Embed Size (px)
Citation preview
Creep Characteristics and Shear Strength
of Recycled Asphalt Blends
by
Jeffery M. Schaper
A Thesis Presented in Partial Fulfillment of the Requirements for the Degree
Master of Science
Approved April 2011 by the Graduate Supervisory Committee:
Edward Kavazanjian, Chair
Claudia Zapata Sandra Houston
ARIZONA STATE UNIVERSITY
May 2011
i
ABSTRACT
The trend towards using recycled materials on new
construction projects is growing as the cost for construction
materials are ever increasing and the awareness of the
responsibility we have to be good stewards of our environment is
heightened. While recycled asphalt is sometimes used in
pavements, its use as structural fill has been hindered by
concern that it is susceptible to large long-term deformations
(creep), preventing its use for a great many geotechnical
applications. While asphalt/soil blends are often proposed as an
alternative to 100% recycled asphalt fill, little data is available
characterizing the geotechnical properties of recycled asphalt soil
blends. In this dissertation, the geotechnical properties for five
different recycled asphalt soil blends are characterized. Data
includes the particle size distribution, plasticity index, creep, and
shear strength for each blend. Blends with 0%, 25%, 50%, 75%
and 100% recycled asphalt were tested. As the recycled asphalt
material used for testing had particles sizes up to 1.5 inches, a
large 18 inch diameter direct shear apparatus was used to
determine the shear strength and creep characteristics of the
material. The results of the testing program confirm that the
creep potential of recycled asphalt is a geotechnical concern
ii
when the material is subjected to loads greater than 1500
pounds per square foot (psf). In addition, the test results
demonstrate that the amount of soil blended with the recycled
asphalt can greatly influence the creep and shear strength
behavior of the composite material. Furthermore, there appears
to be an optimal blend ratio where the composite material had
better properties than either the recycled asphalt or virgin soil
alone with respect to shear strength.

iii
To my wife and children, whom without their love, patience and
understanding this would have not been possible.
To my Grandmother, whom without her inspiration, I would have
never gone beyond my years at Mizzou.
To Doug Lattin, whom for the past ten years has given me the
confidence and support to finish this work.
To John Patterson, whom without his mentoring I would have
quit just short of the finish line.
iv
ACKNOWLEDGMENTS
I would like to thank Dr. Edward Kavazanjian for his
instruction, guidance and assistance throughout my graduate
school studies at Arizona State University. He has been an
important part of my growth both academically and
professionally. His mentoring was invaluable in completing this
research.
I would also like to acknowledge and thank the other
members of my committee, Dr. Claudia Zapata and Dr. Sandra
Houston. I have enjoyed being in their classes and have learned
much from both of them, and in particular from Dr. Zapata.
Peter Goguen was instrumental in keeping the testing
equipment running. I am especially grateful for his tireless
patience through all of the problems encountered.
Lastly, I would like to acknowledge those who helped me
with my research in one fashion or another; Bongseong Seo who
taught me how to use the equipment and was very helpful
working through early problems; Eric Iglesias and Pengbo Yuan
for their manual labor in helping prepare specimens.
v
TABLE OF CONTENTS
Page
LIST OF TABLES ..................................................................vii
LIST OF FIGURES................................................................viii
CHAPTER
1 INTRODUCTION ............................................................. 1
1.1 Overview ........ ....................................................1
1.2 Research Goals ....................................................2
1.3 Potential Contributions ..........................................3
2 BACKGROUND ................................................................5
2.1 Literature........ ....................................................5
2.1.1 University of Texas Studies ...........................6
2.1.2 Florida Institue of Technology (FIT) Study.......7
2.1.3 Other Pertinent Studies ................................9
2.2 Findings.......... .................................................. 10
3 TESTING PROGRAM AND METHODOLOGY......................... 11
3.1 Sources of Material ............................................. 11
3.2 Testing Equipment .............................................. 13
3.2.1 Large Scale Direct Shear Apparatus ............. 14
3.3 Data Acquisition ................................................. 16
3.4 Specimen Fabrication .......................................... 16
3.4.1 Large Scale Specimens............................... 17
vi
CHAPTER Page 3.4.1.1 Preparing the Blended Material......... 18
3.4.1.2 Loading and Compacting
the Specimen ............................... 19
3.4.1.3 Placement of Top Caps.................... 21
3.4.2 Traditional Specimens ................................ 22
3.5 Fabrication and Testing Schedule ............................ 22
4 MATERIAL PROPERTIES.................................................. 25
4.1 Recycled Asphalt Product ....................................... 25
4.2 Blend Soil ......... .................................................. 27
4.3 RAP Blends ....... .................................................. 29
5 COMPRESSIBILITY OF RAP AND RAP BLENDS ................... 34
5.1 Determining Primary and
Secondary Compressibility ................................... 34
5.2 Compressibility of Rap ........................................... 37
5.3 Secondary Compressibility Index of Rap Blends ........ 40
5.4 Compressibility of the Blend Soil ............................. 41
5.4 Discussion......... .................................................. 42
6 SHEAR STRENGTH OF RAP AND RAP SOIL BLENDS............ 45
6.1 Shear Strength of RAP........................................... 47
6.2 Shear Strength of RAP Blends................................. 50
vii
CHAPTER Page 6.3 Shear Strength of Blend Soil .................................. 53
6.4 Discussion......... .................................................. 55
7 CONCLUSIONS AND RECOMMENDATIONS ........................ 58
7.1 Summary.......... .................................................. 58
7.1.1 Compaction Characteristics of RAP
and RAP Blends .................................... 58
7.1.2 Compressibility of RAP and RAP Blends......... 59
7.1.3 Shear Strength of RAP and RAP Blends......... 60
7.1.4 Evaluation of RAP as Structure Backfill ......... 61
7.2 Recommendations................................................. 62
7.2.1 Limitations of the Test Equipment................ 63
7.2.2 Recommendations for Further Research........ 65
7.3 Conclusion ........ .................................................. 66
REFERENCES ..................................................................... 67
APPENDIX
A MATERIAL PROPERTIES DATA SHEETS ................ 70
B COMPRESSION TEST DATA ................................ 78
C SHEAR STRENGTH TEST DATA ......................... 121
viii
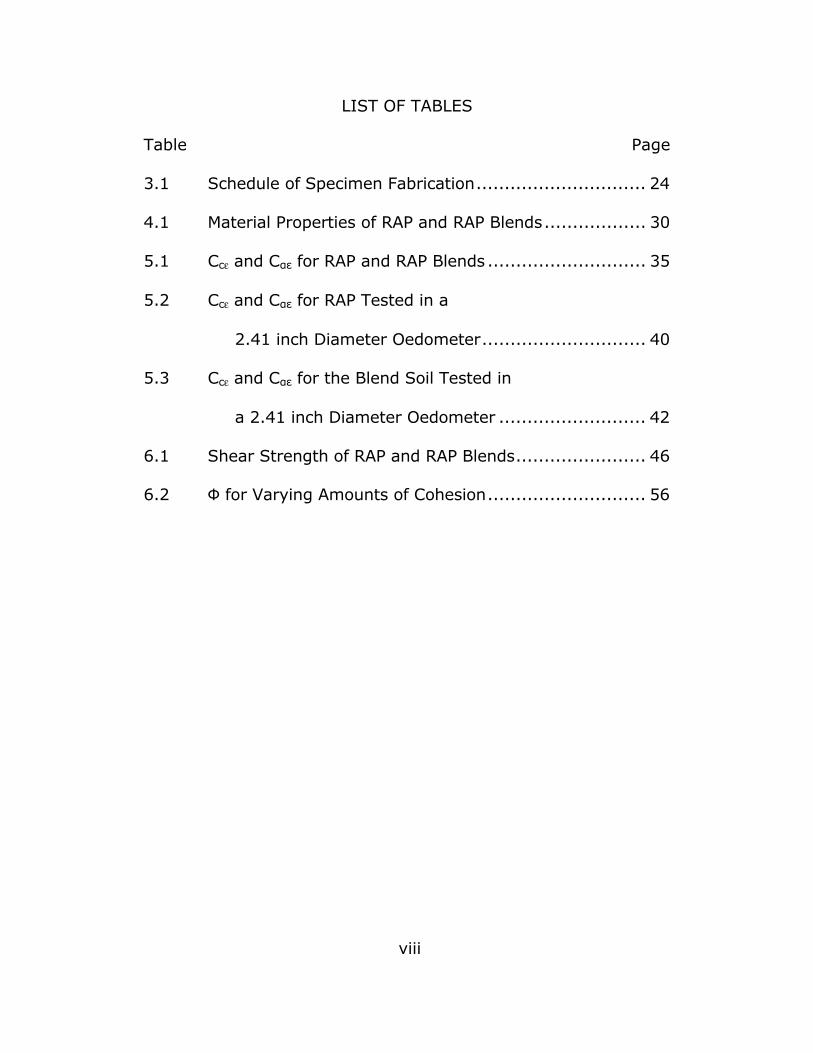
LIST OF TABLES
Table Page
3.1 Schedule of Specimen Fabrication.............................. 24
4.1 Material Properties of RAP and RAP Blends.................. 30
5.1 Ccε and Cαε for RAP and RAP Blends ............................ 35
5.2 Ccε and Cαε for RAP Tested in a
2.41 inch Diameter Oedometer............................. 40
5.3 Ccε and Cαε for the Blend Soil Tested in
a 2.41 inch Diameter Oedometer .......................... 42
6.1 Shear Strength of RAP and RAP Blends....................... 46
6.2 Ф for Varying Amounts of Cohesion............................ 56
ix
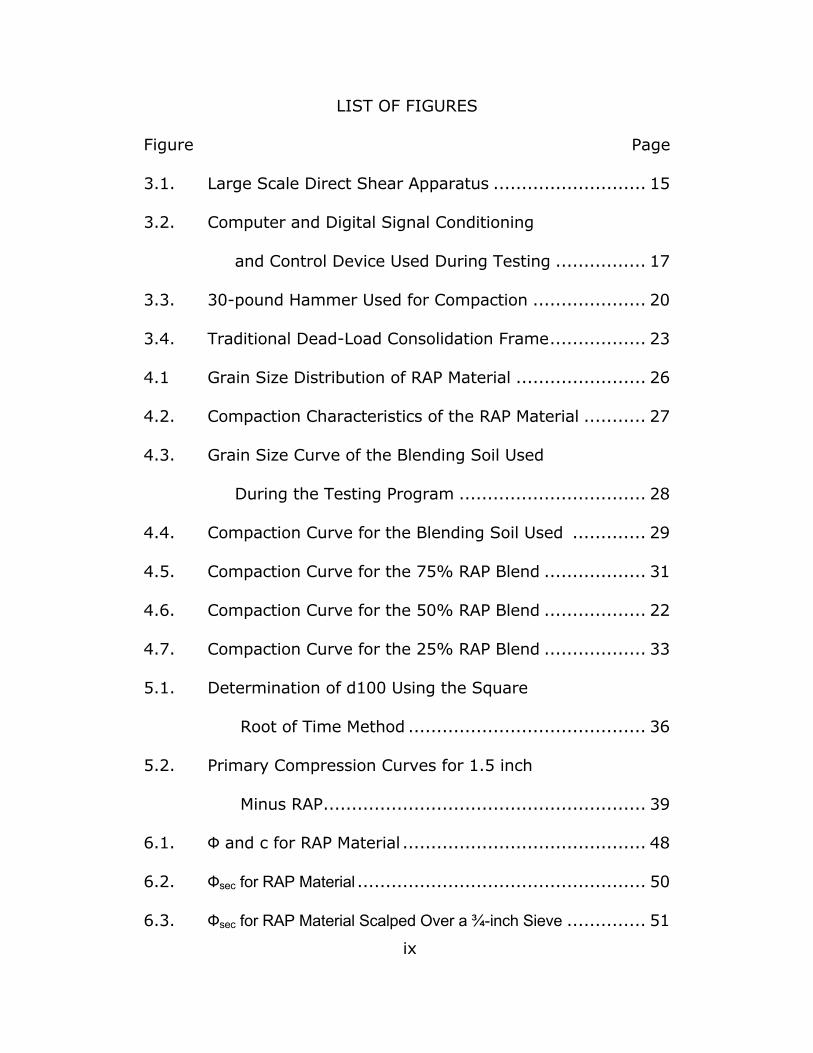
LIST OF FIGURES
Figure Page
3.1. Large Scale Direct Shear Apparatus ........................... 15
3.2. Computer and Digital Signal Conditioning
and Control Device Used During Testing ................ 17
3.3. 30-pound Hammer Used for Compaction .................... 20
3.4. Traditional Dead-Load Consolidation Frame................. 23
4.1 Grain Size Distribution of RAP Material ....................... 26
4.2. Compaction Characteristics of the RAP Material ........... 27
4.3. Grain Size Curve of the Blending Soil Used
During the Testing Program ................................. 28
4.4. Compaction Curve for the Blending Soil Used ............. 29
4.5. Compaction Curve for the 75% RAP Blend .................. 31
4.6. Compaction Curve for the 50% RAP Blend .................. 22
4.7. Compaction Curve for the 25% RAP Blend .................. 33
5.1. Determination of d100 Using the Square
Root of Time Method .......................................... 36
5.2. Primary Compression Curves for 1.5 inch
Minus RAP......................................................... 39
6.1. Ф and c for RAP Material ........................................... 48
6.2. Фsec for RAP Material ................................................... 50
6.3. Фsec for RAP Material Scalped Over a ¾-inch Sieve .............. 51
x
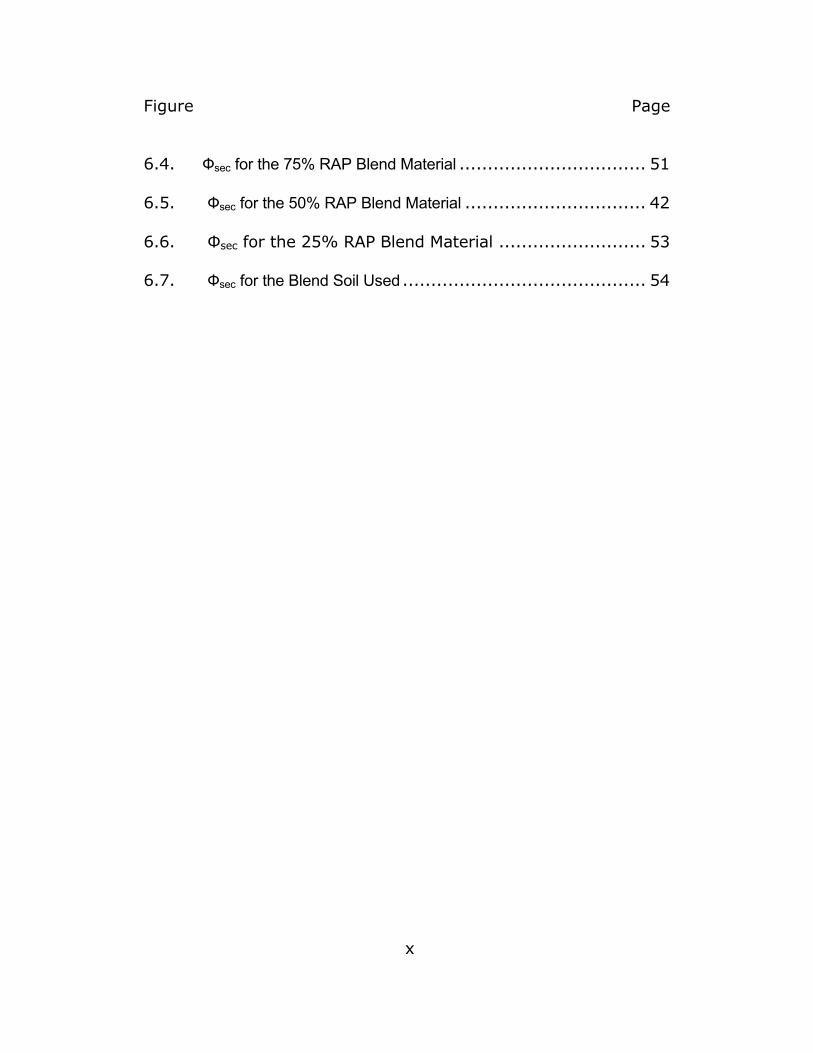
Figure Page
6.4. Фsec for the 75% RAP Blend Material ................................. 51
6.5. Фsec for the 50% RAP Blend Material ................................ 42
6.6. Фsec for the 25% RAP Blend Material .......................... 53
6.7. Фsec for the Blend Soil Used ........................................... 54
1
CHAPTER 1
INTRODUCTION
1.1 Overview
Recycled asphalt product (RAP), the recycled material that
is the resultant product of the removal of asphaltic concrete
pavements that have reached the end of their service life, is fast
finding its way onto many construction projects. RAP is a natural
choice for use as a recycled material because its main
constituent is well controlled, processed and durable mineral
aggregate. RAP is readily available on any roadway construction
project which includes the removal and replacement of the
existing asphalt. RAP material is already commonly being used
for base and subbase materials. RAP material is also being
incorporated on a limited basis into new asphaltic concrete
mixtures, typically at a rate of 10 to 20 percent by weight.
As good of a product RAP material may be, much research
still remains to adequately characterize the material to the
satisfaction of many engineers. Currently many transportation
agencies are still hesitant to use RAP because of the lack of
information about its properties. The Arizona Department of
Transportation, for example, stockpiles thousands of cubic yards
of RAP material every year. One of the main concerns about the
2
behavior of RAP as an engineered material is that it also contains
asphalt cement, usually on the order of 3 to 10 percent by
weight. The affects of the asphalt cement on the behavior of the
RAP material is not fully understood. The potential for increased
compressibility under constant stress, or creep, because of the
asphalt cement content of RAP is one negative affect that has
been documented. This alone limits the use of RAP in a great
many applications, particularly with regard to its use as
structural fill.
1.2 Research Goals
Some research is available that addresses RAP material
and its potential for use in construction applications. For
example, Rathje et al. (2006) at the University of Texas has
investigated the use of RAP material for use as backfill for
mechanically stabilized earth wall systems. Consentino et al.
(2003) at the Florida Institute of Technology has investigated
the use of RAP material, as well as RAP soil blends as a base or
subbase material. The previous research on shear strength and
creep potential were performed using triaxial tests.
The objectives for this research is to further characterize
the material properties, shear strength and compressibility of
RAP and RAP-soil blends. In harmony with maximizing the use of
3
RAP material, my research is focused on evaluating the behavior
of RAP and RAP-soil blends as well as evaluating the potential
use of RAP material as general structural fill material.
1.3 Potential Contributions
It is estimated that over 100 million tons of asphaltic
concrete is removed from U.S. roads on an annual basis as a
result of ongoing resurfacing and widening construction projects
(Kuennen, 2007). The importance of reclaiming and reusing this
material has grown over the past several decades as the asphalt
construction industry gravitates towards becoming more
sustainable and environmentally responsible. The use of recycled
asphaltic concrete (RAP) is becoming even more important as
the cost of oil is skyrocketing and the availability of suitable
materials for roadway construction is declining (Eighmy, &
Magee, 2001). For these reasons it is important to be able to
maximize the applicable uses for recycled RAP material.
The potential for creep is of real concern for RAP material
and consequently has limited the practical use of RAP material in
construction. RAP-soil blends have been proposed as a means of
decreasing the potential for creep. Furthermore, blending soil
with RAP, may improve the shear strength and compaction
characteristics of the blended material over straight 100 percent

4
RAP material. The test data and conclusions of this thesis will
help to better understand the behavior of RAP and RAP-soil
blends.
5
CHAPTER 2
BACKGROUND
2.1 Literature
Limited research has previously been done investigating
the properties of RAP and evaluating its use in certain
construction applications. In preparation for my own research
and in interpreting the results of my findings, I conducted
several literature searches and read numerous articles pertaining
to the engineering applications of RAP material.
A search of the ASU library electronic catalog for the
phrase “recycled asphalt product” resulted in 2,874 references
pertaining to the general subject. By including the terms “RAP”
and “Properties” in the search, the number was reduced to only
52 publications. Of these references, 25 were journal articles, 11
were dissertations, 9 were articles in popular trade publications,
and 7 were newspaper articles. The majority of these references
only refer to RAP in a limited passing context and do not address
directly the compressive or shear strength properties of RAP. In
all, 4 references were found that were most applicable to my
research in that they addressed the engineering properties of
RAP.
6
In addition to searching for background references
addressing RAP material, my research also addressed the
subjects of bound in matrix material and on the effects of the
coefficient of uniformity on the soil skeleton. These references
were specifically targeted to help evaluate the results of my
research on the behavior of asphalt/soil blends. A brief summary
for each of the relevant references follows.
2.1.1 University of Texas studies. The University of
Texas began characterizing RAP, as well as crushed concrete,
and investigating its applicability for backfill of mechanically
stabilized earth (MSE) wall systems in 2001 (Rathje et al.,
2001). This research was sponsored by the Texas Department of
Transportation. Their first report was a state-of-the-art review of
the design of MSE walls and the engineering issues related to the
backfill material. This report outlined some basic characteristics
for RAP material, including grain size distribution, specific gravity
and compaction characteristics.
In 2002, a second report was completed by the University
of Texas presenting the results of initial durability and
geotechnical tests for RAP and crushed concrete (Rathje et al.,
2002). This report expanded the basic characterization of the
RAP material to include consolidated-drained shear strength and
7
hydraulic conductivity from triaxial testing, in addition to some
short term and long term corrosion studies. The triaxial testing
was performed with 4 inch diameter and 8 inch tall specimens,
with particles larger than 0.67 inches removed. Triaxial tests
were performed with confining pressures ranging from 5 psi to
50 psi. The results from this triaxial testing found the effective
stress friction angle for RAP to be 39° and the effective cohesion
of 8 psi.
In 2006, the University of Texas released a third report
evaluating RAP and crushed concrete as backfill for MSE walls
(Rathje et al., 2006). This report summarized the work that they
had been performing for the past several years and put it into
context with regards to the current specifications for MSE wall
backfill. This report also introduced some further test data for
RAP and crushed concrete, including pullout resistance and creep
potential. Testing for consolidated-drained shear strength was
performed using a large direct shear machine, having a 20 inch
square shear box, however the results from this testing for the
RAP were discarded due to problems with creep during the tests.
2.1.2 Florida Institute of Technology (FIT) study. FIT
also performed some research with RAP to develop a
specification for the Florida Department of Transportation for the
8
use of RAP as a base, subbase or general fill material
(Consentino et al., 2003). Their report includes a wide range of
test results performed on RAP, including laboratory and in-situ
stiffness testing, dry unit weight, compaction characteristics,
permeability, consolidated-drained triaxial shear testing and
some preliminary measurements of creep. Triaxial tests were
performed at confining pressure of 5 psi and 15 psi. The results
of the friction angle for 100 percent RAP was found to be 44°
and the cohesion was found to be 4.9 psi.
This report also addresses RAP-soil blends. Compaction,
shear strength and creep tests were performed with a blend of
fine sand material at blend percentages of 80 percent RAP and
60 percent RAP, by weight. The USCS classification of the fine
sand used in this study is poorly graded sand to clayey sand, SP-
SC. The fine sand material was 99.9 percent passing the #40
sieve and 10.4 percent passing the #200 sieve. The fines had a
liquid limit of 39 and a plasticity index of 15. FIT concluded that
the friction angle decreases and cohesion increases as the RAP
content decreases. In addition, the 80 percent and 60 percent
blends yielded denser materials than either the RAP material or
the fine sand alone.
9
2.1.3 Other pertinent studies. To investigate the
observed behavior of RAP and RAP-soil blends based on the test
results from my research, in which the compaction and shear
strength properties were observed to improve when a small
amount of soil was blended with the RAP, I researched a
conference paper presented by J.P. Giroud regarding geotextile
and granular filter criteria (Giroud, 2010). In this work, Giroud
discuses the effects of the coefficient of uniformity, Cu, on the
soil skeleton. Giroud documents that when Cu for a soil is less
than 3, the coarsest particles in the soil remain in continuous
contact, forming a skeleton in which the smaller particles are
trapped. For soils with a Cu greater than 3, the coarsest soil
particles are not in contact with one another, and instead are
floating within the matrix of the smaller particles.
Eric Stuart Lindquist wrote a dissertation on the strength
and deformation properties of mélange (Lindquist, 1994), a
material composed of strong, stiff blocks inside a matrix that is
weaker and softer. From his research he concluded that the
internal friction angle of the mélange increased as the block
proportion of the specimen tested increased. While Lindquist’s
research was not directly applicable to this thesis, as with the
case of Giroud, the background discussion about the effects of
10
the overall material matrix was valuable for the evaluation of the
findings of my research.
2.2 Findings
The University of Texas and the Florida Institute of
Technology have actively been researching the properties of RAP
in an attempt to characterize RAP and evaluate its applicability
as backfill material. The shear strength tests conducted so far
have been consolidated-drained triaxial tests on RAP that has
been scalped of the larger particles. The University of Texas
made some attempts to test to test the shear strength of RAP
with a large direct shear machine, however was unsuccessful
and chose not to publish those results (Rathje et al., 2006).
Preliminary creep testing that has been performed has concluded
that RAP is susceptible to creep.
11
CHAPTER 3
TESTING PROGRAM AND METHODOLOGY
3.1 Sources of Material
Two different materials were used in the testing program;
recycled asphalt pavement (RAP) and a native soil material
representative of the type of soil that is typically found in the
Phoenix valley.
The RAP material was obtained from a large stockpile
located at the Arizona Department of Transportation (ADOT) Salt
River office. This stockpile of RAP material consists of milled
asphalt pavement that has been removed from various ADOT
projects over the past several years. The total volume of RAP in
this stockpile is approximately 20,000 cubic yards. For the
purposes of this testing program, all of the RAP material used
was sampled from one face of the stockpile.
RAP material was sampled on two separate occasions; July
30, 2008 and February 11, 2009. On each occasion the RAP
material was sampled from the same face of the stockpile and
placed into ten five-gallon buckets. The maximum particle size of
the sampled RAP material was approximately 3 inches, however,
to facilitate testing and comply with the ASTM D3080 and ASTM
D2435 requirements concerning the maximum particle size
12
relative to equipment dimensions, the sampled RAP was
screened to remove particles greater than 1.5 inches in
dimension. The samples were then blended to provide a uniform
RAP material.
The blending soil used in the testing program was obtained
from a stockpile of export material on the ADOT Loop 202 (Red
Mountain Freeway) Power Road to University Road project in
Mesa, Arizona. The stockpile was located between McKellips
Road and Brown Road, just east of the Red Mountain Freeway.
This material was stockpiled over a period from early 2008 until
mid-July 2008 by Pulice Construction, Inc. The approximate
volume of material in this stockpile was about 200,000 cubic
yards and consisted of predominantly clayey sand material taken
from the upper 2 feet of the subsurface profile in this same area.
Material was sampled from this stockpile also on two
separate occasions; September 18, 2008 and February 13, 2009.
Material was sampled from random locations throughout the
stockpile on each occasion and blended together to provide a
uniform material for testing.
Six different blends of the RAP and blending soil materials
were investigated in the testing program. The blends consisted
of 100 percent 1.5 inch minus RAP material, 100% RAP material
13
scalped on the ¾ inch sieve, 75% 1.5 inch minus RAP and 25%
soil, 50% 1.5 inch minus RAP and 50% soil, 25% 1.5 inch minus
RAP and 75% soil and 100 percent soil alone.
3.2 Testing Equipment
The maximum particle size of the blended RAP material
made it difficult to evaluate its potential for creep using
traditional laboratory equipment. Typical oedometers having a
diameter of 3 inches were not practical for testing the RAP with a
maximum aggregate size of 1.5 inches. Because the larger
particle sizes were mostly milled pieces of asphaltic concrete, it
was not desirous to screen the RAP material over a sieve size
that would have allowed for the use of traditional oedometers, as
it is believed that the behavior of RAP is influenced by the
asphalt on the larger particles. Instead, it was decided that the
RAP would be tested using the 18-inch diameter direct shear
apparatus in the Arizona State University Enamel Hogue
Geotechnical Laboratory. This equipment is capable of handling
the larger particle sizes and allows for the shear strength of the
material to be evaluated in addition to its creep potential.
Evaluations of shear strength by Rathje et al. (2002) and
Consentino et al. (2003) were performed using triaxial
specimens. It should be noted that there are differences between
14
the direct shear and triaxial tests. In general it is widely believed
that the triaxial method for evaluating shear strength is more
accurate (Bardet, 1997). This is because the direct shear test
places non-uniform strains on the specimen and forces the
failure on a horizontal plane. It is well documented that the peak
friction angle obtained from direct shear tests is generally about
2° higher than that obtained using triaxial testing (Bardet,
1997). The advantage for using direct shear testing in this case,
however, is the ability to test aggregate particle sizes up to 1.5
inches. Additionally, the direct shear apparatus will allow for
compression testing of the RAP and RAP-soil blends in the
unsaturated drained condition.
3.2.1 Large scale direct shear apparatus. The large
scale direct shear apparatus consists of an 18-inch diameter
steel shear box within a steel loading frame. An attached high
pressure pump supplied lateral loading and a smaller pump was
attached to provide a normal load through hydraulic actuators. A
photo of the large scale direct shear frame is included as Figure
3.1.
The shear box is 18-inches in height and is divided into
bottom and top portions along a horizontal plane, with the
bottom portion of the box measuring six-inches in height and the
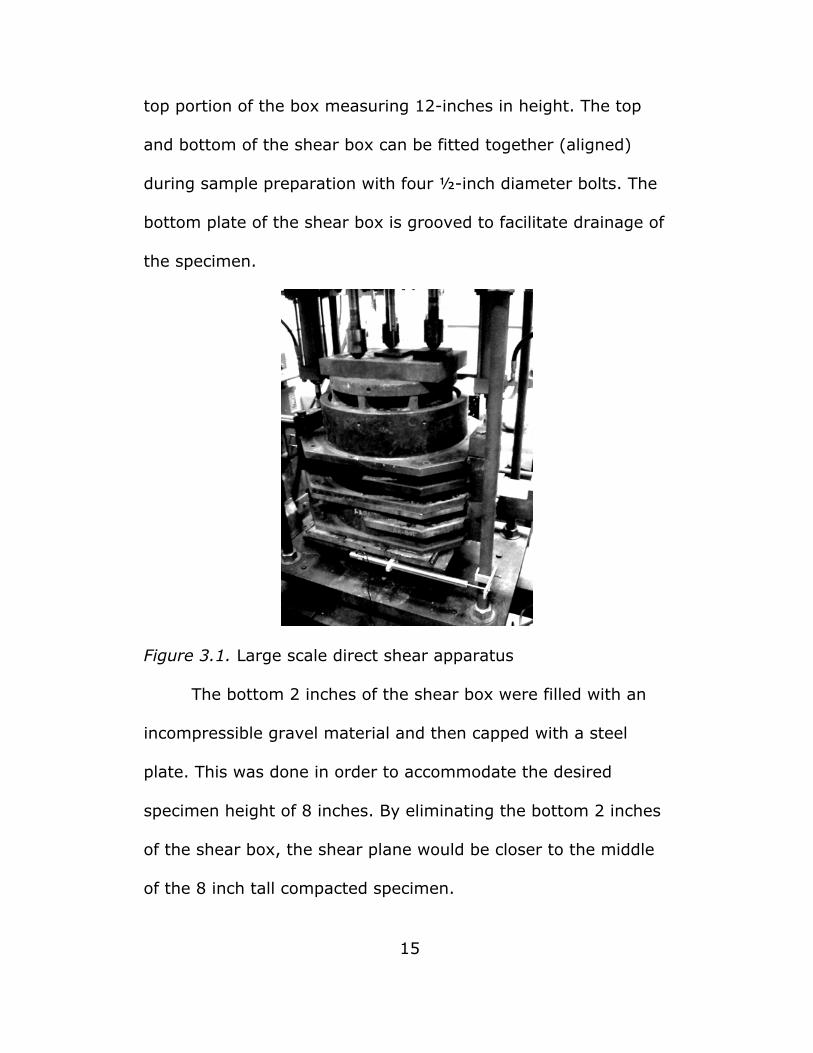
top portion of the box measuring 12-inches in height. The top
and bottom of the shear box can be fitted together (aligned)
during sample preparation with four ½-inch diameter bolts. The
bottom plate of the shear box is grooved to facilitate drainage of
the specimen.
Figure 3.1. Large scale direct shear apparatus
The bottom 2 inches of the shear box were filled with an
incompressible gravel material and then capped with a steel
plate. This was done in order to accommodate the desired
specimen height of 8 inches. By eliminating the bottom 2 inches
of the shear box, the shear plane would be closer to the middle
of the 8 inch tall compacted specimen.
15
16
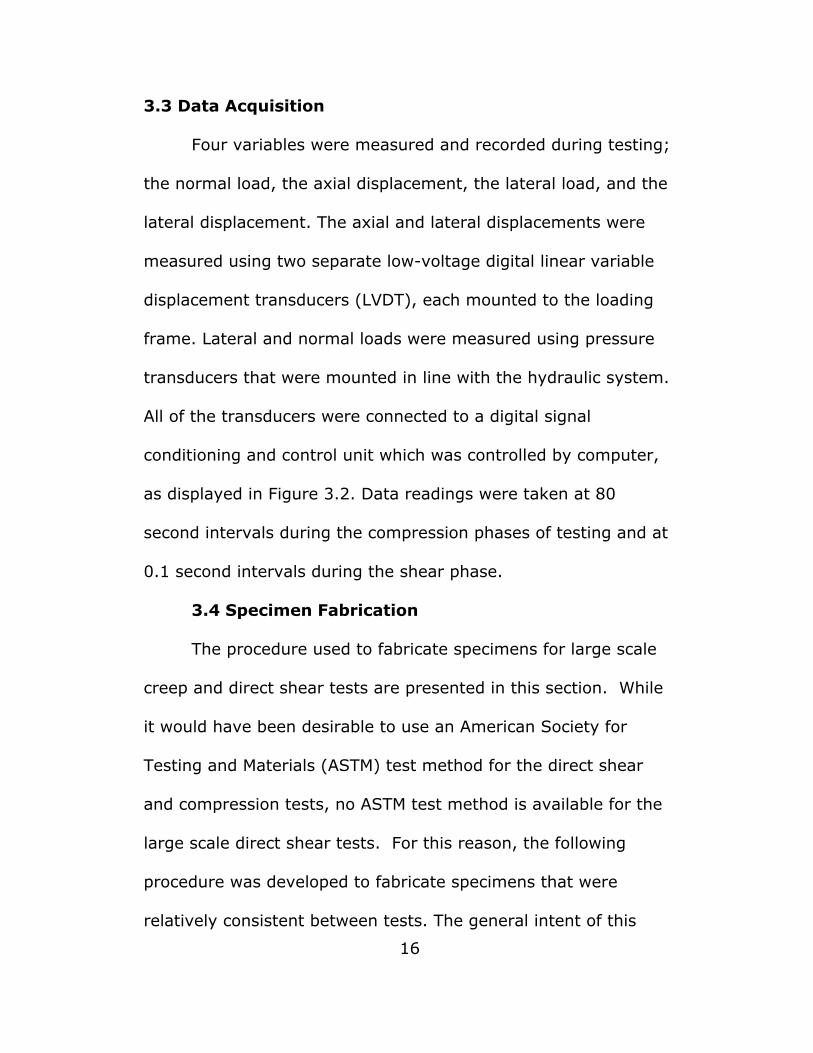
3.3 Data Acquisition
Four variables were measured and recorded during testing;
the normal load, the axial displacement, the lateral load, and the
lateral displacement. The axial and lateral displacements were
measured using two separate low-voltage digital linear variable
displacement transducers (LVDT), each mounted to the loading
frame. Lateral and normal loads were measured using pressure
transducers that were mounted in line with the hydraulic system.
All of the transducers were connected to a digital signal
conditioning and control unit which was controlled by computer,
as displayed in Figure 3.2. Data readings were taken at 80
second intervals during the compression phases of testing and at
0.1 second intervals during the shear phase.
3.4 Specimen Fabrication
The procedure used to fabricate specimens for large scale
creep and direct shear tests are presented in this section. While
it would have been desirable to use an American Society for
Testing and Materials (ASTM) test method for the direct shear
and compression tests, no ASTM test method is available for the
large scale direct shear tests. For this reason, the following
procedure was developed to fabricate specimens that were
relatively consistent between tests. The general intent of this
procedure was to follow the appropriate ASTM standard as
closely as possible, deviating only as necessary to accommodate
the equipment being used.
Figure 3.2. Computer and digital signal conditioning and control
device used during testing.
3.4.1 Large scale specimens. The target dimension of
the specimens used in the 18 inch diameter direct shear
apparatus was 8 inches in height, having a total volume of 1.18
cubic feet. Each specimen was compacted to a density of
approximately 91 percent of the maximum dry density as
determined using ASTM D698 Method C. The material used for
the ASTM D698 Method C test method is screened over a ¾ inch 17
18
sieve, therefore to correct the maximum density and optimum
moisture for the oversize particles, ASTM D4718 was used. The
target moisture content for each specimen was 2 percent below
optimum moisture. The density and moisture conditions were
chosen to simulate field conditions. The specimens were
fabricated directly in the large shear box, using the following
process.
3.4.1.1 Preparing the blended material. A specific
blend of RAP material and soil was targeted for each specimen.
Material for all specimens was proportioned by weight. The blend
percentages for each specimen are outlined in the fabrication
schedule presented in Table 3.1.
Using the appropriate compaction characteristics for the
desired blend (as determined per ASTM D698), the required
weight of the specimen was calculated. Appropriate weights of
dry RAP and dry soil were blended together to achieve the
correct blend percentage. This material was then thoroughly
mixed to produce a uniform matrix of RAP and soil. Water was
added to the mixture to bring it to the desired moisture content.
The mixture was then again thoroughly mixed to provide a
consistent material.
19
3.4.1.2 Loading and compacting the specimen. Prior
to loading the specimen into the direct shear device, the top
section of the shear box was carefully lowered onto and aligned
with the bottom section to create a smooth-wall cylinder within
which to compact the specimen. The two shear box sections
were bolted together at each corner to prevent the box from
moving during compaction. The RAP-soil blend was introduced
into the shear box in three approximately equal lifts. Three lifts
was chosen to avoid having a lift boundary at the same location
as the horizontal shear plane and thus potentially introduce an
artificial weak shear plane at the shear plane location. The target
compacted lift thickness was 2.67 inches; however, the
compaction process was difficult and often resulted in lifts that
were thicker than the target value after compaction.
Each lift was compacted using the 30-pound slide hammer
as depicted in Figure 3.3. However, a slide rod was not used
during compaction; instead a rope handle was fastened to the
hammer to facilitate lifting and dropping the hammer onto the
sample. The hammer was dropped approximately 20 to 30 times
of times on each lift as necessary to achieve a final compacted
lift thickness as close to 2.67 inches as possible
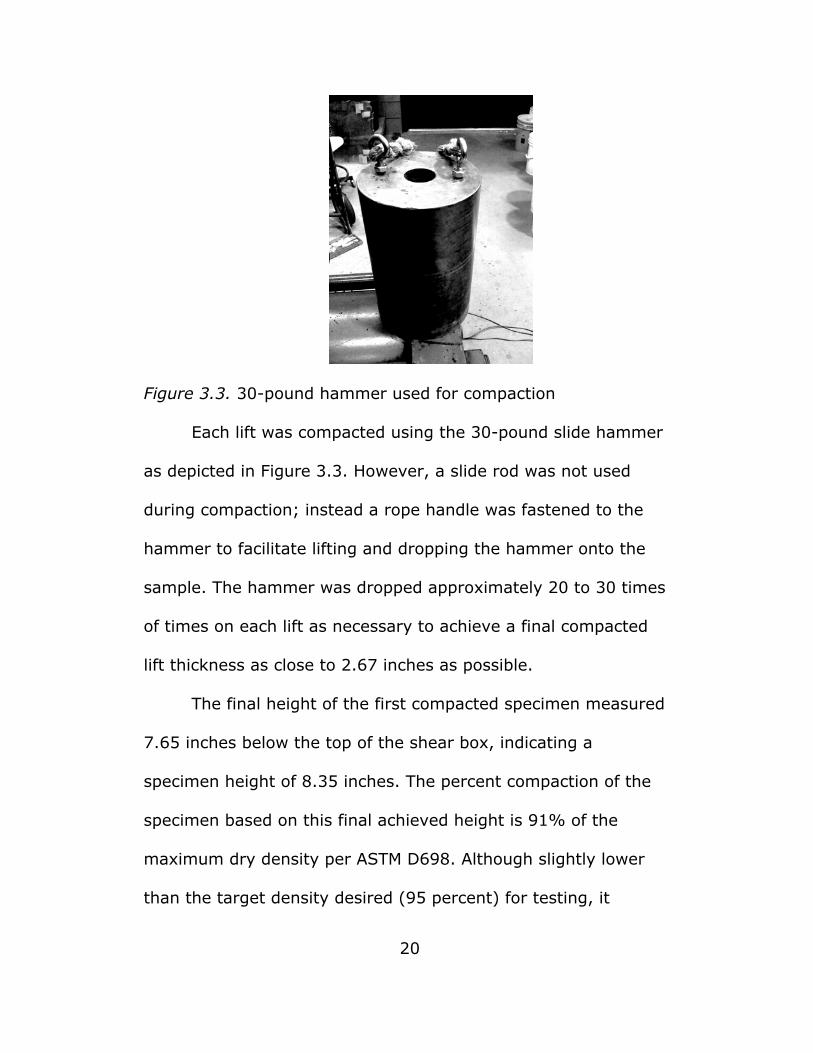
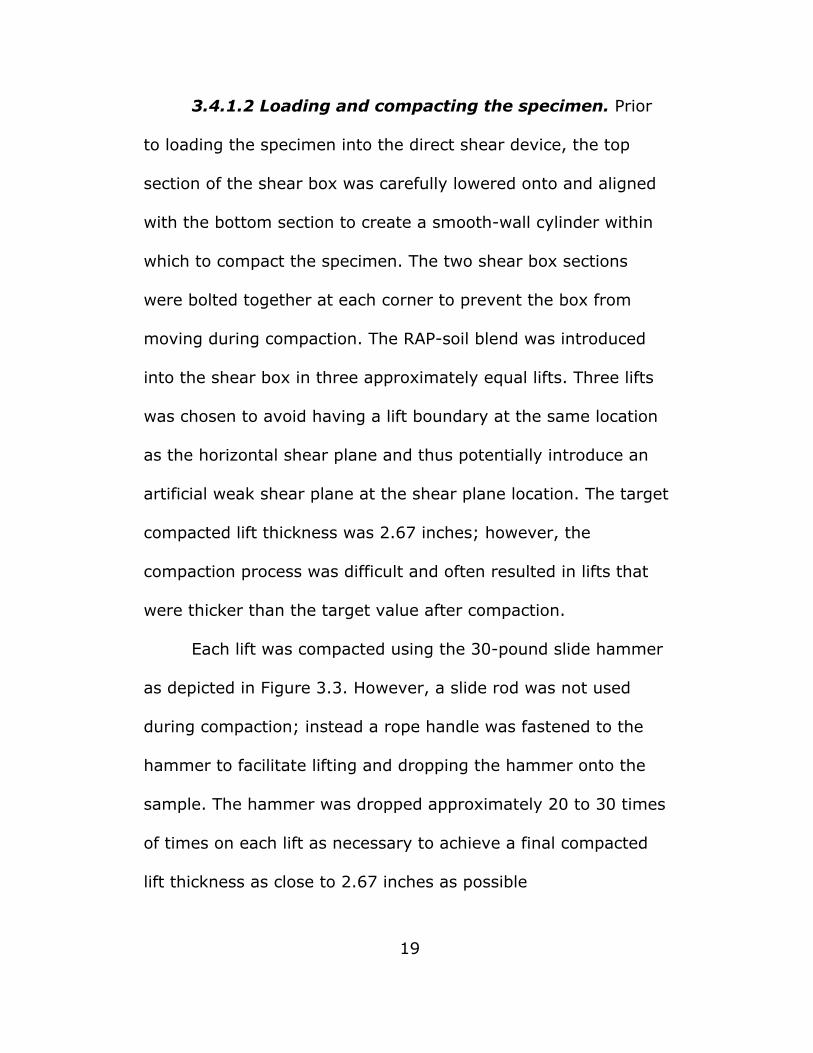
Figure 3.3. 30-pound hammer used for compaction
Each lift was compacted using the 30-pound slide hammer
as depicted in Figure 3.3. However, a slide rod was not used
during compaction; instead a rope handle was fastened to the
hammer to facilitate lifting and dropping the hammer onto the
sample. The hammer was dropped approximately 20 to 30 times
of times on each lift as necessary to achieve a final compacted
lift thickness as close to 2.67 inches as possible.
The final height of the first compacted specimen measured
7.65 inches below the top of the shear box, indicating a
specimen height of 8.35 inches. The percent compaction of the
specimen based on this final achieved height is 91% of the
maximum dry density per ASTM D698. Although slightly lower
than the target density desired (95 percent) for testing, it
20
21
proved more difficult than beneficial to further compact the
specimen and it was determined that 91% relative compaction
would be sufficient for this testing program. The inside of the
shear box was marked at the top of the specimen and all further
specimens were compacted to achieve this same height. This
process provided a level of uniformity between test specimens,
as they all were thereby compacted to the same density.
3.4.1.3 Placement of top caps. After compaction of the
final lift, a steel plate and a hand level were used to assist in
leveling the top of the specimen as much as possible. The top
surface was checked at 6 points to insure a level surface for axial
loading. Following leveling, two top caps were placed on top of
the specimen. Each top cap measured 5 inches in height and
weighed approximately 230 pounds. The two caps were
necessary to raise the loading surface 2 inches above the top of
the shear box. Additionally, a 2 inch thick steel spacer plate was
placed onto the top cap to further raise the loading surface and
to provide a surface suitable for seating of the compression
pistons used to apply the normal load.
The combined weight of the two top caps and the steel
spacer plate was approximately 573 pounds, providing an initial
overburden pressure of 325 pounds per square foot (psf) to the
22
specimen. This initial overburden pressure was considered as the
seating pressure for the specimen, and was thereafter factored
into the total normal pressure placed onto the specimen.
3.4.2 Traditional specimens. In addition to the large
scale specimens, two specimens were also prepared for
compressibility testing using a traditional dead-weight
consolidation frame. The first specimen consisted entirely of soil
and the second specimen entirely of RAP material; no blends
were tested with the traditional dead-weight consolidation frame.
The procedure for preparing these specimens was in strict
accordance with ASTM D2435, the standard test method for one-
dimensional consolidation properties of soils. The only deviation
from this test method was with respect to the maximum particle
size. In these tests, material passing a 3/8 inch sieve was
remolded into a 2.41 inch inside diameter ring. A picture of the
traditional dead-weight consolidation frame used for testing is
presented in Figure 3.4.
3.5 Fabrication and Testing Schedule
Each large diameter specimen took approximately 4 to 6
hours to prepare prior to the start of the compression testing. It
was common to fabricate the specimens early in the morning so
that the first load increment was applied by 8:00 am, and
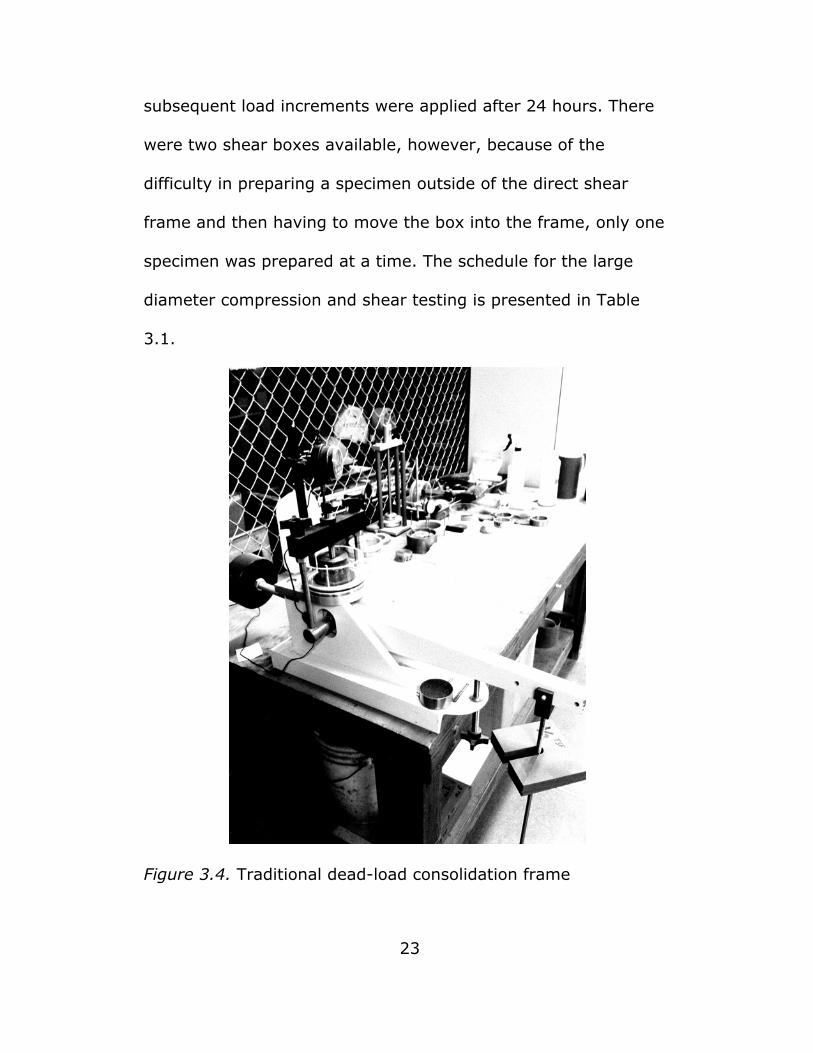
subsequent load increments were applied after 24 hours. There
were two shear boxes available, however, because of the
difficulty in preparing a specimen outside of the direct shear
frame and then having to move the box into the frame, only one
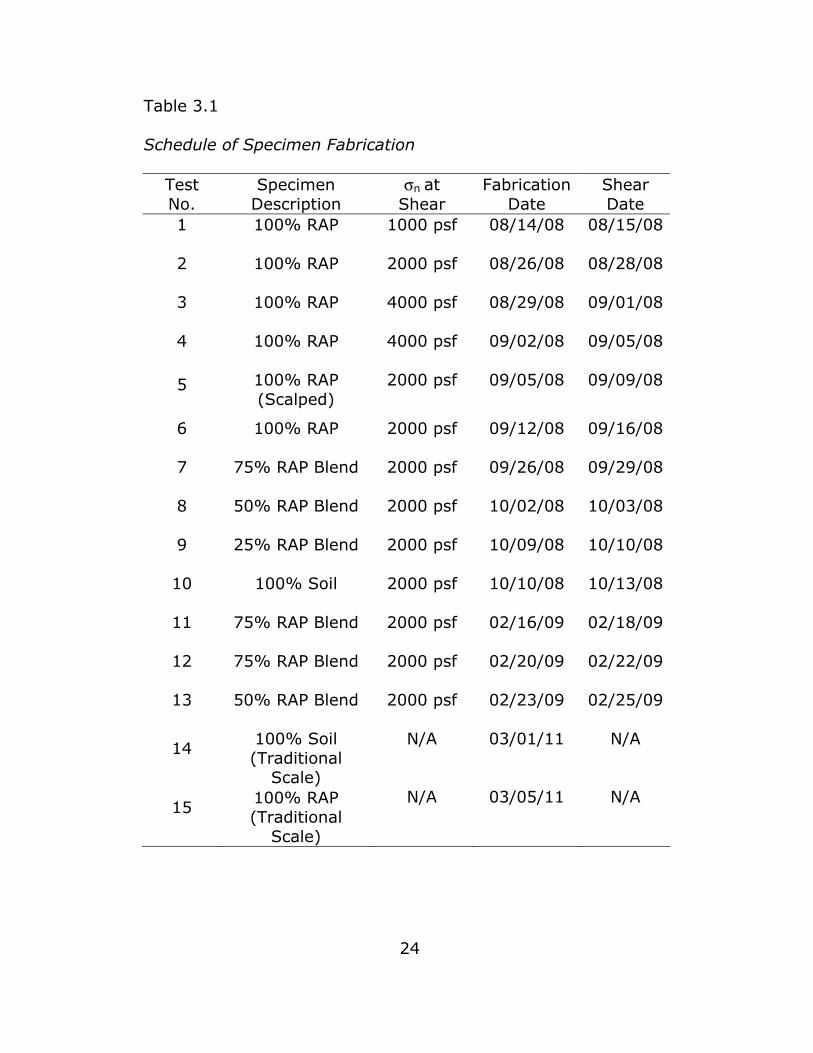
specimen was prepared at a time. The schedule for the large
diameter compression and shear testing is presented in Table
3.1.
Figure 3.4. Traditional dead-load consolidation frame
23
24
Table 3.1
Schedule of Specimen Fabrication
Test No.
Specimen Description
σn at Shear
Fabrication Date
Shear Date
1 100% RAP 1000 psf 08/14/08 08/15/08
2 100% RAP 2000 psf 08/26/08 08/28/08
3 100% RAP 4000 psf 08/29/08 09/01/08
4 100% RAP 4000 psf 09/02/08 09/05/08
5 100% RAP (Scalped)
2000 psf 09/05/08 09/09/08
6 100% RAP 2000 psf 09/12/08 09/16/08
7 75% RAP Blend 2000 psf 09/26/08 09/29/08
8 50% RAP Blend 2000 psf 10/02/08 10/03/08
9 25% RAP Blend 2000 psf 10/09/08 10/10/08
10 100% Soil 2000 psf 10/10/08 10/13/08
11 75% RAP Blend 2000 psf 02/16/09 02/18/09
12 75% RAP Blend 2000 psf 02/20/09 02/22/09
13 50% RAP Blend 2000 psf 02/23/09 02/25/09
14 100% Soil (Traditional
Scale)
N/A 03/01/11 N/A
15 100% RAP (Traditional
Scale)
N/A 03/05/11 N/A
25
CHAPTER 4
MATERIAL PROPERTIES
4.1 Recycled Asphalt Product
Although RAP itself is not a processed material, its primary
constituent component, asphaltic concrete, is a heavily
controlled processed material. As a result, it is expected that the
material properties of RAP, with the exception of particle size,
will generally be consistent regardless of the source of the
asphaltic concrete. The particle size of the RAP, largely a
function of the milling operation, can however vary widely from a
very coarse granular material to a relatively fine granular
material.
The RAP material used for this research was obtained from
a large stockpile. The stockpile itself varied greatly from location
to location. Samples were taken from a cut face on one side of
the stockpile and then combined and split to provide some
uniformity with the RAP material used in each specimen. The
grain size curve for the homogenized RAP material, presented in
Figure 4.1, indicates that the RAP material is fairly well graded
(Cu=20, Cc=0.9). However the actual USCS classification of the
RAP material as determined by ASTM D2485 is GP, poorly
graded gravel with sand, due to the low value for the coefficient
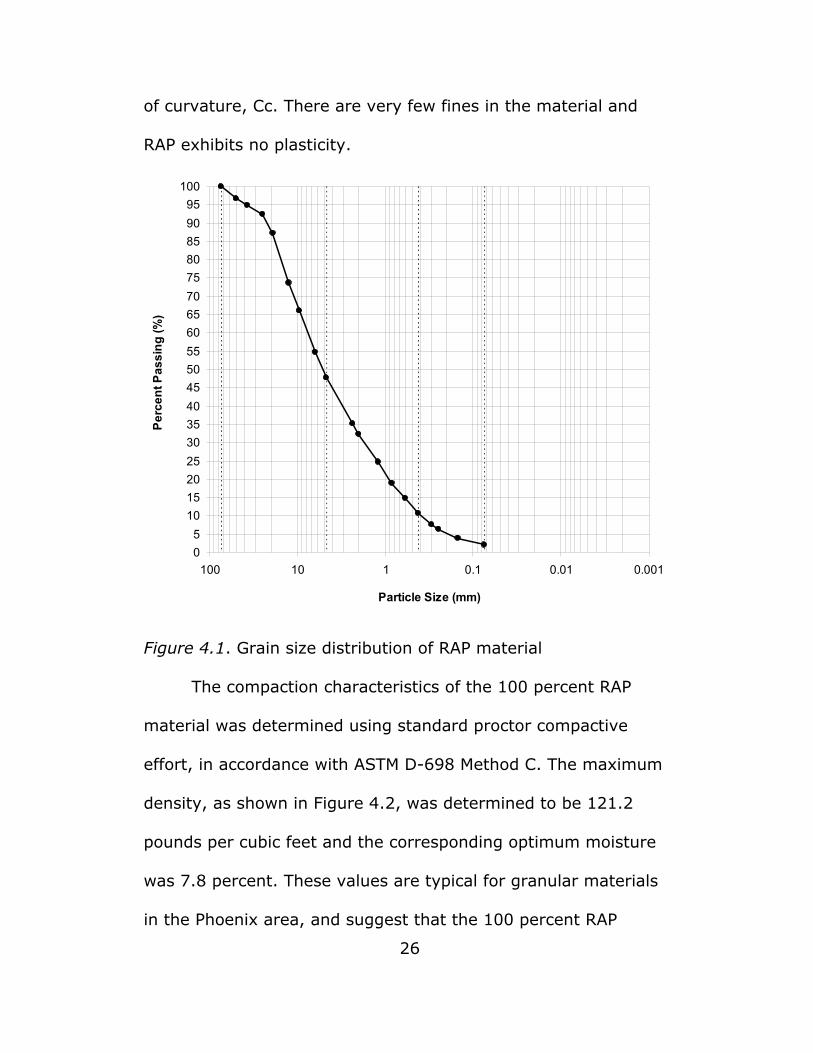
of curvature, Cc. There are very few fines in the material and
RAP exhibits no plasticity.
05
101520253035404550556065707580859095
100
0.0010.010.1110100
Particle Size (mm)
Perc
ent P
assi
ng (%
)
Figure 4.1. Grain size distribution of RAP material
The compaction characteristics of the 100 percent RAP
material was determined using standard proctor compactive
effort, in accordance with ASTM D-698 Method C. The maximum
density, as shown in Figure 4.2, was determined to be 121.2
pounds per cubic feet and the corresponding optimum moisture
was 7.8 percent. These values are typical for granular materials
in the Phoenix area, and suggest that the 100 percent RAP
26
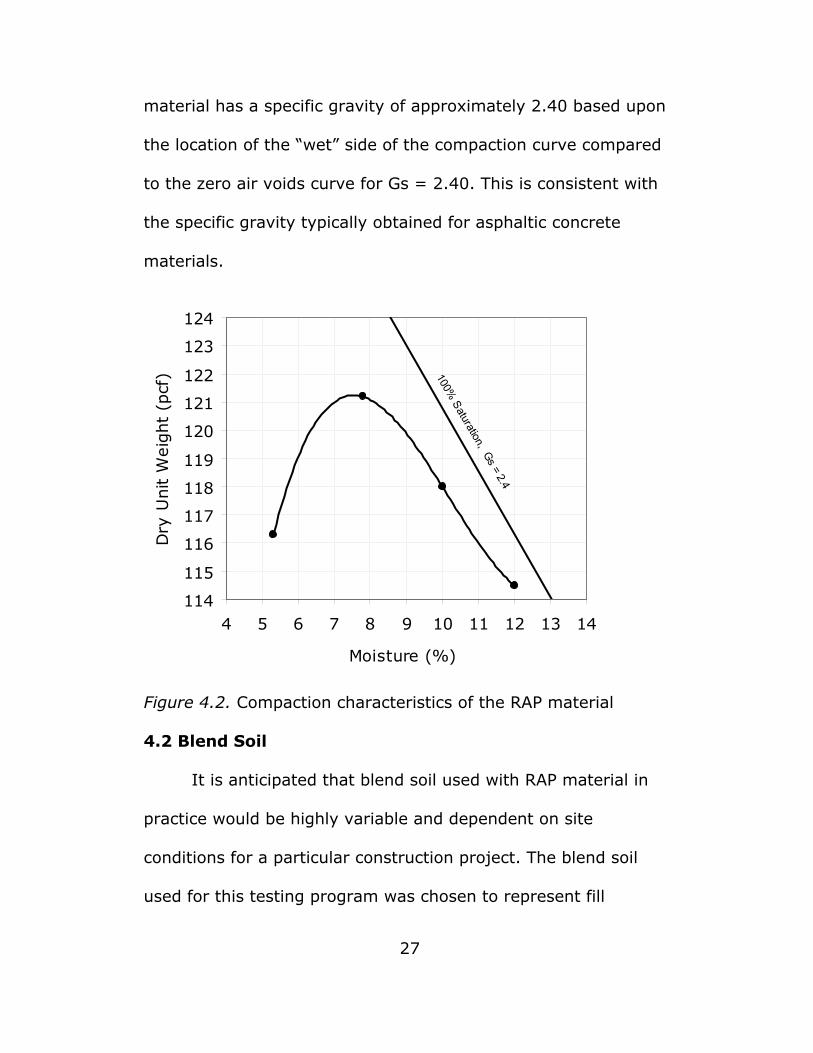
material has a specific gravity of approximately 2.40 based upon
the location of the “wet” side of the compaction curve compared
to the zero air voids curve for Gs = 2.40. This is consistent with
the specific gravity typically obtained for asphaltic concrete
materials.
100% Saturation, Gs = 2.4
114
115
116
117
118
119
120
121
122
123
124
4 5 6 7 8 9 10 11 12 13 14
Moisture (%)
Dry
Unit W
eig
ht
(pcf
)
Figure 4.2. Compaction characteristics of the RAP material
4.2 Blend Soil
It is anticipated that blend soil used with RAP material in
practice would be highly variable and dependent on site
conditions for a particular construction project. The blend soil
used for this testing program was chosen to represent fill
27
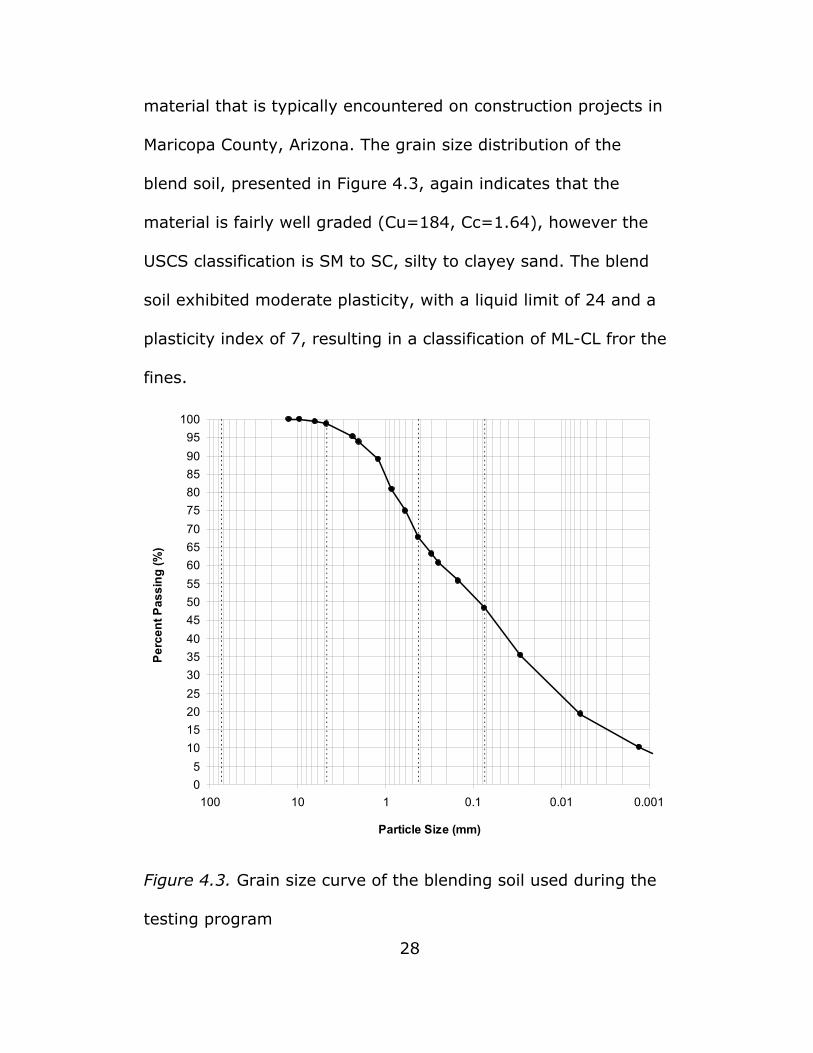
material that is typically encountered on construction projects in
Maricopa County, Arizona. The grain size distribution of the
blend soil, presented in Figure 4.3, again indicates that the
material is fairly well graded (Cu=184, Cc=1.64), however the
USCS classification is SM to SC, silty to clayey sand. The blend
soil exhibited moderate plasticity, with a liquid limit of 24 and a
plasticity index of 7, resulting in a classification of ML-CL fror the
fines.
05
101520253035404550556065707580859095
100
0.0010.010.1110100
Particle Size (mm)
Perc
ent P
assi
ng (%
)
Figure 4.3. Grain size curve of the blending soil used during the
testing program
28
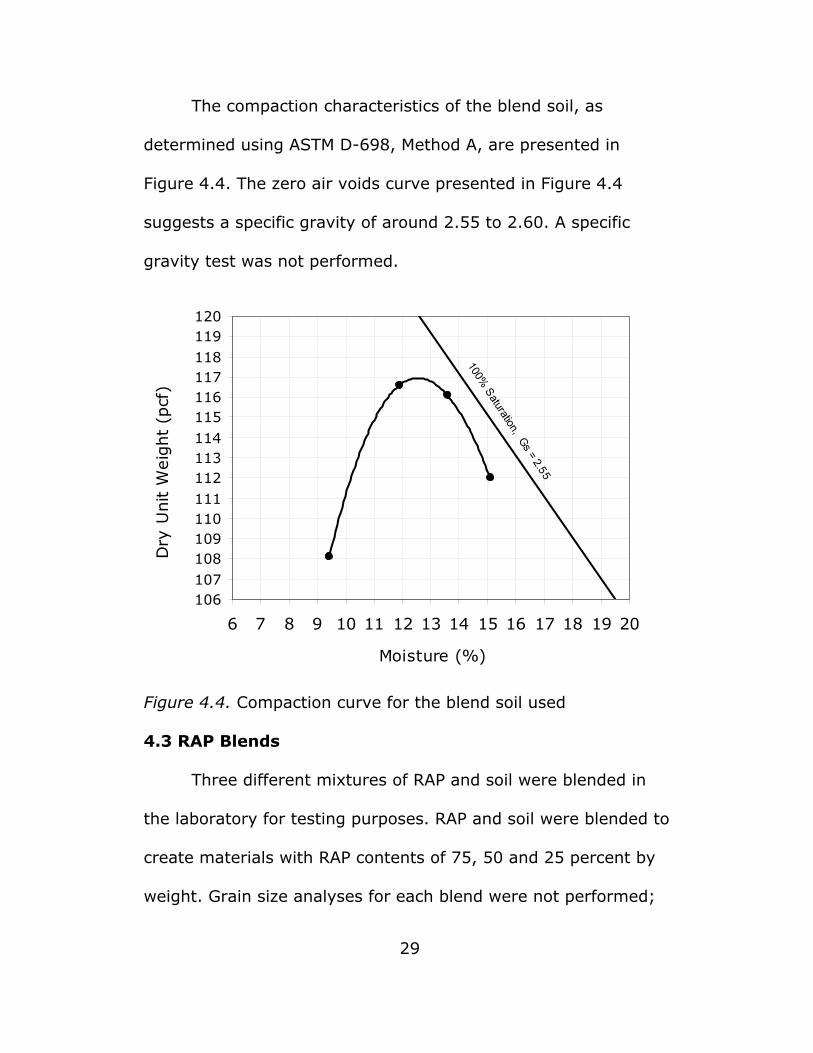
The compaction characteristics of the blend soil, as
determined using ASTM D-698, Method A, are presented in
Figure 4.4. The zero air voids curve presented in Figure 4.4
suggests a specific gravity of around 2.55 to 2.60. A specific
gravity test was not performed.
100% Saturation, Gs = 2.55
106107108109110111112113114115116117118119120
6 7 8 9 10 11 12 13 14 15 16 17 18 19 20
Moisture (%)
Dry
Unit W
eig
ht
(pcf
)
Figure 4.4. Compaction curve for the blend soil used
4.3 RAP Blends
Three different mixtures of RAP and soil were blended in
the laboratory for testing purposes. RAP and soil were blended to
create materials with RAP contents of 75, 50 and 25 percent by
weight. Grain size analyses for each blend were not performed;
29
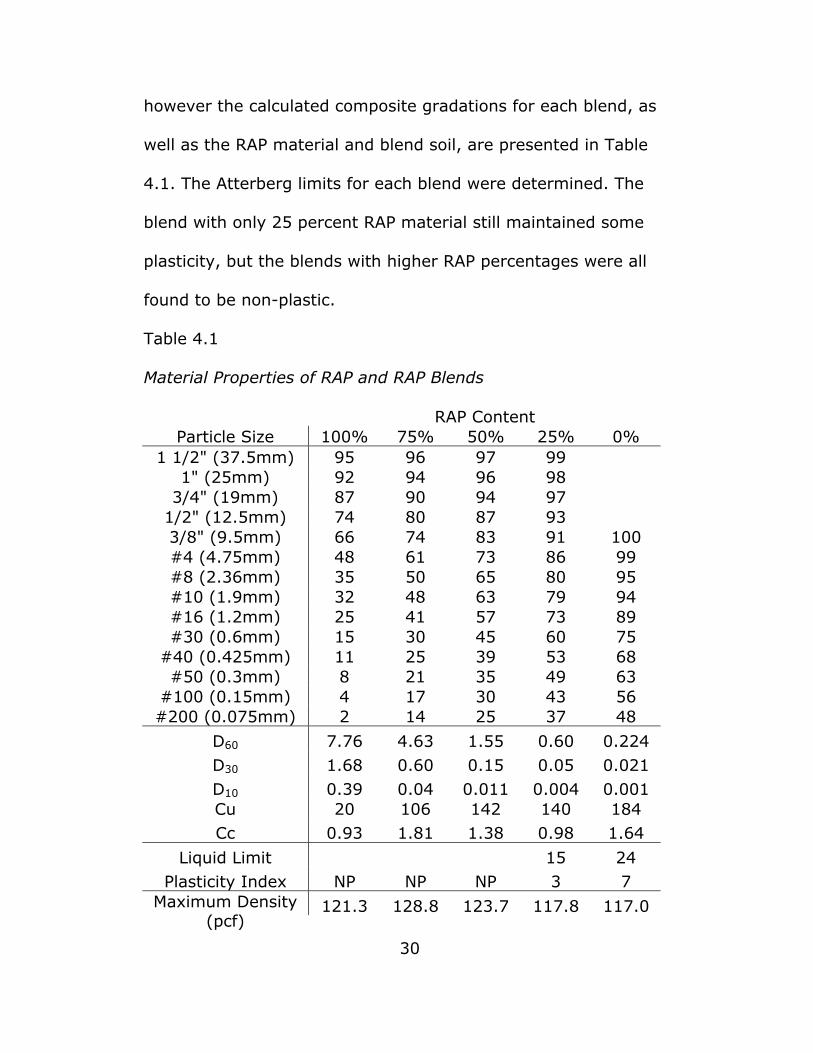
30
however the calculated composite gradations for each blend, as
well as the RAP material and blend soil, are presented in Table
4.1. The Atterberg limits for each blend were determined. The
blend with only 25 percent RAP material still maintained some
plasticity, but the blends with higher RAP percentages were all
found to be non-plastic.
Table 4.1
Material Properties of RAP and RAP Blends
RAP Content Particle Size 100% 75% 50% 25% 0%
1 1/2" (37.5mm) 95 96 97 99 1" (25mm) 92 94 96 98
3/4" (19mm) 87 90 94 97 1/2" (12.5mm) 74 80 87 93 3/8" (9.5mm) 66 74 83 91 100 #4 (4.75mm) 48 61 73 86 99 #8 (2.36mm) 35 50 65 80 95 #10 (1.9mm) 32 48 63 79 94 #16 (1.2mm) 25 41 57 73 89 #30 (0.6mm) 15 30 45 60 75
#40 (0.425mm) 11 25 39 53 68 #50 (0.3mm) 8 21 35 49 63
#100 (0.15mm) 4 17 30 43 56 #200 (0.075mm) 2 14 25 37 48
D60 7.76 4.63 1.55 0.60 0.224 D30 1.68 0.60 0.15 0.05 0.021 D10 0.39 0.04 0.011 0.004 0.001 Cu 20 106 142 140 184 Cc 0.93 1.81 1.38 0.98 1.64
Liquid Limit 15 24 Plasticity Index NP NP NP 3 7
121.3 128.8 123.7 117.8 117.0 Maximum Density (pcf)
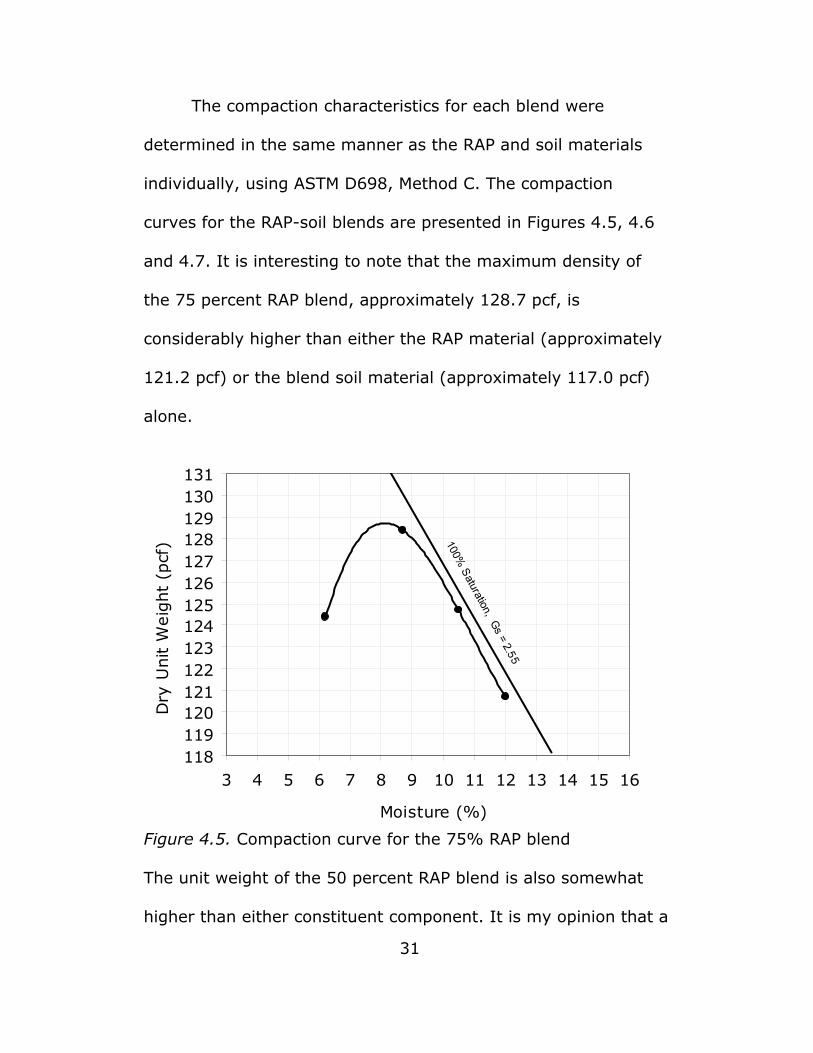
The compaction characteristics for each blend were
determined in the same manner as the RAP and soil materials
individually, using ASTM D698, Method C. The compaction
curves for the RAP-soil blends are presented in Figures 4.5, 4.6
and 4.7. It is interesting to note that the maximum density of
the 75 percent RAP blend, approximately 128.7 pcf, is
considerably higher than either the RAP material (approximately
121.2 pcf) or the blend soil material (approximately 117.0 pcf)
alone.
100% Saturation, Gs = 2.55
118119120121122123124125126127128129130131
3 4 5 6 7 8 9 10 11 12 13 14 15 16
Moisture (%)
Dry
Unit W
eig
ht
(pcf
)
Figure 4.5. Compaction curve for the 75% RAP blend
The unit weight of the 50 percent RAP blend is also somewhat
higher than either constituent component. It is my opinion that a
31
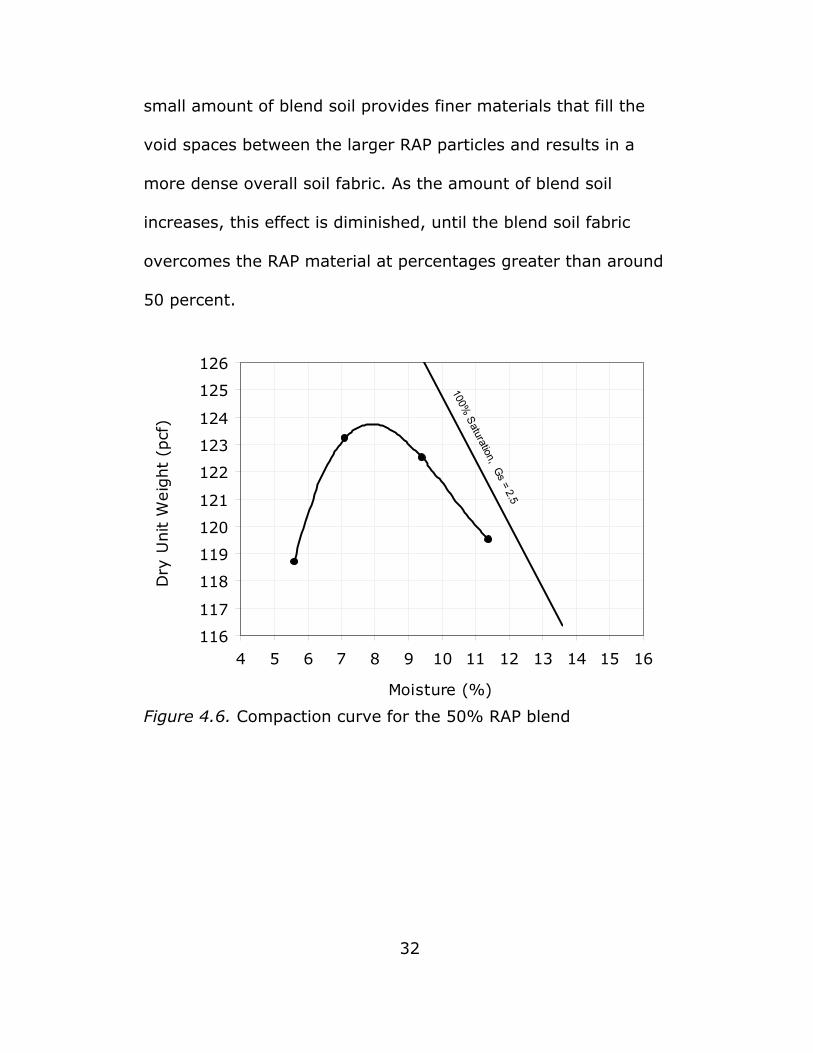
small amount of blend soil provides finer materials that fill the
void spaces between the larger RAP particles and results in a
more dense overall soil fabric. As the amount of blend soil
increases, this effect is diminished, until the blend soil fabric
overcomes the RAP material at percentages greater than around
50 percent.
100% Saturation, Gs = 2.5
116
117
118
119
120
121
122
123
124
125
126
4 5 6 7 8 9 10 11 12 13 14 15 16
Moisture (%)
Dry
Unit W
eig
ht
(pcf
)
Figure 4.6. Compaction curve for the 50% RAP blend
32
100% Saturation, Gs = 2.5
108109110111112113114115116117118119120
6 7 8 9 10 11 12 13 14 15 16 17 18
Moisture (%)
Dry
Unit W
eig
ht
(pcf
)
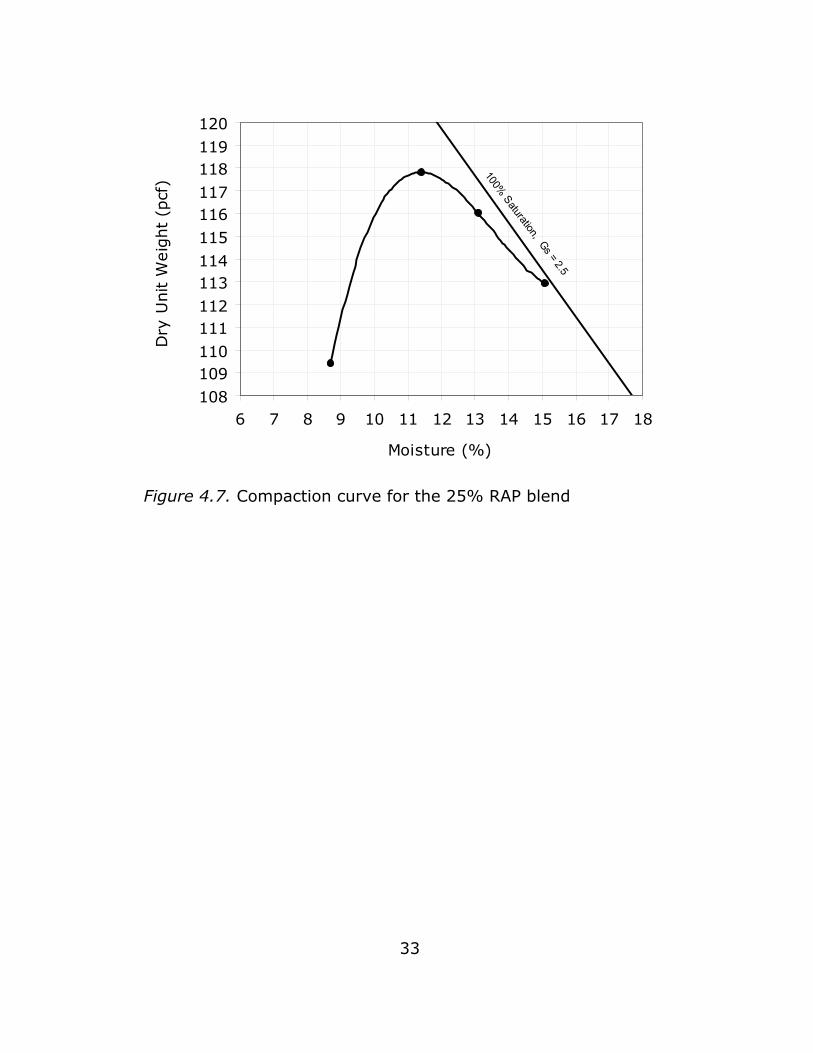
Figure 4.7. Compaction curve for the 25% RAP blend
33
34
CHAPTER 5
COMPRESSIBILITY OF RAP AND RAP SOIL BLENDS
The compressibility of the RAP material, the soil material,
and each blend was tested using the large scale direct shear
apparatus. All specimens were tested in the unsaturated drained
condition. Load increments of normal pressure for each specimen
were chosen in conjunction with the schedule for shear testing.
The summary of these results are presented in Table 5.1. Test
data sheets for all specimens can be found in Appendix B.
5.1 Determining Primary and Secondary Compressibility
Due to the tendency of RAP to creep, a consistent method
had to be developed to determine the end of primary
compression and the initiation of secondary compression for
each load increment. Fur consistency, the point of 100 percent
primary consolidation for each load increment was estimated
using the time-deformation curve from square root of time
method. This method was chosen because the square root of
time method provided a more noticeable straight line trend over
the initial readings than the log of time method. As illustrated in
Figure 5.1, the deformation of the specimen was plotted on the
abscissa against the square root of time plotted on the ordinate.
35
Table 5.1
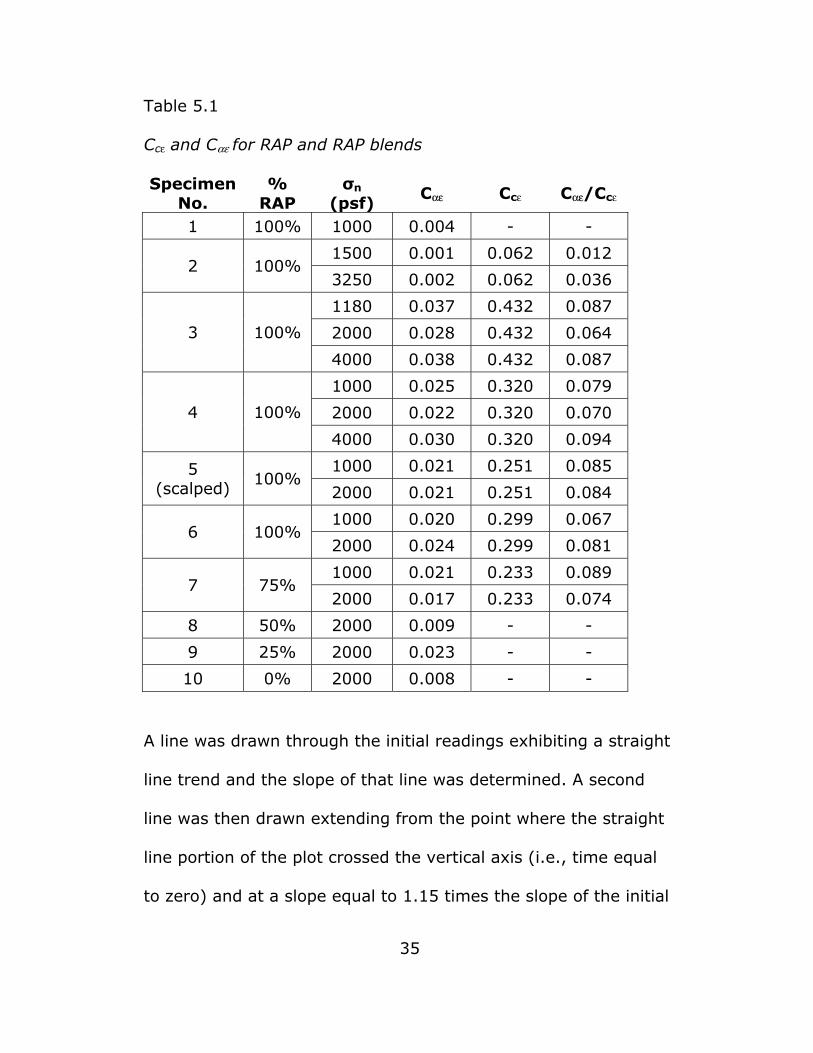
Ccε and Cαε for RAP and RAP blends
Specimen No.
% RAP
σn
(psf) Cαε Ccε Cαε/Ccε
1 100% 1000 0.004 - -
1500 0.001 0.062 0.012 2 100%
3250 0.002 0.062 0.036
1180 0.037 0.432 0.087
2000 0.028 0.432 0.064 3 100%
4000 0.038 0.432 0.087
1000 0.025 0.320 0.079
2000 0.022 0.320 0.070 4 100%
4000 0.030 0.320 0.094
1000 0.021 0.251 0.085 5 (scalped)
100% 2000 0.021 0.251 0.084
1000 0.020 0.299 0.067 6 100%
2000 0.024 0.299 0.081
1000 0.021 0.233 0.089 7 75%
2000 0.017 0.233 0.074
8 50% 2000 0.009 - -
9 25% 2000 0.023 - -
10 0% 2000 0.008 - -
A line was drawn through the initial readings exhibiting a straight
line trend and the slope of that line was determined. A second
line was then drawn extending from the point where the straight
line portion of the plot crossed the vertical axis (i.e., time equal
to zero) and at a slope equal to 1.15 times the slope of the initial
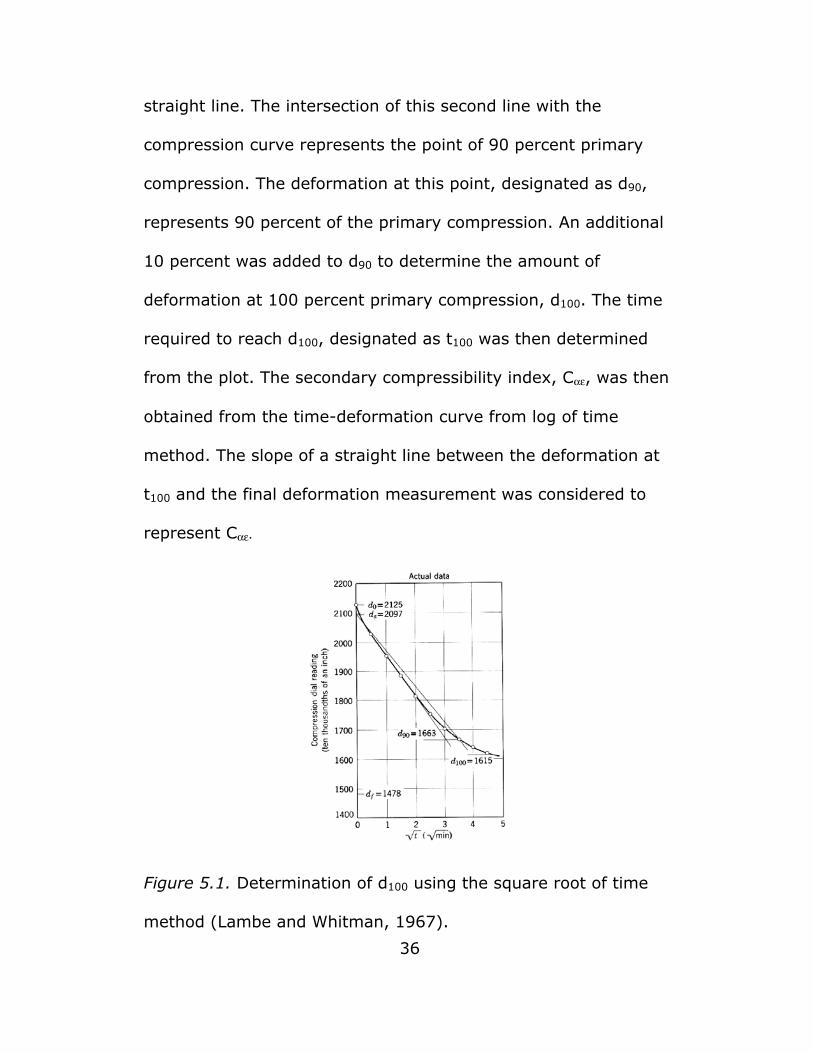
straight line. The intersection of this second line with the
compression curve represents the point of 90 percent primary
compression. The deformation at this point, designated as d90,
represents 90 percent of the primary compression. An additional
10 percent was added to d90 to determine the amount of
deformation at 100 percent primary compression, d100. The time
required to reach d100, designated as t100 was then determined
from the plot. The secondary compressibility index, Cαε, was then
obtained from the time-deformation curve from log of time
method. The slope of a straight line between the deformation at
t100 and the final deformation measurement was considered to
represent Cαε.
Figure 5.1. Determination of d100 using the square root of time
method (Lambe and Whitman, 1967).
36
37
The primary compressibility index, Ccε, was obtained from
the primary compression values for the specimens tested at
multiple normal pressures. From a chart of the percent of strain
plotted along the abscissa versus the normal pressure plotted on
a log scale along the ordinate, Ccε was calculated as the slope of
the line formed by the points. In all cases, the points obtained
between 1,000 psf and 4,000 psf of overburden pressure formed
a relatively straight line. Since it is highly unlikely that the RAP
material has ever experienced 4,000 psf of overburden pressure,
it is reasonable to assume that this line represents the virgin
compression line.
5.2 Compressibility of RAP
Specimen 1, composed of 100 percent RAP only was tested
at a single normal pressure of 1,000 psf. This first specimen
experienced several problems during the compression phase.
These issues were related to maintaining the pump pressure
during the test. It was learned during this early test that the
pump has a difficult time maintaining pressures for an extended
period of time, particularly at low pressures. This problem was
not until late into the test and likely resulted in a lower than
expected secondary compressibility index, Cαε, due to the pump
fluctuations.
38
Specimen 2 was the first specimen tested at more than
one overburden pressure. As with specimen number 1, problems
with the pump resulted in difficulty achieving the desired normal
pressures of 1000 psf and 2000 psf. As a result, the normal
pressures ended up being 1500 psf and 3250 psf. Furthermore,
the pump pressure was not constant throughout the test and
likely resulted in lower than expected primary and secondary
compressibility.
Following the first two trial specimens, the operation of the
pump was significantly improved and proved to be much more
reliable for the remainder of the specimens tested. Specimens 3
and 4 were both tested at normal pressures of 1,000 psf, 2,000
psf and 4,000 psf. Specimen 6 was tested at normal pressures of
1,000 psf and 2,000 psf. Reasonably consistent primary and
secondary compressibility results were obtained from these three
specimens. Specimen 5 was also tested at overburden pressures
of 1,000 psf and 2,000 psf, but the specimen was prepared using
RAP material that was scalped on the ¾-in. (19.0 mm) sieve, so
the results are not directly comparable to the results for the
other tests.
Based on the results of specimens 3, 4 and 6, the primary
compressibility index for the 1.5 inch minus RAP material is
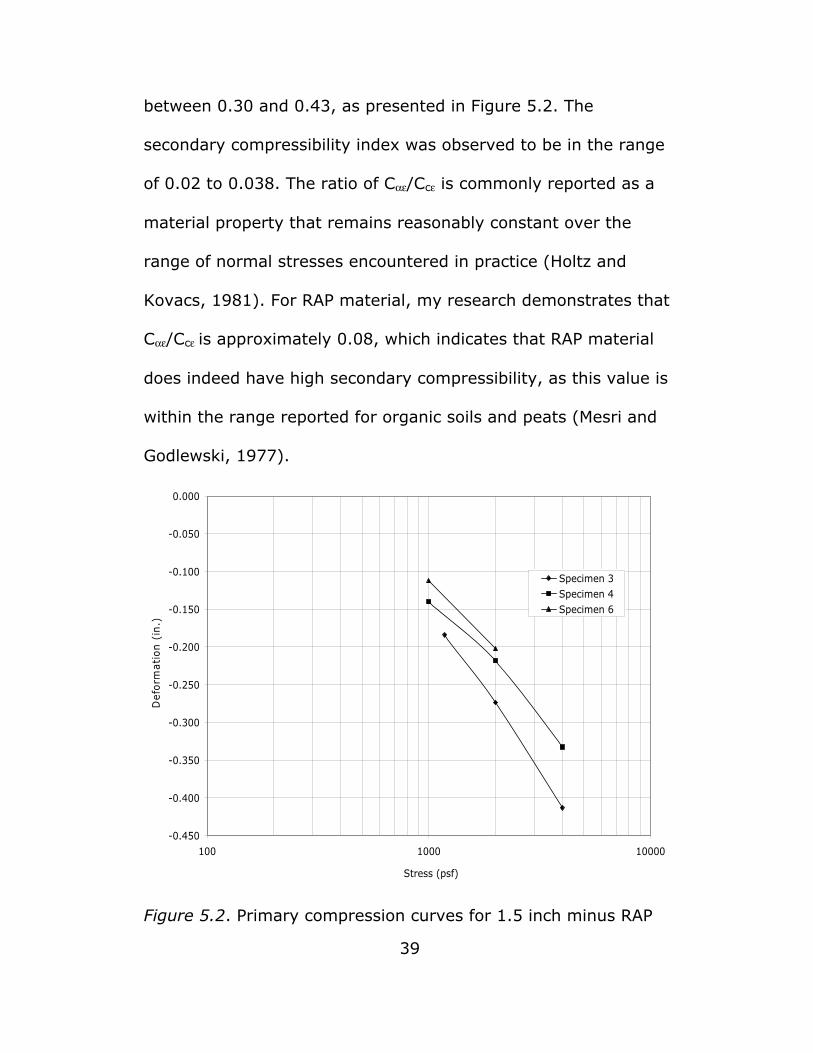
between 0.30 and 0.43, as presented in Figure 5.2. The
secondary compressibility index was observed to be in the range
of 0.02 to 0.038. The ratio of Cαε/Ccε is commonly reported as a
material property that remains reasonably constant over the
range of normal stresses encountered in practice (Holtz and
Kovacs, 1981). For RAP material, my research demonstrates that
Cαε/Ccε is approximately 0.08, which indicates that RAP material
does indeed have high secondary compressibility, as this value is
within the range reported for organic soils and peats (Mesri and
Godlewski, 1977).
-0.450
-0.400
-0.350
-0.300
-0.250
-0.200
-0.150
-0.100
-0.050
0.000
100 1000 10000
Stress (psf)
Def
orm
atio
n (
in.)
Specimen 3Specimen 4Specimen 6
Figure 5.2. Primary compression curves for 1.5 inch minus RAP
39
40
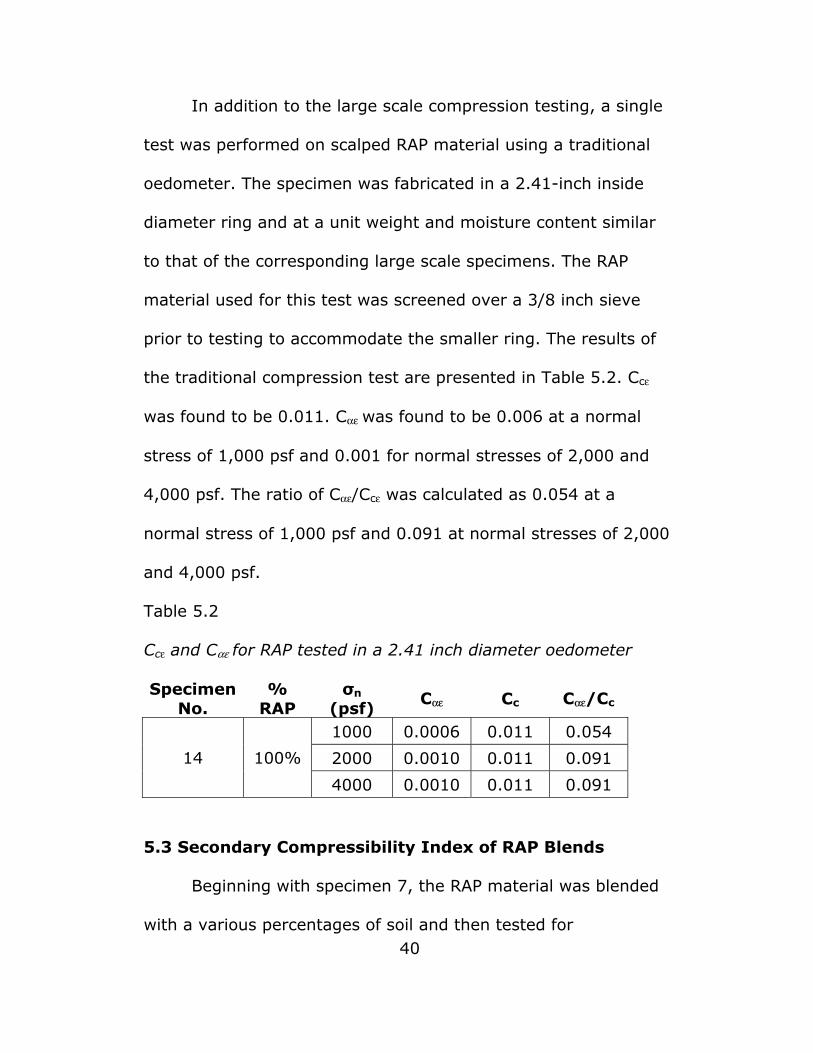
In addition to the large scale compression testing, a single
test was performed on scalped RAP material using a traditional
oedometer. The specimen was fabricated in a 2.41-inch inside
diameter ring and at a unit weight and moisture content similar
to that of the corresponding large scale specimens. The RAP
material used for this test was screened over a 3/8 inch sieve
prior to testing to accommodate the smaller ring. The results of
the traditional compression test are presented in Table 5.2. Ccε
was found to be 0.011. Cαε was found to be 0.006 at a normal
stress of 1,000 psf and 0.001 for normal stresses of 2,000 and
4,000 psf. The ratio of Cαε/Ccε was calculated as 0.054 at a
normal stress of 1,000 psf and 0.091 at normal stresses of 2,000
and 4,000 psf.
Table 5.2
Ccε and Cαε for RAP tested in a 2.41 inch diameter oedometer
Specimen No.
% RAP
σn
(psf) Cαε Cc Cαε/Cc
1000 0.0006 0.011 0.054
2000 0.0010 0.011 0.091 14 100%
4000 0.0010 0.011 0.091
5.3 Secondary Compressibility Index of RAP Blends
Beginning with specimen 7, the RAP material was blended
with a various percentages of soil and then tested for
41
compressibility. Specimen 7 consisted of 75 percent 1.5 inch
minus RAP and 25 percent soil. Specimen 8 consisted of equal
amounts of 1.5 inch minus RAP material and soil. Specimen 9
contained 25 percent 1.5 inch minus RAP and 75 percent soil.
Beginning with specimen 8, problems with maintaining a
constant pump pressure at low pressures during testing
prevented obtaining compression data at the 1,000 psf
overburden pressure. Specimens 8 and 9 were only tested at
2,000 psf and therefore Ccε data for these two blends is
unavailable.
The 75 percent RAP blend still exhibited considerable
secondary compression, but for the 50 percent RAP blend, the
secondary compressibility dropped off significantly. This was not
the case, however, for specimen 9 (25 percent RAP), which
exhibited an unusually high amount of primary compression. It is
believed that the large primary compression resulted in t100
occurring earlier than it should have and ultimately resulted in
larger than normal secondary compression.
5.4 Compressibility of the Blend Soil
For reference, the compressibility of the blend soil alone
was also tested. The blend soil was tested both using the large
scale apparatus as well as using a traditional oedometer. The
42
large scale test of the blend soil was performed only at 2,000 psf
and, as a result, Ccε data is not available. Using the traditional
oedometer, Cαε and Ccε were both obtained. The results of the
large scale test can be found in Table 5.1, while the traditional
test results are presented in Table 5.3.
Table 5.3
Ccε and Cαε for the blend soil tested in a 2.41 inch diameter
oedometer
Specimen No.
% RAP
σn
(psf) Cαε Cc Cαε/Cc
1000 0.0006 0.011 0.057
2000 0.0006 0.011 0.057 15 0%
4000 0.0002 0.011 0.018
The large scale test indicates that the secondary
compressibility index of the blending soil is about 3 to 4 times
lower than that of the RAP material. This result further supports
the observation that RAP material exhibits high secondary
compressibility.
5.5 Discussion
The ratio of Cαε/Ccε for the 100 percent RAP indicates that
RAP does exhibit high secondary compression. While the
research of others such as Rathje et al. (2006) and Consentino
et al. (2003) did not use the ratio of Cαε/Ccε to evaluate
43
secondary compressibility, we all agree that the potential for
creep with RAP is high. Incorporating blending soil with the RAP
material had a significant impact on the secondary
compressibility at a blend of 50 percent RAP with 50 percent soil.
The test data shows that the secondary compressibility of the
RAP-soil blend at the 50 percent blend is approximately the
same as the soil alone. Consentino et al. (2003) had similar
findings with a 20 percent blend of RAP and soil. While there is
disagreement between my test results and the results of
Consentino as to the blend percentage where the creep
associated with the RAP material is mitigated, we both agree
that blending soil with RAP material has the potential to
significantly reduce the large deformations associated with
secondary compressibility.
The values for both the primary and secondary
compressibility indexes obtained with the traditional oedometer
for 100 percent RAP are considerably lower than those obtained
using the large scale test. While the wide discrepancy between
the large scale tests and the traditional scale test raises
questions as to the validity of the large scale testing, it seems
more likely that it indicates the inadequacy of using scalped
material to test RAP compressibility. Even though the absolute
44
values of Cαε, and Ccε were different, the ratios of Cαε/Ccε are
relatively similar and still suggest that the RAP material has high
secondary compressibility.
The ratio of Cαε/Ccε using the traditional oedometer is
within the range for inorganic soils, 0.025 to 0.060, as
suggested by Mesri and Godlewski (1977). Since Ccε was not
obtained for the blending soil using the large direct shear
apparatus, there is no correlation with the traditional oedometer
for Ccε or the ratio of Cαε/Ccε. For the value of Cαε, as with the RAP
material, there is not a good correlation between the large scale
test and the traditional scale test for the blending soil alone.
Again, this may suggest a problem with the large scale
equipment.
45
CHAPTER 6
SHEAR STRENGTH OF RAP AND RAP SOIL BLENDS
The shear strength for thirteen large scale test specimens
was evaluated using the direct shear method under
consolidated-drained condition. The direct shear test method is
an appropriate method for determining the shear strength of the
granular RAP material and blended soils, as these materials will
likely be free draining and should completely consolidate under
relatively rapidly under applied normal stresses.
At the conclusion of secondary compression and at the
desired normal stress for each specimen, the upper portion of
the shear box was lifted approximately ½ inch to facilitate
shearing the specimen without excessive frictional resistance
between the top and bottom of the shear box. The normal load
and the height of the specimen were closely monitored and
maintained as much as possible while lifting the top portion of
the shear box. For specimens 1 and 2, the top portion of the
shear box was only lifted approximately ¼ inch. However in both
cases the gap between the top portion and the bottom portion
closed during shearing. For this reason it was chosen to go with
a ½ inch gap for all subsequent tests.
46
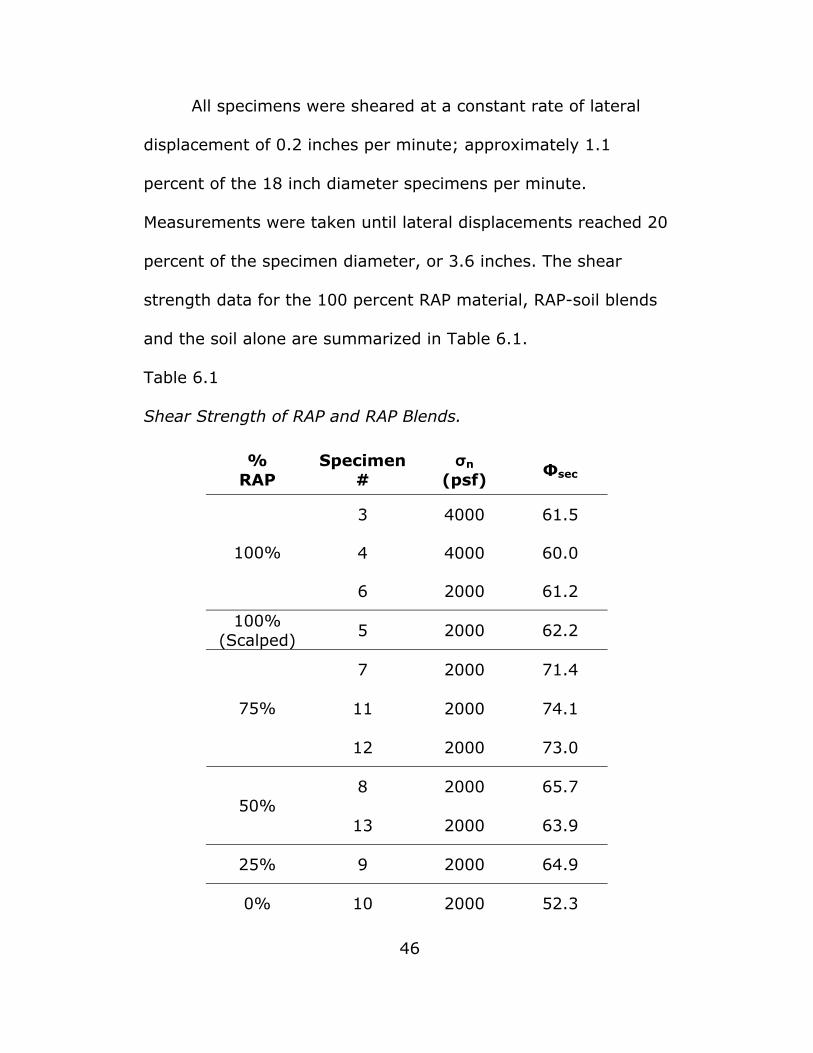
All specimens were sheared at a constant rate of lateral
displacement of 0.2 inches per minute; approximately 1.1
percent of the 18 inch diameter specimens per minute.
Measurements were taken until lateral displacements reached 20
percent of the specimen diameter, or 3.6 inches. The shear
strength data for the 100 percent RAP material, RAP-soil blends
and the soil alone are summarized in Table 6.1.
Table 6.1
Shear Strength of RAP and RAP Blends.
% RAP
Specimen#
σn
(psf) Фsec
3 4000 61.5
4 4000 60.0 100%
6 2000 61.2
100% (Scalped)
5 2000 62.2
7 2000 71.4
11 2000 74.1 75%
12 2000 73.0
8 2000 65.7 50%
13 2000 63.9
25% 9 2000 64.9
0% 10 2000 52.3
47
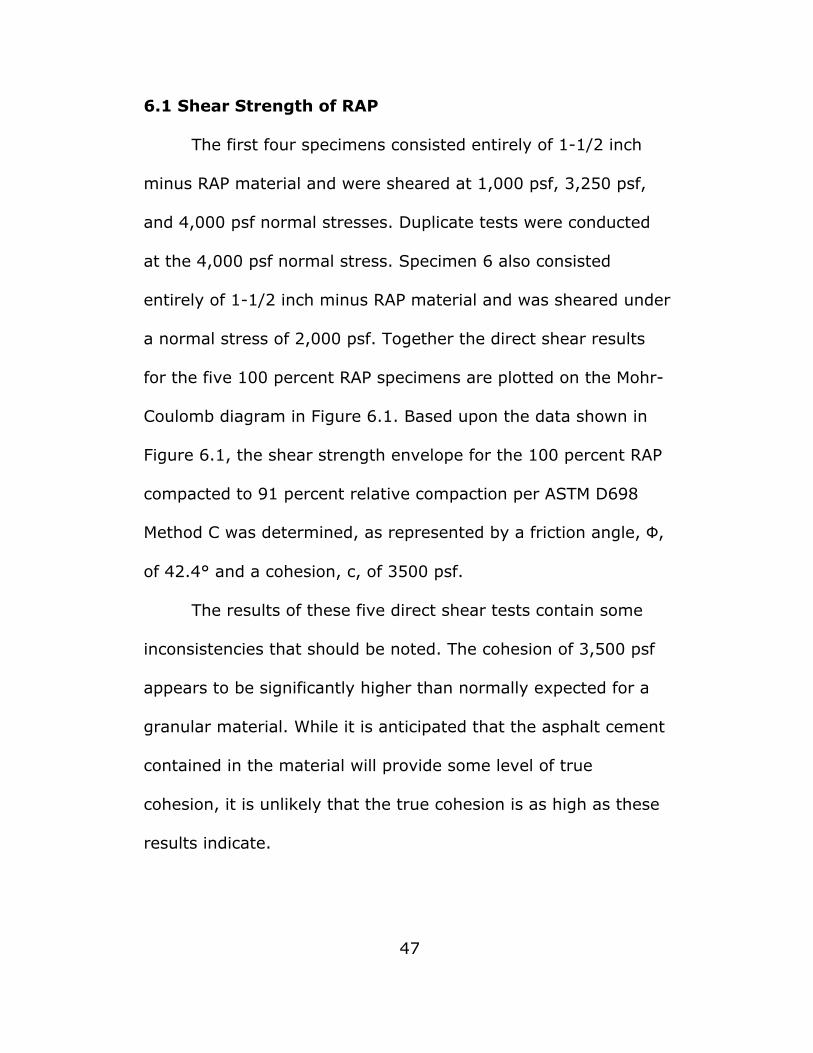
6.1 Shear Strength of RAP
The first four specimens consisted entirely of 1-1/2 inch
minus RAP material and were sheared at 1,000 psf, 3,250 psf,
and 4,000 psf normal stresses. Duplicate tests were conducted
at the 4,000 psf normal stress. Specimen 6 also consisted
entirely of 1-1/2 inch minus RAP material and was sheared under
a normal stress of 2,000 psf. Together the direct shear results
for the five 100 percent RAP specimens are plotted on the Mohr-
Coulomb diagram in Figure 6.1. Based upon the data shown in
Figure 6.1, the shear strength envelope for the 100 percent RAP
compacted to 91 percent relative compaction per ASTM D698
Method C was determined, as represented by a friction angle, Ф,
of 42.4° and a cohesion, c, of 3500 psf.
The results of these five direct shear tests contain some
inconsistencies that should be noted. The cohesion of 3,500 psf
appears to be significantly higher than normally expected for a
granular material. While it is anticipated that the asphalt cement
contained in the material will provide some level of true
cohesion, it is unlikely that the true cohesion is as high as these
results indicate.
0
1000
2000
3000
4000
5000
6000
7000
8000
9000
10000
0 1000 2000 3000 4000 5000 6000
Normal Stress (psf)
Shear
Str
ess
(psf
)
Ф = 42.4° c = 3500 psf
Figure 6.1. Ф and c for RAP material
In addition to the questionably high cohesion, the shear
strength of the first two specimens, tested at 1,000 psf and
3,250 psf normal stresses respectively, seem to have resulted in
shear strengths that are significantly higher than expected when
presented with the rest of the data. This is likely the result of the
top section of the shear box coming into contact with the bottom
section during the shearing operation, which would undoubtedly
result in higher shear strengths. This problem was corrected with
subsequent specimens by increasing the gap between the top
and bottom sections to ½-inch.
48
49
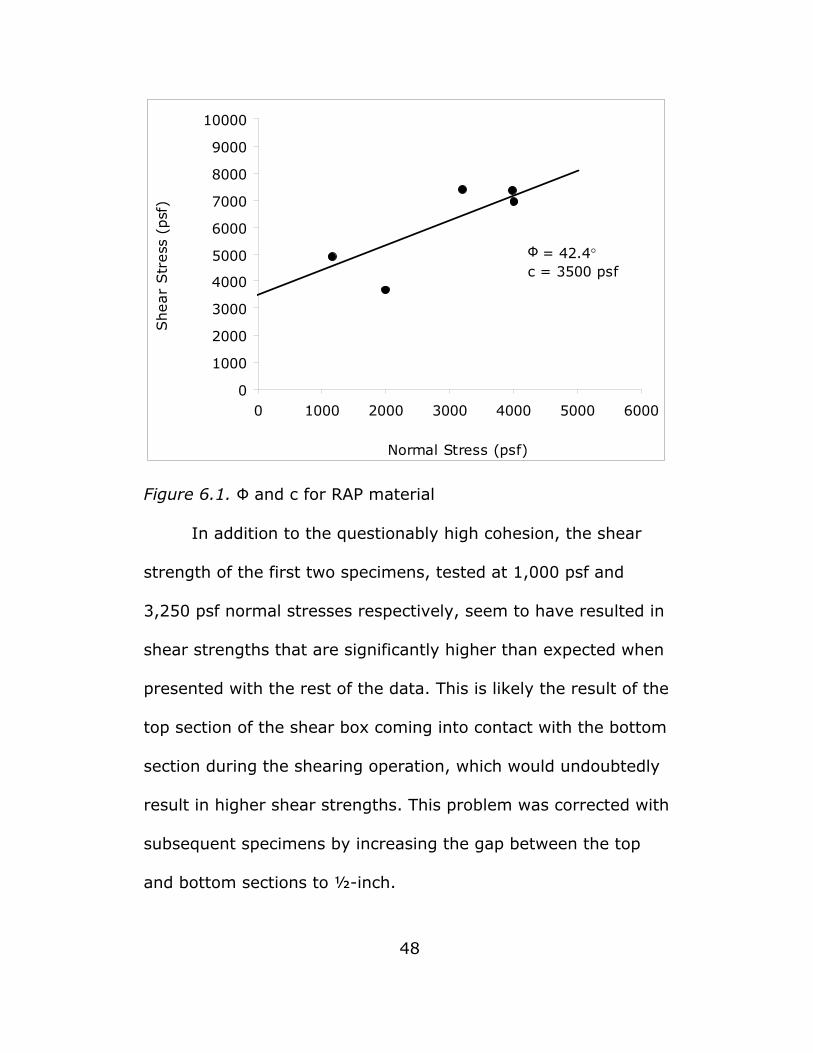
Figure 6.2 presents two alternative shear strength
envelopes for the 100 percent RAP material after removing the
problematic data for the first two tests. For the first
interpretation, the secant friction angle, Фsec, was used. The
secant friction angle assumes that the material is cohesionless.
While this may not be strictly correct, the secant friction angle
provides a good basis for comparison of the shear strength
between specimens tested at a similar normal stress using
different percentages of RAP. Using this method, Фsec for the RAP
material is 60.8°. A second shear strength envelope was
developed after discarding the problematic data by assuming
cohesion equal to 1,150 psf, the value found by Rathje et al
(2006). This second method of interpretation yielded a friction
angle of 55.7° to go with the cohesion of 1,150 psf.
To evaluate the sensitivity of the tests results to particle
size, it was decided to also evaluate the shear strength of 100
percent RAP material that was scalped over a ¾ inch sieve. The
shear strength of the RAP material scalped over a ¾” sieve was
tested under a single normal stress of 2,000 psf with Specimen
5. The resulting secant friction angle, as presented in Figure 6.3,
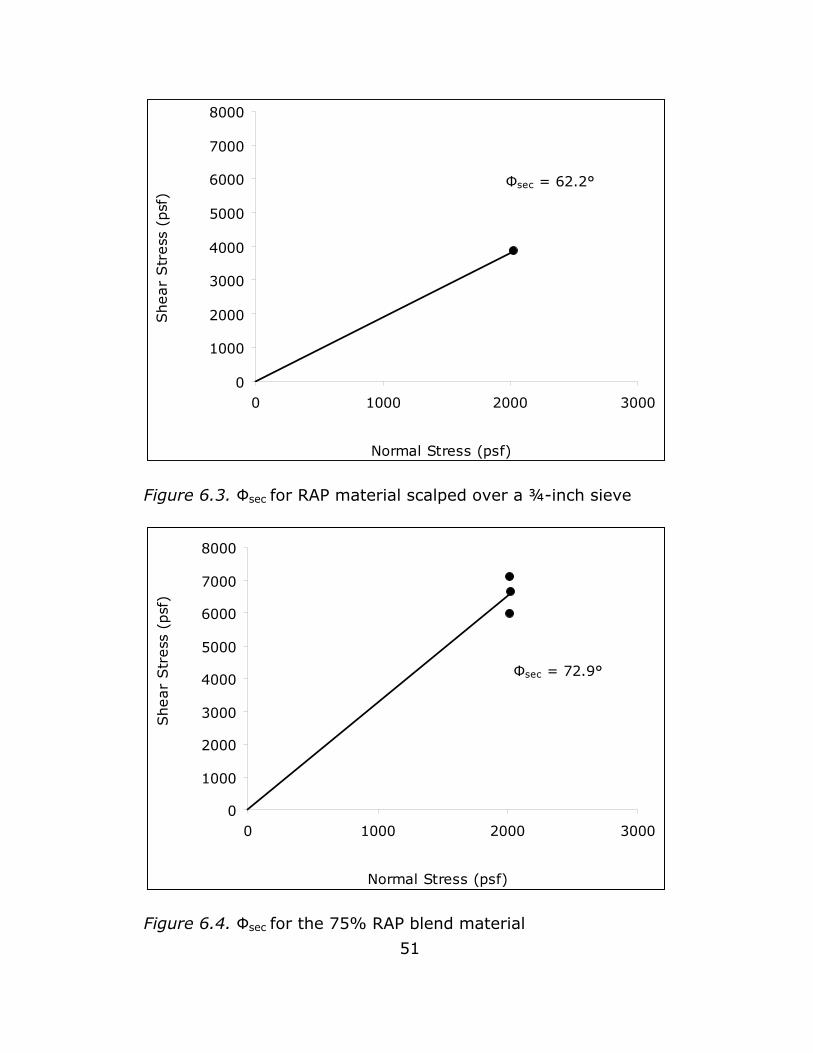
is 62.2°. The secant friction angle for the scalped material is
slightly higher than but consistent with the shear strength of the
1.5 inch minus RAP specimens.
0
1000
2000
3000
4000
5000
6000
7000
8000
9000
10000
0 1000 2000 3000 4000 5000 6000
Normal Stress (psf)
Shear
Str
ess
(psf
)
Фsec = 60.8°
Ф = 55.7°c = 1150 psf
Figure 6.2. Фsec for RAP material
6.2 Shear Strength of RAP Blends
Six specimens, representing the three separate RAP
blends, were tested for shear strength. Each of the RAP blend
specimens were tested at a normal stress of 2,000 psf. Three
tests were conducted on specimens with 75 percent RAP, two
tests were conducted on the 50 percent RAP-soil blend, and one
test was conducted at the 25% RAP-soil blend. The shear
strength envelopes for the 75, 50 and 25 percent blends are
presented in Figures 6.4, 6.5 and 6.6 respectively.
50
0
1000
2000
3000
4000
5000
6000
7000
8000
0 1000 2000 3000
Normal Stress (psf)
Shear
Str
ess
(psf
)Фsec = 62.2°
Figure 6.3. Фsec for RAP material scalped over a ¾-inch sieve
0
1000
2000
3000
4000
5000
6000
7000
8000
0 1000 2000 3000
Normal Stress (psf)
Shear
Str
ess
(psf
)
Фsec = 72.9°
Figure 6.4. Фsec for the 75% RAP blend material
51
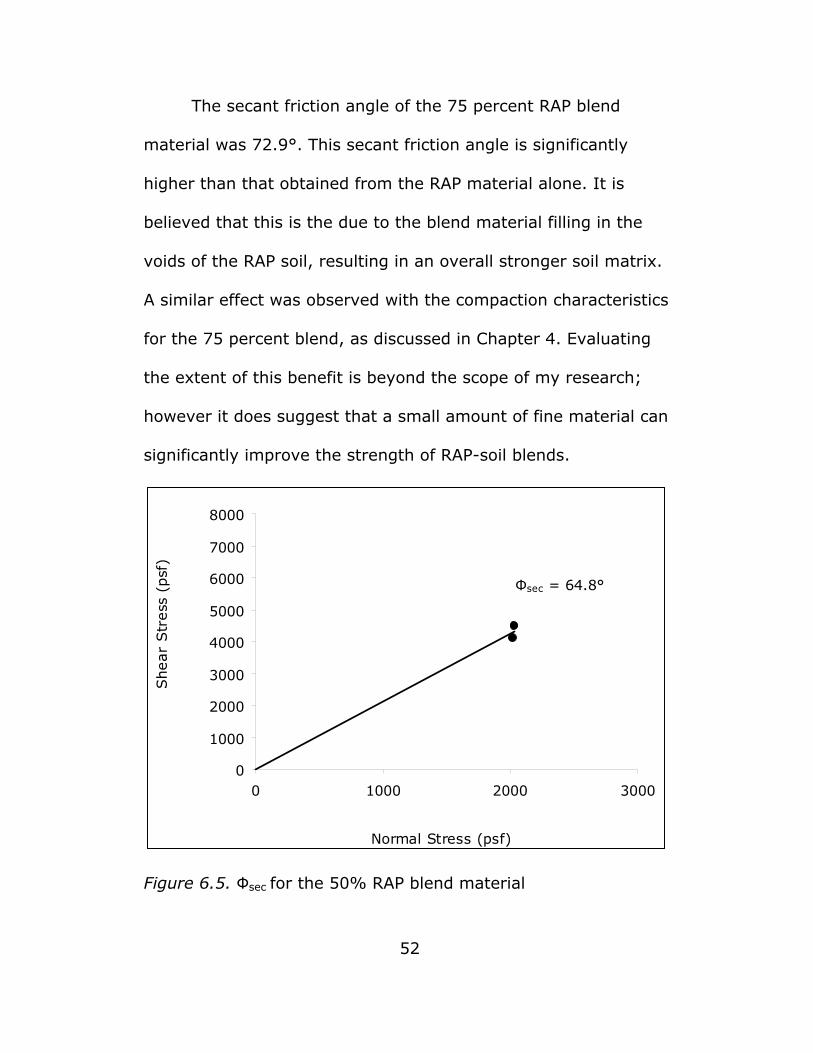
The secant friction angle of the 75 percent RAP blend
material was 72.9°. This secant friction angle is significantly
higher than that obtained from the RAP material alone. It is
believed that this is the due to the blend material filling in the
voids of the RAP soil, resulting in an overall stronger soil matrix.
A similar effect was observed with the compaction characteristics
for the 75 percent blend, as discussed in Chapter 4. Evaluating
the extent of this benefit is beyond the scope of my research;
however it does suggest that a small amount of fine material can
significantly improve the strength of RAP-soil blends.
0
1000
2000
3000
4000
5000
6000
7000
8000
0 1000 2000 3000
Normal Stress (psf)
Shear
Str
ess
(psf
)
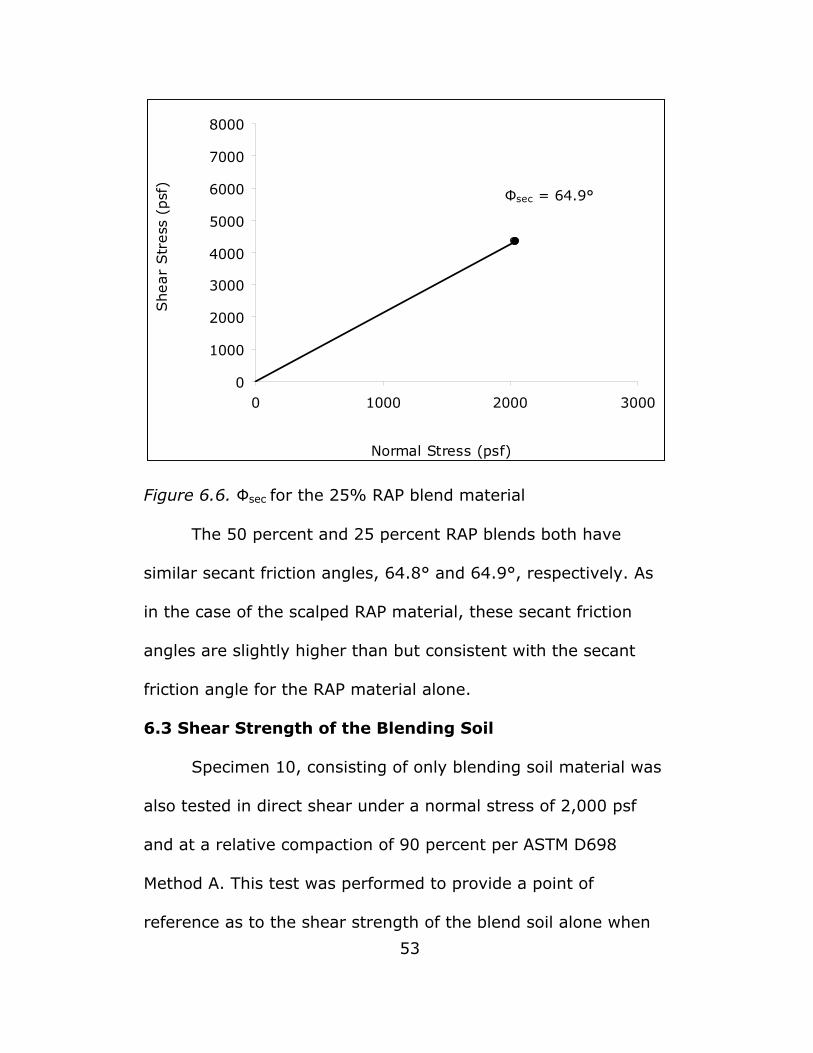
Фsec = 64.8°
Figure 6.5. Фsec for the 50% RAP blend material
52
0
1000
2000
3000
4000
5000
6000
7000
8000
0 1000 2000 3000
Normal Stress (psf)
Shear
Str
ess
(psf
)
Фsec = 64.9°
Figure 6.6. Фsec for the 25% RAP blend material
The 50 percent and 25 percent RAP blends both have
similar secant friction angles, 64.8° and 64.9°, respectively. As
in the case of the scalped RAP material, these secant friction
angles are slightly higher than but consistent with the secant
friction angle for the RAP material alone.
6.3 Shear Strength of the Blending Soil
Specimen 10, consisting of only blending soil material was
also tested in direct shear under a normal stress of 2,000 psf
and at a relative compaction of 90 percent per ASTM D698
Method A. This test was performed to provide a point of
reference as to the shear strength of the blend soil alone when
53
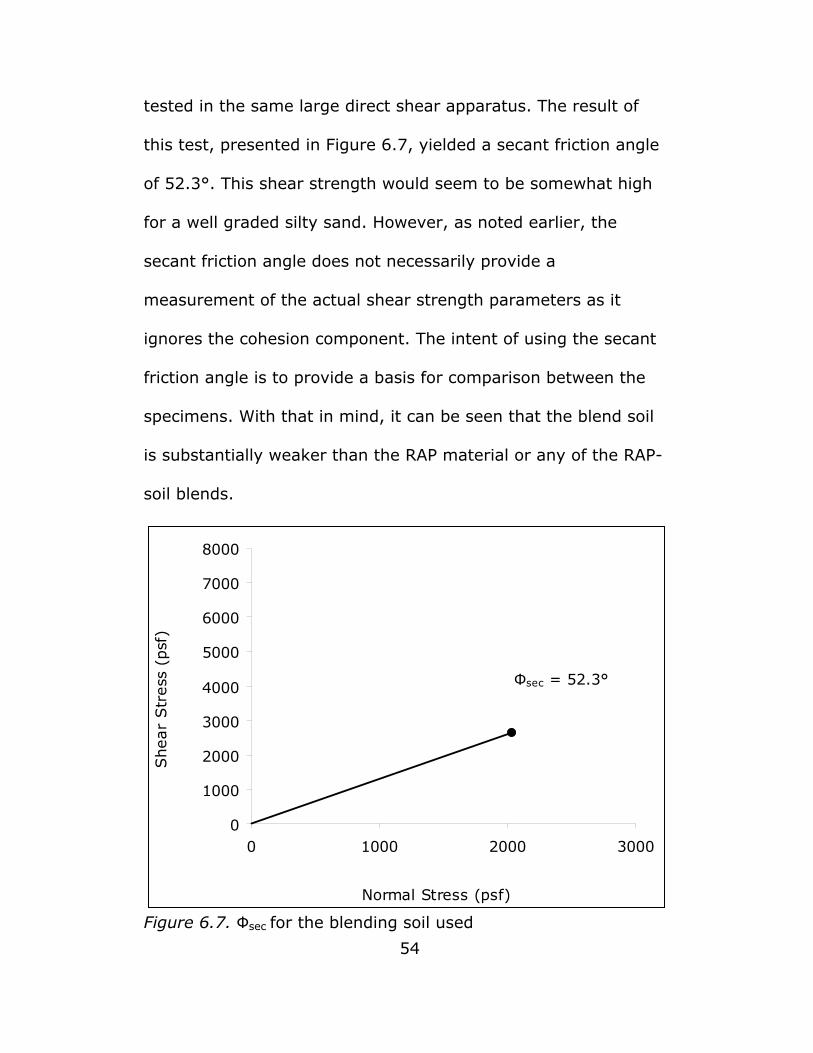
tested in the same large direct shear apparatus. The result of
this test, presented in Figure 6.7, yielded a secant friction angle
of 52.3°. This shear strength would seem to be somewhat high
for a well graded silty sand. However, as noted earlier, the
secant friction angle does not necessarily provide a
measurement of the actual shear strength parameters as it
ignores the cohesion component. The intent of using the secant
friction angle is to provide a basis for comparison between the
specimens. With that in mind, it can be seen that the blend soil
is substantially weaker than the RAP material or any of the RAP-
soil blends.
0
1000
2000
3000
4000
5000
6000
7000
8000
0 1000 2000 3000
Normal Stress (psf)
Shear
Str
ess
(psf
)
Фsec = 52.3°
Figure 6.7. Фsec for the blending soil used
54
55
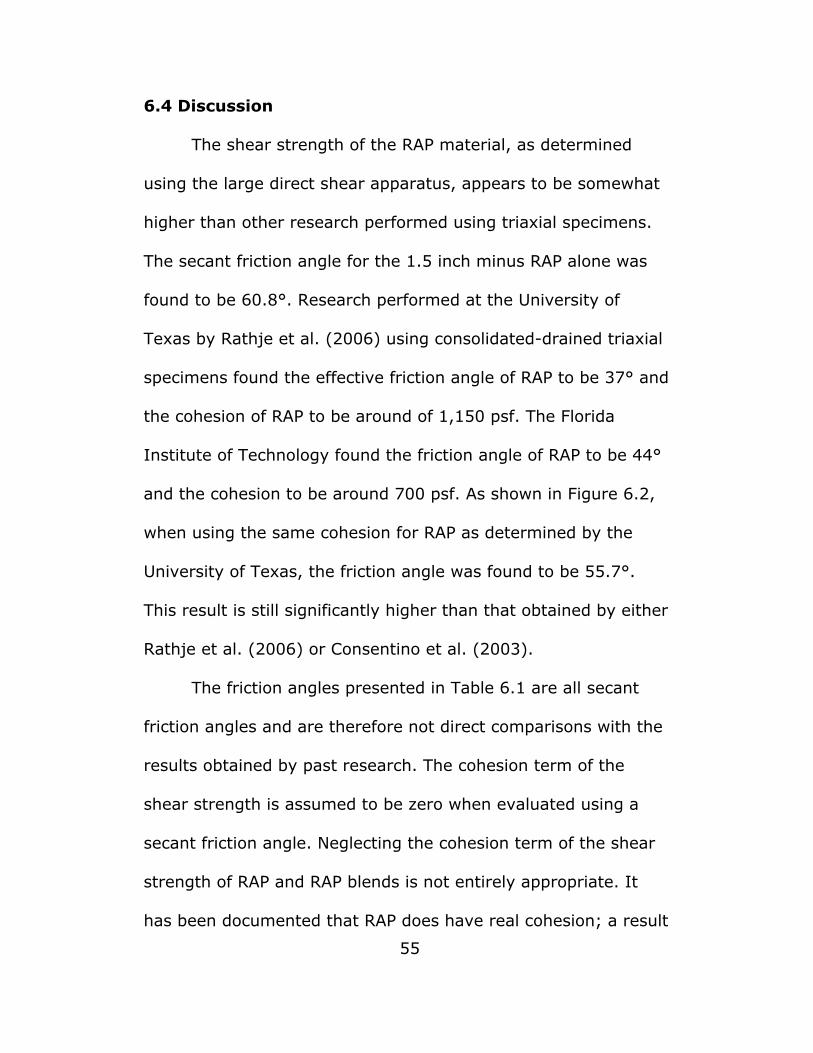
6.4 Discussion
The shear strength of the RAP material, as determined
using the large direct shear apparatus, appears to be somewhat
higher than other research performed using triaxial specimens.
The secant friction angle for the 1.5 inch minus RAP alone was
found to be 60.8°. Research performed at the University of
Texas by Rathje et al. (2006) using consolidated-drained triaxial
specimens found the effective friction angle of RAP to be 37° and
the cohesion of RAP to be around of 1,150 psf. The Florida
Institute of Technology found the friction angle of RAP to be 44°
and the cohesion to be around 700 psf. As shown in Figure 6.2,
when using the same cohesion for RAP as determined by the
University of Texas, the friction angle was found to be 55.7°.
This result is still significantly higher than that obtained by either
Rathje et al. (2006) or Consentino et al. (2003).
The friction angles presented in Table 6.1 are all secant
friction angles and are therefore not direct comparisons with the
results obtained by past research. The cohesion term of the
shear strength is assumed to be zero when evaluated using a
secant friction angle. Neglecting the cohesion term of the shear
strength of RAP and RAP blends is not entirely appropriate. It
has been documented that RAP does have real cohesion; a result
56
of the asphalt binder fusing the particles together (Rathje et al.,
2006). Table 6.2 presents friction angles for the various RAP
blends for three different assumed cohesions; 0 psf, 1,150 psf as
documented by Rathje et al. (2006), and 3,500 psf as presented
in Figure 6.1. The results for the friction angles presented in
Table 6.2 indicate that the friction angle of RAP is relatively high,
even with a cohesion term included.
Table 6.2
Ф for Varying Amounts of Cohesion
Percent RAP (by weight)
c, psf 100% 75% 50% 25%
0 60.8 72.9 64.8 64.9
1150 55.7 69.6 57.3 57.5
3500 39.3 56.7 21.7 22.6
It would appear from the results of the direct shear tests
performed on the RAP blends that a significant improvement to
the shear strength occurs when RAP is blended with soil. This
finding is contrary to what was observed by Consentino et al.
(2003), in which the friction angle of a 20 percent RAP-soil blend
decreased from 44° to 41°. Consentino et al. (2003) also
observed, however, that the cohesion of the RAP-soil blend
57
increased from 605 psf to 1,325 psf with the 20 percent RAP-soil
blend. Due to the increase in cohesion, Consentino et al. (2003)
concludes that the shear strength of the 20 percent RAP blend
was comparable with that of 100 percent RAP that they tested.
It is important to note that the consolidated-drained direct
shear tests performed on the RAP and RAP-soil blends for this
thesis have not been scalped of the larger particles (except for
specimen 5 which was scalped on the ¾ inch sieve). The
inclusion of these larger particles may have a significant impact
on the shear strength of the RAP and RAP-soil blends. All of the
comparative shear strength data has been scalped to
accommodate testing in 4 inch diameter triaxial cells. For this
reason, additional testing with the large scale direct shear
apparatus should be performed to verify the impact that the
larger particles may have on the shear strength properties of
RAP and RAP-soil blends.
58
CHAPTER 7
CONCLUSIONS AND RECOMMENDATIONS
7.1 Summary
Based on the findings of my research, several general
conclusions can be drawn about RAP and RAP blends. The
findings presented herein represent only a very limited testing
program, and further testing should be performed to further
confirm these conclusions. That being said, I believe the
following conclusions can help to further the understanding of
material properties and strength characteristics of RAP material
and RAP-soil blends.
7.1.1 Compaction characteristics of RAP and RAP
blends. The density of the RAP-soil blends was significantly
higher than that of either the RAP material or the blending soil
alone. This is likely due to the resultant grading of the RAP-soil
blends being more well-graded than the RAP material alone.
With the 75 percent and 50 percent RAP blends, the finer
material of the blending soil is able to fill in the voids of the RAP
material. With the 25 percent blend, it would appear that the
RAP particles are floating in the matrix of the blending soil, and
the resultant density is very similar to the blending soil alone.
The results of my research are confirmed by the findings of
59
Consentino et al. (2003), which also found increased densities
for the 80 percent and 60 percent RAP blends. This suggests that
blending RAP into soil, at blend percentages of 50 percent or
more RAP by weight, could significantly increase the density of
the soil and could be used as a means of improving the shear
strength of general fill materials where perhaps creep potential is
not of great concern.
7.1.2 Compressibility of RAP and RAP blends. RAP
material by itself is fairly well documented as exhibiting high
secondary compressibility, or creep, potential and this fact has
further been substantiated by my research. The parameter used
to quantify the level of secondary compressibility was the ratio of
Cαε/Ccε. Mesri and Godlewski (as cited in Holtz, & Kovacs, 1981)
summarized data on the ratio of Cαε/Ccε and determined that the
range for inorganic soils is about 0.025 to 0.06. The results of
the RAP material tested in this research yield higher values than
that, values around 0.08. Comparison with typical values from
Mesri and Godlewski cited in Holtz and Kovaks (1981) suggests
that RAP exhibits secondary compressibility of around the same
magnitude as organic soils.
Due to experimental difficulties, the only blend specimens
that I was able to obtain a ratio of Cαε/Ccε for were the 75
60
percent RAP blends. At this blend ratio the material still had a
Cαε/Ccε ratio representative of organic soil, measuring around
0.08 as well. Unfortunately, equipment problems prevented me
from being able to determine Ccε for the 50 percent and 25
percent blends. In looking at only the secondary compressibility
index, Cαε, for the 50 percent blend, there does seem to be an
indication that Cαε is approaching that of the blend soil. It seems
logical that as the soil becomes dominant in the RAP-soil blend,
Cαε should approach that of the soil. It may be that a 50 percent
blend of RAP and soil mitigates the negative potential for
excessive creep that RAP material alone exhibits.
7.1.3 Shear Strength of RAP and RAP blends. It would
appear as though the shear strength of RAP material is high, on
the same order of magnitude or greater than other granular
materials. It may also be concluded that RAP material can
significantly improve the shear strength properties of soils when
blended together. This is best exemplified with the 75 percent
RAP-soil blend, in which the friction angle was found to be
substantially higher than either of the constituent components.
Even at low RAP contents, however, the shear strength of the
resultant blend was found to be at least as high as RAP alone
and higher than the soil. Because of this, RAP may be considered
61
as a viable material for improving the shear strength of low
strength soils used in general fills.
Due to the large size of the RAP particles it is absolutely
important to use a large scale direct shear machine to determine
the shear strength of RAP. The correlation that I performed
between a large scale test and a traditional sized test was not
very good. However, refinement of the procedures used and
additional testing may help to improve the correlation.
7.1.4 Evaluation of RAP as Structure Backfill. One of
the original objectives for this testing program was to evaluate
the potential for using RAP as backfill material for structures.
Past research by Rathje et al. (2006) has evaluated the use of
RAP as an MSE backfill material. However, these investigators
did not address the use of RAP blends as MSE wall backfill or the
use of RAP or RAP Blends as a general structure backfill material.
Rathje et al. (2006) rejects RAP material for use as MSE backfill
for permanent structures due to the creep potential of the
material, but, as shown in this research, blending RAP with soil
may mitigate creep effects.
The data from this research agrees with the conclusion
that RAP exhibits considerable potential for creep. However, for
the backfill of structures where some long-term settlement can
62
be tolerated, RAP is likely a suitable material. RAP can be milled
and crushed to meet virtually any material gradation
requirements, and is a dense material that compacts easily. With
the addition of a small amount of soil, as with the 75% RAP
blend, the density and compaction of the resultant blend was
even better. RAP and RAP blends exhibit relatively high shear
strength, which is typically desirous for backfill material behind
structures. Furthermore, even though RAP is a cohesive
material, RAP is very different from clay. RAP material is a free
draining material and does not require drainage considerations
behind structures as typical cohesive materials do. Hydraulic
conductivity tests were not performed as part of this research.
However, Rathje et al. (2006) report that the RAP tested at the
University of Texas had a hydraulic conductivity equal to 5.5
x10-4 cm/s at a confining pressure of 50 psi.
7.2 Recommendations
I have several recommendations with regards to further
research efforts at Arizona State University on the general topic
of the characteristics of RAP and RAP blends. These
recommendations have been developed based on a working
knowledge of the current equipment available for use during the
63
testing and on several ideas that may be worth exploring in a
broader research program.
7.2.1 Limitations of the test equipment. During the
testing for this research a couple of issues were experienced with
the equipment that should be addressed before further research
is conducted. The first issue involves the preparation of the
specimens inside the shear box for the large direct shear
apparatus. The size and weight of the shear box and top caps
made them prohibitively difficult to move around. A hydraulic
hand lift was available to assist in moving these components.
However, the combined weight of the mold, sample and top caps
really pushed the limits of the lift. The first sample was prepared
and compacted on the ground, outside of the direct shear frame.
For safety reasons, it was decided that subsequent specimens
would be prepared with the mold already in the direct shear
frame. This made it difficult to compact the specimens as there
was limited room above the shear box to raise and drop the
compaction hammer. I would recommend that a fork lift be used
in the future to accommodate the preparation of the specimens
outside of the frame. Due to limited space in the geotechnical
lab, this may also involve moving the large scale direct shear
apparatus to another location.
64
Due to the surface area of the specimen, fairly large pump
pressures were required to produce the desired axial and lateral
stresses on the specimens. This required the use of the large
pump in the basement for the lateral loads and a smaller pump
for the axial loads. During my testing, I experienced numerous
problems with the smaller pump and its associated equipment.
The ability to hold a constant pressure for 24 hours or more was
the biggest problem. This problem seemed to be exaggerated at
lower pressures. The only way to maintain constant pressure
with the pump was to keep constant watch on the pump
pressure and make adjustments as needed. For testing that
spans several days, this was just not practical. I would strongly
recommend that these issues be resolved before any further
testing is performed.
Because of the problems with the pump, it would have
been ideal to perform long term compression testing on the
ground using dead loads. This was not performed for my
research because of a couple of issues. First and foremost was
the safety factor of trying to move a loaded shear box into the
direct shear frame for shear testing following the compression
testing. Secondly, a large amount of weight is necessary to
produce the desired pressures due to the size of the specimen.
65
For example, in order to produce 2,000 psf of pressure on the
surface area of an 18 inch diameter circle (1.76 square feet),
3,520 pounds of dead load is necessary. This is the equivalent of
placing a small car on top of the specimen. Again this is not
practical and would not be necessary if the smaller pump was in
good working order.
7.2.2 Recommendations for further research. The
limited testing performed during the research for this thesis
really just scratches the surface of the testing that is required to
truly characterize RAP blends. At a minimum, I would
recommend additional compression and shear strength tests at
the same blend ratios as performed for this research to further
confirm the validity of the results. I would also recommend, if
possible, that tests for compressibility span several days up to a
week. This would help to better evaluate the secondary
compressibility of the blends. Additionally, compression testing
performed over a wider range of overburden pressures would
help to better evaluate Ccε. Direct shear testing should also be
performed over a wider range of overburden pressures to
develop a more accurate shear strength envelope.
Since the end goal for researching RAP blends is to
hopefully identify an easy solution for mitigating the potential for
66
creep, I recommend that further methods for potentially
mitigating the creep potential of RAP also be evaluated. Future
research should include varying the moisture content during
compaction to evaluate the effect this might have on creep,
varying the type of blend soil added to the RAP as well as
investigating the effects of applying heat during compaction,
which could perhaps have the effect of fusing the material
together.
7.3 Conclusions
RAP is an abundant material that is finding its way onto
construction projects all over the country. While this may be due
in part to the diligent promotion of incorporating recyclable
materials into construction, the real driving factor behind this is
its availability as a cheap construction material. Research such
as this will help us to understand how RAP material will function
in a variety of construction applications. Hopefully the end result
will be the successful use of RAP material in the future for
applications that are presently not being considered because of a
lack of understanding about RAP behavior.
67
REFERENCES
ASTM International (2008). Standard test method for particle-size analysis of soils (ASTM D422). Annual Book of ASTM Standards. West Conshohocken, PA: American Society for Testing and Materials.
ASTM International (2008). Standard test method for laboratory
compaction characteristics using standard effort (ASTM D698). Annual Book of ASTM Standards. West Conshohocken, PA: American Society for Testing and Materials.
ASTM International (2008). Standard test method for one-
dimensional consolidation properties of soils (ASTM D2435). Annual Book of ASTM Standards. West Conshohocken, PA: American Society for Testing and Materials.
ASTM International (2008). Standard practice for classification of
soils for engineering purposes (ASTM D2487). Annual Book of ASTM Standards. West Conshohocken, PA: American Society for Testing and Materials.
ASTM International (2008). Standard test method for direct
shear test of soils under consolidated drained conditions (ASTM D3080). Annual Book of ASTM Standards. West Conshohocken, PA: American Society for Testing and Materials.
ASTM International (2008). Standard test method for liquid limit,
plastic limit, and plasticity index of soils (ASTM D4318). Annual Book of ASTM Standards. West Conshohocken, PA: American Society for Testing and Materials.
ASTM International (2008). Standard practice for correction of
unit weight and water content for soils containing oversize particles (ASTM D4718). Annual Book of ASTM Standards. West Conshohocken, PA: American Society for Testing and Materials.
68
Bardet, J.P. (1997). Experimental soil mechanics. Upper Sadle River, NJ: Prentice-Hall, Inc.
Cosentino, P.J., Kalaajin, E.H., Shieh, C.S., Mathurin, W.K.J.,
Gomez, F.A., Cleary, E.D., and Treeratrakoon, A. (2003). Developing specifications for using recycled asphalt pavement as base, subbase or general fill materials, phase II (FL/DOT/RMC/06650-7754). Melbourne, FL: Florida Institute of Technology.
Eighmy, T.T., and Magee, B.J. (2001). The road to reuse. Civil
Engineering, 71(9), 66-71 Giroud, J.P. (2010). Development of criteria for geotextile and
granular filters: 9th International Conference on Geosynthetics (pp. 45-64). Guaruja, Brazil.
Holtz, R.D, and Kovacs, W.D. (1981). An introduction to
geotechnical engineering. Upper Saddle River, NJ: Prentice-Hall, Inc.
Kuennen, T. (2007, October 1). The economics of recycling. Rock
Products, Retrieved from http://rockproducts.com/index.php/features/59-features/6691.html.
Lambe, T.W., and Whitman, R.V. (1967). Soil mechanics. John
Wiley and Sons: New York, NY. Lindquist, E.S. (1994). The strength and deformation properties
of melange. Ph.D. Dissertation. Department of Civil Engineering: University of California at Berkeley.
Mesri, G., and Godlewski, P.M. (1977). Time- and stress-
compressility interrelationship. Journal of the Geotechnical Division, ASCE, 103(GT5), 417-430.
Rathje, E.M., Rauch, A.F., Folliard, K.J., Trejo, D., Little, D.,
Viyanant, Ogall, M., and Esfellar, M., (2001). Recycled asphalt pavement and crushed concrete backfill: state-of-the-art review and material characterization. (FHWA/TX-0/4177-6). Austin, TX: Center for Transportation Research.
69
Rathje, E.M., Rauch, A.F., Folliard, K.J., Trejo, D., Little, D., Viyanant, Ogall, M., and Esfellar, M., (2002). Recycled asphalt pavement and crushed concrete backfill: results from initial durability and geotechnical tests. (FHWA/TX-02/4177-2). Austin, TX: Center for Transportation Research.
Rathje, E.M., Rauch, A.F., Trejo, D., Folliard, K.J., Viyanant, C.,
Esfellar, M., Jain, A., and Ogall, M. (2006). Evaluation of crushed concrete and recycled asphalt pavement as backfill for mechanically stabilized earth walls (FHWA/TX-06/0-4177-3). Austin, TX: Center for Transportation Research.

70
APPENDIX A
MATERIAL PROPERTIES DATA SHEETS
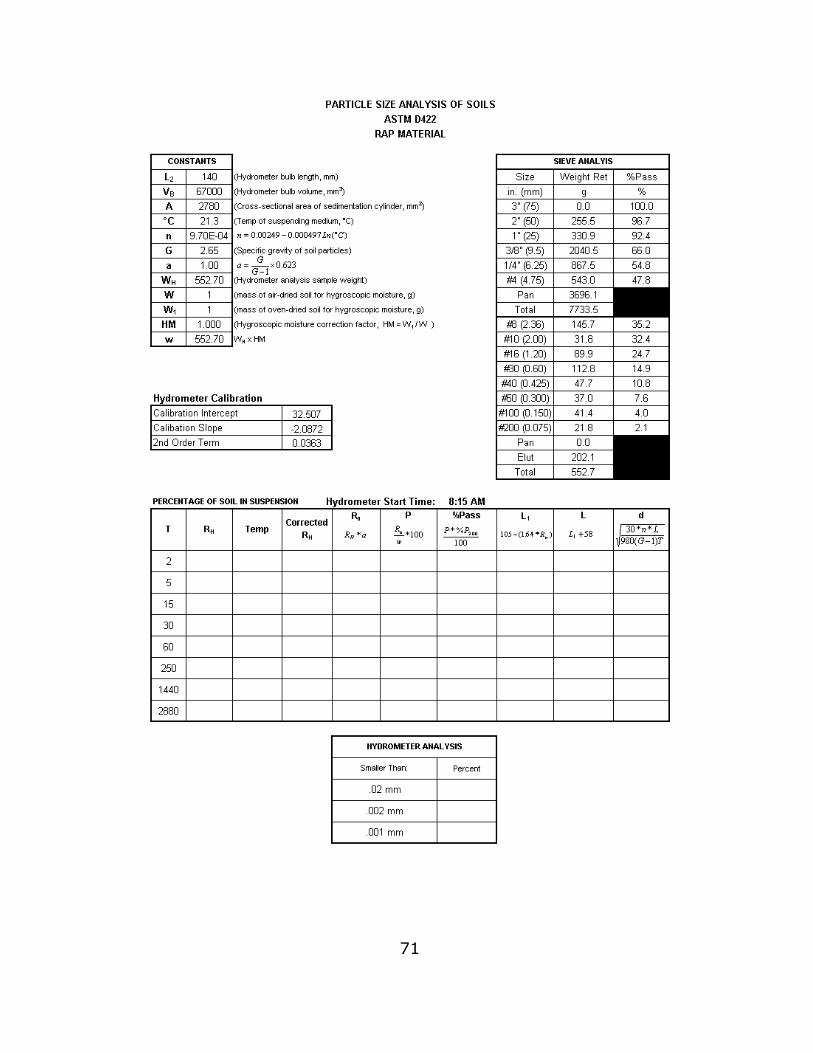
71
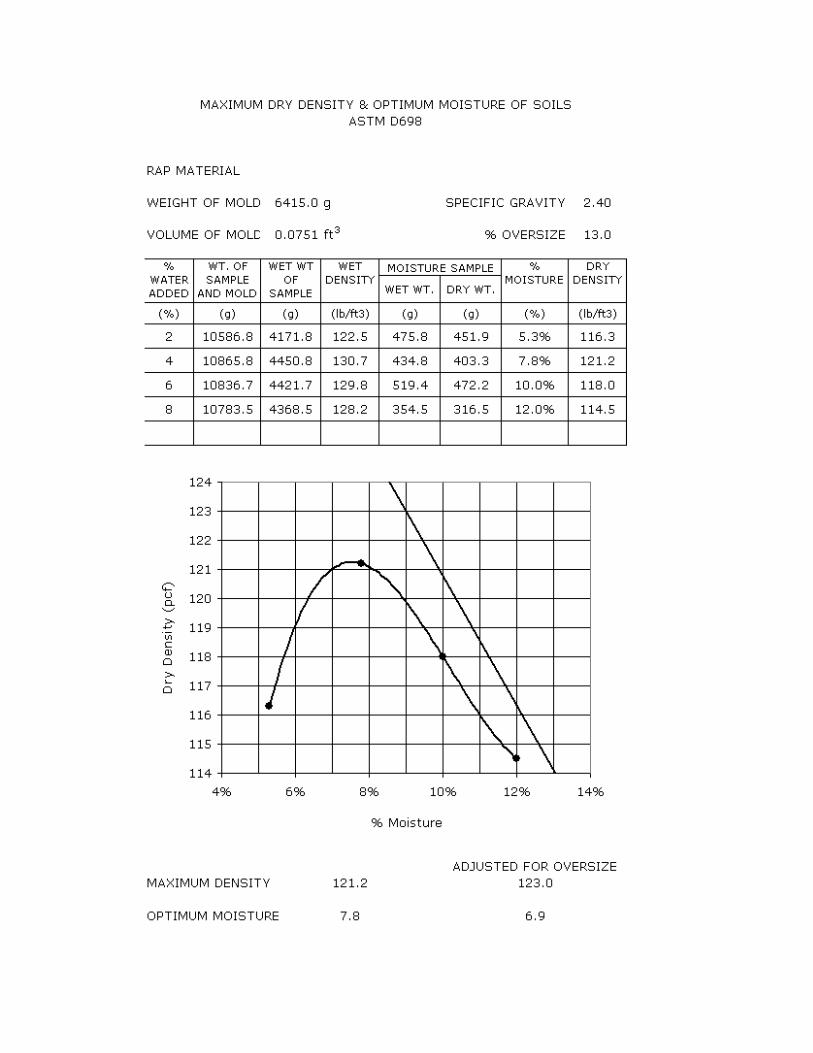
72
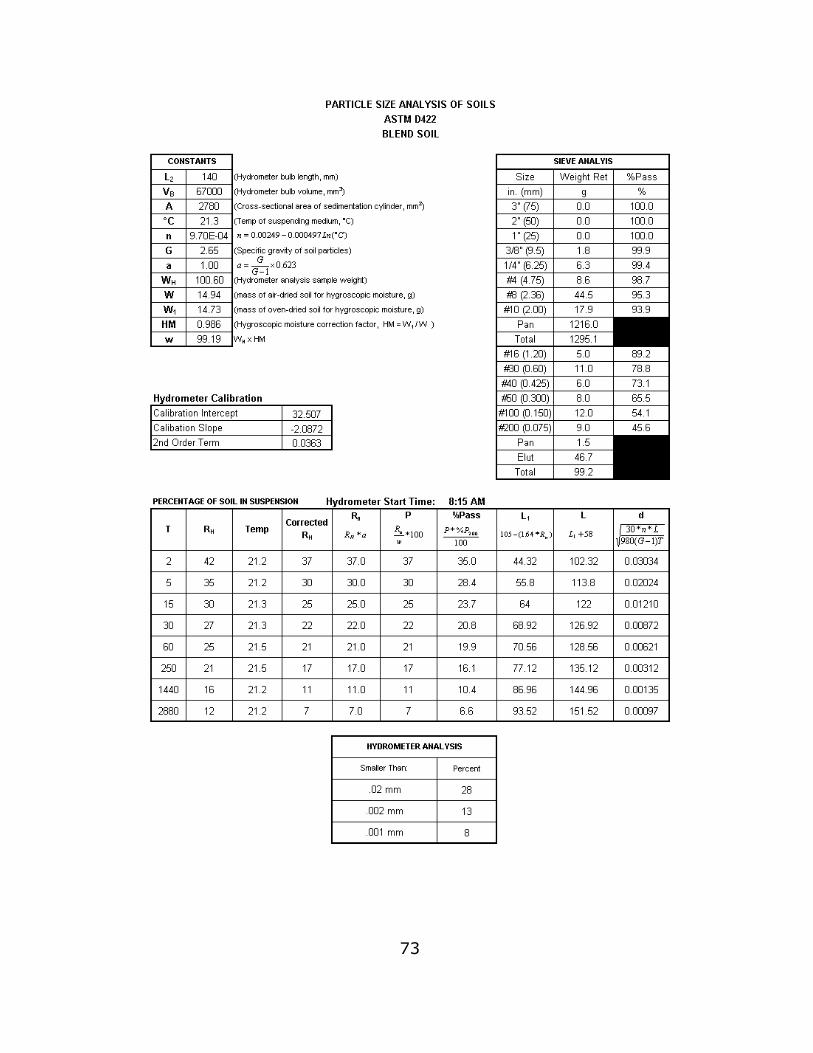
73
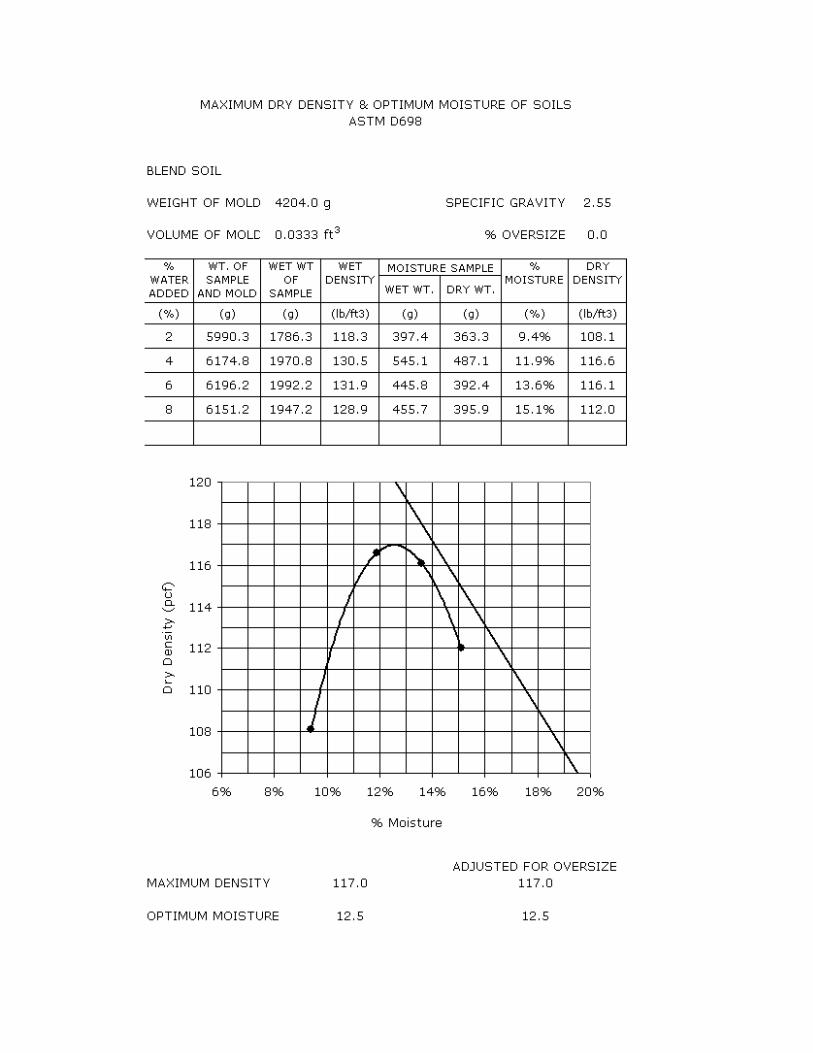
74
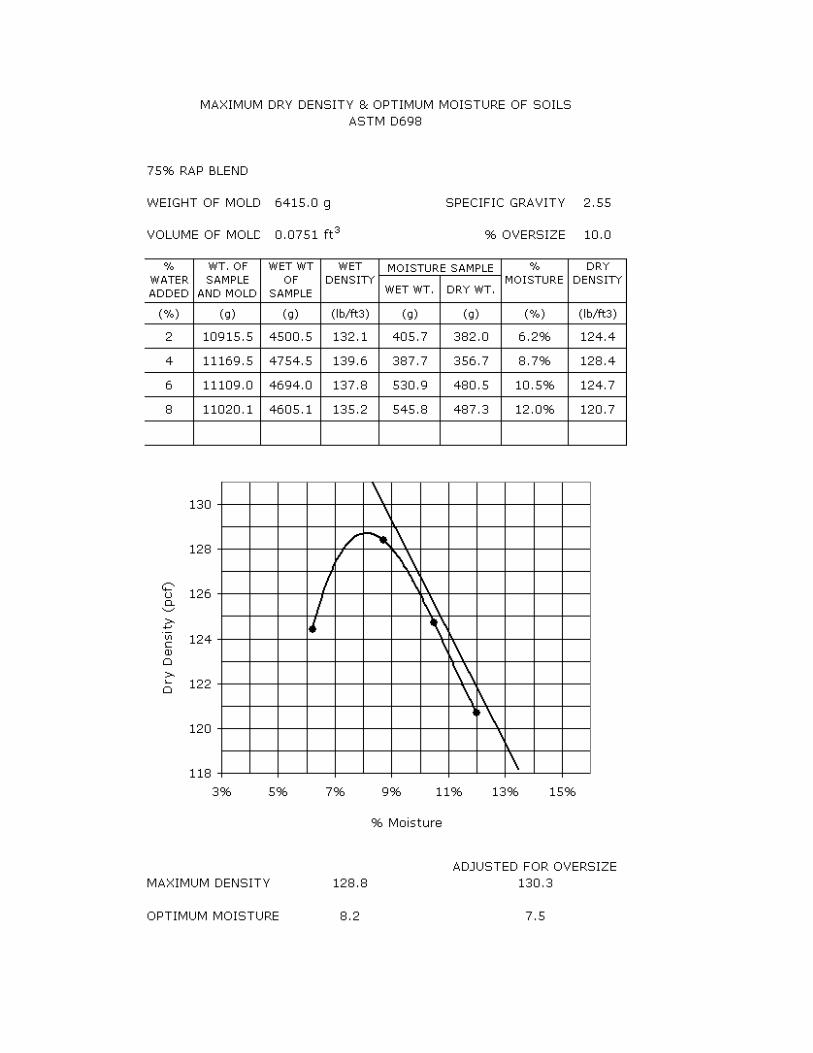
75
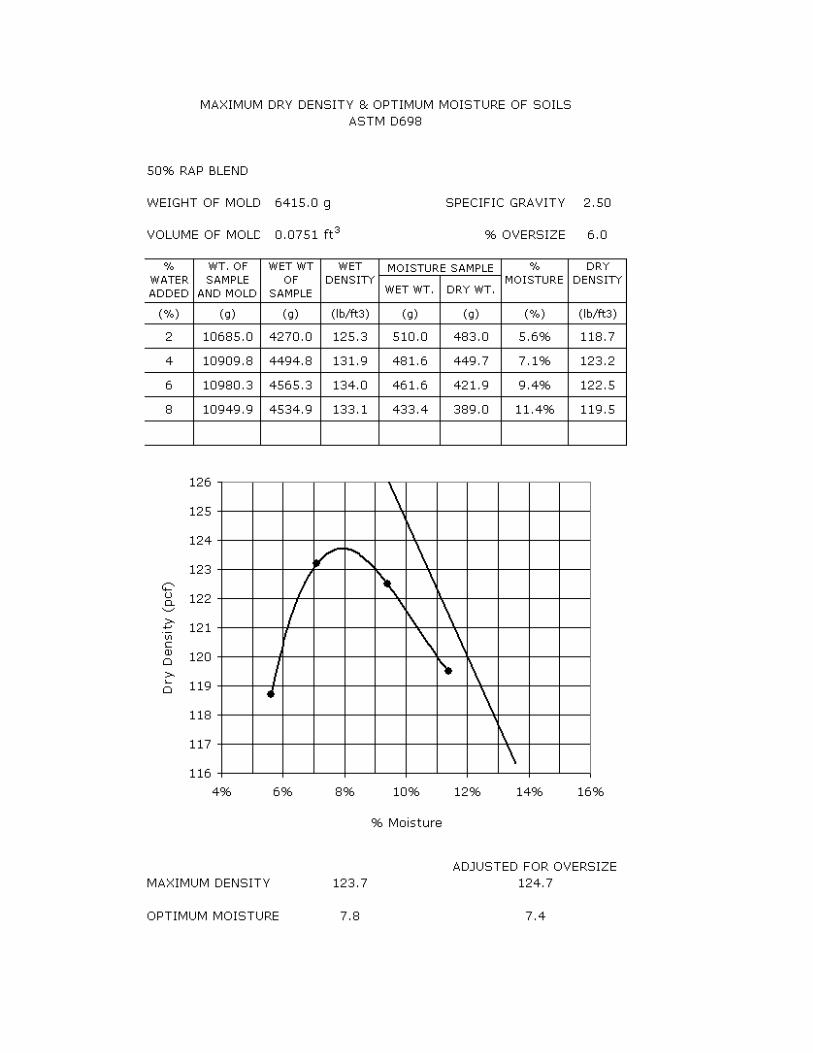
76
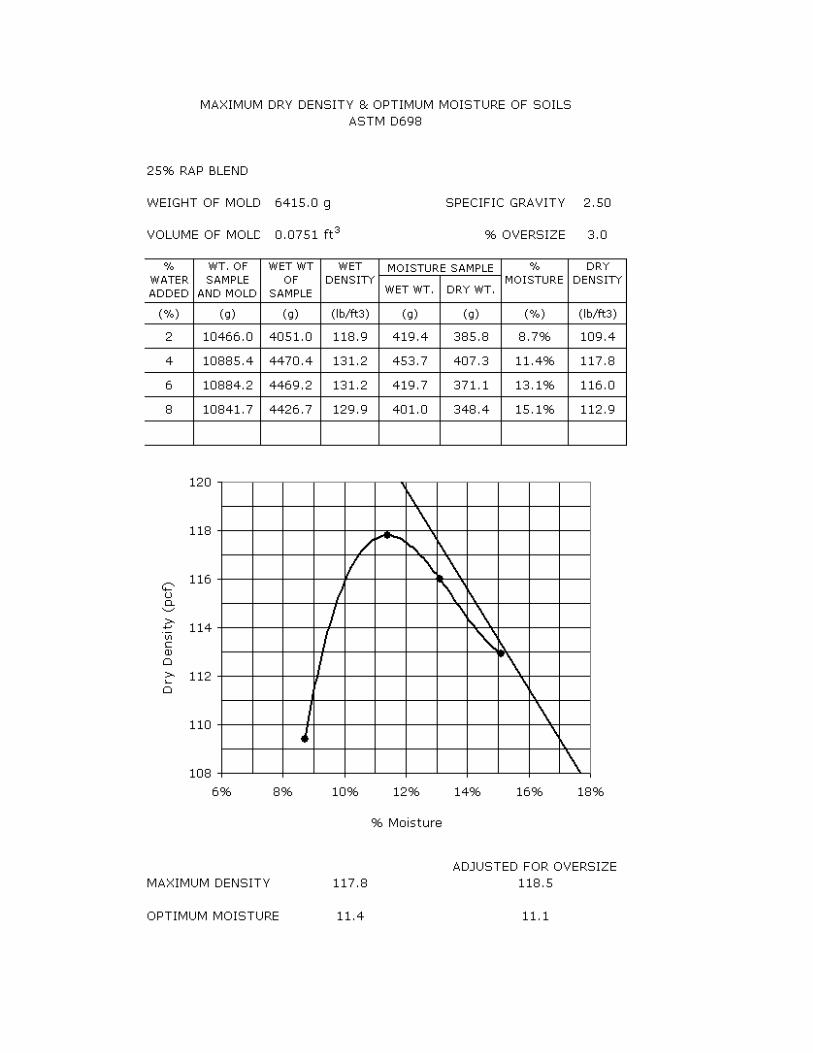
77

78
APPENDIX B
COMPRESSIBILITY TEST DATA
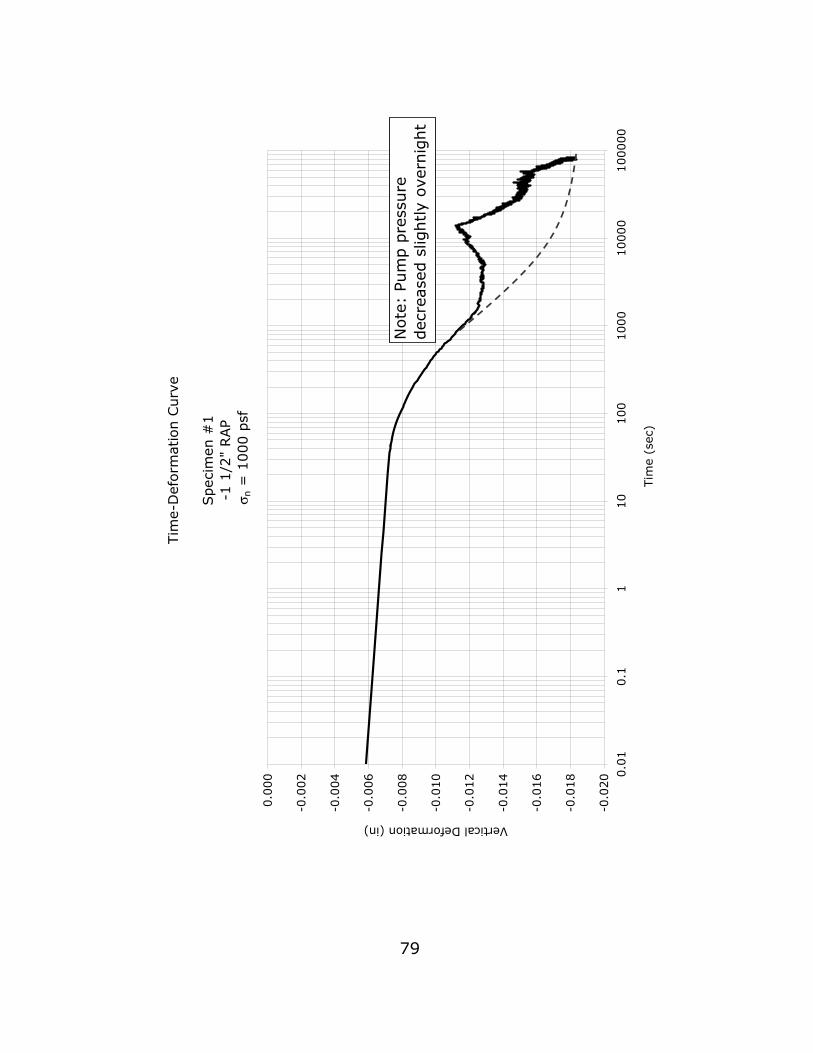
79
Tim
e-D
eform
atio
n C
urv
e
Speci
men
#1
-1 1
/2"
RAP
σn =
1000 p
sf
-0.0
20
-0.0
18
-0.0
16
-0.0
14
-0.0
12
-0.0
10
-0.0
08
-0.0
06
-0.0
04
-0.0
02
0.0
00 0
.01
0.1
110
100
1000
10000
100000
Tim
e (s
ec)
Vertical Deformation (in)
Note
: Pum
p p
ress
ure
dec
reas
ed s
lightly
ove
rnig
ht
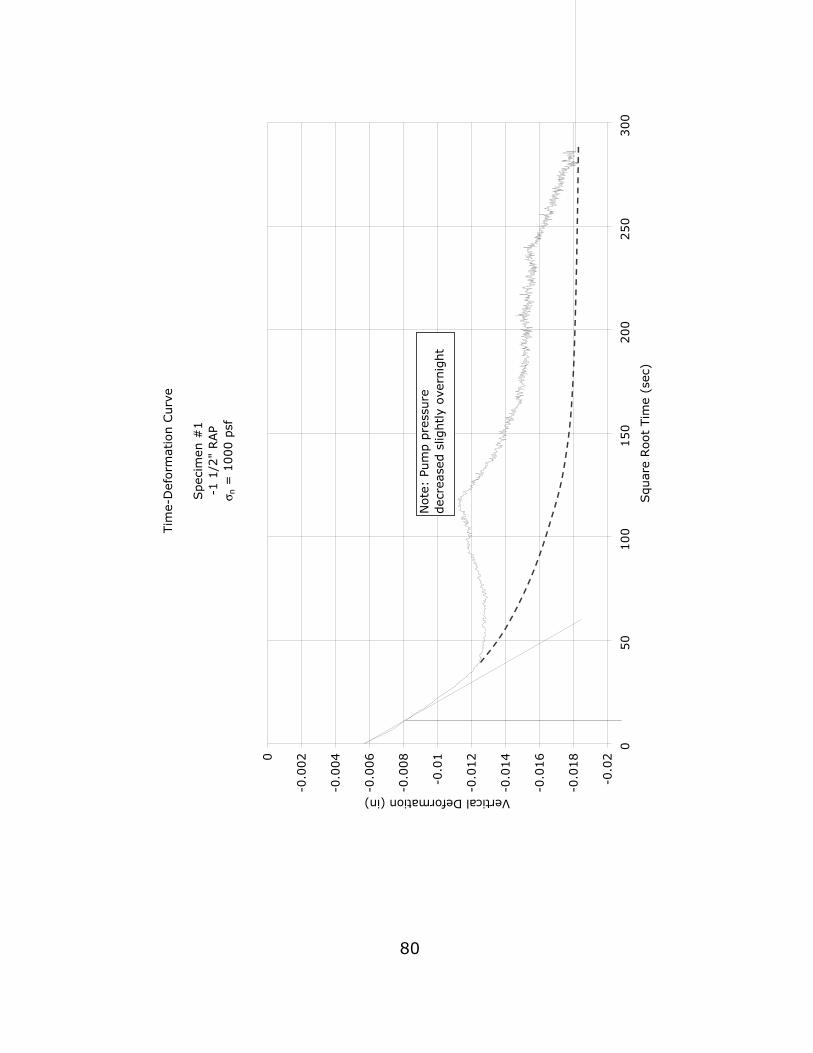
Tim
e-D
eform
atio
n C
urv
e
Spec
imen
#1
-1 1
/2"
RAP
σ n =
1000 p
sf
-0.0
2
-0.0
18
-0.0
16
-0.0
14
-0.0
12
-0.0
1
-0.0
08
-0.0
06
-0.0
04
-0.0
020
050
100
150
200
250
300
Squar
e Root
Tim
e (s
ec)
Vertical Deformation (in)
Note
: Pu
mp p
ress
ure
dec
reas
ed s
lightly
ove
rnig
ht
80
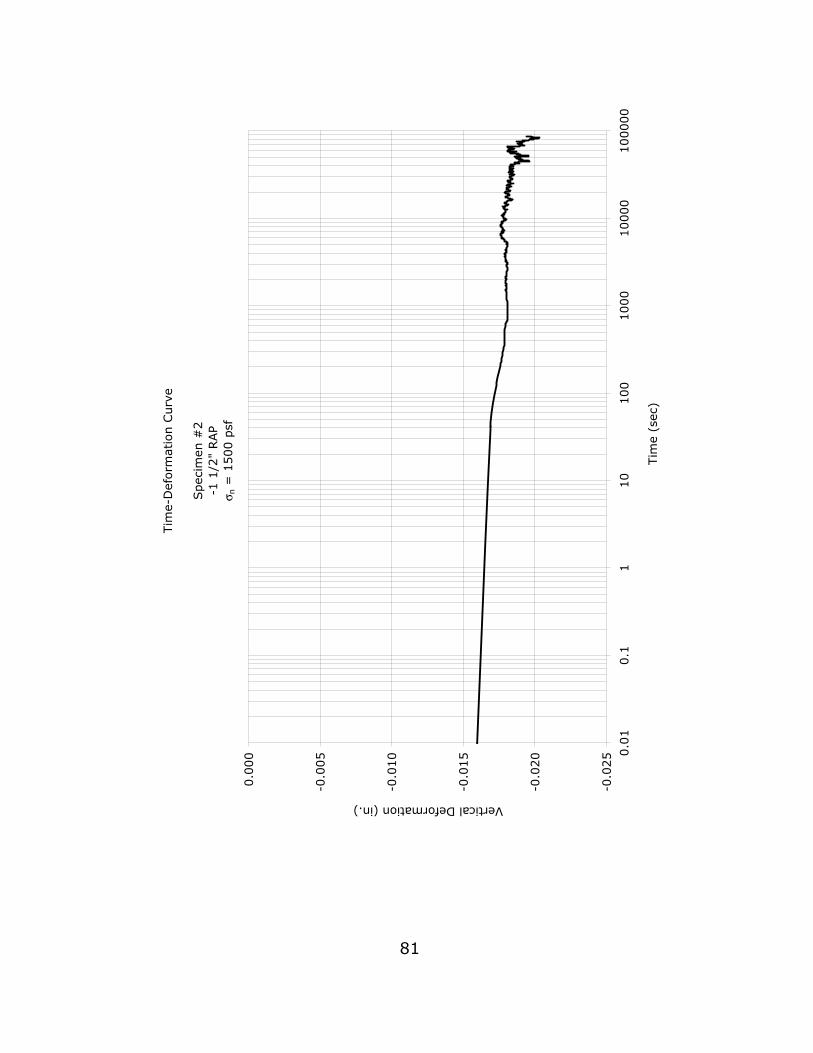
Tim
e-D
eform
atio
n C
urv
e
Spec
imen
#2
-1 1
/2"
RAP
σ n =
1500 p
sf
-0.0
25
-0.0
20
-0.0
15
-0.0
10
-0.0
05
0.0
00 0
.01
0.1
110
100
1000
10000
100000
Tim
e (s
ec)
Vertical Deformation (in.)
81
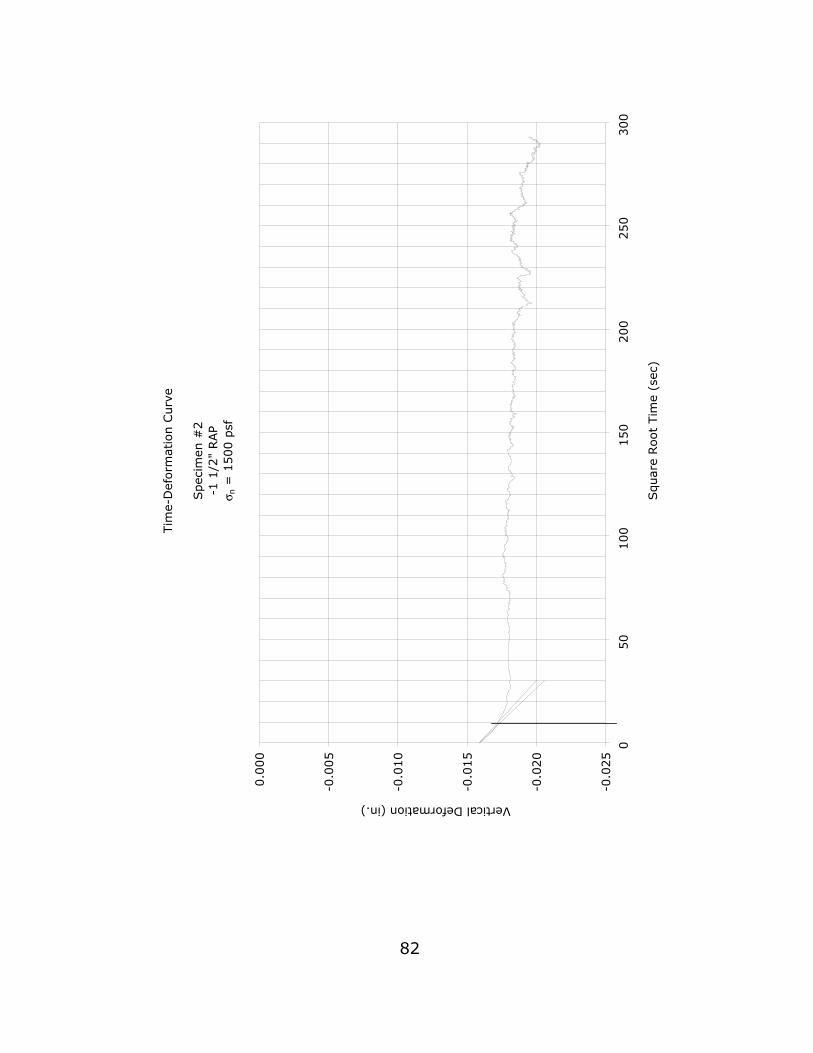
Tim
e-D
eform
atio
n C
urv
e
Spec
imen
#2
-1 1
/2"
RAP
σ n =
1500 p
sf
-0.0
25
-0.0
20
-0.0
15
-0.0
10
-0.0
05
0.0
00
050
100
150
200
250
300
Squar
e Root
Tim
e (s
ec)
Vertical Deformation (in.)
82
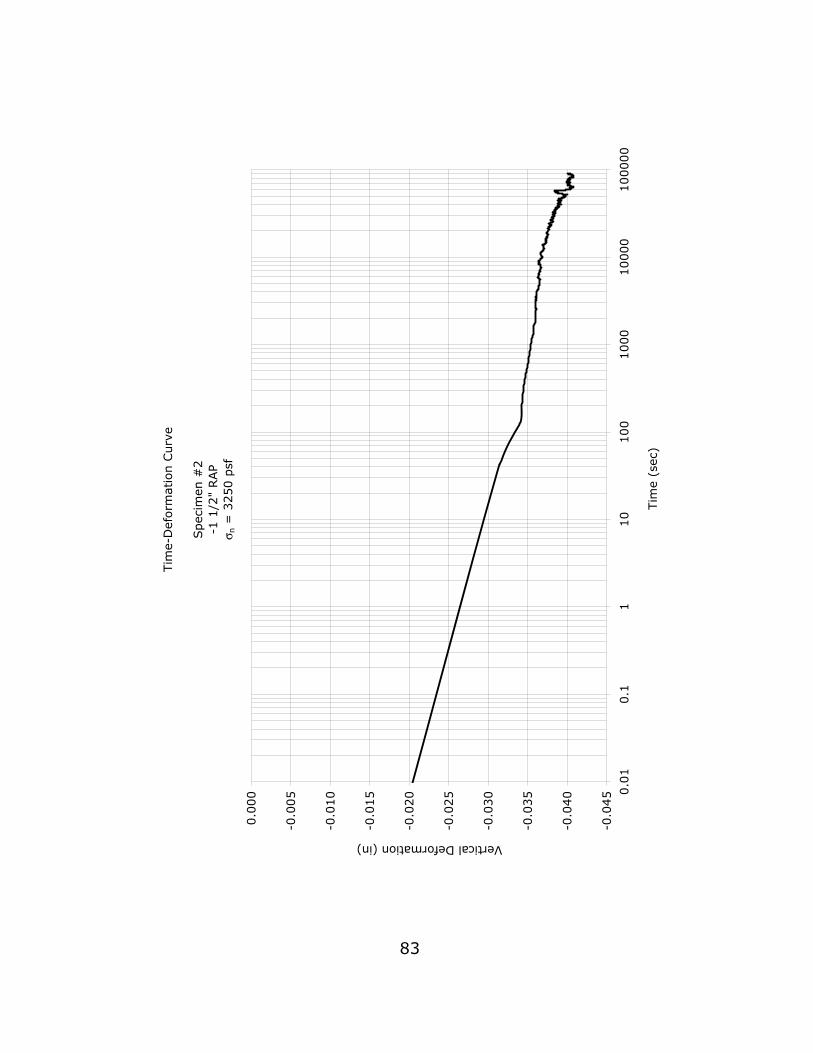
Tim
e-D
eform
atio
n C
urv
e
Spec
imen
#2
-1 1
/2"
RAP
σ n =
3250 p
sf
-0.0
45
-0.0
40
-0.0
35
-0.0
30
-0.0
25
-0.0
20
-0.0
15
-0.0
10
-0.0
05
0.0
00 0
.01
0.1
110
100
1000
10000
100000
Tim
e (s
ec)
Vertical Deformation (in)
83
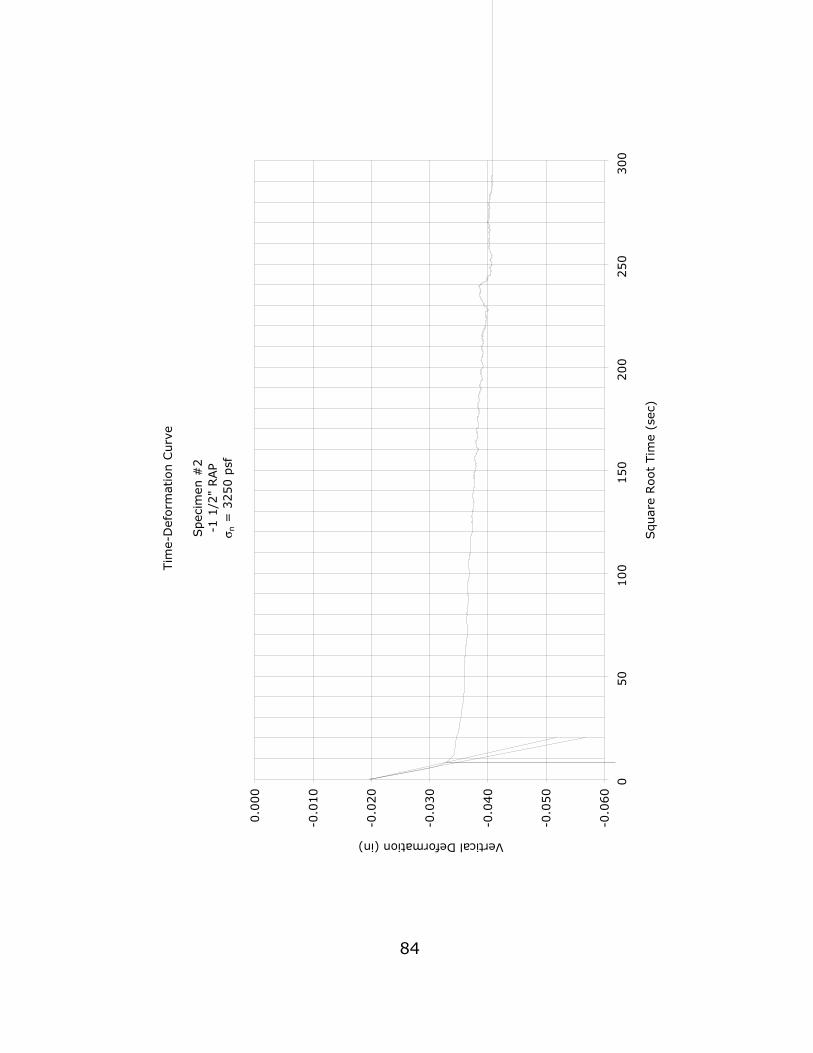
Tim
e-D
eform
atio
n C
urv
e
Spec
imen
#2
-1 1
/2"
RAP
σ n =
3250 p
sf
-0.0
60
-0.0
50
-0.0
40
-0.0
30
-0.0
20
-0.0
10
0.0
00
050
100
150
200
250
300
Squar
e R
oot
Tim
e (
sec)
Vertical Deformation (in)
84
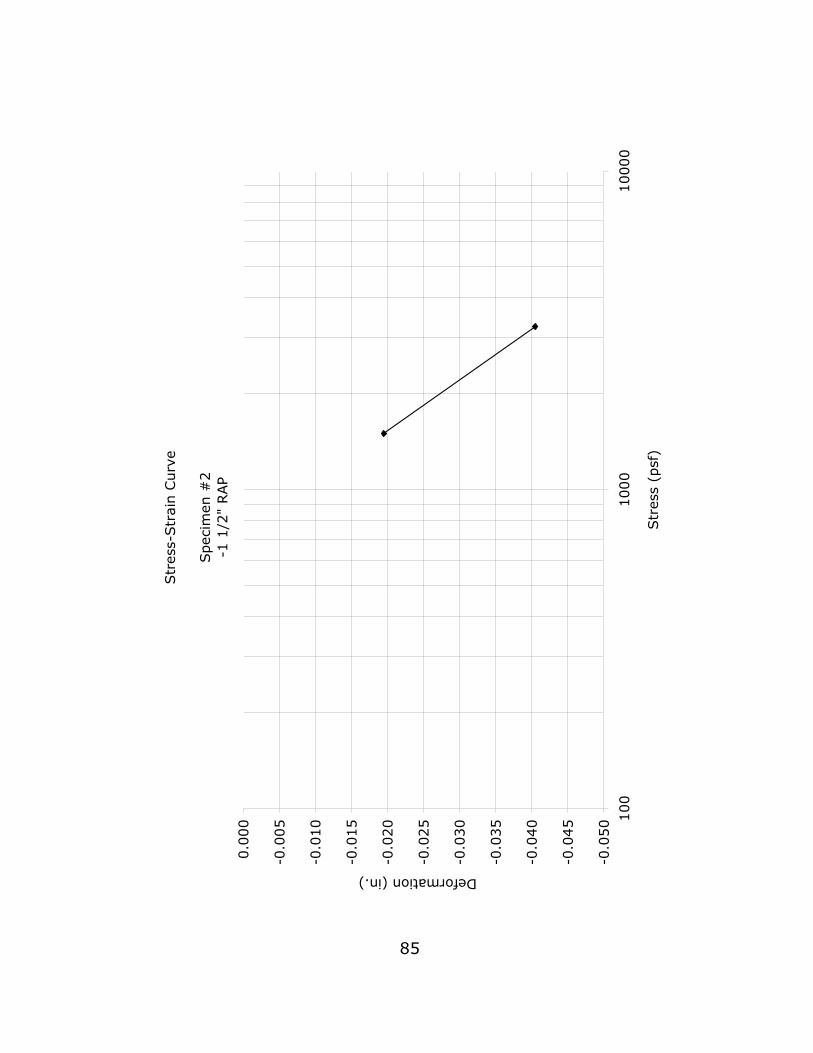
85
Str
ess-
Str
ain
Curv
e
Spec
imen
#2
-1 1
/2"
RAP
-0.0
50
-0.0
45
-0.0
40
-0.0
35
-0.0
30
-0.0
25
-0.0
20
-0.0
15
-0.0
10
-0.0
05
0.0
00 1
00
1000
10000
Str
ess
(psf
)
Deformation (in.)
86
Tim
e-D
eform
atio
n C
urv
e
Spec
imen
#3
-1 1
/2"
RAP
σ n =
1108 p
sf
-0.2
00
-0.1
80
-0.1
60
-0.1
40
-0.1
20
-0.1
00
-0.0
80
-0.0
60
-0.0
40
-0.0
20
0.0
00 0
.01
0.1
110
100
1000
10000
100000
Tim
e (s
ec)
Vertical Deformation (in)
Tim
e-D
eform
atio
n C
urv
e
Spec
imen
#3
-1 1
/2"
RAP
σ n =
1180 p
sf
-0.2
5
-0.2
0
-0.1
5
-0.1
0
-0.0
5
0.0
0 0.0
050.0
0100.0
0150.0
0200.0
0250.0
0300.0
0
Squar
e Root
Tim
e (s
ec)
Vertical Deformation (in.)
87
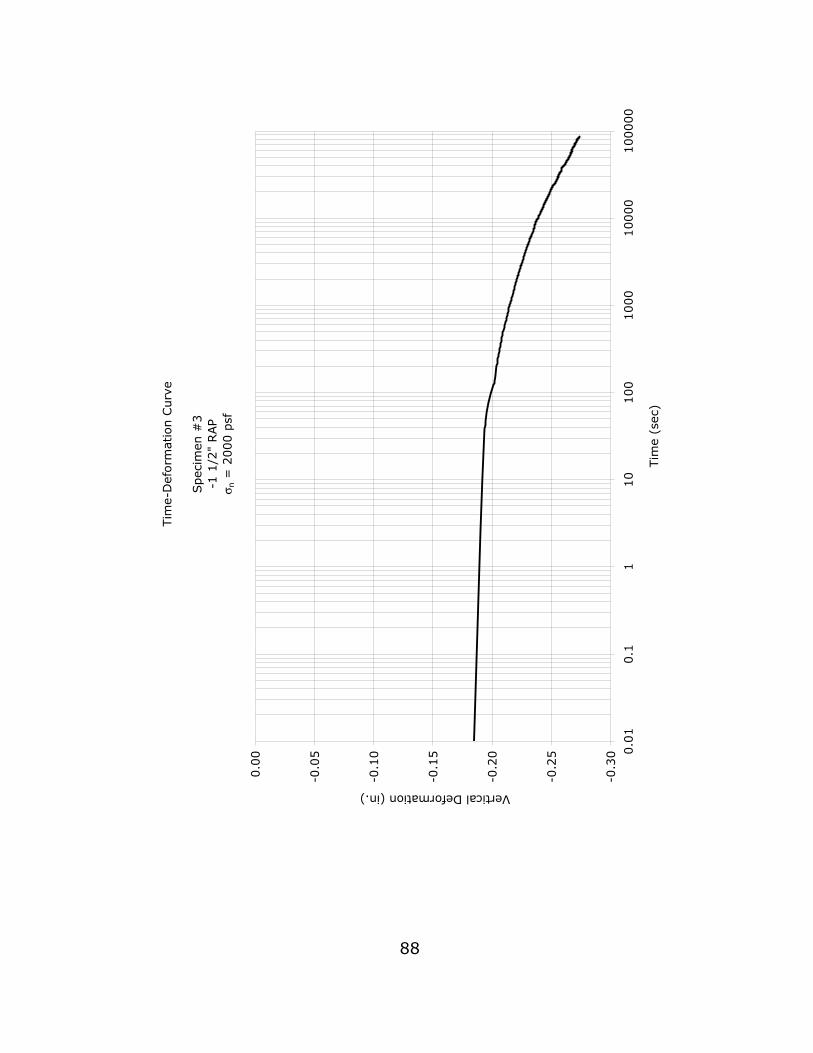
Tim
e-D
eform
atio
n C
urv
e
Spec
imen
#3
-1 1
/2"
RAP
σ n =
2000 p
sf
-0.3
0
-0.2
5
-0.2
0
-0.1
5
-0.1
0
-0.0
5
0.0
0 0.0
10.1
110
100
1000
10000
100000
Tim
e (s
ec)
Vertical Deformation (in.)
88
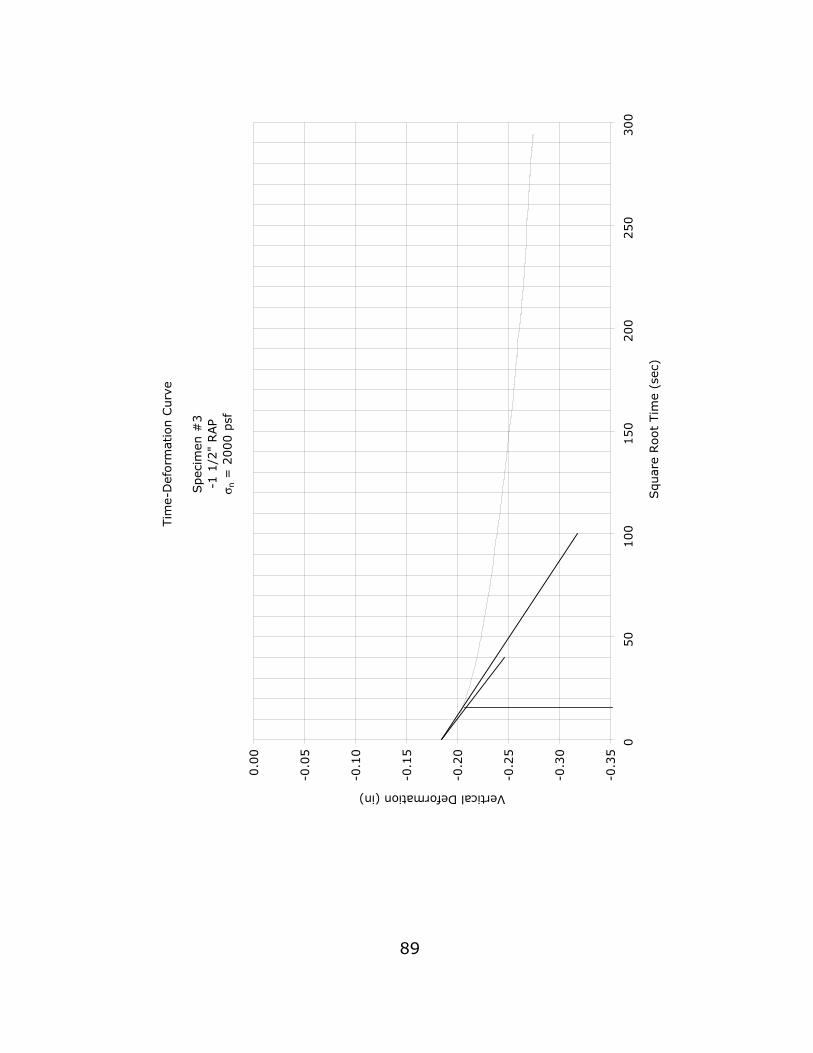
Tim
e-D
eform
atio
n C
urv
e
Spec
imen
#3
-1 1
/2"
RAP
σ n =
2000 p
sf
-0.3
5
-0.3
0
-0.2
5
-0.2
0
-0.1
5
-0.1
0
-0.0
5
0.0
0
050
100
150
200
250
300
Squar
e Root
Tim
e (s
ec)
Vertical Deformation (in)
89
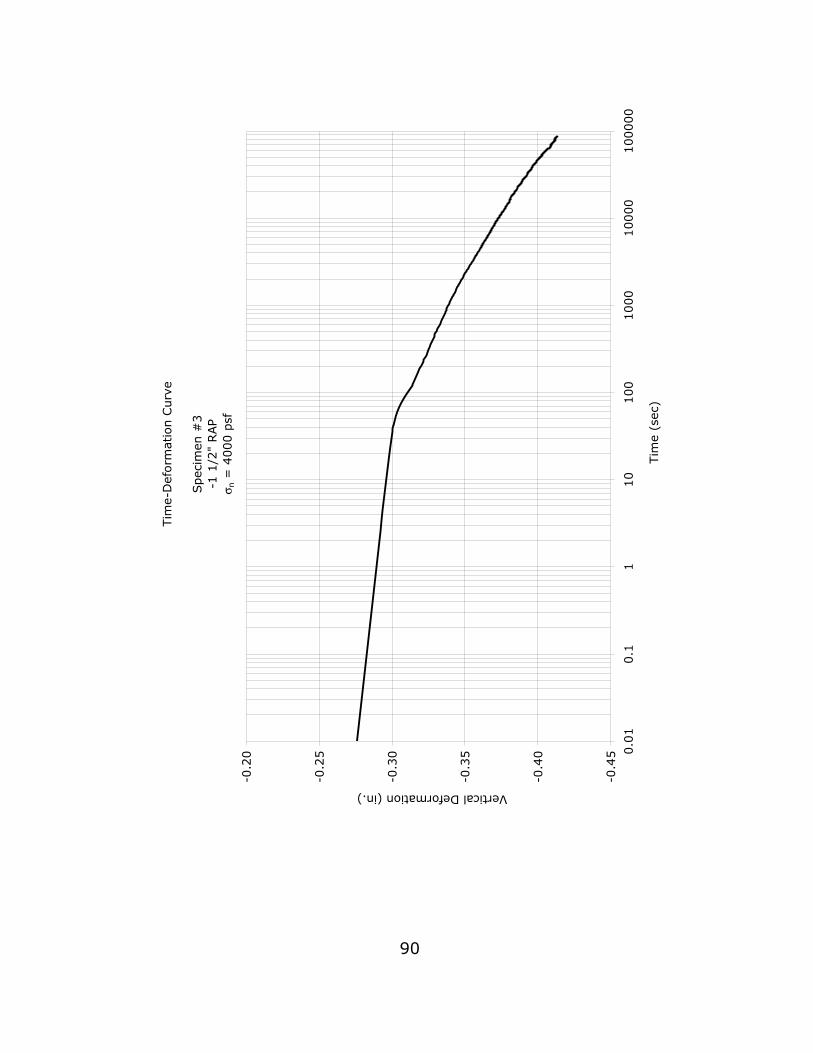
Tim
e-D
eform
atio
n C
urv
e
Spec
imen
#3
-1 1
/2"
RAP
σ n =
4000 p
sf
-0.4
5
-0.4
0
-0.3
5
-0.3
0
-0.2
5
-0.2
0 0.0
10.1
110
100
1000
10000
100000
Tim
e (s
ec)
Vertical Deformation (in.)
90
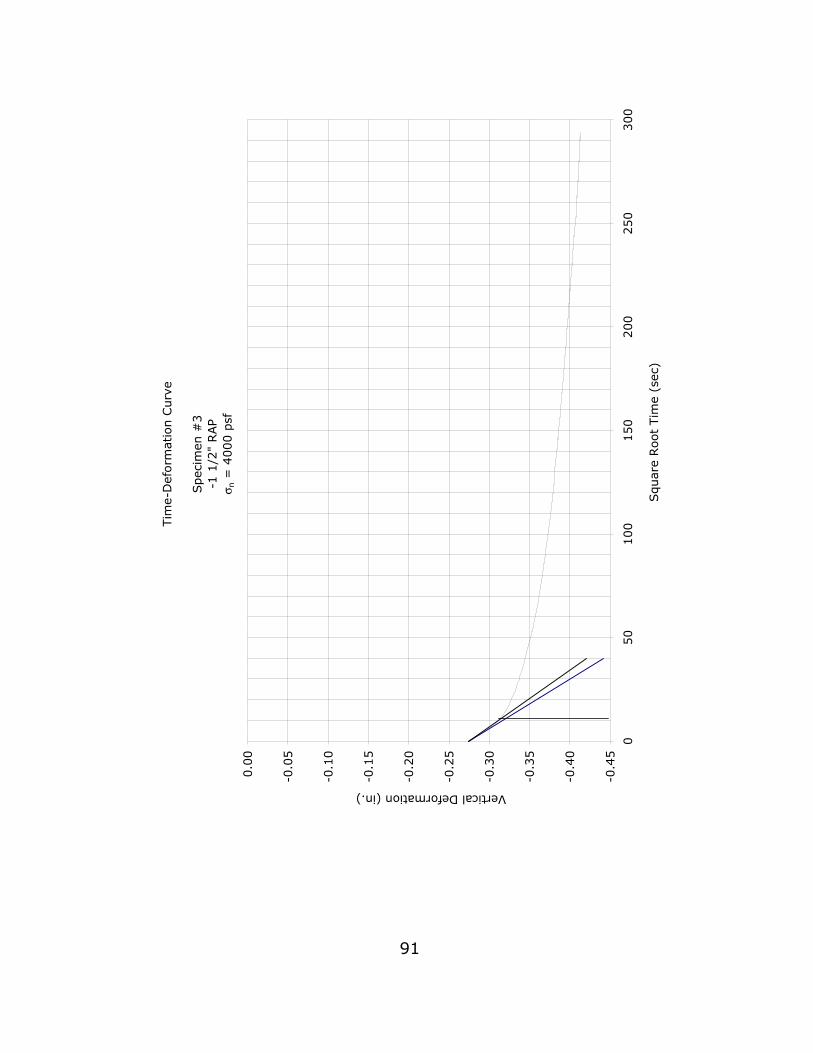
Tim
e-D
eform
atio
n C
urv
e
Spec
imen
#3
-1 1
/2"
RAP
σ n =
4000 p
sf
-0.4
5
-0.4
0
-0.3
5
-0.3
0
-0.2
5
-0.2
0
-0.1
5
-0.1
0
-0.0
5
0.0
0
050
100
150
200
250
300
Squar
e Root
Tim
e (s
ec)
Vertical Deformation (in.)
91
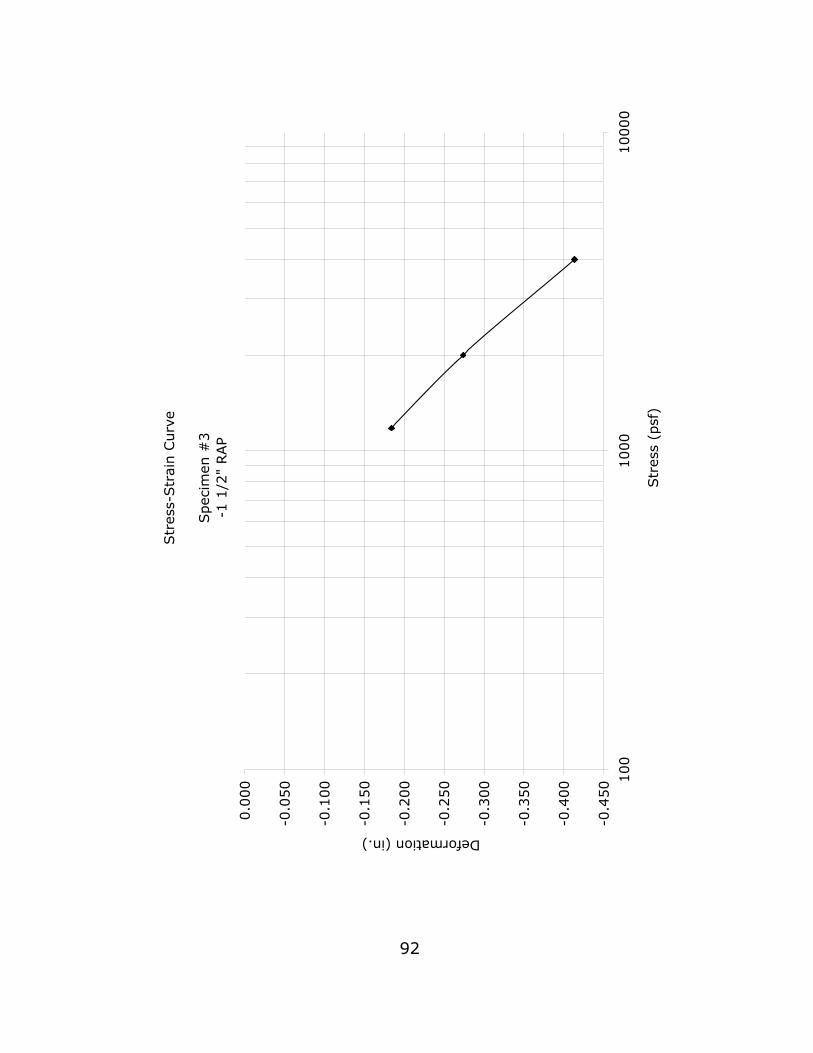
Str
ess-
Str
ain C
urv
e
Spec
imen
#3
-1 1
/2"
RAP
-0.4
50
-0.4
00
-0.3
50
-0.3
00
-0.2
50
-0.2
00
-0.1
50
-0.1
00
-0.0
50
0.0
00 1
00
1000
10000
Str
ess
(psf
)
Deformation (in.)
92
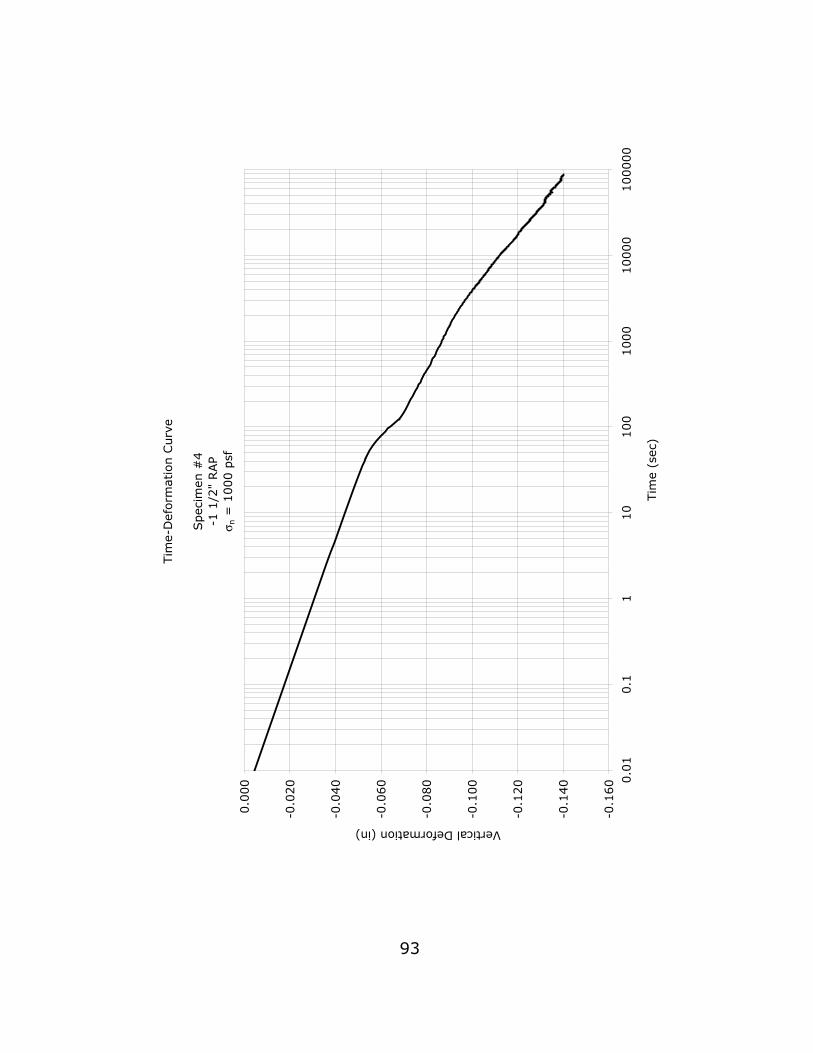
93
Tim
e-D
efo
rmation C
urv
e
Spec
imen
#4
-1 1
/2"
RAP
σ n =
1000 p
sf
-0.1
60
-0.1
40
-0.1
20
-0.1
00
-0.0
80
-0.0
60
-0.0
40
-0.0
20
0.0
00 0
.01
0.1
110
100
1000
10000
100000
Tim
e (s
ec)
Vertical Deformation (in)
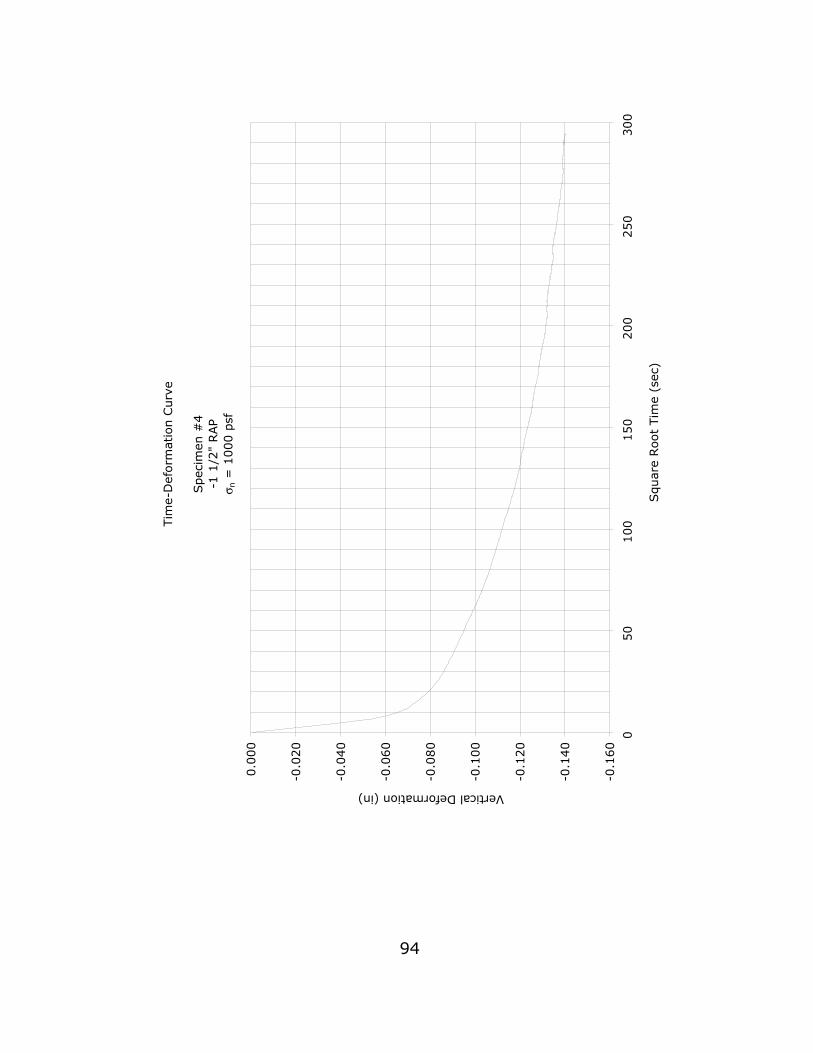
Tim
e-D
eform
atio
n C
urv
e
Spec
imen
#4
-1 1
/2"
RAP
σ n =
1000 p
sf
-0.1
60
-0.1
40
-0.1
20
-0.1
00
-0.0
80
-0.0
60
-0.0
40
-0.0
20
0.0
00
050
100
150
200
250
300
Squar
e Root
Tim
e (s
ec)
Vertical Deformation (in)
94
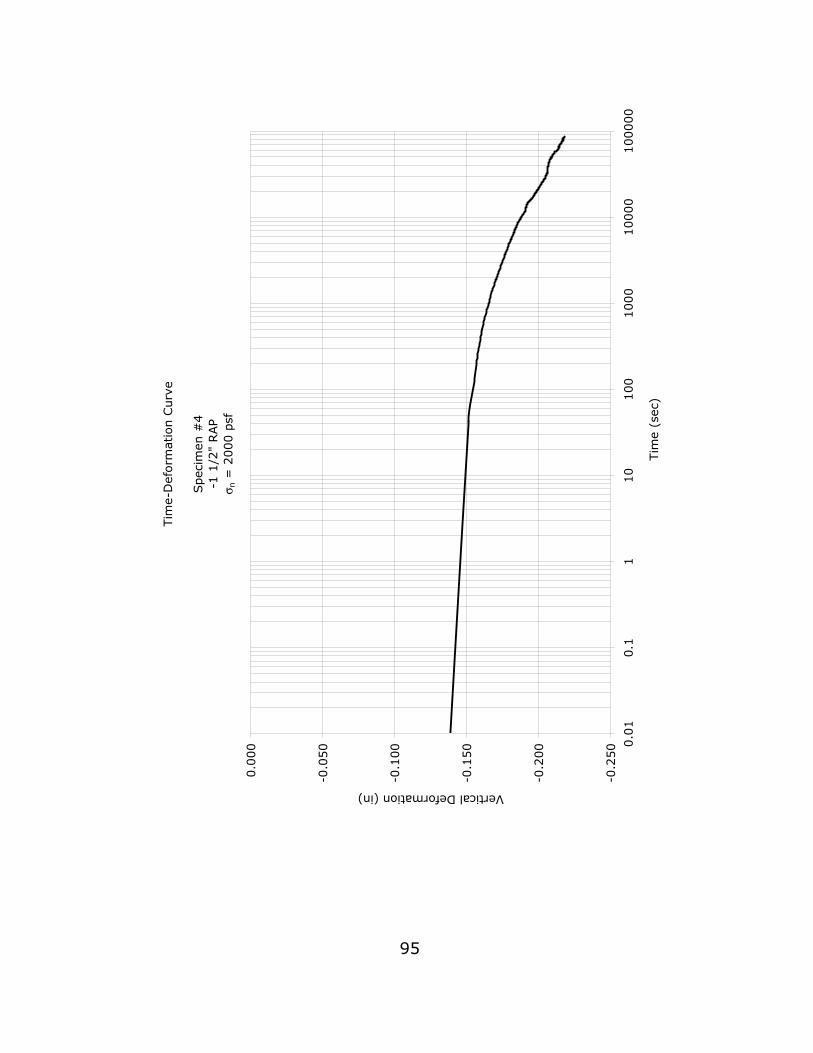
Tim
e-D
eform
atio
n C
urv
e
Spec
imen
#4
-1 1
/2"
RAP
σ n =
2000 p
sf
-0.2
50
-0.2
00
-0.1
50
-0.1
00
-0.0
50
0.0
00 0
.01
0.1
110
100
1000
10000
100000
Tim
e (s
ec)
Vertical Deformation (in)
95
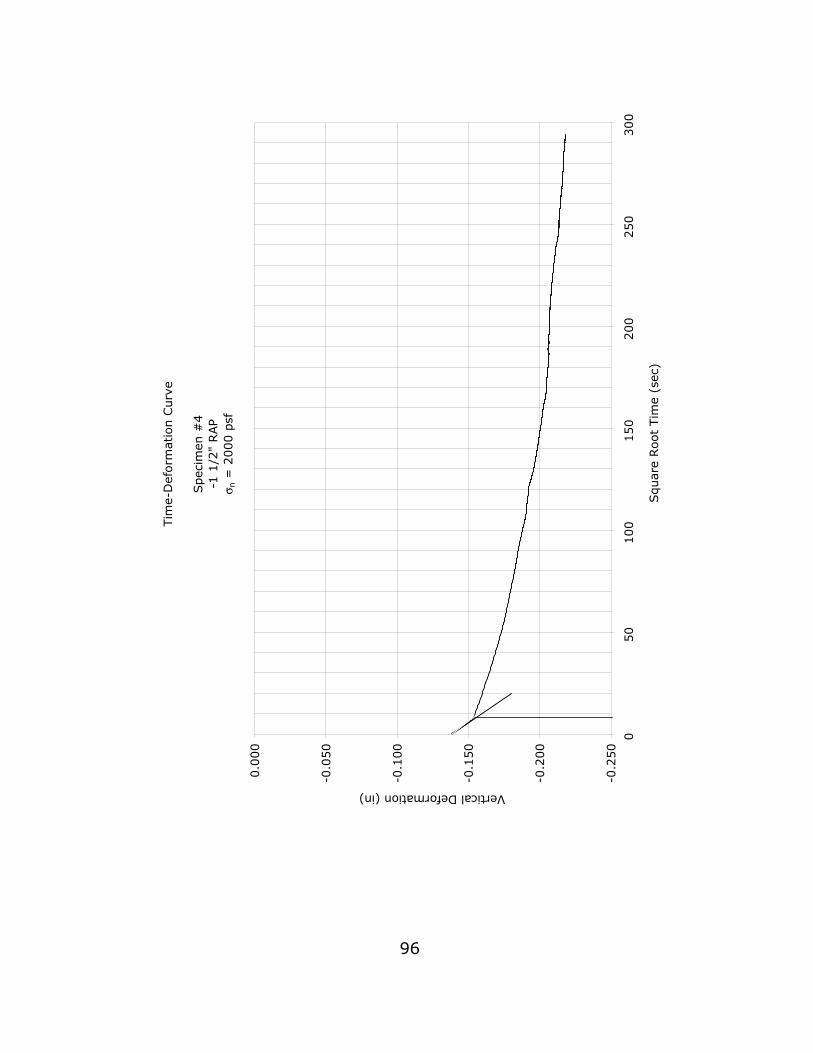
Tim
e-D
eform
atio
n C
urv
e
Spec
imen
#4
-1 1
/2"
RAP
σ n =
2000 p
sf
-0.2
50
-0.2
00
-0.1
50
-0.1
00
-0.0
50
0.0
00
050
100
150
200
250
300
Squar
e Root
Tim
e (s
ec)
Vertical Deformation (in)
96
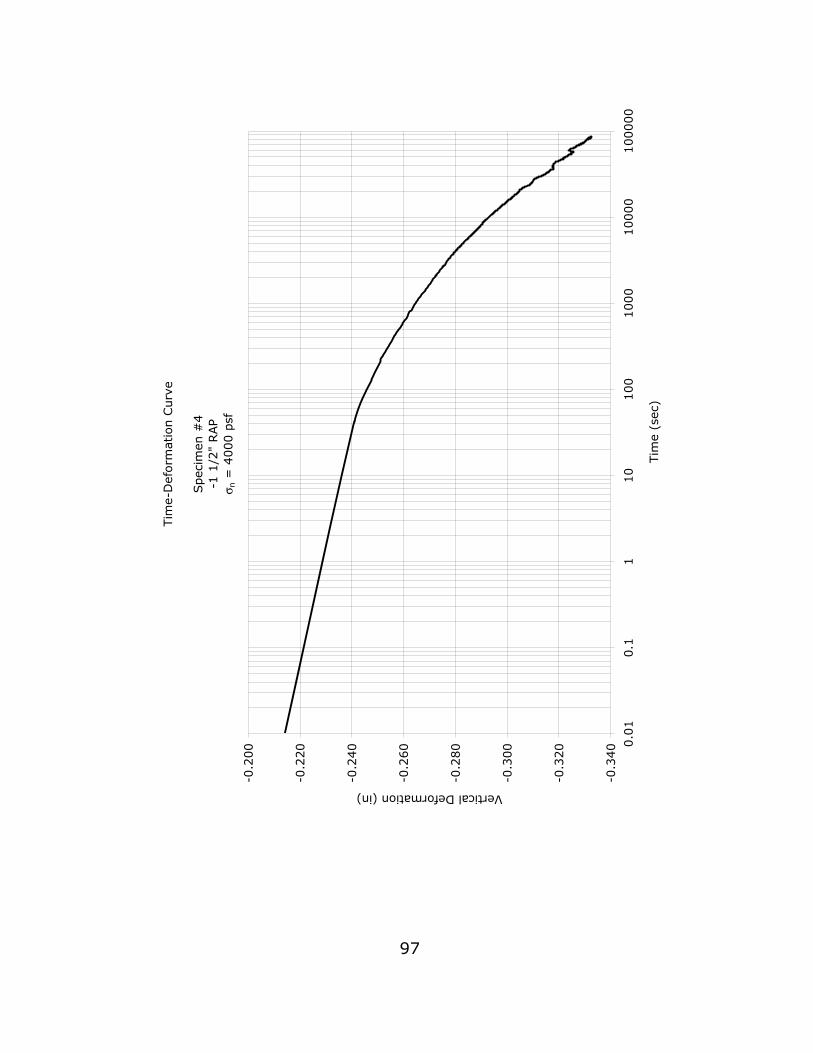
Tim
e-D
eform
atio
n C
urv
e
Spec
imen
#4
-1 1
/2"
RAP
σ n =
4000 p
sf
-0.3
40
-0.3
20
-0.3
00
-0.2
80
-0.2
60
-0.2
40
-0.2
20
-0.2
00 0
.01
0.1
110
100
1000
10000
100000
Tim
e (s
ec)
Vertical Deformation (in)
97
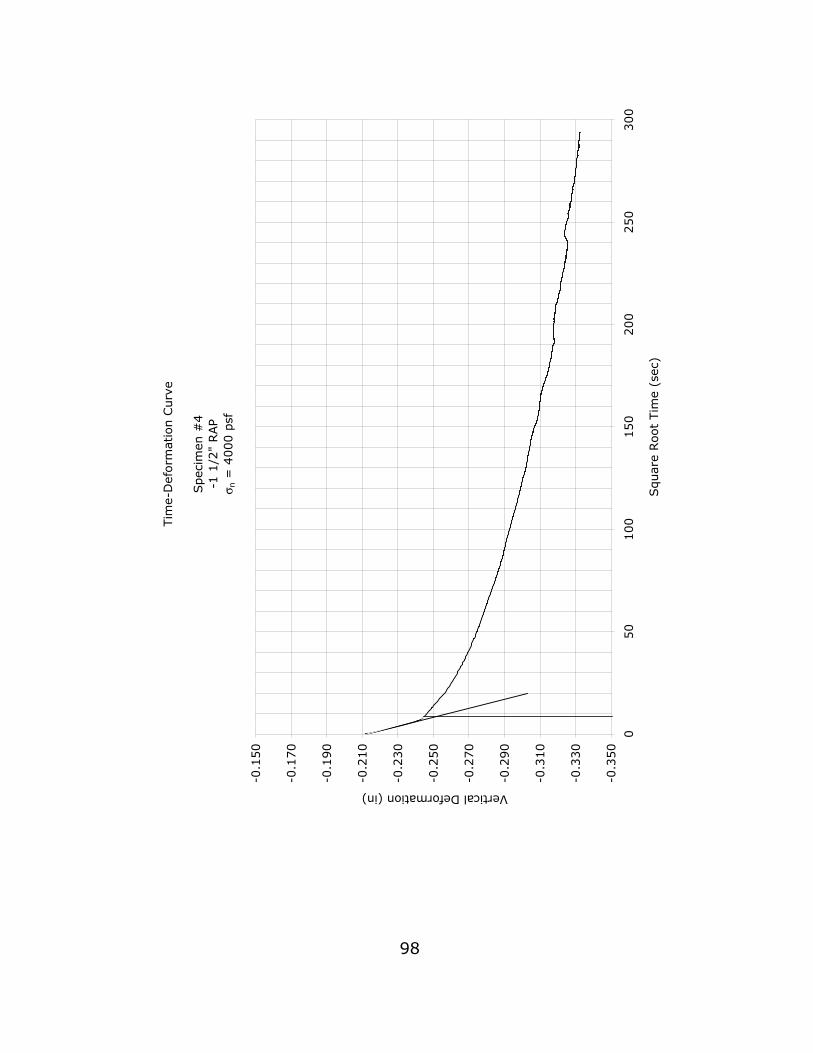
Tim
e-D
eform
atio
n C
urv
e
Spec
imen
#4
-1 1
/2"
RAP
σ n =
4000 p
sf
-0.3
50
-0.3
30
-0.3
10
-0.2
90
-0.2
70
-0.2
50
-0.2
30
-0.2
10
-0.1
90
-0.1
70
-0.1
50
050
100
150
200
250
300
Squar
e Root
Tim
e (s
ec)
Vertical Deformation (in)
98

Str
ess-
Str
ain C
urv
e
Spec
imen
#4
-1 1
/2"
RAP
-0.3
50
-0.3
00
-0.2
50
-0.2
00
-0.1
50
-0.1
00
-0.0
50
0.0
00 1
00
1000
10000
Str
ess
(psf
)
Deformation (in.)
99
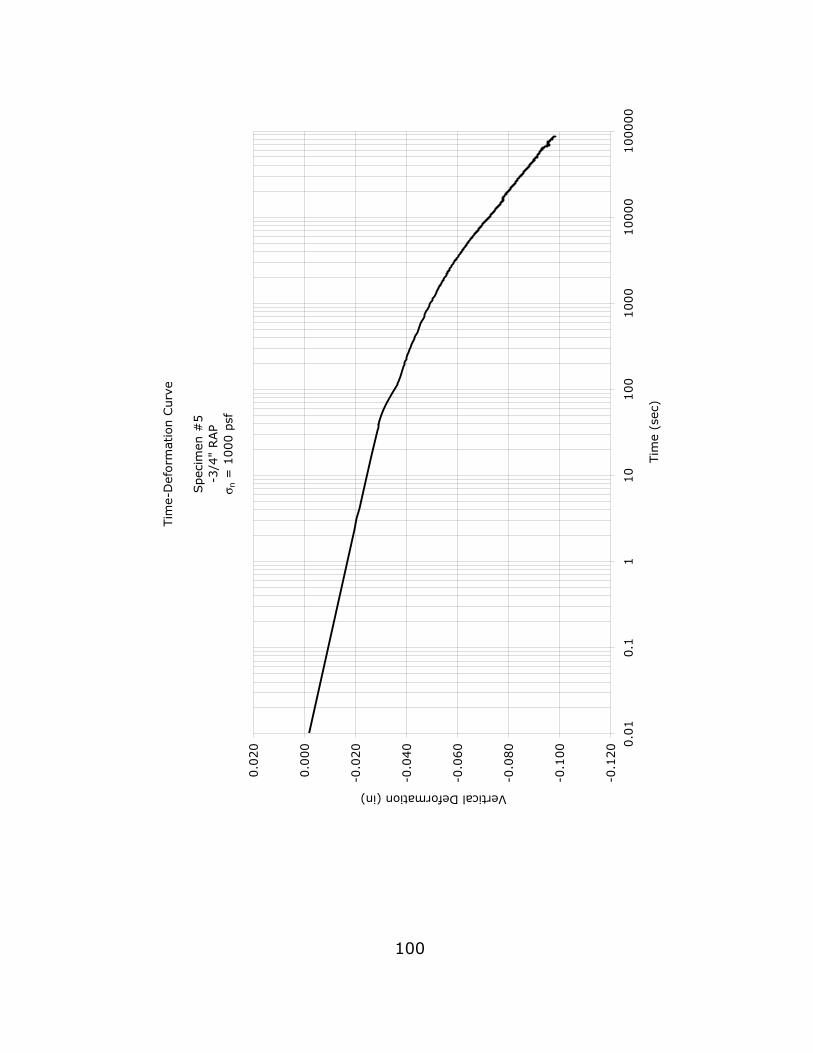
Tim
e-D
eform
atio
n C
urv
e
Spec
imen
#5
-3/4
" RAP
σ n =
1000 p
sf
-0.1
20
-0.1
00
-0.0
80
-0.0
60
-0.0
40
-0.0
20
0.0
00
0.0
20 0
.01
0.1
110
100
1000
10000
100000
Tim
e (s
ec)
Vertical Deformation (in)
100
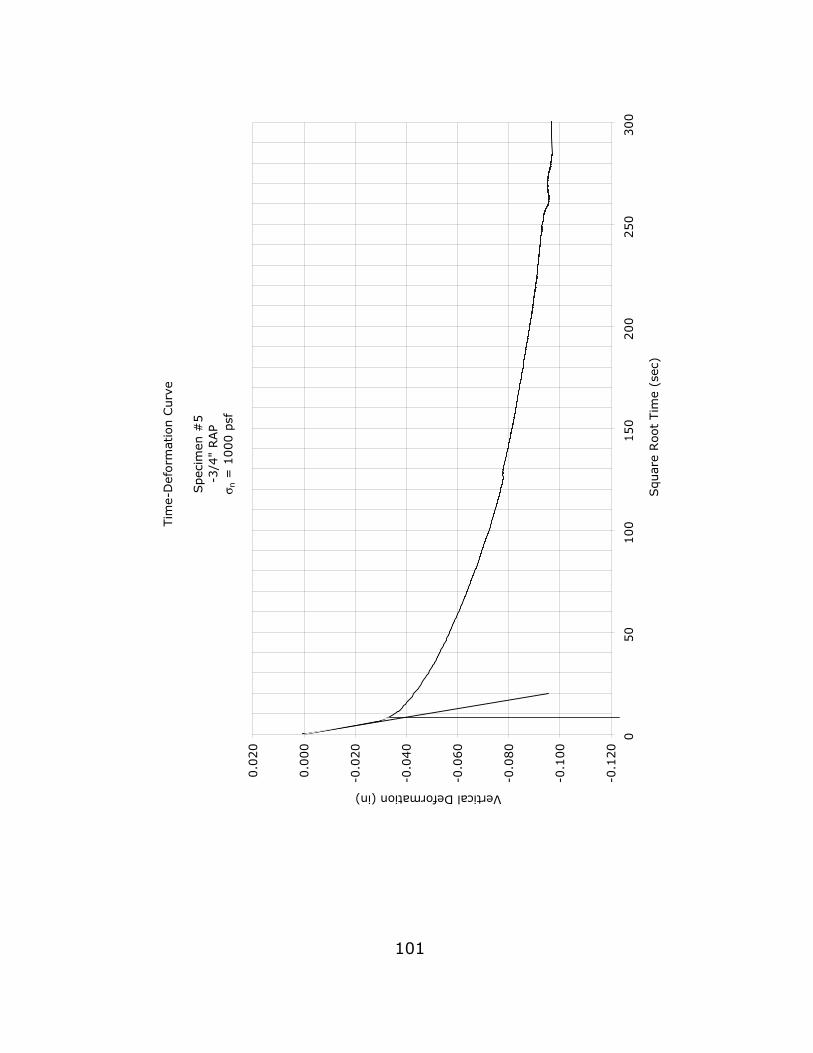
Tim
e-D
eform
atio
n C
urv
e
Spec
imen
#5
-3/4
" RAP
σ n =
1000 p
sf
-0.1
20
-0.1
00
-0.0
80
-0.0
60
-0.0
40
-0.0
20
0.0
00
0.0
20
050
100
150
200
250
300
Squar
e Root
Tim
e (s
ec)
Vertical Deformation (in)
101
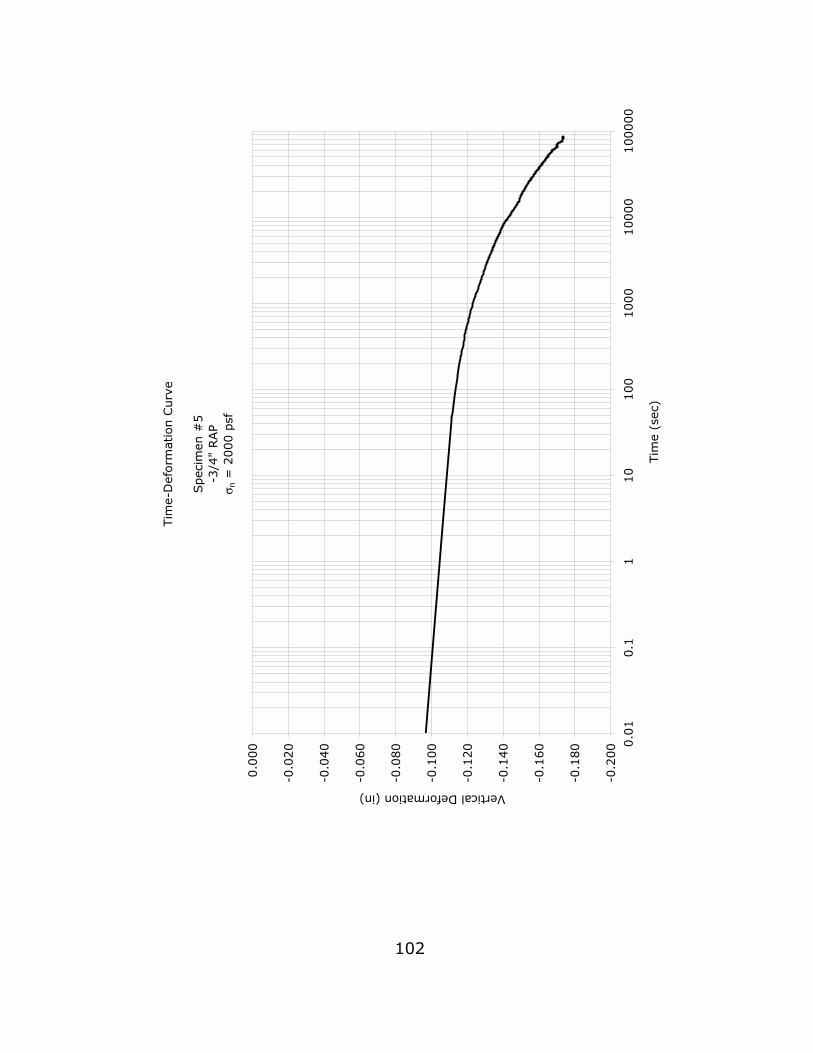
Tim
e-D
eform
atio
n C
urv
e
Spec
imen
#5
-3/4
" RAP
σ n =
2000 p
sf
-0.2
00
-0.1
80
-0.1
60
-0.1
40
-0.1
20
-0.1
00
-0.0
80
-0.0
60
-0.0
40
-0.0
20
0.0
00 0
.01
0.1
110
100
1000
10000
100000
Tim
e (s
ec)
Vertical Deformation (in)
102
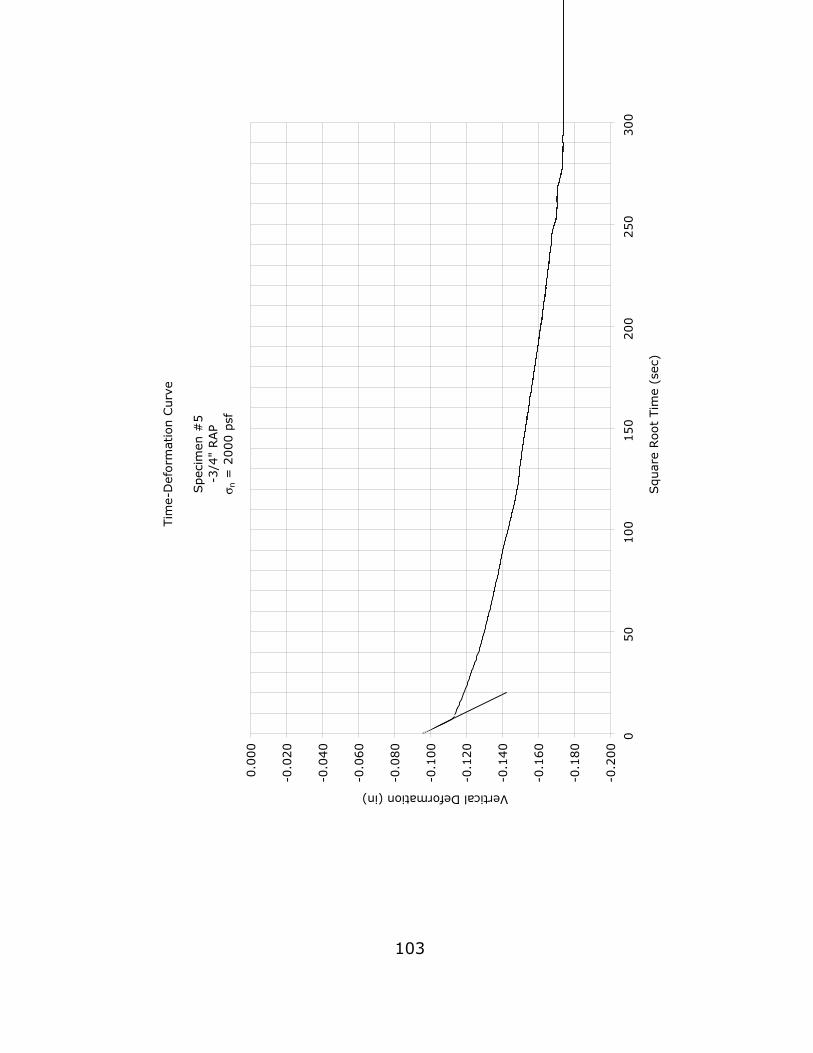
Tim
e-D
eform
atio
n C
urv
e
Spec
imen
#5
-3/4
" RAP
σ n =
2000 p
sf
-0.2
00
-0.1
80
-0.1
60
-0.1
40
-0.1
20
-0.1
00
-0.0
80
-0.0
60
-0.0
40
-0.0
20
0.0
00
050
100
150
200
250
300
Squar
e Root
Tim
e (s
ec)
Vertical Deformation (in)
103
Str
ess-
Str
ain C
urv
e
Spec
imen
#5
-3/4
" RAP
-0.2
00
-0.1
80
-0.1
60
-0.1
40
-0.1
20
-0.1
00
-0.0
80
-0.0
60
-0.0
40
-0.0
20
0.0
00 1
00
1000
10000
Str
ess
(psf
)
Deformation (in.)
104
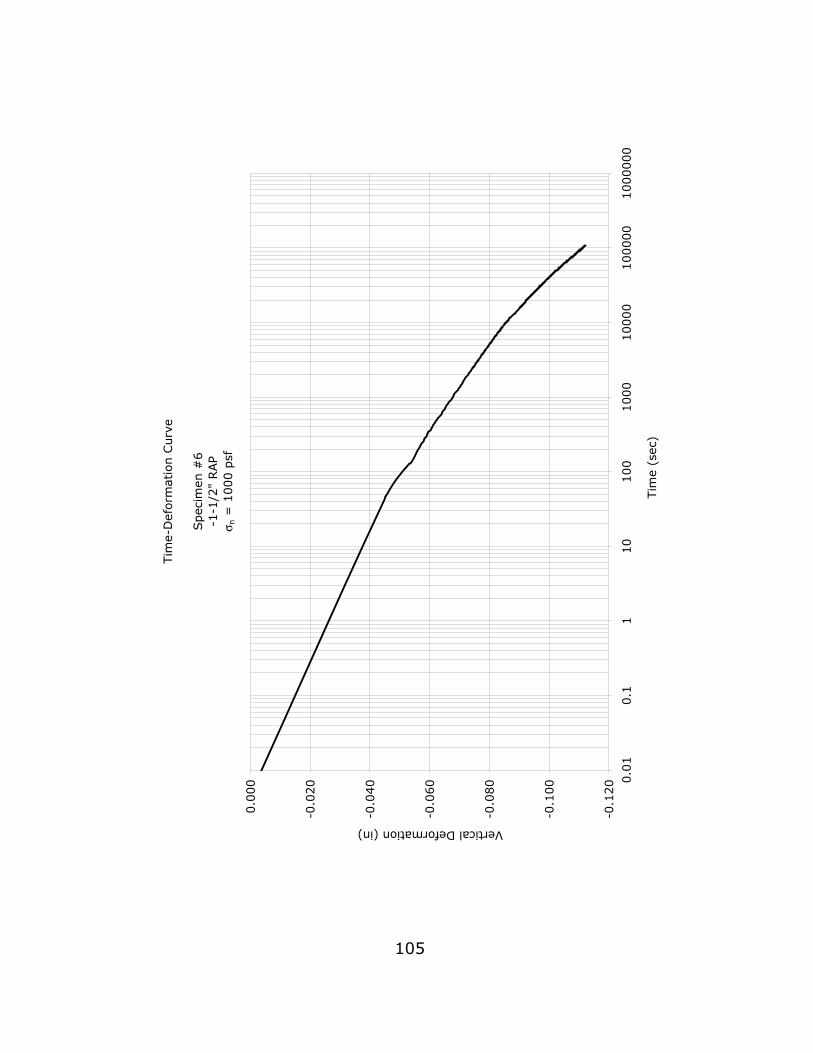
105
Tim
e-D
efo
rmation C
urv
e
Spec
imen
#6
-1-1
/2"
RAP
σ n =
1000 p
sf
-0.1
20
-0.1
00
-0.0
80
-0.0
60
-0.0
40
-0.0
20
0.0
00 0
.01
0.1
110
100
1000
10000
100000
1000000
Tim
e (s
ec)
Vertical Deformation (in)
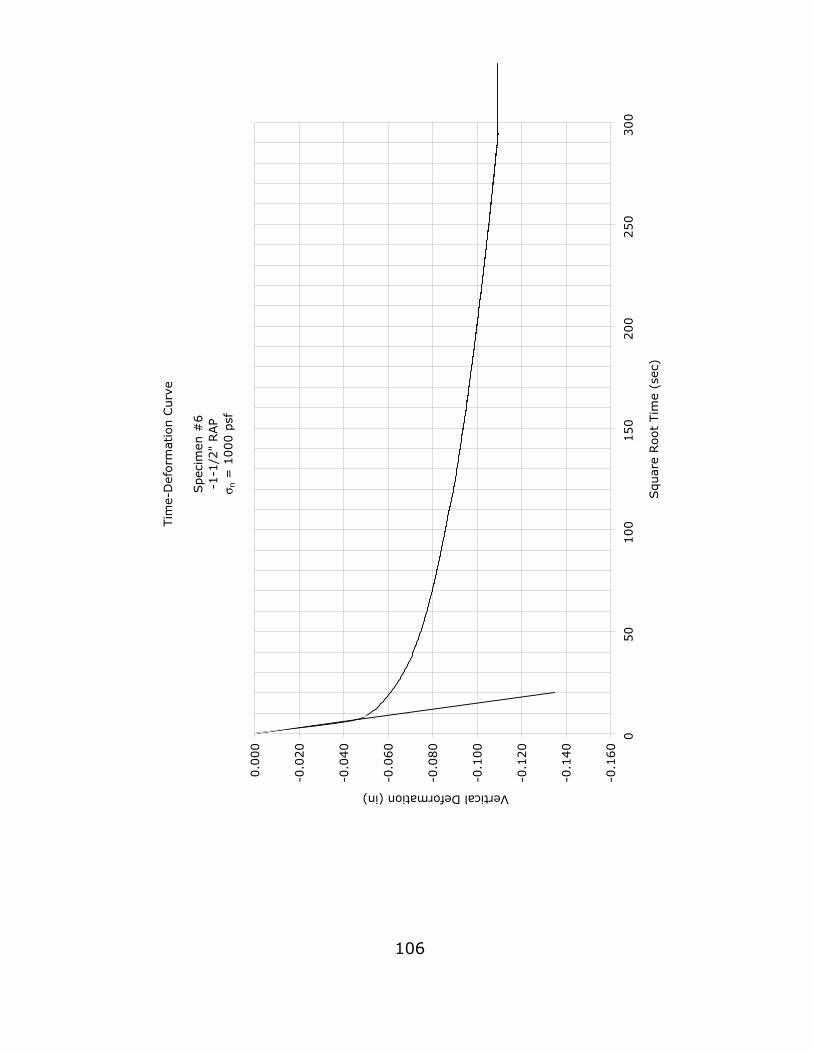
Tim
e-D
eform
atio
n C
urv
e
Spec
imen
#6
-1-1
/2"
RAP
σ n =
1000 p
sf
-0.1
60
-0.1
40
-0.1
20
-0.1
00
-0.0
80
-0.0
60
-0.0
40
-0.0
20
0.0
00
050
100
150
200
250
300
Squar
e Root
Tim
e (s
ec)
Vertical Deformation (in)
106
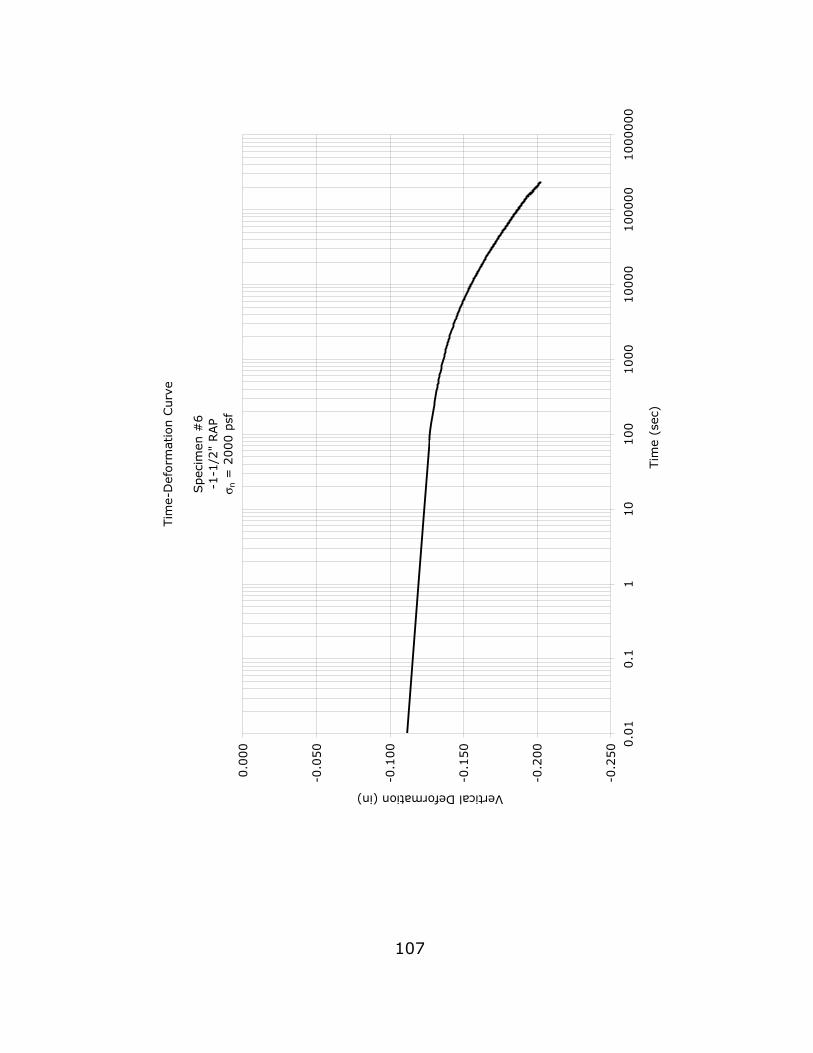
Tim
e-D
eform
atio
n C
urv
e
Spec
imen
#6
-1-1
/2"
RAP
σ n =
2000 p
sf
-0.2
50
-0.2
00
-0.1
50
-0.1
00
-0.0
50
0.0
00 0
.01
0.1
110
100
1000
10000
100000
1000000
Tim
e (s
ec)
Vertical Deformation (in)
107
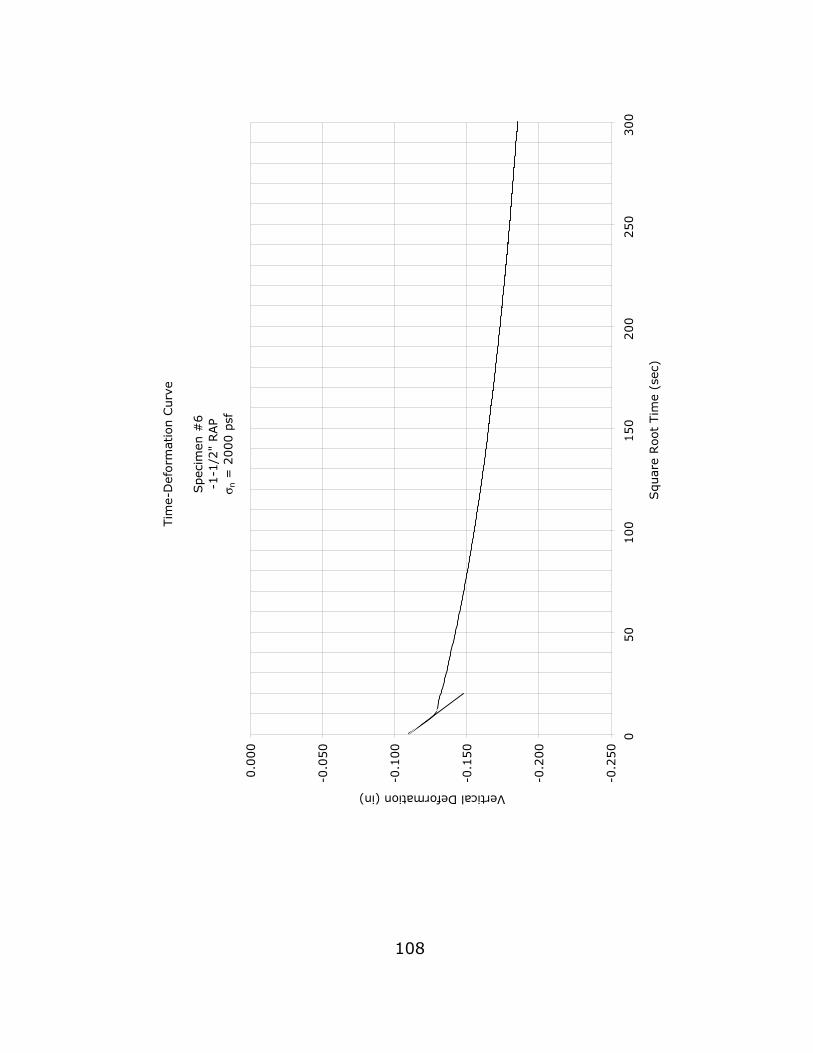
Tim
e-D
eform
atio
n C
urv
e
Spec
imen
#6
-1-1
/2"
RAP
σ n =
2000 p
sf
-0.2
50
-0.2
00
-0.1
50
-0.1
00
-0.0
50
0.0
00
050
100
150
200
250
300
Squar
e Root
Tim
e (s
ec)
Vertical Deformation (in)
108
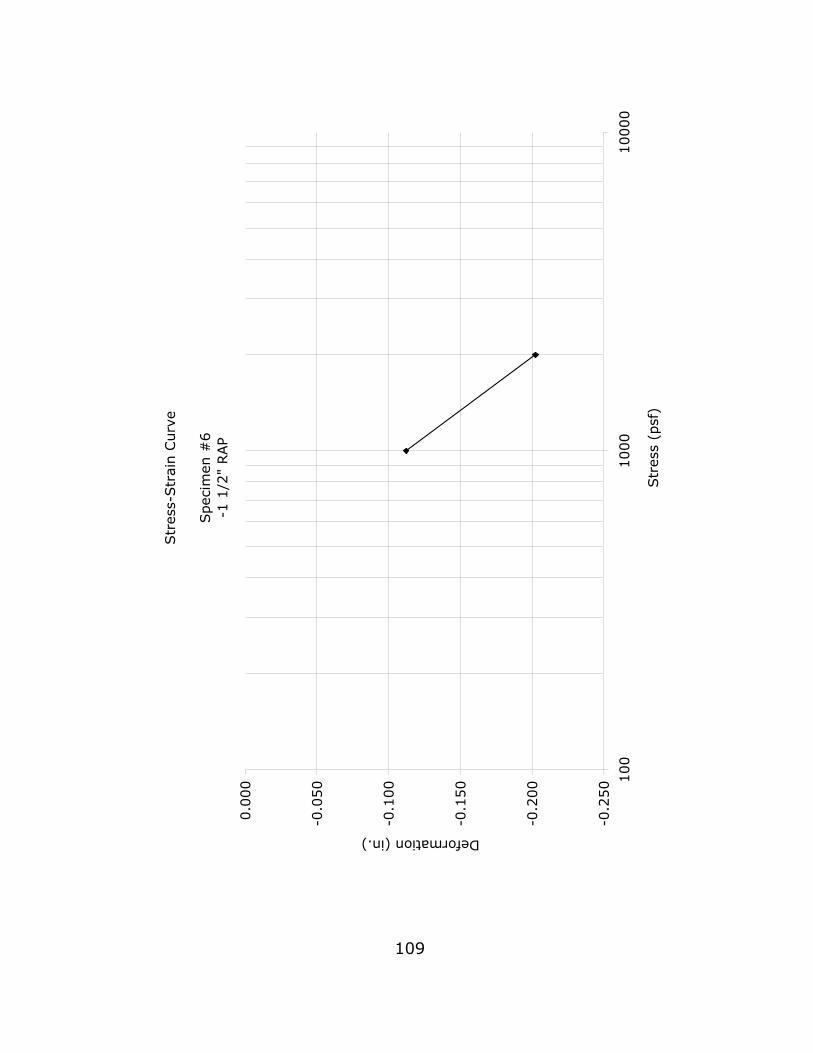
Str
ess-
Str
ain C
urv
e
Spec
imen
#6
-1 1
/2"
RAP
-0.2
50
-0.2
00
-0.1
50
-0.1
00
-0.0
50
0.0
00 1
00
1000
10000
Str
ess
(psf
)
Deformation (in.)
109
Tim
e-D
eform
atio
n C
urv
e
Spec
imen
#7
75%
RAP
Ble
nd
σ n =
1000 p
sf
-0.0
80
-0.0
70
-0.0
60
-0.0
50
-0.0
40
-0.0
30
-0.0
20
-0.0
10
0.0
00 0
.01
0.1
110
100
1000
10000
100000
Tim
e (s
ec)
Vertical Deformation (in)
110
Tim
e-D
eform
atio
n C
urv
e
Spec
imen
#7
75%
RAP
Ble
nd
σ n =
1000 p
sf
-0.1
00
-0.0
90
-0.0
80
-0.0
70
-0.0
60
-0.0
50
-0.0
40
-0.0
30
-0.0
20
-0.0
10
0.0
00
050
100
150
200
250
300
350
Squar
e Root
Tim
e (s
ec)
Vertical Deformation (in)
111
Tim
e-D
eform
atio
n C
urv
e
Spec
imen
#7
75%
RAP
Ble
nd
σ n =
2000 p
sf
-0.1
60
-0.1
40
-0.1
20
-0.1
00
-0.0
80
-0.0
60
-0.0
40
-0.0
20
0.0
00 0
.01
0.1
110
100
1000
10000
100000
1000000
Tim
e (s
ec)
Vertical Deformation (in)
112
Tim
e-D
eform
atio
n C
urv
e
Spec
imen
#7
75%
RAP
Ble
nd
σ n =
2000 p
sf
-0.1
60
-0.1
40
-0.1
20
-0.1
00
-0.0
80
-0.0
60
-0.0
40
-0.0
20
0.0
00
050
100
150
200
250
300
Squar
e Root
Tim
e (s
ec)
Vertical Deformation (in)
113
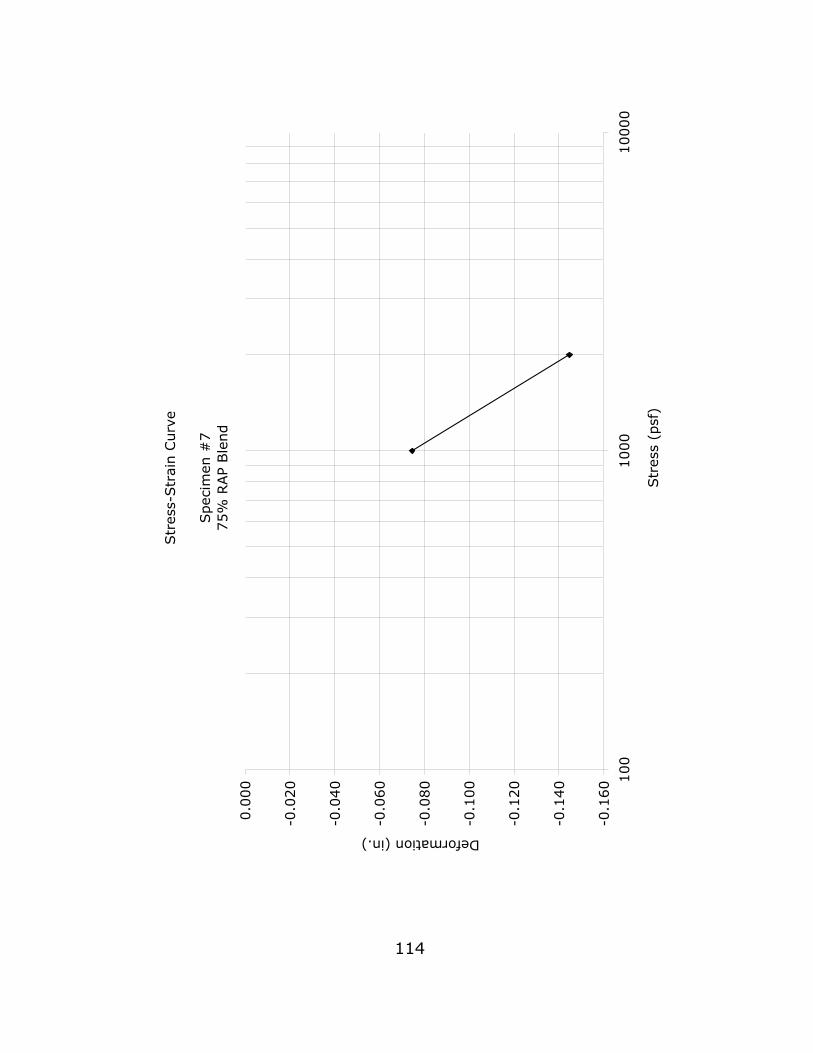
Str
ess-
Str
ain C
urv
e
Spec
imen
#7
75%
RAP
Ble
nd
-0.1
60
-0.1
40
-0.1
20
-0.1
00
-0.0
80
-0.0
60
-0.0
40
-0.0
20
0.0
00 1
00
1000
10000
Str
ess
(psf
)
Deformation (in.)
114
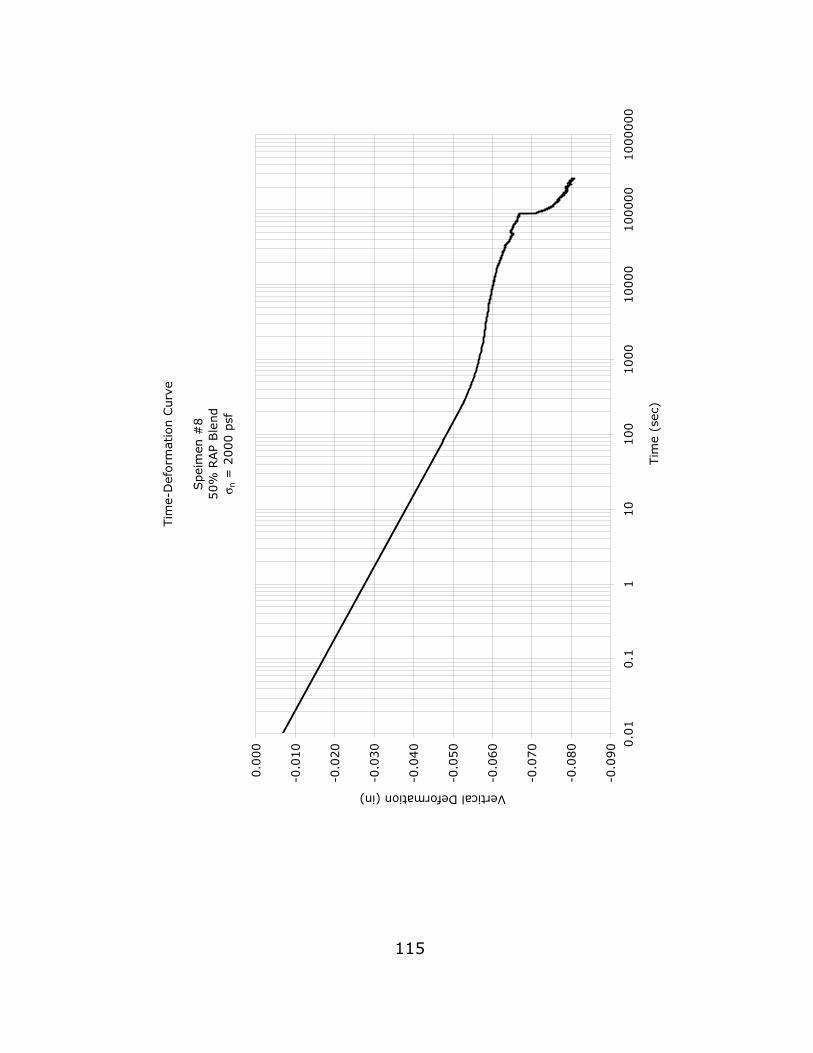
Tim
e-D
eform
atio
n C
urv
e
Spei
men
#8
50%
RAP
Ble
nd
σ n =
2000 p
sf
-0.0
90
-0.0
80
-0.0
70
-0.0
60
-0.0
50
-0.0
40
-0.0
30
-0.0
20
-0.0
10
0.0
00 0
.01
0.1
110
100
1000
10000
100000
1000000
Tim
e (s
ec)
Vertical Deformation (in)
115
Tim
e-D
eform
atio
n C
urv
e
Spec
imen
#8
50%
RAP
Ble
nd
σ n =
2000 p
sf
-0.1
20
-0.1
00
-0.0
80
-0.0
60
-0.0
40
-0.0
20
0.0
00
050
100
150
200
250
300
350
400
450
500
Squar
e Root
Tim
e (s
ec)
Vertical Deformation (in)
116
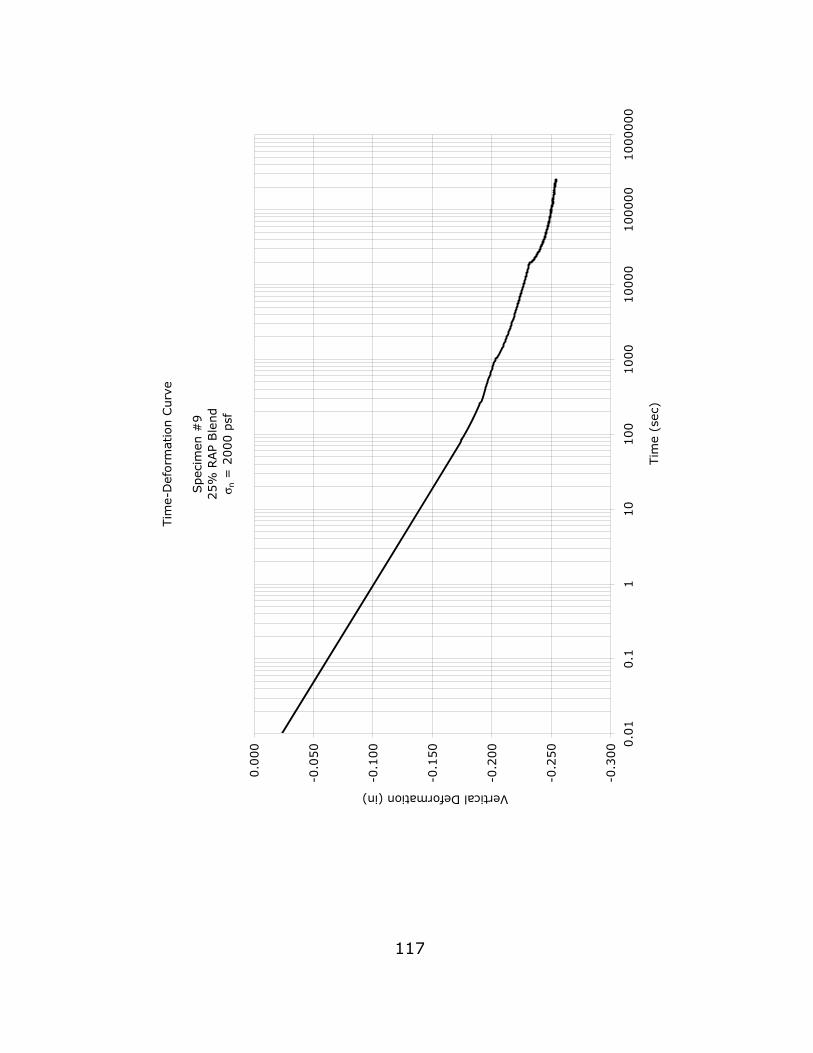
Tim
e-D
eform
atio
n C
urv
e
Spec
imen
#9
25%
RAP
Ble
nd
σ n =
2000 p
sf
-0.3
00
-0.2
50
-0.2
00
-0.1
50
-0.1
00
-0.0
50
0.0
00 0
.01
0.1
110
100
1000
10000
100000
1000000
Tim
e (s
ec)
Vertical Deformation (in)
117
Tim
e-D
eform
atio
n C
urv
e
Spec
imen
#9
25%
RAP
Ble
nd
σ n =
2000 p
sf
-0.4
00
-0.3
50
-0.3
00
-0.2
50
-0.2
00
-0.1
50
-0.1
00
-0.0
50
0.0
00
050
100
150
200
250
300
350
400
Squar
e Root
Tim
e (s
ec)
Vertical Deformation (in)
118
Tim
e-D
eform
atio
n C
urv
e
Spec
imen
#10
100%
Soil
(No R
AP)
σ n
= 2
000 p
sf
-0.1
20
-0.1
00
-0.0
80
-0.0
60
-0.0
40
-0.0
20
0.0
00 0
.01
0.1
110
100
1000
10000
100000
1000000
Tim
e (s
ec)
Vertical Deformation (in)
119
Tim
e-D
eform
atio
n C
urv
e
Spec
imen
#10
100%
Soil
(No R
AP)
σ n
= 2
000 p
sf
-0.2
00
-0.1
80
-0.1
60
-0.1
40
-0.1
20
-0.1
00
-0.0
80
-0.0
60
-0.0
40
-0.0
20
0.0
00
050
100
150
200
250
300
350
400
Squar
e Root
Tim
e (s
ec)
Vertical Deformation (in)
120

121
APPENDIX C
SHEAR STRENGTH TEST DATA
Shea
r Fo
rce
vs.
Late
ral D
ispla
cem
ent
Spec
imen
#1
-1 1
/2"
RAP
σ n =
1000 p
sf
0
1000
2000
3000
4000
5000
6000
7000
8000
9000 0
.00
0.5
01.0
01.5
02.0
02.5
03.0
03.5
04.0
0
Late
ral D
ispla
cem
ent
(in.)
Shear Force (lbf)
122
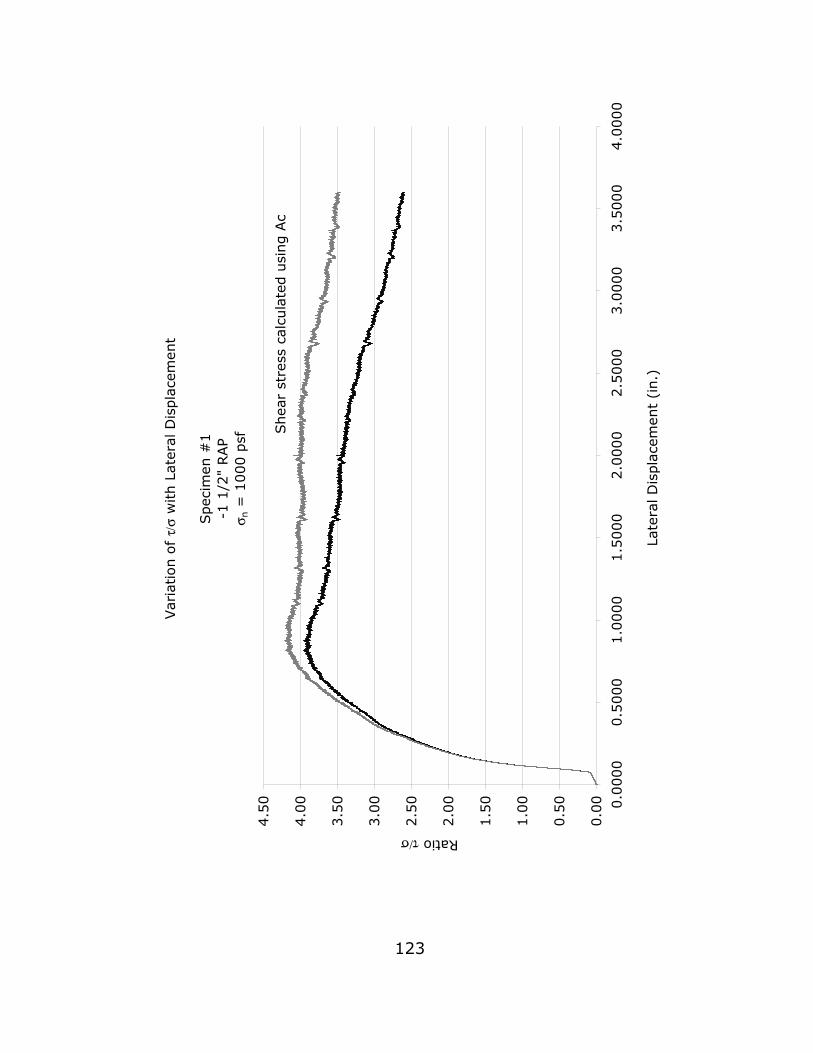
Var
iation o
f τ/
σ w
ith L
ater
al D
ispla
cem
ent
Spec
imen
#1
-1 1
/2"
RAP
σ n =
1000 p
sf
0.0
0
0.5
0
1.0
0
1.5
0
2.0
0
2.5
0
3.0
0
3.5
0
4.0
0
4.5
0 0.0
000
0.5
000
1.0
000
1.5
000
2.0
000
2.5
000
3.0
000
3.5
000
4.0
000
Late
ral D
ispla
cem
ent
(in.)
Ratio τ/σ
Shea
r st
ress
cal
cula
ted u
sing A
c
123
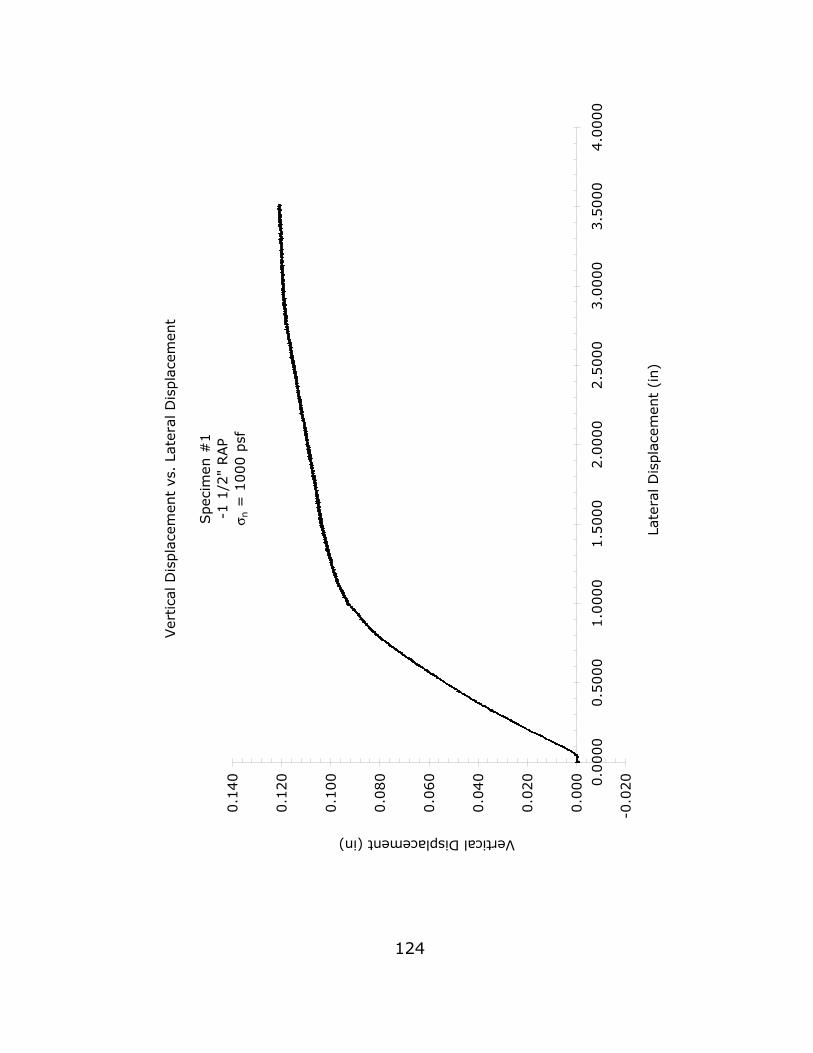
Ver
tica
l D
ispla
cem
ent
vs.
Late
ral D
ispla
cem
ent
Spec
imen
#1
-1 1
/2"
RAP
σ n =
1000 p
sf
-0.0
20
0.0
00
0.0
20
0.0
40
0.0
60
0.0
80
0.1
00
0.1
20
0.1
40 0.0
000
0.5
000
1.0
000
1.5
000
2.0
000
2.5
000
3.0
000
3.5
000
4.0
000
Late
ral D
ispla
cem
ent
(in)
Vertical Displacement (in)
124
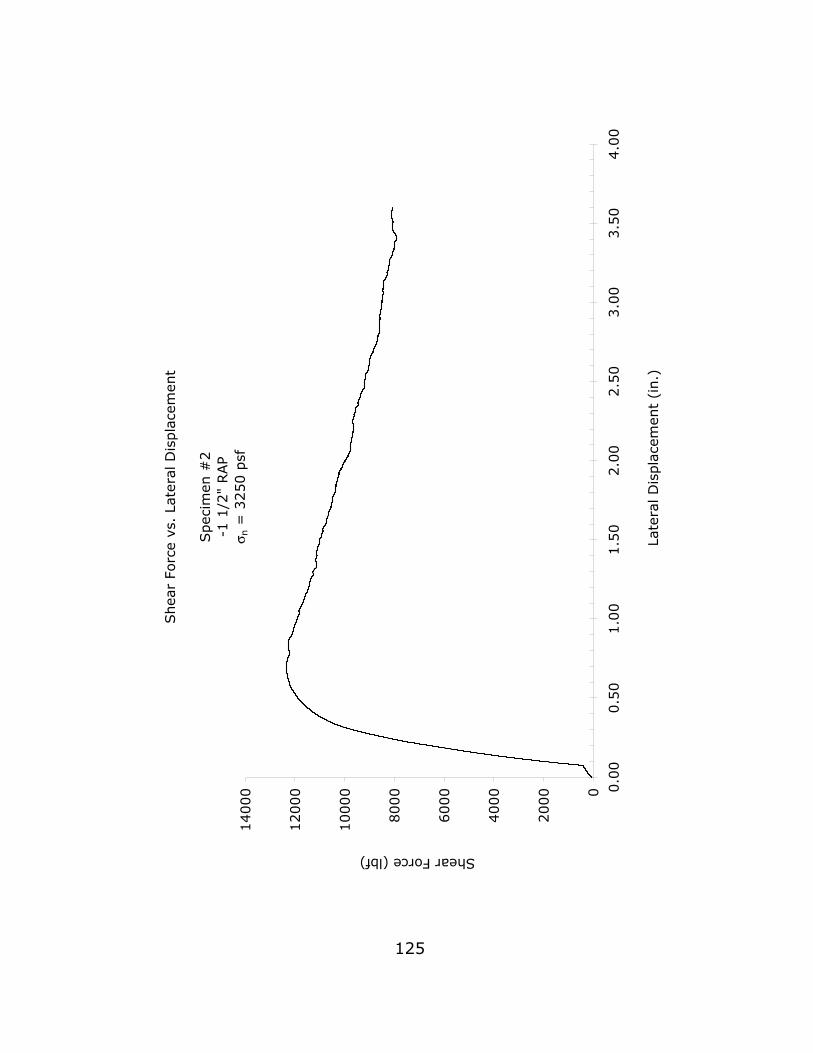
Shea
r Fo
rce
vs.
Late
ral D
ispla
cem
ent
Spec
imen
#2
-1 1
/2"
RAP
σ n =
3250 p
sf
0
2000
4000
6000
8000
10000
12000
14000 0
.00
0.5
01.0
01.5
02.0
02.5
03.0
03.5
04.0
0
Late
ral D
ispla
cem
ent
(in.)
Shear Force (lbf)
125
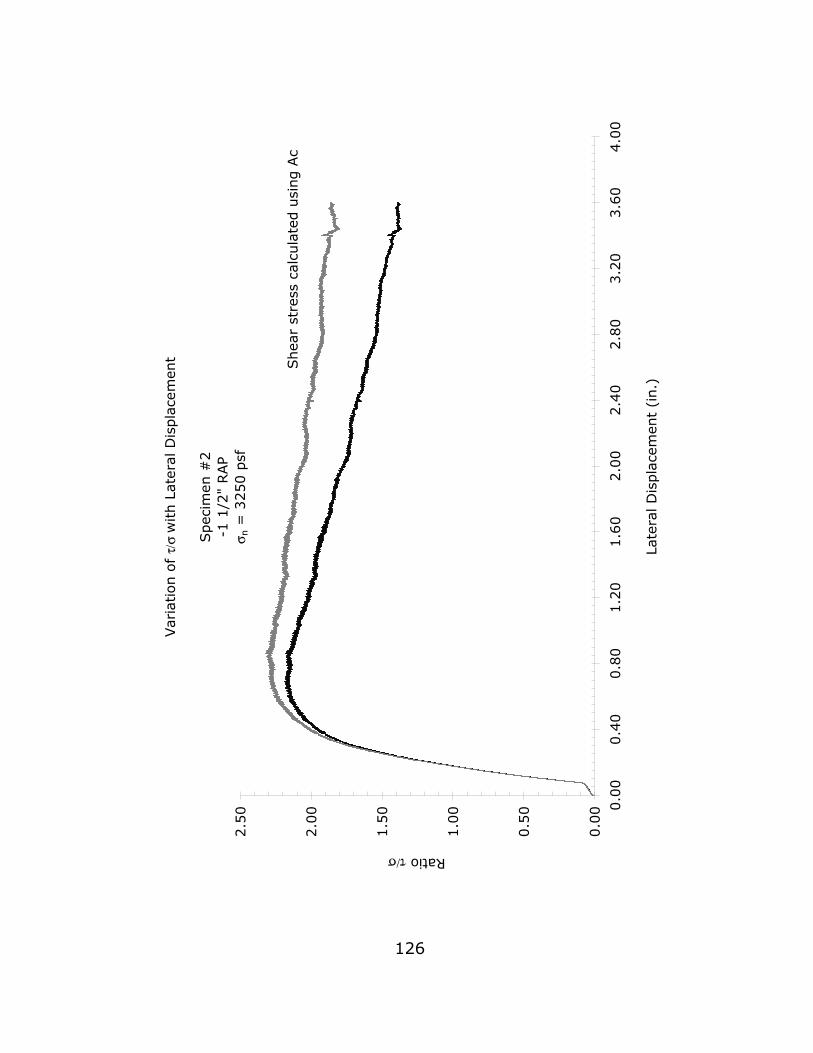
Var
iation o
f τ/
σ w
ith L
ater
al D
ispla
cem
ent
Spec
imen
#2
-1 1
/2"
RAP
σ n =
3250 p
sf
0.0
0
0.5
0
1.0
0
1.5
0
2.0
0
2.5
0 0.0
00.4
00.8
01.2
01.6
02.0
02.4
02.8
03.2
03.6
04.0
0
Late
ral D
ispla
cem
ent
(in.)
Ratio τ/σ
Shea
r st
ress
cal
cula
ted u
sing A
c
126
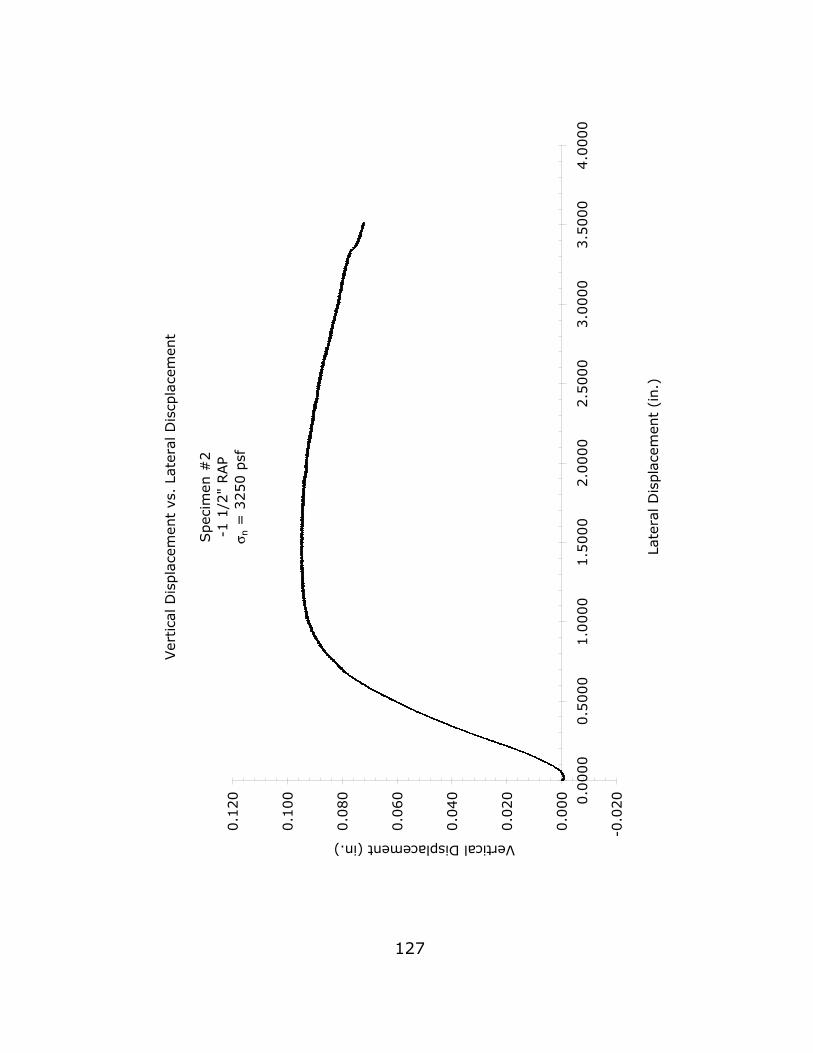
Ver
tica
l D
ispla
cem
ent
vs.
Late
ral D
iscp
lace
men
t
Spec
imen
#2
-1 1
/2"
RAP
σ n =
3250 p
sf
-0.0
20
0.0
00
0.0
20
0.0
40
0.0
60
0.0
80
0.1
00
0.1
20 0.0
000
0.5
000
1.0
000
1.5
000
2.0
000
2.5
000
3.0
000
3.5
000
4.0
000
Late
ral D
ispla
cem
ent
(in.)
Vertical Displacement (in.)
127
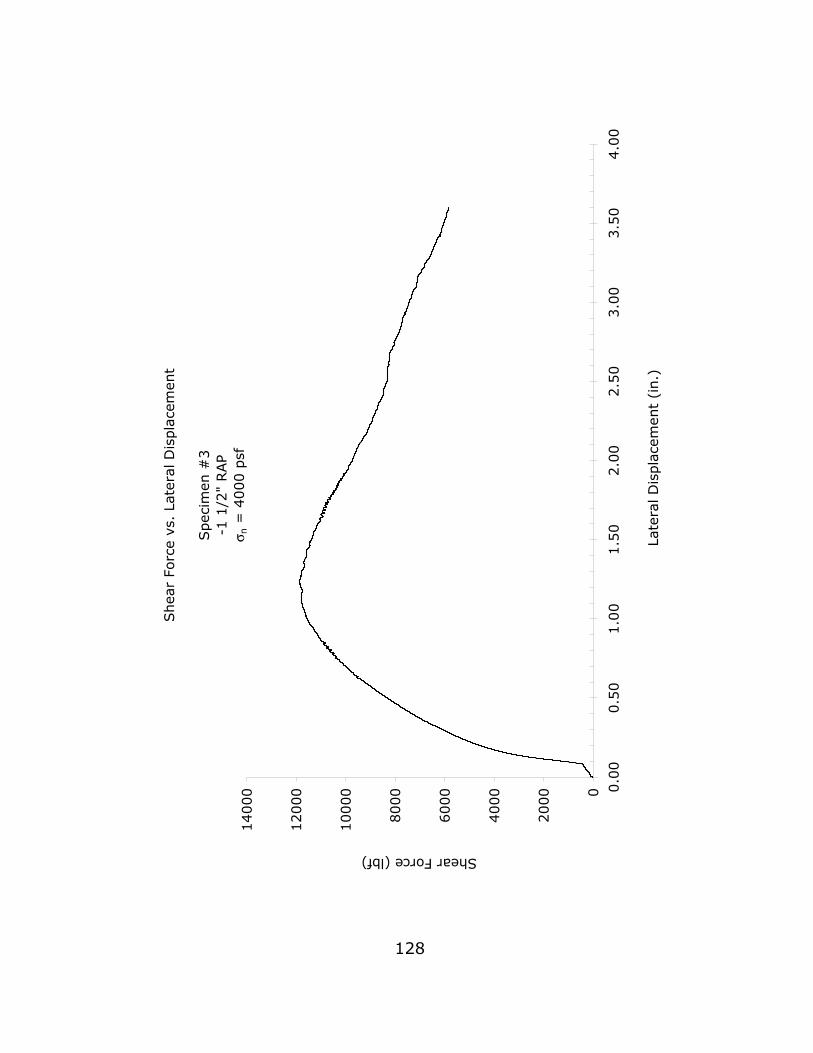
Shea
r Fo
rce
vs.
Late
ral D
ispla
cem
ent
Spec
imen
#3
-1 1
/2"
RAP
σ n =
4000 p
sf
0
2000
4000
6000
8000
10000
12000
14000 0
.00
0.5
01.0
01.5
02.0
02.5
03.0
03.5
04.0
0
Late
ral D
ispla
cem
ent
(in.)
Shear Force (lbf)
128
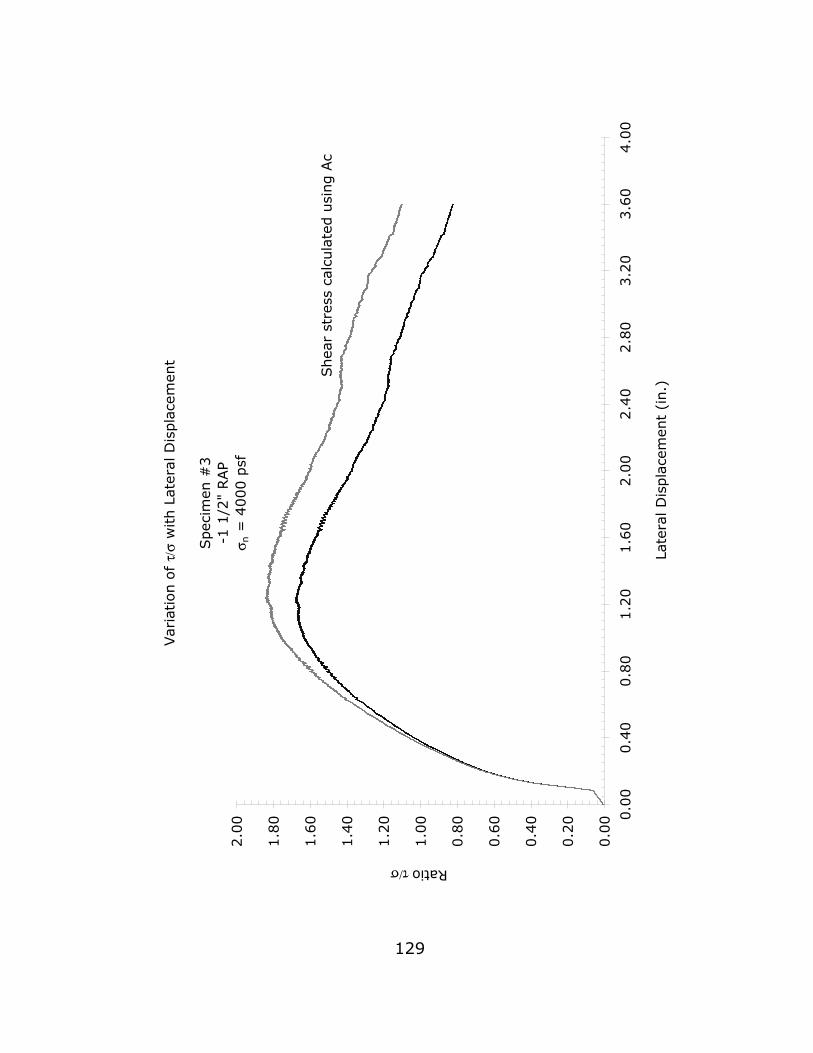
Variat
ion o
f τ/
σ w
ith L
atera
l D
ispla
cem
ent
Spec
imen
#3
-1 1
/2"
RAP
σ n =
4000 p
sf
0.0
0
0.2
0
0.4
0
0.6
0
0.8
0
1.0
0
1.2
0
1.4
0
1.6
0
1.8
0
2.0
0 0.0
00.4
00.8
01.2
01.6
02.0
02.4
02.8
03.2
03.6
04.0
0
Late
ral D
ispla
cem
ent
(in.)
Ratio τ/σ
Shea
r st
ress
cal
cula
ted u
sing A
c
129
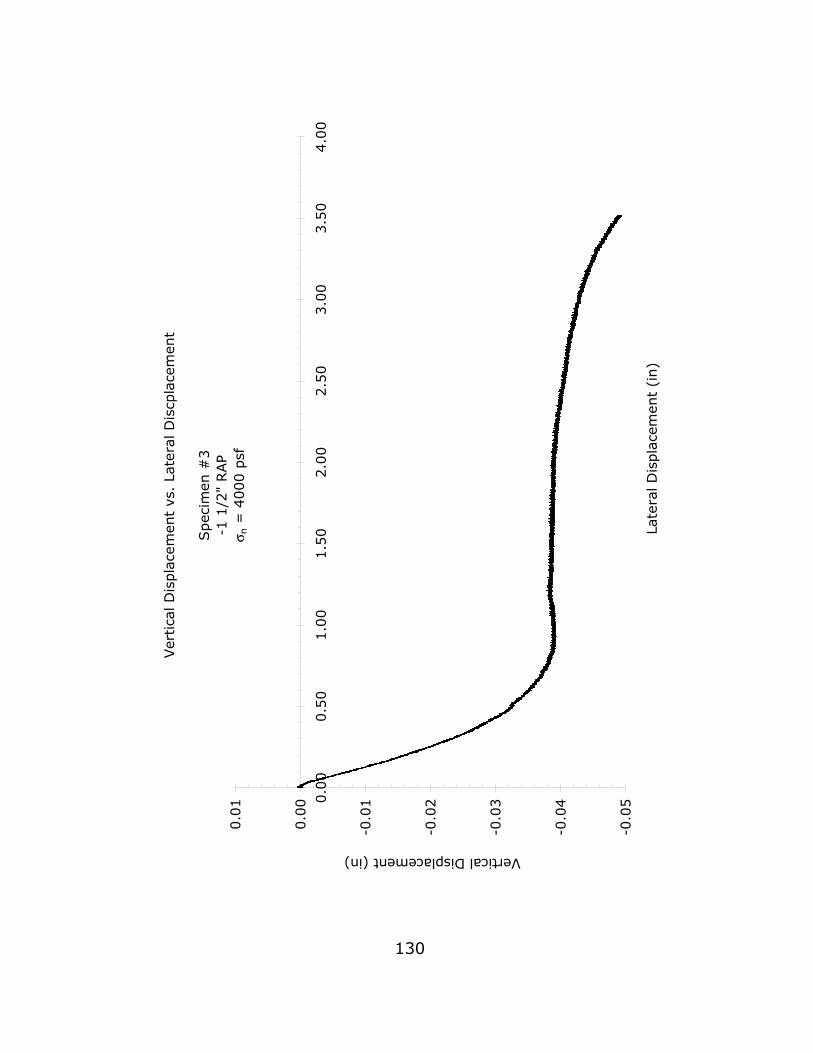
Ver
tica
l D
ispla
cem
ent
vs.
Late
ral D
iscp
lace
men
t
Spec
imen
#3
-1 1
/2"
RAP
σ n =
4000 p
sf
-0.0
5
-0.0
4
-0.0
3
-0.0
2
-0.0
1
0.0
0
0.0
1 0.0
00.5
01.0
01.5
02.0
02.5
03.0
03.5
04.0
0
Late
ral D
ispla
cem
ent
(in)
Vertical Displacement (in)
130
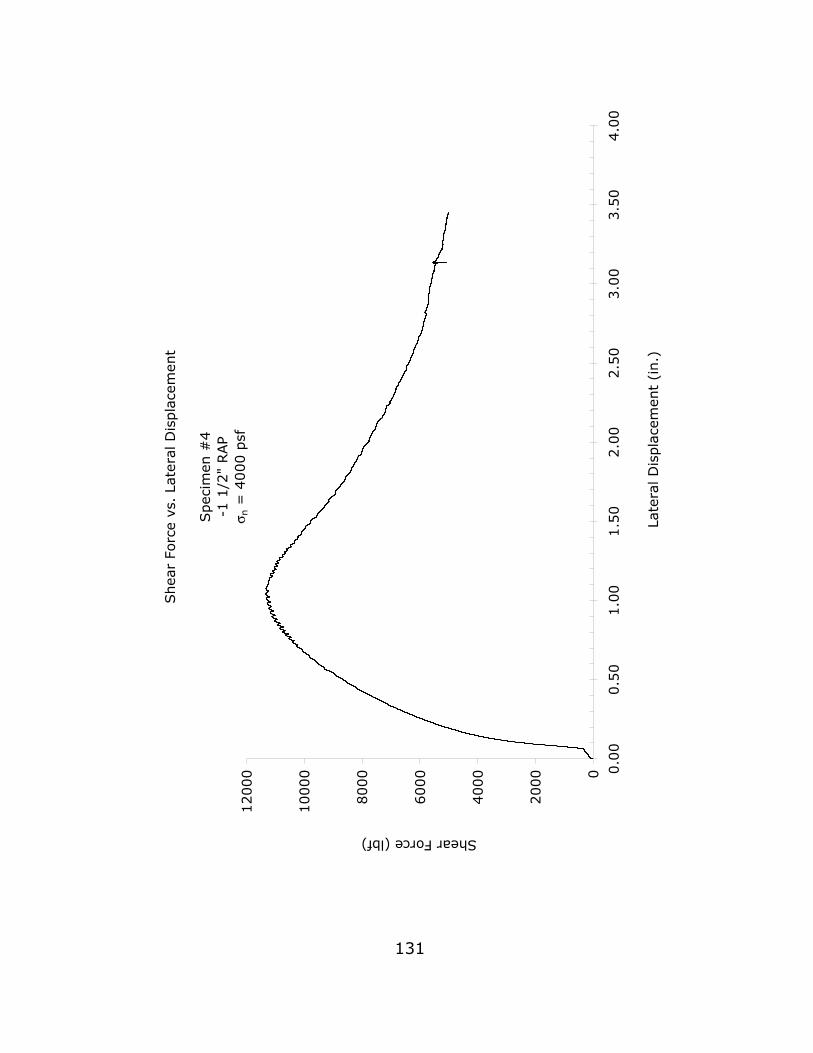
Shea
r Fo
rce
vs.
Late
ral D
ispla
cem
ent
Spec
imen
#4
-1 1
/2"
RAP
σ n =
4000 p
sf
0
2000
4000
6000
8000
10000
12000 0
.00
0.5
01.0
01.5
02.0
02.5
03.0
03.5
04.0
0
Late
ral D
ispla
cem
ent
(in.)
Shear Force (lbf)
131
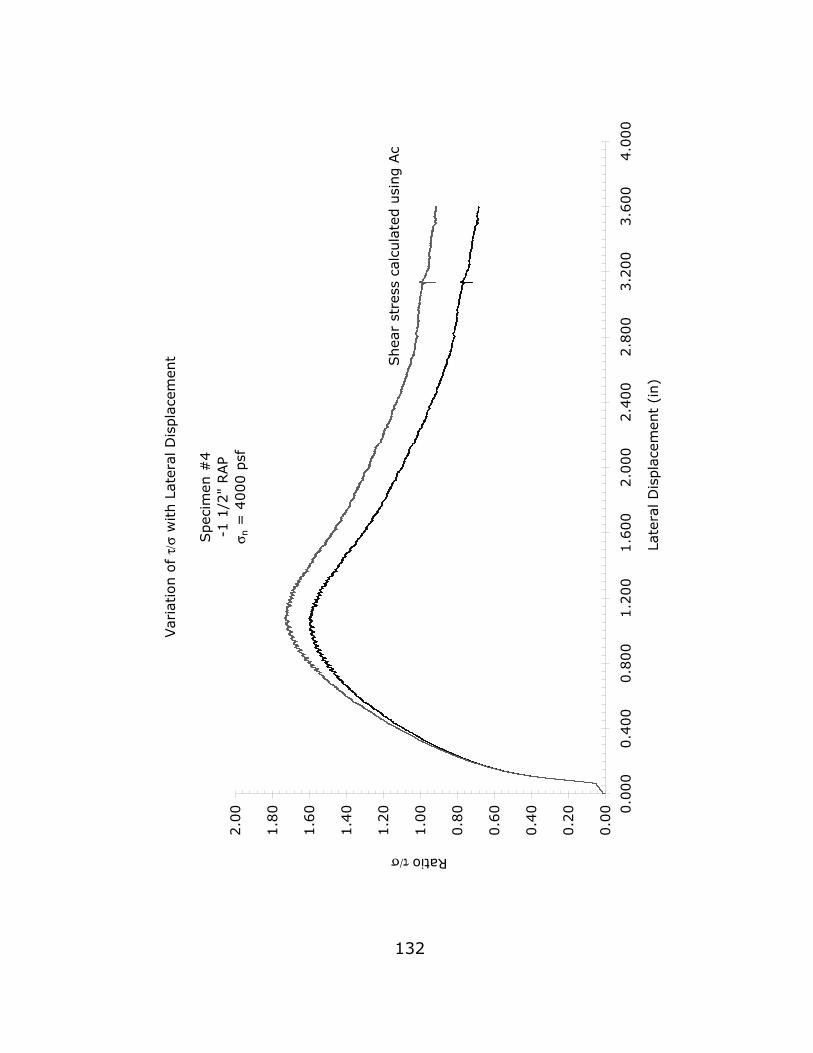
Var
iation o
f τ/
σ w
ith L
ater
al D
ispla
cem
ent
Spec
imen
#4
-1 1
/2"
RAP
σ n =
4000 p
sf
0.0
0
0.2
0
0.4
0
0.6
0
0.8
0
1.0
0
1.2
0
1.4
0
1.6
0
1.8
0
2.0
0 0.0
00
0.4
00
0.8
00
1.2
00
1.6
00
2.0
00
2.4
00
2.8
00
3.2
00
3.6
00
4.0
00
Late
ral D
ispla
cem
ent
(in)
Ratio τ/σ
Shea
r st
ress
cal
cula
ted u
sing A
c
132
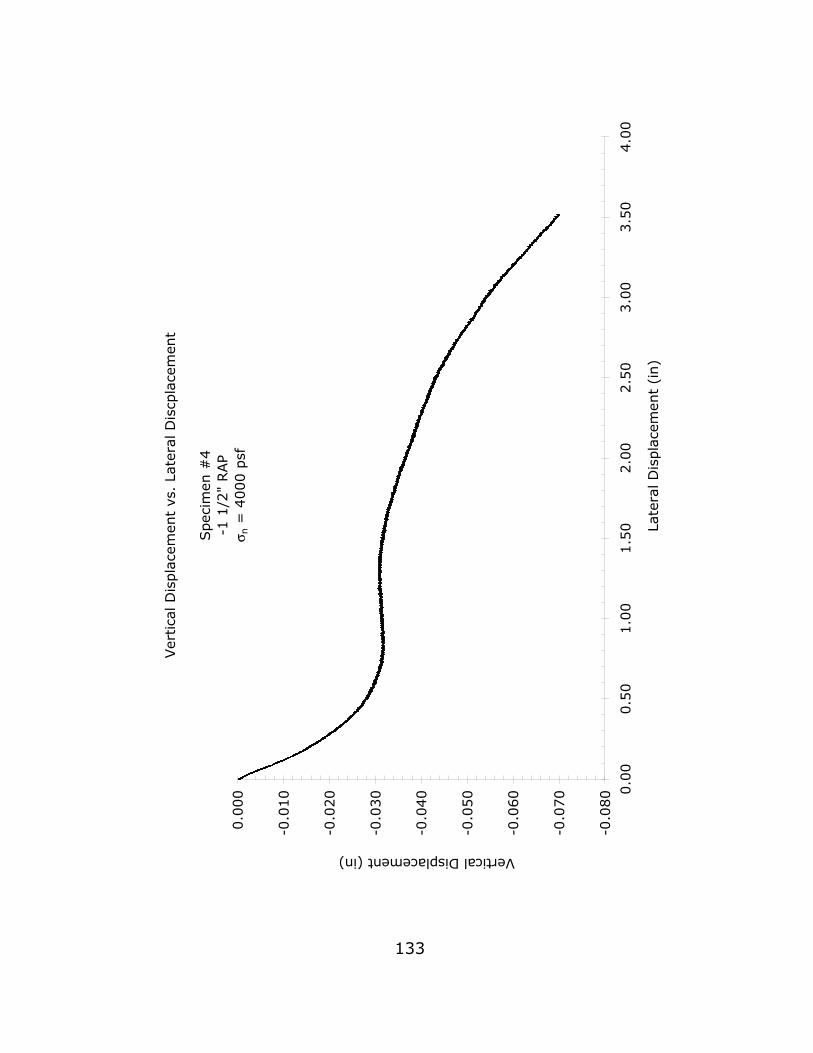
Ver
tica
l D
ispla
cem
ent
vs.
Late
ral D
iscp
lace
men
t
Spec
imen
#4
-1 1
/2"
RAP
σ n =
4000 p
sf
-0.0
80
-0.0
70
-0.0
60
-0.0
50
-0.0
40
-0.0
30
-0.0
20
-0.0
10
0.0
00 0
.00
0.5
01.0
01.5
02.0
02.5
03.0
03.5
04.0
0
Late
ral D
ispla
cem
ent
(in)
Vertical Displacement (in)
133
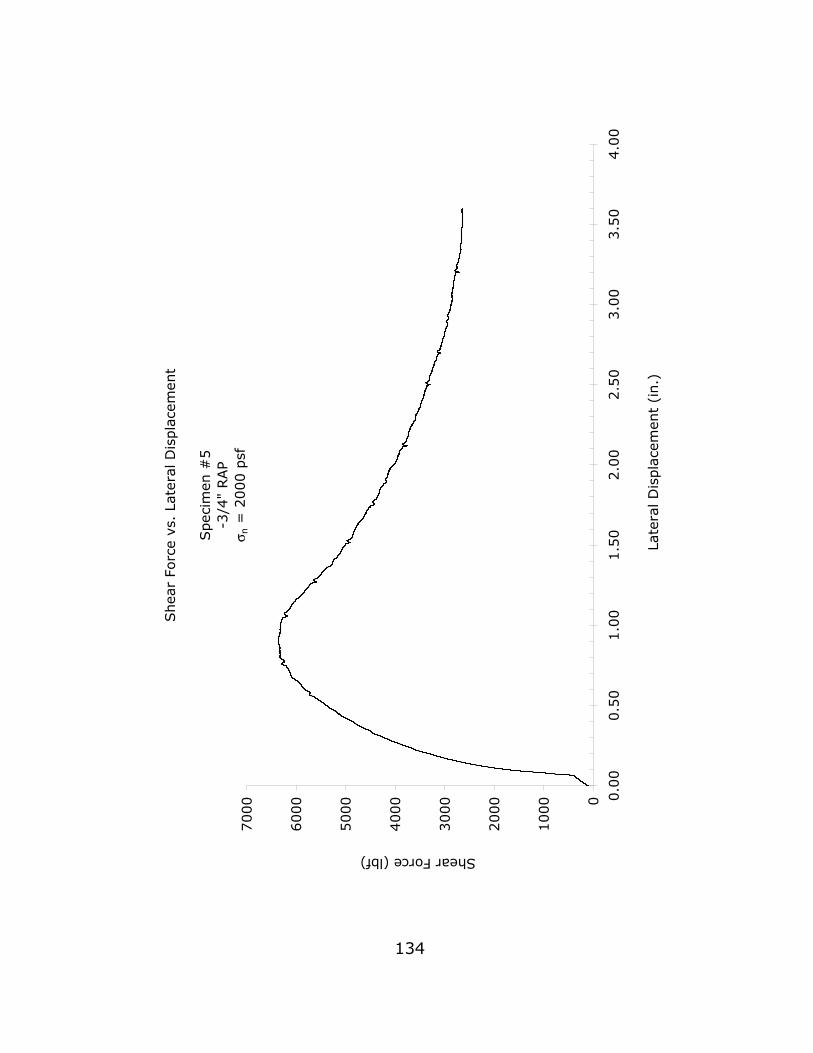
Shea
r Fo
rce
vs.
Late
ral D
ispla
cem
ent
Spec
imen
#5
-3/4
" RAP
σ n =
2000 p
sf
0
1000
2000
3000
4000
5000
6000
7000 0
.00
0.5
01.0
01.5
02.0
02.5
03.0
03.5
04.0
0
Late
ral D
ispla
cem
ent
(in.)
Shear Force (lbf)
134
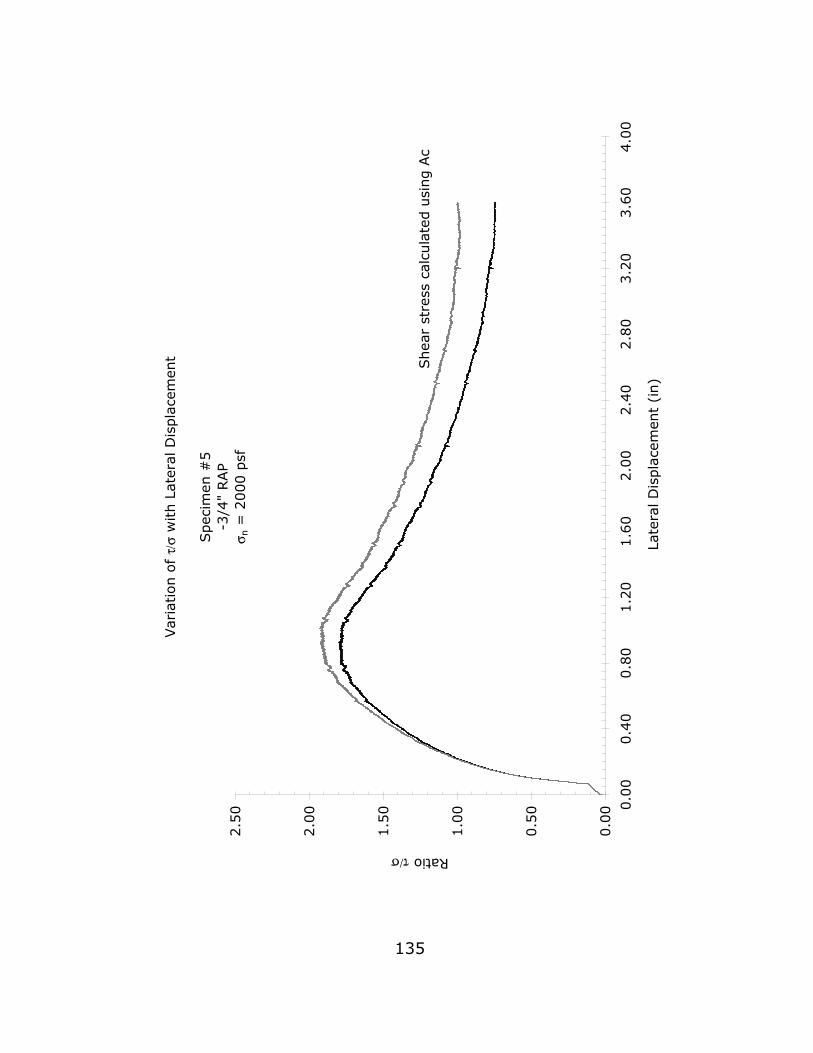
Var
iation o
f τ/
σ w
ith L
ater
al D
ispla
cem
ent
Spec
imen
#5
-3/4
" RAP
σ n =
2000 p
sf
0.0
0
0.5
0
1.0
0
1.5
0
2.0
0
2.5
0 0.0
00.4
00.8
01.2
01.6
02.0
02.4
02.8
03.2
03.6
04.0
0
Late
ral D
ispla
cem
ent
(in)
Ratio τ/σ
Shea
r st
ress
cal
cula
ted u
sing A
c
135
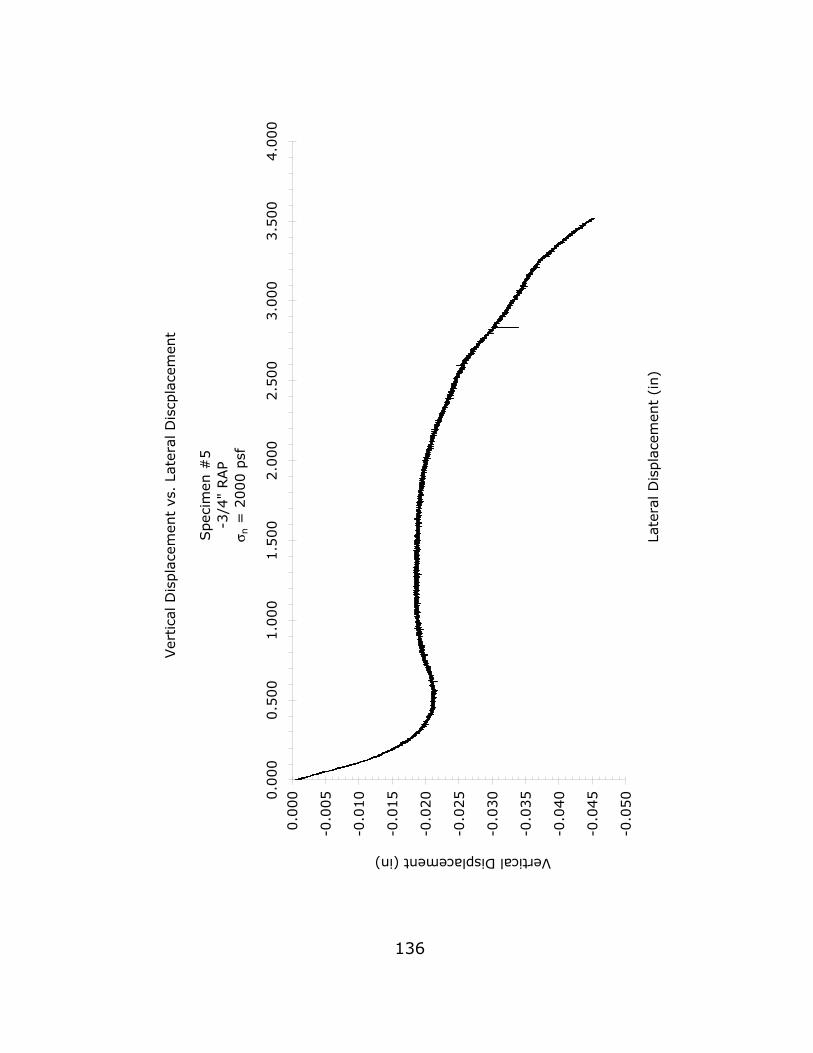
Ver
tica
l D
ispla
cem
ent
vs.
Late
ral D
iscp
lace
men
t
Spec
imen
#5
-3/4
" RAP
σ n =
2000 p
sf
-0.0
50
-0.0
45
-0.0
40
-0.0
35
-0.0
30
-0.0
25
-0.0
20
-0.0
15
-0.0
10
-0.0
05
0.0
000.0
00
0.5
00
1.0
00
1.5
00
2.0
00
2.5
00
3.0
00
3.5
00
4.0
00
Late
ral D
ispla
cem
ent
(in)
Vertical Displacement (in)
136
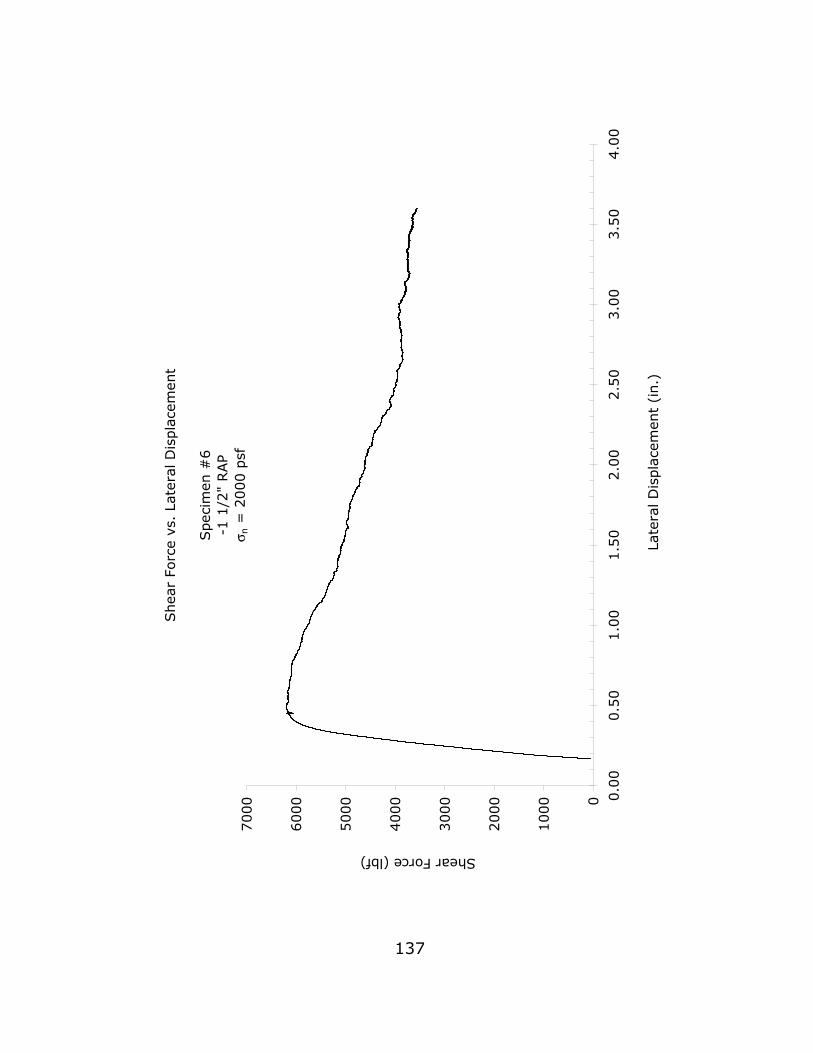
Shea
r Fo
rce
vs.
Late
ral D
ispla
cem
ent
Spec
imen
#6
-1 1
/2"
RAP
σ n =
2000 p
sf
0
1000
2000
3000
4000
5000
6000
7000 0
.00
0.5
01.0
01.5
02.0
02.5
03.0
03.5
04.0
0
Late
ral D
ispla
cem
ent
(in.)
Shear Force (lbf)
137
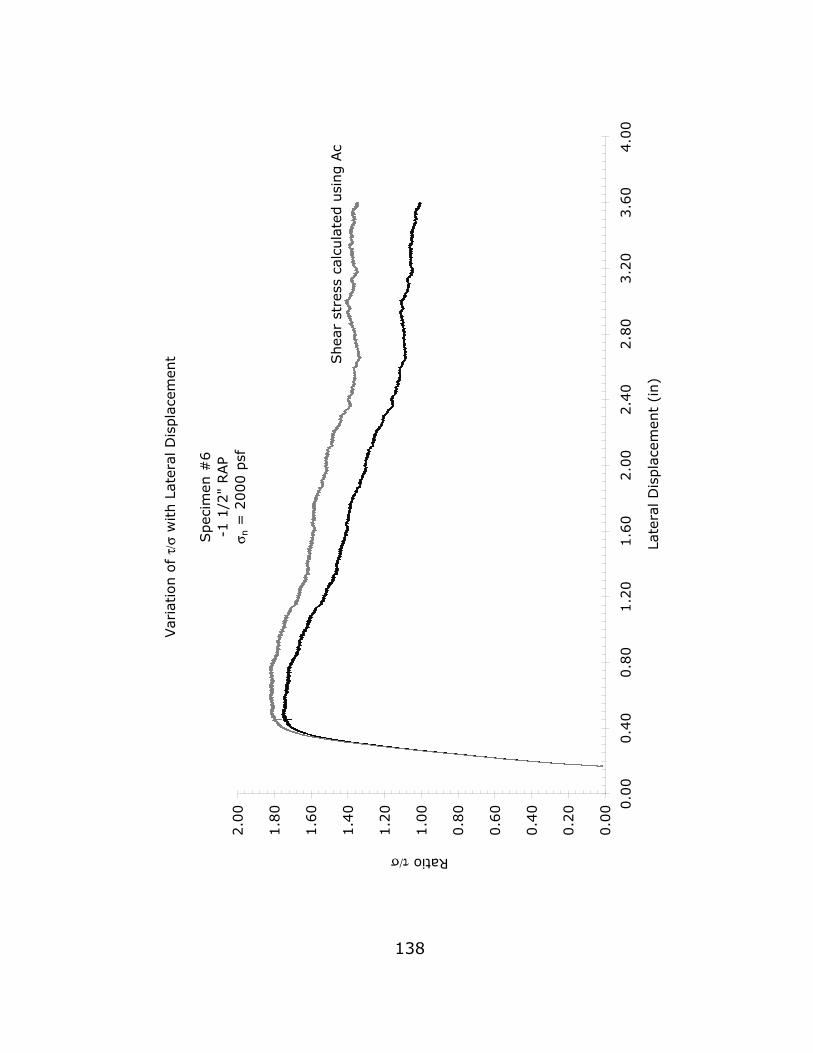
Var
iation o
f τ/
σ w
ith L
ater
al D
ispla
cem
ent
Spec
imen
#6
-1 1
/2"
RAP
σ n =
2000 p
sf
0.0
0
0.2
0
0.4
0
0.6
0
0.8
0
1.0
0
1.2
0
1.4
0
1.6
0
1.8
0
2.0
0 0.0
00.4
00.8
01.2
01.6
02.0
02.4
02.8
03.2
03.6
04.0
0
Late
ral D
ispla
cem
ent
(in)
Ratio τ/σ
Shea
r st
ress
cal
cula
ted u
sing A
c
138
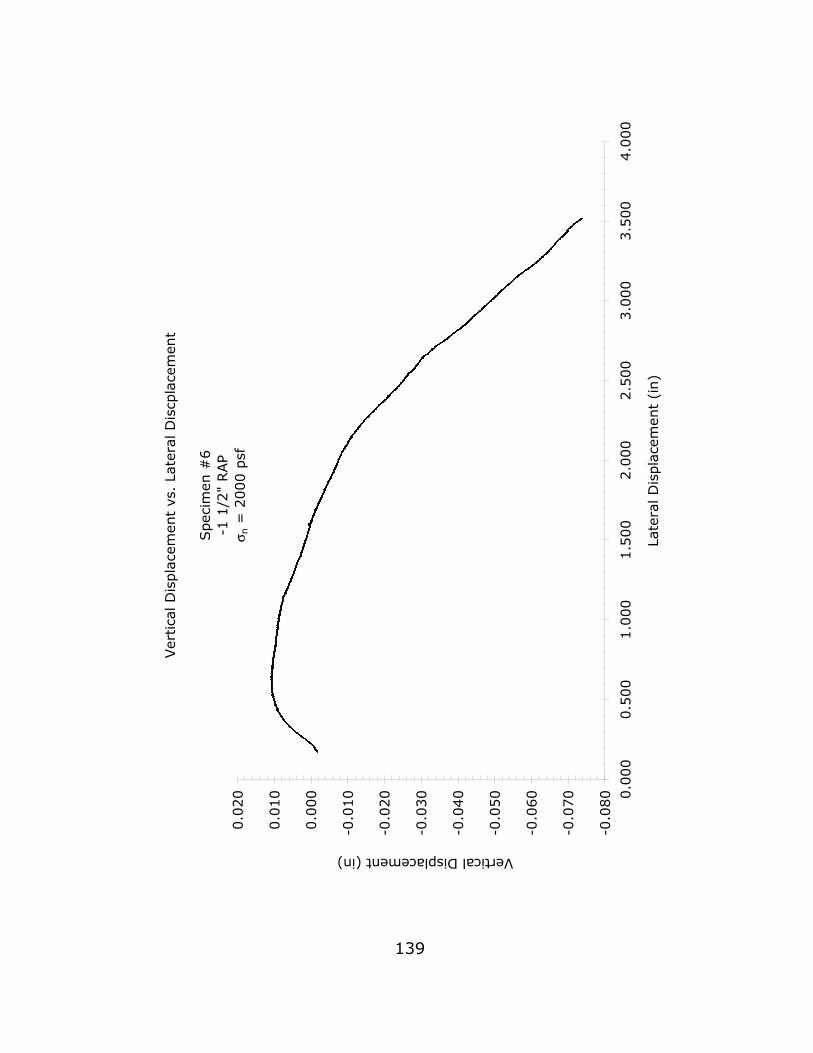
Ver
tica
l D
ispla
cem
ent
vs.
Late
ral D
iscp
lace
men
t
Spec
imen
#6
-1 1
/2"
RAP
σ n =
2000 p
sf
-0.0
80
-0.0
70
-0.0
60
-0.0
50
-0.0
40
-0.0
30
-0.0
20
-0.0
10
0.0
00
0.0
10
0.0
20 0.0
00
0.5
00
1.0
00
1.5
00
2.0
00
2.5
00
3.0
00
3.5
00
4.0
00
Late
ral D
ispla
cem
ent
(in)
Vertical Displacement (in)
139
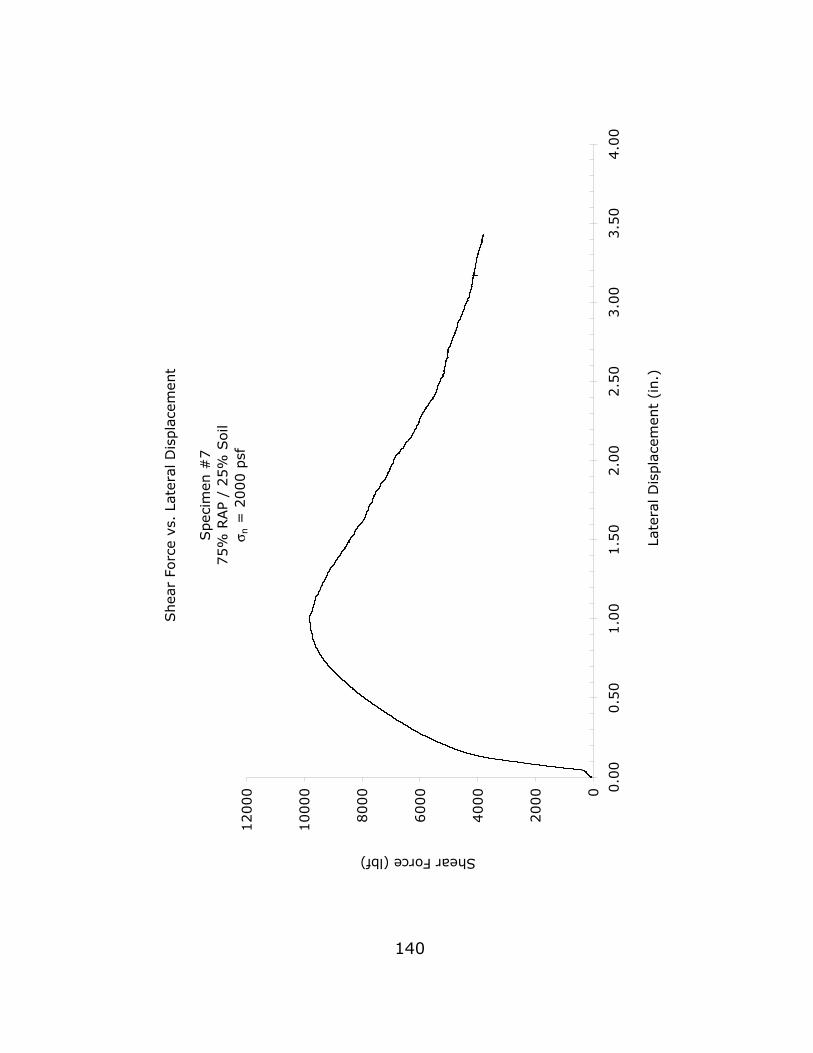
Shea
r Fo
rce
vs.
Late
ral D
ispla
cem
ent
Spec
imen
#7
75%
RAP /
25%
Soil
σ n =
2000 p
sf
0
2000
4000
6000
8000
10000
12000 0
.00
0.5
01.0
01.5
02.0
02.5
03.0
03.5
04.0
0
Late
ral D
ispla
cem
ent
(in.)
Shear Force (lbf)
140
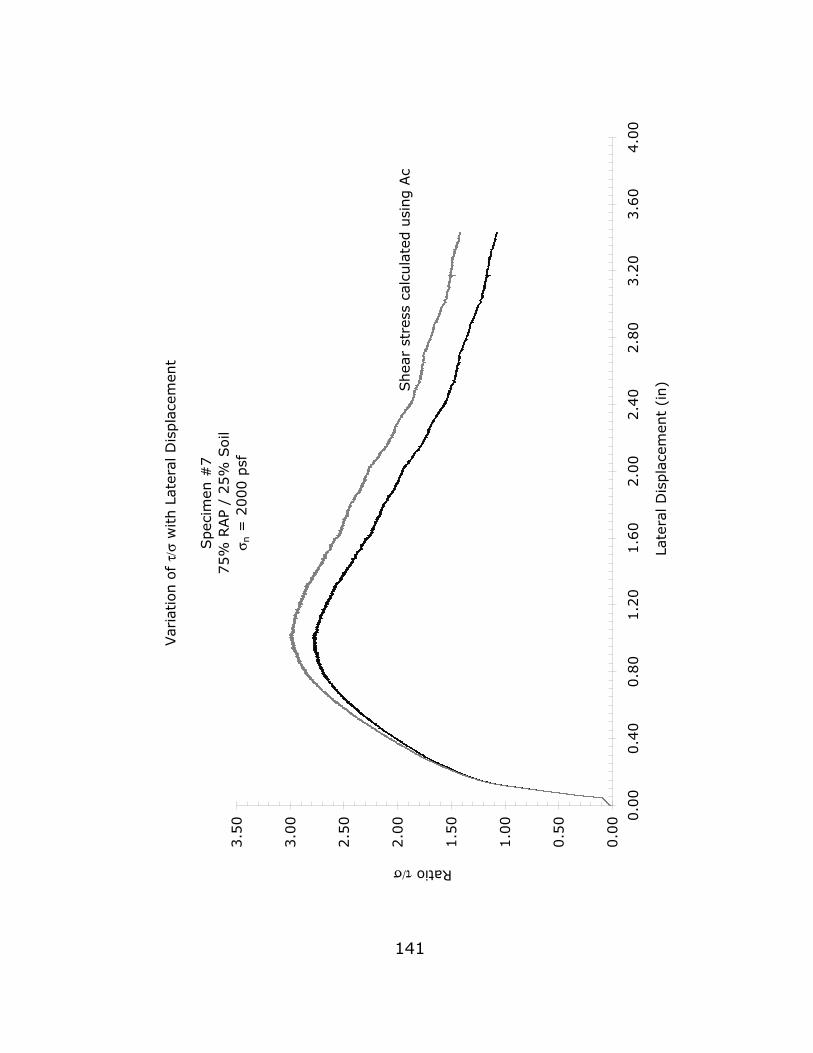
Var
iation o
f τ/
σ w
ith L
ater
al D
ispla
cem
ent
Spec
imen
#7
75%
RAP
/ 25%
Soil
σ n =
2000 p
sf
0.0
0
0.5
0
1.0
0
1.5
0
2.0
0
2.5
0
3.0
0
3.5
0 0.0
00.4
00.8
01.2
01.6
02.0
02.4
02.8
03.2
03.6
04.0
0
Late
ral D
ispla
cem
ent
(in)
Ratio τ/σ
Shea
r st
ress
cal
cula
ted u
sing A
c
141
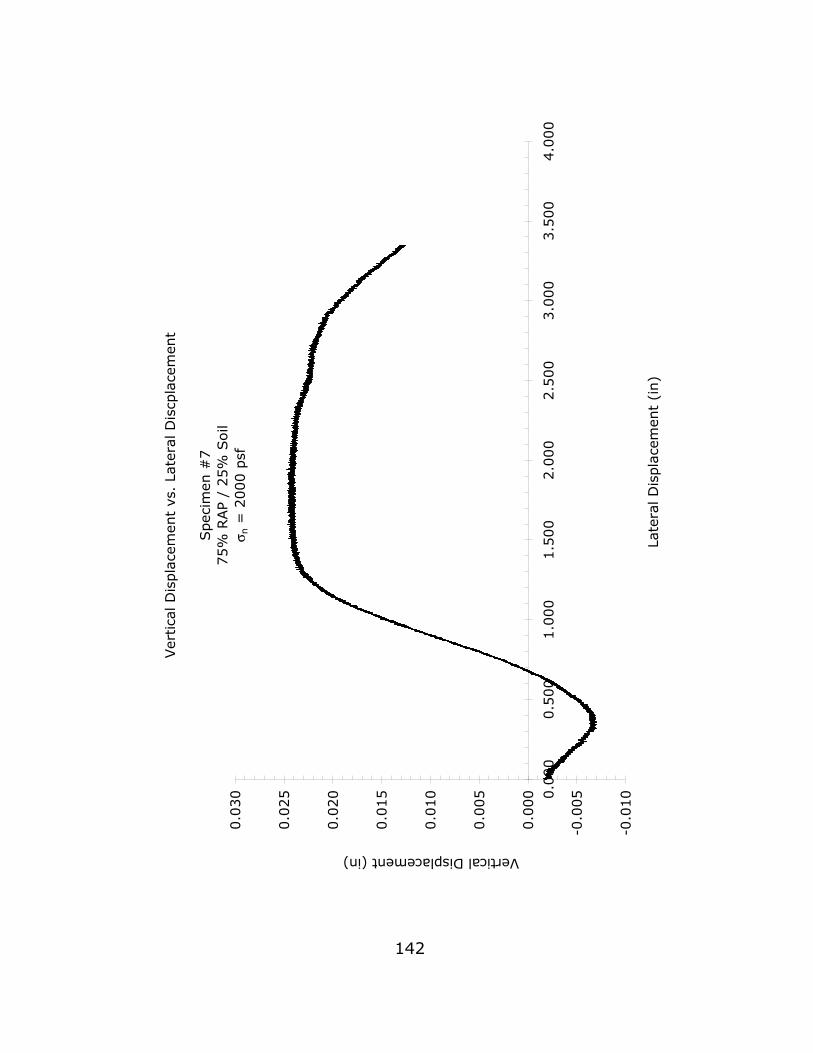
Ver
tica
l D
ispla
cem
ent
vs.
Late
ral D
iscp
lace
men
t
Spec
imen
#7
75%
RAP /
25%
Soil
σ n =
2000 p
sf
-0.0
10
-0.0
05
0.0
00
0.0
05
0.0
10
0.0
15
0.0
20
0.0
25
0.0
30 0.0
00
0.5
00
1.0
00
1.5
00
2.0
00
2.5
00
3.0
00
3.5
00
4.0
00
Late
ral D
ispla
cem
ent
(in)
Vertical Displacement (in)
142
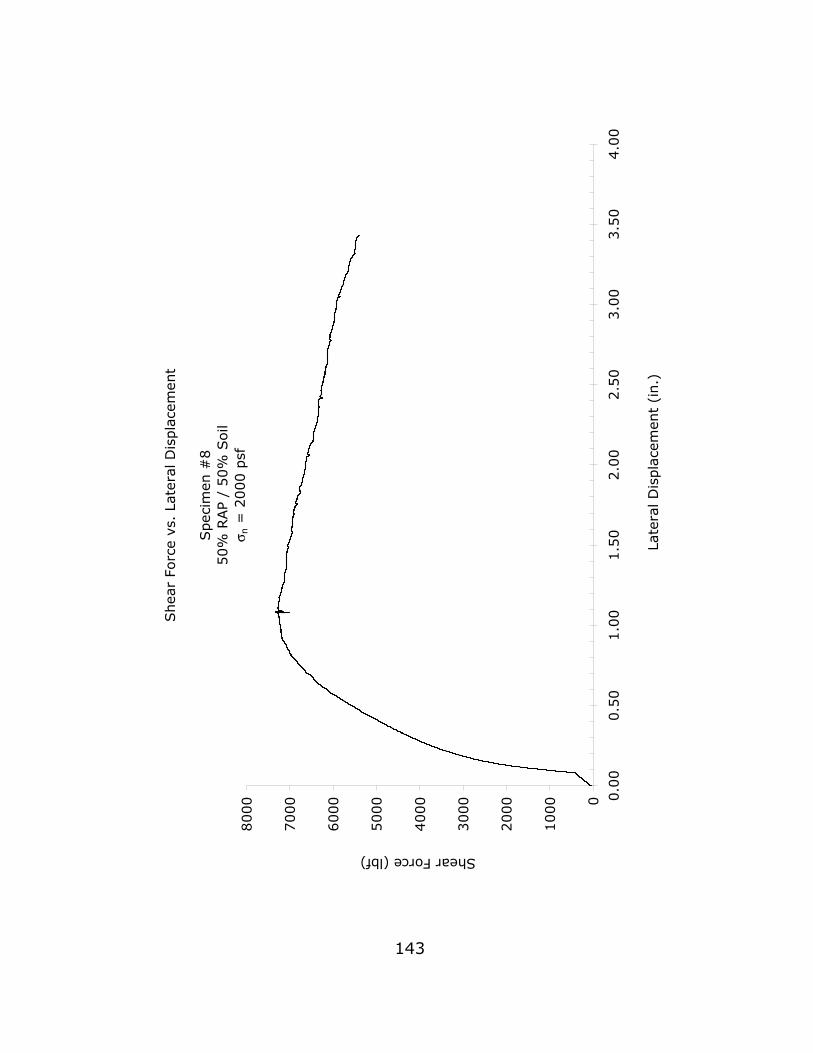
Shea
r Fo
rce
vs.
Late
ral D
ispla
cem
ent
Spec
imen
#8
50%
RAP /
50%
Soil
σ n =
2000 p
sf
0
1000
2000
3000
4000
5000
6000
7000
8000 0
.00
0.5
01.0
01.5
02.0
02.5
03.0
03.5
04.0
0
Late
ral D
ispla
cem
ent
(in.)
Shear Force (lbf)
143
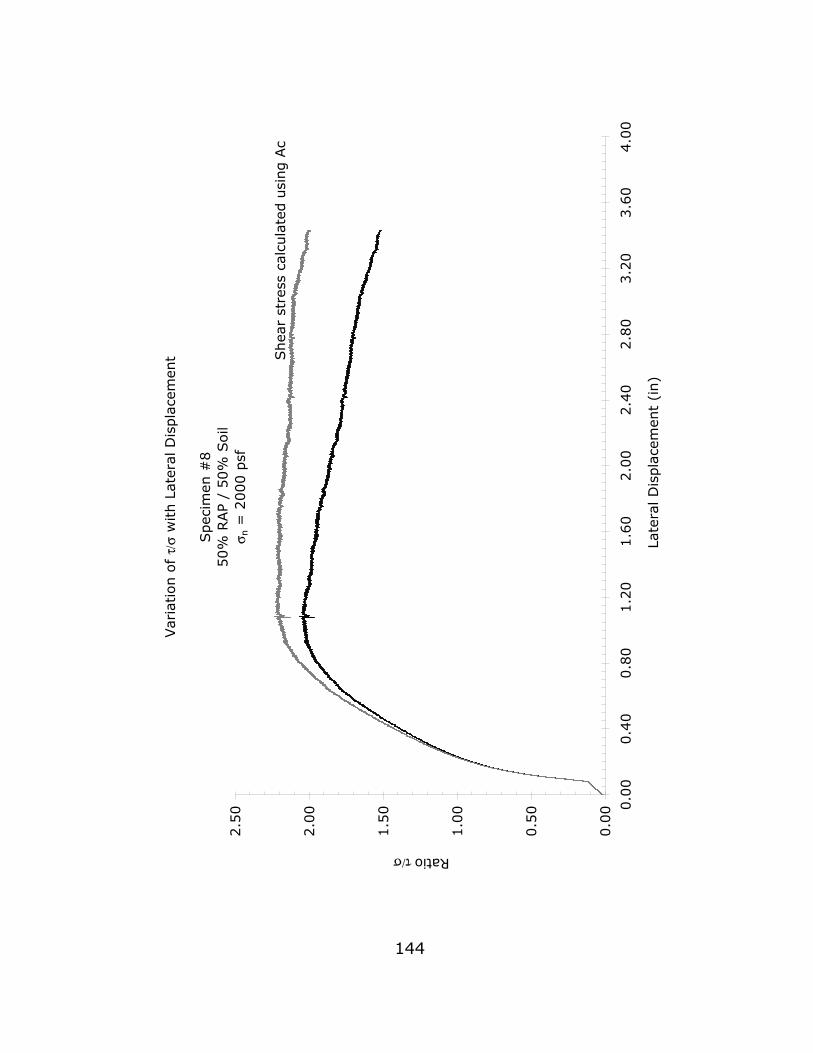
Var
iation o
f τ/
σ w
ith L
ater
al D
ispla
cem
ent
Spec
imen
#8
50%
RAP /
50%
Soil
σ n =
2000 p
sf
0.0
0
0.5
0
1.0
0
1.5
0
2.0
0
2.5
0 0.0
00.4
00.8
01.2
01.6
02.0
02.4
02.8
03.2
03.6
04.0
0
Late
ral D
ispla
cem
ent
(in)
Ratio τ/σ
Shea
r st
ress
cal
cula
ted u
sing A
c
144
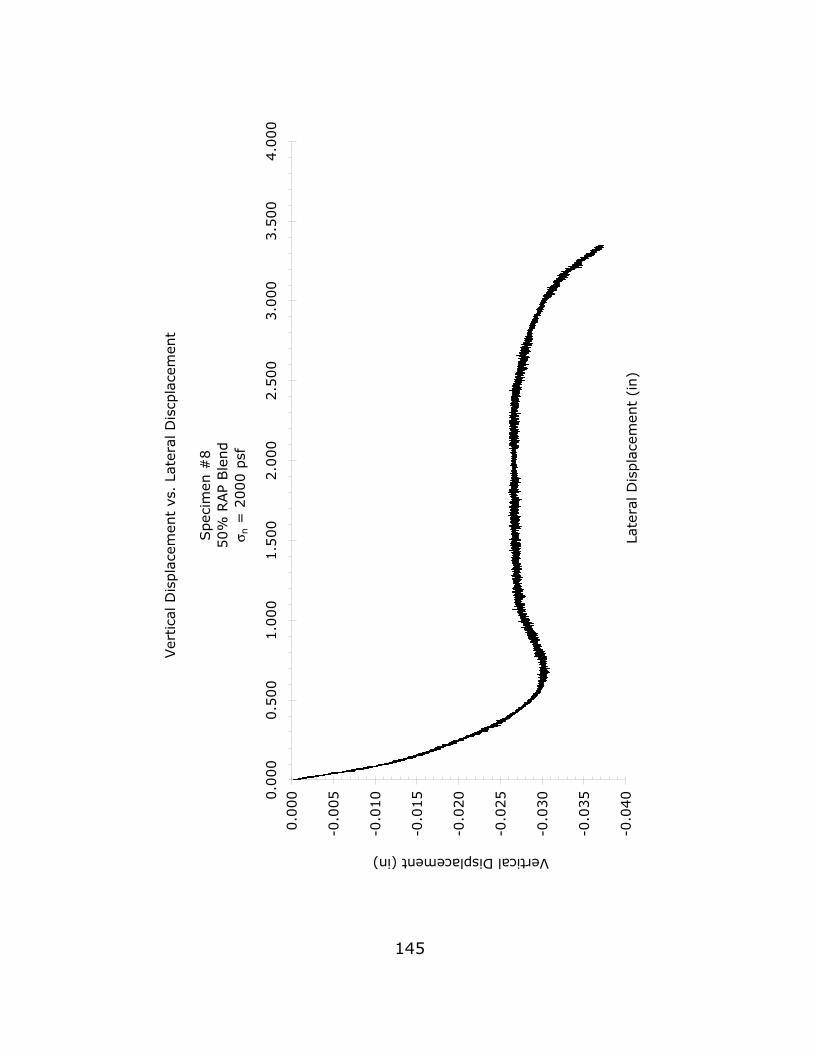
Ver
tica
l D
ispla
cem
ent
vs.
Late
ral D
iscp
lace
men
t
Spec
imen
#8
50%
RAP B
lend
σ n =
2000 p
sf
-0.0
40
-0.0
35
-0.0
30
-0.0
25
-0.0
20
-0.0
15
-0.0
10
-0.0
05
0.0
000.0
00
0.5
00
1.0
00
1.5
00
2.0
00
2.5
00
3.0
00
3.5
00
4.0
00
Late
ral D
ispla
cem
ent
(in)
Vertical Displacement (in)
145
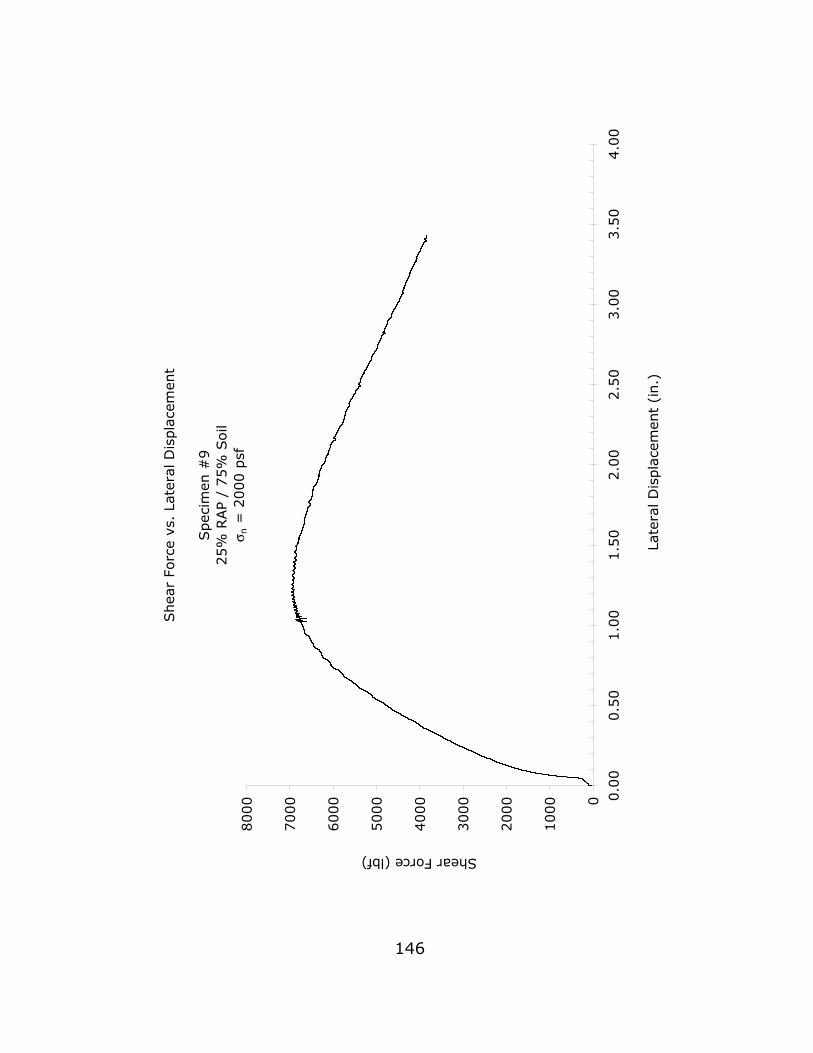
Shea
r Fo
rce
vs.
Late
ral D
ispla
cem
ent
Spec
imen
#9
25%
RAP
/ 75%
Soil
σ n =
2000 p
sf
0
1000
2000
3000
4000
5000
6000
7000
8000 0
.00
0.5
01.0
01.5
02.0
02.5
03.0
03.5
04.0
0
Late
ral D
ispla
cem
ent
(in.)
Shear Force (lbf)
146
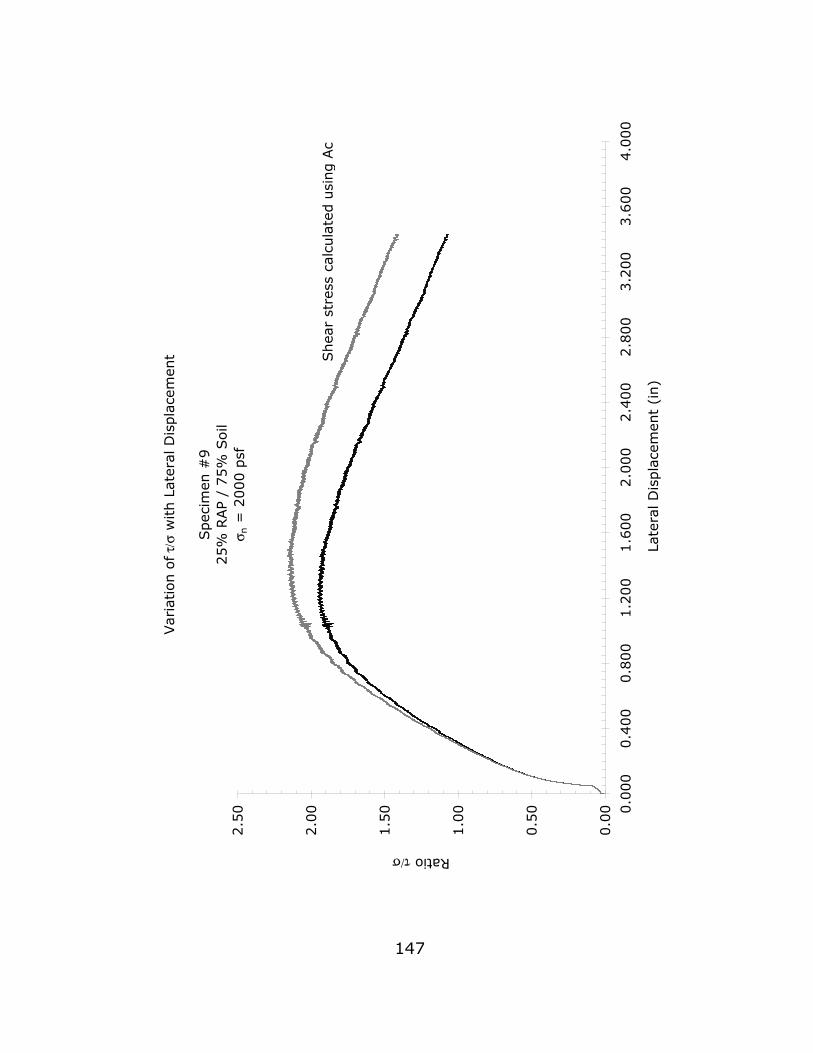
Var
iation o
f τ/σ
with L
ater
al D
ispla
cem
ent
Spec
imen
#9
25%
RAP
/ 75%
Soil
σ n =
2000 p
sf
0.0
0
0.5
0
1.0
0
1.5
0
2.0
0
2.5
0 0.0
00
0.4
00
0.8
00
1.2
00
1.6
00
2.0
00
2.4
00
2.8
00
3.2
00
3.6
00
4.0
00
Late
ral D
ispla
cem
ent
(in)
Ratio τ/σ
Shea
r st
ress
cal
cula
ted u
sing A
c
147
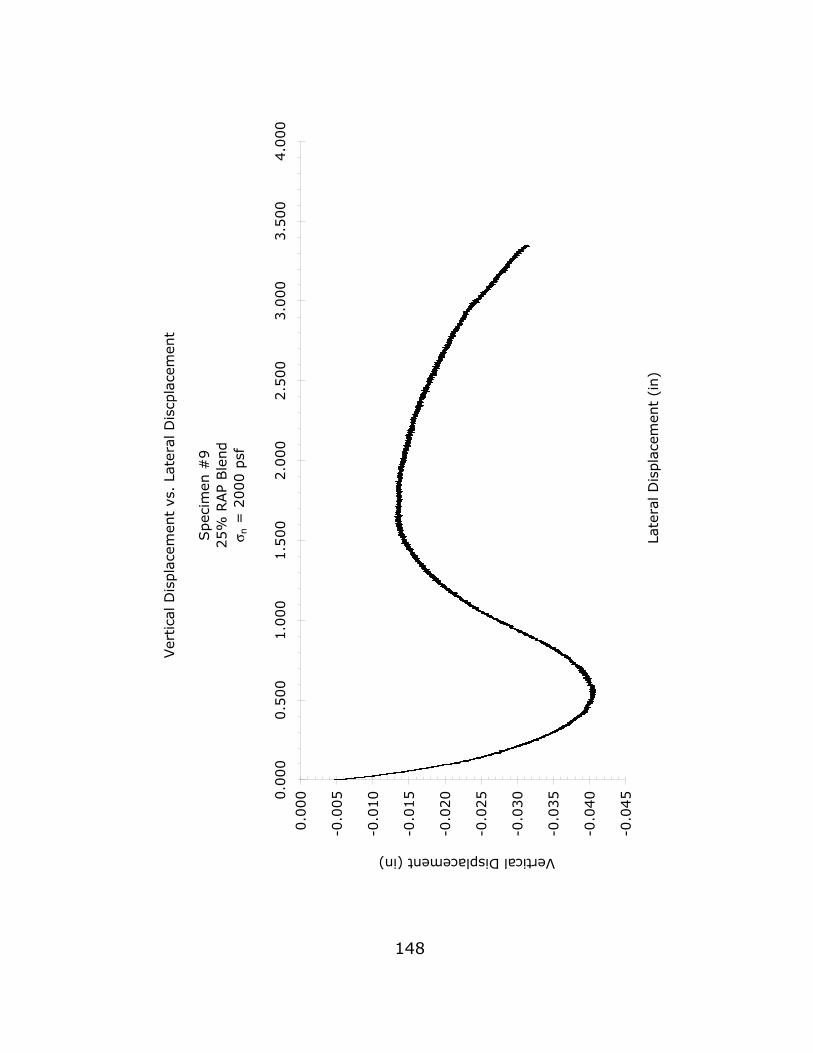
Ver
tica
l D
ispla
cem
ent
vs.
Late
ral D
iscp
lace
men
t
Spec
imen
#9
25%
RAP
Ble
nd
σ n =
2000 p
sf
-0.0
45
-0.0
40
-0.0
35
-0.0
30
-0.0
25
-0.0
20
-0.0
15
-0.0
10
-0.0
05
0.0
000.0
00
0.5
00
1.0
00
1.5
00
2.0
00
2.5
00
3.0
00
3.5
00
4.0
00
Late
ral D
ispla
cem
ent
(in)
Vertical Displacement (in)
148
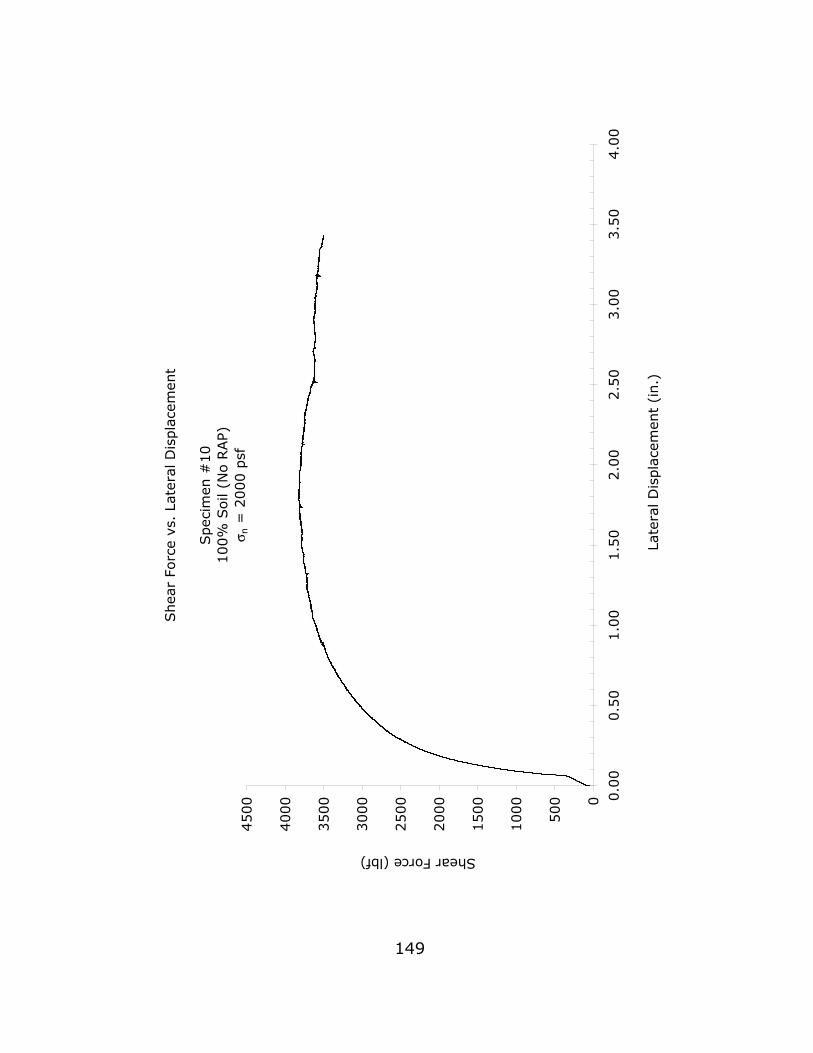
Shea
r Fo
rce
vs.
Late
ral D
ispla
cem
ent
Spec
imen
#10
100%
Soil
(No R
AP)
σ n =
2000 p
sf
0
500
1000
1500
2000
2500
3000
3500
4000
4500 0
.00
0.5
01.0
01.5
02.0
02.5
03.0
03.5
04.0
0
Late
ral D
ispla
cem
ent
(in.)
Shear Force (lbf)
149
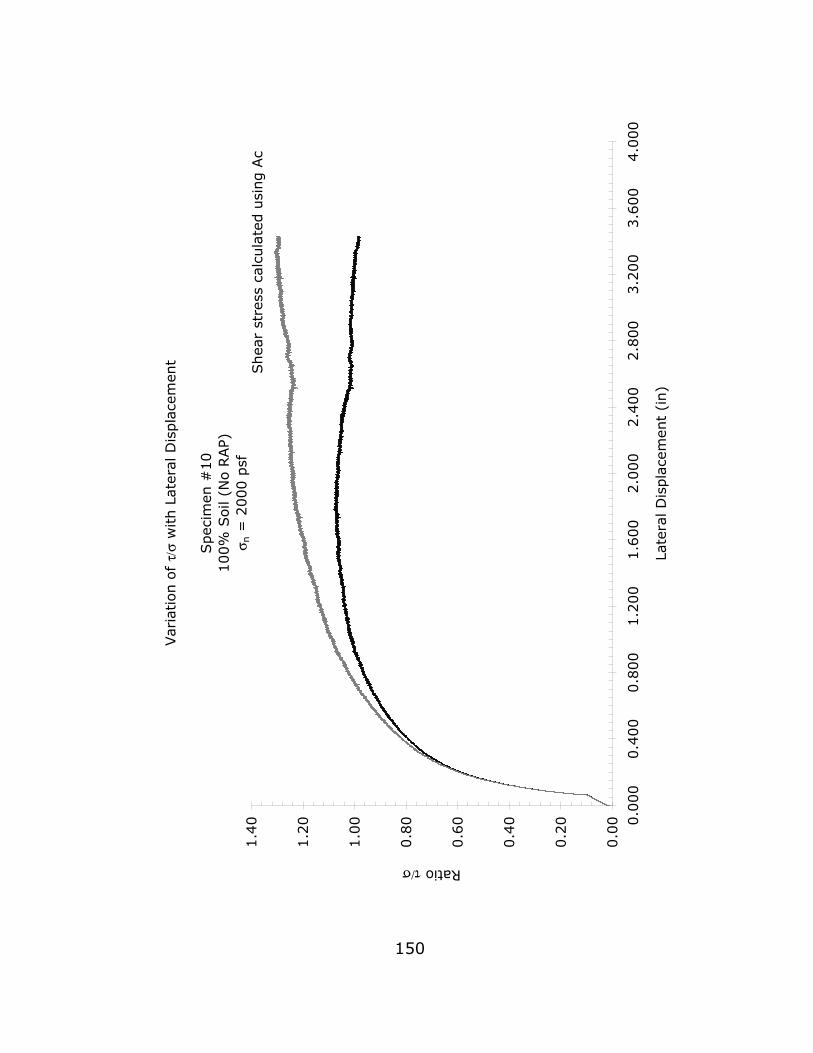
Var
iation o
f τ/
σ w
ith L
ater
al D
ispla
cem
ent
Spec
imen
#10
100%
Soil
(No R
AP)
σ n =
2000 p
sf
0.0
0
0.2
0
0.4
0
0.6
0
0.8
0
1.0
0
1.2
0
1.4
0 0.0
00
0.4
00
0.8
00
1.2
00
1.6
00
2.0
00
2.4
00
2.8
00
3.2
00
3.6
00
4.0
00
Late
ral D
ispla
cem
ent
(in)
Ratio τ/σ
Shea
r st
ress
cal
cula
ted u
sing A
c
150
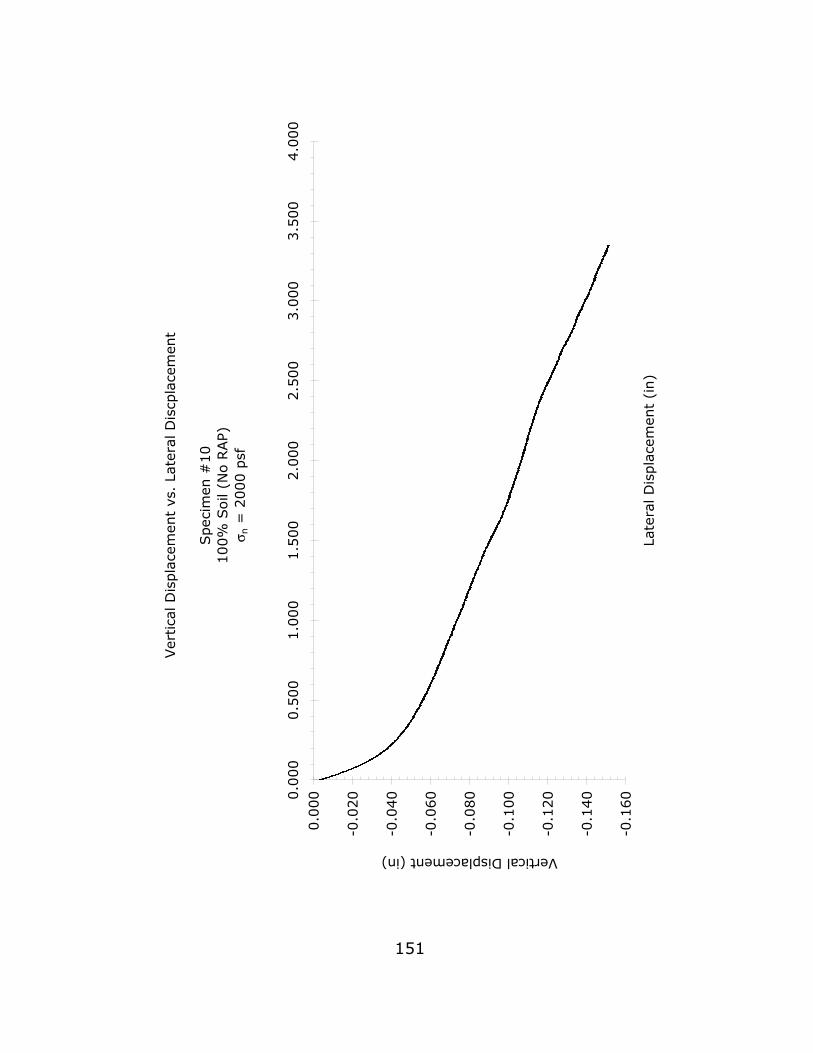
Ver
tica
l D
ispla
cem
ent
vs.
Late
ral D
iscp
lace
men
t
Spec
imen
#10
100%
Soil
(No R
AP)
σ n =
2000 p
sf
-0.1
60
-0.1
40
-0.1
20
-0.1
00
-0.0
80
-0.0
60
-0.0
40
-0.0
20
0.0
000.0
00
0.5
00
1.0
00
1.5
00
2.0
00
2.5
00
3.0
00
3.5
00
4.0
00
Late
ral D
ispla
cem
ent
(in)
Vertical Displacement (in)
151
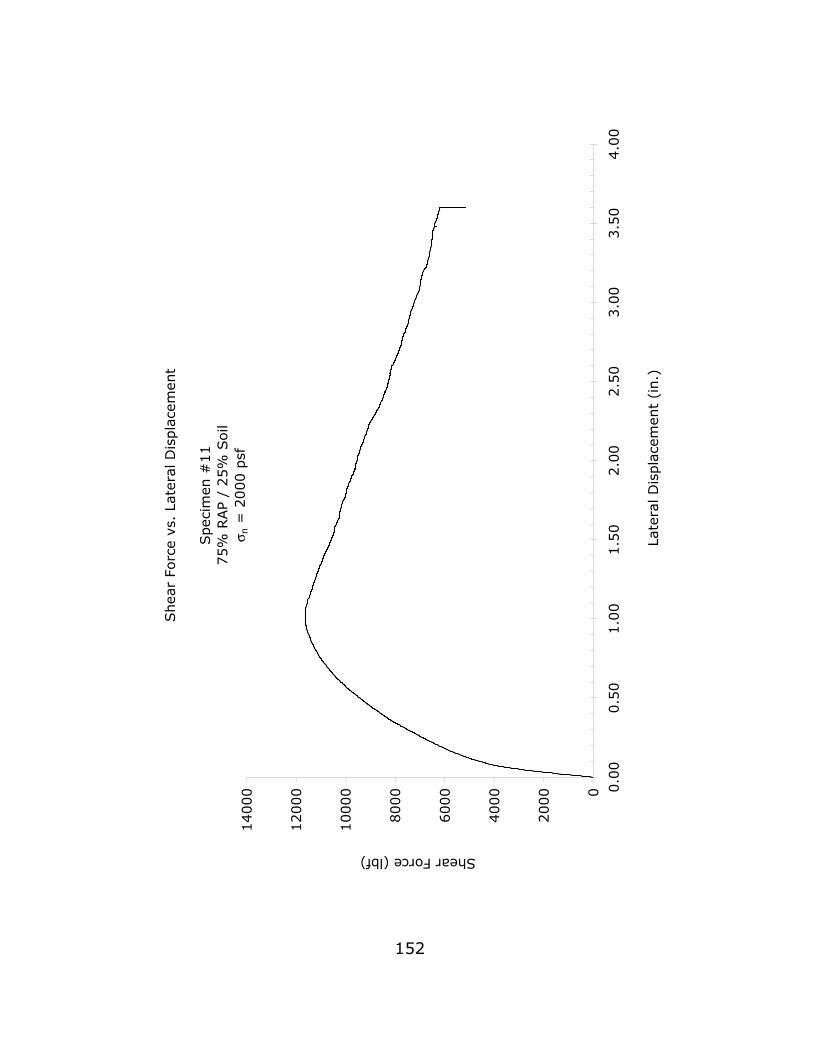
Shea
r Fo
rce
vs.
Late
ral D
ispla
cem
ent
Spec
imen
#11
75%
RAP /
25%
Soil
σ n =
2000 p
sf
0
2000
4000
6000
8000
10000
12000
14000 0
.00
0.5
01.0
01.5
02.0
02.5
03.0
03.5
04.0
0
Late
ral D
ispla
cem
ent
(in.)
Shear Force (lbf)
152
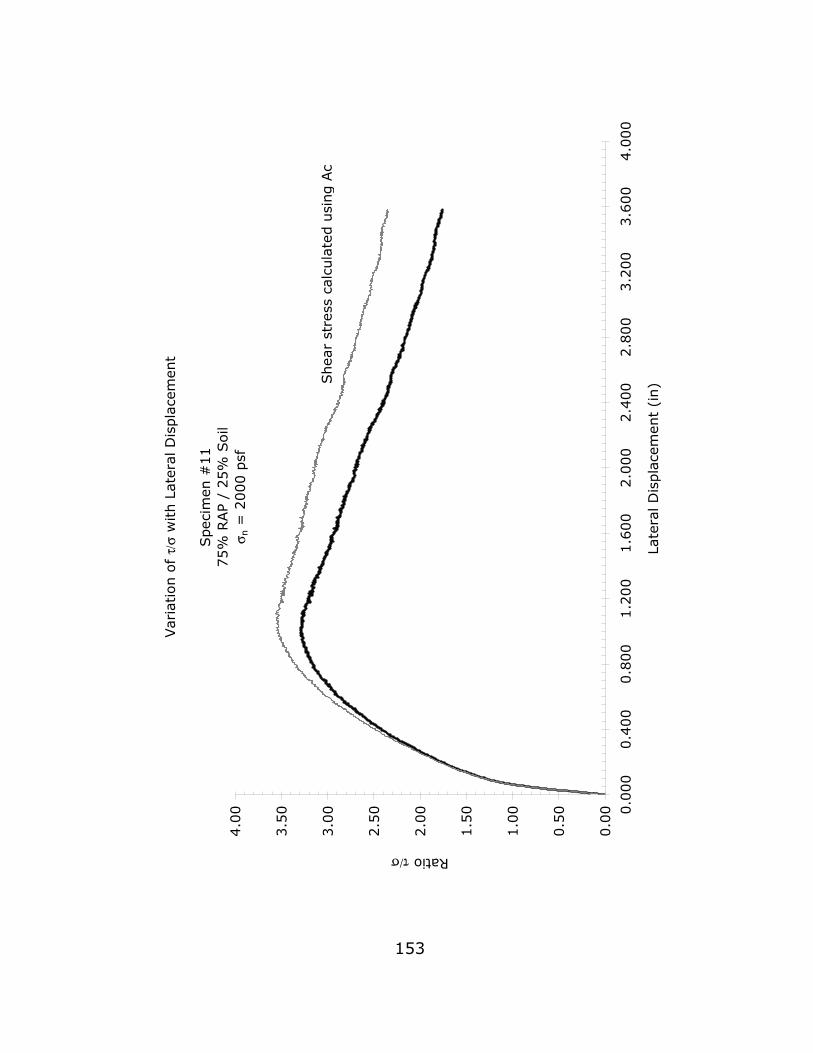
Var
iation o
f τ/
σ w
ith L
ater
al D
ispla
cem
ent
Spec
imen
#11
75%
RAP /
25%
Soil
σ n =
2000 p
sf
0.0
0
0.5
0
1.0
0
1.5
0
2.0
0
2.5
0
3.0
0
3.5
0
4.0
0 0.0
00
0.4
00
0.8
00
1.2
00
1.6
00
2.0
00
2.4
00
2.8
00
3.2
00
3.6
00
4.0
00
Late
ral D
ispla
cem
ent
(in)
Ratio τ/σ
Shea
r st
ress
cal
cula
ted u
sing A
c
153
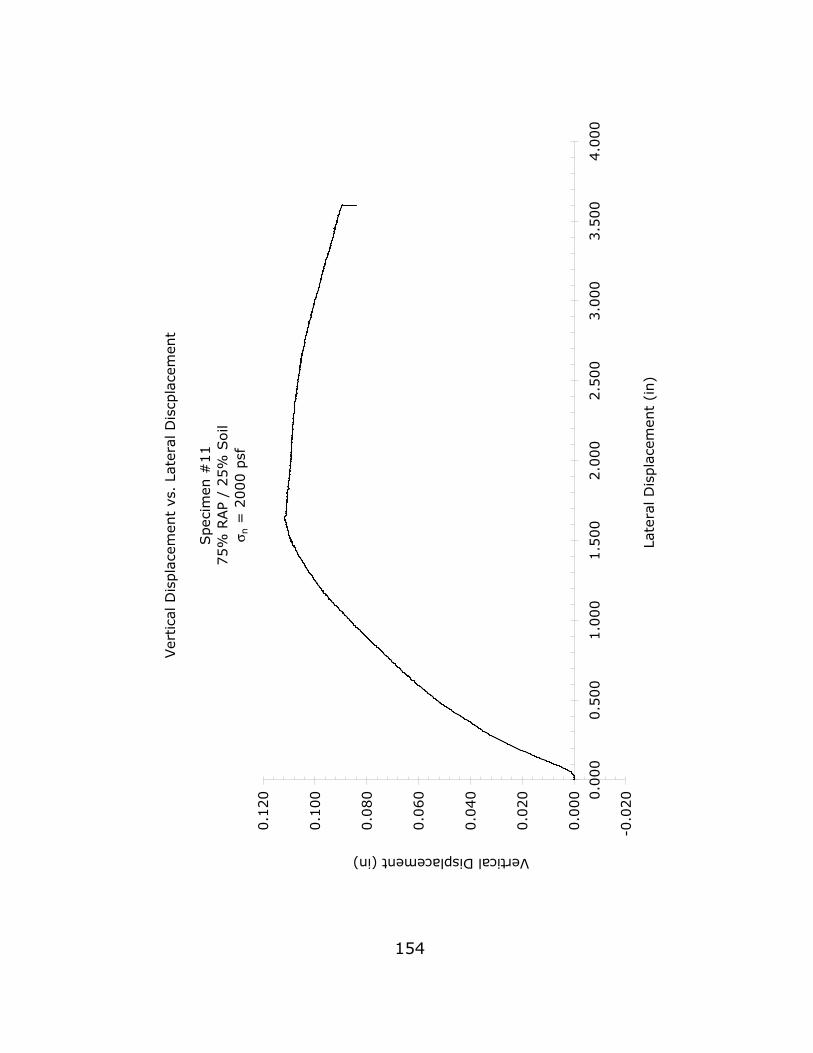
Ver
tica
l D
ispla
cem
ent
vs.
Late
ral D
iscp
lace
men
t
Spec
imen
#11
75%
RAP /
25%
Soil
σ n =
2000 p
sf
-0.0
20
0.0
00
0.0
20
0.0
40
0.0
60
0.0
80
0.1
00
0.1
20 0.0
00
0.5
00
1.0
00
1.5
00
2.0
00
2.5
00
3.0
00
3.5
00
4.0
00
Late
ral D
ispla
cem
ent
(in)
Vertical Displacement (in)
154
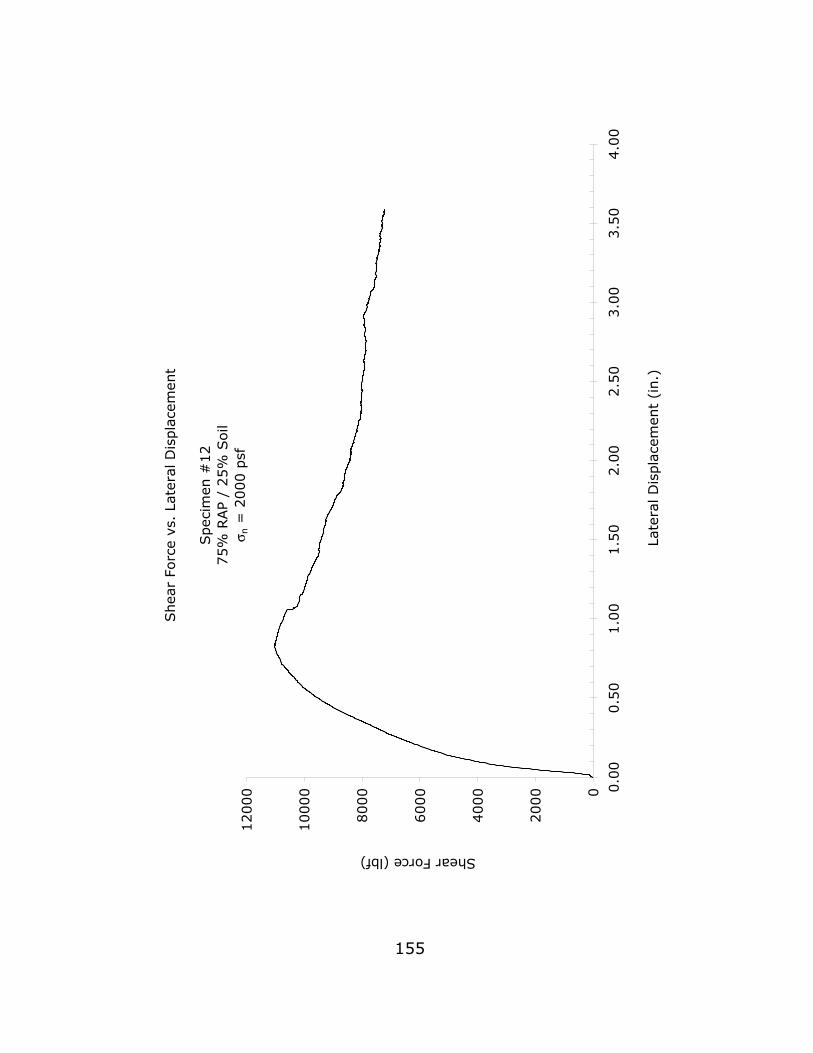
Shea
r Fo
rce
vs.
Late
ral D
ispla
cem
ent
Spec
imen
#12
75%
RAP /
25%
Soil
σ n =
2000 p
sf
0
2000
4000
6000
8000
10000
12000 0
.00
0.5
01.0
01.5
02.0
02.5
03.0
03.5
04.0
0
Late
ral D
ispla
cem
ent
(in.)
Shear Force (lbf)
155
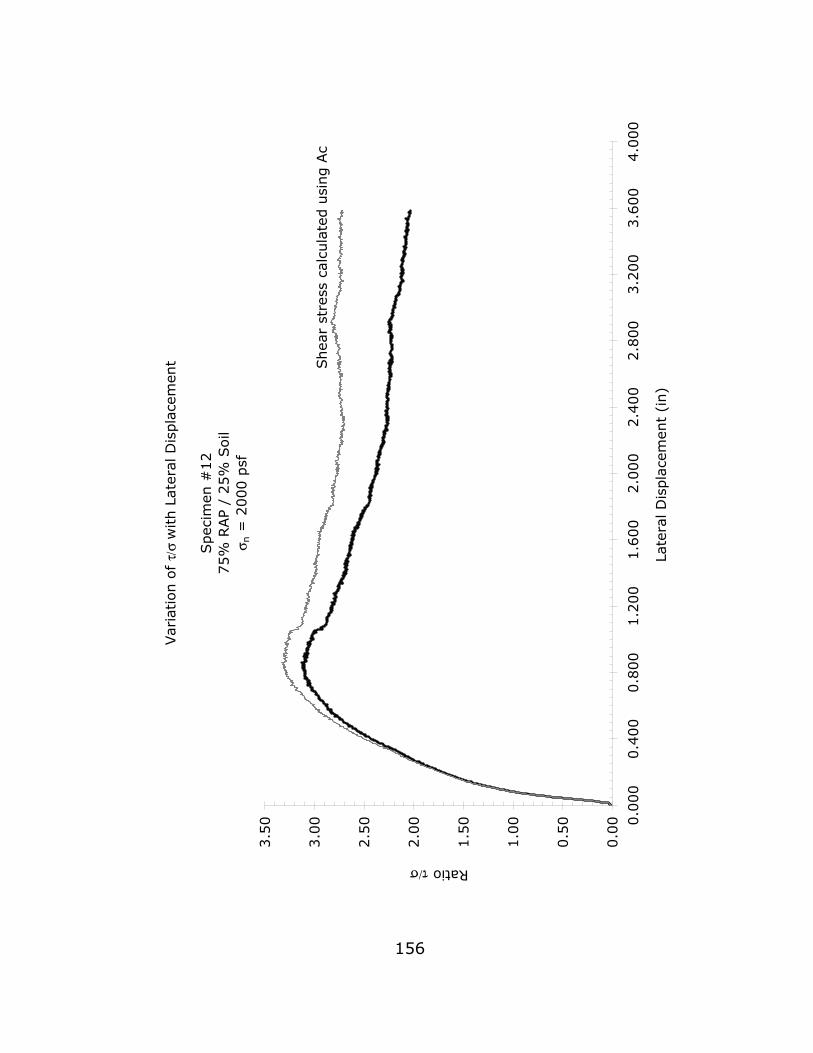
Var
iation o
f τ/
σ w
ith L
ate
ral D
ispla
cem
ent
Spec
imen
#12
75%
RAP
/ 25%
Soil
σ n =
2000 p
sf
0.0
0
0.5
0
1.0
0
1.5
0
2.0
0
2.5
0
3.0
0
3.5
0 0.0
00
0.4
00
0.8
00
1.2
00
1.6
00
2.0
00
2.4
00
2.8
00
3.2
00
3.6
00
4.0
00
Late
ral D
ispla
cem
ent
(in)
Ratio τ/σ
Shea
r st
ress
cal
cula
ted u
sing A
c
156
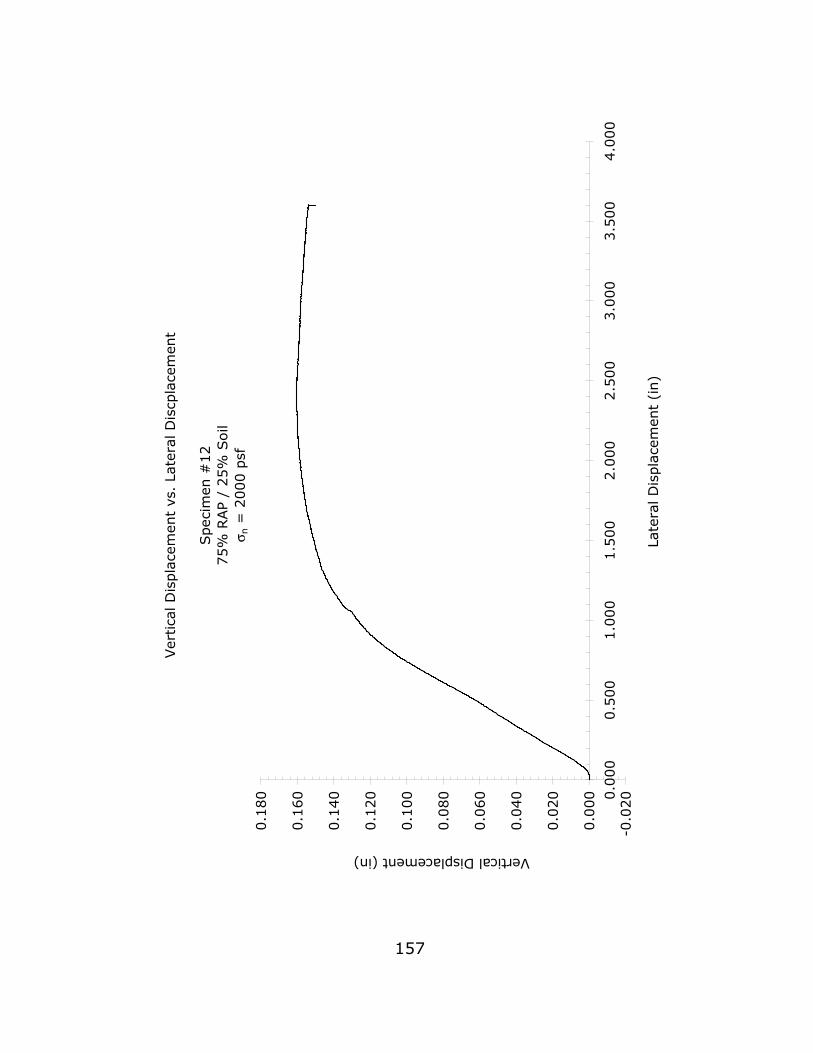
Ver
tica
l D
ispla
cem
ent
vs.
Late
ral D
iscp
lace
men
t
Spec
imen
#12
75%
RAP /
25%
Soil
σ n =
2000 p
sf
-0.0
20
0.0
00
0.0
20
0.0
40
0.0
60
0.0
80
0.1
00
0.1
20
0.1
40
0.1
60
0.1
80 0.0
00
0.5
00
1.0
00
1.5
00
2.0
00
2.5
00
3.0
00
3.5
00
4.0
00
Late
ral D
ispla
cem
ent
(in)
Vertical Displacement (in)
157
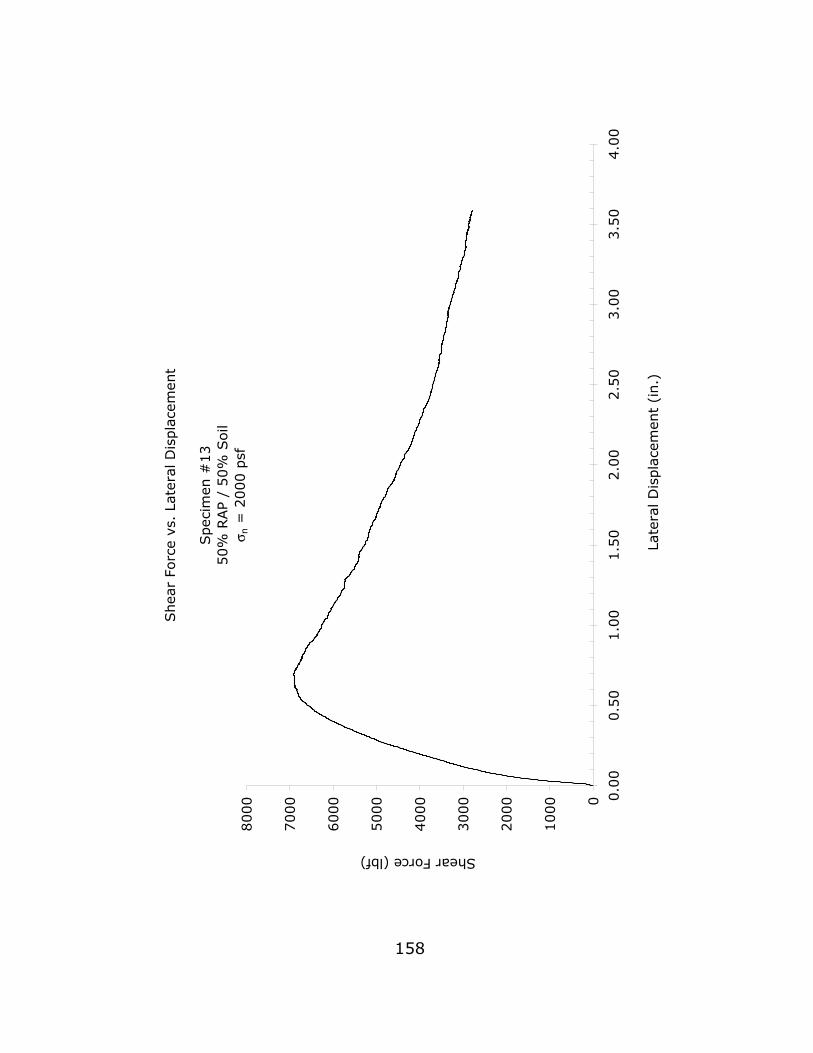
Shea
r Fo
rce
vs.
Late
ral D
ispla
cem
ent
Spec
imen
#13
50%
RAP /
50%
Soil
σ n =
2000 p
sf
0
1000
2000
3000
4000
5000
6000
7000
8000 0
.00
0.5
01.0
01.5
02.0
02.5
03.0
03.5
04.0
0
Late
ral D
ispla
cem
ent
(in.)
Shear Force (lbf)
158
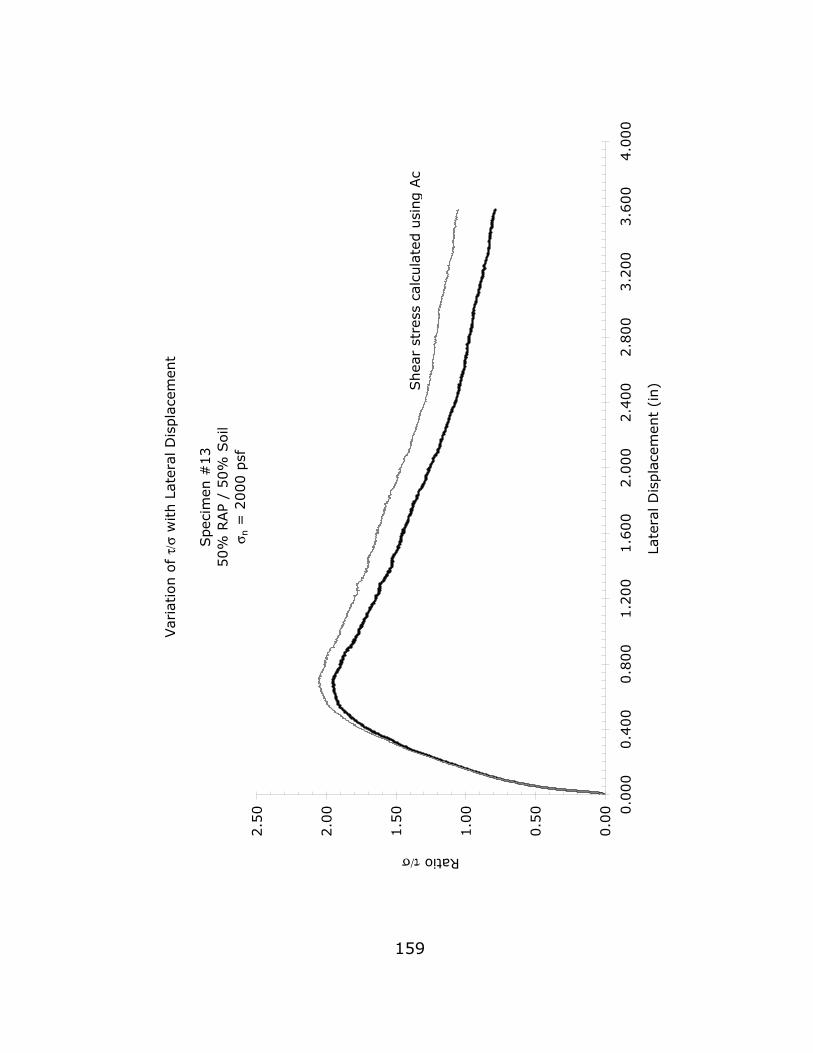
Var
iation o
f τ/
σ w
ith L
ater
al D
ispla
cem
ent
Spec
imen
#13
50%
RAP /
50%
Soil
σ n =
2000 p
sf
0.0
0
0.5
0
1.0
0
1.5
0
2.0
0
2.5
0 0.0
00
0.4
00
0.8
00
1.2
00
1.6
00
2.0
00
2.4
00
2.8
00
3.2
00
3.6
00
4.0
00
Late
ral D
ispla
cem
ent
(in)
Ratio τ/σ
Shea
r st
ress
cal
cula
ted u
sing A
c
159
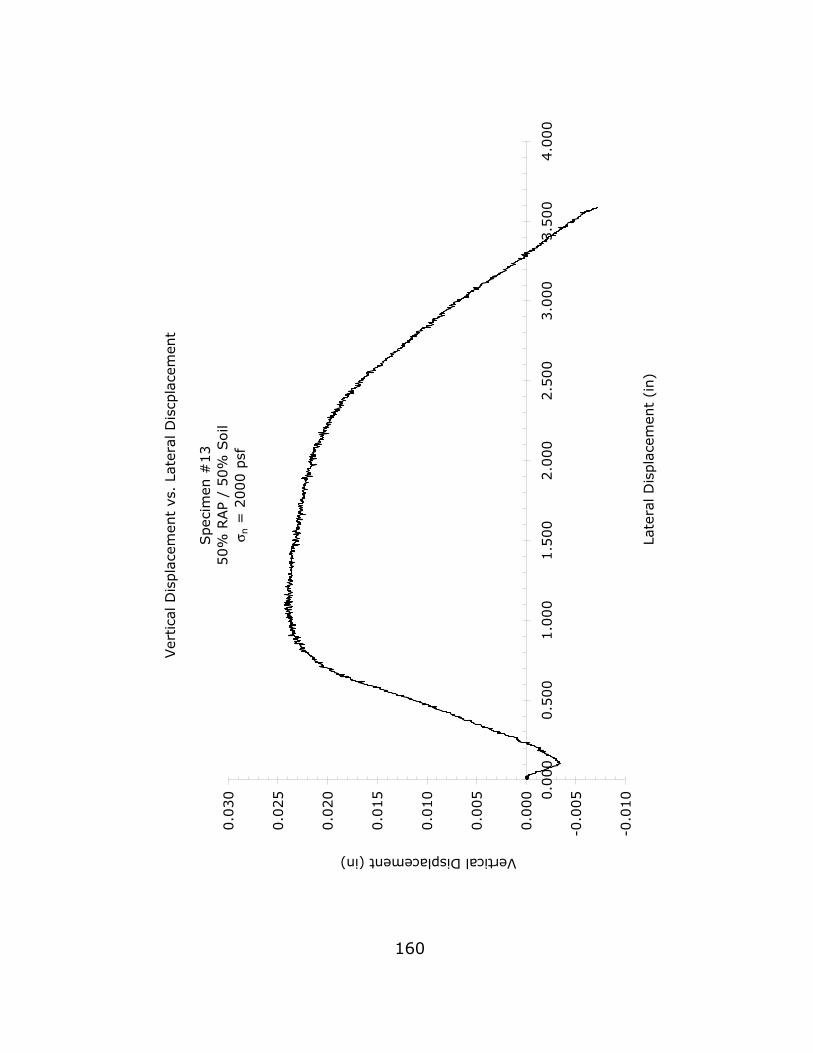
Ver
tica
l D
ispla
cem
ent
vs.
Late
ral D
iscp
lace
men
t
Spec
imen
#13
50%
RAP /
50%
Soil
σ n =
2000 p
sf
-0.0
10
-0.0
05
0.0
00
0.0
05
0.0
10
0.0
15
0.0
20
0.0
25
0.0
30 0.0
00
0.5
00
1.0
00
1.5
00
2.0
00
2.5
00
3.0
00
3.5
00
4.0
00
Late
ral D
ispla
cem
ent
(in)
Vertical Displacement (in)
160