Embed Size (px)
Citation preview
Creep behavior of geosynthetics using confined-accelerated tests
F. A. N. Franca1 and B. S. Bueno2
1Graduate student, Laboratory of Geosynthetics, Geotechnical Engineering Department, School of
Engineering of University of Sao Paulo at Sao Carlos, University of Sao Paulo, Sao Carlos, Sao Paulo,
13.566-536, Brazil, Telephone: +55 16 3373 9501, Telefax: +55 16 3373–9509, E-mail:
[email protected], Laboratory of Geosynthetics, Geotechnical Engineering Department, School of Engineering
of University of Sao Paulo at Sao Carlos, University of Sao Paulo, Sao Carlos, Sao Paulo, 13.566-536,
Brazil, Telephone: +55 16 3373 9501, Telefax: +55 16 3373 9509, E-mail: [email protected]
Received 7 January 2010, revised 2 December 2010, accepted 22 June 2011
ABSTRACT: The creep behavior of geosynthetics has commonly been determined using
standardized creep tests, which are time consuming and very expensive. In addition, these tests
involve the use of in-isolation specimens. Thus they are not likely to consider the overall effect of
soil confinement. Confined creep tests conducted at elevated temperature can be used to address
these negative aspects of standardized creep tests. This paper presents a pioneering laboratory
apparatus developed in order to conduct confined, accelerated and confined-accelerated creep tests.
In addition, preliminary tests were performed to assess the new equipment’s capability of
conducting confined and accelerated creep tests. These tests were performed using a biaxial
geogrid, a woven geotextile, and a nonwoven geotextile. The new equipment allowed different
conditions to be reproduced. The creep behavior of the nonwoven geotextile and the geogrid was
found to be very sensitive to soil confinement. On the other hand, the woven geotextile presented
a creep behavior independent of soil confinement. The geogrid results did not agree with reports in
the technical literature. Accordingly, these results showed the importance of characterizing the
effect of soil confinement in geosynthetics creep behavior. Additionally, these preliminary results
showed the potential of the new device to overcome the main negative aspects of standardized
creep tests on geosynthetics.
KEYWORDS: Geosynthetics, Creep behavior, Soil confinement, Elevated temperature
REFERENCE: Franca, F. A. N. & Bueno, B. S. (2011). Creep behavior of geosynthetics using confined-
accelerated tests. Geosynthetics International, 18, No. 5, 242–254. [http://dx.doi.org/10.1680/
gein.2011.18.5.242]
1. INTRODUCTION
Creep behavior plays an important role in geosynthetic-
reinforced soil (GRS) structures, because it reduces the
design short-term tensile strength of the reinforcement. In
addition, creep strains obtained in laboratory tests may
also be used to evaluate the behavior of GRS structures
prior to their construction. These laboratory tests have
commonly been used to determine the creep behavior of
geosynthetics. They are conducted at standard values of
temperature and relative humidity using in-isolation speci-
mens. Furthermore, the recommended test duration may
reach up to 10 000 h (e.g. ASTM D 5262, ISO/TR 20432
(ISO 2007)). Consequently, the full determination of
geosynthetics creep behavior is both time consuming and
very expensive. Moreover, these tests do not consider the
possibly significant effect of soil confinement on the
stress–strain behavior of geosynthetics, as in-isolation
specimens are used. Thus in-isolation creep tests may lead
to conservative results, which increase construction costs.
In order to overcome these drawbacks, many studies
have suggested different approaches to evaluate geosyn-
thetics creep behavior. Creep tests conducted at elevated
temperature may be used to reduce the test duration. In
addition, they may be performed under soil confinement,
in order to consider its effect on specimens’ creep behav-
ior. Both improvements in geosynthetics creep tests—soil
confinement and heating—are quite simple to implement
when they are considered by themselves. As presented in
the next section, several researchers have published results
obtained from improved test arrangements, which were
able to consider each of these effects one at a time.
Geosynthetics International, 2011, 18, No. 5
2421072-6349 # 2011 Thomas Telford Ltd
This paper presents a pioneering piece of equipment
that allows confined-accelerated creep tests to be con-
ducted. In addition, preliminary results obtained using
three different geosynthetics and four different types of
creep tests (conventional, confined, accelerated, and
confined-accelerated) are shown. The new creep-testing
equipment was developed in the Laboratory of Geosyn-
thetics of the School of Engineering of the University of
Sao Paulo at Sao Carlos, in Brazil. Further analyses, such
as time–temperature superposition plots, are not discussed
in this paper. Additional tests are planned, and the
analyses of their results will contribute to understanding
of the creep behavior of the material used so far in this
research.
2. THEORETICAL REVIEW OFGEOSYNTHETICS CREEP BEHAVIOR
Creep behavior refers to time-dependent deformations that
any material is subjected to under a constant load.
Polymers may present significant creep deformations,
owing to their molecular structure. Also, the creep behav-
ior of geosynthetics is one of the most important proper-
ties in the design of GRS structures. Therefore their long-
term performance should be determined (Koerner 2005) in
order to provide reliable design parameters.
Creep deformations in geosynthetics are commonly
associated with both the macro- and microstructure of
geosynthetics. Bueno et al. (2005) illustrated this by
discussing the creep behavior of nonwoven geotextiles.
These authors defined the intrinsic creep behavior, which
is related to elongation of polymeric fibers, and the
structural creep behavior, which is associated with the
slippage between geosynthetic fibers.
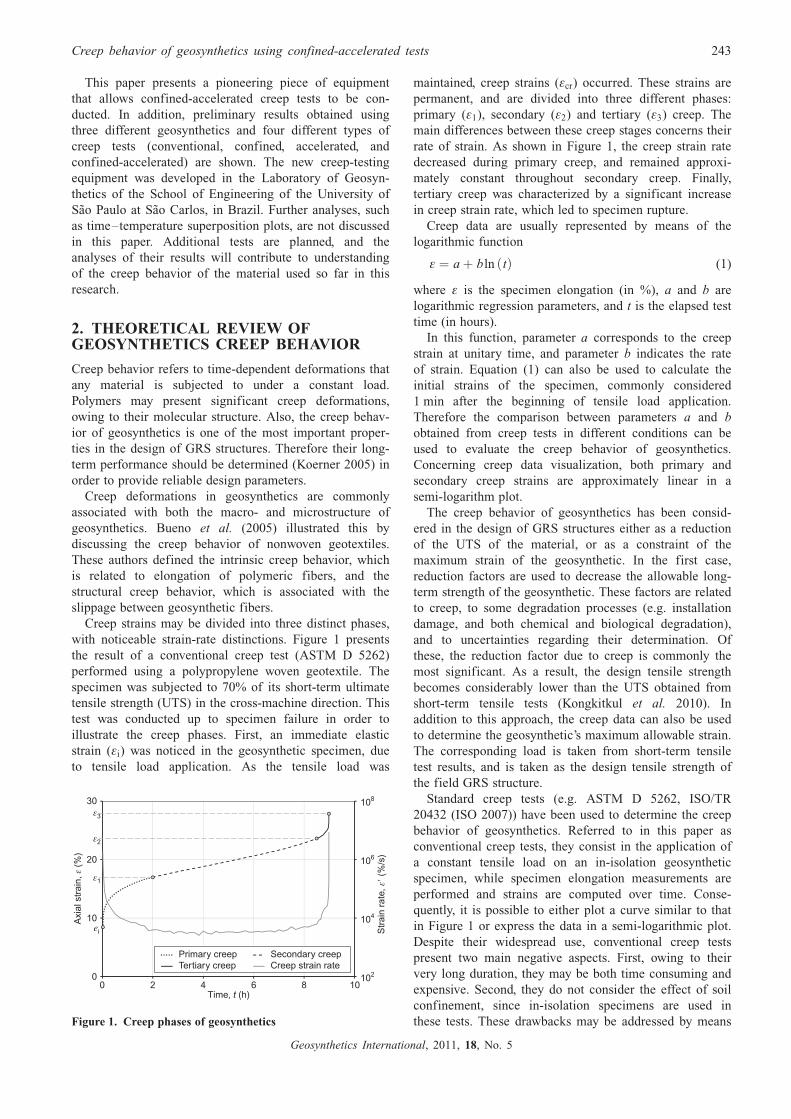
Creep strains may be divided into three distinct phases,
with noticeable strain-rate distinctions. Figure 1 presents
the result of a conventional creep test (ASTM D 5262)
performed using a polypropylene woven geotextile. The
specimen was subjected to 70% of its short-term ultimate
tensile strength (UTS) in the cross-machine direction. This
test was conducted up to specimen failure in order to
illustrate the creep phases. First, an immediate elastic
strain (�i) was noticed in the geosynthetic specimen, due
to tensile load application. As the tensile load was
maintained, creep strains (�cr) occurred. These strains are
permanent, and are divided into three different phases:
primary (�1), secondary (�2) and tertiary (�3) creep. The
main differences between these creep stages concerns their
rate of strain. As shown in Figure 1, the creep strain rate
decreased during primary creep, and remained approxi-
mately constant throughout secondary creep. Finally,
tertiary creep was characterized by a significant increase
in creep strain rate, which led to specimen rupture.
Creep data are usually represented by means of the
logarithmic function
� ¼ aþ bln tð Þ (1)
where � is the specimen elongation (in %), a and b are
logarithmic regression parameters, and t is the elapsed test
time (in hours).
In this function, parameter a corresponds to the creep
strain at unitary time, and parameter b indicates the rate
of strain. Equation (1) can also be used to calculate the
initial strains of the specimen, commonly considered
1 min after the beginning of tensile load application.
Therefore the comparison between parameters a and b
obtained from creep tests in different conditions can be
used to evaluate the creep behavior of geosynthetics.
Concerning creep data visualization, both primary and
secondary creep strains are approximately linear in a
semi-logarithm plot.
The creep behavior of geosynthetics has been consid-
ered in the design of GRS structures either as a reduction
of the UTS of the material, or as a constraint of the
maximum strain of the geosynthetic. In the first case,
reduction factors are used to decrease the allowable long-
term strength of the geosynthetic. These factors are related
to creep, to some degradation processes (e.g. installation
damage, and both chemical and biological degradation),
and to uncertainties regarding their determination. Of
these, the reduction factor due to creep is commonly the
most significant. As a result, the design tensile strength
becomes considerably lower than the UTS obtained from
short-term tensile tests (Kongkitkul et al. 2010). In
addition to this approach, the creep data can also be used
to determine the geosynthetic’s maximum allowable strain.
The corresponding load is taken from short-term tensile
test results, and is taken as the design tensile strength of
the field GRS structure.
Standard creep tests (e.g. ASTM D 5262, ISO/TR
20432 (ISO 2007)) have been used to determine the creep
behavior of geosynthetics. Referred to in this paper as
conventional creep tests, they consist in the application of
a constant tensile load on an in-isolation geosynthetic
specimen, while specimen elongation measurements are
performed and strains are computed over time. Conse-
quently, it is possible to either plot a curve similar to that
in Figure 1 or express the data in a semi-logarithmic plot.
Despite their widespread use, conventional creep tests
present two main negative aspects. First, owing to their
very long duration, they may be both time consuming and
expensive. Second, they do not consider the effect of soil
confinement, since in-isolation specimens are used in
these tests. These drawbacks may be addressed by means
102
104
106
108
0
10
20
30
0 2 4 6 8 10
Str
ain
rate
,(%
/s)
ε�
Axi
al s
trai
n,(%
)ε
Time, (h)t
Primary creep Secondary creepTertiary creep Creep strain rate
ε1
ei
ε2
ε3
Figure 1. Creep phases of geosynthetics
Creep behavior of geosynthetics using confined-accelerated tests 243
Geosynthetics International, 2011, 18, No. 5
of two main approaches: tests performed at elevated
temperature and under soil confinement, respectively.
Conventional creep tests can be performed at elevated
temperature in order to expedite the characterization of
creep behavior (Bueno et al. 2005). Thus several conven-
tional creep tests may be conducted at the same load
level, but at different temperatures. Subsequently, time-
temperature superposition (TTS) techniques are used to
interpret their results: that is, creep strains recorded at
elevated temperature can be interpreted as creep strains at
reference temperature on a different timescale. This
improves the prediction of geosynthetics’ long-term creep
behavior at ambient temperature. Several successful re-
searches have been conducted concerning the acceleration
of geosynthetics’ creep response by means of elevated
temperature tests (Jeon et al. 2002; Zornberg et al. 2004;
Bueno et al. 2005; Jones and Clarke 2007; Tong et al.
2008; Yeo and Hsuan 2008). This issue is already well
established in the technical literature, and its discussion is
not within the scope of this paper. In addition, ASTM D
6992 presents the stepped isothermal method (SIM), ini-
tially developed by Thornton et al. (1998). In this ap-
proach, the creep behavior of geosynthetics is evaluated
by tests conducted with temperature increments in one
single specimen. Thus the material variability does not
interfere in the analysis of the results.
In some cases, geosynthetic stress–strain behavior is
strongly dependent on soil confinement. FHWA (1998)
suggest three mechanisms of soil–geosynthetic interaction
that may cause this. First, the internal friction between
fibers and yarns is restrained under soil confinement.
Second, the basic components of a geosynthetic specimen
may present themselves as tortuous, and soil confinement
may constrain alignment of these curved elements. Finally,
soil penetration into openings or apertures in a geosyn-
thetic may reduce the reorientation of fibers and yarns.
Regarding these assumptions, the stress–strain behavior of
nonwoven geotextiles is considered to be the most affected
by soil confinement, followed by that of woven geotextiles
and geogrids. Even though Boyle et al. (1996) found
woven geotextiles’ stress–strain behavior to be completely
independent of soil confinement, FHWA (1998) showed
some results where woven geotextile stress–strain behav-
ior was affected by soil confinement. Based on such
discrepancies, FHWA (1998) suggest that each geosyn-
thetic should be characterized regarding its confined
stress–strain behavior.
Similarly to short-term stress–strain behavior, the creep
behavior of geosynthetics may also be affected by soil
confinement. Thus, in order to overcome the second
negative aspect of conventional creep tests, they may be
performed with in-soil specimens. Tests conducted with
this approach are more likely to consider the overall effect
of soil confinement in the creep response of geosynthetics.
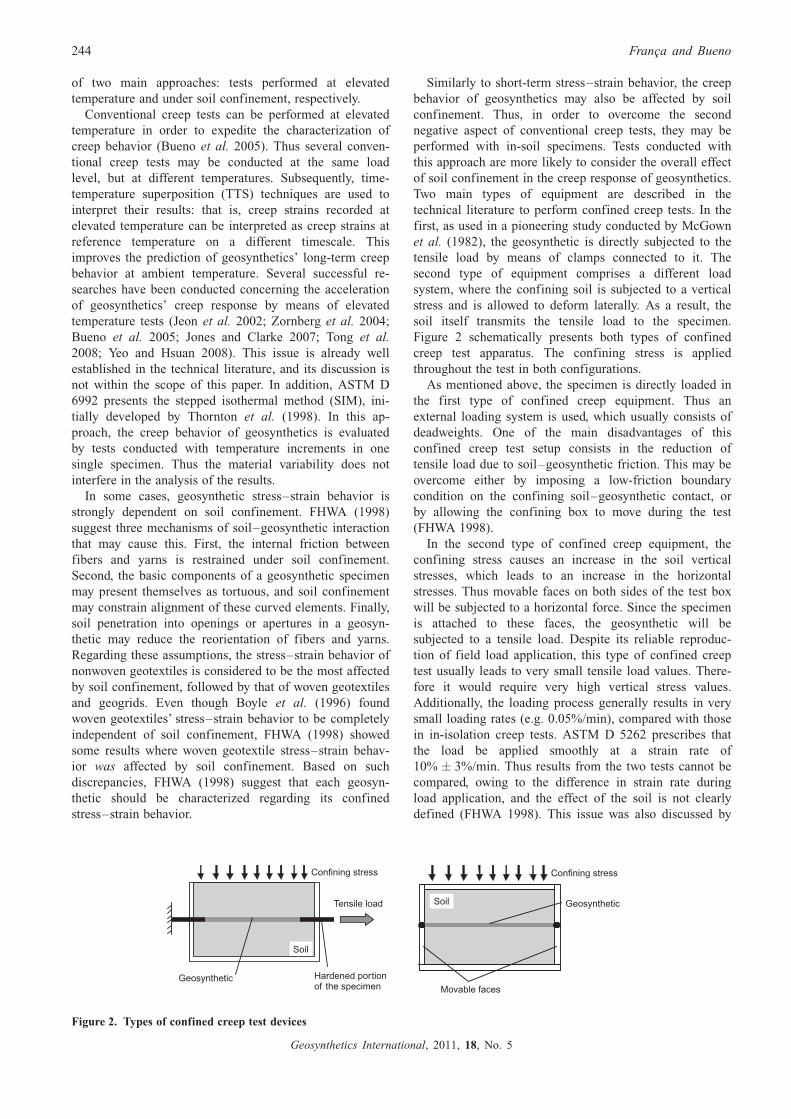
Two main types of equipment are described in the
technical literature to perform confined creep tests. In the
first, as used in a pioneering study conducted by McGown
et al. (1982), the geosynthetic is directly subjected to the
tensile load by means of clamps connected to it. The
second type of equipment comprises a different load
system, where the confining soil is subjected to a vertical
stress and is allowed to deform laterally. As a result, the
soil itself transmits the tensile load to the specimen.
Figure 2 schematically presents both types of confined
creep test apparatus. The confining stress is applied
throughout the test in both configurations.
As mentioned above, the specimen is directly loaded in
the first type of confined creep equipment. Thus an
external loading system is used, which usually consists of
deadweights. One of the main disadvantages of this
confined creep test setup consists in the reduction of
tensile load due to soil–geosynthetic friction. This may be
overcome either by imposing a low-friction boundary
condition on the confining soil–geosynthetic contact, or
by allowing the confining box to move during the test
(FHWA 1998).
In the second type of confined creep equipment, the
confining stress causes an increase in the soil vertical
stresses, which leads to an increase in the horizontal
stresses. Thus movable faces on both sides of the test box
will be subjected to a horizontal force. Since the specimen
is attached to these faces, the geosynthetic will be
subjected to a tensile load. Despite its reliable reproduc-
tion of field load application, this type of confined creep
test usually leads to very small tensile load values. There-
fore it would require very high vertical stress values.
Additionally, the loading process generally results in very
small loading rates (e.g. 0.05%/min), compared with those
in in-isolation creep tests. ASTM D 5262 prescribes that
the load be applied smoothly at a strain rate of
10% � 3%/min. Thus results from the two tests cannot be
compared, owing to the difference in strain rate during
load application, and the effect of the soil is not clearly
defined (FHWA 1998). This issue was also discussed by
Soil
Geosynthetic
Confining stress
Hardened portionof the specimen
Tensile load Soil Geosynthetic
Confining stress
Movable faces
Figure 2. Types of confined creep test devices
244 Franca and Bueno
Geosynthetics International, 2011, 18, No. 5
Walters et al. (2002) in a study of reinforcement stiffness
in different conditions (in-isolation and in-soil speci-
mens).
FHWA (1998) presented several types of equipment
used in different studies to measure the confined stress–
strain properties of geosynthetics. These authors also
described some studies where pullout tests were used to
characterize the in-soil stress–strain behavior of geosyn-
thetics. Despite the convenience of pullout tests, FHWA
(1998) suggested that alternative tests be considered to
conduct confined creep studies, such as those presented in
Figure 2. Additionally, Boyle and Holtz (1996) empha-
sized the importance of direct measurement of reinforce-
ment tension in in-soil tests in order to consider some
reduction in the load while the geosynthetic continues to
strain. This may occur because of a soil tendency to set
up.
Some recent studies on confined creep tests are pre-
sented by Costa (2004), Mendes et al. (2007), Ding et al.
(2008) and Kamiji et al. (2008). Despite the number of
successful attempts, there is not a standard procedure to
conduct in-soil creep tests.
The approaches to address the two main negative points
of conventional creep tests have been comprehensively
published in the technical literature. However, the combi-
nation of the two techniques in one creep test would both
consider the effects of the confining soil surrounding the
geosynthetic and expedite the tests. Thus reliable results
would be produced, with a reduction of test duration and
costs.
3. EXPERIMENTAL
3.1. Creep-testing equipment
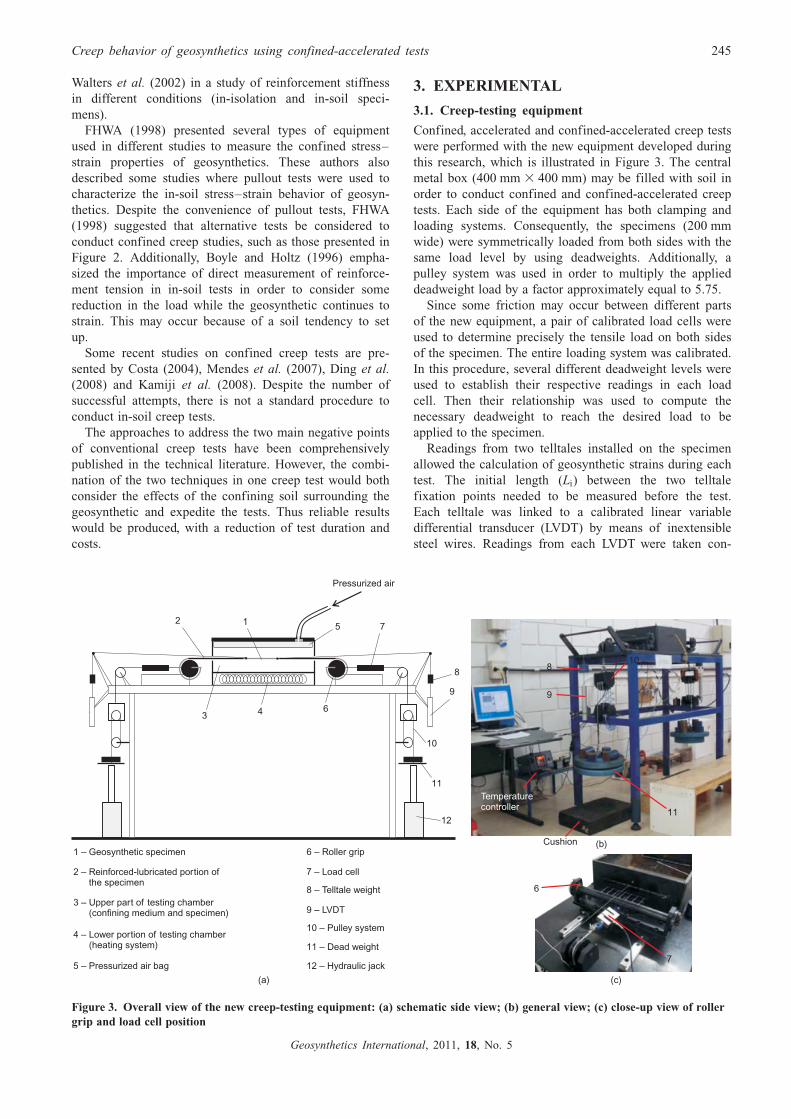
Confined, accelerated and confined-accelerated creep tests
were performed with the new equipment developed during
this research, which is illustrated in Figure 3. The central
metal box (400 mm 3 400 mm) may be filled with soil in
order to conduct confined and confined-accelerated creep
tests. Each side of the equipment has both clamping and
loading systems. Consequently, the specimens (200 mm
wide) were symmetrically loaded from both sides with the
same load level by using deadweights. Additionally, a
pulley system was used in order to multiply the applied
deadweight load by a factor approximately equal to 5.75.
Since some friction may occur between different parts
of the new equipment, a pair of calibrated load cells were
used to determine precisely the tensile load on both sides
of the specimen. The entire loading system was calibrated.
In this procedure, several different deadweight levels were
used to establish their respective readings in each load
cell. Then their relationship was used to compute the
necessary deadweight to reach the desired load to be
applied to the specimen.
Readings from two telltales installed on the specimen
allowed the calculation of geosynthetic strains during each
test. The initial length (Li) between the two telltale
fixation points needed to be measured before the test.
Each telltale was linked to a calibrated linear variable
differential transducer (LVDT) by means of inextensible
steel wires. Readings from each LVDT were taken con-
Pressurized air
5
6
1
4
9
11
10
7
8
2
12
3
1 – Geosynthetic specimen
2 – Reinforced-lubricated portion ofthe specimen
3 – Upper part of testing chamber(confining medium and specimen)
4 – Lower portion of testing chamber(heating system)
5 – Pressurized air bag
6 – Roller grip
7 – Load cell
8 – Telltale weight
9 – LVDT
10 – Pulley system
11 – Dead weight
12 – Hydraulic jack
(a)
(b)
(c)
6
7
11
9
810
Temperaturecontroller
Cushion
Figure 3. Overall view of the new creep-testing equipment: (a) schematic side view; (b) general view; (c) close-up view of roller
grip and load cell position
Creep behavior of geosynthetics using confined-accelerated tests 245
Geosynthetics International, 2011, 18, No. 5
tinuously during every test with a precision of 0.01 mm.
Therefore the displacement of each fixation point was
constantly measured and registered throughout the test.
Finally, specimen strains were calculated by means of the
equation
� ¼ dA þ dB
Li(2)
where � is the specimen elongation (in %); dA and dB are
the readings from each telltale (in mm); and Li is the
initial length between the two fixation points of the
telltales (in mm).
Since the new creep test device was designed to conduct
creep tests at elevated temperature, it is also equipped
with a heating system. This comprises two thermocouples,
an expanded polystyrene cover, and a heating chamber
filled with loose sand, in which a set of electric resistances
is installed. Thermocouple 1 (TC-1) is located near the
electric resistances, and is used to control the programmed
temperature set point inside the heating chamber. TC-1
can also be used to perform any heating path. The second
thermocouple (TC-2) is placed 20 mm above the speci-
men. Therefore the specimen temperature was considered
to be equal that read by TC-2. The whole heating system
was calibrated in order to determine the relationship
between the readings from each thermocouple. As a result,
the temperature near the specimen was accurately deter-
mined in each test.
Regarding confined creep tests, the confining stresses
were reproduced by means of a pressurized air bag placed
on top of the surrounding soil. The pressure inside the bag
was kept constant during the tests. Two pieces of high-
density polyethylene geomembrane were used to reduce
soil–geosynthetics friction on both sides. In addition, the
portions of each specimen in contact with the geo-
membrane were reinforced, covered with a polyester
Mylar1 sheet (0.075 mm thick, manufactured by
DuPont1), and lubricated. This procedure resulted in a
geosynthetic free length of 100 mm. Thus the specimen’s
width/length ratio was equal to 2:1.
3.2. Geosynthetics
Three different categories of geosynthetics were used in
this research. They were selected in order to provide a
wide variety of geosynthetic types. Geosynthetic A was a
biaxial polyester geogrid with 28 mm wide apertures.
Geosynthetic B was a polypropylene woven geotextile
with mass per unit area (ASTM D 5261) equal to
276 g/m2 (COV ¼ 3.03%) and thickness (ASTM D 5199)
equal to 0.94 mm (COV ¼ 4.21%). Both geosynthetics A
and B were tested in the machine direction. Geosynthetic
C was a polyester nonwoven geotextile manufactured with
needled-punched short fibers. The thickness (ASTM D
5199) and mass per unit area (ASTM D 5261) of
geosynthetic C were 2.59 mm (COV ¼ 6.80%) and
313 g/m2 (COV ¼ 4.64%), respectively. Table 1 sum-
marizes the geosynthetics’ information.
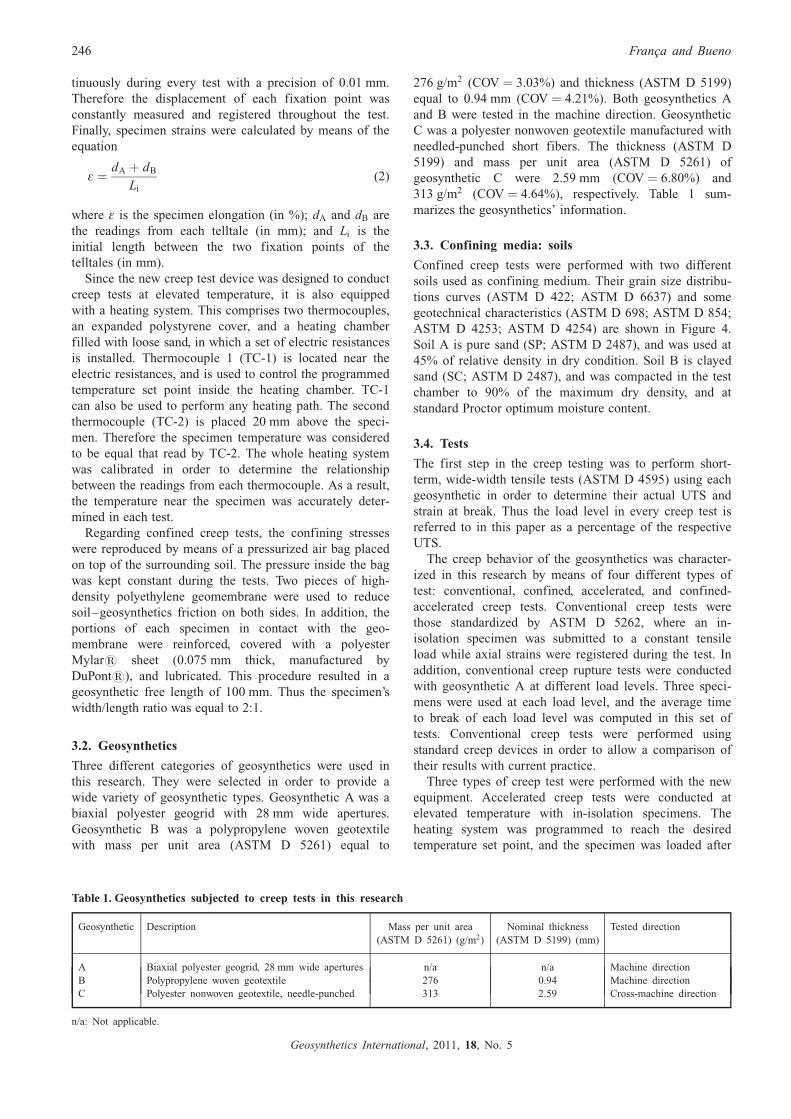
3.3. Confining media: soils
Confined creep tests were performed with two different
soils used as confining medium. Their grain size distribu-
tions curves (ASTM D 422; ASTM D 6637) and some
geotechnical characteristics (ASTM D 698; ASTM D 854;
ASTM D 4253; ASTM D 4254) are shown in Figure 4.
Soil A is pure sand (SP; ASTM D 2487), and was used at
45% of relative density in dry condition. Soil B is clayed
sand (SC; ASTM D 2487), and was compacted in the test
chamber to 90% of the maximum dry density, and at
standard Proctor optimum moisture content.
3.4. Tests
The first step in the creep testing was to perform short-
term, wide-width tensile tests (ASTM D 4595) using each
geosynthetic in order to determine their actual UTS and
strain at break. Thus the load level in every creep test is
referred to in this paper as a percentage of the respective
UTS.
The creep behavior of the geosynthetics was character-
ized in this research by means of four different types of
test: conventional, confined, accelerated, and confined-
accelerated creep tests. Conventional creep tests were
those standardized by ASTM D 5262, where an in-
isolation specimen was submitted to a constant tensile
load while axial strains were registered during the test. In
addition, conventional creep rupture tests were conducted
with geosynthetic A at different load levels. Three speci-
mens were used at each load level, and the average time
to break of each load level was computed in this set of
tests. Conventional creep tests were performed using
standard creep devices in order to allow a comparison of
their results with current practice.
Three types of creep test were performed with the new
equipment. Accelerated creep tests were conducted at
elevated temperature with in-isolation specimens. The
heating system was programmed to reach the desired
temperature set point, and the specimen was loaded after
Table 1. Geosynthetics subjected to creep tests in this research
Geosynthetic Description Mass per unit area
(ASTM D 5261) (g/m2)
Nominal thickness
(ASTM D 5199) (mm)
Tested direction
A Biaxial polyester geogrid, 28 mm wide apertures n/a n/a Machine direction
B Polypropylene woven geotextile 276 0.94 Machine direction
C Polyester nonwoven geotextile, needle-punched 313 2.59 Cross-machine direction
n/a: Not applicable.
246 Franca and Bueno
Geosynthetics International, 2011, 18, No. 5
temperature equilibrium was reached. Confined creep tests
refer to those where in-soil specimens were used in the
new creep test equipment. These tests were conducted at
room conditions (temperature and relative humidity),
which were kept within a strict range. Finally, the
confined-accelerated creep tests were conducted at ele-
vated temperature and under soil confinement, simulta-
neously.
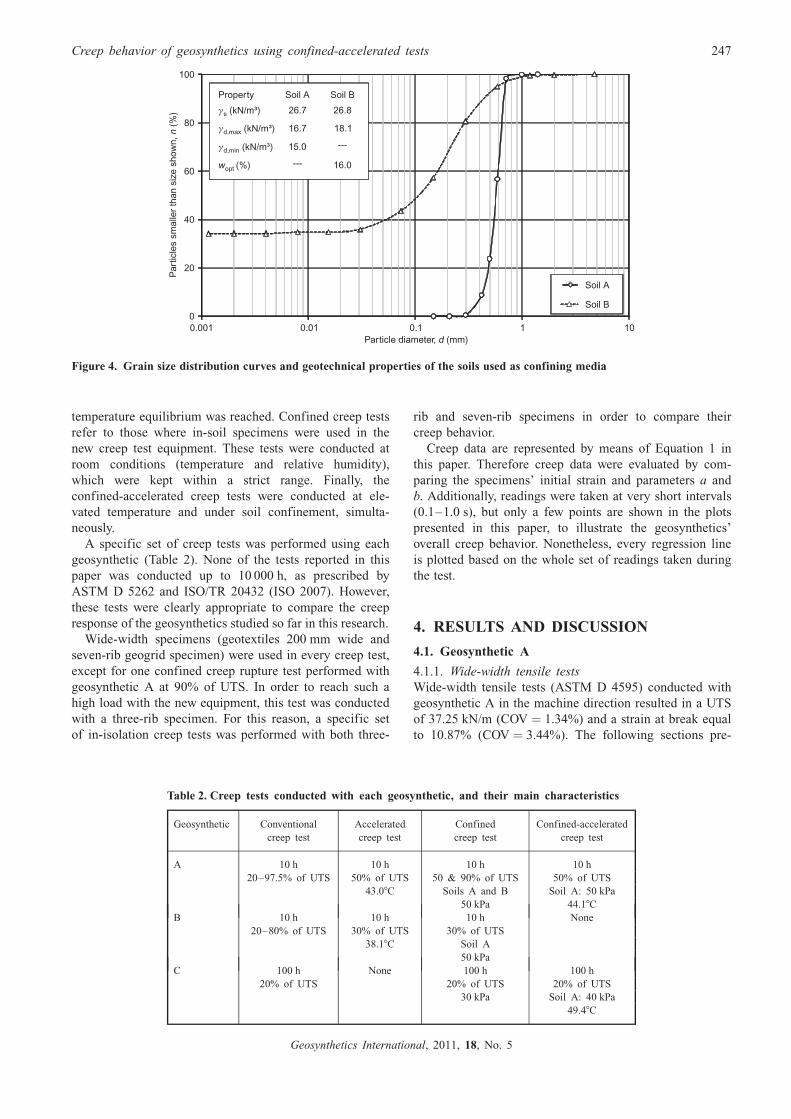
A specific set of creep tests was performed using each
geosynthetic (Table 2). None of the tests reported in this
paper was conducted up to 10 000 h, as prescribed by
ASTM D 5262 and ISO/TR 20432 (ISO 2007). However,
these tests were clearly appropriate to compare the creep
response of the geosynthetics studied so far in this research.
Wide-width specimens (geotextiles 200 mm wide and
seven-rib geogrid specimen) were used in every creep test,
except for one confined creep rupture test performed with
geosynthetic A at 90% of UTS. In order to reach such a
high load with the new equipment, this test was conducted
with a three-rib specimen. For this reason, a specific set
of in-isolation creep tests was performed with both three-
rib and seven-rib specimens in order to compare their
creep behavior.
Creep data are represented by means of Equation 1 in
this paper. Therefore creep data were evaluated by com-
paring the specimens’ initial strain and parameters a and
b. Additionally, readings were taken at very short intervals
(0.1–1.0 s), but only a few points are shown in the plots
presented in this paper, to illustrate the geosynthetics’
overall creep behavior. Nonetheless, every regression line
is plotted based on the whole set of readings taken during
the test.
4. RESULTS AND DISCUSSION
4.1. Geosynthetic A
4.1.1. Wide-width tensile tests
Wide-width tensile tests (ASTM D 4595) conducted with
geosynthetic A in the machine direction resulted in a UTS
of 37.25 kN/m (COV ¼ 1.34%) and a strain at break equal
to 10.87% (COV ¼ 3.44%). The following sections pre-
0
20
40
60
80
100
0.001 0.01 0.1 1 10Particle diameter, (mm)d
Soil A
Soil B
Property Soil A Soil B
γs (kN/m³)
γd,max (kN/m³)
γd,min (kN/m³)
16.7 18.1
---
wopt (%)
15.0
16.0---P
artic
les
smal
ler
than
siz
e sh
own,
(
%)
n
26.826.7
Figure 4. Grain size distribution curves and geotechnical properties of the soils used as confining media
Table 2. Creep tests conducted with each geosynthetic, and their main characteristics
Geosynthetic Conventional
creep test
Accelerated
creep test
Confined
creep test
Confined-accelerated
creep test
A 10 h
20–97.5% of UTS
10 h
50% of UTS
43.08C
10 h
50 & 90% of UTS
Soils A and B
50 kPa
10 h
50% of UTS
Soil A: 50 kPa
44.18C
B 10 h
20–80% of UTS
10 h
30% of UTS
38.18C
10 h
30% of UTS
Soil A
50 kPa
None
C 100 h
20% of UTS
None 100 h
20% of UTS
30 kPa
100 h
20% of UTS
Soil A: 40 kPa
49.48C
Creep behavior of geosynthetics using confined-accelerated tests 247
Geosynthetics International, 2011, 18, No. 5
sent the results of creep tests performed using this
material.
4.1.2. In-isolation creep tests
First, geosynthetic A was submitted to conventional creep
tests conducted up to 10 h. Table 3 presents the results
obtained from these tests at several different load levels
(20–80% of UTS). As expected, parameters a and b are
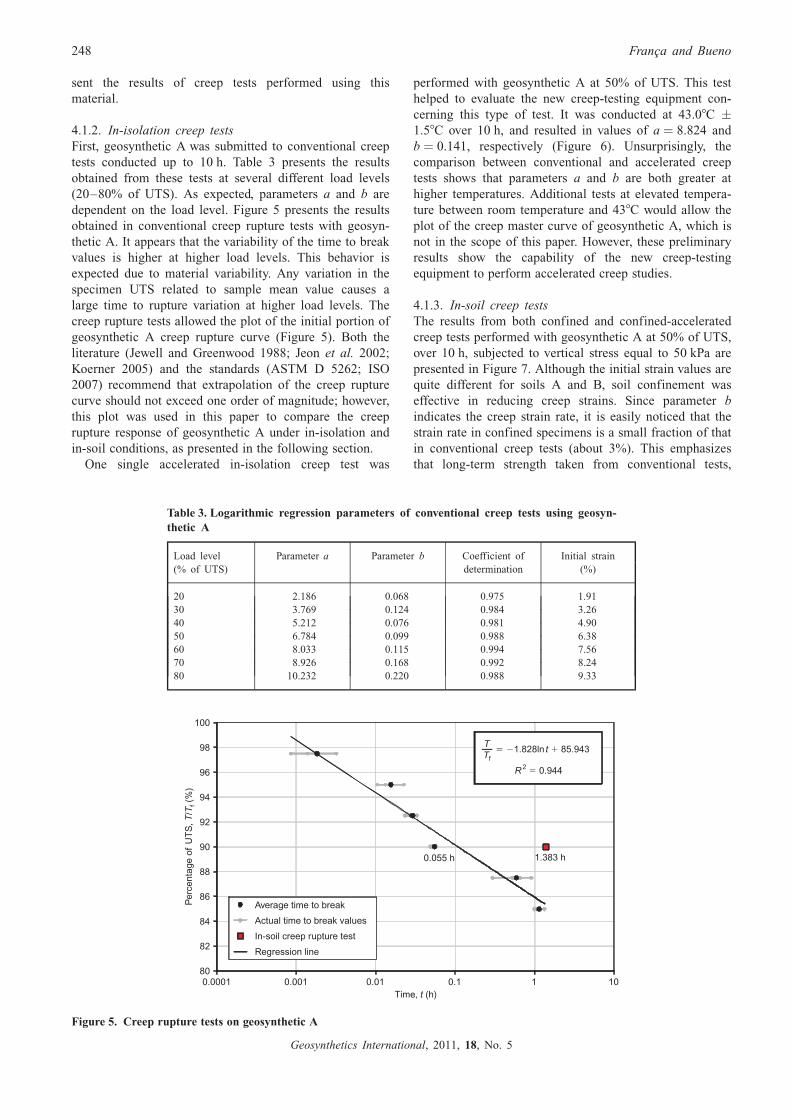
dependent on the load level. Figure 5 presents the results
obtained in conventional creep rupture tests with geosyn-
thetic A. It appears that the variability of the time to break
values is higher at higher load levels. This behavior is
expected due to material variability. Any variation in the
specimen UTS related to sample mean value causes a
large time to rupture variation at higher load levels. The
creep rupture tests allowed the plot of the initial portion of
geosynthetic A creep rupture curve (Figure 5). Both the
literature (Jewell and Greenwood 1988; Jeon et al. 2002;
Koerner 2005) and the standards (ASTM D 5262; ISO
2007) recommend that extrapolation of the creep rupture
curve should not exceed one order of magnitude; however,
this plot was used in this paper to compare the creep
rupture response of geosynthetic A under in-isolation and
in-soil conditions, as presented in the following section.
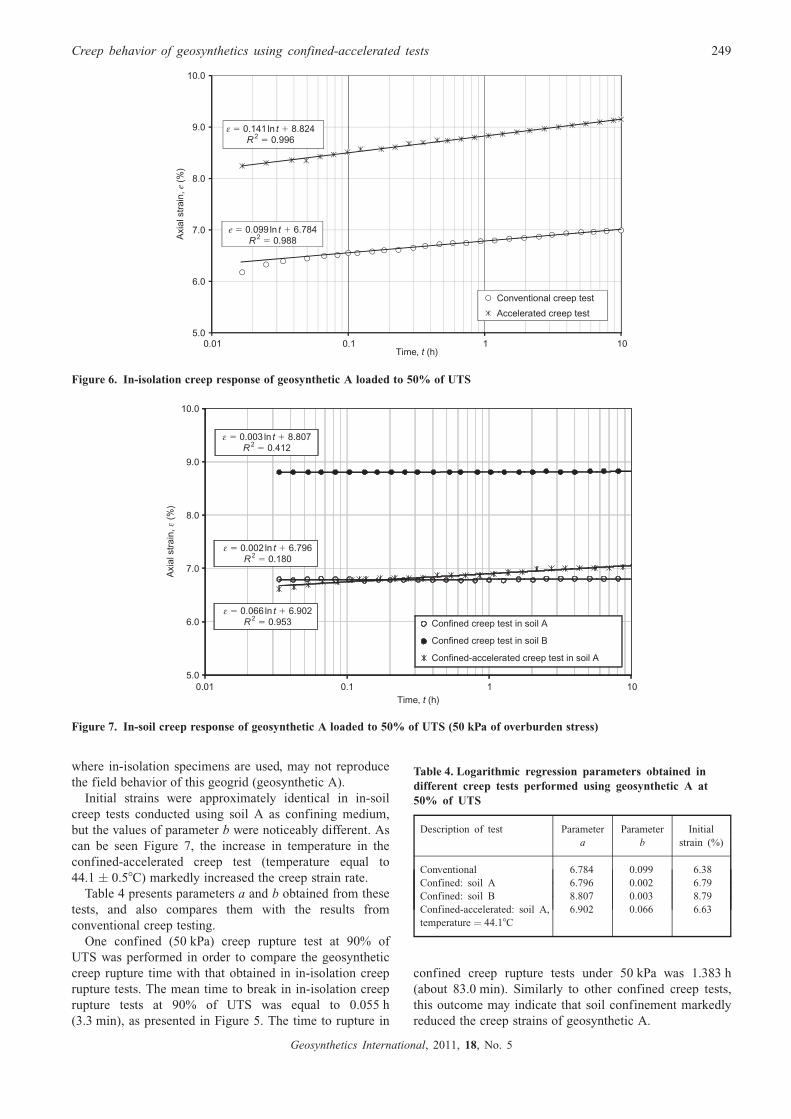
One single accelerated in-isolation creep test was
performed with geosynthetic A at 50% of UTS. This test
helped to evaluate the new creep-testing equipment con-
cerning this type of test. It was conducted at 43.08C �1.58C over 10 h, and resulted in values of a ¼ 8.824 and
b ¼ 0.141, respectively (Figure 6). Unsurprisingly, the
comparison between conventional and accelerated creep
tests shows that parameters a and b are both greater at
higher temperatures. Additional tests at elevated tempera-
ture between room temperature and 438C would allow the
plot of the creep master curve of geosynthetic A, which is
not in the scope of this paper. However, these preliminary
results show the capability of the new creep-testing
equipment to perform accelerated creep studies.
4.1.3. In-soil creep tests
The results from both confined and confined-accelerated
creep tests performed with geosynthetic A at 50% of UTS,
over 10 h, subjected to vertical stress equal to 50 kPa are
presented in Figure 7. Although the initial strain values are
quite different for soils A and B, soil confinement was
effective in reducing creep strains. Since parameter b
indicates the creep strain rate, it is easily noticed that the
strain rate in confined specimens is a small fraction of that
in conventional creep tests (about 3%). This emphasizes
that long-term strength taken from conventional tests,
Table 3. Logarithmic regression parameters of conventional creep tests using geosyn-
thetic A
Load level
(% of UTS)
Parameter a Parameter b Coefficient of
determination
Initial strain
(%)
20 2.186 0.068 0.975 1.91
30 3.769 0.124 0.984 3.26
40 5.212 0.076 0.981 4.90
50 6.784 0.099 0.988 6.38
60 8.033 0.115 0.994 7.56
70 8.926 0.168 0.992 8.24
80 10.232 0.220 0.988 9.33
Per
cent
age
ofU
TS
,/
(%)
T T
f
0.0001 0.001 0.10.01 1 10
TTf
� � �1.828ln 85.943t
0.055 h 1.383 h
80
82
84
86
88
90
92
94
96
98
100
Time, (h)t
Average time to break
Actual time to break values
In-soil creep rupture test
Regression line
R 2 0.944�
Figure 5. Creep rupture tests on geosynthetic A
248 Franca and Bueno
Geosynthetics International, 2011, 18, No. 5
where in-isolation specimens are used, may not reproduce
the field behavior of this geogrid (geosynthetic A).
Initial strains were approximately identical in in-soil
creep tests conducted using soil A as confining medium,
but the values of parameter b were noticeably different. As
can be seen Figure 7, the increase in temperature in the
confined-accelerated creep test (temperature equal to
44.1 � 0.58C) markedly increased the creep strain rate.
Table 4 presents parameters a and b obtained from these
tests, and also compares them with the results from
conventional creep testing.
One confined (50 kPa) creep rupture test at 90% of
UTS was performed in order to compare the geosynthetic
creep rupture time with that obtained in in-isolation creep
rupture tests. The mean time to break in in-isolation creep
rupture tests at 90% of UTS was equal to 0.055 h
(3.3 min), as presented in Figure 5. The time to rupture in
confined creep rupture tests under 50 kPa was 1.383 h
(about 83.0 min). Similarly to other confined creep tests,
this outcome may indicate that soil confinement markedly
reduced the creep strains of geosynthetic A.
0.01 0.1 1 10
e � 0.099 ln 6.7840.988t
R�
�2
ε � ��
0.141 ln 8.8240.996t
R 2
5.0
6.0
7.0
8.0
9.0
10.0
Axi
al s
trai
n,(%
)e
Time, (h)t
Conventional creep test
Accelerated creep test
Figure 6. In-isolation creep response of geosynthetic A loaded to 50% of UTS
0.01 0.1 1 10
Axi
al s
trai
n,(%
)ε
ε � ��
0.002 ln 6.7960.180t
R 2
ε 0.003 ln 8.8070.412
� ��
tR 2
ε t� ��
0.066 ln 6.9020.953R 2
5.0
6.0
7.0
8.0
9.0
10.0
Time, (h)t
Confined creep test in soil A
Confined creep test in soil B
Confined-accelerated creep test in soil A
Figure 7. In-soil creep response of geosynthetic A loaded to 50% of UTS (50 kPa of overburden stress)
Table 4. Logarithmic regression parameters obtained in
different creep tests performed using geosynthetic A at
50% of UTS
Description of test Parameter
a
Parameter
b
Initial
strain (%)
Conventional 6.784 0.099 6.38
Confined: soil A 6.796 0.002 6.79
Confined: soil B 8.807 0.003 8.79
Confined-accelerated: soil A,
temperature ¼ 44.18C
6.902 0.066 6.63
Creep behavior of geosynthetics using confined-accelerated tests 249
Geosynthetics International, 2011, 18, No. 5
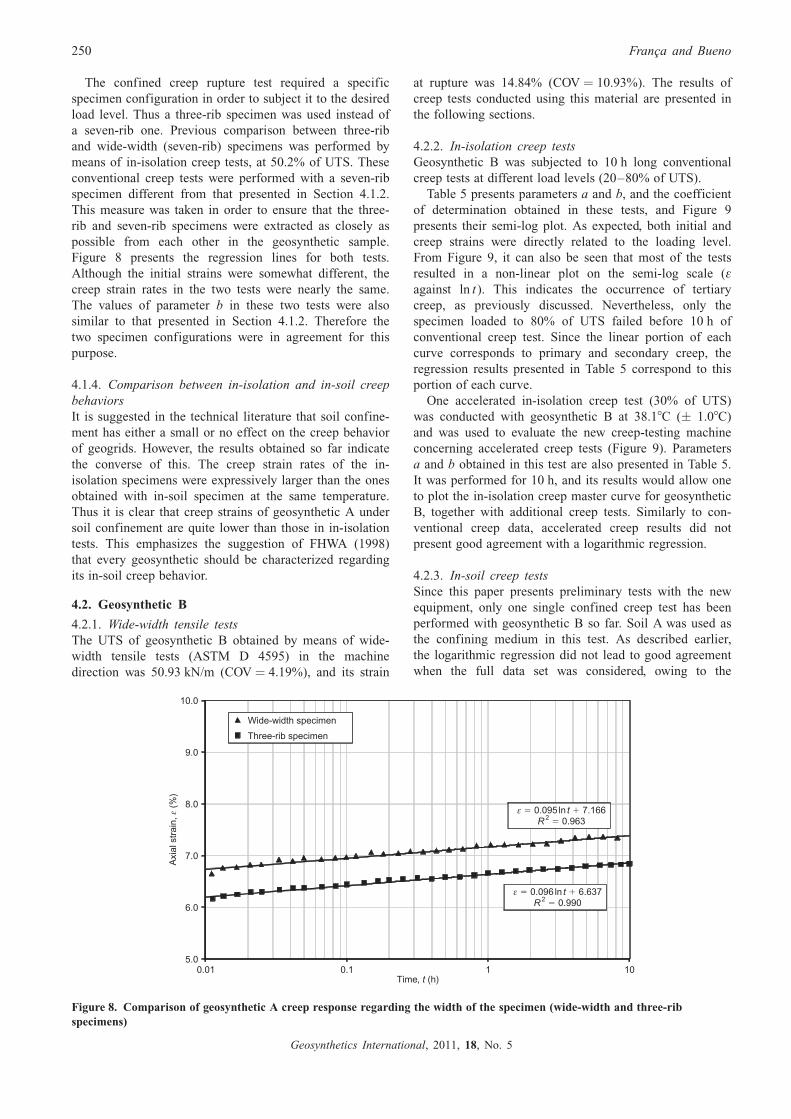
The confined creep rupture test required a specific
specimen configuration in order to subject it to the desired
load level. Thus a three-rib specimen was used instead of
a seven-rib one. Previous comparison between three-rib
and wide-width (seven-rib) specimens was performed by
means of in-isolation creep tests, at 50.2% of UTS. These
conventional creep tests were performed with a seven-rib
specimen different from that presented in Section 4.1.2.
This measure was taken in order to ensure that the three-
rib and seven-rib specimens were extracted as closely as
possible from each other in the geosynthetic sample.
Figure 8 presents the regression lines for both tests.
Although the initial strains were somewhat different, the
creep strain rates in the two tests were nearly the same.
The values of parameter b in these two tests were also
similar to that presented in Section 4.1.2. Therefore the
two specimen configurations were in agreement for this
purpose.
4.1.4. Comparison between in-isolation and in-soil creep
behaviors
It is suggested in the technical literature that soil confine-
ment has either a small or no effect on the creep behavior
of geogrids. However, the results obtained so far indicate
the converse of this. The creep strain rates of the in-
isolation specimens were expressively larger than the ones
obtained with in-soil specimen at the same temperature.
Thus it is clear that creep strains of geosynthetic A under
soil confinement are quite lower than those in in-isolation
tests. This emphasizes the suggestion of FHWA (1998)
that every geosynthetic should be characterized regarding
its in-soil creep behavior.
4.2. Geosynthetic B
4.2.1. Wide-width tensile tests
The UTS of geosynthetic B obtained by means of wide-
width tensile tests (ASTM D 4595) in the machine
direction was 50.93 kN/m (COV ¼ 4.19%), and its strain
at rupture was 14.84% (COV ¼ 10.93%). The results of
creep tests conducted using this material are presented in
the following sections.
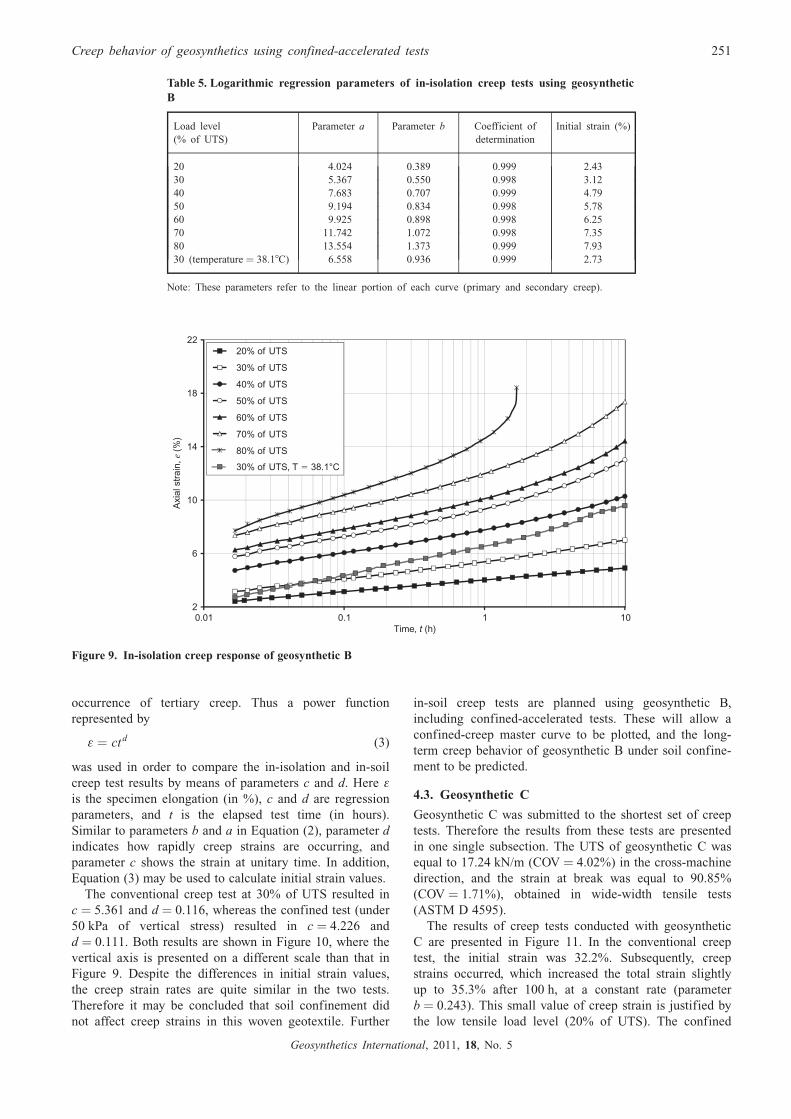
4.2.2. In-isolation creep tests
Geosynthetic B was subjected to 10 h long conventional
creep tests at different load levels (20–80% of UTS).
Table 5 presents parameters a and b, and the coefficient
of determination obtained in these tests, and Figure 9
presents their semi-log plot. As expected, both initial and
creep strains were directly related to the loading level.
From Figure 9, it can also be seen that most of the tests
resulted in a non-linear plot on the semi-log scale (�against ln t ). This indicates the occurrence of tertiary
creep, as previously discussed. Nevertheless, only the
specimen loaded to 80% of UTS failed before 10 h of
conventional creep test. Since the linear portion of each
curve corresponds to primary and secondary creep, the
regression results presented in Table 5 correspond to this
portion of each curve.
One accelerated in-isolation creep test (30% of UTS)
was conducted with geosynthetic B at 38.18C (� 1.08C)
and was used to evaluate the new creep-testing machine
concerning accelerated creep tests (Figure 9). Parameters
a and b obtained in this test are also presented in Table 5.
It was performed for 10 h, and its results would allow one
to plot the in-isolation creep master curve for geosynthetic
B, together with additional creep tests. Similarly to con-
ventional creep data, accelerated creep results did not
present good agreement with a logarithmic regression.
4.2.3. In-soil creep tests
Since this paper presents preliminary tests with the new
equipment, only one single confined creep test has been
performed with geosynthetic B so far. Soil A was used as
the confining medium in this test. As described earlier,
the logarithmic regression did not lead to good agreement
when the full data set was considered, owing to the
Axi
al s
trai
n,(%
)ε
0.01 0.1 1 10
ε 0.095 ln 7.1660.963
� ��
tR 2
ε � ��
0.096 ln 6.6370.990t
R 2
5.0
6.0
7.0
8.0
9.0
10.0
Time, (h)t
Wide-width specimen
Three-rib specimen
Figure 8. Comparison of geosynthetic A creep response regarding the width of the specimen (wide-width and three-rib
specimens)
250 Franca and Bueno
Geosynthetics International, 2011, 18, No. 5
occurrence of tertiary creep. Thus a power function
represented by
� ¼ ctd (3)
was used in order to compare the in-isolation and in-soil
creep test results by means of parameters c and d. Here �is the specimen elongation (in %), c and d are regression
parameters, and t is the elapsed test time (in hours).
Similar to parameters b and a in Equation (2), parameter d
indicates how rapidly creep strains are occurring, and
parameter c shows the strain at unitary time. In addition,
Equation (3) may be used to calculate initial strain values.
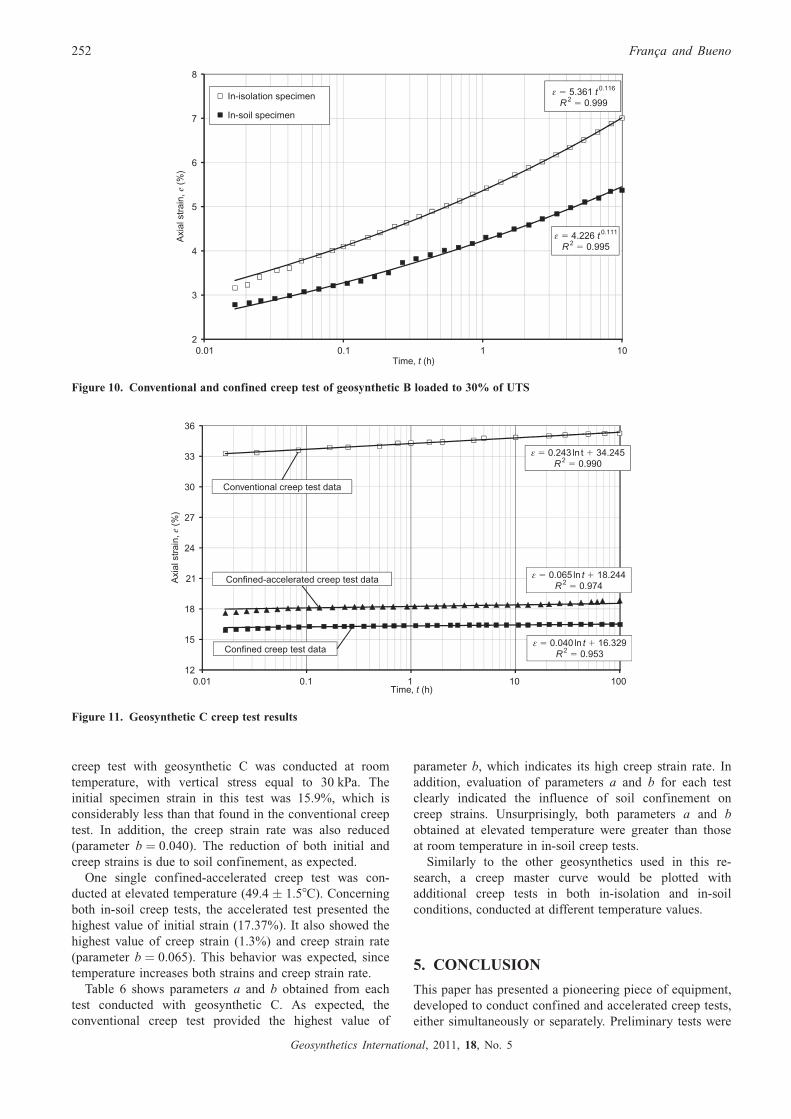
The conventional creep test at 30% of UTS resulted in
c ¼ 5.361 and d ¼ 0.116, whereas the confined test (under
50 kPa of vertical stress) resulted in c ¼ 4.226 and
d ¼ 0.111. Both results are shown in Figure 10, where the
vertical axis is presented on a different scale than that in
Figure 9. Despite the differences in initial strain values,
the creep strain rates are quite similar in the two tests.
Therefore it may be concluded that soil confinement did
not affect creep strains in this woven geotextile. Further
in-soil creep tests are planned using geosynthetic B,
including confined-accelerated tests. These will allow a
confined-creep master curve to be plotted, and the long-
term creep behavior of geosynthetic B under soil confine-
ment to be predicted.
4.3. Geosynthetic C
Geosynthetic C was submitted to the shortest set of creep
tests. Therefore the results from these tests are presented
in one single subsection. The UTS of geosynthetic C was
equal to 17.24 kN/m (COV ¼ 4.02%) in the cross-machine
direction, and the strain at break was equal to 90.85%
(COV ¼ 1.71%), obtained in wide-width tensile tests
(ASTM D 4595).
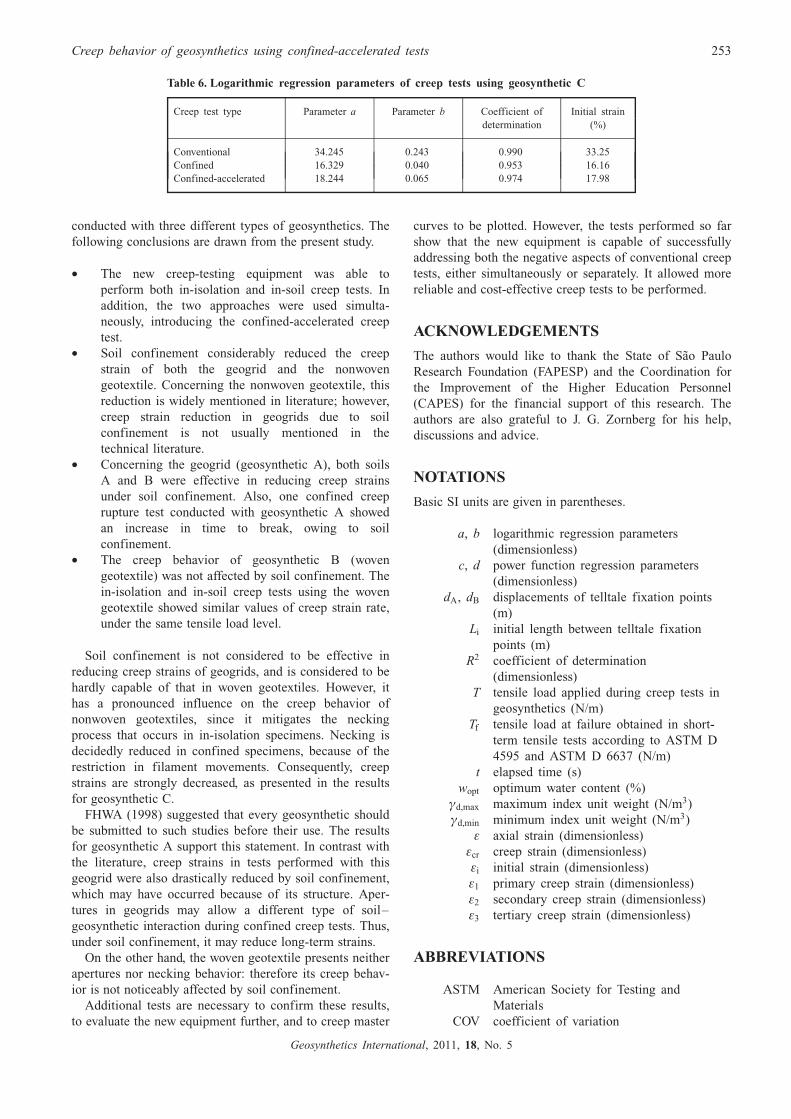
The results of creep tests conducted with geosynthetic
C are presented in Figure 11. In the conventional creep
test, the initial strain was 32.2%. Subsequently, creep
strains occurred, which increased the total strain slightly
up to 35.3% after 100 h, at a constant rate (parameter
b ¼ 0.243). This small value of creep strain is justified by
the low tensile load level (20% of UTS). The confined
Table 5. Logarithmic regression parameters of in-isolation creep tests using geosynthetic
B
Load level
(% of UTS)
Parameter a Parameter b Coefficient of
determination
Initial strain (%)
20 4.024 0.389 0.999 2.43
30 5.367 0.550 0.998 3.12
40 7.683 0.707 0.999 4.79
50 9.194 0.834 0.998 5.78
60 9.925 0.898 0.998 6.25
70 11.742 1.072 0.998 7.35
80 13.554 1.373 0.999 7.93
30 (temperature ¼ 38.18C) 6.558 0.936 0.999 2.73
Note: These parameters refer to the linear portion of each curve (primary and secondary creep).
0.01 0.1 1 102
6
10
14
18
22
Axi
al s
trai
n,(%
)e
Time, (h)t
20% of UTS
30% of UTS
40% of UTS
50% of UTS
60% of UTS
70% of UTS
80% of UTS
30% of UTS, T 38.1°C�
Figure 9. In-isolation creep response of geosynthetic B
Creep behavior of geosynthetics using confined-accelerated tests 251
Geosynthetics International, 2011, 18, No. 5
creep test with geosynthetic C was conducted at room
temperature, with vertical stress equal to 30 kPa. The
initial specimen strain in this test was 15.9%, which is
considerably less than that found in the conventional creep
test. In addition, the creep strain rate was also reduced
(parameter b ¼ 0.040). The reduction of both initial and
creep strains is due to soil confinement, as expected.
One single confined-accelerated creep test was con-
ducted at elevated temperature (49.4 � 1.58C). Concerning
both in-soil creep tests, the accelerated test presented the
highest value of initial strain (17.37%). It also showed the
highest value of creep strain (1.3%) and creep strain rate
(parameter b ¼ 0.065). This behavior was expected, since
temperature increases both strains and creep strain rate.
Table 6 shows parameters a and b obtained from each
test conducted with geosynthetic C. As expected, the
conventional creep test provided the highest value of
parameter b, which indicates its high creep strain rate. In
addition, evaluation of parameters a and b for each test
clearly indicated the influence of soil confinement on
creep strains. Unsurprisingly, both parameters a and b
obtained at elevated temperature were greater than those
at room temperature in in-soil creep tests.
Similarly to the other geosynthetics used in this re-
search, a creep master curve would be plotted with
additional creep tests in both in-isolation and in-soil
conditions, conducted at different temperature values.
5. CONCLUSION
This paper has presented a pioneering piece of equipment,
developed to conduct confined and accelerated creep tests,
either simultaneously or separately. Preliminary tests were
0.01 0.1 1 10
ε 5.3610.999
��
0.116
2t
R
ε ��
4.2260.995
0.111
2t
R
2
3
4
5
6
7
8
Axi
al s
trai
n,(%
)e
Time, (h)t
In-isolation specimen
In-soil specimen
Figure 10. Conventional and confined creep test of geosynthetic B loaded to 30% of UTS
0.01 0.1 1 10 100
ε 0.243 ln t 34.2450.990
� ��R 2
ε � ��
0.040 ln 16.3290.953t
R 2
ε ln 18.244t ���
0.0650.974R 2
12
15
18
21
24
27
30
33
36
Axi
al s
trai
n,(%
)e
Time, (h)t
Conventional creep test data
Confined-accelerated creep test data
Confined creep test data
Figure 11. Geosynthetic C creep test results
252 Franca and Bueno
Geosynthetics International, 2011, 18, No. 5
conducted with three different types of geosynthetics. The
following conclusions are drawn from the present study.
• The new creep-testing equipment was able to
perform both in-isolation and in-soil creep tests. In
addition, the two approaches were used simulta-
neously, introducing the confined-accelerated creep
test.
• Soil confinement considerably reduced the creep
strain of both the geogrid and the nonwoven
geotextile. Concerning the nonwoven geotextile, this
reduction is widely mentioned in literature; however,
creep strain reduction in geogrids due to soil
confinement is not usually mentioned in the
technical literature.
• Concerning the geogrid (geosynthetic A), both soils
A and B were effective in reducing creep strains
under soil confinement. Also, one confined creep
rupture test conducted with geosynthetic A showed
an increase in time to break, owing to soil
confinement.
• The creep behavior of geosynthetic B (woven
geotextile) was not affected by soil confinement. The
in-isolation and in-soil creep tests using the woven
geotextile showed similar values of creep strain rate,
under the same tensile load level.
Soil confinement is not considered to be effective in
reducing creep strains of geogrids, and is considered to be
hardly capable of that in woven geotextiles. However, it
has a pronounced influence on the creep behavior of
nonwoven geotextiles, since it mitigates the necking
process that occurs in in-isolation specimens. Necking is
decidedly reduced in confined specimens, because of the
restriction in filament movements. Consequently, creep
strains are strongly decreased, as presented in the results
for geosynthetic C.
FHWA (1998) suggested that every geosynthetic should
be submitted to such studies before their use. The results
for geosynthetic A support this statement. In contrast with
the literature, creep strains in tests performed with this
geogrid were also drastically reduced by soil confinement,
which may have occurred because of its structure. Aper-
tures in geogrids may allow a different type of soil–
geosynthetic interaction during confined creep tests. Thus,
under soil confinement, it may reduce long-term strains.
On the other hand, the woven geotextile presents neither
apertures nor necking behavior: therefore its creep behav-
ior is not noticeably affected by soil confinement.
Additional tests are necessary to confirm these results,
to evaluate the new equipment further, and to creep master
curves to be plotted. However, the tests performed so far
show that the new equipment is capable of successfully
addressing both the negative aspects of conventional creep
tests, either simultaneously or separately. It allowed more
reliable and cost-effective creep tests to be performed.
ACKNOWLEDGEMENTS
The authors would like to thank the State of Sao Paulo
Research Foundation (FAPESP) and the Coordination for
the Improvement of the Higher Education Personnel
(CAPES) for the financial support of this research. The
authors are also grateful to J. G. Zornberg for his help,
discussions and advice.
NOTATIONS
Basic SI units are given in parentheses.
a, b logarithmic regression parameters
(dimensionless)
c, d power function regression parameters
(dimensionless)
dA, dB displacements of telltale fixation points
(m)
Li initial length between telltale fixation
points (m)
R2 coefficient of determination
(dimensionless)
T tensile load applied during creep tests in
geosynthetics (N/m)
Tf tensile load at failure obtained in short-
term tensile tests according to ASTM D
4595 and ASTM D 6637 (N/m)
t elapsed time (s)
wopt optimum water content (%)
ªd,max maximum index unit weight (N/m3)
ªd,min minimum index unit weight (N/m3)
� axial strain (dimensionless)
�cr creep strain (dimensionless)
�i initial strain (dimensionless)
�1 primary creep strain (dimensionless)
�2 secondary creep strain (dimensionless)
�3 tertiary creep strain (dimensionless)
ABBREVIATIONS
ASTM American Society for Testing and
Materials
COV coefficient of variation
Table 6. Logarithmic regression parameters of creep tests using geosynthetic C
Creep test type Parameter a Parameter b Coefficient of
determination
Initial strain
(%)
Conventional 34.245 0.243 0.990 33.25
Confined 16.329 0.040 0.953 16.16
Confined-accelerated 18.244 0.065 0.974 17.98
Creep behavior of geosynthetics using confined-accelerated tests 253
Geosynthetics International, 2011, 18, No. 5
GRS geosynthetic-reinforced soil
LVDT linear variable differential transducer
TC-1, TC-2 thermocouples 1 and 2
TTS time-temperature superposition
UTS ultimate tensile strength
REFERENCES
ASTM D 422. Standard Test Method for Particle-Size Analysis of Soils,
ASTM International, West Conshohocken, PA, USA.
ASTM D 698. Standard Test Methods for Laboratory Compaction
Characteristics of Soil Using Standard Effort (12 400 ft-lbf/ft3
(600 kN-m/m3)), ASTM International, West Conshohocken, PA, USA.
ASTM D 854. Standard Test Method for Specific Gravity of Soil Solids
by Water Pycnometer, ASTM International, West Conshohocken,
PA, USA.
ASTM D 2487. Standard Practice for Classification of Soils for
Engineering Purposes (Unified Soil Classification System), ASTM
International, West Conshohocken, PA, USA.
ASTM D 4253. Standard Test Methods for Maximum Index Density and
Unit Weight of Soils Using a Vibratory Table, ASTM International,
West Conshohocken, PA, USA.
ASTM D 4254. Standard Test Methods for Minimum Index Density and
Unit Weight of Soils and Calculation of Relative Density, ASTM
International, West Conshohocken, PA, USA.
ASTM D 4595. Standard Test Method for Tensile Properties of
Geotextiles by the Wide-Width Strip Method, ASTM International,
West Conshohocken, PA, USA.
ASTM D 5199. Standard Test Method for Measuring the Nominal
Thickness of Geosynthetics, ASTM International, West Consho-
hocken, PA, USA.
ASTM D 5261. Standard Test Method for Measuring Mass per Unit Area
of Geotextiles, ASTM International, West Conshohocken, PA, USA.
ASTM D 5262. Standard Test Method for Evaluating the Unconfined
Tension Creep and Creep Rupture Behavior of Geosynthetics,
ASTM International, West Conshohocken, PA, USA.
ASTM D 6637. Standard Test Method for Determining Tensile Properties
of Geogrids by the Single or Multi-Rib Tensile Method, ASTM
International, West Conshohocken, PA, USA.
ASTM D 6992. Standard Test Method for Accelerated Tensile Creep and
Creep-Rupture of Geosynthetic Material Based on Time-Tempera-
ture Superposition Using the Stepped Isothermal Method, ASTM
International, West Conshohocken, PA, USA.
Boyle, S. R., Gallagher, M. & Holtz, R. D. (1996). Influence of strain
rate, specimen length and confinement in measured geotextile
properties. Geosynthetics International, 3, No. 2, 205–225.
Boyle, S. R. & Holtz, R. D. (1996). Discussion of ‘A performance test
for assessment of long-term creep behavior of soil-geosynthetics
composites’ by Wu, J. T. H. and Helwany, S. M. B. Geosynthetics
International, 3, No. 4, 551–557.
Bueno, B. S., Constanzi, M. A. & Zornberg, J. G. (2005). Conventional
and accelerated creep tests on nonwoven needle-punched geotex-
tiles. Geosynthetics International, 12, No. 6, 276–287.
Costa, C. M. L. (2004). Time dependent deformations in geotextile
reinforced soil walls. PhD thesis. Department of Geotechnical
Engineering, University of Sao Paulo, Sao Carlos, Brazil.
Ding, J., Tong, J. & Zhou, W. (2008). Test study on the confined creep
features of HDPE geogrid in sand. Proceedings of the 4th European
Geosynthetic Conference, Edinburgh, Scotland, paper no. 156, 4 pp.
FHWA (Federal Highway Administration) (1998). Development of
Protocols for Confined Extension/Creep Testing of Geosynthetics
for Highway Applications, FHWA-RD-97-143, Elias, V., Yuan, Z.,
Swan Jr., R. W. & Bachus, R. C, Editors, Federal Highway
Administration, McLean, VA, USA.
ISO (International Organization for Standardization) (2007). ISO/TR
20432. Guidelines for the Determination of the Long-Term
Strength of Geosynthetics for Soil Reinforcement. International
Organization for Standardization, Geneva, Switzerland.
Jeon, H. Y., Kim, S. H. & Yoo, H. K. (2002). Assessment of long-term
performances of polyester geogrids by accelerated creep test.
Polymer Testing, 21, No. 5, 489–495.
Jewell, R. A. & Greenwood, J. H. (1988). Long term strength and safety
in steep soil slopes reinforced by polymer material. Geotextiles and
Geomembranes, 7, No. 1–2, 81–118.
Jones, C. J. F. P. & Clarke, D. (2007). The residual strength of
geosynthetic reinforcement subjected to accelerated creep testing
and simulated seismic events. Geotextiles and Geomembranes, 25,
No. 3, 155–169.
Kamiji, T., Bueno, B. & Costa, C. (2008). Nonwoven geotextiles:
evaluation of behavior in confined creep tests. Proceedings of the
4th European Geosynthetic Conference, Edinburgh, Scotland, paper
no. 288, 7 pp.
Koerner, R. M. (2005). Designing with Geosynthetics, Prentice Hall,
Upper Saddle River, NJ, USA.
Kongkitkul, W., Tatsuoka, F., Hirakawa, D., Sugimoto, T., Kawahata, S.
& Ito, M. (2010). Time histories of tensile force in geogrid arranged
in two full-scale high walls. Geosynthetics International, 17, No. 1,
12–33.
McGown, A., Andrawes, K. Z. & Kabir, M. H. (1982). Load-extension
testing of geotextiles confined in soil. Proceedings of the 2nd
International Conference on Geosynthetics, Las Vegas, NV, USA,
pp. 793–798.
Mendes, M. J. A., Palmeira, E. M. & Matheus, E. (2007). Some factors
affecting the in-soil load strain behavior of virgin and damaged
nonwoven geotextiles, Geosynthetics International, 14, No. 1,
39–50.
Tong, J., Gong, B. & Liu, J. (2008). An experimental study on the creep
behavior of geogrids at different temperature. Proceedings of the
4th European Geosynthetic Conference, Edinburgh, Scotland, paper
no. 155, 6 pp.
Thornton, J. S., Allen, S. R., Thomas, R. W. & Sandri, D. (1998). The
stepped isothermal method for time-temperature superposition and
its application to creep data on polyester yarn. Proceedings of the
6th International Conference on Geosynthetics, Atlanta, GA, pp.
699–706.
Walters, D. L., Allen, T. M. & Bathurst, R. J. (2002). Conversion of
geosynthetic strain to load using reinforcement stiffness. Geosyn-
thetics International, 9, No. 5–6, 483–523.
Yeo, S. & Hsuan, Y. G. (2008). Evaluation of stepped isothermal
method using two types of geogrids. Proceedings of the 4th
European Geosynthetic Conference, Edinburgh, Scotland, paper no.
285, 9 pp.
Zornberg, J. G., Byler, B. R. & Knudsen, J. W. (2004). Creep of
geotextiles using time-temperature superposition methods. Journal
of Geotechnical and Geoenvironmental Engineering, 130, No. 11,
1158–1168.
The Editor welcomes discussion on all papers published in Geosynthetics International. Please email your contribution to
[email protected] by 15 April 2012.
254 Franca and Bueno
Geosynthetics International, 2011, 18, No. 5