Embed Size (px)
Citation preview
Creep and fracture behavior of as-cast Mg–11Y–5Gd–2Zn–0.5Zr(wt%)
D. D. Yin • Q. D. Wang • C. J. Boehlert •
W. J. Ding
Received: 7 February 2012 / Accepted: 30 April 2012 / Published online: 1 June 2012
� Springer Science+Business Media, LLC 2012
Abstract The tensile-creep and creep–fracture behavior
of as-cast Mg–11Y–5Gd–2Zn–0.5Zr (wt%) (WGZ1152)
was investigated at temperatures between 523 and 598 K
(0.58–0.66Tm) and stresses between 30 and 140 MPa. The
creep stress exponent was close to five, suggesting that
dislocation creep was the dominant creep mechanism. The
activation energy for creep (233 ± 18 kJ/mol) was higher
than that for self-diffusion in magnesium, and was believed
to be associated with cross-slip, which was the dominant
thermally-aided creep mechanism. This was consistent
with the surface observations, which suggested non-basal
slip and cross-slip were active at 573 K. The minimum
creep rate and fracture time values fit the original and
modified Monkman–Grant models. In situ creep experi-
ments highlighted the intergranular cracking evolution. The
creep properties and behavior were compared with those
for other high-temperature creep-resistant Mg alloys such
as WE54-T6 and HZ32-T5.
Introduction
Due to their low density, high specific strength, specific
stiffness, damping capacity, good castability, machinabil-
ity, and recyclability, magnesium (Mg) alloys are promis-
ing light-weight structural material for applications in
which weight reduction is critical, including aerospace,
aircraft, and automotive components [1–5]. However, their
limited strength and creep resistance at temperatures above
398 K have limited their use [2–4, 6].
Al is the most widely used alloying element in Mg
alloys due to its strengthening effect. Although Mg–Al–Mn
(AM) and Mg–Al–Zn (AZ) series alloys are strong at room
temperature, they exhibit relatively poor creep resistance at
temperatures above 393–423 K compared with rare-earth
(RE) containing Mg alloys due to the instability of the
b-Mg17Al12 phase [4]. Small additions of Si, RE elements,
and Ca to AZ and AM series alloys can increase the creep
resistance, as has been shown for the following alloys:
AS21, AS41, AE42, AE41, AJ52, AX53, and MRI153
[3–5, 7, 8]. Ag and RE elements are effective creep
strengtheners at temperatures up to 523 K, and this finding
has resulted in the development of Mg–Ag–RE–Zr alloys
including QE22 [5, 6]. Even greater creep resistance can be
achieved through the addition of Th or RE (Y and Gd) to
Mg [3, 5, 6, 9]. In this group, HZ32 [Mg–3.3Th–2.1Zn–
0.7Zr (wt%)] is the Mg alloy which has been used at the
highest service temperatures (618–643 K) [3, 6]. However,
HZ32 is being phased out due to its radioactivity [3].
WE54 [Mg–5.2Y–3.6RE–0.5Zr (wt%)] is the most widely
used commercial structural Mg alloys for elevated-tem-
perature applications up to 523 K [1, 6, 10]. Recently, a
Mg–Y based alloy, Mg–11Y–5Gd–2Zn–0.5Zr (wt%)
(WGZ1152), has been developed, and this alloy has
exhibited potential for elevated-temperature applications at
D. D. Yin � Q. D. Wang (&) � W. J. Ding
National Engineering Research Center of Light Alloy Net
Forming, School of Materials Science and Engineering,
Shanghai Jiao Tong University, 800 Dongchuan Road,
Shanghai 200240, People’s Republic of China
e-mail: [email protected]
D. D. Yin
e-mail: [email protected]
Q. D. Wang � W. J. Ding
The State Key Laboratory of Metal Matrix Composites,
School of Materials Science and Engineering, Shanghai Jiao
Tong University, 800 Dongchuan Road, Shanghai 200240,
People’s Republic of China
C. J. Boehlert
Department of Chemical Engineering and Materials Science,
Michigan State University, East Lansing, MI 48824, USA
123
J Mater Sci (2012) 47:6263–6275
DOI 10.1007/s10853-012-6546-4
temperatures above 523 K [11–14]. In order to further
improve and develop high-performance creep-resistant Mg
alloys, it is necessary to systematically investigate their
mechanical behavior and deformation mechanisms. The
aim of the present work was to investigate the tensile-creep
and creep–fracture behavior of as-cast WGZ1152 at
523–598 K (0.58–0.66Tm, where Tm is the absolute melting
temperature of this alloy [12]). The relationship among
microstructural evolution, creep deformation, and creep–
fracture are discussed.
Experimental procedures
The measured composition of the studied alloy, measured
using an inductively coupled plasma analyzer, was Mg–
11.3Y–4.7Gd–2.0Zn–0.46Zr (wt%). It was prepared from
high-purity Mg, Zn ingots (C99.9 %), and Mg–25Y (wt%),
Mg–25Gd (wt%), and Mg–30Zr (wt%) master alloys by
electronic resistance melting in a mild steel crucible at
approximately 1,023 K under a mixed atmosphere of CO2
and SF6. The ratio of CO2 gas to SF6 gas was 100:1. The
alloy was cast into a rectangular steel mold with dimen-
sions of 210 mm in length, 130 mm in width, and 60 mm
in thickness, which was pre-heated to 473 K. The
mechanical properties of the WGZ1152 alloy were com-
pared with that for a WE54 [Mg–5.2Y–3.6RE–0.5Zr
(wt%)] ingot which was purchased from Magnesium
Elektron UK and subjected to a solution treatment at 798 K
for 8 h followed by water quenching and a subsequent
aging treatment of 16 h at 523 K [1].
Conventional tensile-creep tests were performed at tem-
peratures between 523 and 598 K and under constant load in
air. Rectangular specimens, with dimensions of 25 mm in
gage length, 6 mm in width, and 2 mm in thickness, were cut
from the ingot by an electric discharge machine (EDM). In
order to achieve thermal stability, the specimens were held at
the test temperature for 1 h before loading. The temperature
was maintained constant within ±1 K of the target temper-
ature throughout the tests. The strain was measured using a
linear variable differential transformer attached to a high-
temperature extensometer, which was attached to the gage
section of the specimens. The temperature-stress–strain-time
data were collected by a computer-controlled data acquisi-
tion system. Most of the specimens were taken to failure.
Some of the tests were interrupted after 1,000 h or longer.
An in situ tensile-creep experiment was conducted on
the as-cast material at T = 573 K and r = 50 MPa. A flat
dogbone-shaped sample, with dimensions of 10 mm in
gage length, 3 mm in width, and 2.5 mm in thickness, was
cut using EDM. The specimen was glued to a metallic
platen and polished to a 1 lm finish using an automatic
polishing machine and ethanol as a polishing lubricant. The
experiment was performed using a screw-driven tensile
stage (built by Ernest F. Fullam, Incorporated, Clifton
Park, NY) placed inside a Zeiss (Jena, Germany) EVO
MA15 scanning electron microscope (SEM). Temperature
was controlled using a constant-voltage power supply to a
6 mm diameter tungsten-based heater located just below
the gage section of the sample. An open-bath, closed-loop
chiller was used to circulate distilled water at RT through
copper tubes to prevent the tensile stage from overheating.
A fine-gage type-K thermocouple was spot-welded to the
gage section of the sample. After the sample’s gauge-sec-
tion temperature reached the desired creep temperature, a
30 min period was given to stabilize the thermal stress
prior to applying load. The load, which was measured
using a 4,448 N load cell, was applied at 5 N/s until
reaching the desired creep stress. The test was considered
constant load where the stress fluctuation varied ±3 MPa.
Secondary electron (SE) SEM images were taken before
loading and at periodic displacements throughout the
experiment without interrupting the experiment. The
pressure in the SEM chamber never exceeded 10-6 torr,
and therefore, oxidation did not detrimentally affect the
SEM imaging. Further details of this apparatus and testing
technique can be found elsewhere [15, 16].
Microstructural observations, both before and after
deformation, were made using optical microscopy (LEICA
MEF4M), and scanning electron microscopy (FEI SIRION
200). The creep specimens, for which ex-situ observations
obtained, were mechanically polished, and then etched in a
4 vol% nital solution.
Results
Initial microstructure
The microstructure of the WGZ1152 has been described
previously [11, 12]. Figure 1a illustrates a representative
optical photomicrograph of the as-cast alloy. The gray
Mg24(GdYZn)5 phase and the strip-shaped black X phases
were distributed along the grain boundaries. The fine-lamellar
phases were uniformly distributed from grain boundaries to
the interior of the a-Mg grains and exhibited one single ori-
entation in a given grain as shown in Fig. 1b. Based on pre-
vious studies [11, 12, 17], both the X phase along grain
boundaries and the fine-lamellar phases within grain interior
exhibited an 18R-type long period stacking ordered structure.
The average a-Mg grain size was 116 ± 15 lm [12].
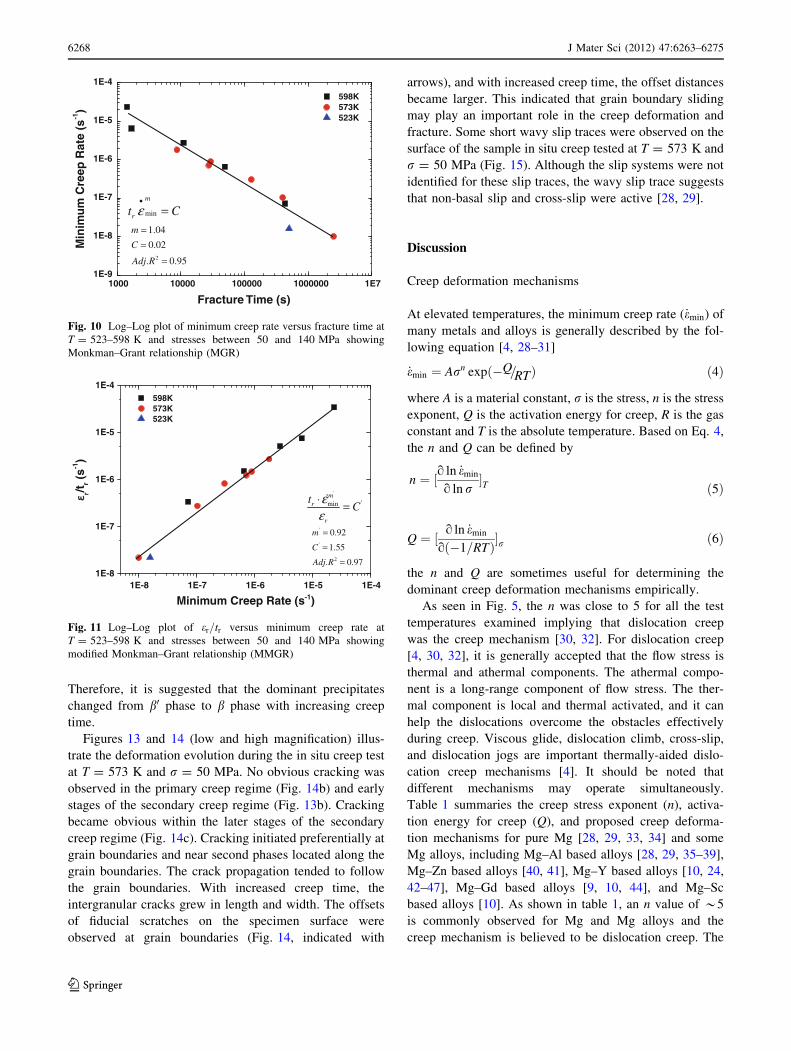
Creep properties
Figure 2 compares the minimum creep rates of the studied
alloy with that of a WE54-T6 alloy and a HZ32-T5 alloy.
6264 J Mater Sci (2012) 47:6263–6275
123
The minimum creep rate of the as-cast WGZ1152 was
superior to the WE54-T6 at T = 523–573 K (0.58–0.64Tm)
and r = 50–80 MPa, and was comparable to the HZ32-T5
at T = 573 K and r = 30 MPa. At T = 523 K and
r = 80 MPa, the minimum creep rate of the as-cast
WGZ1152 was almost two orders of magnitude lower than
that for WE54-T6. At T = 573 K and r = 50 MPa, the
minimum creep rate of the as-cast WGZ1152 was almost
one order of magnitude lower than that for WE54-T6, and
the creep–fracture life of the as-cast WGZ1152 (699 h)
was 12 times higher than that for WE54-T6 (*53 h). The
minimum creep rate of the as-cast WGZ1152 was
comparable to that for HZ32-T5 at T = 573 K and
r = 30 MPa [10].
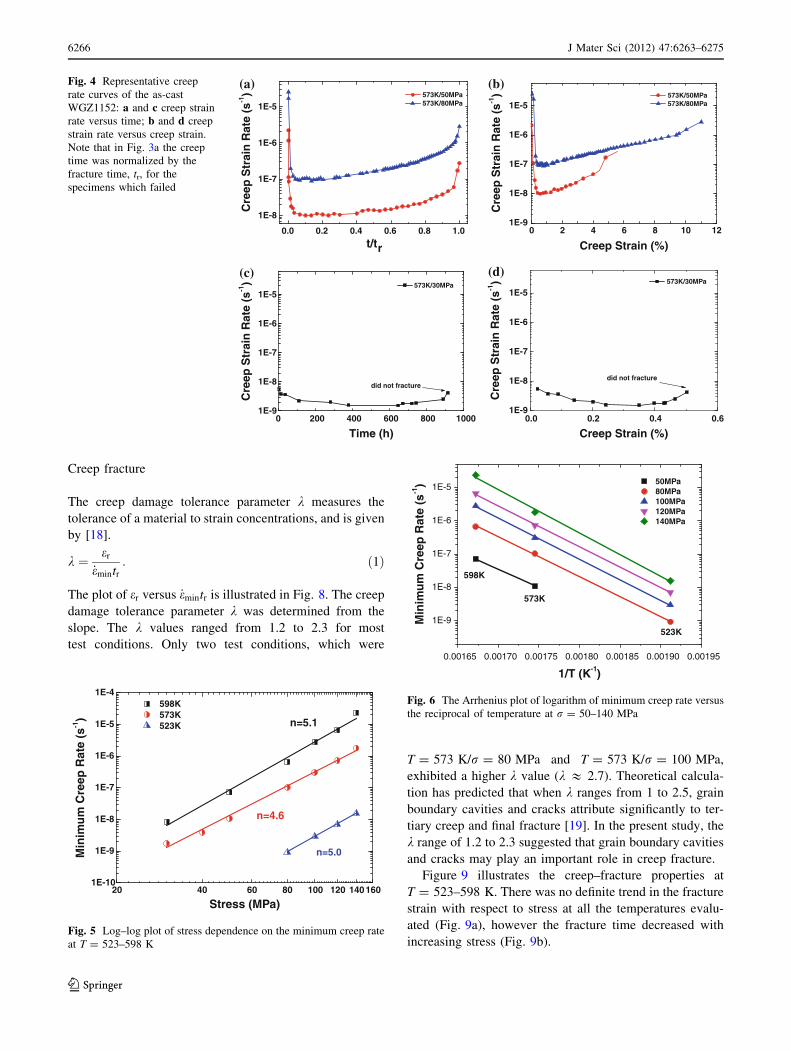
Figure 3 illustrates representative creep curves of as-
cast WGZ1152 at T = 573 K and r = 30–80 MPa. The
creep resistance decreased with increasing stress. The
corresponding creep strain rate versus creep strain curves
are illustrated in Fig. 4. After the primary creep stage, the
creep strain rate reached a minimum, and then increased
quite slowly with increasing strain. In the tertiary creep
regime, the creep strain rate increased with increasing
strain until fracture occurred.
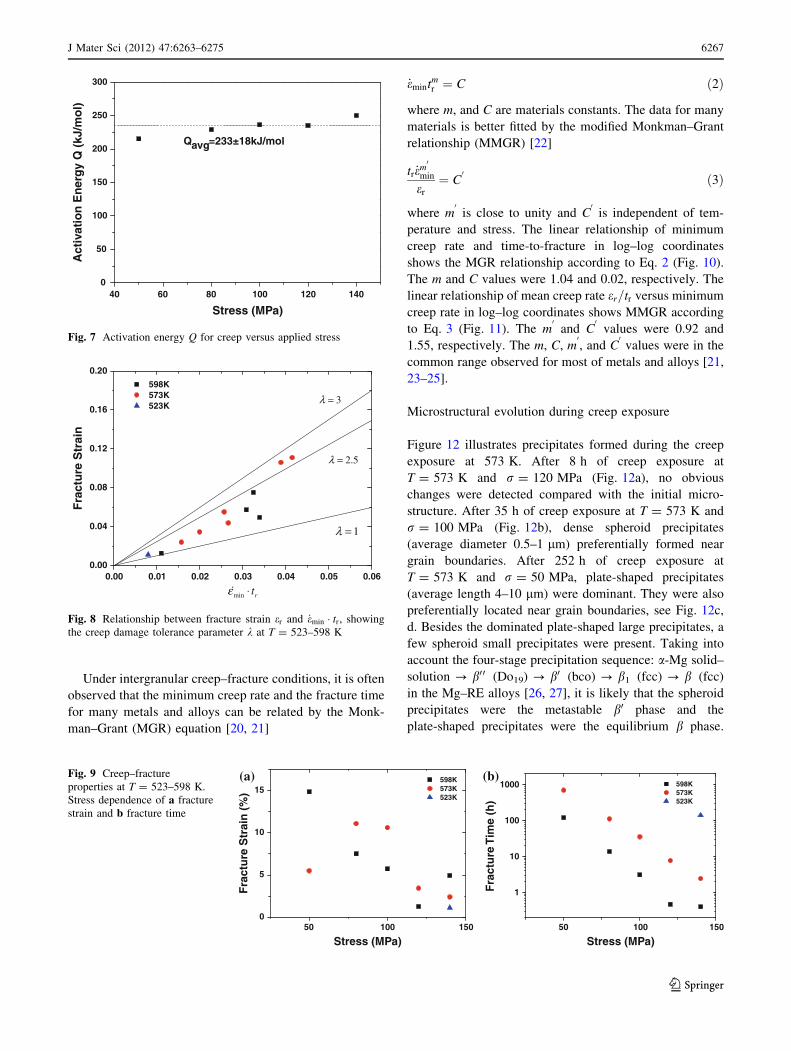
Figure 5 shows the log–log plot of the stress dependence
on the minimum creep rate at T = 523–598 K. The creep
stress exponent n was determined from the slope. For 523,
573, and 598 K the n values were 5.0, 4.6 and 5.1,
respectively. The Arrhenius plot of the logarithm of the
minimum creep rate versus the reciprocal of temperature at
stresses between 50 and 140 MPa is illustrated in Fig. 6.
The activation energy for creep was determined from the
slope. The activation energy for creep was independent of
stress within the experimental deviation (Fig. 7). The
average activation energy for creep Qavg was 233 ±
18 kJ/mol for all the stress levels examined.
Fig. 1 a Optical photomicrograph and b secondary electron SEM photomicrograph of the as-cast WGZ1152 showing its representative
microstructure
Fig. 2 Minimum creep rates of the as-cast WGZ1152 in comparison
with WE54-T6 and HZ32-T5
0 200 400 600 800 1000 12000
2
4
6
8
10
12
did not fractureCre
ep S
trai
n (
%)
Time (h)
573K/30MPa 573K/50MPa 573K/80MPa
Fig. 3 Representative creep curves of the as-cast WGZ1152
J Mater Sci (2012) 47:6263–6275 6265
123
Creep fracture
The creep damage tolerance parameter k measures the
tolerance of a material to strain concentrations, and is given
by [18].
k ¼ er
_emintr: ð1Þ
The plot of er versus _emintr is illustrated in Fig. 8. The creep
damage tolerance parameter k was determined from the
slope. The k values ranged from 1.2 to 2.3 for most
test conditions. Only two test conditions, which were
T = 573 K/r = 80 MPa and T = 573 K/r = 100 MPa,
exhibited a higher k value (k & 2.7). Theoretical calcula-
tion has predicted that when k ranges from 1 to 2.5, grain
boundary cavities and cracks attribute significantly to ter-
tiary creep and final fracture [19]. In the present study, the
k range of 1.2 to 2.3 suggested that grain boundary cavities
and cracks may play an important role in creep fracture.
Figure 9 illustrates the creep–fracture properties at
T = 523–598 K. There was no definite trend in the fracture
strain with respect to stress at all the temperatures evalu-
ated (Fig. 9a), however the fracture time decreased with
increasing stress (Fig. 9b).
1E-8
1E-7
1E-6
1E-5
Cre
ep S
trai
n R
ate
(s-1) 573K/50MPa
573K/80MPa
t/tr
1E-9
1E-8
1E-7
1E-6
1E-5
Cre
ep S
trai
n R
ate
(s-1)
Creep Strain (%)
573K/50MPa 573K/80MPa
(a) (b)
1E-9
1E-8
1E-7
1E-6
1E-5
did not fracture
Cre
ep S
trai
n R
ate
(s-1)
Time (h)
573K/30MPa
0.0 0.2 0.4 0.6 0.8 1.0 0 2 4 6 8 10 12
0 200 400 600 800 1000 0.0 0.2 0.4 0.61E-9
1E-8
1E-7
1E-6
1E-5
did not fracture
Cre
ep S
trai
n R
ate
(s-1)
Creep Strain (%)
573K/30MPa(d)(c)
Fig. 4 Representative creep
rate curves of the as-cast
WGZ1152: a and c creep strain
rate versus time; b and d creep
strain rate versus creep strain.
Note that in Fig. 3a the creep
time was normalized by the
fracture time, tr, for the
specimens which failed
160140120100806040201E-10
1E-9
1E-8
1E-7
1E-6
1E-5
1E-4
n=5.0
n=4.6
n=5.1
598K 573K 523K
Min
imu
m C
reep
Rat
e (s
-1)
Stress (MPa)
Fig. 5 Log–log plot of stress dependence on the minimum creep rate
at T = 523–598 K
0.00165 0.00170 0.00175 0.00180 0.00185 0.00190 0.00195
1E-9
1E-8
1E-7
1E-6
1E-5
523K
573K
598K
50MPa 80MPa 100MPa 120MPa 140MPa
Min
imu
m C
reep
Rat
e (s
-1)
1/T (K-1)
Fig. 6 The Arrhenius plot of logarithm of minimum creep rate versus
the reciprocal of temperature at r = 50–140 MPa
6266 J Mater Sci (2012) 47:6263–6275
123
Under intergranular creep–fracture conditions, it is often
observed that the minimum creep rate and the fracture time
for many metals and alloys can be related by the Monk-
man–Grant (MGR) equation [20, 21]
_emintmr ¼ C ð2Þ
where m, and C are materials constants. The data for many
materials is better fitted by the modified Monkman–Grant
relationship (MMGR) [22]
tr _em0
min
er
¼ C0 ð3Þ
where m0
is close to unity and C0
is independent of tem-
perature and stress. The linear relationship of minimum
creep rate and time-to-fracture in log–log coordinates
shows the MGR relationship according to Eq. 2 (Fig. 10).
The m and C values were 1.04 and 0.02, respectively. The
linear relationship of mean creep rate er=tr versus minimum
creep rate in log–log coordinates shows MMGR according
to Eq. 3 (Fig. 11). The m0
and C0
values were 0.92 and
1.55, respectively. The m, C, m0, and C
0values were in the
common range observed for most of metals and alloys [21,
23–25].
Microstructural evolution during creep exposure
Figure 12 illustrates precipitates formed during the creep
exposure at 573 K. After 8 h of creep exposure at
T = 573 K and r = 120 MPa (Fig. 12a), no obvious
changes were detected compared with the initial micro-
structure. After 35 h of creep exposure at T = 573 K and
r = 100 MPa (Fig. 12b), dense spheroid precipitates
(average diameter 0.5–1 lm) preferentially formed near
grain boundaries. After 252 h of creep exposure at
T = 573 K and r = 50 MPa, plate-shaped precipitates
(average length 4–10 lm) were dominant. They were also
preferentially located near grain boundaries, see Fig. 12c,
d. Besides the dominated plate-shaped large precipitates, a
few spheroid small precipitates were present. Taking into
account the four-stage precipitation sequence: a-Mg solid–
solution ? b00 (Do19) ? b0 (bco) ? b1 (fcc) ? b (fcc)
in the Mg–RE alloys [26, 27], it is likely that the spheroid
precipitates were the metastable b0 phase and the
plate-shaped precipitates were the equilibrium b phase.
40 60 80 100 120 1400
50
100
150
200
250
300
Qavg=233±18kJ/mol
Act
ivat
ion
En
erg
y Q
(kJ
/mo
l)
Stress (MPa)
Fig. 7 Activation energy Q for creep versus applied stress
0.00 0.01 0.02 0.03 0.04 0.05 0.060.00
0.04
0.08
0.12
0.16
0.20
3λ =
2.5λ =
1λ =
598K 573K 523K
Fra
ctu
re S
trai
n
min rt⋅
Fig. 8 Relationship between fracture strain er and _emin � tr, showing
the creep damage tolerance parameter k at T = 523–598 K
150100500
5
10
15 598K 573K 523K
Fra
ctu
re S
trai
n (
%)
Stress (MPa)15010050
1
10
100
1000 598K 573K 523K
Fra
ctu
re T
ime
(h)
Stress (MPa)
(a) (b)Fig. 9 Creep–fracture
properties at T = 523–598 K.
Stress dependence of a fracture
strain and b fracture time
J Mater Sci (2012) 47:6263–6275 6267
123
Therefore, it is suggested that the dominant precipitates
changed from b0 phase to b phase with increasing creep
time.
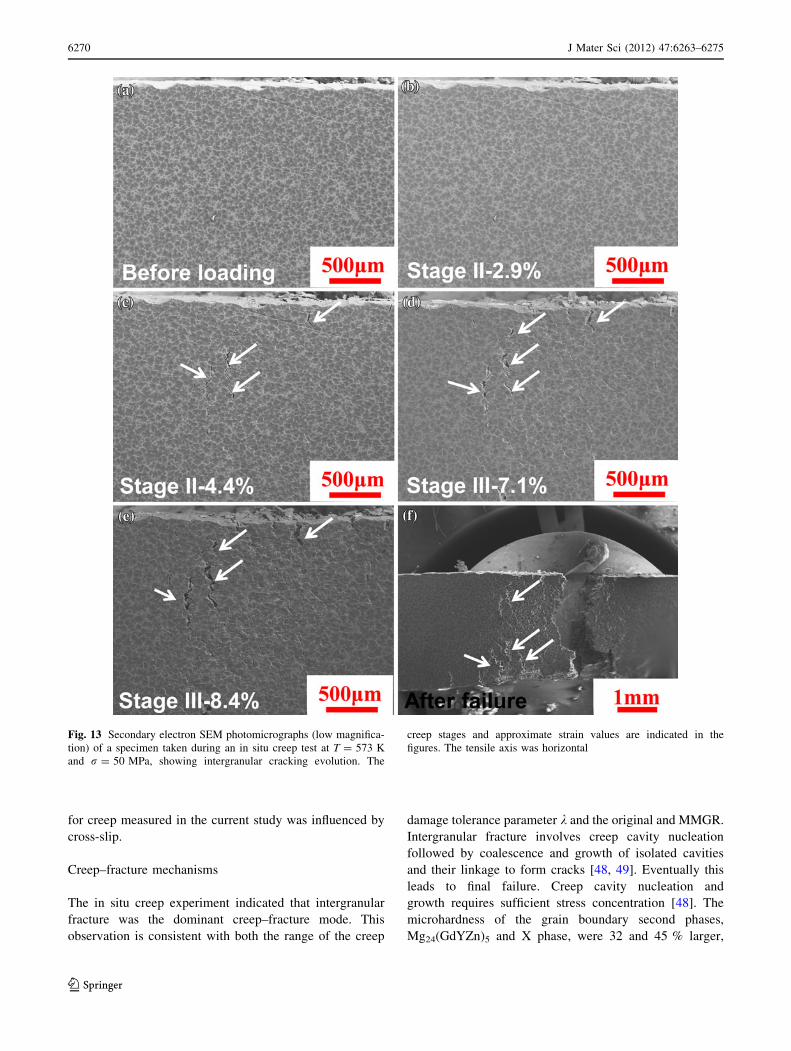
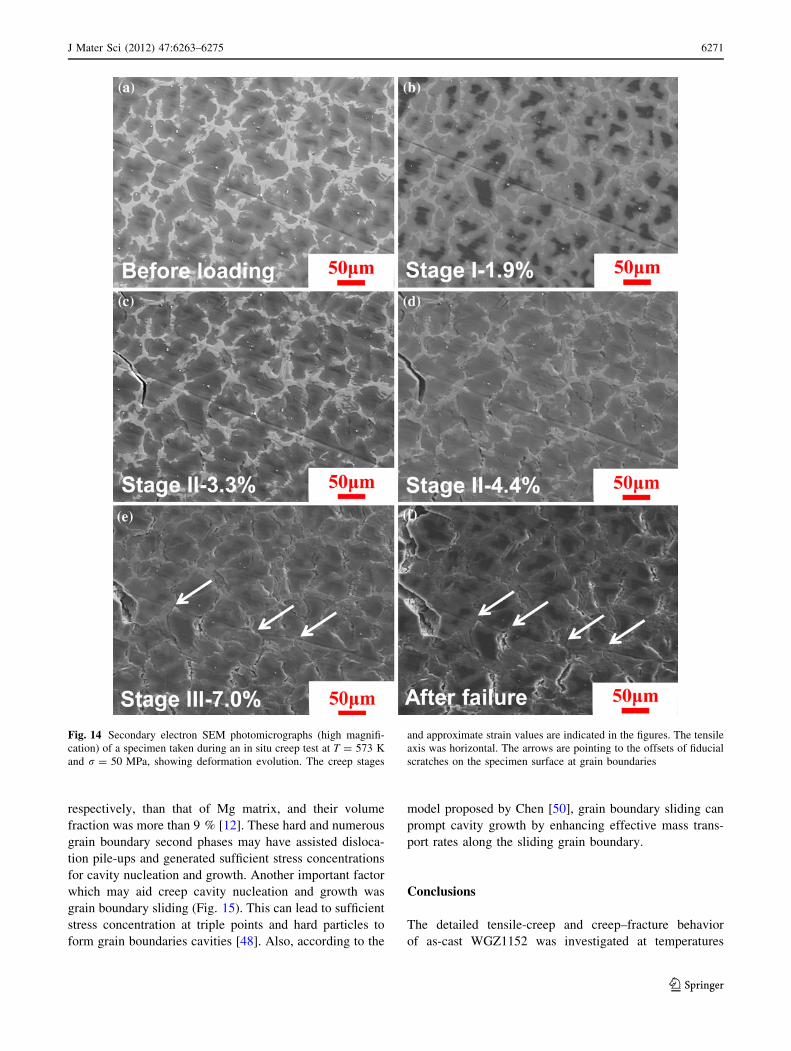
Figures 13 and 14 (low and high magnification) illus-
trate the deformation evolution during the in situ creep test
at T = 573 K and r = 50 MPa. No obvious cracking was
observed in the primary creep regime (Fig. 14b) and early
stages of the secondary creep regime (Fig. 13b). Cracking
became obvious within the later stages of the secondary
creep regime (Fig. 14c). Cracking initiated preferentially at
grain boundaries and near second phases located along the
grain boundaries. The crack propagation tended to follow
the grain boundaries. With increased creep time, the
intergranular cracks grew in length and width. The offsets
of fiducial scratches on the specimen surface were
observed at grain boundaries (Fig. 14, indicated with
arrows), and with increased creep time, the offset distances
became larger. This indicated that grain boundary sliding
may play an important role in the creep deformation and
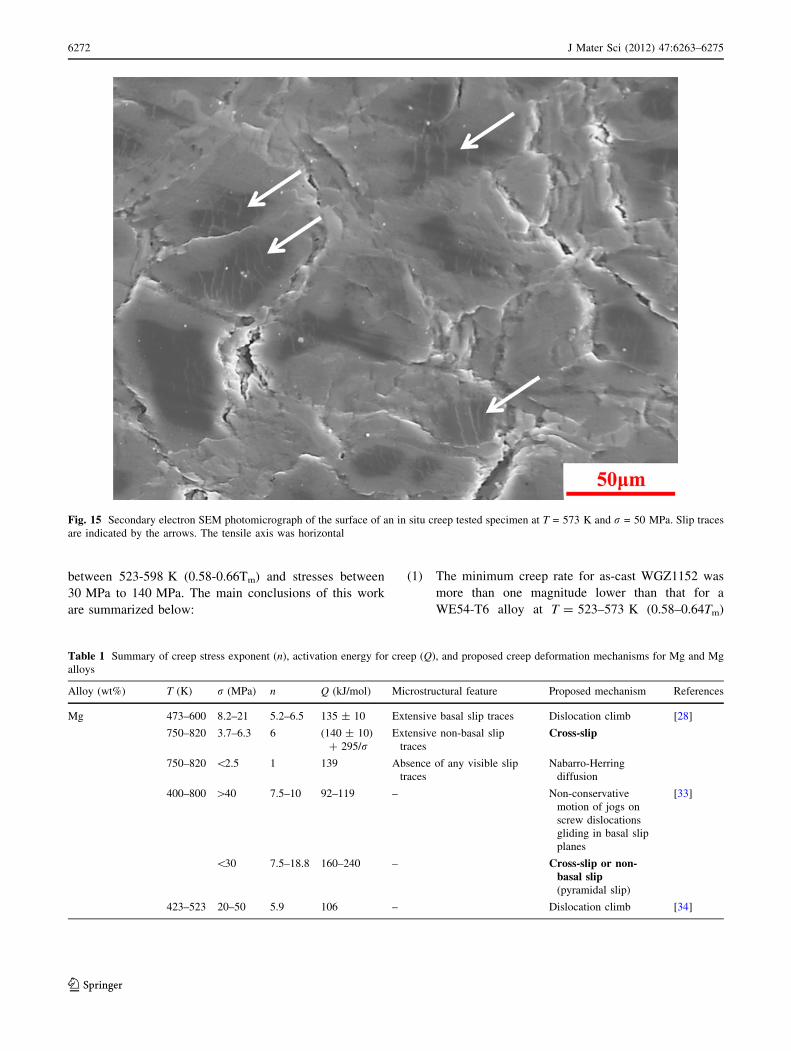
fracture. Some short wavy slip traces were observed on the
surface of the sample in situ creep tested at T = 573 K and
r = 50 MPa (Fig. 15). Although the slip systems were not
identified for these slip traces, the wavy slip trace suggests
that non-basal slip and cross-slip were active [28, 29].
Discussion
Creep deformation mechanisms
At elevated temperatures, the minimum creep rate (_emin) of
many metals and alloys is generally described by the fol-
lowing equation [4, 28–31]
_emin ¼ Arn expð�Q=RTÞ ð4Þ
where A is a material constant, r is the stress, n is the stress
exponent, Q is the activation energy for creep, R is the gas
constant and T is the absolute temperature. Based on Eq. 4,
the n and Q can be defined by
n ¼ ½o ln _emin
o ln r�T ð5Þ
Q ¼ ½ o ln _emin
oð�1=RTÞ�r ð6Þ
the n and Q are sometimes useful for determining the
dominant creep deformation mechanisms empirically.
As seen in Fig. 5, the n was close to 5 for all the test
temperatures examined implying that dislocation creep
was the creep mechanism [30, 32]. For dislocation creep
[4, 30, 32], it is generally accepted that the flow stress is
thermal and athermal components. The athermal compo-
nent is a long-range component of flow stress. The ther-
mal component is local and thermal activated, and it can
help the dislocations overcome the obstacles effectively
during creep. Viscous glide, dislocation climb, cross-slip,
and dislocation jogs are important thermally-aided dislo-
cation creep mechanisms [4]. It should be noted that
different mechanisms may operate simultaneously.
Table 1 summaries the creep stress exponent (n), activa-
tion energy for creep (Q), and proposed creep deforma-
tion mechanisms for pure Mg [28, 29, 33, 34] and some
Mg alloys, including Mg–Al based alloys [28, 29, 35–39],
Mg–Zn based alloys [40, 41], Mg–Y based alloys [10, 24,
42–47], Mg–Gd based alloys [9, 10, 44], and Mg–Sc
based alloys [10]. As shown in table 1, an n value of *5
is commonly observed for Mg and Mg alloys and the
creep mechanism is believed to be dislocation creep. The
1000 10000 100000 1000000 1E71E-9
1E-8
1E-7
1E-6
1E-5
1E-4
598K 573K 523K
Min
imu
m C
reep
Rat
e (s
-1)
Fracture Time (s)
min
m
rt Cε•
=
2
1.04
0.02
. 0.95
m
C
Adj R
==
=
Fig. 10 Log–Log plot of minimum creep rate versus fracture time at
T = 523–598 K and stresses between 50 and 140 MPa showing
Monkman–Grant relationship (MGR)
1E-8 1E-7 1E-6 1E-5 1E-41E-8
1E-7
1E-6
1E-5
1E-4 598K 573K 523K
r/tr (
s-1)
Minimum Creep Rate (s-1)
'
'minm
r
r
tC
ε⋅ =
'
'
2
0.92
1.55
. 0.97
m
C
Adj R
==
=
Fig. 11 Log–Log plot of er=tr versus minimum creep rate at
T = 523–598 K and stresses between 50 and 140 MPa showing
modified Monkman–Grant relationship (MMGR)
6268 J Mater Sci (2012) 47:6263–6275
123
Q value creep can provide more information about the
specified thermally-aided dislocation creep mechanisms.
The measured Qavg value of the studied alloy was
233 ± 18 kJ/mol, and this value was significantly higher
than the activation energy for lattice self-diffusion of pure
Mg (135 kJ/mol) [1]. Similar Q values have been reported
by Vagarali et al. [28, 29], Milika et al. [33], Suzuki et al.
[42, 43], and Regev et al. [37, 38]. Vagarali et al. [28]
performed tensile creep tests for pure Mg and found that
the activation energy for creep was 190–220 ± 10 kJ/mol
for temperature between 750 and 820 K and stresses
between 3.7 and 6.3 MPa, and there was evidence of non-
basal slip. They compared the cross-slip mechanisms
developed by Friedel with their experimental data, and
concluded that the creep deformation was controlled by
the rate of cross-slip of dislocations from the basal to the
prismatic planes. They also studied the creep behavior of
a M–0.8Al solid–solution alloy, and found a Q value of
230 ± 15 kJ/mol at temperatures of 750–810 K and
stresses below 10 MPa [29]. The most important micro-
structural features were extensive non-basal slip traces
and some isolated, but well-defined sub-boundaries. As in
their previous study for pure Mg, the experimental data
were in agreement with a cross-slip mechanism. Thus,
they concluded the cross-slip of screw dislocations from
the basal to the prismatic planes was the rate-controlling
mechanism. Milika et al. [33] reported an activation
energy for creep of 160–240 kJ/mol for pure Mg at
temperatures of 400–800 K and stresses below 30 MPa.
They suggested the cross-slip of screw dislocations from
the basal to the pyramidal planes and pyramidal slip
limited by nucleation of kink motion were the possible
dislocation creep mechanisms. Suzuki et al. [42, 43]
studied the creep behavior of binary Mg–(0.7–3.9)Y
alloys at temperatures between 550 and 650 K and
stresses between 4 and 40 MPa. An Q value of
230–290 kJ/mol was reported, and cross-slip of screw
\a[-dislocations were observed at T = 650 K. They
believed that the relatively high activation energy was
associated with cross-slip. Regev et al. [37, 38] studied
the creep behavior of AZ91D at temperatures between
392 and 453 K and stresses between 40 and 115 MPa.
Their Q vaule was 94–220 kJ/mol, and non-basal dislo-
cation segments were identified using TEM. They pro-
posed that cross-slip might control the creep deformation.
Thus, it is reasonable to believe that the activation energy
Fig. 12 a–c Optical photomicrographs and d Secondary electron
SEM photomicrograph of specimens creep tested to different creep
times: a 8 h (T = 573 K and r = 120 MPa), b 35 h (T = 573 K and
r = 100 MPa), c and d 252 h (T = 573 K and r = 50 MPa). The
tensile axis was horizontal
J Mater Sci (2012) 47:6263–6275 6269
123
for creep measured in the current study was influenced by
cross-slip.
Creep–fracture mechanisms
The in situ creep experiment indicated that intergranular
fracture was the dominant creep–fracture mode. This
observation is consistent with both the range of the creep
damage tolerance parameter k and the original and MMGR.
Intergranular fracture involves creep cavity nucleation
followed by coalescence and growth of isolated cavities
and their linkage to form cracks [48, 49]. Eventually this
leads to final failure. Creep cavity nucleation and
growth requires sufficient stress concentration [48]. The
microhardness of the grain boundary second phases,
Mg24(GdYZn)5 and X phase, were 32 and 45 % larger,
Fig. 13 Secondary electron SEM photomicrographs (low magnifica-
tion) of a specimen taken during an in situ creep test at T = 573 K
and r = 50 MPa, showing intergranular cracking evolution. The
creep stages and approximate strain values are indicated in the
figures. The tensile axis was horizontal
6270 J Mater Sci (2012) 47:6263–6275
123
respectively, than that of Mg matrix, and their volume
fraction was more than 9 % [12]. These hard and numerous
grain boundary second phases may have assisted disloca-
tion pile-ups and generated sufficient stress concentrations
for cavity nucleation and growth. Another important factor
which may aid creep cavity nucleation and growth was
grain boundary sliding (Fig. 15). This can lead to sufficient
stress concentration at triple points and hard particles to
form grain boundaries cavities [48]. Also, according to the
model proposed by Chen [50], grain boundary sliding can
prompt cavity growth by enhancing effective mass trans-
port rates along the sliding grain boundary.
Conclusions
The detailed tensile-creep and creep–fracture behavior
of as-cast WGZ1152 was investigated at temperatures
Fig. 14 Secondary electron SEM photomicrographs (high magnifi-
cation) of a specimen taken during an in situ creep test at T = 573 K
and r = 50 MPa, showing deformation evolution. The creep stages
and approximate strain values are indicated in the figures. The tensile
axis was horizontal. The arrows are pointing to the offsets of fiducial
scratches on the specimen surface at grain boundaries
J Mater Sci (2012) 47:6263–6275 6271
123
between 523-598 K (0.58-0.66Tm) and stresses between
30 MPa to 140 MPa. The main conclusions of this work
are summarized below:
(1) The minimum creep rate for as-cast WGZ1152 was
more than one magnitude lower than that for a
WE54-T6 alloy at T = 523–573 K (0.58–0.64Tm)
Fig. 15 Secondary electron SEM photomicrograph of the surface of an in situ creep tested specimen at T = 573 K and r = 50 MPa. Slip traces
are indicated by the arrows. The tensile axis was horizontal
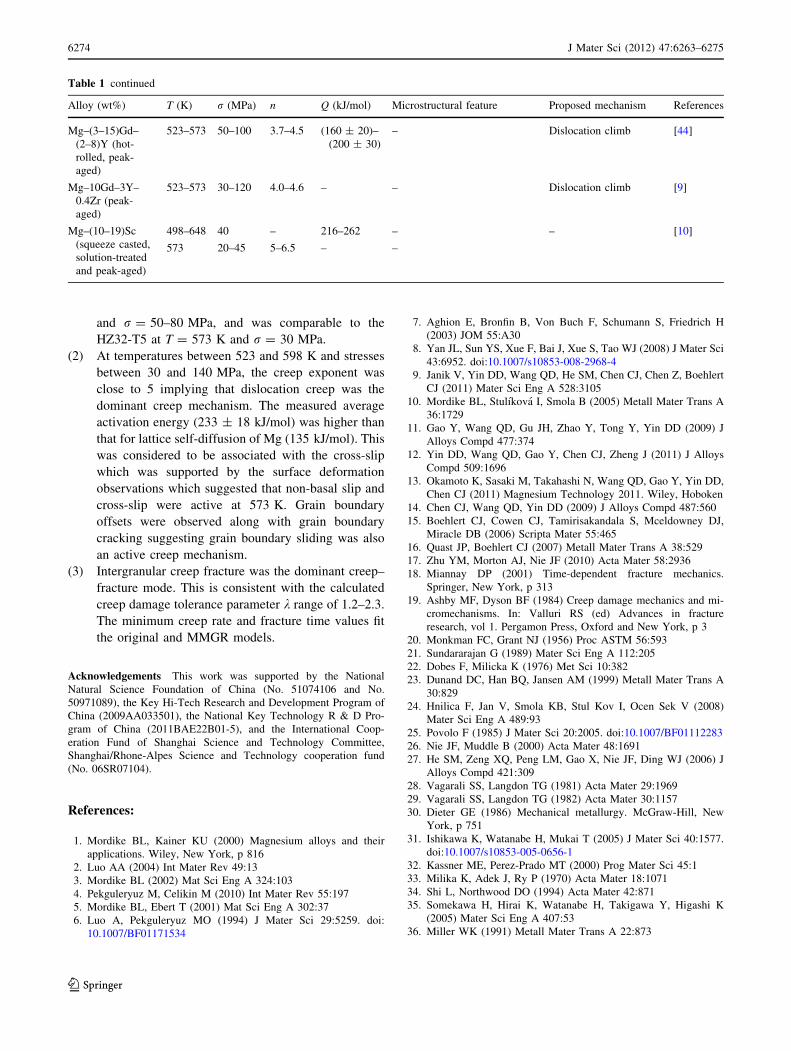
Table 1 Summary of creep stress exponent (n), activation energy for creep (Q), and proposed creep deformation mechanisms for Mg and Mg
alloys
Alloy (wt%) T (K) r (MPa) n Q (kJ/mol) Microstructural feature Proposed mechanism References
Mg 473–600 8.2–21 5.2–6.5 135 ± 10 Extensive basal slip traces Dislocation climb [28]
750–820 3.7–6.3 6 (140 ± 10)
? 295/rExtensive non-basal slip
traces
Cross-slip
750–820 \2.5 1 139 Absence of any visible slip
traces
Nabarro-Herring
diffusion
400–800 [40 7.5–10 92–119 – Non-conservative
motion of jogs on
screw dislocations
gliding in basal slip
planes
[33]
\30 7.5–18.8 160–240 – Cross-slip or non-basal slip(pyramidal slip)
423–523 20–50 5.9 106 – Dislocation climb [34]
6272 J Mater Sci (2012) 47:6263–6275
123
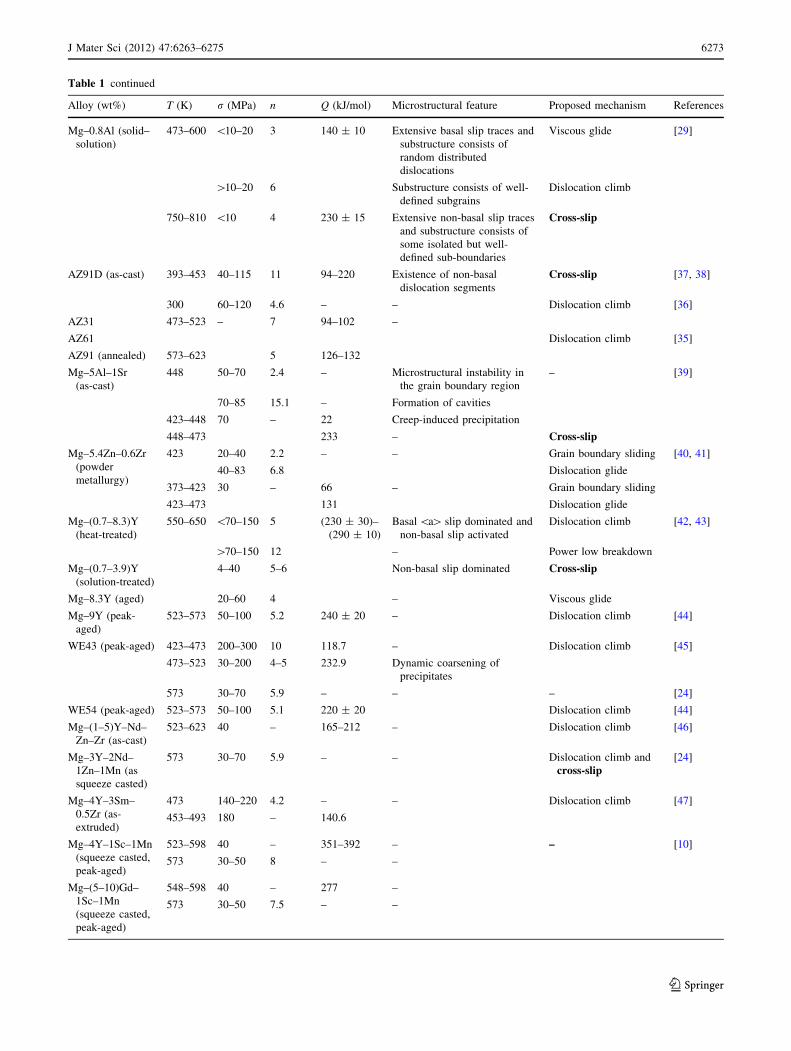
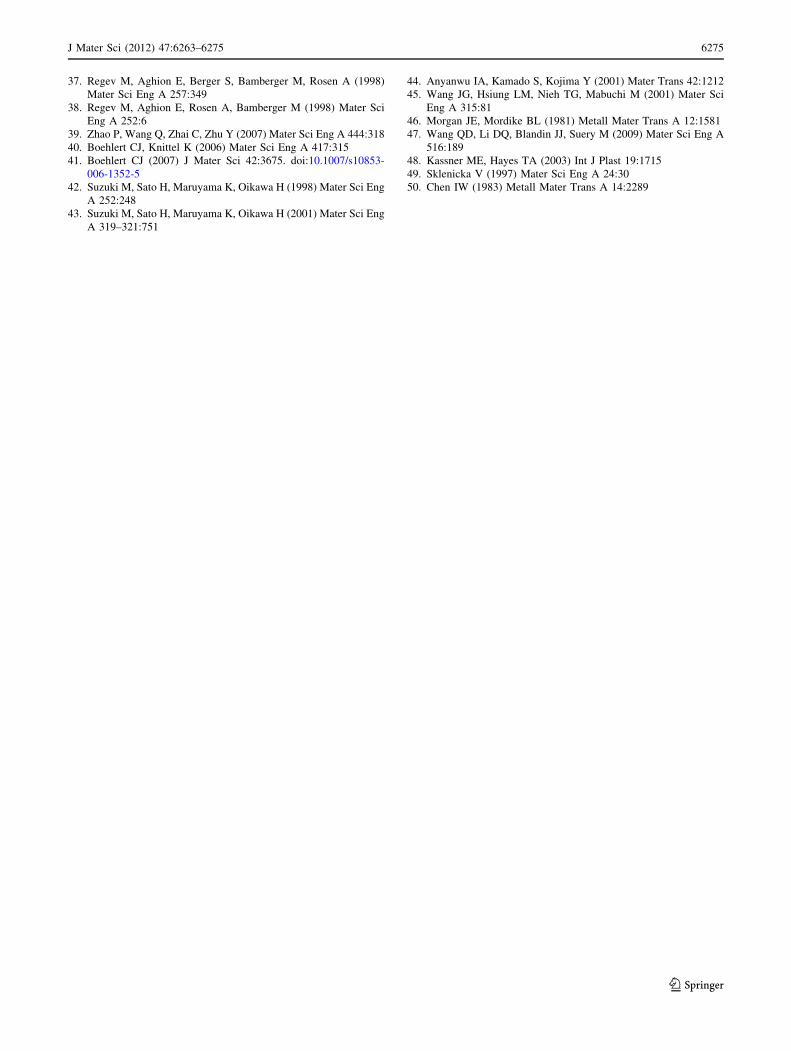
Table 1 continued
Alloy (wt%) T (K) r (MPa) n Q (kJ/mol) Microstructural feature Proposed mechanism References
Mg–0.8Al (solid–
solution)
473–600 \10–20 3 140 ± 10 Extensive basal slip traces and
substructure consists of
random distributed
dislocations
Viscous glide [29]
[10–20 6 Substructure consists of well-
defined subgrains
Dislocation climb
750–810 \10 4 230 ± 15 Extensive non-basal slip traces
and substructure consists of
some isolated but well-
defined sub-boundaries
Cross-slip
AZ91D (as-cast) 393–453 40–115 11 94–220 Existence of non-basal
dislocation segments
Cross-slip [37, 38]
300 60–120 4.6 – – Dislocation climb [36]
AZ31 473–523 – 7 94–102 –
AZ61 Dislocation climb [35]
AZ91 (annealed) 573–623 5 126–132
Mg–5Al–1Sr
(as-cast)
448 50–70 2.4 – Microstructural instability in
the grain boundary region
– [39]
70–85 15.1 – Formation of cavities
423–448 70 – 22 Creep-induced precipitation
448–473 233 – Cross-slip
Mg–5.4Zn–0.6Zr
(powder
metallurgy)
423 20–40 2.2 – – Grain boundary sliding [40, 41]
40–83 6.8 Dislocation glide
373–423 30 – 66 – Grain boundary sliding
423–473 131 Dislocation glide
Mg–(0.7–8.3)Y
(heat-treated)
550–650 \70–150 5 (230 ± 30)–
(290 ± 10)
Basal \a[ slip dominated and
non-basal slip activated
Dislocation climb [42, 43]
[70–150 12 – Power low breakdown
Mg–(0.7–3.9)Y
(solution-treated)
4–40 5–6 Non-basal slip dominated Cross-slip
Mg–8.3Y (aged) 20–60 4 – Viscous glide
Mg–9Y (peak-
aged)
523–573 50–100 5.2 240 ± 20 – Dislocation climb [44]
WE43 (peak-aged) 423–473 200–300 10 118.7 – Dislocation climb [45]
473–523 30–200 4–5 232.9 Dynamic coarsening of
precipitates
573 30–70 5.9 – – – [24]
WE54 (peak-aged) 523–573 50–100 5.1 220 ± 20 Dislocation climb [44]
Mg–(1–5)Y–Nd–
Zn–Zr (as-cast)
523–623 40 – 165–212 – Dislocation climb [46]
Mg–3Y–2Nd–
1Zn–1Mn (as
squeeze casted)
573 30–70 5.9 – – Dislocation climb and
cross-slip[24]
Mg–4Y–3Sm–
0.5Zr (as-
extruded)
473 140–220 4.2 – – Dislocation climb [47]
453–493 180 – 140.6
Mg–4Y–1Sc–1Mn
(squeeze casted,
peak-aged)
523–598 40 – 351–392 – – [10]
573 30–50 8 – –
Mg–(5–10)Gd–
1Sc–1Mn
(squeeze casted,
peak-aged)
548–598 40 – 277 –
573 30–50 7.5 – –
J Mater Sci (2012) 47:6263–6275 6273
123
and r = 50–80 MPa, and was comparable to the
HZ32-T5 at T = 573 K and r = 30 MPa.
(2) At temperatures between 523 and 598 K and stresses
between 30 and 140 MPa, the creep exponent was
close to 5 implying that dislocation creep was the
dominant creep mechanism. The measured average
activation energy (233 ± 18 kJ/mol) was higher than
that for lattice self-diffusion of Mg (135 kJ/mol). This
was considered to be associated with the cross-slip
which was supported by the surface deformation
observations which suggested that non-basal slip and
cross-slip were active at 573 K. Grain boundary
offsets were observed along with grain boundary
cracking suggesting grain boundary sliding was also
an active creep mechanism.
(3) Intergranular creep fracture was the dominant creep–
fracture mode. This is consistent with the calculated
creep damage tolerance parameter k range of 1.2–2.3.
The minimum creep rate and fracture time values fit
the original and MMGR models.
Acknowledgements This work was supported by the National
Natural Science Foundation of China (No. 51074106 and No.
50971089), the Key Hi-Tech Research and Development Program of
China (2009AA033501), the National Key Technology R & D Pro-
gram of China (2011BAE22B01-5), and the International Coop-
eration Fund of Shanghai Science and Technology Committee,
Shanghai/Rhone-Alpes Science and Technology cooperation fund
(No. 06SR07104).
References:
1. Mordike BL, Kainer KU (2000) Magnesium alloys and their
applications. Wiley, New York, p 816
2. Luo AA (2004) Int Mater Rev 49:13
3. Mordike BL (2002) Mat Sci Eng A 324:103
4. Pekguleryuz M, Celikin M (2010) Int Mater Rev 55:197
5. Mordike BL, Ebert T (2001) Mat Sci Eng A 302:37
6. Luo A, Pekguleryuz MO (1994) J Mater Sci 29:5259. doi:
10.1007/BF01171534
7. Aghion E, Bronfin B, Von Buch F, Schumann S, Friedrich H
(2003) JOM 55:A30
8. Yan JL, Sun YS, Xue F, Bai J, Xue S, Tao WJ (2008) J Mater Sci
43:6952. doi:10.1007/s10853-008-2968-4
9. Janik V, Yin DD, Wang QD, He SM, Chen CJ, Chen Z, Boehlert
CJ (2011) Mater Sci Eng A 528:3105
10. Mordike BL, Stulıkova I, Smola B (2005) Metall Mater Trans A
36:1729
11. Gao Y, Wang QD, Gu JH, Zhao Y, Tong Y, Yin DD (2009) J
Alloys Compd 477:374
12. Yin DD, Wang QD, Gao Y, Chen CJ, Zheng J (2011) J Alloys
Compd 509:1696
13. Okamoto K, Sasaki M, Takahashi N, Wang QD, Gao Y, Yin DD,
Chen CJ (2011) Magnesium Technology 2011. Wiley, Hoboken
14. Chen CJ, Wang QD, Yin DD (2009) J Alloys Compd 487:560
15. Boehlert CJ, Cowen CJ, Tamirisakandala S, Mceldowney DJ,
Miracle DB (2006) Scripta Mater 55:465
16. Quast JP, Boehlert CJ (2007) Metall Mater Trans A 38:529
17. Zhu YM, Morton AJ, Nie JF (2010) Acta Mater 58:2936
18. Miannay DP (2001) Time-dependent fracture mechanics.
Springer, New York, p 313
19. Ashby MF, Dyson BF (1984) Creep damage mechanics and mi-
cromechanisms. In: Valluri RS (ed) Advances in fracture
research, vol 1. Pergamon Press, Oxford and New York, p 3
20. Monkman FC, Grant NJ (1956) Proc ASTM 56:593
21. Sundararajan G (1989) Mater Sci Eng A 112:205
22. Dobes F, Milicka K (1976) Met Sci 10:382
23. Dunand DC, Han BQ, Jansen AM (1999) Metall Mater Trans A
30:829
24. Hnilica F, Jan V, Smola KB, Stul Kov I, Ocen Sek V (2008)
Mater Sci Eng A 489:93
25. Povolo F (1985) J Mater Sci 20:2005. doi:10.1007/BF01112283
26. Nie JF, Muddle B (2000) Acta Mater 48:1691
27. He SM, Zeng XQ, Peng LM, Gao X, Nie JF, Ding WJ (2006) J
Alloys Compd 421:309
28. Vagarali SS, Langdon TG (1981) Acta Mater 29:1969
29. Vagarali SS, Langdon TG (1982) Acta Mater 30:1157
30. Dieter GE (1986) Mechanical metallurgy. McGraw-Hill, New
York, p 751
31. Ishikawa K, Watanabe H, Mukai T (2005) J Mater Sci 40:1577.
doi:10.1007/s10853-005-0656-1
32. Kassner ME, Perez-Prado MT (2000) Prog Mater Sci 45:1
33. Milika K, Adek J, Ry P (1970) Acta Mater 18:1071
34. Shi L, Northwood DO (1994) Acta Mater 42:871
35. Somekawa H, Hirai K, Watanabe H, Takigawa Y, Higashi K
(2005) Mater Sci Eng A 407:53
36. Miller WK (1991) Metall Mater Trans A 22:873
Table 1 continued
Alloy (wt%) T (K) r (MPa) n Q (kJ/mol) Microstructural feature Proposed mechanism References
Mg–(3–15)Gd–
(2–8)Y (hot-
rolled, peak-
aged)
523–573 50–100 3.7–4.5 (160 ± 20)–
(200 ± 30)
– Dislocation climb [44]
Mg–10Gd–3Y–
0.4Zr (peak-
aged)
523–573 30–120 4.0–4.6 – – Dislocation climb [9]
Mg–(10–19)Sc
(squeeze casted,
solution-treated
and peak-aged)
498–648 40 – 216–262 – – [10]
573 20–45 5–6.5 – –
6274 J Mater Sci (2012) 47:6263–6275
123
37. Regev M, Aghion E, Berger S, Bamberger M, Rosen A (1998)
Mater Sci Eng A 257:349
38. Regev M, Aghion E, Rosen A, Bamberger M (1998) Mater Sci
Eng A 252:6
39. Zhao P, Wang Q, Zhai C, Zhu Y (2007) Mater Sci Eng A 444:318
40. Boehlert CJ, Knittel K (2006) Mater Sci Eng A 417:315
41. Boehlert CJ (2007) J Mater Sci 42:3675. doi:10.1007/s10853-
006-1352-5
42. Suzuki M, Sato H, Maruyama K, Oikawa H (1998) Mater Sci Eng
A 252:248
43. Suzuki M, Sato H, Maruyama K, Oikawa H (2001) Mater Sci Eng
A 319–321:751
44. Anyanwu IA, Kamado S, Kojima Y (2001) Mater Trans 42:1212
45. Wang JG, Hsiung LM, Nieh TG, Mabuchi M (2001) Mater Sci
Eng A 315:81
46. Morgan JE, Mordike BL (1981) Metall Mater Trans A 12:1581
47. Wang QD, Li DQ, Blandin JJ, Suery M (2009) Mater Sci Eng A
516:189
48. Kassner ME, Hayes TA (2003) Int J Plast 19:1715
49. Sklenicka V (1997) Mater Sci Eng A 24:30
50. Chen IW (1983) Metall Mater Trans A 14:2289
J Mater Sci (2012) 47:6263–6275 6275
123