Embed Size (px)
Citation preview
Cree Lawson
Founder & CEO
Arrivalist
Joe Ramler
Senior Economist
MT Department of Commerce
2016 EDUCATIONAL SEMINAR FOR TOURISM ORGANIZATIONS (ESTO)

The Opportunity
Airlines, Hotels and Rental Car companies can close the loop.
But Destination Marketers could not – until now...
Airlines, Hotels, and Car Rental advertisers couldshow ROI on ads but Destination Marketers could not.
Here’s Why:
2016 EDUCATIONAL SEMINAR FOR TOURISM ORGANIZATIONS (ESTO)
Target Audience
Home Location
Hotels
Airlines
Car
Rentals
Destinations
Hotels
Airlines
Car
Rentals
Destinations
Advertising Purchase
Responding Audience
HomeLocation
?

Quick Overview: How It Works
Presence = ROI
Types of Media:
• Site Visit
• Banners
• Video
• Mobile
2016 EDUCATIONAL SEMINAR FOR TOURISM ORGANIZATIONS (ESTO)
Advertising
Ad
You’ve
Arrived
App notifies advertiser of arrival
User views Arrivalist
Powered Ads or Content
Welcome!
Hi
User gets relevant ads
while in market
User Moves
Technology finds user in new
location
Advertiser Receivesreport which shows ads
resulted in arrivals
Data Targeting
Multi-ScreenMedia
Geo Location
DataArrivalist Technology
(Patent Pending)
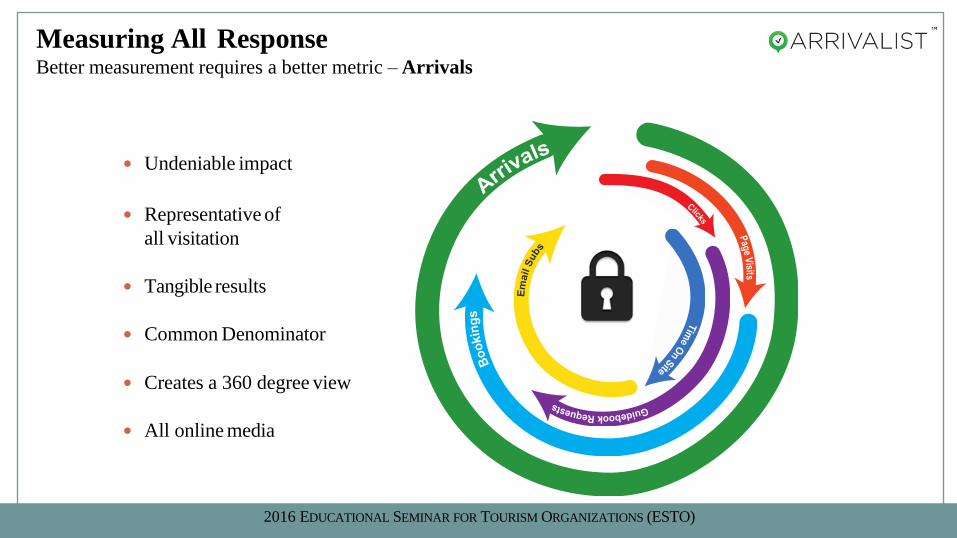
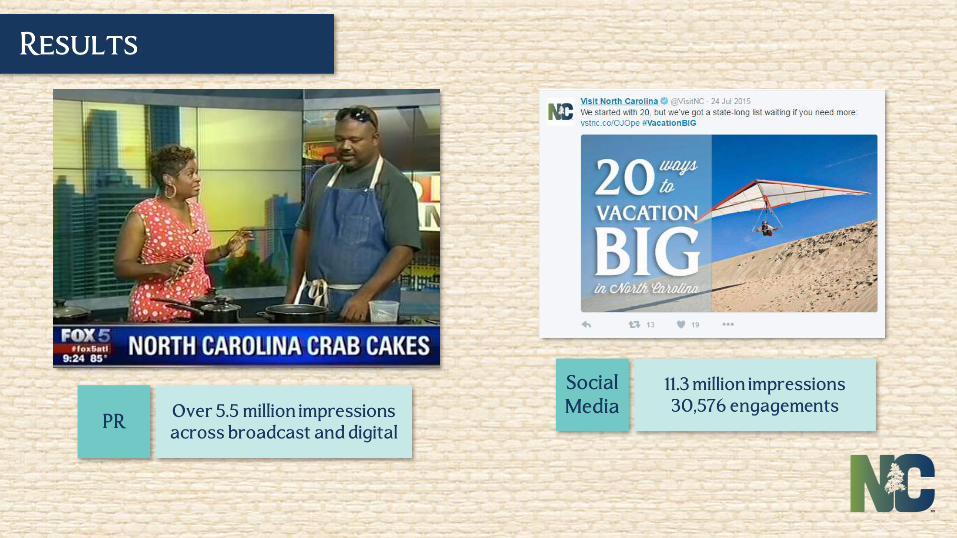
Measuring All ResponseBetter measurement requires a better metric – Arrivals
Undeniable impact
Representative of
all visitation
Tangible results
Common Denominator
Creates a 360 degree view
All online media
2016 EDUCATIONAL SEMINAR FOR TOURISM ORGANIZATIONS (ESTO)

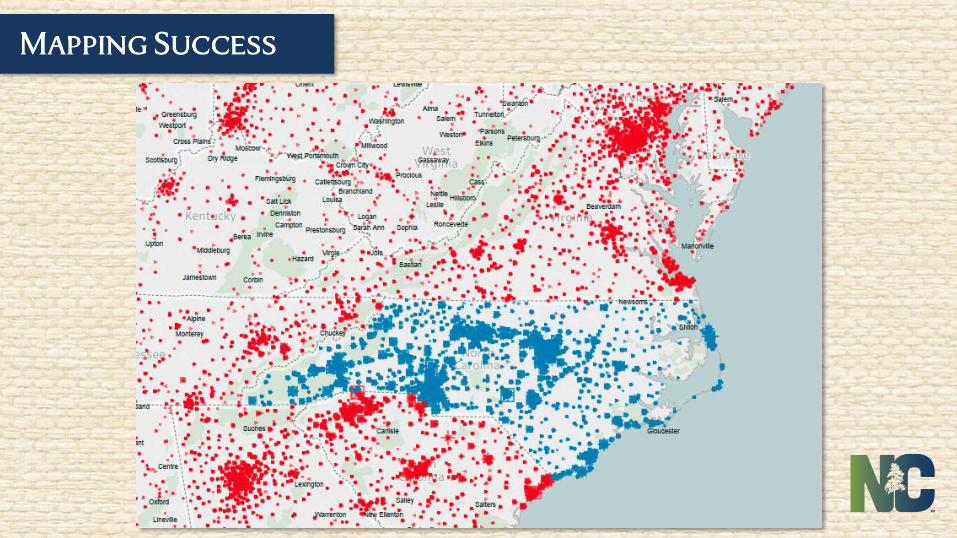
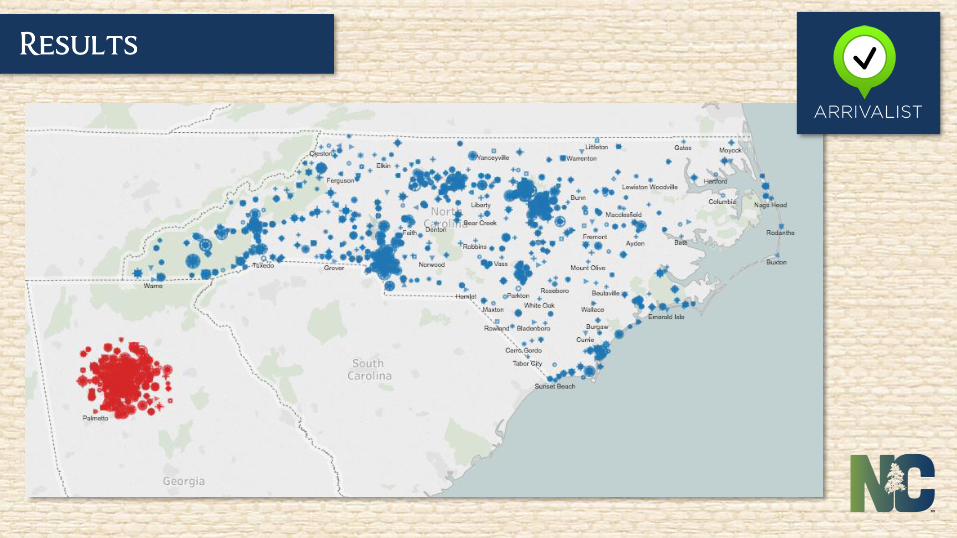
Verified US Arrivals Into Montana by Origin State
October 2015 – August 2016
2016 EDUCATIONAL SEMINAR FOR TOURISM ORGANIZATIONS (ESTO)

Top
Destinations
Rank City
1 Missoula
2 Kalispell
3 Billings
4 Bozeman
5 Great Falls
Verified Arrivals Into Montana from Origins within 300 Miles
September 2015 – August 2016
2016 EDUCATIONAL SEMINAR FOR TOURISM ORGANIZATIONS (ESTO)
Montana
3,988 VerifiedArrivals

3,988 VerifiedArrivals
Top Origin
Markets
Rank City,State
1 Spokane,WA
2 Calgary,AB
3 Boise, ID
4 Sheridan, WY
5Lethbridge,
AB
Origin of Verified Arrivals Into Montana within 300 Miles
September 2015 – August 2016
2016 EDUCATIONAL SEMINAR FOR TOURISM ORGANIZATIONS (ESTO)
Montana

RankOrigin Market
(City, State)% of Verified Arrivals
1 Spokane, WA 10.08%
2 Calgary, AB 8.83%
3 Boise, ID 4.99%
4 Sheridan, WY 4.49%
5 Lethbridge, AB 3.86%
6 Jackson, WY 3.01%
7 Idaho Falls, ID 2.78%
8 Basin, WY 2.58%
9 Williston, ND 2.46%
10 Post Falls, ID 2.23%
11 Cody, WY 1.93%
12 Coeur D Alene, ID 1.68%
13 Powell, WY 1.63%
14 Hayden, ID 1.60%
15 Salmon, ID 1.45%
“Drive Market” Verified Arrivals by Origin (City, State)
September 2015 – August 2016
2016 EDUCATIONAL SEMINAR FOR TOURISM ORGANIZATIONS (ESTO)

Top Regions by
APM
Rank Regions
1 Wyoming
2North
Dakota
3South
Dakota
4 Idaho
5 Washington
2016 MONTANA GOVERNOR’S CONFERENCE ON TOURISM & RECREATION
Verified Arrivals to Montana per 1000 Exposures (APM) by “Drive Market”
September 2015 – August 2016
2016 EDUCATIONAL SEMINAR FOR TOURISM ORGANIZATIONS (ESTO)
Montana

Top Regions by
APM
Rank Regions
1 Alaska
2 Colorado
3 Minnesota
4 Nevada
5 Hawaii
2016 MONTANA GOVERNOR’S CONFERENCE ON TOURISM & RECREATION
Verified Arrivals to Montana per 1000 Exposures (APM) by “Fly Market”
September 2015 – August 2016
2016 EDUCATIONAL SEMINAR FOR TOURISM ORGANIZATIONS (ESTO)
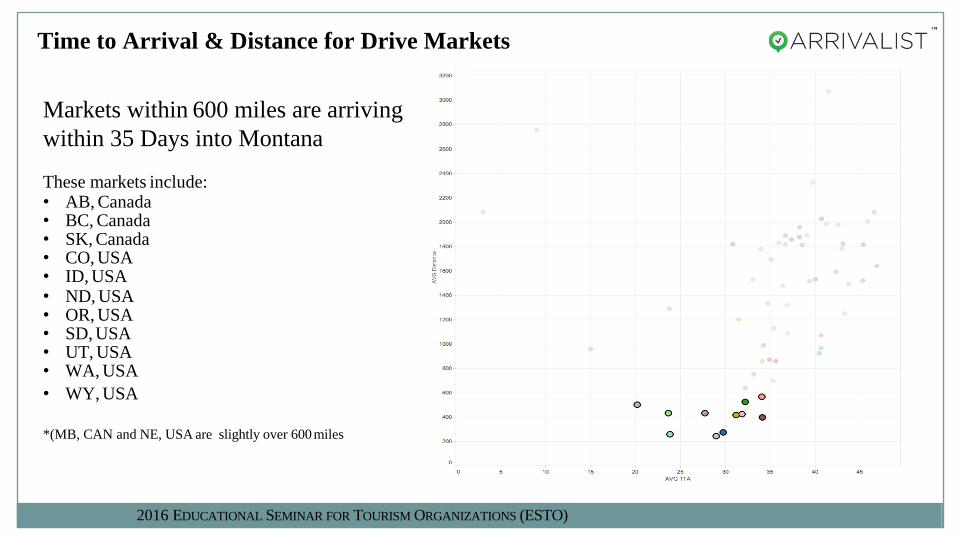
Markets within 600 miles are arriving
within 35 Days into Montana
These markets include:• AB, Canada• BC, Canada• SK, Canada• CO, USA• ID, USA• ND, USA• OR, USA• SD, USA• UT, USA• WA, USA
• WY, USA
*(MB, CAN and NE, USA are slightly over 600 miles
2016 EDUCATIONAL SEMINAR FOR TOURISM ORGANIZATIONS (ESTO)
Time to Arrival & Distance for Drive Markets

“Drive” vs. “Fly” Market APM to Montana by Media Source
March 1st – August 2016
APM – Arrivals per 1000 Tagged Media Exposures
Vendor DriveAPM FlyAPM
Vendor1 1.69 0.89
Vendor2 1.16 0.25
Vendor3 0.76 0.27
Vendor4 0.73 0.21
Vendor5 0.39 0.04
Vendor6 0.32 0.05
Vendor7 0.28 0.21
Vendor8 0.2 0.05
Vendor9 0.19 0.04
Vendor10 0.13 0.01
Vendor11 0.11 0.01
Vendor12 0.09 0.01
Vendor13 0.05 0.01
2016 EDUCATIONAL SEMINAR FOR TOURISM ORGANIZATIONS (ESTO)

Results reflect only paid digital FY 2016 Warm Season Campaign
Campaign DriveAPM FlyAPM
FY16 WS Montana Destination Content 2.43 1.08
FY16 WS AdvertorialTrafficDrivers Mobile 2.26 1.54
FY16 WS Montana Mobile Content 1.84 1.44
FY16 WS AdvertorialTrafficDrivers 1.80 0.83
FY16 WS FlyBillings 0.69 0.05
FY16 WS Travel Intent Behavioral Targeting 0.57 0.38
FY16 WS MissouriRiverCountry 0.50 0.28
FY16 WS TownPumpHotel 0.37 0.04
FY16 WS HavreTBID 0.33 0.07
FY16 WS NativeArticle 0.33 0.05
Overall Average 0.46 0.20
“Top Performing” FY 2016 Warm Season Campaigns – Drive vs. Fly Markets
March 1st – August 2016
2016 EDUCATIONAL SEMINAR FOR TOURISM ORGANIZATIONS (ESTO)
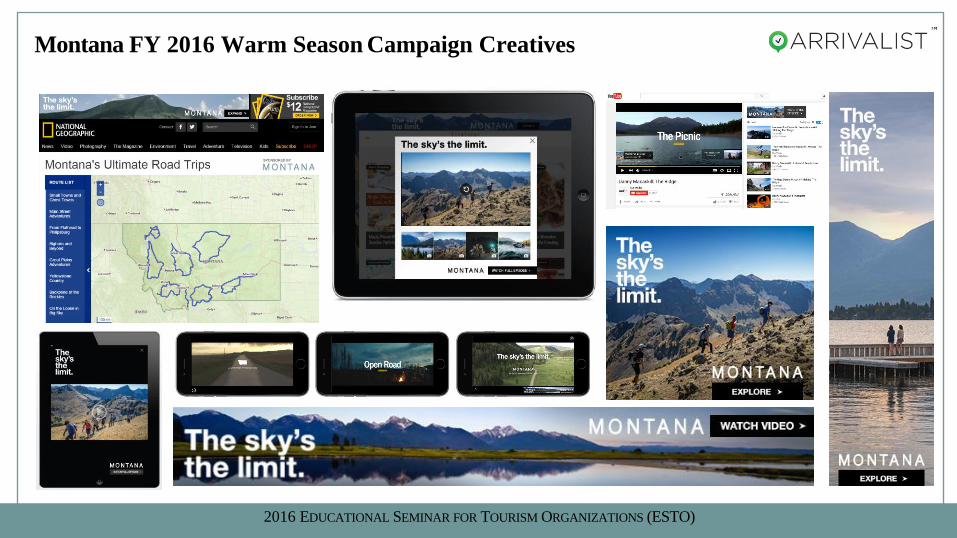
Montana FY 2016 Warm Season Campaign Creatives
2016 EDUCATIONAL SEMINAR FOR TOURISM ORGANIZATIONS (ESTO)

Vendor Total Media Cost % of Arrivals
Vendor1 $147,500.00 38.6%
Vendor2 $75,000.00 31.1%
Vendor3 $425,000.00 8.0%
Vendor4 $97,500.00 4.2%
Vendor5 $300,000.00 2.8%
Vendor6 $121,000.00 5.6%
Vendor7 $500,000.00 1.5%
Vendor8 $65,000.00 1.5%
Vendor9 $65,000.00 0.6%
Vendor10 $20,000.00 5.8%
Vendor11 $500,000.00 0.1%
Vendor12 $300,000.00 0.1%
Vendor13 $50,000.00 0.1%
Results and Cost reflect paid digital FY 2016 Warm Season Campaign
2016 MONTANA GOVERNOR’S CONFERENCE ON TOURISM & RECREATION
*Cost is Vender based and not indicative of location
“Drive Market” Arrivals to Montana by Media Source
March 1st – August 2016
2016 EDUCATIONAL SEMINAR FOR TOURISM ORGANIZATIONS (ESTO)

This table compares total media spend by media source (vendor) for the top 5
"performing sources" for the paid digital FY 2016 Warm Season Campaign
Media Source Media SpendVerified
Arrivals
Media Spend Per
Verified Arrival
Vendor1 $147,500.00 7,406 $20
Vendor2 $75,000.00 3,615 $21
Vendor3 $425,000.00 1,531 $278
Vendor4 $97,500.00 738 $132
Vendor5 $300,000.00 608 $493
Total $1,045,000.00 13,898 $75.19
Digital Media Spend per Verified Arrival
March 1st – August 2016
2016 EDUCATIONAL SEMINAR FOR TOURISM ORGANIZATIONS (ESTO)

Avg. Traveler Spending in Montana by Origin State
State
Avg. Traveler
Spending in MT Per
Trip
Verified MT
Arrivals
Estimated Total
Spending in MT by
Verified Travelers
(Arrivals)
Arizona $421.39 728 $306,772
California $347.45 2,506 $870,710
Colorado $423.62 1,351 $572,311
Florida $417.00 652 $271,884
Georgia $374.66 470 $176,090
Illinois $417.94 570 $238,226
New York $419.34 493 $206,735
Ohio $429.61 312 $134,038
Oregon $620.54 836 $518,771
Pennsylvania $510.03 349 $178,000
Texas $445.99 2,522 $1,124,787
Virginia $543.54 292 $158,714
Washington $364.74 2,433 $887,412
2016 EDUCATIONAL SEMINAR FOR TOURISM ORGANIZATIONS (ESTO)

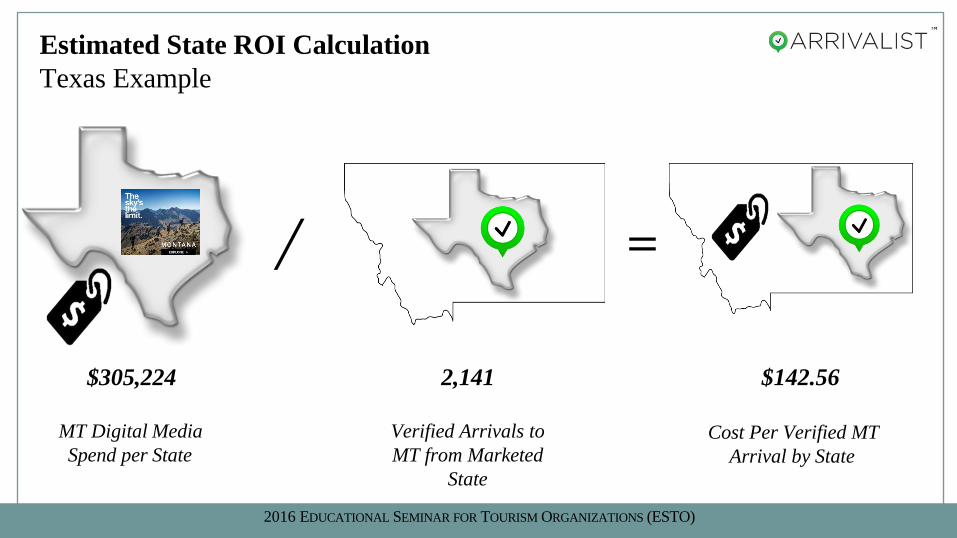
Estimated State ROI Calculation
Texas Example
13,446,008
MT Paid Advertising
Impressions in State
x
$22.70
Avg. Media Cost per 1,000 Impressions
(all MT FY 2016 Summer Paid Digital Ads)
=
$305,224
MT Digital Media
Spend per State
2016 EDUCATIONAL SEMINAR FOR TOURISM ORGANIZATIONS (ESTO)
MT Digital Media
Spend per State
/
2,141
Verified Arrivals to
MT from Marketed
State
=
$142.56
Cost Per Verified MT
Arrival by State
Estimated State ROI Calculation
Texas Example
$305,224
2016 EDUCATIONAL SEMINAR FOR TOURISM ORGANIZATIONS (ESTO)

=
Cost Per Verified MT
Arrival by State
/
$445.99
Average Traveler
Spending in MT by
State
$3.13 : $1.00
Estimated ROI
$s Spent in MT for
every $1 Spent to Get
Those $s by State
Estimated State ROI Calculation
Texas Example
$142.56
2016 EDUCATIONAL SEMINAR FOR TOURISM ORGANIZATIONS (ESTO)

2016 EDUCATIONAL SEMINAR FOR TOURISM ORGANIZATIONS (ESTO)
Considerations, Assumptions & Summary
• Verified arrivals don’t account for all
Montana visitors who were exposed to
paid advertising
• Comparing vender APMs isn’t
necessarily apples to apples
• Ad platforms are reaching potential
Montana visitors at different points in
the marketing “funnel”
• APM and other estimates derived from
this data should be compared on a
relative basis; nominal figures may be
misleading
• Many other factors play into traveler
influence and behavior
• Ease of accessibility (i.e. air
access)
• Differences in target segments (i.e.
international vs. domestic travelers
behaviors)
• Others…


The Best Way to Experience Florida
36
Road-trip ROI
37
38
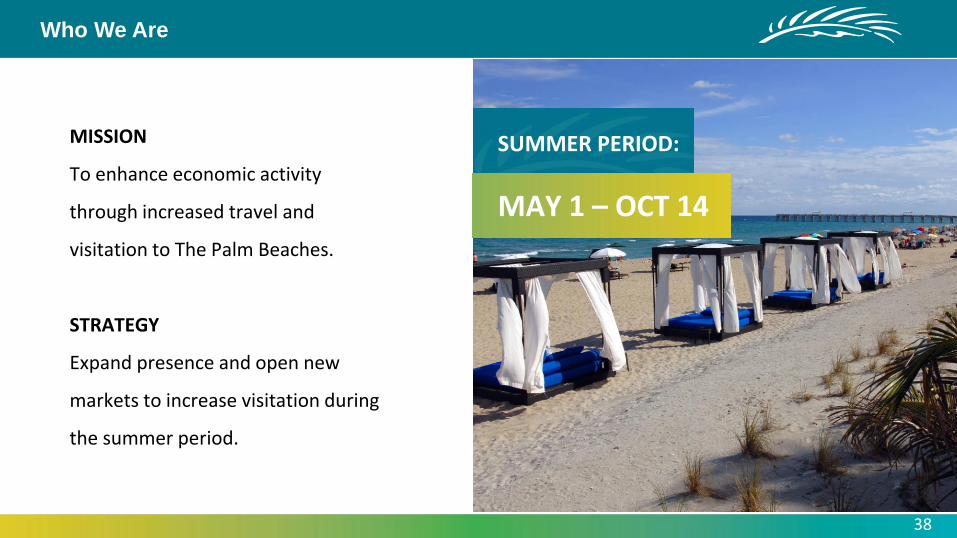
Who We Are
MISSION
To enhance economic activity
through increased travel and
visitation to The Palm Beaches.
STRATEGY
Expand presence and open new
markets to increase visitation during
the summer period.
SUMMER PERIOD:
MAY 1 – OCT 14
39
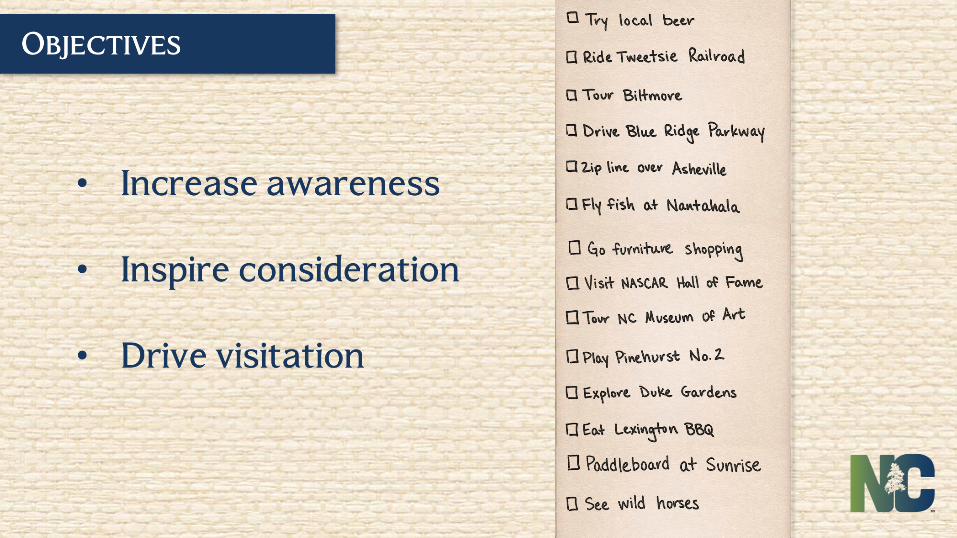
Campaign Objective
Objective
• Increase summer visitation from Primary Drive Markets
(DMAs)
Strategy
• Target more impressions towards drive market DMAs
Measurement
• Create a ROI model
• Spend per market
• Room nights sold
• Identify best performing markets & media partners
40
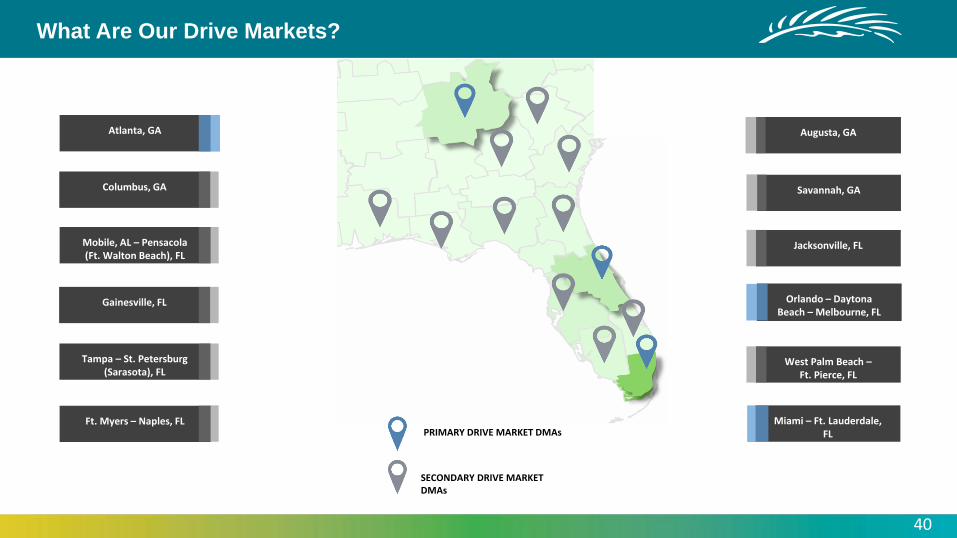
What Are Our Drive Markets?
Mobile, AL – Pensacola (Ft. Walton Beach), FL
Orlando – Daytona Beach – Melbourne, FL
Miami – Ft. Lauderdale, FL
Ft. Myers – Naples, FL
Tampa – St. Petersburg (Sarasota), FL
West Palm Beach –Ft. Pierce, FL
Atlanta, GA
Columbus, GA
Gainesville, FL
Savannah, GA
Augusta, GA
Jacksonville, FL
PRIMARY DRIVE MARKET DMAs
SECONDARY DRIVE MARKET DMAs

41
Campaign Tactic
Summer Program:• 74 million impressions spread
across 14 different media partners.• 75% of impressions targeted to
Primary Drive Market DMAs.• Run Dates: 05/01 – 10/14

42
Measurement Strategy
• To identify best performing campaigns/media partners.
• To calculate a cost-per-arrival on a DMA level
• To record in-market spend data on DMA level
• To calculate spend-per-arrival on DMA level
• To record year over year room nights sold
STR Report VisaVueArrivalist Data

What Happened?
43

44
Top Origin States (Q2 & Q3 2015)
OF SUMMER VISITATION
COMING FROM FLORIDA AND
GEORGIA
61.3%

45
Top Origin Drive Market DMAs
27.6%
11.5%
ORIGIN DMA REGION % OF MEDIA-EXPOSED ARRIVALS
Miami - Ft Lauderdale, FL 27.62%
Orlando - Daytona Beach - Melbourne, FL 11.47%
Atlanta, GA 6.49%
Fort Myers - Naples, FL 4.69%
Tampa - St. Petersburg (Sarasota), FL 4.69%
Tallahassee, FL 1.80%
Jacksonville, FL 1.58%
Gainesville, FL 1.35%
Savannah, GA 0.41%
Mobile, AL - Pensacola (Ft. Walton Beach), FL 0.33%
Panama City, FL 0.25%
Columbus, GA 0.08%
Macon, GA 0.08%
Albany, GA 0.04%
Augusta, GA 0.02%% OF TOTAL ARRIVALS
6.5%

46
Days To Arrival From Drive Market DMAs
AVG. DAYS TO ARRIVAL FROM MEDIA EXPOSURE:
50
AVG. DAYS TO ARRIVAL FROM MEDIA EXPOSURE:
34
AVG. DAYS TO ARRIVAL FROM MEDIA EXPOSURE:
32
Atlanta, GA
Days to Arrival Arrivals
1-3 6.87%
4-7 12.03%
8-14 15.12%
15-30 29.55%
31-90 31.62%
91-180 4.47%
181-365 0.34%
Orlando-Daytona Beach-Melbourne, FL
Days to Arrival Arrivals
1-3 8.63%
4-7 13.51%
8-14 13.51%
15-30 26.83%
31-90 33.21%
91-180 4.13%
181-365 0.19%
Miami-Fort Lauderdale, FL
Days to Arrival Arrivals
1-3 16.56%
4-7 14.77%
8-14 13.20%
15-30 20.47%
31-90 29.53%
91-180 5.39%
181-365 0.08%

47
Vendor Cost Vs Arrival Performance
35.0% Of Media Cost Influences 78.7% Of Arrivals

Economic Impact
48
49
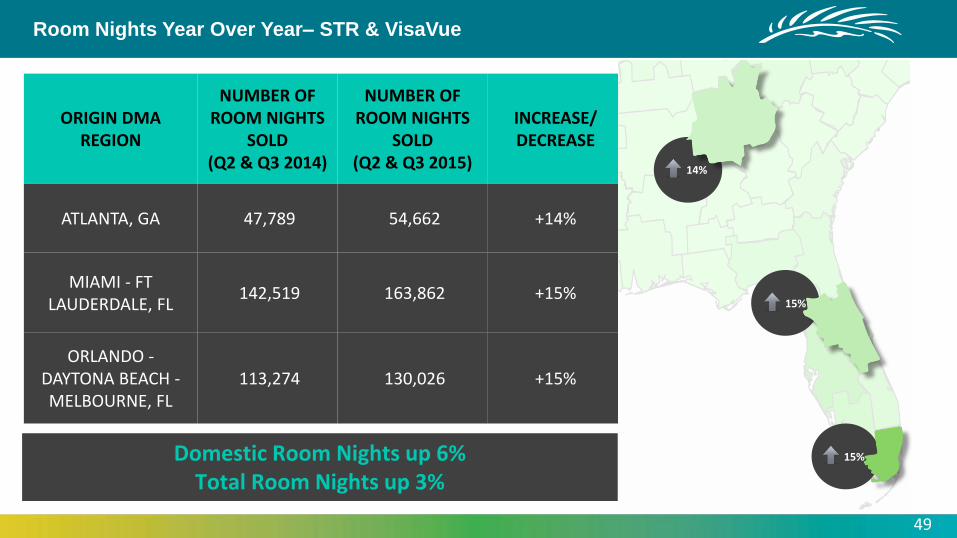
Room Nights Year Over Year– STR & VisaVue
ORIGIN DMA REGION
NUMBER OF ROOM NIGHTS
SOLD(Q2 & Q3 2014)
NUMBER OF ROOM NIGHTS
SOLD(Q2 & Q3 2015)
INCREASE/DECREASE
ATLANTA, GA 47,789 54,662 +14%
MIAMI - FT LAUDERDALE, FL
142,519 163,862 +15%
ORLANDO -DAYTONA BEACH -MELBOURNE, FL
113,274 130,026 +15%
14%
15%
15%
Domestic Room Nights up 6%Total Room Nights up 3%

$16.0
$80.0
$7.1
$35.0
$9.6
$66.0
50
Top Drive Market DMAs – Arrivalist & VisaVue
COST PER
ROOM NIGHT
SPEND PER
ROOM NIGHT
ORIGIN DMA REGION
EST. MEDIA COST
PER ROOM NIGHT
ROOM NIGHT
SPEND PER VISIT
ATLANTA, GA $16.0 $80.0
MIAMI - FT LAUDERDALE, FL
$9.6 $66.0
ORLANDO –DAYTONA BEACH -MELBOURNE, FL
$7.1 $35.0

$26.8
$369.9
$15.8
$301.5
$11.2
$741.0
51
Top Drive Market DMAs – Arrivalist & VisaVue
COST PER
ARRIVAL
SPEND PER
ARRIVAL
ORIGIN DMA REGIONEST. MEDIA COST
PER ARRIVAL
IN-MARKETSPEND PER
VISIT
MIAMI - FT LAUDERDALE, FL $11.2 $741.0
ATLANTA, GA $26.8 $369.9
ORLANDO - DAYTONA BEACH -MELBOURNE, FL
$15.8 $301.5
NON-PRIMARY DMAs $10.5 $367.6

52
Top Drive Market DMAs – Arrivalist & VisaVue
ORIGIN DMA REGIONECONOMIC IMPACT PER $ MEDIA COST
ATLANTA, GA $13.8
ORLANDO - DAYTONA BEACH - MELBOURNE, FL
$19.1
MIAMI - FT LAUDERDALE, FL $66.2
NON-PRIMARY DMAs $34.7
ECONOMIC IMPACT PER
DOLAR MEDIA COST
$13.8
$19.1
$66.2

53
Executive Summary
By monitoring performance with tools...
1. Media Performance/Attribution (Arrivalist)
• 35% of Media Cost influenced 79% of Attributed Visitation
2. Hotel Performance (STR)
• Target Markets saw 15% increase vs. 3% overall
3. Economic Performance (VisaVue)
• Cost to acquire a visit/room night yields a positive ROI
We show the full story of how DTPB efforts impacts The Palm Beaches

The Best Way to Experience Florida
54
Thank You!