Embed Size (px)
Citation preview

Credo WealthAnnual Best Execution Disclosure 2017
May 2018

2
Introduction
This report has been prepared by Credo for the period ending 31 December 2017 for the purposes of meeting our regulatory obligations under Commission Delegated Regulation (EU) 2017/576 (“MiFID II”), which
requires Credo to annually publish, for each class of financial instrument traded,
▪ the top five venues where we have executed client orders, and/or
▪ the top five firms to whom we have transmitted or placed client orders for execution.
This report also provides information on Credo’s assessment of the quality of execution it obtained from these execution venues and/or firms, for each class of financial instrument. Where an asset class has not been
traded during the reporting period, no data or analysis is shown. Credo Capital Plc trades as Agent on behalf of retail and professional clients (and does not deal as principal), the annual best execution tables have
been produced for each classification of client. Further information on the execution process can be found in our Order Execution Policy here.
Please note, information for the reporting period has been collated based on the regulatory obligations that applied to Credo during that time, which are different to those that apply now, namely MiFID II, and pursuant
to which this report has been prepared. Consequently, there are certain sections in this report for which information required under MiFID II for the reporting period (i) was not available; (ii) was only partly available; or
(iii) was available in a different format. As a result, this report has been prepared on a best efforts basis only. The assumptions and available information used to prepare this report may result in inconsistencies in
information across asset classes presented herein or, in the case of aggressive/passive/directed orders, no data being presented, and therefore may not accurately reflect the trading activities undertaken by Credo in
2017. Please also note, the assumptions and methodologies used to produce this report may not be used for the preparation of future reports.
Top 5 Execution Venues and Counterparties
The top 5 execution venues and counterparties used by Credo Capital Plc for different asset classes of instrument are set out in the ‘Annual Best Execution Disclosure Tables 2017’.
Credo Capital Plc trades as Agent on behalf of retail and professional clients (and does not deal as principal), the annual best execution tables have been produced for each classification of client.
The relevant execution information for each asset class has been split into two tables. Table 1 displays the top five execution venues ranked in terms of trading volumes and Table 2 displays the top five executing
brokers ranked in terms of trading volumes.
The shares & depositary receipts asset class have been grouped by ESMA’s ‘Equity ticksize - MiFID Transitional Transparency Calculations’, further information can be located here.

3
Equities – Shares & Depositary Receipts
Retail Client Tables
Fewer than 1 trade per day over the year on average? – No
Top five execution venues ranked in terms of
trading volumesLEI / MIC
Proportion of volume traded as a
percentage of total in that class
Proportion of orders executed as
a percentage of total in that class
Percentage of
passive orders
Percentage of
aggressive orders
Percentage of
directed orders
- - - - - - -
- - - - - - -
- - - - - - -
- - - - - - -
- - - - - - -
Fewer than 1 trade per day over the year on average? – No
Top five executing brokers ranked in terms
of trading volumesLEI / MIC
Proportion of volume traded as a
percentage of total in that class
Proportion of orders executed as
a percentage of total in that class
Percentage of
passive orders
Percentage of
aggressive orders
Percentage of
directed orders
Jefferies International Limited S5THZMDUJCTQZBTRVI98 1.03% 2.58% N/A N/A N/A
Peel Hunt LLP 5493007DWN0R4YBM4C84 0.58% 8.12% N/A N/A N/A
Bell Potter Securities Ltd 213800EM6BT4AHJDKX45 0.30% 1.85% N/A N/A N/A
Macquarie Capital (Europe) Limited 549300GX4FPMFF91RJ37 0.21% 2.21% N/A N/A N/A
Nplus1 Singer Capital Markets Limited 213800ITO7QMNQ9SFG53 0.16% 2.58% N/A N/A N/A

4
Equities – Shares & Depositary Receipts: Tick Size Liquidity Bands 1 & 2
Retail Client Tables
Fewer than 1 trade per day over the year on average? – No
Top five execution venues ranked in terms of
trading volumesLEI / MIC
Proportion of volume traded as a
percentage of total in that class
Proportion of orders executed as
a percentage of total in that class
Percentage of
passive orders
Percentage of
aggressive orders
Percentage of
directed orders
London Stock Exchange XLON 0.11% 0.19% N/A N/A N/A
- - - - - - -
- - - - - - -
- - - - - - -
- - - - - - -
Fewer than 1 trade per day over the year on average? – No
Top five executing brokers ranked in terms
of trading volumesLEI / MIC
Proportion of volume traded as a
percentage of total in that class
Proportion of orders executed as
a percentage of total in that class
Percentage of
passive orders
Percentage of
aggressive orders
Percentage of
directed orders
Jefferies International Limited S5THZMDUJCTQZBTRVI98 4.94% 4.39% N/A N/A N/A
Cantor Fitzgerald Europe 549300KM6VUHPKQLQX53 3.66% 1.09% N/A N/A N/A
Shore Capital Stockbrokers Limited 2138009KZO3MK7TV6372 3.54% 1.38% N/A N/A N/A
Winterflood Securities Ltd 8BRUP6V1DX3PIG2R0745 3.12% 3.46% N/A N/A N/A
Peel Hunt LLP 5493007DWN0R4YBM4C84 2.41% 2.61% N/A N/A N/A

5
Equities – Shares & Depositary Receipts: Tick Size Liquidity Bands 3 & 4
Retail Client Tables
Fewer than 1 trade per day over the year on average? – No
Top five execution venues ranked in terms of
trading volumesLEI / MIC
Proportion of volume traded as a
percentage of total in that class
Proportion of orders executed as
a percentage of total in that class
Percentage of
passive orders
Percentage of
aggressive orders
Percentage of
directed orders
London Stock Exchange XLON 0.65% 0.54% N/A N/A N/A
- - - - - - -
- - - - - - -
- - - - - - -
- - - - - - -
Fewer than 1 trade per day over the year on average? – No
Top five executing brokers ranked in terms
of trading volumesLEI / MIC
Proportion of volume traded as a
percentage of total in that class
Proportion of orders executed as
a percentage of total in that class
Percentage of
passive orders
Percentage of
aggressive orders
Percentage of
directed orders
Shore Capital Stockbrokers Limited 2138009KZO3MK7TV6372 14.87% 1.00% N/A N/A N/A
Peel Hunt LLP 5493007DWN0R4YBM4C84 10.88% 3.52% N/A N/A N/A
Winterflood Securities Ltd 8BRUP6V1DX3PIG2R0745 8.28% 5.31% N/A N/A N/A
Cantor Fitzgerald Europe 549300KM6VUHPKQLQX53 7.14% 1.03% N/A N/A N/A
Jefferies International Limited S5THZMDUJCTQZBTRVI98 3.43% 4.31% N/A N/A N/A

6
Equities – Shares & Depositary Receipts: Tick Size Liquidity Bands 5 & 6
Retail Client Tables
Fewer than 1 trade per day over the year on average? – No
Top five execution venues ranked in terms of
trading volumesLEI / MIC
Proportion of volume traded as a
percentage of total in that class
Proportion of orders executed as
a percentage of total in that class
Percentage of
passive orders
Percentage of
aggressive orders
Percentage of
directed orders
London Stock Exchange XLON 0.50% 1.35% N/A N/A N/A
- - - - - - -
- - - - - - -
- - - - - - -
- - - - - - -
Fewer than 1 trade per day over the year on average? – No
Top five executing brokers ranked in terms
of trading volumesLEI / MIC
Proportion of volume traded as a
percentage of total in that class
Proportion of orders executed as
a percentage of total in that class
Percentage of
passive orders
Percentage of
aggressive orders
Percentage of
directed orders
Barclays Capital Securities Limited K9WDOH4D2PYBSLSOB484 8.23% 12.95% N/A N/A N/A
Peel Hunt LLP 5493007DWN0R4YBM4C84 6.76% 3.96% N/A N/A N/A
Jefferies International Limited S5THZMDUJCTQZBTRVI98 6.18% 4.53% N/A N/A N/A
Winterflood Securities Ltd 8BRUP6V1DX3PIG2R0745 3.51% 6.35% N/A N/A N/A
KCG Europe Limited 549300346EFUPFCXJT79 3.00% 6.10% N/A N/A N/A

7
Debt Instruments: Bonds
Retail Client Tables
Fewer than 1 trade per day over the year on average? – No
Top five execution venues ranked in terms of
trading volumesLEI / MIC
Proportion of volume traded as a
percentage of total in that class
Proportion of orders executed as
a percentage of total in that class
Percentage of
passive orders
Percentage of
aggressive orders
Percentage of
directed orders
- - - - - - -
- - - - - - -
- - - - - - -
- - - - - - -
- - - - - - -
Fewer than 1 trade per day over the year on average? – No
Top five executing brokers ranked in terms
of trading volumesLEI / MIC
Proportion of volume traded as a
percentage of total in that class
Proportion of orders executed as
a percentage of total in that class
Percentage of
passive orders
Percentage of
aggressive orders
Percentage of
directed orders
Guy Butler Ltd 213800AG2H8MB5FGJ538 21.39% 24.64% N/A N/A N/A
NCL Investments Limited D2F0VEF263OY4T3YK397 14.71% 28.70% N/A N/A N/A
Bridport & Co (Jersey) Ltd 2138001S6PWXXBKX9S40 4.18% 6.37% N/A N/A N/A
Peel Hunt LLP 5493007DWN0R4YBM4C84 1.28% 4.20% N/A N/A N/A
Shore Capital Stockbrokers Limited 2138009KZO3MK7TV6372 1.09% 2.24% N/A N/A N/A

8
Exchange Traded Products (Exchange Traded Funds / Notes / Commodities)
Retail Client Tables
Fewer than 1 trade per day over the year on average? – No
Top five execution venues ranked in terms of
trading volumesLEI / MIC
Proportion of volume traded as a
percentage of total in that class
Proportion of orders executed as
a percentage of total in that class
Percentage of
passive orders
Percentage of
aggressive orders
Percentage of
directed orders
London Stock Exchange XLON 0.11% 0.11% N/A N/A N/A
- - - - - - -
- - - - - - -
- - - - - - -
- - - - - - -
Fewer than 1 trade per day over the year on average? – No
Top five executing brokers ranked in terms
of trading volumesLEI / MIC
Proportion of volume traded as a
percentage of total in that class
Proportion of orders executed as
a percentage of total in that class
Percentage of
passive orders
Percentage of
aggressive orders
Percentage of
directed orders
Commerzbank AG 851WYGNLUQLFZBSYGB56 7.94% 12.94% N/A N/A N/A
Jane Street Financial Limited 549300ZHEHX8M31RP142 7.20% 9.18% N/A N/A N/A
Flow Traders B.V. 549300CLJI9XDH12XV51 5.91% 3.65% N/A N/A N/A
Barclays Capital Securities Limited K9WDOH4D2PYBSLSOB484 5.00% 10.45% N/A N/A N/A
Winterflood Securities Ltd 8BRUP6V1DX3PIG2R0745 2.68% 2.32% N/A N/A N/A

9
Securitised Derivatives: Warrants & Certificate Derivatives
Retail Client Tables
Fewer than 1 trade per day over the year on average? – No
Top five execution venues ranked in terms of
trading volumesLEI / MIC
Proportion of volume traded as a
percentage of total in that class
Proportion of orders executed as
a percentage of total in that class
Percentage of
passive orders
Percentage of
aggressive orders
Percentage of
directed orders
- - - - - - -
- - - - - - -
- - - - - - -
- - - - - - -
- - - - - - -
Fewer than 1 trade per day over the year on average? – No
Top five executing brokers ranked in terms
of trading volumesLEI / MIC
Proportion of volume traded as a
percentage of total in that class
Proportion of orders executed as
a percentage of total in that class
Percentage of
passive orders
Percentage of
aggressive orders
Percentage of
directed orders
Argentarius ETI Management Ltd 529900F3D49MEG3JBV68 100.00% 100.00% N/A N/A N/A
- - - - - - -
- - - - - - -
- - - - - - -
- - - - - - -

10
Other Instruments
Retail Client Tables
Fewer than 1 trade per day over the year on average? – No
Top five execution venues ranked in terms of
trading volumesLEI / MIC
Proportion of volume traded as a
percentage of total in that class
Proportion of orders executed as
a percentage of total in that class
Percentage of
passive orders
Percentage of
aggressive orders
Percentage of
directed orders
- - - - - - -
- - - - - - -
- - - - - - -
- - - - - - -
- - - - - - -
Fewer than 1 trade per day over the year on average? – No
Top five executing brokers ranked in terms
of trading volumesLEI / MIC
Proportion of volume traded as a
percentage of total in that class
Proportion of orders executed as
a percentage of total in that class
Percentage of
passive orders
Percentage of
aggressive orders
Percentage of
directed orders
Guy Butler Ltd 213800AG2H8MB5FGJ538 10.58% 14.17% N/A N/A N/A
Jefferies International Limited S5THZMDUJCTQZBTRVI98 8.28% 14.77% N/A N/A N/A
Canaccord Genuity Limited ZBU7VFV5NIMN4ILRFC23 2.06% 5.97% N/A N/A N/A
Numis Securities Limited 213800P3F4RT97WDSX47 1.59% 4.99% N/A N/A N/A
Winterflood Securities Ltd 8BRUP6V1DX3PIG2R0745 1.14% 4.19% N/A N/A N/A

11
Equities – Shares & Depositary Receipts
Professional Client Tables
Fewer than 1 trade per day over the year on average? – No
Top five execution venues ranked in terms of
trading volumesLEI / MIC
Proportion of volume traded as a
percentage of total in that class
Proportion of orders executed as
a percentage of total in that class
Percentage of
passive orders
Percentage of
aggressive orders
Percentage of
directed orders
- - - - - - -
- - - - - - -
- - - - - - -
- - - - - - -
- - - - - - -
Fewer than 1 trade per day over the year on average? – No
Top five executing brokers ranked in terms
of trading volumesLEI / MIC
Proportion of volume traded as a
percentage of total in that class
Proportion of orders executed as
a percentage of total in that class
Percentage of
passive orders
Percentage of
aggressive orders
Percentage of
directed orders
Baillieu Holst Ltd 2549003CT61K58T27J39 74.82% 0.74% N/A N/A N/A
Jefferies International Limited S5THZMDUJCTQZBTRVI98 13.48% 12.55% N/A N/A N/A
Peel Hunt LLP 5493007DWN0R4YBM4C84 2.82% 7.75% N/A N/A N/A
Macquarie Capital (Europe) Limited 549300GX4FPMFF91RJ37 2.50% 0.37% N/A N/A N/A
J.P. Morgan Securities PLC K6Q0W1PS1L1O4IQL9C32 1.09% 0.37% N/A N/A N/A

12
Equities – Shares & Depositary Receipts: Tick Size Liquidity Bands 1 & 2
Professional Client Tables
Fewer than 1 trade per day over the year on average? – No
Top five execution venues ranked in terms of
trading volumesLEI / MIC
Proportion of volume traded as a
percentage of total in that class
Proportion of orders executed as
a percentage of total in that class
Percentage of
passive orders
Percentage of
aggressive orders
Percentage of
directed orders
London Stock Exchange XLON 0.19% 0.13% N/A N/A N/A
- - - - - - -
- - - - - - -
- - - - - - -
- - - - - - -
Fewer than 1 trade per day over the year on average? – No
Top five executing brokers ranked in terms
of trading volumesLEI / MIC
Proportion of volume traded as a
percentage of total in that class
Proportion of orders executed as
a percentage of total in that class
Percentage of
passive orders
Percentage of
aggressive orders
Percentage of
directed orders
Jefferies International Limited S5THZMDUJCTQZBTRVI98 36.61% 6.42% N/A N/A N/A
Numis Securities Limited 213800P3F4RT97WDSX47 6.29% 0.51% N/A N/A N/A
Winterflood Securities Ltd 8BRUP6V1DX3PIG2R0745 4.69% 1.79% N/A N/A N/A
Cantor Fitzgerald Europe 549300KM6VUHPKQLQX53 4.56% 0.60% N/A N/A N/A
Peel Hunt LLP 5493007DWN0R4YBM4C84 3.59% 1.16% N/A N/A N/A

13
Equities – Shares & Depositary Receipts: Tick Size Liquidity Bands 3 & 4
Professional Client Tables
Fewer than 1 trade per day over the year on average? – No
Top five execution venues ranked in terms of
trading volumesLEI / MIC
Proportion of volume traded as a
percentage of total in that class
Proportion of orders executed as
a percentage of total in that class
Percentage of
passive orders
Percentage of
aggressive orders
Percentage of
directed orders
London Stock Exchange XLON 6.98% 1.06% N/A N/A N/A
- - - - - - -
- - - - - - -
- - - - - - -
- - - - - - -
Fewer than 1 trade per day over the year on average? – No
Top five executing brokers ranked in terms
of trading volumesLEI / MIC
Proportion of volume traded as a
percentage of total in that class
Proportion of orders executed as
a percentage of total in that class
Percentage of
passive orders
Percentage of
aggressive orders
Percentage of
directed orders
Barclays Capital Securities Limited K9WDOH4D2PYBSLSOB484 8.30% 31.01% N/A N/A N/A
Peel Hunt LLP 5493007DWN0R4YBM4C84 5.99% 3.33% N/A N/A N/A
Winterflood Securities Ltd 8BRUP6V1DX3PIG2R0745 5.59% 5.12% N/A N/A N/A
Jefferies International Limited S5THZMDUJCTQZBTRVI98 4.26% 3.60% N/A N/A N/A
Canaccord Genuity Limited ZBU7VFV5NIMN4ILRFC23 2.88% 1.54% N/A N/A N/A
14
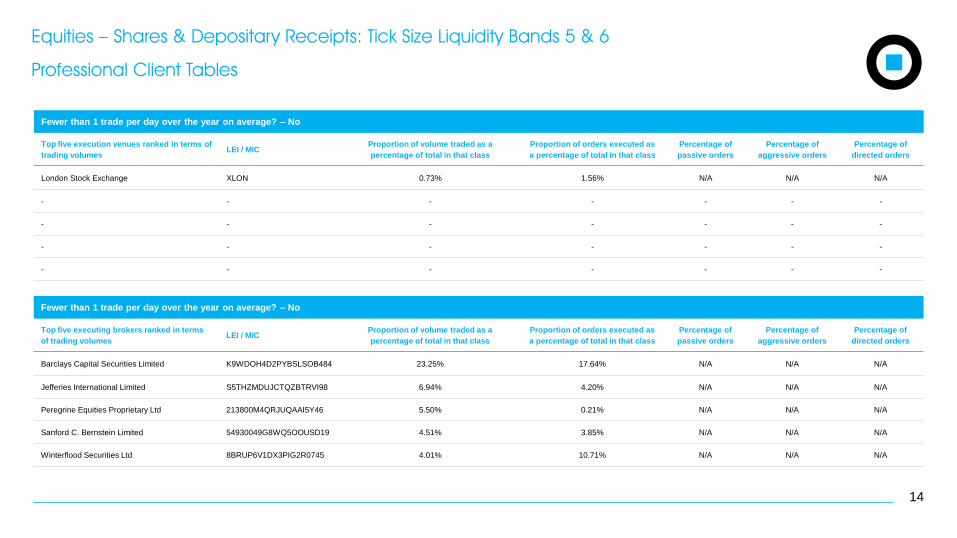
Equities – Shares & Depositary Receipts: Tick Size Liquidity Bands 5 & 6
Professional Client Tables
Fewer than 1 trade per day over the year on average? – No
Top five execution venues ranked in terms of
trading volumesLEI / MIC
Proportion of volume traded as a
percentage of total in that class
Proportion of orders executed as
a percentage of total in that class
Percentage of
passive orders
Percentage of
aggressive orders
Percentage of
directed orders
London Stock Exchange XLON 0.73% 1.56% N/A N/A N/A
- - - - - - -
- - - - - - -
- - - - - - -
- - - - - - -
Fewer than 1 trade per day over the year on average? – No
Top five executing brokers ranked in terms
of trading volumesLEI / MIC
Proportion of volume traded as a
percentage of total in that class
Proportion of orders executed as
a percentage of total in that class
Percentage of
passive orders
Percentage of
aggressive orders
Percentage of
directed orders
Barclays Capital Securities Limited K9WDOH4D2PYBSLSOB484 23.25% 17.64% N/A N/A N/A
Jefferies International Limited S5THZMDUJCTQZBTRVI98 6.94% 4.20% N/A N/A N/A
Peregrine Equities Proprietary Ltd 213800M4QRJUQAAI5Y46 5.50% 0.21% N/A N/A N/A
Sanford C. Bernstein Limited 54930049G8WQ5OOUSD19 4.51% 3.85% N/A N/A N/A
Winterflood Securities Ltd 8BRUP6V1DX3PIG2R0745 4.01% 10.71% N/A N/A N/A

15
Debt Instruments: Bonds
Professional Client Tables
Fewer than 1 trade per day over the year on average? – No
Top five execution venues ranked in terms of
trading volumesLEI / MIC
Proportion of volume traded as a
percentage of total in that class
Proportion of orders executed as
a percentage of total in that class
Percentage of
passive orders
Percentage of
aggressive orders
Percentage of
directed orders
- - - - - - -
- - - - - - -
- - - - - - -
- - - - - - -
- - - - - - -
Fewer than 1 trade per day over the year on average? – No
Top five executing brokers ranked in terms
of trading volumesLEI / MIC
Proportion of volume traded as a
percentage of total in that class
Proportion of orders executed as
a percentage of total in that class
Percentage of
passive orders
Percentage of
aggressive orders
Percentage of
directed orders
Guy Butler Ltd 213800AG2H8MB5FGJ538 21.47% 8.44% N/A N/A N/A
NCL Investments Limited D2F0VEF263OY4T3YK397 16.06% 5.69% N/A N/A N/A
Bridport & Co (Jersey) Ltd 2138001S6PWXXBKX9S40 4.81% 1.93% N/A N/A N/A
FirstRand Bank Ltd ZAYQDKTCATIXF9OQY690 4.02% 0.61% N/A N/A N/A
Shore Capital Stockbrokers Limited 2138009KZO3MK7TV6372 1.54% 0.47% N/A N/A N/A

16
Exchange Traded Products (Exchange Traded Funds / Notes / Commodities)
Professional Client Tables
Fewer than 1 trade per day over the year on average? – No
Top five execution venues ranked in terms of
trading volumesLEI / MIC
Proportion of volume traded as a
percentage of total in that class
Proportion of orders executed as
a percentage of total in that class
Percentage of
passive orders
Percentage of
aggressive orders
Percentage of
directed orders
- - - - - - -
- - - - - - -
- - - - - - -
- - - - - - -
- - - - - - -
Fewer than 1 trade per day over the year on average? – No
Top five executing brokers ranked in terms
of trading volumesLEI / MIC
Proportion of volume traded as a
percentage of total in that class
Proportion of orders executed as
a percentage of total in that class
Percentage of
passive orders
Percentage of
aggressive orders
Percentage of
directed orders
Jane Street Financial Limited 549300ZHEHX8M31RP142 26.36% 10.34% N/A N/A N/A
Commerzbank AG 851WYGNLUQLFZBSYGB56 14.79% 9.78% N/A N/A N/A
Barclays Capital Securities Limited K9WDOH4D2PYBSLSOB484 10.53% 23.27% N/A N/A N/A
Flow Traders B.V. 549300CLJI9XDH12XV51 4.50% 3.26% N/A N/A N/A
Winterflood Securities Ltd 8BRUP6V1DX3PIG2R0745 2.47% 1.93% N/A N/A N/A

17
Securitised Derivatives: Other Securitised Derivatives
Professional Client Tables
Fewer than 1 trade per day over the year on average? – No
Top five execution venues ranked in terms of
trading volumesLEI / MIC
Proportion of volume traded as a
percentage of total in that class
Proportion of orders executed as
a percentage of total in that class
Percentage of
passive orders
Percentage of
aggressive orders
Percentage of
directed orders
- - - - - - -
- - - - - - -
- - - - - - -
- - - - - - -
- - - - - - -
Fewer than 1 trade per day over the year on average? – No
Top five executing brokers ranked in terms
of trading volumesLEI / MIC
Proportion of volume traded as a
percentage of total in that class
Proportion of orders executed as
a percentage of total in that class
Percentage of
passive orders
Percentage of
aggressive orders
Percentage of
directed orders
Credit Suisse Securities (Europe) Ltd DL6FFRRLF74S01HE2M14 58.69% 25.00% N/A N/A N/A
Investec Bank Plc 84S0VF8TSMH0T6D4K848 23.47% 25.00% N/A N/A N/A
Bridport & Co (Jersey) Ltd 2138001S6PWXXBKX9S40 9.39% 25.00% N/A N/A N/A
Commerzbank AG 851WYGNLUQLFZBSYGB56 8.45% 25.00% N/A N/A N/A
- - - - - - -

18
Other Instruments
Professional Client Tables
Fewer than 1 trade per day over the year on average? – No
Top five execution venues ranked in terms of
trading volumesLEI / MIC
Proportion of volume traded as a
percentage of total in that class
Proportion of orders executed as
a percentage of total in that class
Percentage of
passive orders
Percentage of
aggressive orders
Percentage of
directed orders
- - - - - - -
- - - - - - -
- - - - - - -
- - - - - - -
- - - - - - -
Fewer than 1 trade per day over the year on average? – No
Top five executing brokers ranked in terms
of trading volumesLEI / MIC
Proportion of volume traded as a
percentage of total in that class
Proportion of orders executed as
a percentage of total in that class
Percentage of
passive orders
Percentage of
aggressive orders
Percentage of
directed orders
Guy Butler Ltd 213800AG2H8MB5FGJ538 61.83% 7.78% N/A N/A N/A
Jefferies International Limited S5THZMDUJCTQZBTRVI98 7.46% 8.18% N/A N/A N/A
Shore Capital Stockbrokers Limited 2138009KZO3MK7TV6372 1.20% 0.60% N/A N/A N/A
Canaccord Genuity Limited ZBU7VFV5NIMN4ILRFC23 0.60% 1.00% N/A N/A N/A
Bridport & Co (Jersey) Ltd 2138001S6PWXXBKX9S40 0.30% 3.79% N/A N/A N/A

19
Qualitative Analysis
Requirement under Article 3(3) Credo Response
(a) an explanation of the relative importance the firm gave to the execution factors of price, costs,
speed, likelihood of execution or any other consideration including qualitative factors when
assessing the quality of execution;
Credo Capital Plc is required to ensure for the Relevant Period that the best possible result is obtained on a consistent basis when executing
client orders and transmitting orders to third parties for execution. What constitutes the best possible result however varies depending on the
specific execution factors relevant for each trade. We generally treat price and costs as the most important of these factors for obtaining the best
possible result. However, the overall value to you of a particular order may be affected by other factors such as likelihood of execution, size,
speed etc... In determining the relative importance of these factors, we will use reasonable judgment together with our understanding of the
appropriate execution criteria for the specific order. For example, when transacting a large order, minimising market impact might be more
important than price or, when trading an illiquid product, certainty of execution might be more important than price. We may therefore conclude
that factors other than price and costs are more important in achieving the best possible result.
(b) a description of any close links, conflicts of interests, and common ownerships with respect to
any execution venues used to execute orders;
Credo does not have any close links, conflicts of interests or common ownerships with respect to any execution venues used to execute orders.
(c) a description of any specific arrangements with any execution venues regarding payments
made or received, discounts, rebates or non-monetary benefits received;
Credo does not have any arrangements with any execution venues regarding payments made or received, discounts, rebates or non‐monetary
benefits received.
(d) an explanation of the factors that led to a change in the list of execution venues listed in the
firm’s execution policy, if such a change occurred;
There are no changes to note in the list of execution venues listed in the firm’s Order Execution Policy. Brokerage firms on our list of execution
venues are subject to an initial authorisation and ongoing monitoring process, which includes, regular reviews of the performance of execution
services provided by the broker, and the broker’s ability to trade effectively on our clients’ behalf.
(e) an explanation of how order execution differs according to client categorisation, where the
firm treats categories of clients differently and where it may affect the order execution
arrangements;
All Credo Capital Plc clients are treated on the same basis with regards to trade execution.
Execution Quality Analysis and Conclusion
We note below the information required to be provided under Article 3(3) of RTS 28 providing a summary of the analysis and conclusions drawn from Credo Capital Plc’s monitoring of the quality of execution
obtained on the execution venues or via a counterparty where all client orders have been executed during 2017.

20
Qualitative Analysis
Requirement under Article 3(3) Credo Response
(f) an explanation of whether other criteria were given precedence over immediate price and cost
when executing retail client orders and how these other criteria were instrumental in delivering
the best possible result in terms of the total consideration to the client;
As explained in section (a), Credo Capital Plc generally treat price and costs as the most important execution factors for obtaining the best
possible result for clients. However, the overall value of a particular order to a client may be affected by other factors such as likelihood of
execution, size, speed etc... In determining the relative importance of these factors, we will use reasonable judgment together with our
understanding of the appropriate execution criteria for the specific order. For example, when transacting a large order, minimising market impact
might be more important than price or, when trading an illiquid product, certainty of execution might be more important than price. We may
therefore conclude that factors other than price and costs are more important in achieving the best possible result.
(g) an explanation of how the investment firm has used any data or tools relating to the quality of
execution, including any data published under Delegated Regulation (EU) 2017/575 [RTS 27];
During 2017, Credo Capital Plc has regularly monitored the quality of execution obtained from the execution venues used to place client orders.
Credo Capital Plc is satisfied that it has adhered to the requirements set out in its Order Execution Policy in seeking to obtain best execution for
its clients by reference to all relevant factors.
Each trade is monitored by the Dealing Team when placing the trade instruction to ensure that it is executed on the best terms available. It is a
prerequisite of the terms of business of all brokers used by Credo Capital Plc that they must provide Credo Capital Plc clients with best execution.
Brokers used by Credo Capital Plc are kept under constant review by the Head of Trading and new brokers can be added if they demonstrate an
ability to access relevant liquidity (subject to satisfying Credo Capital Plc's on‐boarding requirements).
From 2018 Credo Capital Plc will have access to an independent transaction cost analysis tool that allows it to record implementation shortfall, i.e.
the price difference between when the trade was released and the price achieved for the client. This will be applicable to various trading
strategies. Other benchmarks are also utilised to achieve a more complete picture. The allows Credo Capital Plc to rate counterparties'
performance. Credo Capital Plc will use this together with other sources of information available to them on a regular basis to consider whether
the brokers used have provided the best possible results for clients or whether any changes require to be made to Credo Capital Plc's execution
arrangements or brokers used. In addition, Credo Capital Plc monitors the effectiveness of its Order Execution Policy and arrangements at least
annually (and whenever any material changes are proposed) to identify, and where appropriate, correct any deficiencies.
(h) where applicable, an explanation of how the investment firm has used output of a
consolidated tape provider.
This is not applicable, as there are currently no consolidated tape providers in Europe.

credogroup.com