Embed Size (px)
Citation preview
CreditForecast Quarterly Report on Household Credit: AutoRelease Date: 8/13/2010Analysis by: Scott Hoyt
Equifax Inc. and Moody’s Analytics • www.economy.com • [email protected] • www.equifax.com • www.CreditForecast.com 1
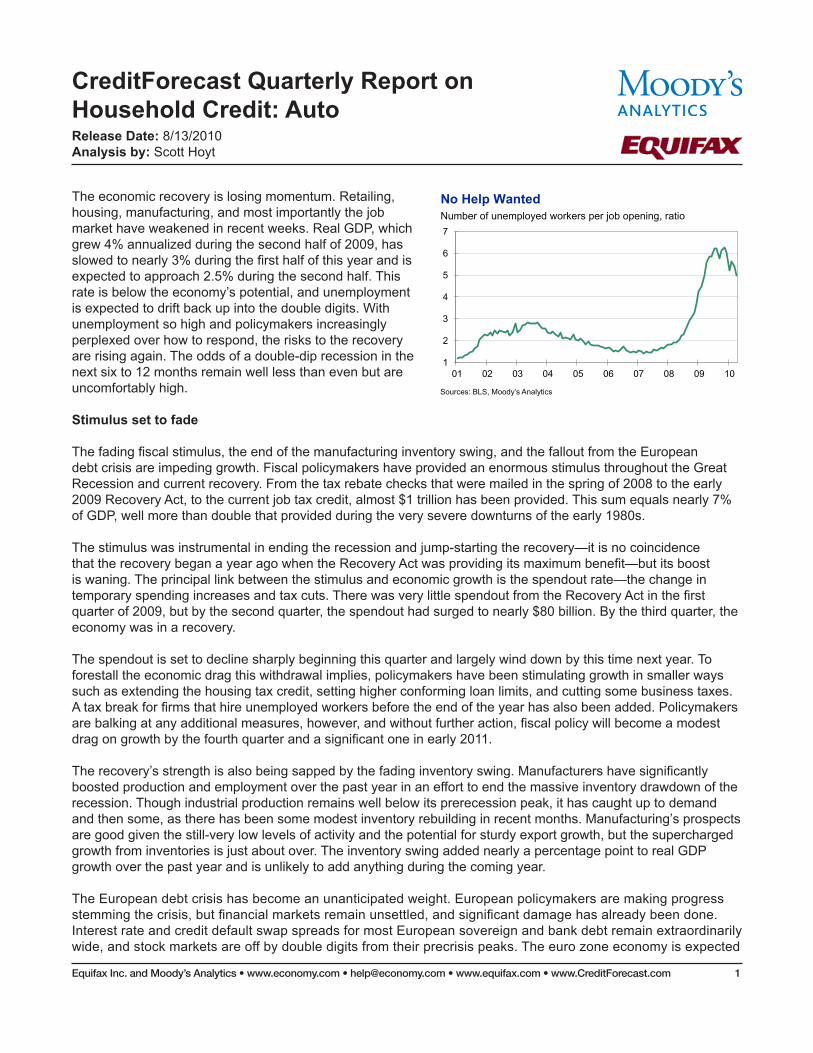
The economic recovery is losing momentum. Retailing, housing, manufacturing, and most importantly the job market have weakened in recent weeks. Real GDP, which grew 4% annualized during the second half of 2009, has slowed to nearly 3% during the first half of this year and is expected to approach 2.5% during the second half. This rate is below the economy’s potential, and unemployment is expected to drift back up into the double digits. With unemployment so high and policymakers increasingly perplexed over how to respond, the risks to the recovery are rising again. The odds of a double-dip recession in the next six to 12 months remain well less than even but are uncomfortably high.
Stimulus set to fade
The fading fiscal stimulus, the end of the manufacturing inventory swing, and the fallout from the European debt crisis are impeding growth. Fiscal policymakers have provided an enormous stimulus throughout the Great Recession and current recovery. From the tax rebate checks that were mailed in the spring of 2008 to the early 2009 Recovery Act, to the current job tax credit, almost $1 trillion has been provided. This sum equals nearly 7% of GDP, well more than double that provided during the very severe downturns of the early 1980s.
The stimulus was instrumental in ending the recession and jump-starting the recovery—it is no coincidence that the recovery began a year ago when the Recovery Act was providing its maximum benefit—but its boost is waning. The principal link between the stimulus and economic growth is the spendout rate—the change in temporary spending increases and tax cuts. There was very little spendout from the Recovery Act in the first quarter of 2009, but by the second quarter, the spendout had surged to nearly $80 billion. By the third quarter, the economy was in a recovery.
The spendout is set to decline sharply beginning this quarter and largely wind down by this time next year. To forestall the economic drag this withdrawal implies, policymakers have been stimulating growth in smaller ways such as extending the housing tax credit, setting higher conforming loan limits, and cutting some business taxes. A tax break for firms that hire unemployed workers before the end of the year has also been added. Policymakers are balking at any additional measures, however, and without further action, fiscal policy will become a modest drag on growth by the fourth quarter and a significant one in early 2011.
The recovery’s strength is also being sapped by the fading inventory swing. Manufacturers have significantly boosted production and employment over the past year in an effort to end the massive inventory drawdown of the recession. Though industrial production remains well below its prerecession peak, it has caught up to demand and then some, as there has been some modest inventory rebuilding in recent months. Manufacturing’s prospects are good given the still-very low levels of activity and the potential for sturdy export growth, but the supercharged growth from inventories is just about over. The inventory swing added nearly a percentage point to real GDP growth over the past year and is unlikely to add anything during the coming year.
The European debt crisis has become an unanticipated weight. European policymakers are making progress stemming the crisis, but financial markets remain unsettled, and significant damage has already been done. Interest rate and credit default swap spreads for most European sovereign and bank debt remain extraordinarily wide, and stock markets are off by double digits from their precrisis peaks. The euro zone economy is expected
FROM MOODY’S ECONOMY.COM 1
1
2
3
4
5
6
7
01 02 03 04 05 06 07 08 09 10
No Help Wanted Number of unemployed workers per job opening, ratio
Sources: BLS, Moody’s Analytics
CreditForecast Quarterly Report on Household Credit: AutoRelease Date: 8/13/2010Analysis by: Scott Hoyt
Equifax Inc. and Moody’s Analytics • www.economy.com • [email protected] • www.equifax.com • www.CreditForecast.com 2
to slump by early next year as credit constraints and fiscal restraint intensify. The U.S. economy will feel the ill effects from weaker exports to Europe and even more so from lower stock prices. The collective psyche, particularly that of large businesses and wealthier households, seems very attuned to the ups and downs of stock prices.
Given the vocal complaints regarding the Federal Reserve’s foray into credit easing—purchasing mortgage securities to support the housing market is a form of fiscal policy—the central bank would not likely be willing or politically able to expand the types of financial securities it buys. Even if policymakers could muster the political will, they have few options. The Fed is expected to maintain its zero interest rate policy well into 2011, and if the recovery were to falter, it would resume its credit-easing efforts to reduce long-term interest rates. Yet, those efforts might not provide much of a boost. Fixed mortgage rates are already about as low as they have ever been, and yet housing demand is struggling even after accounting for the end of the recent housing tax credit.
Political reality
Congress and the Obama administration are also running out of options. As election year politicking gears up, they are even having difficulty agreeing to extend expired emergency unemployment benefits and provide more aid to state and local governments, the two clearest steps to support the economy in the next few months. Worries that some unemployed workers are taking advantage of the generous benefits and that states and municipalities need to become more efficient are not misplaced, but they are overdone. More than four unemployed workers for each open position—compared with closer to one-for-one in a well-functioning economy—suggests that most benefit recipients cannot find work. That state and local government employment growth has been consistent with population increases for more than a decade suggests that these public payrolls are not that bloated, especially since population growth has occurred among groups that require more government services.
Worries that any additional stimulus measures not offset by spending cuts or tax increases will add to the nation’s daunting fiscal challenges are reasonable. But restraint should begin not this year or next, but rather when the economy is in full swing and able to digest it. Given the immediate risks to the recovery—and the fiscal havoc that another recession would wreak—a pay-as-you-go stimulus policy probably is not advisable at this point. Nonetheless, the intense opposition all but precludes anything beyond modest additional help for the unemployed and state and local governments.
Outlook is little changed
Odds of a near-term double-dip recession—which were nearly one in five this spring—are now closer to one in four. Even these odds assume Congress and the Obama administration will extend emergency unemployment benefits through 2010, providing some modest additional help to state and local governments. We also assume they are able to forestall most of the tax increases now legislated to take place at the start of 2011.
The recent slowing in economic growth had already been largely anticipated, so the 2010 outlook for real GDP, jobs and unemployment has not appreciably changed. Real GDP is expected to advance nearly 3% this year, monthly payroll employment gains are expected to average close to 125,000, and the unemployment rate is expected to end the year back over 10%.
Prospects for 2011-2012 also remain much more upbeat. Real GDP is expected to advance almost 4% in 2011 and 5% in 2012 amid stronger employment growth and falling unemployment, though this forecast is predicated on a range of developments: a more or less successful resolution of the European debt crisis this summer, more stable financial markets as a result, only modest house price declines in coming months, and continued solid
CreditForecast Quarterly Report on Household Credit: AutoRelease Date: 8/13/2010Analysis by: Scott Hoyt
Equifax Inc. and Moody’s Analytics • www.economy.com • [email protected] • www.equifax.com • www.CreditForecast.com 3
growth in emerging economies. It also depends on policymakers’ ability to make credible changes to the nation’s long-term fiscal outlook next year. Though they will not be able to completely solve the nation’s fiscal problems, they should be able to convince global investors that the U.S. will meet its responsibilities. Interest rates will increase significantly in 2011-2012 but not hurt the expansion.
Much has to work out well for our positive outlook to come to fruition. But it is important to remember that it is not unusual at this point in a recovery to worry about its staying power. This business cycle is different in many obvious respects from all the others, but the one constant is that our economy’s underlying strengths will ultimately prevail.
CreditForecast Quarterly Report on Household Credit: AutoRelease Date: 8/13/2010Analysis by: Scott Hoyt
Equifax Inc. and Moody’s Analytics • www.economy.com • [email protected] • www.equifax.com • www.CreditForecast.com 4
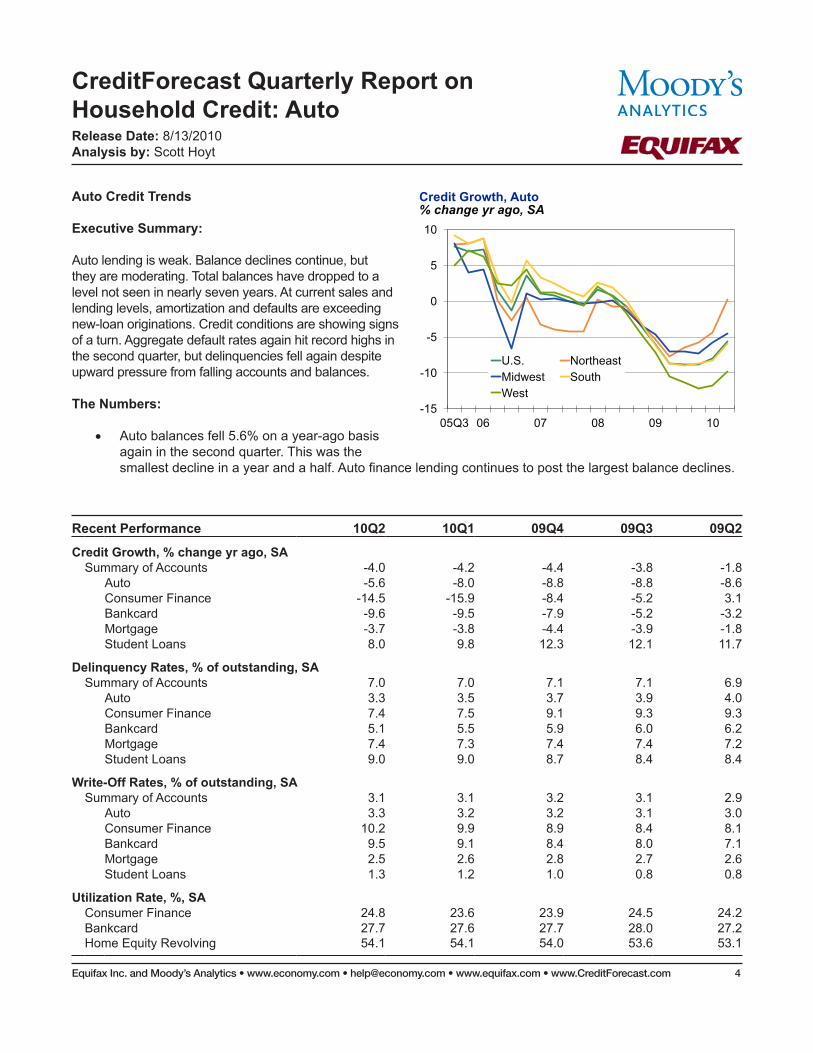
Auto Credit Trends
Executive Summary:
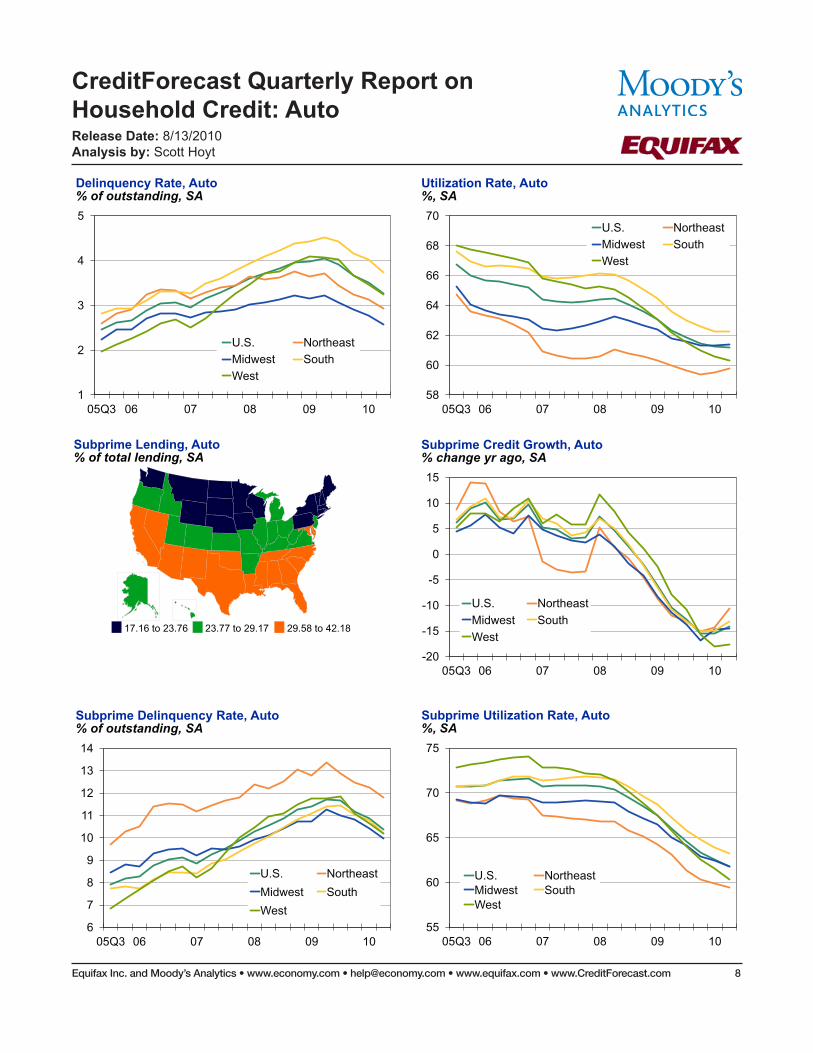
Auto lending is weak. Balance declines continue, but they are moderating. Total balances have dropped to a level not seen in nearly seven years. At current sales and lending levels, amortization and defaults are exceeding new-loan originations. Credit conditions are showing signs of a turn. Aggregate default rates again hit record highs in the second quarter, but delinquencies fell again despite upward pressure from falling accounts and balances.
The Numbers:
• Auto balances fell 5.6% on a year-ago basis again in the second quarter. This was the smallest decline in a year and a half. Auto finance lending continues to post the largest balance declines.
-15
-10
-5
0
5
10
05Q3 06 07 08 09 10
U.S. Northeast Midwest South West
Credit Growth, Auto % change yr ago, SA
Recent Performance 10Q2 10Q1 09Q4 09Q3 09Q2
Credit Growth, % change yr ago, SASummary of Accounts -4.0 -4.2 -4.4 -3.8 -1.8
Auto -5.6 -8.0 -8.8 -8.8 -8.6Consumer Finance -14.5 -15.9 -8.4 -5.2 3.1Bankcard -9.6 -9.5 -7.9 -5.2 -3.2Mortgage -3.7 -3.8 -4.4 -3.9 -1.8Student Loans 8.0 9.8 12.3 12.1 11.7
Delinquency Rates, % of outstanding, SASummary of Accounts 7.0 7.0 7.1 7.1 6.9
Auto 3.3 3.5 3.7 3.9 4.0Consumer Finance 7.4 7.5 9.1 9.3 9.3Bankcard 5.1 5.5 5.9 6.0 6.2Mortgage 7.4 7.3 7.4 7.4 7.2Student Loans 9.0 9.0 8.7 8.4 8.4
Write-Off Rates, % of outstanding, SASummary of Accounts 3.1 3.1 3.2 3.1 2.9
Auto 3.3 3.2 3.2 3.1 3.0Consumer Finance 10.2 9.9 8.9 8.4 8.1Bankcard 9.5 9.1 8.4 8.0 7.1Mortgage 2.5 2.6 2.8 2.7 2.6Student Loans 1.3 1.2 1.0 0.8 0.8
Utilization Rate, %, SAConsumer Finance 24.8 23.6 23.9 24.5 24.2Bankcard 27.7 27.6 27.7 28.0 27.2Home Equity Revolving 54.1 54.1 54.0 53.6 53.1
CreditForecast Quarterly Report on Household Credit: AutoRelease Date: 8/13/2010Analysis by: Scott Hoyt
Equifax Inc. and Moody’s Analytics • www.economy.com • [email protected] • www.equifax.com • www.CreditForecast.com 5
• Accounts are declining but at a slightly more modest pace. The shift to used-car lending is putting a cap on average balances, although they posted their first quarterly increase in over two years in the second quarter.
• Declines in accounts are slightly more modest among consumers with prime credit scores. The share of subprime accounts posted its sixth consecutive decline.
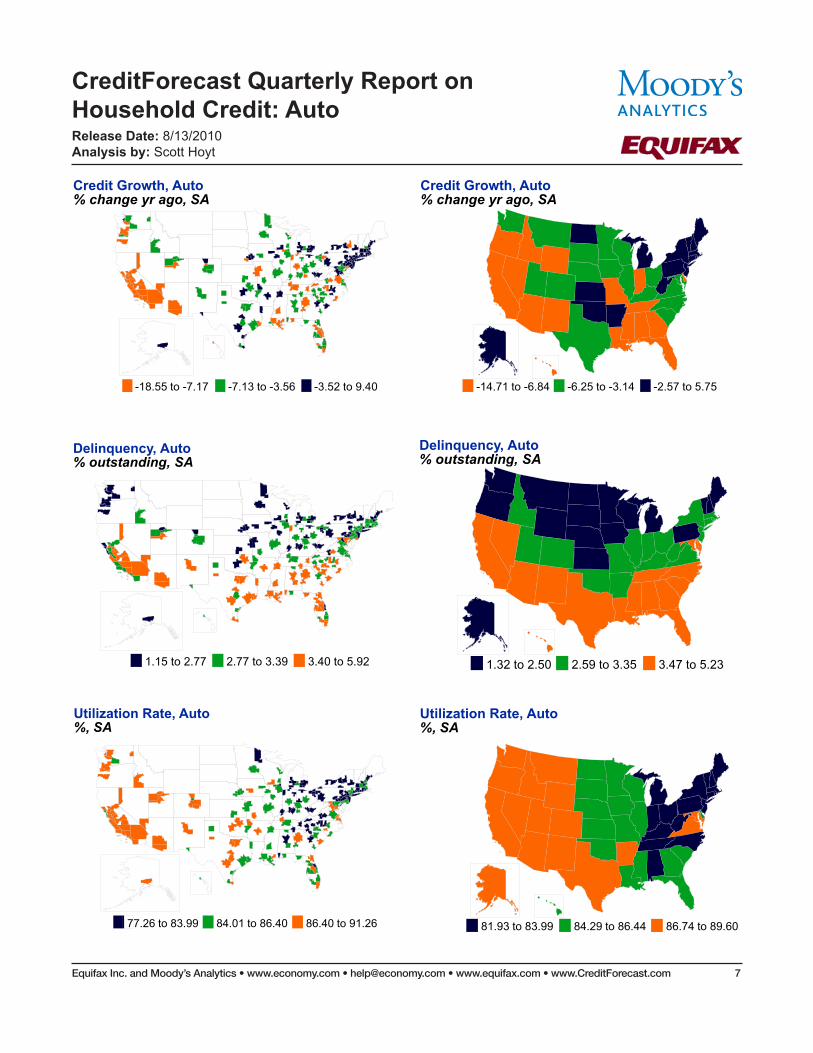
• Auto credit conditions are very weak, although there are signs of coming improvement. The total dollar delinquency rate was 77 basis points below its year-ago peak at the end of the second quarter. However, the default rate continues to rise and is more than double its high following the 2001 recession. Both are inflated by declining balances. Credit conditions are particularly weak in the auto finance segment, both in absolute levels and relative to historic rates.
• Encouragingly, dollar delinquency rates are falling for all but the 120-day bucket. That bucket is little changed over the last two years.
• Auto credit utilization dipped to 61.2% in the second quarter, the lowest on record. Utilization rates are somewhat lower in the auto finance segment, likely because of larger declines in balances.
• The introduction of re-estimated seasonal factors with the first quarter data resulted in minor changes to historical seasonally adjusted data.
Behind the Numbers:
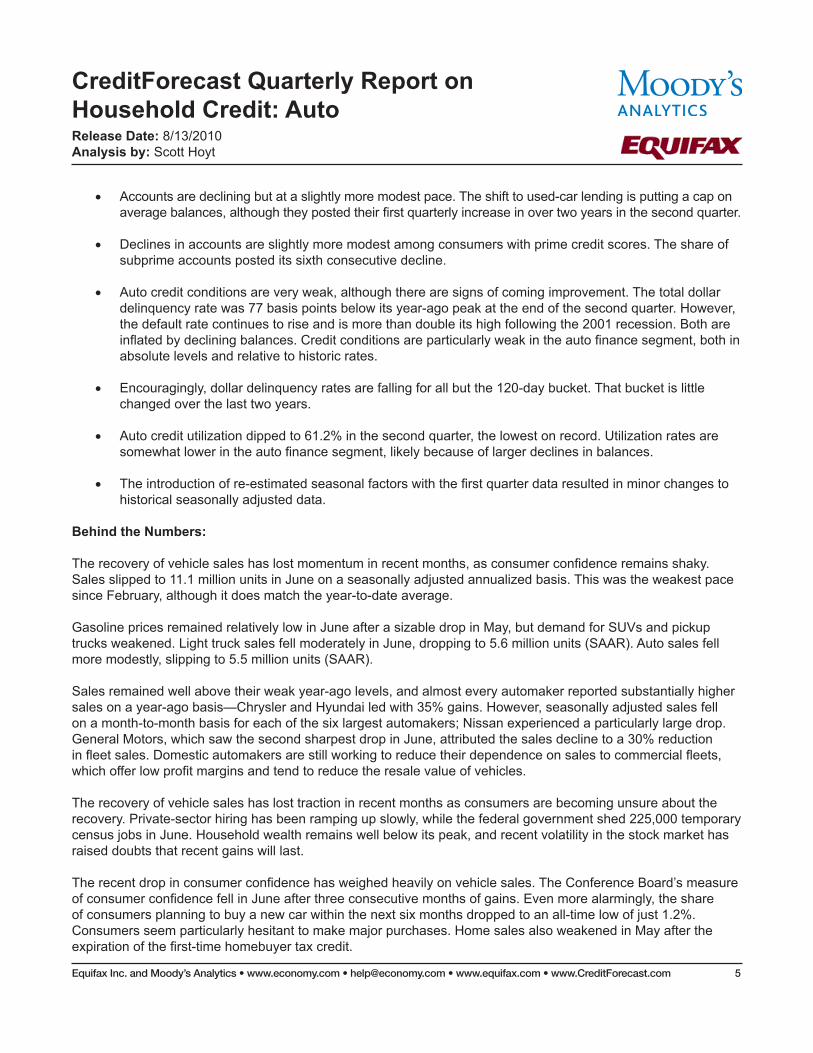
The recovery of vehicle sales has lost momentum in recent months, as consumer confidence remains shaky. Sales slipped to 11.1 million units in June on a seasonally adjusted annualized basis. This was the weakest pace since February, although it does match the year-to-date average.
Gasoline prices remained relatively low in June after a sizable drop in May, but demand for SUVs and pickup trucks weakened. Light truck sales fell moderately in June, dropping to 5.6 million units (SAAR). Auto sales fell more modestly, slipping to 5.5 million units (SAAR).
Sales remained well above their weak year-ago levels, and almost every automaker reported substantially higher sales on a year-ago basis—Chrysler and Hyundai led with 35% gains. However, seasonally adjusted sales fell on a month-to-month basis for each of the six largest automakers; Nissan experienced a particularly large drop. General Motors, which saw the second sharpest drop in June, attributed the sales decline to a 30% reduction in fleet sales. Domestic automakers are still working to reduce their dependence on sales to commercial fleets, which offer low profit margins and tend to reduce the resale value of vehicles.
The recovery of vehicle sales has lost traction in recent months as consumers are becoming unsure about the recovery. Private-sector hiring has been ramping up slowly, while the federal government shed 225,000 temporary census jobs in June. Household wealth remains well below its peak, and recent volatility in the stock market has raised doubts that recent gains will last.
The recent drop in consumer confidence has weighed heavily on vehicle sales. The Conference Board’s measure of consumer confidence fell in June after three consecutive months of gains. Even more alarmingly, the share of consumers planning to buy a new car within the next six months dropped to an all-time low of just 1.2%. Consumers seem particularly hesitant to make major purchases. Home sales also weakened in May after the expiration of the first-time homebuyer tax credit.
CreditForecast Quarterly Report on Household Credit: AutoRelease Date: 8/13/2010Analysis by: Scott Hoyt
Equifax Inc. and Moody’s Analytics • www.economy.com • [email protected] • www.equifax.com • www.CreditForecast.com 6
Although many consumers remain on edge, fundamentals are still improving and confidence will eventually move higher. Although the labor market has not improved as rapidly as expected, it is moving in the right direction. Income growth is accelerating and inflation remains low. Finally, limited availability of credit remains a stumbling block for many consumers, but lending standards are no longer tightening.
Vehicle sales are still expected to improve over the months ahead, reaching an annualized pace of about 12 million units by the end of the year. However, the risks to this outlook are growing, particularly if private sector job growth remains tame and confidence remains low. Sales are not expected to approach their previous benchmark pace of 16 million units until 2012.
Credit conditions are set to improve as a result of the tightness of lending standards since the credit crisis became severe. Increasing shares of auto loan portfolios were originated under tight lending standards. This is already driving down delinquency rates and will soon impact defaults as well.
CreditForecast Quarterly Report on Household Credit: AutoRelease Date: 8/13/2010Analysis by: Scott Hoyt
Equifax Inc. and Moody’s Analytics • www.economy.com • [email protected] • www.equifax.com • www.CreditForecast.com 7
Credit Growth, Auto % change yr ago, SA
-18.55 to -7.17 -7.13 to -3.56 -3.52 to 9.40
Delinquency, Auto % outstanding, SA
1.15 to 2.77 2.77 to 3.39 3.40 to 5.92
Utilization Rate, Auto %, SA
77.26 to 83.99 84.01 to 86.40 86.40 to 91.26
Credit Growth, Auto % change yr ago, SA
-14.71 to -6.84 -6.25 to -3.14 -2.57 to 5.75
Delinquency, Auto % outstanding, SA
1.32 to 2.50 2.59 to 3.35 3.47 to 5.23
Utilization Rate, Auto %, SA
81.93 to 83.99 84.29 to 86.44 86.74 to 89.60
CreditForecast Quarterly Report on Household Credit: AutoRelease Date: 8/13/2010Analysis by: Scott Hoyt
Equifax Inc. and Moody’s Analytics • www.economy.com • [email protected] • www.equifax.com • www.CreditForecast.com 8
1
2
3
4
5
05Q3 06 07 08 09 10
U.S. Northeast Midwest South West
Delinquency Rate, Auto % of outstanding, SA
Subprime Lending, Auto % of total lending, SA
17.16 to 23.76 23.77 to 29.17 29.58 to 42.18
6
7
8
9
10
11
12
13
14
05Q3 06 07 08 09 10
U.S. Northeast
Midwest South
West
Subprime Delinquency Rate, Auto % of outstanding, SA
58
60
62
64
66
68
70
05Q3 06 07 08 09 10
U.S. Northeast Midwest South West
Utilization Rate, Auto %, SA
-20
-15
-10
-5
0
5
10
15
05Q3 06 07 08 09 10
U.S. Northeast Midwest South West
Subprime Credit Growth, Auto % change yr ago, SA
55
60
65
70
75
05Q3 06 07 08 09 10
U.S. Northeast Midwest South West
Subprime Utilization Rate, Auto %, SA
CreditForecast Quarterly Report on Household Credit: AutoRelease Date: 8/13/2010Analysis by: Scott Hoyt
Equifax Inc. and Moody’s Analytics • www.economy.com • [email protected] • www.equifax.com • www.CreditForecast.com 9
CreditForecast.comCreditForecast.com is a joint product of Equifax and Moody’s Analytics, leaders in the collection, analysis and forecasting of household credit trends.
CreditForecast.com is a unique tool that provides history and forecasts for a wide range of household credit, economic and demographic variables at a detailed level of geography. Users are able to examine, segment and stratify credit risk and economic data across states, metropolitan areas, and rest of states.
CreditForecast.com provides quarterly historical credit data back to 1998. Forecasts have a five-year horizon and a quarterly periodicity and are updated on a quarterly basis.
Key features of CreditForecast.com include:
• Credit Trend data for different product categories and subcategories, including by prime and subprime score splits.
• Detailed economic and demographic data.
• Blended credit and economic series (including Loan to Value and Debt Service Burden).
• Historic and forecast risk (ERS 3.0, Smart Score 2.0, Telco Risk Score, Adv. Energy Risk Score, Adv. Wireless Risk Score) and bankruptcy (BNI 3.0) scores.
• Multiple forecasted scenarios, including a baseline most probable scenario and two alternative scenarios.
• In-depth analysis across product categories.
• Quarterly historical and forecast database updates with immediate internet deliverability.
• Timely data updates (data–historic and forecast–available within four weeks of the end of the previous quarter; analysis within seven).
• Quarterly conference calls presented by Moody’s Analytics and Equifax representatives to discuss the current economic outlook and analysis performed using the CreditForecast.com data.
CATEGORiES
There are seven categories and various subcategories available from CreditForecast.com:
Category Subcategories
Auto Auto Finance - Auto trades opened through a dealer or auto finance company.
Auto Bank - Auto trades opened through a bank or credit union.
Total Auto - Auto trades opened through a dealer or auto finance company, a bank, or credit union.

CreditForecast Quarterly Report on Household Credit: AutoRelease Date: 8/13/2010Analysis by: Scott Hoyt
Equifax Inc. and Moody’s Analytics • www.economy.com • [email protected] • www.equifax.com • www.CreditForecast.com 10
Bankcard Bankcard - Unsecured or secured credit cards issued by a bank, national card company, or credit union; includes revolving and open type accounts.
Consumer Consumer Finance - Revolving or installment trade opened through a sales finance company. Also includes retail trades opened with a clothing company, department or variety store, mail order catalog including the internet, grocery store, home furnishing store, jewelry or camera store, building or hardware store, oil company, sporting goods store, farm or gardening supply store, or other retailer, or charge card/revolving trade with an auto company.
First Mortgage First Mortgage - Mortgage trades with a mortgage or real estate company or bank, credit union or finance company; exclusive of Home Equity Revolving and Home Equity Installment.
Home Equity Home Equity Total - Installment or revolving trade with a mortgage or real estate company or bank, credit union or finance company, identified as home equity.
Home Equity Installment - Installment trade with a mortgage or real estate company or bank, credit union or finance company, identified as home equity; exclusive of First Mortgage and Home Equity Revolving.
Home Equity Revolving - Revolving trade with a mortgage or real estate company or bank, credit union or finance company, identified as revolving; exclusive of Home Equity Installment.
Student Loan Student Loan - Student loan from a bank, credit union or finance company or from the government.
Total Top-line summary of all the categories.
All categories/subcategories (excepting Total) are mutually exclusive (that is, no trade is included in more than one category/subcategory). An “Other” category is also provided when the “All” option is purchased in order to complete the universe of accounts.
Other Primarily installment loans not otherwise classified (that is, not auto, first mortgage, home-equity, or student loan).
VARiABLES
For each of the categories, historical data and projections are available at the national, regional, state and metropolitan area levels for the following variables:
Total Trades
Total Balances
High Credit/Loan Amount
Utilization/Balance Outstanding
Delinquency rates % of number
– Total, 30-day, 60-day, 90-day, 120+ day/Collections, Severely Derogatory
CreditForecast Quarterly Report on Household Credit: AutoRelease Date: 8/13/2010Analysis by: Scott Hoyt
Equifax Inc. and Moody’s Analytics • www.economy.com • [email protected] • www.equifax.com • www.CreditForecast.com 11
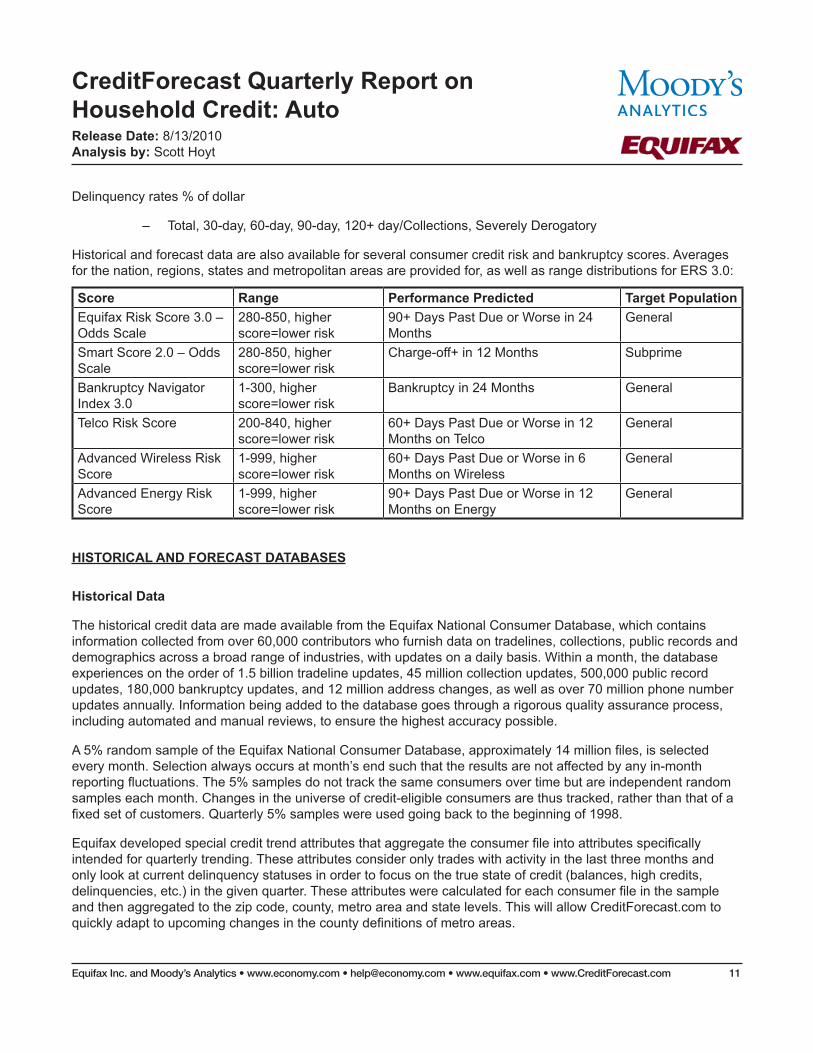
Delinquency rates % of dollar
– Total, 30-day, 60-day, 90-day, 120+ day/Collections, Severely Derogatory
Historical and forecast data are also available for several consumer credit risk and bankruptcy scores. Averages for the nation, regions, states and metropolitan areas are provided for, as well as range distributions for ERS 3.0:
Score Range Performance Predicted Target PopulationEquifax Risk Score 3.0 – Odds Scale
280-850, higher score=lower risk
90+ Days Past Due or Worse in 24 Months
General
Smart Score 2.0 – Odds Scale
280-850, higher score=lower risk
Charge-off+ in 12 Months Subprime
Bankruptcy Navigator Index 3.0
1-300, higher score=lower risk
Bankruptcy in 24 Months General
Telco Risk Score 200-840, higher score=lower risk
60+ Days Past Due or Worse in 12 Months on Telco
General
Advanced Wireless Risk Score
1-999, higher score=lower risk
60+ Days Past Due or Worse in 6 Months on Wireless
General
Advanced Energy Risk Score
1-999, higher score=lower risk
90+ Days Past Due or Worse in 12 Months on Energy
General
HiSTORiCAL AND FORECAST DATABASES
Historical Data
The historical credit data are made available from the Equifax National Consumer Database, which contains information collected from over 60,000 contributors who furnish data on tradelines, collections, public records and demographics across a broad range of industries, with updates on a daily basis. Within a month, the database experiences on the order of 1.5 billion tradeline updates, 45 million collection updates, 500,000 public record updates, 180,000 bankruptcy updates, and 12 million address changes, as well as over 70 million phone number updates annually. Information being added to the database goes through a rigorous quality assurance process, including automated and manual reviews, to ensure the highest accuracy possible.
A 5% random sample of the Equifax National Consumer Database, approximately 14 million files, is selected every month. Selection always occurs at month’s end such that the results are not affected by any in-month reporting fluctuations. The 5% samples do not track the same consumers over time but are independent random samples each month. Changes in the universe of credit-eligible consumers are thus tracked, rather than that of a fixed set of customers. Quarterly 5% samples were used going back to the beginning of 1998.
Equifax developed special credit trend attributes that aggregate the consumer file into attributes specifically intended for quarterly trending. These attributes consider only trades with activity in the last three months and only look at current delinquency statuses in order to focus on the true state of credit (balances, high credits, delinquencies, etc.) in the given quarter. These attributes were calculated for each consumer file in the sample and then aggregated to the zip code, county, metro area and state levels. This will allow CreditForecast.com to quickly adapt to upcoming changes in the county definitions of metro areas.
CreditForecast Quarterly Report on Household Credit: AutoRelease Date: 8/13/2010Analysis by: Scott Hoyt
Equifax Inc. and Moody’s Analytics • www.economy.com • [email protected] • www.equifax.com • www.CreditForecast.com 12
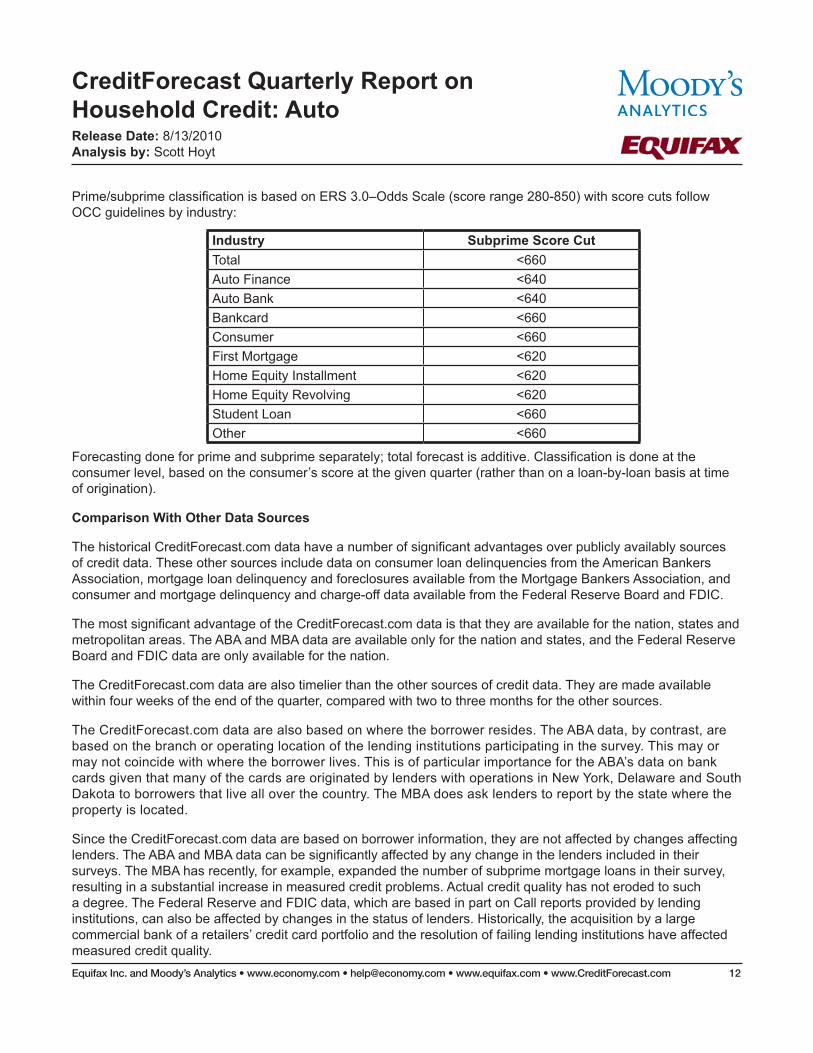
Prime/subprime classification is based on ERS 3.0–Odds Scale (score range 280-850) with score cuts follow OCC guidelines by industry:
industry Subprime Score CutTotal <660Auto Finance <640Auto Bank <640Bankcard <660Consumer <660First Mortgage <620Home Equity Installment <620Home Equity Revolving <620Student Loan <660Other <660
Forecasting done for prime and subprime separately; total forecast is additive. Classification is done at the consumer level, based on the consumer’s score at the given quarter (rather than on a loan-by-loan basis at time of origination).
Comparison With Other Data Sources
The historical CreditForecast.com data have a number of significant advantages over publicly availably sources of credit data. These other sources include data on consumer loan delinquencies from the American Bankers Association, mortgage loan delinquency and foreclosures available from the Mortgage Bankers Association, and consumer and mortgage delinquency and charge-off data available from the Federal Reserve Board and FDIC.
The most significant advantage of the CreditForecast.com data is that they are available for the nation, states and metropolitan areas. The ABA and MBA data are available only for the nation and states, and the Federal Reserve Board and FDIC data are only available for the nation.
The CreditForecast.com data are also timelier than the other sources of credit data. They are made available within four weeks of the end of the quarter, compared with two to three months for the other sources.
The CreditForecast.com data are also based on where the borrower resides. The ABA data, by contrast, are based on the branch or operating location of the lending institutions participating in the survey. This may or may not coincide with where the borrower lives. This is of particular importance for the ABA’s data on bank cards given that many of the cards are originated by lenders with operations in New York, Delaware and South Dakota to borrowers that live all over the country. The MBA does ask lenders to report by the state where the property is located.
Since the CreditForecast.com data are based on borrower information, they are not affected by changes affecting lenders. The ABA and MBA data can be significantly affected by any change in the lenders included in their surveys. The MBA has recently, for example, expanded the number of subprime mortgage loans in their survey, resulting in a substantial increase in measured credit problems. Actual credit quality has not eroded to such a degree. The Federal Reserve and FDIC data, which are based in part on Call reports provided by lending institutions, can also be affected by changes in the status of lenders. Historically, the acquisition by a large commercial bank of a retailers’ credit card portfolio and the resolution of failing lending institutions have affected measured credit quality.
CreditForecast Quarterly Report on Household Credit: AutoRelease Date: 8/13/2010Analysis by: Scott Hoyt
Equifax Inc. and Moody’s Analytics • www.economy.com • [email protected] • www.equifax.com • www.CreditForecast.com 13
Forecast Data
Projections of the credit, economic and demographic variables are available with a quarterly periodicity and a five-year forecast horizon. Forecasting is done for the prime and subprime separately; total forecast is additive. The forecast database includes a baseline most probable forecast and four alternative scenarios. The alternative scenarios vary according to where we are in the business cycle. For instance, when the economy is weak, a mild recession and a severe recession scenario may be most appropriate. In a recovering economy, a pessimistic and an optimistic scenario are likely to be more appropriate. The forecasts are updated with new history and forecasts four times per year.
The economic and demographic forecasts are produced using Moody’s Analytics’s detailed econometric model system. A description of this system is available upon request. The credit forecasts are produced with a model developed using a recursive pooled time series, cross-sectional specification. Each equation is estimated for all metro areas using the available historic data. The equations are log-linear in form, meaning the terms (unless otherwise indicated) are specified as the natural logarithm and the coefficients can be interpreted as elasticities. All the equations contain metro area-specific constant terms to capture the metro area-specific fixed effects. Finally, all of the equations contain an autoregressive term to capture the inertia in the series.

© 2010, Equifax Inc. (“Equifax”) and Moody’s Analytics, Inc. (“Moody’s”) and/or its licensors. All rights reserved. The information and materials contained herein are protected by United States copyright, trade secret, and/or trademark law, as well as other state, national, and international laws and regulations. Except and to the extent as otherwise expressly agreed to, such information and materials are for the exclusive use of CreditForecast.com subscribers, and may not be copied, reproduced, repackaged, further transmitted, transferred, disseminated, redistributed or resold, or stored for subsequent use for any purpose, in whole or in part. All information has been obtained from sources believed to be reliable. Because of the possibility of human and mechanical error as well as other factors, however, all information contained herein is provided “AS IS” without warranty of any kind. UNDER NO CIRCUM-STANCES SHALL EQUIFAX OR Moody’s BE LIABLE TO YOU OR ANY OTHER PERSON IN ANY MANNER FOR ANY LOSS OR DAMAGE CAUSED BY, RESULTING FROM, OR RELATING TO, IN WHOLE OR IN PART, ERRORS OR DEFICIENCIES CONTAINED IN THE INFORMATION PROVIDED, INCLUDING BUT NOT LIMITED TO ANY INDIRECT, SPECIAL, INCIDENTAL, PUNITIVE, OR CON-SEQUENTIAL DAMAGES HOWEVER THEY ARISE. The financial reporting, analysis, projections, observations, and other information contained herein are statements of opinion and not statements of fact or recommendations to purchase, sell, or hold any securities. Each opinion must be weighed solely as one factor in any investment decision made by or on behalf of any user of the information contained herein.
Equifax Inc. and Moody’s Analytics • www.economy.com • [email protected] • www.equifax.com • www.CreditForecast.com