Embed Size (px)
Citation preview
91
Journal of System Management
2019, Issue 3, pp. 091-104
Credit Risk Measurement of Trusted Customers Using
Logistic Regression and Neural Networks
Gholamreza Khojasteh Department of Management, Isfahan (Khorasgan) Branch,
Islamic Azad University, Isfahan, Iran
Saeed Daei Karimzadeh
Department of Economics, Isfahan (Khorasgan) Branch,
Islamic Azad University, Isfahan, Iran
(Corresponding Author)
Hossein Sharifi Ranani
Department of Economics, Isfahan (Khorasgan) Branch,
Islamic Azad University, Isfahan, Iran
Received: 29 April 2019 Accepted: 25 August 2019
Abstract. The issue of credit risk and deferred bank claims is one
of the sensitive issues of banking industry, which can be considered
as the main cause of bank failures. In recent years, the economic
slowdown accompanied by inflation in Iran has led to an increase
in deferred bank claims that could put the country's banking
system in serious trouble. Accordingly, the current paper presents a
prediction model for credit risk of real customers of Qavamin Bank
Branch in Shiraz, using a combined approach of logistic regression
and neural network. Therefore, the necessary examinations were
carried out on a sample of 351 individuals from the real customers
of the bank in the period 2011-2012. According to the information
available, 17 variables were extracted including financial and non-
financial variables for classifying customers into well-balanced s
and ill-balanced s. Among the variables, five effective variables on
credit risk were selected using the parent forward stepwise selection
92 G. Khojasteh, S. Daei Karimzadeh, H. Sharifi Ranani
technique, which was used to train neural networks with three
neurons in the hidden layer. the optimum cutting point was
selected based on the performance curve of the system and the
results of the neural network output on the test data show that the
accuracy of the combined model in the classifier of well-balanced
customers is .89 and in the category of ill-balanced customers is .83
that is better than the results of logistic regression and in general,
it is possible to estimate the accuracy of prediction.
Keywords: Credit Risk, Logistic Regression, Neural Networks,
Receiver Operating Characteristic (ROC).
1. Introduction
The banking industry is one of the most important sectors of every
economy. Banks as brokers alongside stock and insurance are the main
pillars of financial markets. There is strong evidence that good-
performing commercial banks have accelerated economic growth, while
poorly-performing commercial banks are preventing economic progress
and cause poverty. Granting a loan puts the bank at risk. Credit risk or
risk associated with non-repayment of debt is the oldest and most
common form of risk in the financial market in the history of banking.
This kind of risk is the most important type of risk in financial,
commercial, and trading transactions (Richard et al., 2008). The
increasing variety of traders from individuals to independent states and
the growing variety of obligations (from car loans to complex
transactions) means that credit risk management is at the forefront of
risk management activities undertaken by active companies in the
financial services industry. The high availability of banks' deposits and
facilities provided by banks has meant that there are no suitable models
for measuring credit risk and risk management systems in the banking
network. Accordingly, the current paper aimed at presenting a hybrid
model for assessing the credit risk of real customers studying Qavamin
Bank Branches in Shiraz.
2. Background
There are two major issues regarding credit risk management. One is the
variables that influences and predicts this risk, and the other includes
Credit Risk Measurement of Trusted Customers Using Logistic Regression ... 93
models used to combine predictor variables in order to achieve an
appropriate accuracy in classification. Therefore, it is important to
identify the effective factors and the variables involved in credit risk. In
many researches such as that of Mirzaie et al. (2011) and Beikzaded et
al. (2014), investigated key variables affecting the credit risk of banking
customers based on the 5C model, including qualitative and financial
variables (personality, capacity, capital, collateral, general terms and
conditions. Empirically, it should be noted that most researches on
identifying the factors affecting credit risk relating to the 5C indicators,
and more recently with the addition of a feature called "Terms and
Conditions of Facility" (which shows the amount applied for by the
applicant, the purpose for the application and the requested time
duration), have used the 6C index (Ghassemi & Deniyayi, 2015). The
current paper has used 17 financial and non-financial variables in
explaining credit risk.
3. Method
This is an applied descriptive-analytical research. The statistical
population of the study is all real customers of Qavamin Bank Branches
in Shiraz. The total of all the data provided to the researcher based on
an administrative process and a letter section includes 351 files from 16
branches of Qavamin Bank of Shiraz, which is a statistical sample.
Logistic regression is a regression statistical model for binary variables
such as illness or health, well-balanced and ill-balanced and so on. This
model can be considered as a generalized linear model that uses the legit
function as a link function, and the error follows a polynomial
distribution. Logistic regression can be seen as a special case of general
linear modeling and linear regression. The logistic regression model is
based on completely different assumptions (on the relationship between
dependent and independent variables) of linear regression. The
important difference between these two models can be seen in the two
logistic regression features. First, the conditional distribution y | x is a
Bernoulli distribution instead of a Gaussian distribution (because the
binary dependent variable). The second is the probability prediction
values and is limited to the interval between zero and one and to the aid
of the logistic distribution function. In the logistic regression, the
94 G. Khojasteh, S. Daei Karimzadeh, H. Sharifi Ranani
relationship between independent variables and dependent variable,
which has two values of zero and one, is as
1( 1 )
1 xp p y x
e α β− −= = =
+
Thus,
1ln ln
1 x
px
p eα β
α β− −
= = + −
To meet parameters α and β are used to estimate the maximum
accuracy. The logistic regression output is between zero and one, and the
value of.5 is commonly known as the cutoff point. Therefore, if the value
of the regression is half the size or smaller, the input data class will be
different. In general, the0.5-point cutoff value is not effective and this
point needs to be optimized. Another suitable criterion for measuring the
quality and efficiency of fitted models and determining their predictive
power is using the area under the Receiver Operating Characteristic
(ROC). This curve is the sensitivity of a feature and area below which is
a number between 0 and 1 and serves as a benchmark for measuring the
ability to predict models. This number is close to 1, indicating the
ability and efficiency of the prediction model. This method is a visual
comparison and it is easy to draw this curve in SPSS software. With a
glimpse at logistic regression and neural networks, the combined research
model acts as follows:
With the help of logistic regression, candidate variables are refined in the
field of risk prediction of the parent with the parent forward search
approach and the list of the most important influencing variables is
determined by the logistic regression function. Therefore, if the initial
variables are equal to 1 2, ,...,
pX X X , the output of this stage is an effective
variable * * *
1 2, ,...,
kX X X . In the next step, the selected variables are used as
inputs of the neural network with a well-balanced and ill-balanced
output. A high-level nonlinear neural network establishes the link
between inputs and outputs in train data. To calculate the optimal
cutoff point in the neural network, the performance characteristic curve
is also used and the accuracy of the designed network is evaluated on the
test data.
Credit Risk Measurement of Trusted Customers Using Logistic Regression ... 95
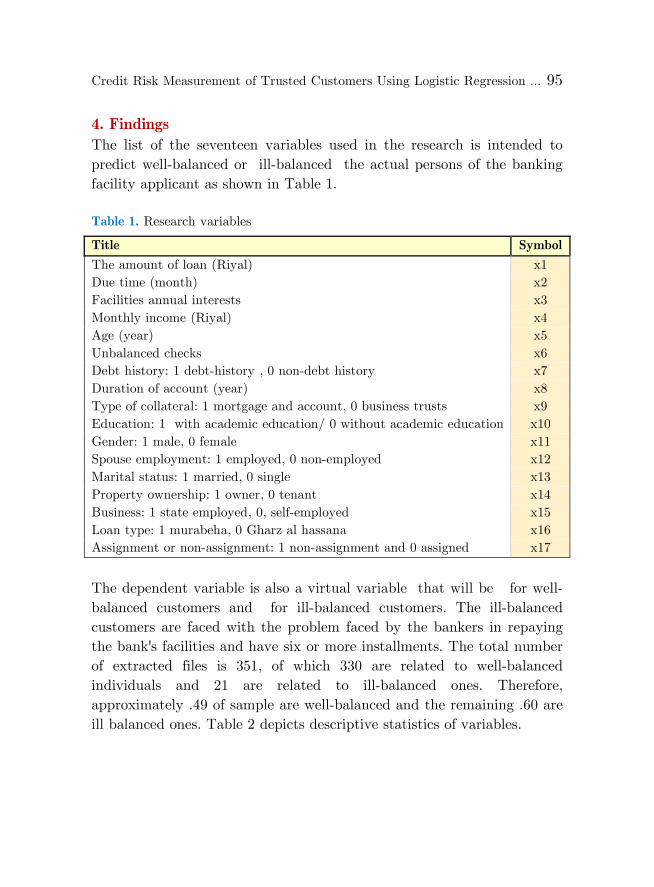
4. Findings
The list of the seventeen variables used in the research is intended to
predict well-balanced or ill-balanced the actual persons of the banking
facility applicant as shown in Table 1.
Table 1. Research variables
Title Symbol
The amount of loan (Riyal) x1
Due time (month) x2
Facilities annual interests x3
Monthly income (Riyal) x4
Age (year) x5
Unbalanced checks x6
Debt history: 1 debt-history , 0 non-debt history x7
Duration of account (year) x8
Type of collateral: 1 mortgage and account, 0 business trusts x9
Education: 1 with academic education/ 0 without academic education x10
Gender: 1 male, 0 female x11
Spouse employment: 1 employed, 0 non-employed x12
Marital status: 1 married, 0 single x13
Property ownership: 1 owner, 0 tenant x14
Business: 1 state employed, 0, self-employed x15
Loan type: 1 murabeha, 0 Gharz al hassana x16
Assignment or non-assignment: 1 non-assignment and 0 assigned x17
The dependent variable is also a virtual variable that will be for well-
balanced customers and for ill-balanced customers. The ill-balanced
customers are faced with the problem faced by the bankers in repaying
the bank's facilities and have six or more installments. The total number
of extracted files is 351, of which 330 are related to well-balanced
individuals and 21 are related to ill-balanced ones. Therefore,
approximately .49 of sample are well-balanced and the remaining .60 are
ill balanced ones. Table 2 depicts descriptive statistics of variables.

96 G. Khojasteh, S. Daei Karimzadeh, H. Sharifi Ranani
Table 2. Descriptive statistics of research variables
Statistical index X1 X2 X3 X4 X5 X6 X7
Mean 241000000 42/64 15/6496 25000000 41/3 0/8 3/16
Median 17000000 36 18 21000000 39 0 2
Maximum 3200000000 560 60 200000000 75 21 17
Minimum 12000000 12 4 0 21 0 0
Standard deviation 277000000 31/72 5/3452 18000000 11/1 1/15 3/02
Skewness 6/08 12/49 1/7225 4/91 0/47 17/.28 1/78
Peakeness 55/56 203/18 17/13 39/2812 2/43 310/86 7/02
Jarque bera 42583/3 595218 3094/38 20662/7 17/78 1403623 423/03
p-Value 0 0 0 0 0 0 0
The value of the Jarque bera statistic for all variables in Table 2
indicates that the distribution of any of the variables does not follow
a.95 confidence level of normal distribution. The statistical description of
the virtual variables from the mean byte is presented in Table 3.
Table 3. The mean of virtual variables
Description Mean
Non-debt history 0/923
Mortgage collateral 0/461
Academic education 0/606
Male 0/666
Employees spouse 0/418
Married 0/772
Residential Owners 0/575
Government jobs 0/287
Being a single person 1
Murabahah Facilities 0.98
Well-balanced s 0/940171
Due to the fact that all of the facilities offered are non-negotiable, the
virtual variable of duty was excluded from the sum of the research
variables. 351 sample files were divided into two categories of train data
and test data for the period 2011-2017. 15 well-balanced records (from
330 records) and 15 ill- balanced records (from 21 cases and equivalent
to.25 data) were randomly selected as train data. Indeed, since the
Credit Risk Measurement of Trusted Customers Using Logistic Regression ... 97
number of ill- balanced customers is far less than the number of well-
balanced customers, the two models were considered equal to the model's
ability to predict ill- balanced records. X4: Average monthly income, x6:
Number of return checks; x7: Bank debt history; x8: account duration
and x9: type of collateral was selected for entering the regression
approximation in Table 4.
Table 4. Approximation of logistic regression model
Variable Value Standard
deviation
Parent
Statistics
Degree of
freedom p- value B
e
X4 /0001 /00001 7/059 1 /0008 1/000
X6 -/0801 1/047 /0586 1 044/0 /0449
X7 2/244 /0722 9/658 1 /0002 9/435
X8 /0382 /0149 6/577 1 /0010 1/465
X9 1/763 /0711 6/140 1 /0013 5/828
C 173/0 /0756 /0053 1 /0819 1/189
The last column shows the amount of increase or decrease in probability
for one increment in the independent variable. So the logistic regression
model is
( )4 6 7 8 9
1
1 exp 0.173 0.001 0.80 2.24 0.382 1.76Z
x x x x x=
+ − + − + + +
According to Table 4, all variables in the model have a significant effect
on the dependent variable. In the meantime, the effect of the number of
return checks is negative and significant, which means that the increase
in the number of return checks reduces the dependent variable and
increases the likelihood of it being placed in the category of ill-balanced.
The bank debt record has a positive and significant effect, despite the
expectations.
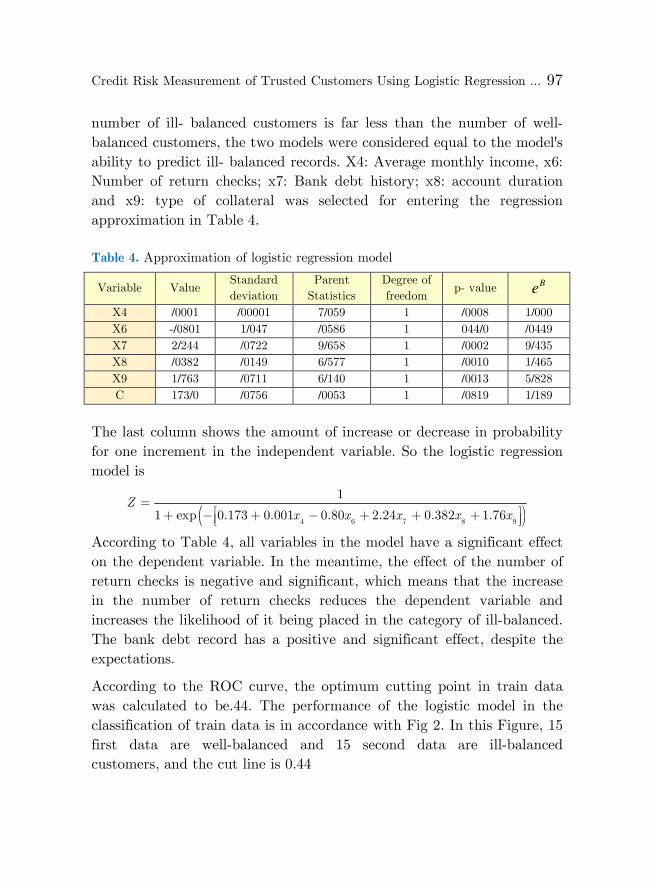
According to the ROC curve, the optimum cutting point in train data
was calculated to be.44. The performance of the logistic model in the
classification of train data is in accordance with Fig 2. In this Figure, 15
first data are well-balanced and 15 second data are ill-balanced
customers, and the cut line is 0.44
98 G. Khojasteh, S. Daei Karimzadeh, H. Sharifi Ranani
Fig 1. ROC curve to calculate the optimal cut point
Fig 2. Logistics model performance in train data

Credit Risk Measurement of Trusted Customers Using Logistic Regression ... 99
According to Fig 2:
(A) The probability of a well-balanced customer to be classified correctly
is 0.73.
(B) The probability of an ill-balanced customer to be classified correctly
is 0.730.
The function of the regression model is presented on 315 data files of
well-balanced records (321 first data of Fig 3 and 6 data from ill-
balanced records (6 final data of Fig 3 and a cutting line of.44.
Fig 3. Logistic model performance on test data
According to Fig 3:
(A) The probability of a well-balanced customer to be classified correctly
is 0.73.
(B) The probability of an ill-balanced customer to be classified correctly
is 0.50.
As you can see, logistic regression does not have the proper performance
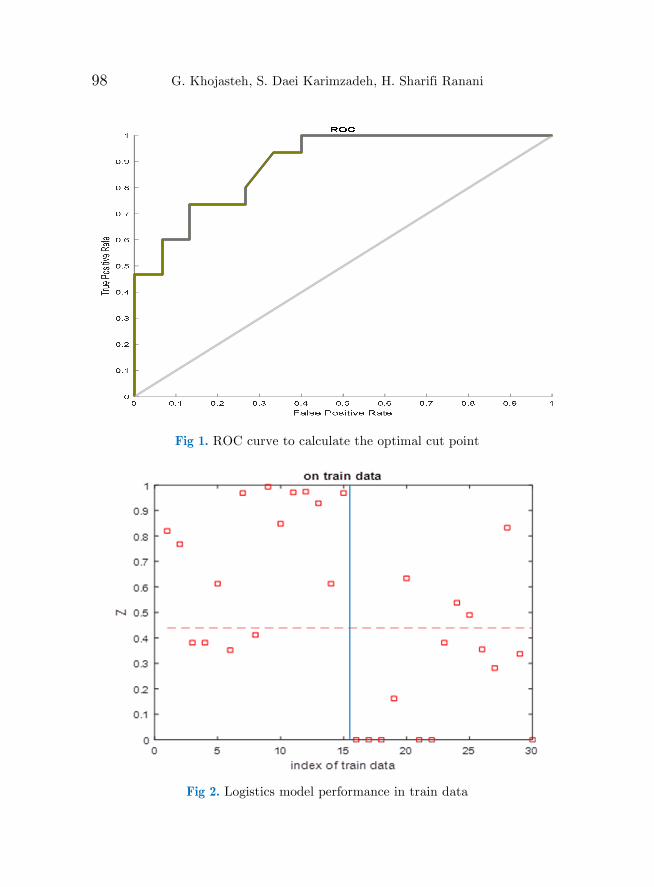
in the test data. In the following, a neural network with three neurons in
Z
100 G. Khojasteh, S. Daei Karimzadeh, H. Sharifi Ranani
the hidden layer will be used to classify the customers, whose inputs are
the five variables selected in the parent forward stepwise selection
technique logistic regression. The neural network view used is shown in
Fig 4:
Fig 4. Schematic view of research neural network
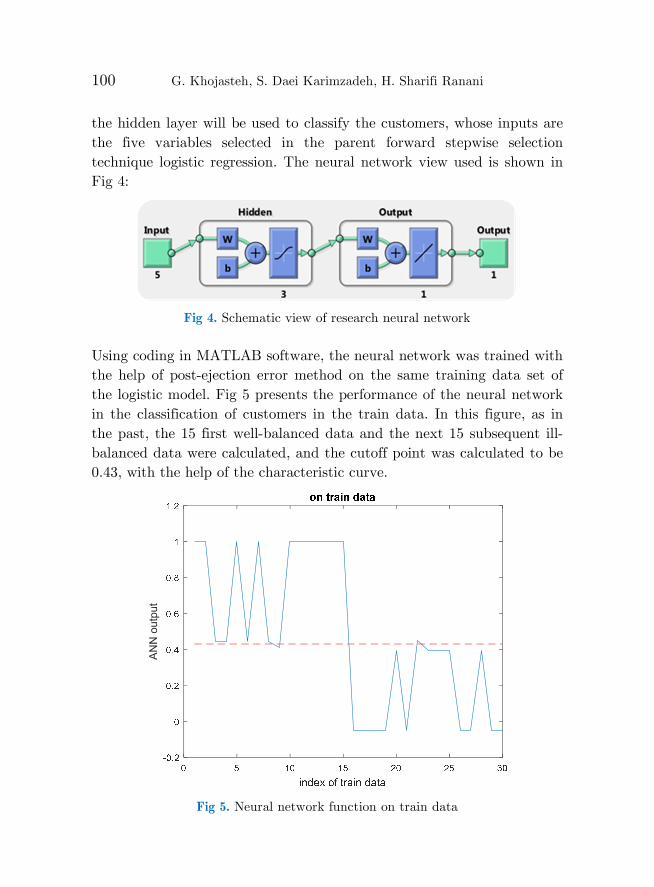
Using coding in MATLAB software, the neural network was trained with
the help of post-ejection error method on the same training data set of
the logistic model. Fig 5 presents the performance of the neural network
in the classification of customers in the train data. In this figure, as in
the past, the 15 first well-balanced data and the next 15 subsequent ill-
balanced data were calculated, and the cutoff point was calculated to be
0.43, with the help of the characteristic curve.
Fig 5. Neural network function on train data
AN
N o
utp
ut
Credit Risk Measurement of Trusted Customers Using Logistic Regression ... 101
According to Fig 5:
(A) The probability of a well-balanced customer to be classified correctly
is 0.933.
(B) The probability of an ill-balanced customer to be classified correctly
is 0.933.
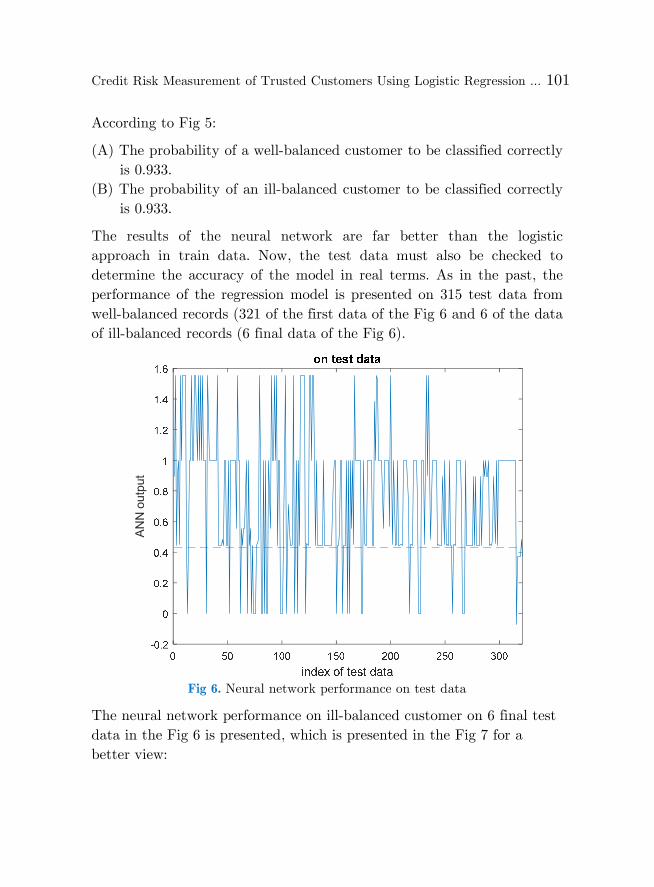
The results of the neural network are far better than the logistic
approach in train data. Now, the test data must also be checked to
determine the accuracy of the model in real terms. As in the past, the
performance of the regression model is presented on 315 test data from
well-balanced records (321 of the first data of the Fig 6 and 6 of the data
of ill-balanced records (6 final data of the Fig 6).
Fig 6. Neural network performance on test data
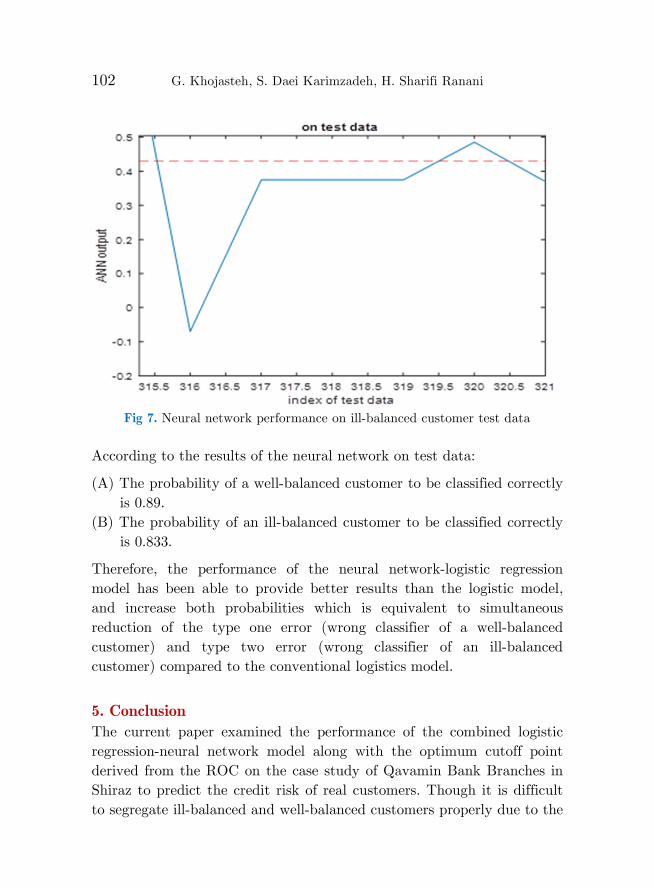
The neural network performance on ill-balanced customer on 6 final test
data in the Fig 6 is presented, which is presented in the Fig 7 for a
better view:
AN
N o
utp
ut
102 G. Khojasteh, S. Daei Karimzadeh, H. Sharifi Ranani
Fig 7. Neural network performance on ill-balanced customer test data
According to the results of the neural network on test data:
(A) The probability of a well-balanced customer to be classified correctly
is 0.89.
(B) The probability of an ill-balanced customer to be classified correctly
is 0.833.
Therefore, the performance of the neural network-logistic regression
model has been able to provide better results than the logistic model,
and increase both probabilities which is equivalent to simultaneous
reduction of the type one error (wrong classifier of a well-balanced
customer) and type two error (wrong classifier of an ill-balanced
customer) compared to the conventional logistics model.
5. Conclusion
The current paper examined the performance of the combined logistic
regression-neural network model along with the optimum cutoff point
derived from the ROC on the case study of Qavamin Bank Branches in
Shiraz to predict the credit risk of real customers. Though it is difficult
to segregate ill-balanced and well-balanced customers properly due to the

Credit Risk Measurement of Trusted Customers Using Logistic Regression ... 103
low percentage of ill-balanced customers (.06 out of the all data) in the
test data, the results of the model classification can be suitably
evaluated. Therefore, this system is recommended in the prediction of
credit risk. Neural networks with refined inputs from the logistic
regression approach have been able to create a better boundary between
customers, although this boundary is very sensitive and the data of a
number of customers in the two groups is close to the boundary.
References
Abdoli, Ghahreman and Fard Hariri, Alireza (2015). "Modeling the Risk
Assessment of Legal Customers of the Bank of Rafah" Journal of
Applied Economics Theory, Second Year, No. 1, pp. 1-24.
Arab Mazar, Abbas and Royan Tan, Puneh (2006). "Factors Affecting
Credit Risk of Bank Customers, Case Study of Agricultural Bank".
Economic research, 3 (6), 45-80.
Beikzadeh, Jafar and Aghazadeh, Gholamreza and Aghazadeh,
Mohammad Reza (2014) "The Study of Factors Affecting Credit Risk
and Prioritizing Credit Scoring Criteria (C-6) for Bank Customers
Using AHP Technique, Case Study of West Azarbayjan Bank",
Ravand Quarterly, No. 68, pp. 121-150.
Baharloo, Nahid, Ali Akbar Amin Bidokhti and Javad Mohaghegh Nia
(2015). "Comparison of Optimal Model of Multiple and Binary
Logistic Regression for Credit Rating of Real Customers of Rafah
Kargaran Bank", Journal of Economic Research, No. 63, pp. 147-166.
Ghassemi, Ahmad Reza, Tahereh Deniyayi (2015), "Customer Credit
Risk Measurement with Neural Network Approach in a Government
Bank", Financial Engineering and Management of Securities, No. 27,
pp. 155- 181.
Hosseini, Abdolkhalagh and Zibaee, Mansour (2014) "Credit Risk
Management in Agricultural Bank of Mamasani City Using Neural
Network Model", Journal of Agricultural Economics, No. 2, pp. 111-
119.
Jamei, Reza; Ahmadi, Fereydoun and Nasiri, Behnam. (2015). "Credit
risk assessment of banking customers' classification using multi-
104 G. Khojasteh, S. Daei Karimzadeh, H. Sharifi Ranani
criteria prediction and decision models (Case study: National Bank of
Kurdistan Province)". Accounting Reviews 3 (9). 81-108.
Ja'fari, Eskandari, Meysam, Roohi and Roohi Milad. (2017). "Banking
Credit Risk Management for Bank Customers Using the Decision
Makers Method with Genetic Algorithm with Data Mining
Approach." Asset Management and Financing, 5 (4), 17-32i.
Karimi, Zahra and Asadi Gorji, Hossein and Gilak Hakim Abadi,
Mohammad Taghi and Asadi, Norahla (2015). "Factors Affecting
Credit Risk of Customers of Commercial Banks Case Study: Bank of
Commerce of Neka City - Mazandaran Province" Quarterly Journal of
Monetary Economics, Finance, No. 10, pp. 205-234.
Kia, Mostafa, (2010), "Neural Networks in MATLAB", Tehran, Kian
Rayaneh Green Publishing, Third Edition.
Mirzaei, Hossein and Nazarian, Rafik and Bagheri, Rana (2011)
"Investigating the Factors Affecting Credit Risk of Legal Persons of
Banks (Case Study of the National Bank of Iran, Tehran), Quarterly
Journal of Economic Research, Vol. 19, No. 58, Pp. 67-98.
Rahmani, Ali and Gharibe Esmaeili (2010), Efficiency of Neural
Networks, Logistic Regression, and Differentiation Analysis in
Prognosis of Default, Economics of Value, No. 4, pp. 151-172.
Salehi, Mojtaba; Kurd Kutuli, Alireza. (2017). "Choosing the best
features to determine the credit risk of bank customers." Smart
Business Management Studies 6 (22) .124-1594.
Tehrani, Reza and Shams, Fallah (2005) "Designing and explaining the
model of credit risk in the banking system of the country", Journal of
Social Sciences and Humanities, Shiraz University, Vol. 22, No. 2, pp.
45-60.


![Light based measurement for Light Weight Cans v5 [Read-Only] · 2015. 10. 30. · Trusted Sencon Support •Dedicated to can making for 37 years •Trusted products that always work](https://img.pdfslide.us/doc/110x75/60eb66667d8bde32f457b750/light-based-measurement-for-light-weight-cans-v5-read-only-2015-10-30-trusted.jpg)