Embed Size (px)
Citation preview

CALKAIN RESEARCH
w w w. c a l k a i n . c o m
CREDIT RATING EFFECTS ON THE MARKETPLACE
EXECUTIVE SUMMARY
This paper describes the effects of credit ratings in the mar-ketplace. Calkain Research (CR) will start out by discussing the overall background of credit ratings and give an analysis of what they mean within the marketplace. In detail, an analysis of the implications on interest rates and borrowing strategies will be given. Additionally, CR will discuss the preliminary lease chang-es submitted by Financial Accounting Standards Board (FASB) and the International Accounting Standards Board (IASB) and the overall impact they will bring to credit ratings and the mar-ketplace. CR will then review how credit ratings affect investors when making decisions as well as make an investment analysis between three drugstore pharmacies, Walgreen (NYSE: WAG), CVS (NYSE: CVS) and Rite Aid (NYSE RAD), all in different credit tiers, in order to evaluate the type of risk and return of each. In summary, the correlations between credit ratings and default probability will be assessed.
TABLE OF CONTENTS
» INTRODUCTION 2
» TENANT ANALYSIS 2
» WHAT IS A CREDIT RATING? 2
RATINGS CATEGORIES
» IMPACT OF CREDIT RATING 3
SALE-LEASEBACKS
» FASB ACCOUNTING CHANGES TO LEASES 6
» COMMERCIAL LENDING GUIDELINES 7
» FINANCING OPTIONS 8
INVESTOR STANDPOINT
» TENANT COMPARISON: HIGH VS. LOW/NO CREDIT 10
WHY YOU SHOULD INVEST IN PHARMACIES
» CREDIT RATINGS VS PROBABILITY OF DEFAULT 12
» CONCLUSION 14
CALKAIN RESEARCH
w w w. c a l k a i n . c o m
INTRODUCTION
Credit ratings play a major role in the financial marketplace. Whenever someone decides to invest in a security, they must de-termine if that issuing entity will be able to meet its obligations. Although all publically traded debt securities a company issues are rated, long-term credit ratings tend to be more indicative of a company’s ability to honor its debt responsibilities. It is impor-tant to note that the ratings discussed are not recommendations to buy or sell securities of these companies, but purely to explain the implications of their assigned rating. This paper will discuss the roles these credit ratings play from a borrower, lender, and investor standpoint. Furthermore, the newly proposed lease changes from the Financial Accounting Standards Board will be reviewed to see the relative impact on companies and their as-signed ratings. Lastly, I will compare three drugstore pharmacies in different credit tiers to perform an investment analysis.
TENANT ANALYSIS
In today’s tight credit market, it is now more important than ever to find the right tenant. With an investment opportunity in which landlord has no responsibilities, it is important to have a tenant who fulfills all the obligations.
To effectively find an accurate return on your investment, you must evaluate several factors: real estate, lease, and the tenant. An in-depth analysis is required for each factor to obtain the Net Operating Income for the investment. It is important to note that with any investment, there is risk involved. The credit of the tenant affects many different aspects of the business such as long-term lease security, possible financing, and asset liquidity. Each of these will be gone over in more detail.
From an investor’s perspective, a leased property’s price should reflect the tenant’s ability to meet the terms of the lease. Proper-ties typically are valued using their Capitalization Rate, also re-ferred to as Cap Rate. The property’s cap rate reflects the value of a stream of economic benefits discounted for time and risk. This is computed as a pretax cap rate using the Net Operating Income (NOI). Below is the equation in determining the rate.
The CAP rate= NOI/ cost( value of investment).
Some of the major considerations when calculating Cap Rates for NNN Properties are:
» The credit worthiness of the tenant.
» The length of the lease, typically 10 to 25 years.
» The type of lease, triple net (NNN) or double net (NN).
» Type and frequency of bumps or increases if any in rent.
» Cost of financing
» Strength of the demographics of the property location
» Nature, age, and condition of the improvements.
As you can see listed above, the credit worthiness of the tenant is a big factor in determining the CAP rate, therefore influencing the other factors in the equation such as cost of financing. The higher quality of the tenant allows for a lower CAP rate in many cases. The CAP rate and market price of an investment carry an inverse relationship. The lower cap rate (high quality credit ten-ant), the higher the investment price. Conversely if any of the above factors are negatively affected such as no or bad credit tenants, the CAP rate will be higher and the resulting value would be lower reflecting the greater risk of investment. This relationship is correlated with a market in perfect equilibrium, which is never the case. For example, there could be a bad in-vestment that is simply overpriced with the given CAP rate. It does not necessarily mean the lower the CAP rate, lower the risk. Since 2009, CAP rates have declined due to low interest rates, high volatility in the bond market, and higher demand for in-vestment-grade properties. Now, some investors are reaching out to lower credit tenants trying to obtain a higher yield on their investment.
WHAT IS A CREDIT RATING?
The credit rating issued by agencies is vital. The financial market-place heavily utilizes these credit ratings in their financial mod-els. Three parties that will be discussed in detail are the lender, company, and the investor. Before we talk about the importance of credit ratings for each of these perspectives, we first need to understand the idea behind the ratings.
A credit rating is an opinion on the creditworthiness of a debt issuer. The rating itself is not influenced by any other factors in the marketplace. These provide an opinion to investors on a se-curity issued by a company. Whenever a company issues debt, whether short or long-term, the agencies will issue a rating for it. The agencies will peruse the financial statements of the com-pany to give an accurate rating. Moody’s for example will take five years of historical information and three years of forecasting to evaluate a company’s rating. More importantly, these ratings can change rapidly when major changes are occurring to a com-pany.
Throughout the years, these ratings have become more widely used throughout the marketplace and are a cornerstone for fi-nancial regulation. As of late, there has been talk of the removal of certain agencies issuing ratings due to the recent financial cri-
CALKAIN RESEARCH
w w w. c a l k a i n . c o m
sis. The marketplace blamed these agencies for having “personal interest”, faulty models of evaluation, and long lag when rating changes take place. The ratings that will be discussed will be the long-term debt issued by corporations. The following is a break-down of the four broad rating categories:
AAA credit company: This borrower pays their loans on time and satisfies the cove-nants agreed to in the mortgage and promissory note. Because of the certainty of getting paid, you offer this borrower a low interest rate. Company can withstand extreme economic crisis and makes all payments on time.
BBB credit company: They pay their bills. Sometimes they’re late and they’ve renego-tiated loans in the past. You’re aware that you carry some risk with this borrower and you offer them a higher interest rate. Company can withstand a moderate level of stress and meet fi-nancial obligations.
CCC credit company: They are high risk and can withstand a mild downward change in economy. The company may have little or no profits and the trend may continue to default.
D credit company. Has defaulted on obligations and likely to default on most or all future ones.
All long-term credit ratings are based off the company’s default risk and their likelihood of payment. As you go lower down in credit ratings from A-D, the likelihood the borrower will not meet its financial obligation, especially in tough economic times, in-creases. Typically, the difference between a high and low credit rating is the default risk. A company that has a greater chance of default will have a lower credit rating. Most credit agencies, such as S&P, have a stress test for each rating category to see if a company can survive. The higher the rating, the higher the prob-ability a company can handle an economic downturn. Through past performance evaluations, future forecasting, and “what-if” sensitivity analysis, these agencies provide an accurate assess-ment of companies.
The previous chart demonstrates the different types of credit rating each company can have, divided between investment and non-investment grade. The plus and minuses for S&P and numbers for Moody’s represent the company being on a credit watch. In 2009 alone, S&P changed 35.46% of their credit ratings on companies. This can be for numerous reasons such as refi-nancing of debt, amount of leverage, industry outlook, earnings performance, and other factors.
IMPACT OF CREDIT RATINGS
The impact of credit ratings on companies themselves is enor-mous. From a corporate view, credit ratings determine the inter-est rate on their securities. Any change in their rating will alter their interest rates. Some of these changes might sound like subtle differences, but to companies looking to borrow money on the market, each little movement adds to their cost of bor-rowing in terms of interest rates and interest expense. With most large companies who borrow an enormous amount of money, these interest payments can add up to millions over time. Ben-eficial ratings can expand breadth of market, widen distribution, improve liquidity and pricing, and help management with inde-pendent, outside perspective on the company. The quickest way for an outsider to see the financial stability of a company is to look at their credit rating. Since these agencies do all of the work and consistently monitor the company’s performance, outsid-ers can quickly view a snapshot of the financial strength of the company.
When a company’s credit rating is lowered, it is more expen-sive for that company to borrow money due to higher interest expense payable on the bonds. In turn, these higher expenses result in lower earnings per share and a lowering of the overall profitability of the company. When company’s debt goes from investment to speculative grade, the perception of the company changes drastically. In today’s marketplace, many investment institutions are forbidden to buy or hold any securities that are non-investment grade, thus making investment grade bonds
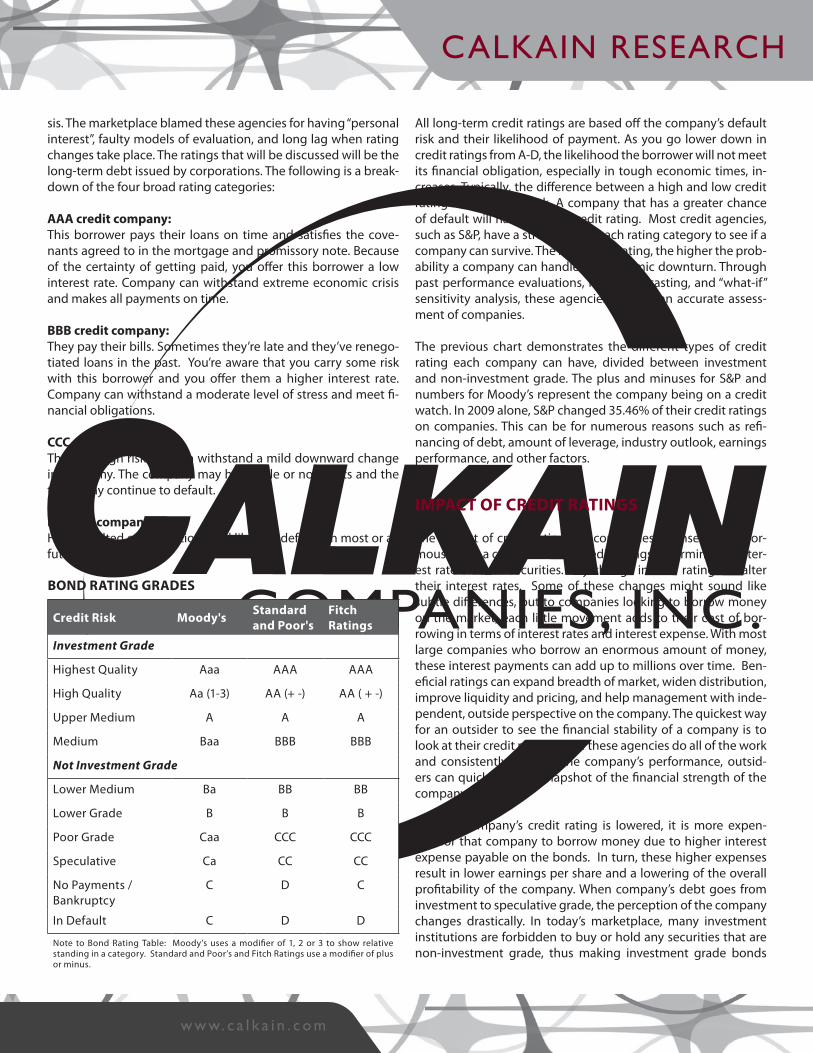
BOND RATING GRADES
Credit Risk Moody's Standard and Poor's
Fitch Ratings
Investment Grade
Highest Quality Aaa AAA AAA
High Quality Aa (1-3) AA (+ -) AA ( + -)
Upper Medium A A A
Medium Baa BBB BBB
Not Investment Grade
Lower Medium Ba BB BB
Lower Grade B B B
Poor Grade Caa CCC CCC
Speculative Ca CC CC
No Payments / Bankruptcy
C D C
In Default C D D
Note to Bond Rating Table: Moody’s uses a modifier of 1, 2 or 3 to show relative standing in a category. Standard and Poor’s and Fitch Ratings use a modifier of plus or minus.
CALKAIN RESEARCH
w w w. c a l k a i n . c o m
highly more liquid and marketable. Ratings affect the interest rates of bonds, covenants, and securities required by investors. Therefore, they impact access, cost, and types of capital avail-able to the organization, and, ultimately, its future.
SALE-LEASEBACK
One benefit for a company with a high quality rating is the op-tion of performing a sale-leaseback. In a credit-driven market, this provides a great way for a tenant to expand its core busi-ness. Based on historical returns, typically a company will receive a 4-6% yearly return from their real estate. For growing com-panies, returns are often generated between 15-20% on invest-ment opportunities. An 11-16% increase in capital can be made on other investments related to core business. Thus, the higher the reinvestment rate for the company, the more attractive a sales-leaseback will become.
Additionally, by leasing the property and paying rent, the tenant can enhance their financial statements. Even if a company does not fully own the real-estate, they can benefit from a lease-back. For example, if you own a 12,000 square-foot building worth $1.5 million, which has $750,000 of equity and $750,000 of debt, a sale-leaseback would provide $750,000 in immediate liquid-ity for business growth. If your business’ internal rate of return is 15 percent, this re-investment could produce an additional $112,500 per year in returns. If the projected appreciation rate is 4 percent, then your real estate equity would only grow by $60,000 per year. Based on today’s lending terms, it may be pos-sible for you to save an additional $52,500 by leasing versus own-ing, depending on the terms of the lease. Furthermore, there is a tax advantage a company gains with a sale leaseback. For sale-leasebacks, a company can fully deduct the rental expense. In contrast, with a conventional mortgage financing, a company will only be able to deduct interest and depreciation. This may not sound like much for a large company, but if you own a ma-jority of your real estate assets, this number could be magnified.
Perhaps most importantly, a company can enhance or preserve its credit rating through sale-leasebacks. The credit rating agen-cies often look at certain financial ratios, such as debt to equity, ROA, and ROE to analyze a company’s financial outlook. By tak-ing it off the balance sheet as an asset and moving it to a foot-note as an operating lease, the company receives a financial benefit when the rating agency discounts its lease payments. Additionally, the related debt, if any, is no longer a liability, which results in an increase in the current ratio. Thus, an increased cur-rent ratio improves the seller’s position for borrowing future ad-ditional funds since it is widely used among lenders to deter-mine financial standing.
Returns on assets and on invested capital increase, improving the company’s credit profile and widening the range of alterna-tive future financing means. Whether the company uses the cap-
ital to grow their core business, make acquisitions, reduce debt, or reallocate to more productive assets, all of these methods can enhance a company’s credit rating.
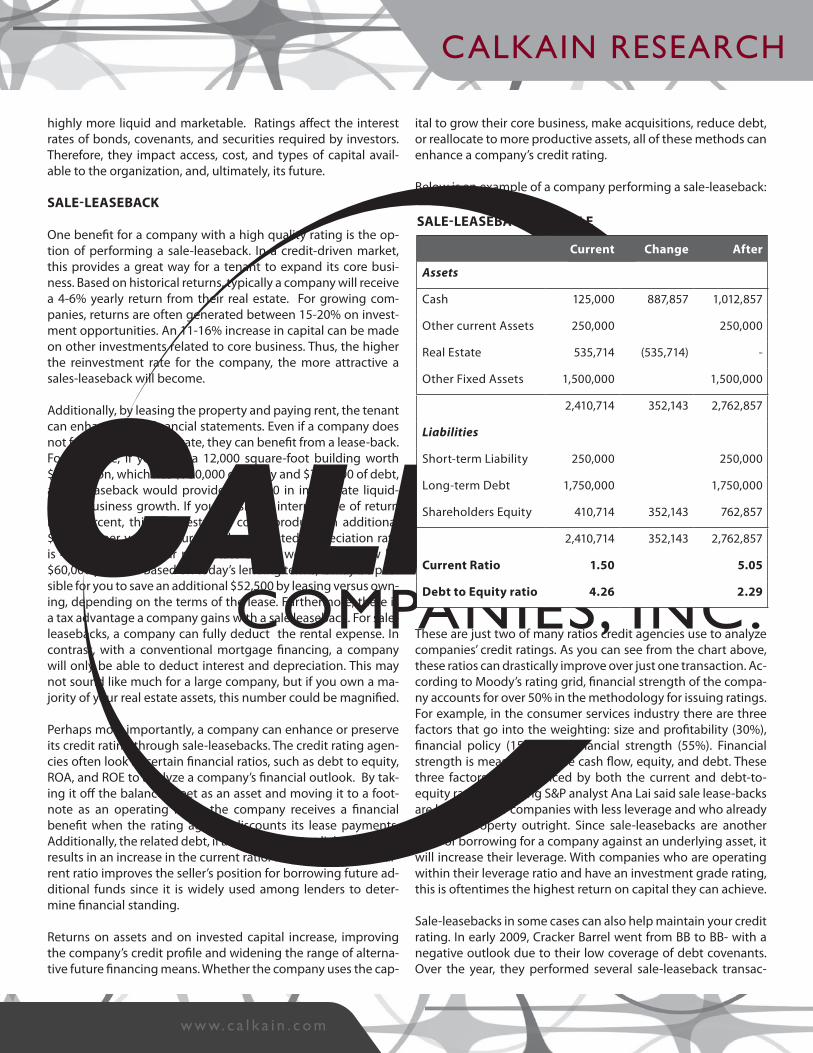
Below is an example of a company performing a sale-leaseback:
These are just two of many ratios credit agencies use to analyze companies’ credit ratings. As you can see from the chart above, these ratios can drastically improve over just one transaction. Ac-cording to Moody’s rating grid, financial strength of the compa-ny accounts for over 50% in the methodology for issuing ratings. For example, in the consumer services industry there are three factors that go into the weighting: size and profitability (30%), financial policy (15%), and financial strength (55%). Financial strength is measured by free cash flow, equity, and debt. These three factors are influenced by both the current and debt-to-equity ratio. Reporting S&P analyst Ana Lai said sale lease-backs are beneficial for companies with less leverage and who already own the property outright. Since sale-leasebacks are another form of borrowing for a company against an underlying asset, it will increase their leverage. With companies who are operating within their leverage ratio and have an investment grade rating, this is oftentimes the highest return on capital they can achieve.
Sale-leasebacks in some cases can also help maintain your credit rating. In early 2009, Cracker Barrel went from BB to BB- with a negative outlook due to their low coverage of debt covenants. Over the year, they performed several sale-leaseback transac-
SALE-LEASEBACK EXAMPLE
Current Change After
Assets
Cash 125,000 887,857 1,012,857
Other current Assets 250,000 250,000
Real Estate 535,714 (535,714) -
Other Fixed Assets 1,500,000 1,500,000
2,410,714 352,143 2,762,857
Liabilities
Short-term Liability 250,000 250,000
Long-term Debt 1,750,000 1,750,000
Shareholders Equity 410,714 352,143 762,857
2,410,714 352,143 2,762,857
Current Ratio 1.50 5.05
Debt to Equity ratio 4.26 2.29

CALKAIN RESEARCH
w w w. c a l k a i n . c o m
tions to improve the coverage and maintain their BB rating. They ended up performing lease-backs for over 15 stores to help pay off over $142.8 million of long-term debt for the year. Without these transactions, they would have been in jeopardy of not paying off some of their debt, which would have lowered their credit rating. In 2010 their outlook has changed to posi-tive. One statement from Moody senior analyst Bill Fahy stated, “The change in outlook to positive reflects the improvement in Cracker Barrel’s debt protection metrics despite weak consumer spending and relatively modest earnings growth as it has mate-rially reduced its debt levels.” The positive outlook also reflects our view that debt protection metrics will continue to improve as management focuses on debt reduction over and above re-quired amortization, as well as our view that operating metrics will gradually improve over time.” According to Moody’s, over 42.5% of their ratings for the restaurant industry are weighted by leverage and coverage of company. Secondly, their method-ology for retail services industry has 41% of its formula weighted with financial policies and key indicator ratios. These formulas use numbers derived from liquidity and debt. The ratios that are quantified for this can all be improved through sale leaseback transactions, thus improving credit outlook. According to GAAP, operating leases are expenses that are not put on balance sheet. The entire rental payment is fully tax-deductible. A company that owns their property only gains tax benefits from interest and depreciation, not the principal payments.
While current GAAP treats operating leases as expenses, credit agencies treat them differently. According to analysts from S&P, Moody’s, and Fitch, sale lease-backs are already capitalized and treated as an asset, not an expense. S&P analyst, Ana Lai, said ad-justments are made with the cash received from sale-leasebacks so the ratios are not affected from these types of transactions. Even if certain ratios are not immediately improved from the transactions, sale-leasebacks can be beneficial for a company.
First, for a company that has a lot of distribution centers, ware-houses, and retail stores, it may not make a lot of sense for the company to own all these properties. When evaluating proj-ects, if they can find higher returns through other projects, they are increasing their overall profitability. Additionally, investors would have a much more positive outlook seeing the company’s earnings being used for research and innovation rather than owning real estate. Secondly, if a company with short-term fi-nancial difficulties needs to pay off debt or make an investment, a sale-leaseback may be the best way to achieve the lowest cost of capital. When a company is facing debt repayments in the imminent future, this could save them from defaulting on pay-ment and preserving their credit. Another corporate strategy is executing on these leasebacks to buy back shares of their stock. When done by the corporation, the values of the outstanding shares increase on the open market.
Margaret Taylor, an analyst with Moody’s, says there also can be
disadvantages for companies utilizing sale-leasebacks. First, the cash flow proceeds from sales are not considered free cash flow. Since the leases are capitalized, they are put back on the balance sheet. The capital expenditures companies report on the cash flow statement by the depreciation component will be increased due to a sale-leaseback. This increase in the expenditures will take away from the free cash flow, giving a more accurate de-piction of its free cash. Secondly, long term sale-leasebacks for companies can actually penalize them. Moody’s for example has two ways for capitalizing leasebacks. One, is they apply a multiple to current rent expense to calculate the amount of the adjustment to debt. For the retail sector it is 8x rent factor to as-sess a company’s effective leverage. The other way is capitalizing operating leases at less than the present value of the future lease payments, which is discounted by the long-term borrowing rate. For instance, if a company enters into a sale-leaseback with a 30 year lease, it will be capitalized at a higher PV amount than 8x rent expense. Moody’s uses the number that is higher between the two when adjusting for debt.
Companies that already have an investment grade rating have an advantage. Consider the case of SunTrust, which in the first two quarters of 2008 completed corporate sale-leasebacks of 149 branch properties and office buildings. The net proceeds from the sales were $245.3 million. Since the lessee of this cor-porate-guaranteed lease is SunTrust, investors are buying the in-vestment grade obligation of SunTrust and are not driven by the real estate decision as much as the credit rating of the tenant.
Drugstores such as Walgreens and CVS are often packaged in portfolios and sold wrapped with this type of financing. In many cases, investors are not going to buy these properties without having an investment grade tenant in them. Similarly, for an in-vestor who is willing to take on a company that has below in-vestment grade quality, there is a premium that can be 200-400 basis points higher per year. Still, for companies with no or low credit, it provides a great opportunity to expand when they have limited opportunities.
Perhaps the most important factor in how sale-leasebacks im-prove the company is the company’s debt to leverage measures. Several analysts from S&P and Moody’s agree that how much le-verage a company uses is a big factor in their ratings. According to S&P analyst Gerald Phelam, if a company has a low amount of leverage, below the industry average, it can gain the optimal benefit from sale-leaseback. For instance, Home Depot has a 2x debt to leverage ratio, while their target amount is 2.5x. Since they own around 90% of their stores, they can afford to perform sale-leasebacks to open up more locations or invest elsewhere. This would keep them within the parameters of their credit guidelines. Another analyst, Ana Lai, says Walgreens for example has a 3.5 debt to leverage ratio while Rite-Aid is around the 9-10 range. She says that in comparison, a company with less lever-age such as Walgreens, when compared to the industry stan-
CALKAIN RESEARCH
w w w. c a l k a i n . c o m
dard, benefits more from a sale- leaseback. With so many factors involved, there is no clear answer as to whether sale-leasebacks are going to enhance a company’s credit rating. What the com-pany does with the cash proceeds in the future will determine the effect on the rating. One thing for certain is that there’s a clear distinction from what the accounting standards and credit rating agencies use as guidelines for their treatment of sale-leasebacks.
FASB ACCOUNTING CHANGES TO LEASES
There has been much speculation about the accounting change to leases. Although it’s purely speculative as nothing has been fi-nalized yet, it seems for certain that the proposal will be accept-ed to allow more transparency within the companies reporting of financial statements. One modification of the proposal is to change all “significant” operating leases to capital leases. As of now, companies can report many leases of real estate as an operating expense and avoid capitalizing the property on the balance sheet as an asset. To be classified as an operating lease, a company cannot have a transfer of ownership or bargain pur-chase offer at end of lease term. In addition, the present value at the beginning of the lease term of the minimum lease payments is no more than 90% of the fair value of the leased property to the company at the inception of the lease. If it meets these re-quirements it’s treated as an operating expense and placed in a footnote on balance sheet.
The other accounting change will be the inclusion of options in the calculation of the life of the asset and thus its subsequent ex-tension. Presently, the life of the asset does not include options of renewal. The change will require tenants to capitalize all “like-ly” liability obligations such as purchase options and/or lease extensions, driving up the present value booked. For example, a five-year lease with a five-year renewal option will be booked as a 10-year lease commitment. Both of these changes could have a significant impact on their financial statements going forward.
Take for example Walgreens who performed saleleasebacks and has up to five decades of options to review on a vast majority of their real estate. By having to capitalize all of these assets, it is going to negatively alter their balance sheet by adding on a lot more assets and debt. It is worth noting just recently FASB and IASB members met and voted down to adding options and re-newal periods in the length of leasing unless there is significant economic incentive to do so, such as bargain pricing on renew-als. The original proposal included economic factors, as well as a wide variety of other factors, including lessee past practice, market conditions, and lessee intent. Instead, they agreed to ac-count for leases on the basis of their contractual minimum. As mentioned earlier, credit agencies already include all of these leases as capital leases in their methodology. So even though
their short-term financials may be altered, it will have no affect on their credit rating from the agencies. All of their off-balance sheet reporting is put back on the balance sheet.
In their methodology, S&P capitalizes the lease commitment on balance sheets using the present value of the minimum lease payments at 8.5% rate. Moody’s, uses the same adjust-ment concept at 8.0% rate. The rates vary by sector from 4 to 10%, retail being around 8. Both agencies use a methodology not to capitalize operating lease commitments at less than the present value of the future lease payments, discounted by the long-term borrowing rate, as these represent firm commitments over the long term. Both credit agencies make adjustments to these leases and are inconsistent with GAAP and other account-ing standards. Their goal is to measure credit analysis, not to fol-low accounting practices. The agencies simulate a company’s financial statements assuming it had bought and depreciated the leased assets, and financed the purchase with a like amount of debt. This requires modification to the balance sheet, income and cash flow statements.
Below is a table showing how S&P already treats operating leas-es. Other than the proposed capitalizing leasing options and renewals, no other major changes should be made to evaluate rating.
STANDARD ADJUSTMENTS FOR OPERATING LEASES
Balance Sheet
We adjust the balance sheet by adding both debt and fixed assets (usually gross plant, property and equipment). We compute this debt by multiplying current rent expense by a factor of 5X, 6X, 8X or 10X, or, if the present value (PV) of the minimum lease commitments (using the incremental bor-rowing rate as the discount rate) is higher, we use the PV.
Income Statement
We adjust the income statement to reclassify one-third of the rent expense to interest expense and the remaining two-thirds rent to "Depreciation - Capitalized Operating Leases" (a component of operating profit), and we adjust operating expenses (or cost of goods sold and selling, gen-eral & administrative expenses) proportionally.
Cash Flow Statement
We adjust the cash flow statement to reclassify the prin-cipal portion of lease payments from operating cash flow (CFO) to a financing cash outflow (CFF). We also simulate capital expenditure for newly acquired leased assets by increasing the capital expenditures line in investing cash flows (CFI) with a concomitant borrowing in CFF to fund the capital expenditures

CALKAIN RESEARCH
w w w. c a l k a i n . c o m
As you can see from the table above, operating leases are treated similarly to capital leases on all three major financial statements. Even though credit agencies will not see a major change, the same cannot be said for accounting practices done by compa-nies if the new draft passes. The document is already drafted and if finalized this year all changes would be adopted in 2013. While this should have no impact on credit rating, debt covenants will have to be revised and lenders will have to reevaluate their ac-counting ratios they use for determining credit. Presently, the SEC reported that an estimated $1.25 trillion of operating leases kept off-balance sheet would be transferred to corporate bal-ance sheets if adopted. While credit ratings should remain un-harmed, all parties will need to make adjustments going forward to adapt to the change. Analysts say the only material changes to credit ratings would come from adverse market reactions or change in business practices, not the leasing change itself. Ten-ants, landlords, and lenders will all have to make changes in their strategies. At this point though, nothing is final and there will certainly be new modifications due to the impact of these changes. With the heavy criticism and wide impact, FASB and IASB are cautious to set out major changes quickly. The final tar-get date for adoption is set for December 31, 2011 but may be delayed.
COMMERCIAL LENDING GUIDELINES
In commercial net leases, the investment yields are primarily based on the credit of the tenant. Other factors such as rental location and trends are also factors, but are not the significant factor in the yield. While credit of the borrower is important in the credit decision, the lender heavily weighs the credit rating of the tenant. Ratings are determined by several credit agen-cies. As discussed earlier, two of the major agencies are Standard & Poors (S&P) and Moody’s. Lenders such as private investors, banks, and insurance companies use these ratings to consider who they may consider giving a secured loan too and what the terms will be.
Each lender has different criteria for who they lend too. For ex-ample, CTL lenders will only lend to investment tenants regard-less of the quality of real estate. On the other hand, insurance companies such as American Fidelity assess all types of compa-nies and measure them through H and Z scores to determine if they qualify. A company could have no or non-investment credit but have high H and Z scores and qualify for a loan. As do inves-tors, all lenders try to diversify their portfolio assets as much as possible.
According to mortgage banker Brad Cox of Thomas Wood and Company, lenders desire certain industries and companies. Additionally, being a name-brand tenant gives the company instant credibility when trying to acquire funds. For instance, Publix is a private company who does not release their finan-
cial statements. Lenders will still give them maximum LTV and low borrowing rates because of their solid reputation. In reality though no one is sure how strong Publix is, their image is based on public perception. Most lenders have certain criteria for the type of financing options for companies, but the overall assess-ment of a company can be subjective.
Trends change with time and with the current economy, lend-ing is not how it used it be. Mr. Cox stated, “The days of no one providing equity and the borrower achieving 100% leverage are over. Right now lenders are willing to put down 60-70% LTV.” A company’s credit and the lease terms affect the lenders ability to issue funds. He goes on to say for an investment grade ten-ant who only has 4 or so years left on lease, lenders are cautious about lending to them because of the risk of the tenant not re-newing. Right now there is more money and conduits, but lend-ers are still tight on underwriting guidelines. There are a lot of deals right now to be made but many do not qualify because of tight criteria. For example, American Fidelity will not lend to a majority restaurants unless there is a ground lease. On their proposed list of approved retail credits, there were 71 retailers they would lend to and 55 not approved. This doesn’t include any franchisees or maximum exposure retailers such as CVS and Walgreens. Furthermore, of the 71 approved, most of them have restrictions and additional criteria they must meet. This shows that many investors are following very tight guidelines in today’s lending environment.
Every investment institution has their own qualifications and standards for what they are looking to buy and preferences may change over time. Insurance companies are looking for stand-alone, investment grade tenants. Banks on the other hand are looking at mostly recourse loans and are being more selective. Between the two, brokers are currently finding better execution and more deals being done with life insurance companies.
Regardless of the institutional investor, each has a set of lending policies that are guided by certain financial ratios. There are sev-eral ratios that banks look at when deciding to lend out money for a commercial loan. One important formula is Loan to Value. This is the total amount borrowed versus the appraised value of the property. Some lenders will loan as much as 80 to 90% of the value of property given that the tenant has investment grade rating or higher. A second ratio is the Debt Service Cov-erage Ratio, which is the net operating income from property divided by the total debt service. This is the best indicator of default probability. The lender makes sure businesses can cover all expenses including loan payment to make sure no personal money is needed. The ratio should ideally be over 1, showing the lender can pay its debt obligations. Similarly, the Personal Debt Coverage Ratio also measures debt. Instead of measuring the debt for property itself, the PDCR measures the overall debt of the borrower and equals monthly personal debt divided by monthly personal income. A borrower with 150% PDCR is obvi-

CALKAIN RESEARCH
w w w. c a l k a i n . c o m
ously in serious trouble paying off debt since his debt is 1.5x his income. Banks will seldom lend if percentage is above 50%, and most prefer a lower percentage than that.
Loans in themselves are simple, but each has different charac-teristics. A non-recourse loan is given to investors for real estate whose tenants are financially strong companies. The interest rate is largely determined in correlation with the credit rating of the companyas specified by Standard & Poor’s or Moody’s. The better the credit rating of the tenant, the lower the rate of inter-est will be on the non-recourse loan, within the parameters of the market rate at that point in time. The loan is usually correlat-ed with the remaining years left on the lease. In most cases, the lender will extend the loan for an investment graded company. For a non-investment rated company, lenders are only willing to give out recourse loans. Lenders are not confident in their debt repayments so they want more collateral in return other than the asset at hand.
Another type of popular financing for investing in NNN proper-ties is Credit Tenant Lease (CTL) financing. It is a non-traditional type of commercial real estate loan that allows borrowers to “leverage-up” based on the predictable income streams of long-term leases. CTL financing provides substantial debt lev-els based on the credit-quality of the tenant, and the net lease structure securing the asset. The collateral is the long-term lease, not the physical real estate. Since financing is primarily based on the tenant, the credit rating plays a vital role in determining eli-gibility. Lenders are comfortable providing funds knowing that an investment-grade tenant’s monthly rent check will be paying the mortgage balance.
CTL loans are originated by commercial mortgage bankers or di-rect CTL lenders. Bankers will issue and sell a private mortgage bond in order to fund the CTL loan. Direct lenders also collat-eralize the lease into a bond, but often hold the debt in their own portfolios rather than sell it on the secondary market. The nature of the loan is very straightforward and the processing of the loan takes on average 45-60 days, far less than bank loans. The main requirement is that the rent collected must cover the mortgage payment. This is measured by the debt service cov-erage ratio and the minimum requirements are from 1.01- 1.25 depending on the lender. What makes these loans very attrac-tive is in most cases the borrower just needs enough money to cover mortgage and expenses to qualify. Another added benefit of CTL loans is the fixed financing for the investor. Virtually any company that can boast of a superior credit rating and leases real estate on a NNN basis can qualify for CTL financing. Unfor-tunately, you typically won’t qualify for CTL financing if tenants who are in the building are non-investment grade or have no credit established. The main advantages are maximum loan pro-ceeds and lower debt service coverage requirements. CTL loans are characterized by their high LTV’s, 80% - 100% and low debt service coverage ratios, 1.05 – 1.25. Some other advantages of
the loan are its non recourse and fixed rates that self-amortize. As you can see from the types of loans above, an investment grade tenant is the most important or sole factor in obtaining them. These loans maximize your investment by utilizing lever-aging and borrowing at low rates. More importantly, lenders are more willing to give borrowers longer terms and amortization schedule on the loan. If the potential tenant has no or bad credit, then factors such as real estate and lease terms become increas-ing more important. In addition to corporate rating of tenant, the type and terms of the lease are other factors that are consid-ered. If a lender is just willing to sign a ground lease because of the tenant’s credit, this may hike up interest rates. For instance, a company that wants a $500,000 loan may be receiving a 6% or slightly higher rate, whereas a $3 million dollar loan may get rates as low as 5%. Another factor that will have a direct effect on rates is the lease term. Lenders are hesitant about the tenant signing a 10 year lease on a 25 year amortization because of the releasing risk that would be involved. This added risk would fol-low with higher rates.
With the current market, CTL lenders are looking for only invest-ment grade tenants, where as life insurance companies will look into non-investment grade companies if their return yield is ap-propriate. Just like with any investor, both CTL lenders and in-surance companies are looking to diversify their portfolio and maintain a level of maximum exposure. For instance, companies such as Walgreens and CVS are rapidly expanding due to de-mand. Some of the large lenders are not willing to finance any of those drug stores right now to limit their maximum exposure, even though they both have strong credit ratings. As in with individuals, pensions and insurance companies need to diversify their portfolio of investments to reduce firm specific risk. In late 2009 and early 2010, Walgreens could not find any CTL lenders to finance their new store openings for most of the year because the buyers had too much Walgreens debt in their portfolio and needed to buy other bonds to diversify. CTL financing is becom-ing increasingly popular due to the relatively strong bond mar-ket. Investment banks finance these loans and issue bonds that are selling in the open market. This is the easiest way for invest-ment grade companies to borrow in a recession where it can be difficult to pry money from insurance companies and banks.
FINANCING OPTIONS
With today’s economy, financing is more important than ever. Cash-on-cash yields are important in this marketplace due to the comparative available yields on corporate bonds and treasury bills. Since the market for most deals uses exchanges between parties in which debt is involved, most transactions require a fi-nancing element in order to complete the exchange. Numerous lenders exist for these deals in today’s financing marketplace.
CALKAIN RESEARCH
w w w. c a l k a i n . c o m
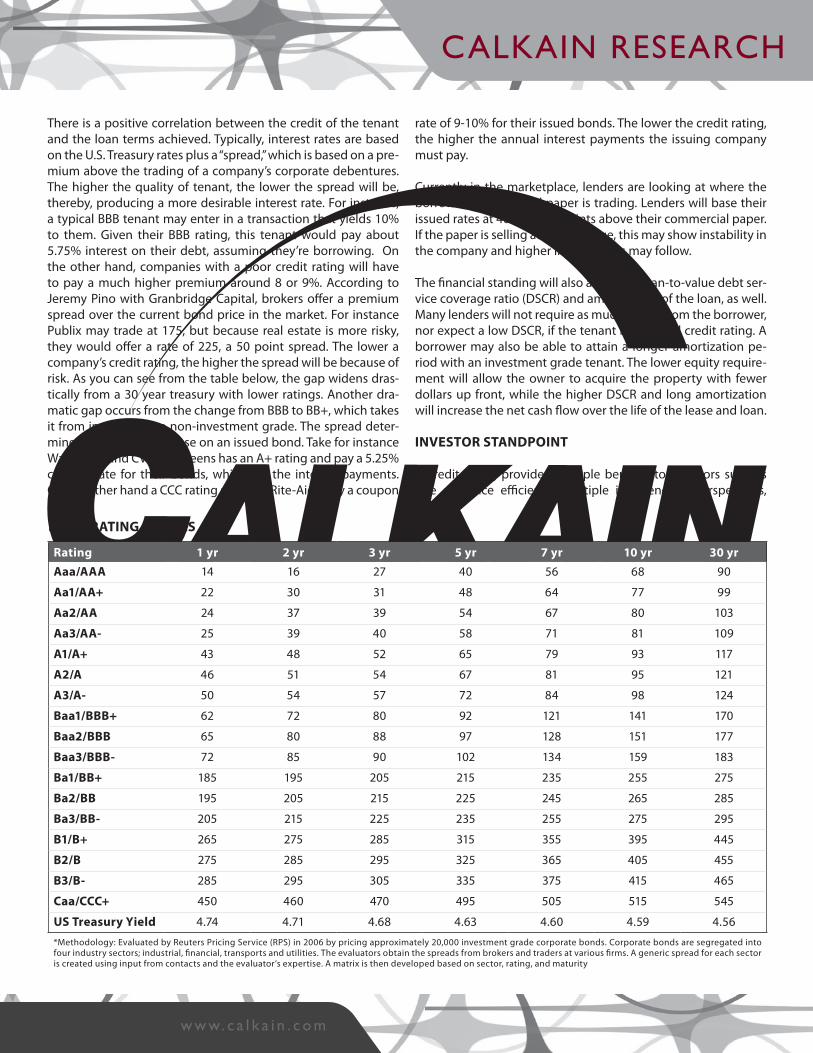
There is a positive correlation between the credit of the tenant and the loan terms achieved. Typically, interest rates are based on the U.S. Treasury rates plus a “spread,” which is based on a pre-mium above the trading of a company’s corporate debentures. The higher the quality of tenant, the lower the spread will be, thereby, producing a more desirable interest rate. For instance, a typical BBB tenant may enter in a transaction that yields 10% to them. Given their BBB rating, this tenant would pay about 5.75% interest on their debt, assuming they’re borrowing. On the other hand, companies with a poor credit rating will have to pay a much higher premium around 8 or 9%. According to Jeremy Pino with Granbridge Capital, brokers offer a premium spread over the current bond price in the market. For instance Publix may trade at 175, but because real estate is more risky, they would offer a rate of 225, a 50 point spread. The lower a company’s credit rating, the higher the spread will be because of risk. As you can see from the table below, the gap widens dras-tically from a 30 year treasury with lower ratings. Another dra-matic gap occurs from the change from BBB to BB+, which takes it from investment to non-investment grade. The spread deter-mines the interest expense on an issued bond. Take for instance Walgreens and CVS. Walgreens has an A+ rating and pay a 5.25% coupon rate for their bonds, which are the interest payments. On the other hand a CCC rating such has Rite-Aid carry a coupon
rate of 9-10% for their issued bonds. The lower the credit rating, the higher the annual interest payments the issuing company must pay.
Currently in the marketplace, lenders are looking at where the borrower’s commercial paper is trading. Lenders will base their issued rates at 40-50 basis points above their commercial paper. If the paper is selling at a wide range, this may show instability in the company and higher interest rates may follow.
The financial standing will also affect the loan-to-value debt ser-vice coverage ratio (DSCR) and amortization of the loan, as well. Many lenders will not require as much equity from the borrower, nor expect a low DSCR, if the tenant has a good credit rating. A borrower may also be able to attain a longer amortization pe-riod with an investment grade tenant. The lower equity require-ment will allow the owner to acquire the property with fewer dollars up front, while the higher DSCR and long amortization will increase the net cash flow over the life of the lease and loan.
INVESTOR STANDPOINT
A credit rating provides multiple benefits to investors such as due diligence efficiency, multiple independent perspectives,
BOND RATING GRADES
Rating 1 yr 2 yr 3 yr 5 yr 7 yr 10 yr 30 yrAaa/AAA 14 16 27 40 56 68 90
Aa1/AA+ 22 30 31 48 64 77 99
Aa2/AA 24 37 39 54 67 80 103
Aa3/AA- 25 39 40 58 71 81 109
A1/A+ 43 48 52 65 79 93 117
A2/A 46 51 54 67 81 95 121
A3/A- 50 54 57 72 84 98 124
Baa1/BBB+ 62 72 80 92 121 141 170
Baa2/BBB 65 80 88 97 128 151 177
Baa3/BBB- 72 85 90 102 134 159 183
Ba1/BB+ 185 195 205 215 235 255 275
Ba2/BB 195 205 215 225 245 265 285
Ba3/BB- 205 215 225 235 255 275 295
B1/B+ 265 275 285 315 355 395 445
B2/B 275 285 295 325 365 405 455
B3/B- 285 295 305 335 375 415 465
Caa/CCC+ 450 460 470 495 505 515 545
US Treasury Yield 4.74 4.71 4.68 4.63 4.60 4.59 4.56
*Methodology: Evaluated by Reuters Pricing Service (RPS) in 2006 by pricing approximately 20,000 investment grade corporate bonds. Corporate bonds are segregated into four industry sectors; industrial, financial, transports and utilities. The evaluators obtain the spreads from brokers and traders at various firms. A generic spread for each sector is created using input from contacts and the evaluator’s expertise. A matrix is then developed based on sector, rating, and maturity
CALKAIN RESEARCH
w w w. c a l k a i n . c o m
and facilitates easy comparisons by providing easy benchmark-ing. Additionally, it’s another tool in portfolio management for investors to analyze a company because of its relative stability over time. In short, the ratings give an investor an efficient way to look at a range of alternatives. While credit ratings are used to evaluate companies on all levels, we will compare the ratings from drug store retailers. Specifically, we will evaluate NNN leas-ing from these companies.
Tenants in properties are divided into two segments. Proper-ties have either credit or non credit tenants. The most desirable and least risky properties have investment grade credit tenants. Non credit tenant properties have tenants that are not credit rated. These tenants frequently are regional or local businesses or companies that are unrated. Some tenants are considered credit worthy yet are unrated because they carry no debt on their books. A prime example of this would be Publix. One of the best tenants for leasing too is Walgreens due to their quality credit rating, which makes it a more secure investment. Gener-ally though, the stronger the credit the less yield there is going to be and more expensive the property is. The returns on these investments typically range from 6-10%, depending on your lev-el of risk tolerance. For instance, a well-known Walgreens would yield around 6%, while a less known franchisee restaurant would yield closer to a 10% return in today’s market. While these are
just estimates, they provide a benchmark on the levels of return.
TENANT COMPARISON: HIGH VS. LOW/NO CREDIT
Before we evaluate the differences, we’ll assume all other factors are held constant, such as length of lease and location. Investing and returns will vary by individual. It depends on what part of the investing cycle you are in. Investing in NNN real estate is a lot like investing in a bond, they both produce similar streams of income and are credit-driven.
Someone who is trying to grow money at an accelerated pace is in the wealth creation stage. If you are able to take risk, you could make a substantial gain by investing in a regional or lo-cal company. If they have established themselves in the com-munity and show positive trends on financial statements, this could present a great opportunity even without a public credit rating. One key advantage in this type of investment is the abil-ity to insert periodic rent increases in the contract. In contrast, this would be a lot harder for a high quality tenant.
Another aspect is if you are investing in mergers or franchisees. In both cases the financials need to be scrutinized and not just
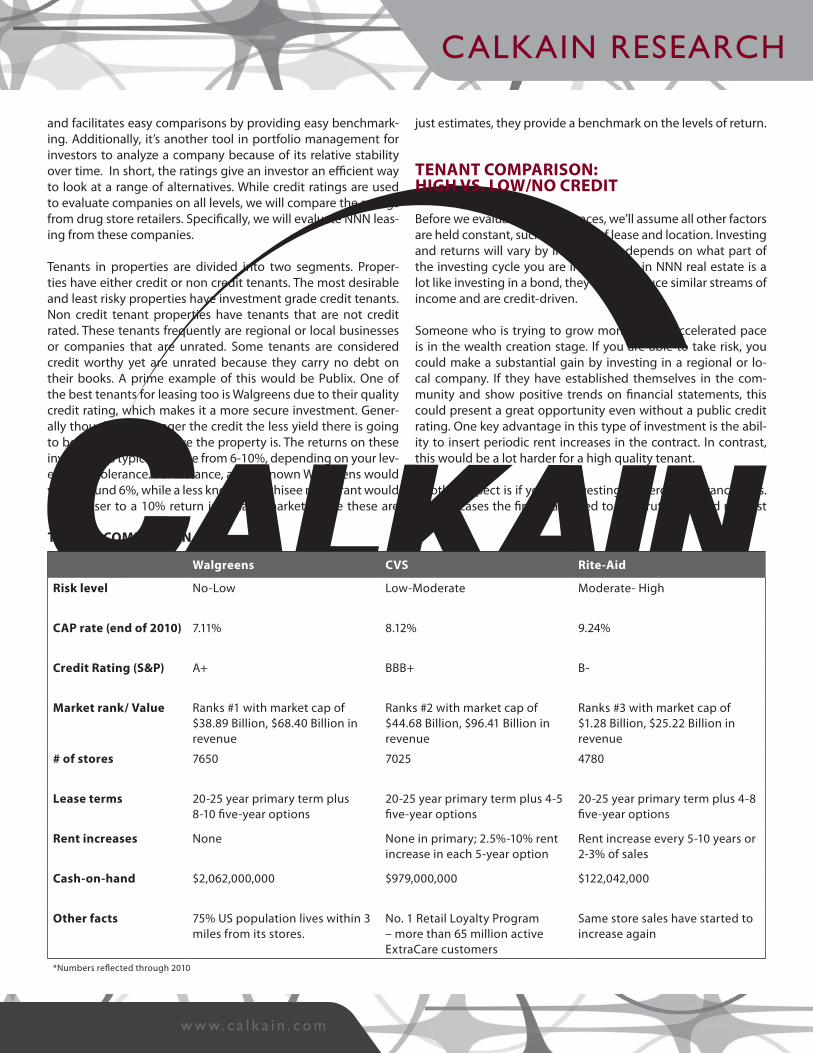
TENANT COMPARISON
Walgreens CVS Rite-Aid
Risk level No-Low Low-Moderate Moderate- High
CAP rate (end of 2010) 7.11% 8.12% 9.24%
Credit Rating (S&P) A+ BBB+ B-
Market rank/ Value Ranks #1 with market cap of $38.89 Billion, $68.40 Billion in revenue
Ranks #2 with market cap of $44.68 Billion, $96.41 Billion in revenue
Ranks #3 with market cap of $1.28 Billion, $25.22 Billion in revenue
# of stores 7650 7025 4780
Lease terms 20-25 year primary term plus 8-10 five-year options
20-25 year primary term plus 4-5 five-year options
20-25 year primary term plus 4-8 five-year options
Rent increases None None in primary; 2.5%-10% rent increase in each 5-year option
Rent increase every 5-10 years or 2-3% of sales
Cash-on-hand $2,062,000,000 $979,000,000 $122,042,000
Other facts 75% US population lives within 3 miles from its stores.
No. 1 Retail Loyalty Program – more than 65 million active ExtraCare customers
Same store sales have started to increase again
*Numbers reflected through 2010
CALKAIN RESEARCH
w w w. c a l k a i n . c o m
the statements from other franchisees, but also the parent com-pany. It also needs to be known if there is a “guarantee” in the contract to show if parent company will cover the finances if franchisee fails.
WHY SHOULD YOU INVEST IN PHARMACIES
As you can see listed below, this is just some of the information that goes into making a decision on a tenant. There are a variety of factors such as competition and location, but here we will talk about the ones relating to the credit rating. One of the main ad-vantages of investing in these companies is the pharmacy busi-ness is generally recession-proof. With healthcare being such an important element in people’s lives, there is always going to be a demand for medicine. There is no target or selective audience for prescriptions, everyone has access to getting prescriptions whether they can afford it or not. Because of this, the tenants sometimes will not build any rent bumps into their leases. Over time, this decreases the amount of rent received for investor due to inflation. With a mature investor who is closer to retirement, they value stability with small, if any rent bump over higher in-creases with less stability. In all cases, you should evaluate the financial strength of the prospective tenant by itself and then in relation to its competitors in marketplace.
Someone who is a mature investor and whose goals are risk management and conservative investing is in wealth preserva-tion mode. These investors want a strong asset with low risk for good yield at maybe 7 to 8 percent. They want tax benefits and to live off the cash-flow. In this cycle it’s about sustaining and maintaining your current lifestyle. A prime sector for this inves-tor is pharmacies such as Walgreens.
For a moderate risk investor CVS may be more appropriate. You can often find CAP rates between 6.5-8% for these properties. This is the only NNN investment grade drug store presently that offers rent increases. Even though they vary by location, a typical CVS will average about a 5% increase in rent every five years at some point in the lease.
For a high risk high yield investor who is looking for wealth accu-mulation, a company such as Rite-Aid provides the best oppor-tunity. Rite-Aid has the most leverage right now out of the three and has accumulated mass amounts of debt through acquisi-tions. With the high perceived risk due to bankruptcy talks and non-investment credit rating, an investor could make a nice re-turn in the right situation. With high cap rates relative to industry and rent bumps from 5 to 10% every five years, these stores pro-vide a great opportunity for high return. On the other hand, high return comes with high risk. Given their past financial difficulties and limited financing options, the investment risk is increased. Rite-Aid may be looking to sell some of their properties to lower their debt. These may include high sales volume store and in great locations. This is important because some Rite-Aid leases
have gross sales percentage returns to the investor. Investing in a high volume store where you get around 2.5% of gross sales could be highly profitable. More importantly, even if Rite-Aid were to declare bankruptcy, they are not going to close down a profitable store. If there is a store with strong sales growth and located in good area, this alleviates some of the risk with this investment.
Another important consideration that will be a deciding factor is financing. General pricing for a drug store pharmacy typically ranges from $4-7 million. Depending on the investor, financing may be needed. Private equity firms or institutional investors may have plenty of capital raised on hand, where a private in-vestor may have to finance. The cap rate is lowest for Walgreens, which means higher price for the property. While the cap rate is lower for Walgreens than Rite Aid, you will be able to get the best rates and terms for Walgreens because of their superior rat-ing. For example, let’s say Walgreens has a 7.5% cap with a 5.5% interest rate on the loan. This generates a 2% premium on your investment. On the other hand, let’s say Rite Aid has a 10% cap and 9% interest rate. This shows a 1% premium for investor. As you can see, you can generate more cash flow from the former in this situation. This just scratches the surface of financing. There are a multitude of other factors to consider such as LTV value, DSCR, length of amortization, type of recourse, among others. All of these have a significant role in what type of financing you receive.
Between Walgreens, CVS, or Rite-Aid, which is the best tenant? The answer is, it depends. There are advantages and disadvan-tages to all three tenants above. The most secure investment lies with Walgreens for obvious reasons. They have the highest credit rating of all three. More importantly, they have a corpo-rate guarantee on all their leases. Even if a store closes due to slow sales, Walgreens continues to pay rent on its master leases through subleasing or other means. If you’re an investor who has a lot of cash and does not need financing, you can generate a higher return without financing. This is an especially attractive investment with a low credit tenant such as Rite-Aid. Presently, Rite-Aid has only approximately $122 million of cash-on-hand, compared to $979 million in CVS and over $2 billion in Wal-greens. From an investor standpoint and because of their need for immediate cash, high CAP rates should follow. If financing is a concern for you, then obtaining a loan with favorable condi-tions would require an investment grade tenant such as CVS or Walgreens. There are also additional factors to consider such as length and type of lease and location that play a major role in the decision.
To sum up, all the information presented is purely informational and you should consult a licensed professional for assistance in these investments. With the wide gaps in the credit rating be-tween the three companies, there are also wide gaps between the risk and return. When determining your investment decision,

CALKAIN RESEARCH
w w w. c a l k a i n . c o m
more goes into it than just the credit rating. The credit rating is just a “snapshot” of the financial situation of a company and the facts listed above are just part of a small analysis that should be done before investing. Whether you are investing in real estate or any other security in the market, a thorough credit analysis should be part of the due diligence process before making an investment decision.
CREDIT RATINGS VS PROBABILITY OF DEFAULT
Perhaps the single most important value of credit ratings to in-vestors is it allows them to get a third party view of the issuer’s ability to make all their financial commitments in the future. This is particularly important in real estate when the tenant signs a 20-25 year lease for the investment property. The investor is get-ting a bond-like return from them in the amount of the agreed upon rent. If an investor buys a bond from a company and short-ly thereafter the company declares bankruptcy, the investor will not only lose out on their interest payments, but also are at high risk of losing all the money then invested in the principal of the
bond itself. In the case of an investor who leases out to this same company, they are at risk of losing out rent payments and will be forced to pay out of pocket until they lease to another ten-ant. This is why it is extremely important to accurately assess the default probability of a tenant.
The chart bellow is a snapshot of several retail businesses and their assigned rating by the two largest credit agencies. Al-though there are many consistencies between the two, there are some differences. This shows why it is important to have more than one credit opinion. When looking at the chart below Ad-vance Auto has a 4% chance of default, which gives it a slight in-vestment grade. If you the investor lease your property to them for 20-25 years, Advance Auto would have a 4% chance over the next five years of defaulting and not making payments. In the case of real estate, it is slightly different. Not only is there a 4% chance of defaulting and declaring bankruptcy, but there are ad-ditional risk the investor needs to be aware of. For example, Ad-vanced Auto could relocate their store or move out altogether if they trying to cut expenses and facing financial difficulties. For these reasons, most investors stay away from non-investment grade tenants to avoid paying all expenses every month for a
CREDIT RATINGS VS PROBABILITY OF DEFAULT
Tenant StockSymbol
Standard& Poor’s
Probability ofDefault (5 years) Moody’s Probability of
Default (5 years)7-Eleven SE AA- 0.25% Baa3 4.00%
A&P GAP D 60.00% D 60.00%
Advance Auto AAP BBB- 4.00% Baa3 4.00%
AT&T T A- 0.80% A2 0.60%
AutoZone AZO BBB 2.00% Baa2 2.00%
Bank of America BAC A 0.60% A2 0.60%
Best Buy BBY BBB- 4.00% Baa2 2.00%
Blockbuster Entertainment BBI D 60.00% NR -
Burger King Corp. BKC B 31.00% Ba2 9.00%
Capital One Financial Corp COF BBB+ 2.00% Baa1 1.50%
Chase Bank BBBY AA- 0.25% Aa1 0.15%
Chevron Corp CVX AA 0.20% Aa1 0.15%
Circle K (Alimentation Couche-Tard) ANCUF BBB- 7.00% NR 7.00%
Citibank C A+ 0.40% A1 0.40%
CVS CVS BBB+ 1.50% Baa2 2.00%
Dollar General DG BB 9.00% BA3 19.00%
Rite Aid RAD B- 43.00% Caa2 56.00%
Starbucks SBUX BBB+ 1.50% Baa3 4.00%
Walgreen Co WAG A 0.60% A2 0.60%
CALKAIN RESEARCH
w w w. c a l k a i n . c o m
period of time if their tenant moves out. Even investment grade tenants have risk. Starbucks would be a prime example. Due to a bad 4th quarter in 2008, early in 2009 Starbucks closed over 300 stores.
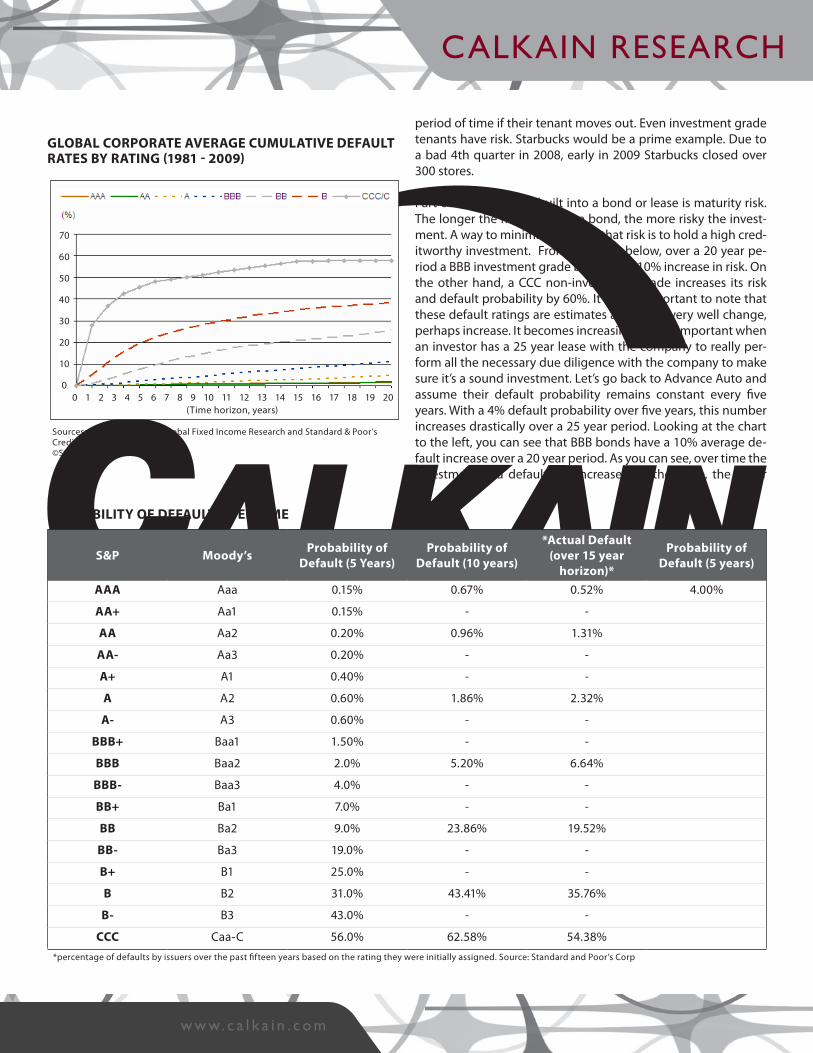
Part of the risk that is built into a bond or lease is maturity risk. The longer the maturity of the bond, the more risky the invest-ment. A way to minimize some of that risk is to hold a high cred-itworthy investment. From the chart below, over a 20 year pe-riod a BBB investment grade bond has a 10% increase in risk. On the other hand, a CCC non-investment grade increases its risk and default probability by 60%. It is also important to note that these default ratings are estimates and could very well change, perhaps increase. It becomes increasingly more important when an investor has a 25 year lease with the company to really per-form all the necessary due diligence with the company to make sure it’s a sound investment. Let’s go back to Advance Auto and assume their default probability remains constant every five years. With a 4% default probability over five years, this number increases drastically over a 25 year period. Looking at the chart to the left, you can see that BBB bonds have a 10% average de-fault increase over a 20 year period. As you can see, over time the investment and default risk increases. Furthermore, the lower
PROBABILITY OF DEFAULT OVER TIME
S&P Moody’s Probability of Default (5 Years)
Probability of Default (10 years)
*Actual Default (over 15 year
horizon)*
Probability of Default (5 years)
AAA Aaa 0.15% 0.67% 0.52% 4.00%
AA+ Aa1 0.15% - -
AA Aa2 0.20% 0.96% 1.31%
AA- Aa3 0.20% - -
A+ A1 0.40% - -
A A2 0.60% 1.86% 2.32%
A- A3 0.60% - -
BBB+ Baa1 1.50% - -
BBB Baa2 2.0% 5.20% 6.64%
BBB- Baa3 4.0% - -
BB+ Ba1 7.0% - -
BB Ba2 9.0% 23.86% 19.52%
BB- Ba3 19.0% - -
B+ B1 25.0% - -
B B2 31.0% 43.41% 35.76%
B- B3 43.0% - -
CCC Caa-C 56.0% 62.58% 54.38%
*percentage of defaults by issuers over the past fifteen years based on the rating they were initially assigned. Source: Standard and Poor’s Corp
GLOBAL CORPORATE AVERAGE CUMULATIVE DEFAULT RATES BY RATING (1981 - 2009)
Sources: Standard & Poor’s Global Fixed Income Research and Standard & Poor’s CreditPro ®©Standard & Poor’s 2010
(Time horizon, years)
70
60
50
40
30
20
10
00 1 2 3 4 5 6 7 8 9 10 11 12 13 14 15 16 17 18 19 20

CALKAIN RESEARCH
w w w. c a l k a i n . c o m
the credit rating, the higher the percentage increase of default over time. Surprisingly though, between years 15-20, there is a very small increase in the default risk in the investment and most level off. The most volatile years for the securities are in years 1-10.From the chart above, as the credit rating of the company goes down, the probability of default increases. Also from the last column you can see that although predicted and actual rates of default do differ, they are very similar in the investment grade ratings. Surprisingly, for non-investment grade ratings their ac-tual cumulative default rates over a 15 year period are below the predicted probability of a 10 year security. This shows relative uncertainty in the marketplace for speculative investments and the economy as a whole.
One important issue to take into consideration is the rating can change over time. Some instances include a change in earnings performance, technology, or debt covenants. Most credit agen-cies will alert the public by placing that company on a credit watch before the change of rating is made. This will alert inves-tors while the agency will conduct further analysis to see if an emerging situation will materially affect the company. Since 1981, an average of 29% of companies had a rating change each year. Of this average every year, the state of the economy plays a critical role in determining the downgrade to upgrade ratio. In 2008 and 2009, the ratio was 2.03 and 3.85 respectively. This means that downgrades exceeded upgrades over two and three times the amount of upgrades in these years. Our economic re-cession and global turmoil during this time was the result.
It is important to note that while these default probability per-centages are accurate, they’re only estimations due to several factors. First, unforeseen economic downturns can arise at any given time. According to a recent study by Standard & Poor, in 2009 264 companies defaulted giving a default rate of 3.99%, 5.62% in US. Of those, 11 were investment graded, giving a de-fault rate 0.32% for investment grade defaults. The default rate for speculative companies was 9.23% and the highest in a de-cade in the US at 10.9%. Secondly, issued ratings can change and are not taken in account when the company defaults. To show the importance of this lets look at investment grade defaults in 2009. As stated before, 11 of them had investment grades when defaulting. When looking at the originally issued ratings for all of the defaulting companies, 38 had originally been issued an investment grade rating. Even though studies show a lower per-centage in investment grade defaults, they do not take into ac-count originally issued ratings. Of the 264 defaulting entities in 2009, 27 more companies defaulted with an original investment grade. It is also important to note that the lower the credit rating, the higher the chance a company’s credit rating will change. This means that a vastly higher percentage of credit changes were from non-investment rated companies than investment graded ones. This is why it is increasingly important to monitor a com-pany’s rating and performance over time.
Moody’s also measured default rates from 1970-2009 based on a company’s issued rating. At 5, 10, and 20 years an investment grade company likelihood of defaulting were .973%, 2.503%, and 6.661% respectively. On the other hand, speculative grade companies over the same time horizons were 21.359%, 34.005%, and 49.649% respectively. The risk increases drastically over these intervals for both investment and speculative issued long-term bonds.
The last factor to look at is the correlation of the default rating with the time of default. According to a study done by S&P from 1981-2009, the lower the credit rating, the faster the time of default. For example, the AAA rated companies that defaulted did so on average at 16 years from the issuance of rating. BBB and CCC rated companies did so at 7.5 and 0.9 years respective-ly. This shows that not only do lower rated companies have a higher probability of default, but also happens at an accelerated pace with lower rating.
To sum up, there are a multiple patterns showing the relation-ships between credit ratings and default probability. Not only does default probability increase with a lower rating, but also the time of default is increased. Additionally, the length of ma-turity increases the risk over time and is directly correlated with credit rating, meaning the lower the credit rating the higher the maturity risk over time. It is also important to realize that when and if a company defaults on their debt, you may get paid back anywhere between zero and the full value of your principal in-vestment.
CONCLUSION
Credit ratings are a cornerstone in today’s financial marketplace. They are heavily relied upon by all parties in determining the yield and risk of issued debt. Even though it is a great funda-mental approach, it is important to realize when making deci-sions that more than just the credit rating should be taken into consideration. One must use mathematical models and look at market ratings such as bond prices when getting involved in a transaction.
These ratings are not an indication of investment merit, but an indicator of credit risk that can be used to view what investors can return in the event of a default. There are many more aspects in an investment decision that need to be considered. Other fac-tors include the current make-up of their portfolios, their invest-ment strategy and time horizon, their tolerance for risk, and an estimation of the security’s relative value to others. While real es-tate for an investor should be only a certain percentage of your portfolio, the credit analysis described can be used for any and all of your securities that make up your portfolio.
CALKAIN RESEARCH
w w w. c a l k a i n . c o m
REFERENCES AND WORK CITED
“Corporate Methodology.” Fitch Ratings, 2006. Web. 7 Feb. 2011. <http://pages.stern.nyu.edu/~igiddy/articles/corporate_rat-ings.pdf>.
“Credit Rating Agencies.” Crisis Response 8 (2009). World Bank, Oct. 2009. Web. 13 Mar. 2011. <http://rru.worldbank.org/docu-ments/CrisisResponse/Note8.pdf>.
“Guideline Rent Expense Multiples for Use with.” Moody’s, Mar. 2006. Web. 4 Feb. 2011. <http://www.elfaonline.org/cvweb_elfa/Product_Downloads/mlac06rtngagen.pdf>.
“Rating Methodology.” Moody’s - Credit Ratings, Research, Tools and Analysis for the Global Capital Markets. Ed. Justin Neville. 1 Dec. 2006. Web. 12 March 2011. <http://www.moodys.com/re-searchdocumentcontentpage.aspx?docid=PBC_100824>.
“Retail Industry Rating Methodology.” Moody’s - Credit Ratings, Research, Tools and Analysis for the Global Capital Markets. Dec. 2006. Web. 7 Feb. 2011. <http://www.moodys.com/research-documentcontentpage.aspx?docid=PBC_100824>.
Simpson, John. “Cap Rates | Appraisal Matters.” Appraisal Mat-ters-John Simpson MAI’s Opinions and Thoughts on Commer-cial Appraisal, Valuation and Real Estate in General. 4 May 2009. Web. 6 Feb. 2011. <http://www.appraisalmatters.net/?tag=cap-rates>.
“S&P | Default, Transition, and Recovery: 2009 Annual Global Cor-porate Default Study And Rating Transitions | Americas.” S&P. 17 Mar. 2010. Web. 18 Feb. 2011. <http://www.standardandpoors.com/ratings/articles/en/us/?assetID=1245207201119>.
“Taxable Fixed Income-Chartbook.” Raymond James, 25 Mar. 2011. Web. 28 Mar. 2011. <http://raymondjames.com/pdfs/tfi_chartbook.pdf>.
Tennant, Jennifer. “Average One-to-Five-Year Rating Transition Rates, 1970-2009.” Moody’s - Credit Ratings, Research, Tools and Analysis for the Global Capital Markets. 1 Nov. 2006. Web. 4 Feb. 2011. <http://www.moodys.com/researchdocumentcontent-page.aspx?docid=PBC_123501>.
Phone Interviews with: Jeremy Pino, Grandbridge Real Estate CaptialBrad Cox, Thomas D Wood & CompanyEd Isola, Isola & Associates Inc.Margaret Taylor, Analyst with Moody’sAna Lai, Analyst with S&PJerry Phelam, Analyst with S&P
FOR MORE INFORMATION
AU T H O R CHRIS CASWELL | Research Assistant
WINSTON ORZECHOWSKI | Research [email protected]. (703) 787-471411150 Sunset Hills Road | Reston, VA 20190
CALK AIN COMPANIES,
INC.
WASHINGTON, DCFLORIDAMARYLANDDELAWAREBOSTON
R E V I E W E D BY DAVID SOBELMAN | Executive Vice PresidentSTANLEY WYRICZ | Senior Managing DirectorRICHARD MURPHY | Managing DirectorMICHAEL O’MARA | Vice PresidentWINSTON ORZECHOWSKI | Research Director


![-ravichandran@uiowa.edu] CVS Health (CVS) September … · Through the above service, CVS helps clients in designing ... Improvement, and Modernization ... prescriptions at CVS Pharmacy](https://img.pdfslide.us/doc/110x75/5b5140327f8b9a056a8bdae7/-ravichandranuiowaedu-cvs-health-cvs-september-through-the-above-service.jpg)