Embed Size (px)
Citation preview
Credit Rating Analysis with Support Vector Machines and Neural Networks:
A Market Comparative Study
Zan Huang, Hsinchun Chen, Chia-jung Hsu, Andy Chen, Soushan Wu
AI SeminarArtificial Intelligence Lab
The University of Arizona
08/16/2002
AgendaAgenda
• Introduction• Credit Risk Analysis• Literature Review• Research Questions• Analytical Methods• Data Sets• Experiments Results and Analysis• Discussion and Future Directions

Introduction
• Credit Rating is valuable information– Widely used measure for the riskiness of the
companies and bonds
• Credit Rating is expensive information– Costly to obtain
• Credit Rating prediction is important– For investors: estimate riskiness of unrated
companies– For companies: monitor the companies’ credit
rating, predict the future rating.
Credit Rating Credit Rating
Credit Rating PredictionCredit Rating Prediction
• Rating agencies: subjective judgment is important, not predictable.
• Researchers: satisfactory results have been obtained using statistical and AI methods.
• Prediction Assumption– Risk evaluation expertise embedded in historical
rating data
• Beyond Prediction– Interpretation of models Market characteristics

Our StudyOur Study
• Apply a relatively new machine learning technique, Support Vector Machines, with a classic technique, Neural Networks
• Interpretation of the model– Variable contribution analysis
• Cross market analysis– United States and Taiwan market

Credit Risk Analysis
Credit RatingCredit Rating
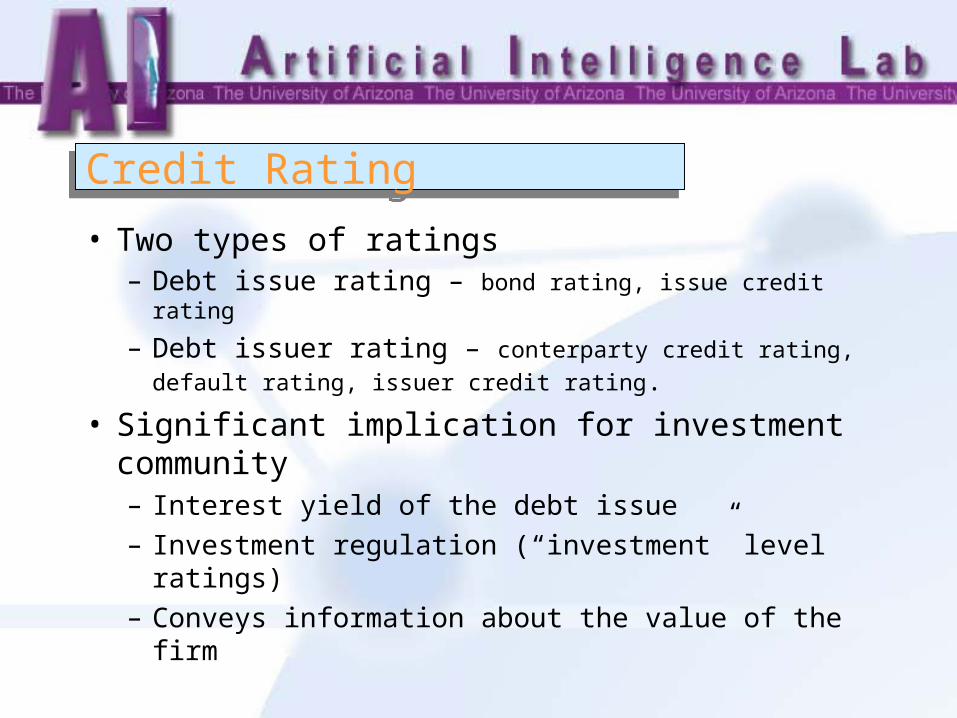
• Two types of ratings– Debt issue rating – bond rating, issue credit rating
– Debt issuer rating – conterparty credit rating, default
rating, issuer credit rating.
• Significant implication for investment community– Interest yield of the debt issue– Investment regulation (“investment” level ratings)– Conveys information about the value of the firm
Credit Rating ProcessCredit Rating Process
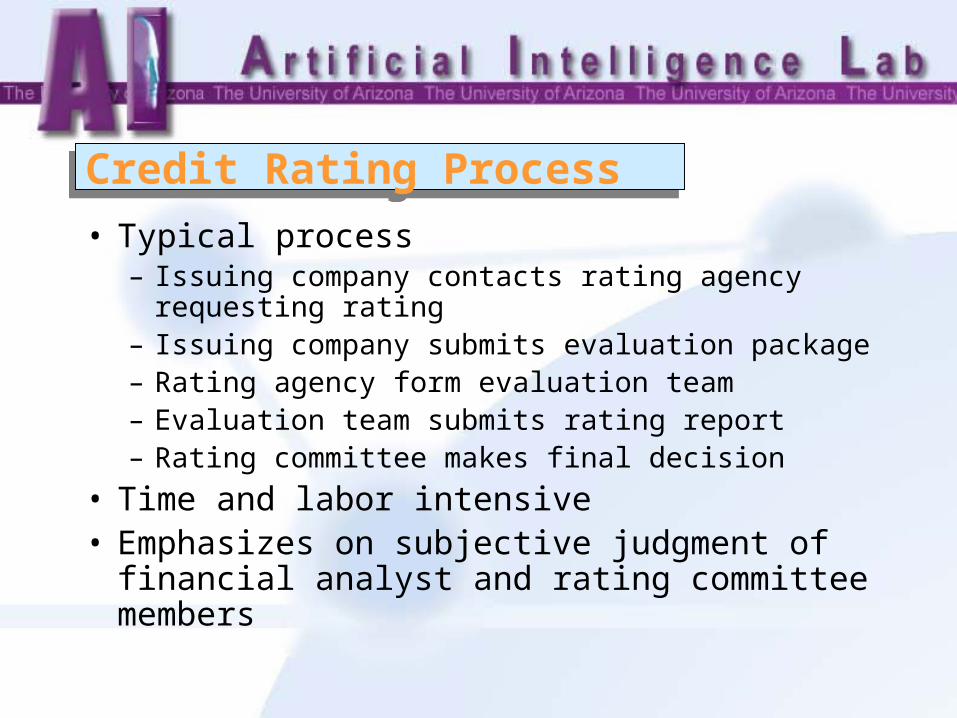
• Typical process– Issuing company contacts rating agency
requesting rating– Issuing company submits evaluation package– Rating agency form evaluation team– Evaluation team submits rating report– Rating committee makes final decision
• Time and labor intensive• Emphasizes on subjective judgment of
financial analyst and rating committee members
Literature Review:
Bond Rating Prediction
Statistical MethodsStatistical Methods
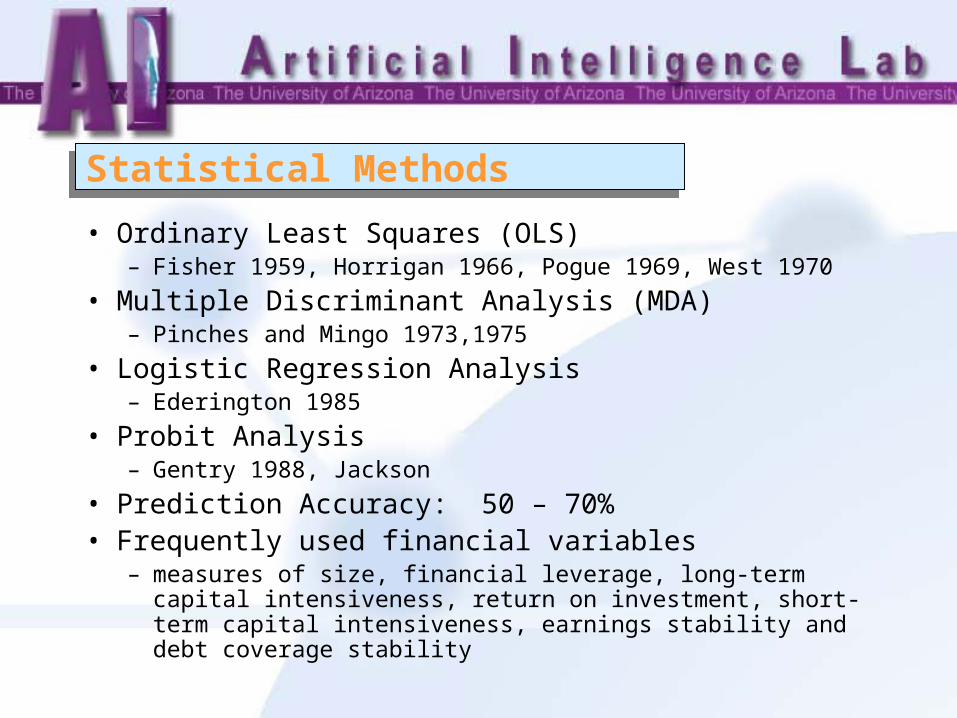
• Ordinary Least Squares (OLS)– Fisher 1959, Horrigan 1966, Pogue 1969, West 1970
• Multiple Discriminant Analysis (MDA)– Pinches and Mingo 1973,1975
• Logistic Regression Analysis– Ederington 1985
• Probit Analysis – Gentry 1988, Jackson
• Prediction Accuracy: 50 – 70%• Frequently used financial variables
– measures of size, financial leverage, long-term capital intensiveness, return on investment, short-term capital intensiveness, earnings stability and debt coverage stability
Statistical Methods (cont.)Statistical Methods (cont.)
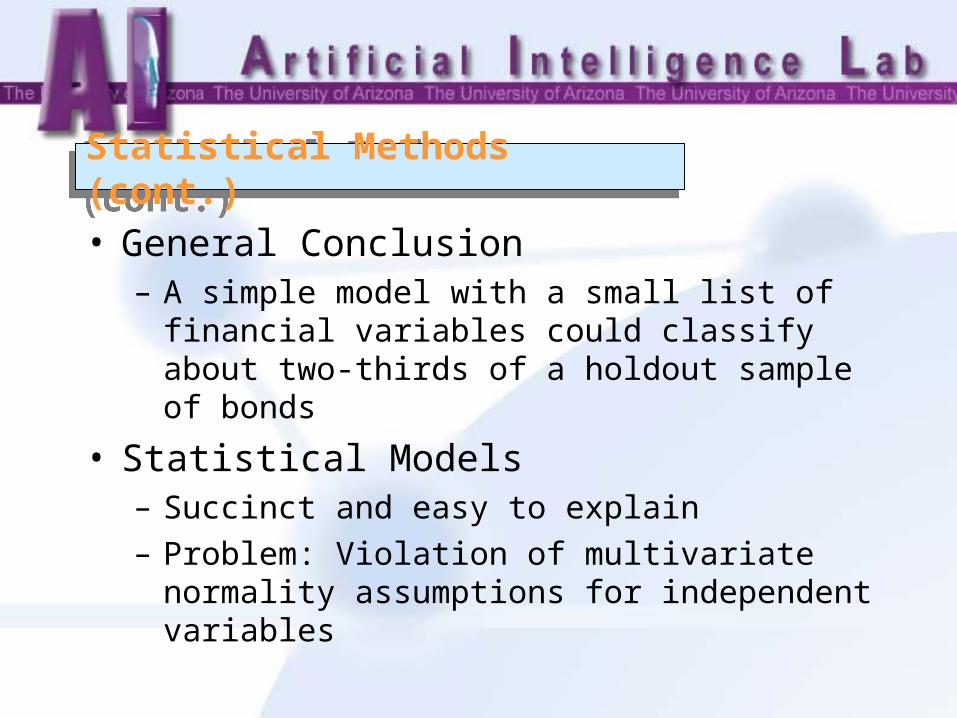
• General Conclusion– A simple model with a small list of financial
variables could classify about two-thirds of a holdout sample of bonds
• Statistical Models– Succinct and easy to explain– Problem: Violation of multivariate normality
assumptions for independent variables
Artificial Intelligence MethodsArtificial Intelligence Methods
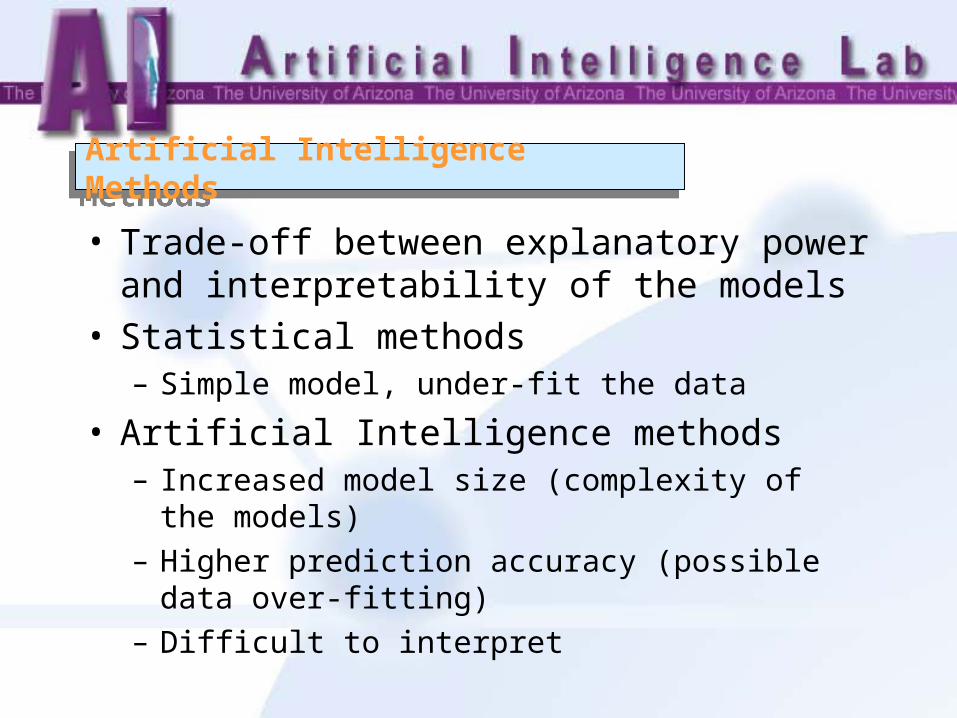
• Trade-off between explanatory power and interpretability of the models
• Statistical methods– Simple model, under-fit the data
• Artificial Intelligence methods– Increased model size (complexity of the models)– Higher prediction accuracy (possible data over-
fitting)– Difficult to interpret

Artificial Intelligence Methods (cont.)Artificial Intelligence Methods (cont.)
• Neural networks• Rule-based systems• Inductive Learning/Decision Trees• Case-based reasoning system
Artificial Intelligence Methods (cont.)Artificial Intelligence Methods (cont.)
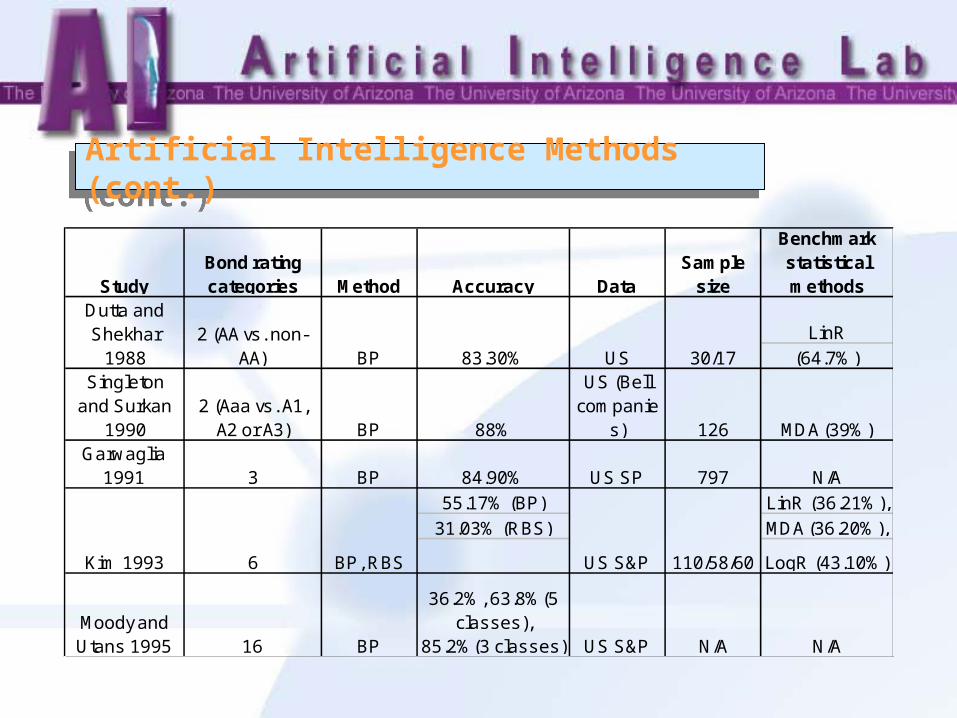
StudyBond rating categories Method Accuracy Data
Sample size
Benchmark statistical methods
LinR(64.7%)
Singleton and Surkan
19902 (Aaa vs. A1,
A2 or A3) BP 88%
US (Bell companie
s) 126 MDA (39%)Garwaglia
1991 3 BP 84.90% US SP 797 N/A55.17% (BP) LinR (36.21%),
31.03% (RBS) MDA (36.20%),
LogR (43.10%)
Moody and Utans 1995 16 BP
36.2%, 63.8%(5 classes),
85.2%(3 classes) US S&P N/A N/A
Dutta and Shekhar
19882 (AA vs. non-
AA) BP 83.30%
Kim 1993 6 BP, RBS US S&P
US 30/17
110/58/60
Artificial Intelligence Methods (cont.)Artificial Intelligence Methods (cont.)
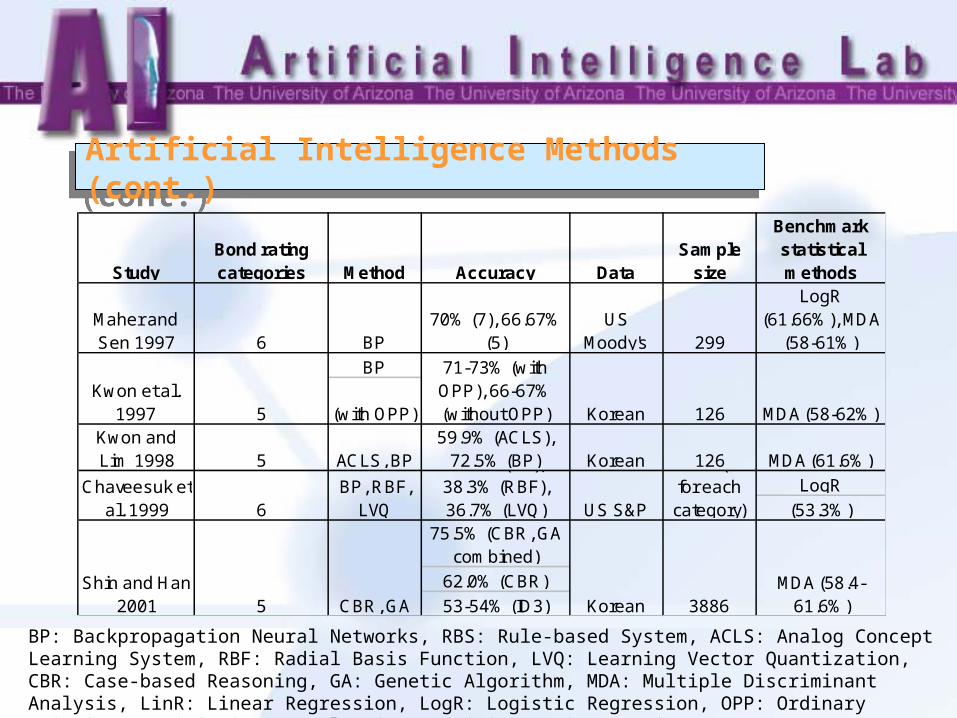
StudyBond rating categories Method Accuracy Data
Sample size
Benchmark statistical methods
Maher and Sen 1997 6 BP
70% (7), 66.67% (5)
US Moody's 299
LogR (61.66%), MDA
(58-61%)BP
(with OPP)Kwon and Lim 1998 5 ACLS, BP
59.9% (ACLS), 72.5% (BP) Korean 126 MDA (61.6%)
LogR(53.3%)
75.5% (CBR, GA combined)
62.0% (CBR)53-54% (ID3)
71-73% (with OPP), 66-67% (without OPP) Korean 126 MDA (58-62%)
Chaveesuk et al. 1999 6
BP, RBF, LVQ
56.7% (BP), 38.3% (RBF), 36.7% (LVQ) US S&P
60/60 (10 for each category)
Kwon et al. 1997 5
3886MDA (58.4-
61.6%)Shin and Han
2001 5 CBR, GA Korean
BP: Backpropagation Neural Networks, RBS: Rule-based System, ACLS: Analog Concept Learning System, RBF: Radial Basis Function, LVQ: Learning Vector Quantization, CBR: Case-based Reasoning, GA: Genetic Algorithm, MDA: Multiple Discriminant Analysis, LinR: Linear Regression, LogR: Logistic Regression, OPP: Ordinary Pairwise Partitioning. Sample size: Training/tuning/testing.
Artificial Intelligence Methods (cont.)Artificial Intelligence Methods (cont.)
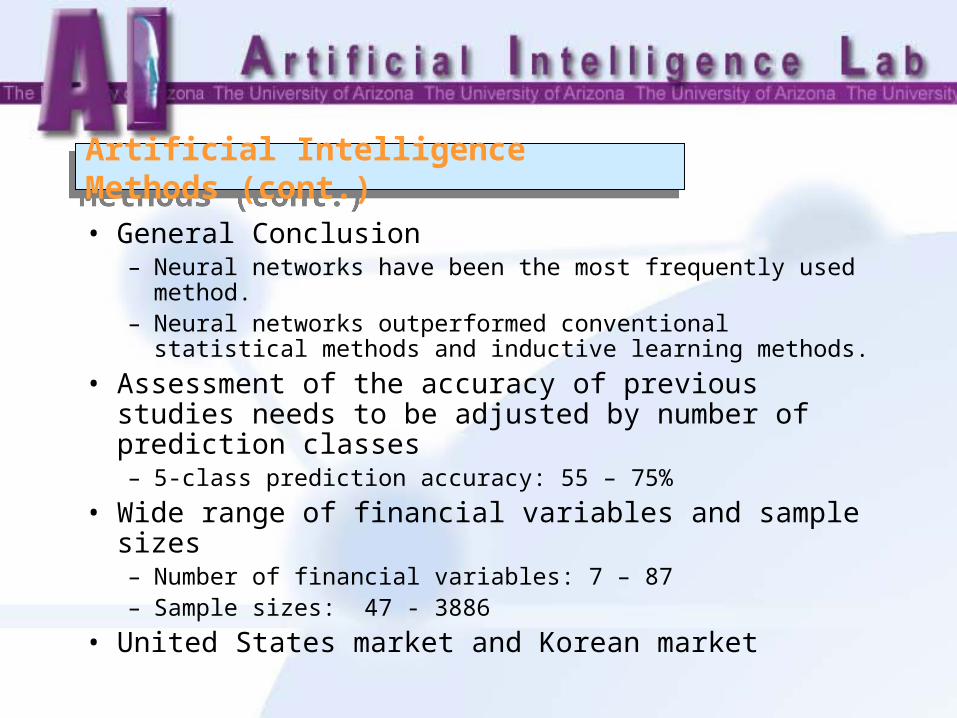
• General Conclusion– Neural networks have been the most frequently used
method.– Neural networks outperformed conventional statistical
methods and inductive learning methods.
• Assessment of the accuracy of previous studies needs to be adjusted by number of prediction classes– 5-class prediction accuracy: 55 – 75%
• Wide range of financial variables and sample sizes– Number of financial variables: 7 – 87– Sample sizes: 47 - 3886
• United States market and Korean market

Research Questions
Research QuestionsResearch Questions
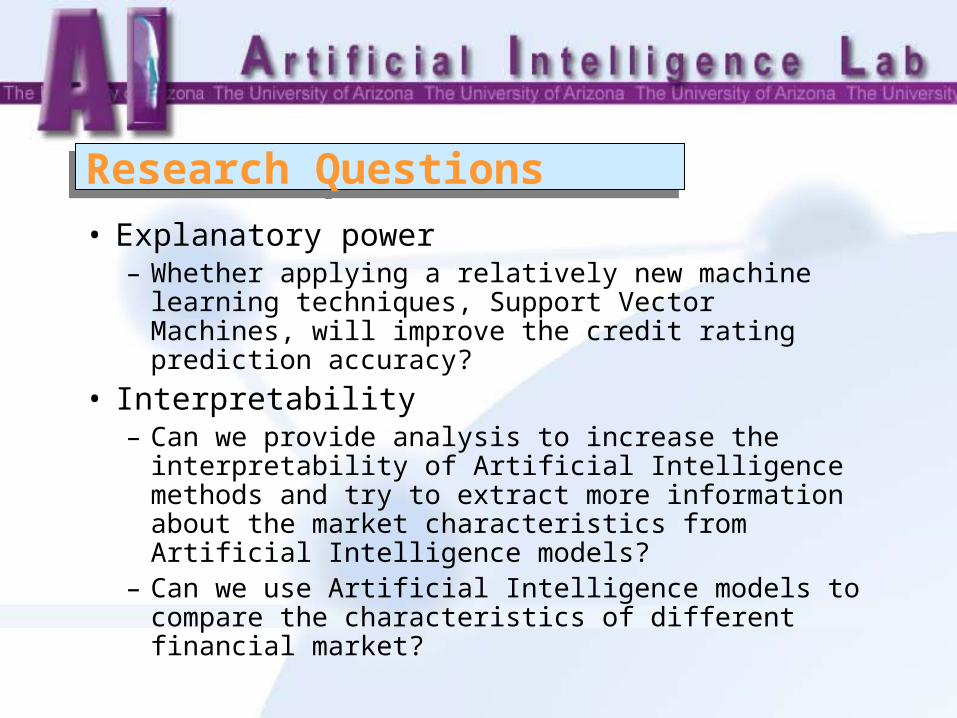
• Explanatory power– Whether applying a relatively new machine learning
techniques, Support Vector Machines, will improve the credit rating prediction accuracy?
• Interpretability– Can we provide analysis to increase the
interpretability of Artificial Intelligence methods and try to extract more information about the market characteristics from Artificial Intelligence models?
– Can we use Artificial Intelligence models to compare the characteristics of different financial market?

Analytical Methods
Backpropagation Neural NetworkBackpropagation Neural Network
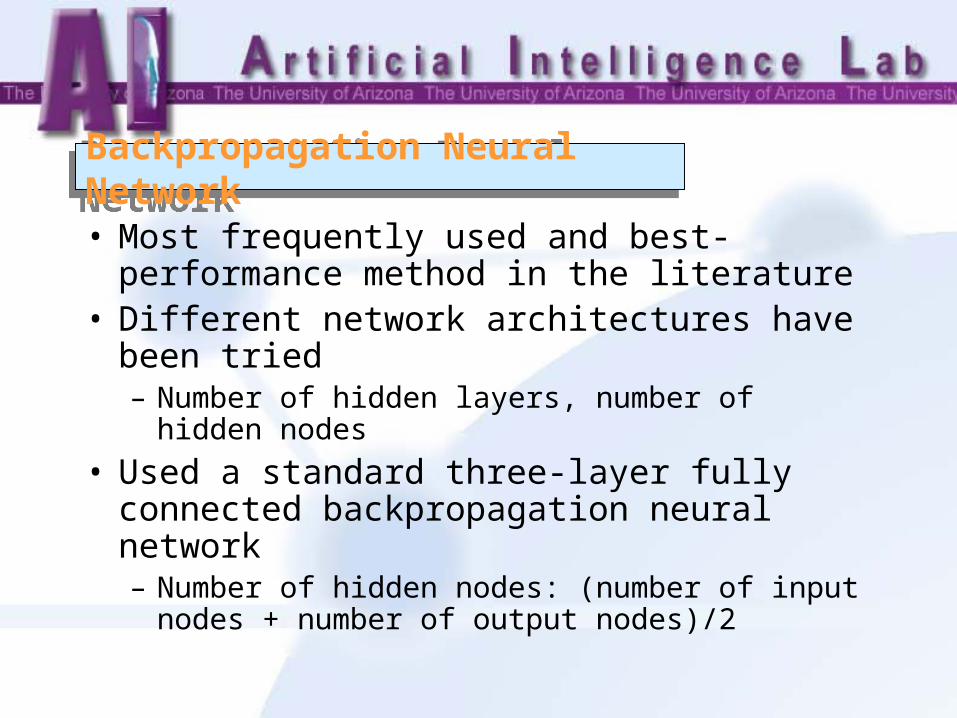
• Most frequently used and best-performance method in the literature
• Different network architectures have been tried– Number of hidden layers, number of hidden nodes
• Used a standard three-layer fully connected backpropagation neural network – Number of hidden nodes: (number of input nodes +
number of output nodes)/2

Support Vector MachinesSupport Vector Machines
• Introduced by Vapnik in 1995• Based on Structural Risk Minimization
principle from computational learning theory• SVM is positioned at the intersection of
learning theory and practice– “it contains a large class of neural nets, radial basis
function (RBF) nets, and polynomial classifiers as special cases. Yet it is simple enough to be analyzed mathematically, because it can be shown to correspond to a linear method in a high-dimensional feature space nonlinearly related to input space.” – Hearst 1998

Support Vector Machines (cont.)Support Vector Machines (cont.)
• A good candidate for combining the strengths of more theory-driven statistical methods and more data-driven machine learning methods
• Empirical evidence– Excellent generalization performance in a wide
range of problems (Bioinformatics, text categorization, image detection, etc.)
• Has not been applied to the credit rating prediction problem
• Multi-class SVM– Hsu and Lin 2002, BSVM package

Data Sets
Taiwan Data SetTaiwan Data Set
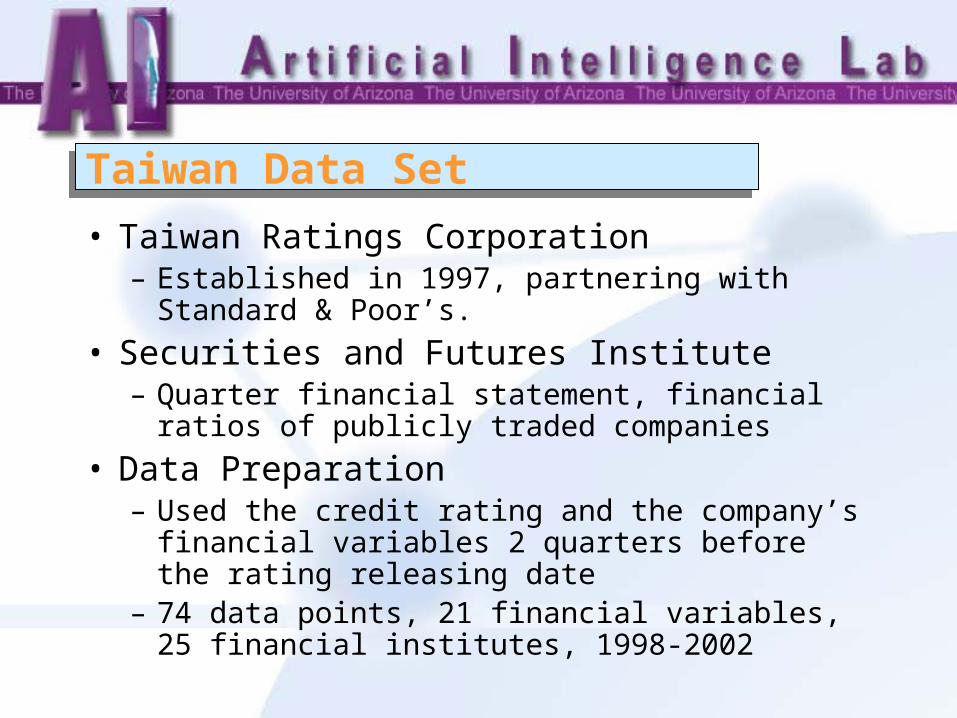
• Taiwan Ratings Corporation – Established in 1997, partnering with Standard &
Poor’s.
• Securities and Futures Institute – Quarter financial statement, financial ratios of
publicly traded companies
• Data Preparation– Used the credit rating and the company’s financial
variables 2 quarters before the rating releasing date– 74 data points, 21 financial variables, 25 financial
institutes, 1998-2002
United States Data SetUnited States Data Set
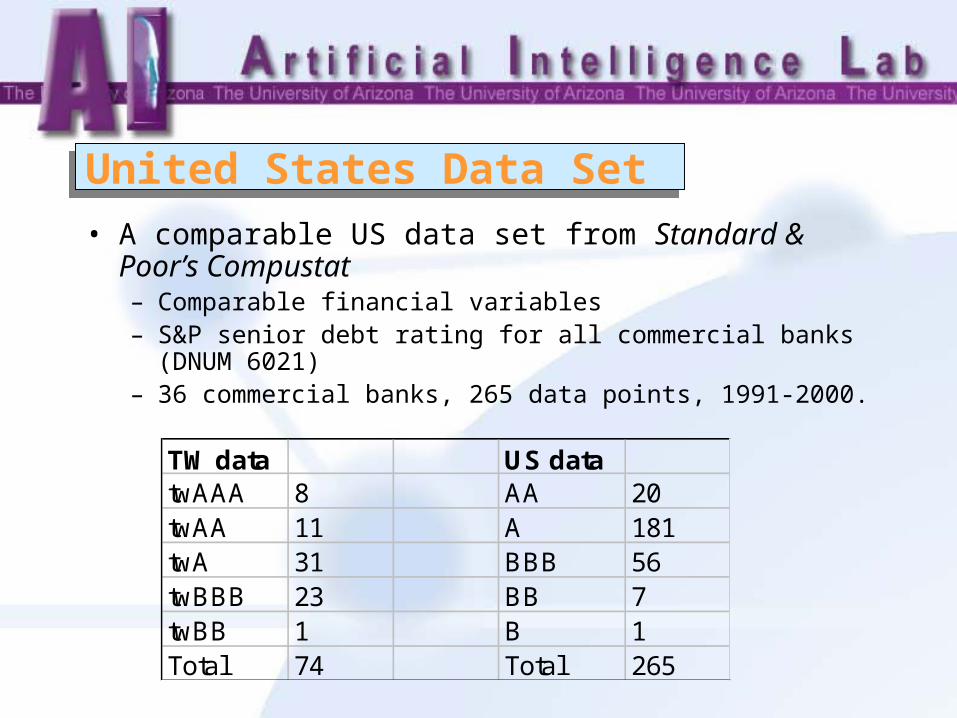
• A comparable US data set from Standard & Poor’s Compustat – Comparable financial variables– S&P senior debt rating for all commercial banks (DNUM
6021)– 36 commercial banks, 265 data points, 1991-2000.
TW data US datatwAAA 8 AA 20twAA 11 A 181twA 31 BBB 56twBBB 23 BB 7twBB 1 B 1Total 74 Total 265
Variable SelectionVariable Selection
• ANOVA test– Whether the differences of each financial variable
among different rating classes were significant.– 5 uninformative variables removed from the data
set
• Final data sets– Taiwan: 14 financial ratios and 2 balance
measures– United States: 12 financial ratios and 2 balance
measures
Financial VariablesFinancial Variables
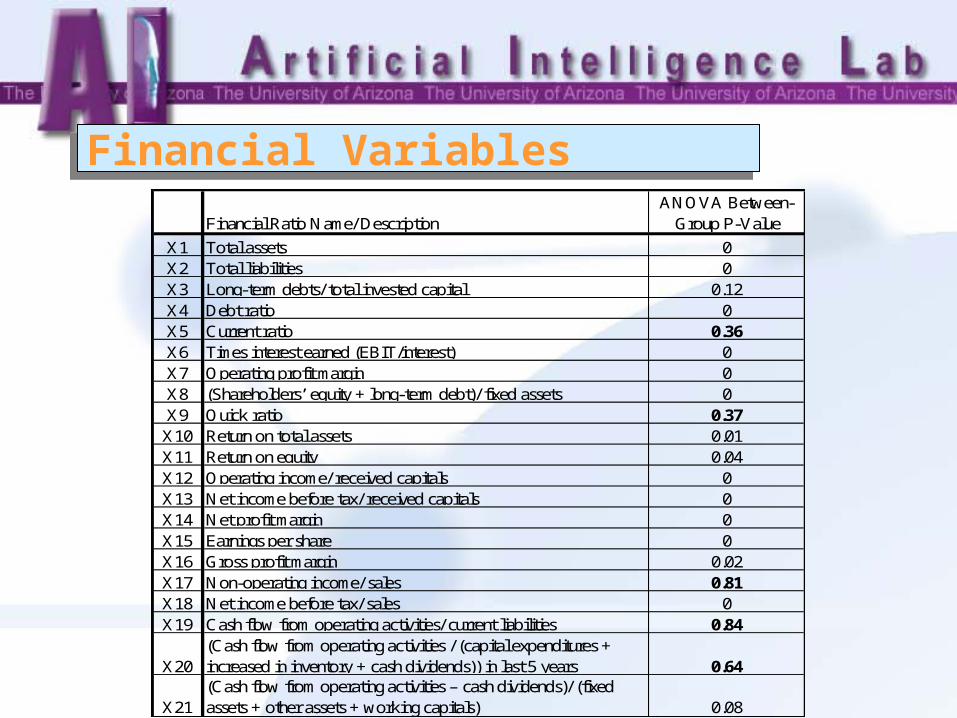
Financial Ratio Name/ DescriptionANOVA Between-
Group P-Value
X1 Total assets 0X2 Total liabilities 0X3 Long-term debts/ total invested capital 0.12X4 Debt ratio 0X5 Current ratio 0.36X6 Times interest earned (EBIT/interest) 0X7 Operating profit margin 0X8 (Shareholders’ equity + long-term debt)/ fixed assets 0X9 Quick ratio 0.37
X10 Return on total assets 0.01X11 Return on equity 0.04X12 Operating income/ received capitals 0X13 Net income before tax/ received capitals 0X14 Net profit margin 0X15 Earnings per share 0X16 Gross profit margin 0.02X17 Non-operating income/ sales 0.81X18 Net income before tax/ sales 0X19 Cash flow from operating activities/ current liabilities 0.84
X20(Cash flow from operating activities / (capital expenditures + increased in inventory + cash dividends)) in last 5 years 0.64
X21(Cash flow from operating activities – cash dividends)/ (fixed assets + other assets + working capitals) 0.08

Experiment Results and Analysis
Experiment ResultsExperiment Results
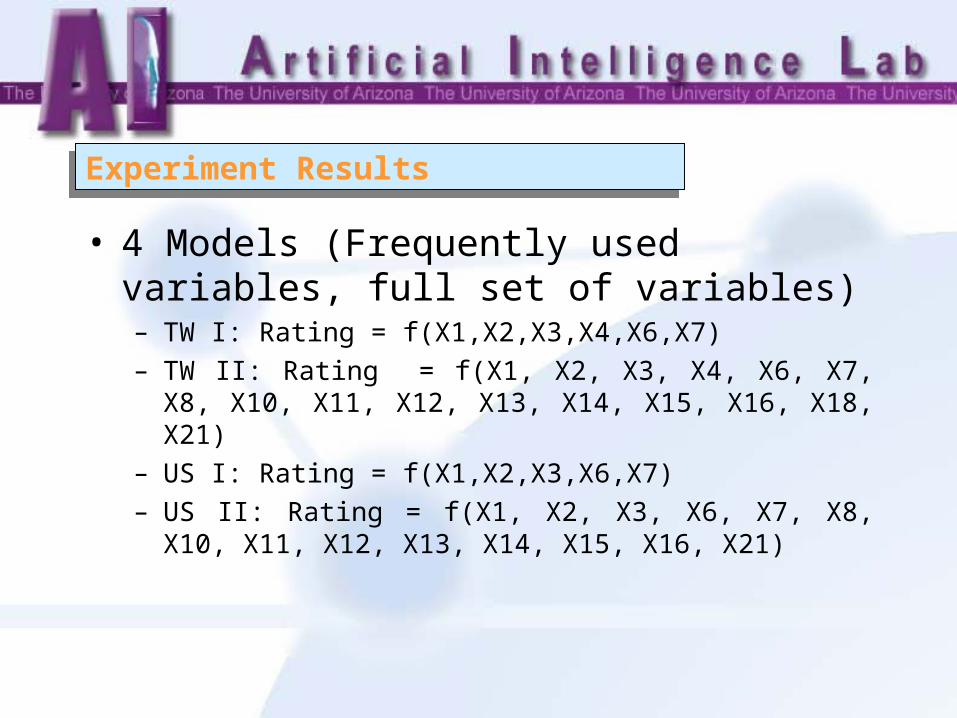
• 4 Models (Frequently used variables, full set of variables)– TW I: Rating = f(X1,X2,X3,X4,X6,X7)– TW II: Rating = f(X1, X2, X3, X4, X6, X7, X8, X10, X11,
X12, X13, X14, X15, X16, X18, X21)– US I: Rating = f(X1,X2,X3,X6,X7) – US II: Rating = f(X1, X2, X3, X6, X7, X8, X10, X11, X12,
X13, X14, X15, X16, X21)
Experiment Results (cont.)Experiment Results (cont.)
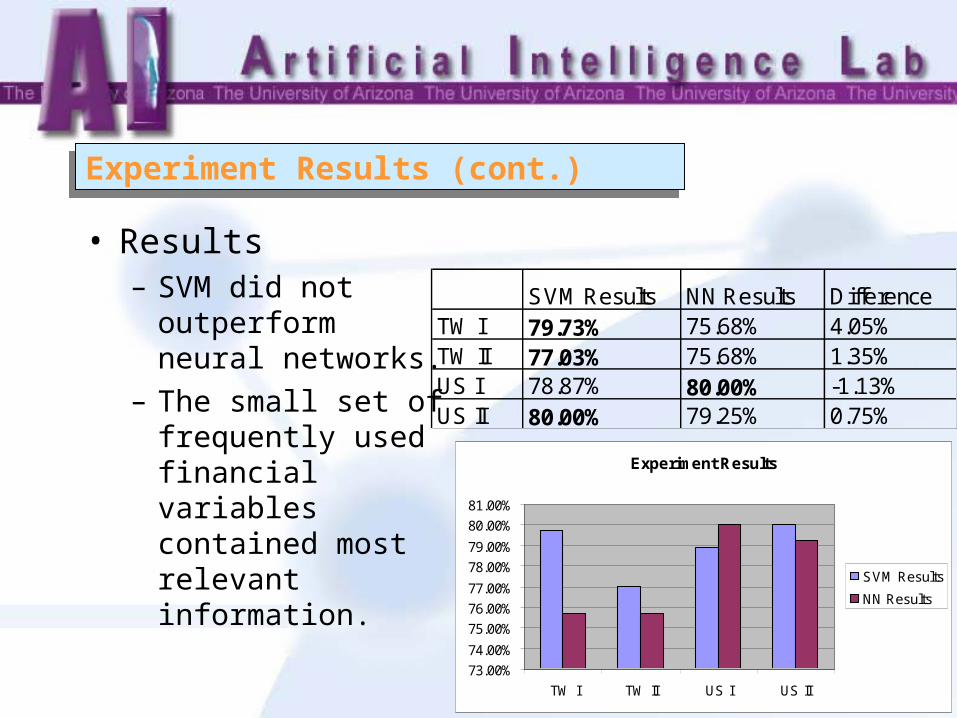
• Results– SVM did not
outperform neural networks.
– The small set of frequently used financial variables contained most relevant information.
SVM Results NN Results DifferenceTW I 79.73% 75.68% 4.05%TW II 77.03% 75.68% 1.35%US I 78.87% 80.00% -1.13%US II 80.00% 79.25% 0.75%
Experiment Results
73.00%
74.00%
75.00%
76.00%
77.00%
78.00%
79.00%
80.00%
81.00%
TW I TW II US I US II
SVM Results
NN Results
Within-1-class accuracy Within-1-class accuracy
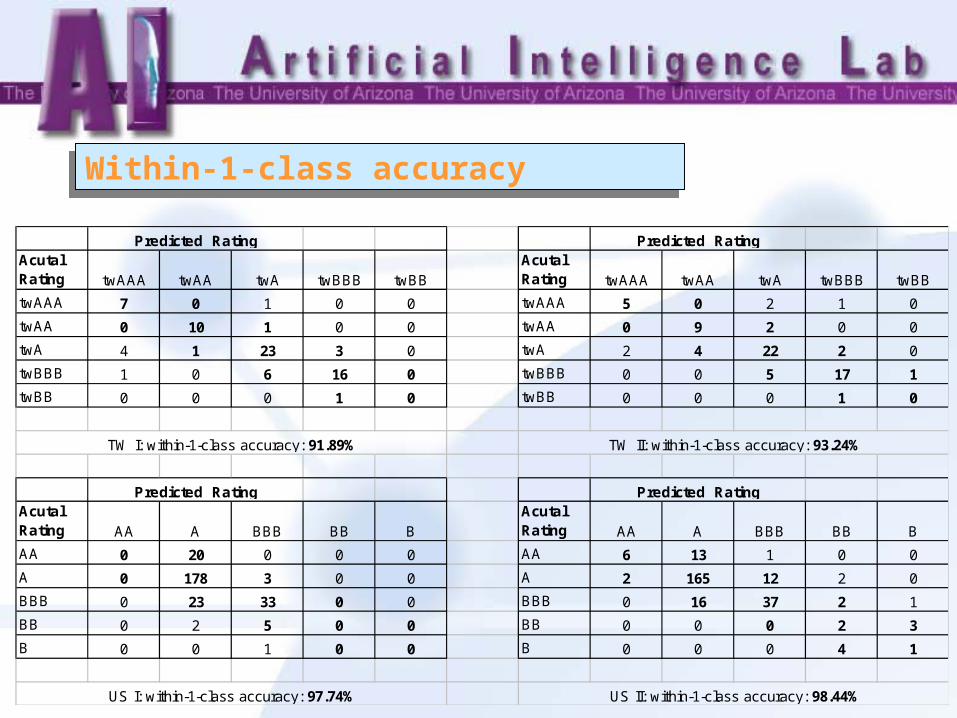
Acutal Rating twAAA twAA twA twBBB twBB
Acutal Rating twAAA twAA twA twBBB twBB
twAAA 7 0 1 0 0 twAAA 5 0 2 1 0
twAA 0 10 1 0 0 twAA 0 9 2 0 0
twA 4 1 23 3 0 twA 2 4 22 2 0
twBBB 1 0 6 16 0 twBBB 0 0 5 17 1
twBB 0 0 0 1 0 twBB 0 0 0 1 0
Acutal Rating AA A BBB BB B
Acutal Rating AA A BBB BB B
AA 0 20 0 0 0 AA 6 13 1 0 0
A 0 178 3 0 0 A 2 165 12 2 0
BBB 0 23 33 0 0 BBB 0 16 37 2 1
BB 0 2 5 0 0 BB 0 0 0 2 3
B 0 0 1 0 0 B 0 0 0 4 1
Predicted Rating Predicted Rating
TW I: within-1-class accuracy: 91.89% TW II: within-1-class accuracy: 93.24%
Predicted Rating Predicted Rating
US I: within-1-class accuracy: 97.74% US II: within-1-class accuracy: 98.44%
Variable Contribution AnalysisVariable Contribution Analysis
• Research of credit rating prediction using Artificial Intelligence methods has been solely focused on prediction accuracy.
• Low level understanding of the market– Credit rating analyst rate companies (consciously
or unconsciously) based on a specific set of financial variables
• Higher level understanding– What are the relative importance of individual
financial variables in the process of credit rating? - Variable Contribution Analysis
Variable Contribution Analysis (cont.)Variable Contribution Analysis (cont.)
• Difficult for both Neural Networks and Support Vector Machines
• Substantial literature in interpreting neural network models– Mainly extracts information from the connection strengths
(inter-layer weights) of neural network model– Measures of relative importance – Garson 1991, Yoon 1994
– Symbolic rules derived from connection weights – Taha 1999
– Optimal neural network structure construction and better understanding of the models - Engelbrecht 1998
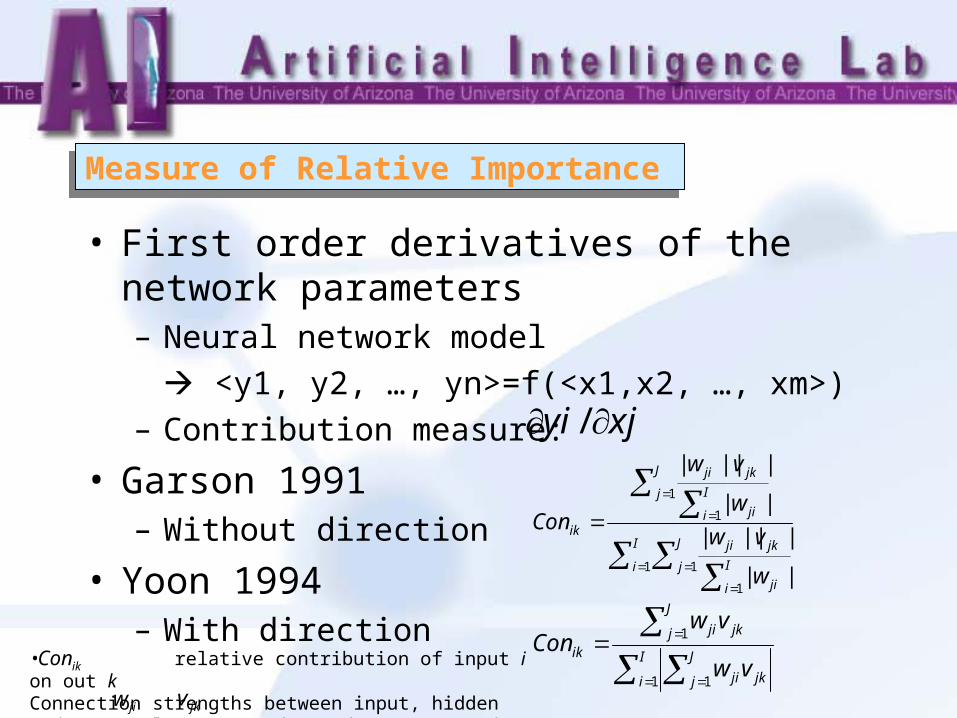
Measure of Relative ImportanceMeasure of Relative Importance
• First order derivatives of the network parameters– Neural network model
<y1, y2, …, yn>=f(<x1,x2, …, xm>)– Contribution measure:
• Garson 1991– Without direction
• Yoon 1994– With direction
xjyi /
I
i
J
j I
i ji
jkji
J
j I
i ji
jkji
ik
w
vw
w
vw
Con
1 1
1
1
1
||
||||
||
||||
I
i
J
j jkji
J
j jkji
ik
vw
vwCon
1 1
1
• relative contribution of input i on out k Connection strengths between input, hidden and output layers are denoted as and .jiw jkv
ikCon
Variable Contribution AnalysisVariable Contribution Analysis
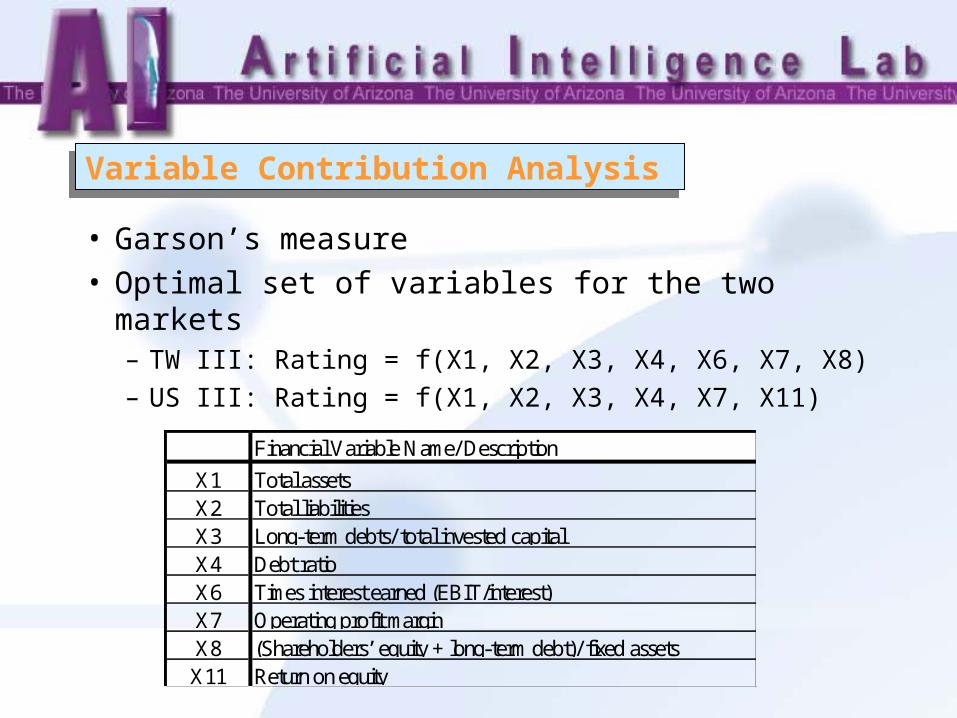
• Garson’s measure• Optimal set of variables for the two markets
– TW III: Rating = f(X1, X2, X3, X4, X6, X7, X8) – US III: Rating = f(X1, X2, X3, X4, X7, X11)
Financial Variable Name/ Description
X1 Total assetsX2 Total liabilitiesX3 Long-term debts/ total invested capitalX4 Debt ratioX6 Times interest earned (EBIT/interest)X7 Operating profit marginX8 (Shareholders’ equity + long-term debt)/ fixed assetsX11 Return on equity
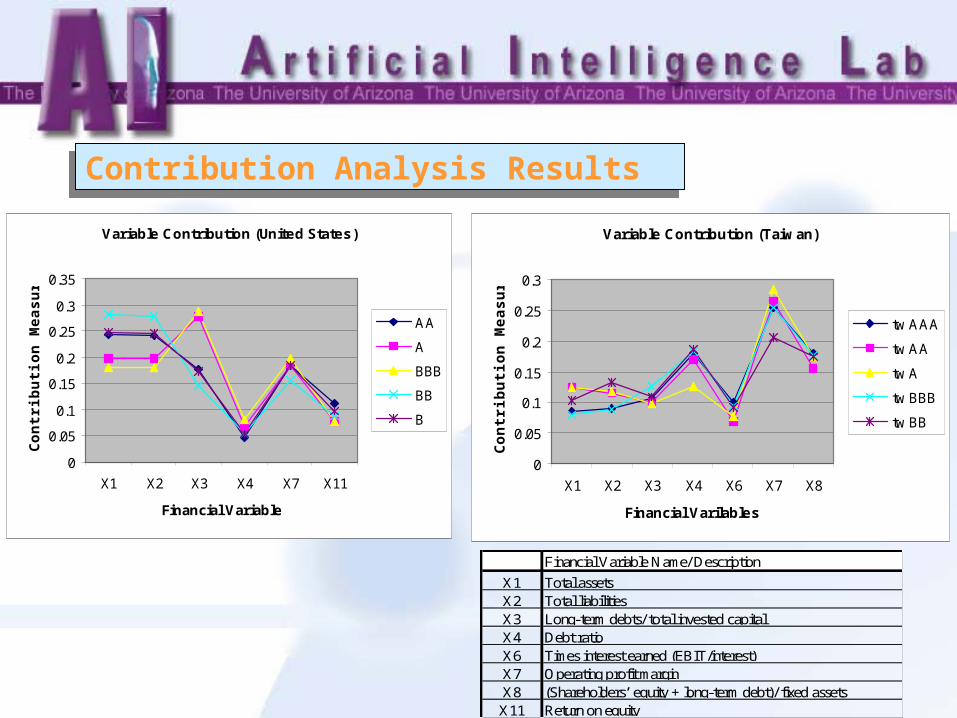
Contribution Analysis ResultsContribution Analysis Results
Variable Contribution (United States)
0
0.05
0.1
0.15
0.2
0.25
0.3
0.35
X1 X2 X3 X4 X7 X11
Financial Variable
Co
ntr
ibu
tio
n M
easu
re AA
A
BBB
BB
B
Variable Contribution (Taiwan)
0
0.05
0.1
0.15
0.2
0.25
0.3
X1 X2 X3 X4 X6 X7 X8
Financial VarilablesC
on
trib
uti
on
Mea
sure
tw AAA
tw AA
tw A
tw BBB
tw BB
Financial Variable Name/ Description
X1 Total assetsX2 Total liabilitiesX3 Long-term debts/ total invested capitalX4 Debt ratioX6 Times interest earned (EBIT/interest)X7 Operating profit marginX8 (Shareholders’ equity + long-term debt)/ fixed assetsX11 Return on equity
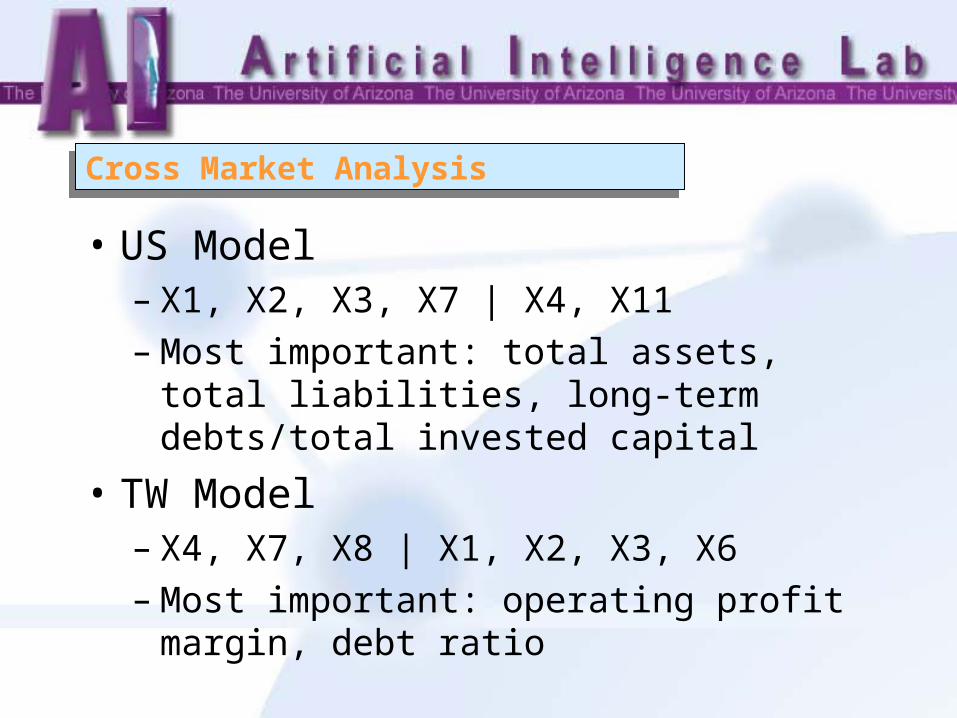
Cross Market AnalysisCross Market Analysis
• US Model– X1, X2, X3, X7 | X4, X11– Most important: total assets, total liabilities,
long-term debts/total invested capital
• TW Model– X4, X7, X8 | X1, X2, X3, X6 – Most important: operating profit margin, debt
ratio

Discussion and Future Directions
DiscussionDiscussion
• We need expertise from credit rating industry to evaluate and interpret the results– Some positive response: “Size is not (that)
important in Taiwan.” – Dr. Soushan Wu
• The reason for the prediction accuracy improvement over previous studies
• The reason for SVM’s failure to improve

Future DirectionsFuture Directions
• Data mining + text mining– Add important financial variables from the
text format annual report
• Larger scale cross market analysis– Mainland China, Taiwan, Hong Kong and
United States markets
• Multidimensional financial data visualization and exploration