Embed Size (px)
Citation preview
Evaluating the Effectiveness of Credit Counseling
Phase One: The Impact of Delivery Channels for
Credit Counseling Services
(May 31, 2006)
by
Michael E. Staten Distinguished Professor
Director: Credit Research Center McDonough School of Business
Georgetown University 3240 Prospect St., NW Suite 300
Washington, D.C. 20007 E-mail: [email protected]
John M. Barron Loeb Professor of Economics
Department of Economics Krannert School of Management
Purdue University 1310 Krannert Building
West Lafayette, IN 47907 E-mail: [email protected]
1
Evaluating the Impact of Delivery Channels for Credit Counseling Services
Phase I
Executive Summary
Objective Phase 1 of the study developed several objective measures of counseling effectiveness and used them to determine whether effectiveness is influenced by delivery method (in-person counseling vs. telephone counseling). The Sample Ten credit counseling agencies were selected to participate in the study through a competitive grant proposal process. Several agencies provided counseling only over the phone, while others focused on face-to-face counseling sessions, and still others offered a combination of delivery channels. What they all have in common is an emphasis on client education and identification of the cause of underlying financial problems. Participating agencies contributed data on over 70,000 clients who received an initial counseling session during March-April, 2003. Three years of credit report data (credit report attributes and credit scores in March 2002, March 2003 and March 2005) were appended to the client data in the initial sample by the national credit reporting agency Trans Union. All personally identifiable information was removed from client records before the data files were delivered to the research team. After dropping cases for which a match was not possible for all three years, the resulting analysis sample contained detailed credit report data and information from the initial counseling interview for 59,972 clients. For this particular pooled sample, the most common form of the delivery channel is the telephone (67.7% of clients) followed by in-person delivery (22.6%) and Internet delivery (9.7%). Note that these proportions reflect the flow of business in early 2003 and may well be different at these same agencies today. Because Internet counseling was not consistently defined across agencies in 2003, the Phase 1 analysis focused only on telephone and in-person clients. Data provided by the agencies for clients in the sample reflect information gathered during the first “counseling interview” with the client. All of the agencies in our sample did a first interview lasting anywhere from 30 minutes to 75 minutes. The interview collected detailed budget and asset information and identified potential causes of the clients’ financial problems. Options were discussed and the counselor made a recommendation to the client. The counselor's recommendation and a written action plan were part of the product delivered to the consumer. Options for many clients included a recommendation to enroll in an agency-administered debt repayment program called a Debt Management Plan (DMP). Consumers recommended for a DMP could choose not to enroll, but the DMP recommendation is a signal that the counselor thought the client was qualified.
2
Agencies provided data on the counselor’s recommended action step for each client, as well as information on Debt Management Plans (DMPs) for those who started a plan. In this pooled sample, 62.1% of clients were recommended for a DMP, although that percentage varied widely across agencies from a minimum of 16.9% to a maximum of 77.1%. However, the proportion of clients who actually started a DMP was substantially smaller (29.8% overall), as was the range across agencies (16.9% to 39.1%). Characteristics of Consumers at the Time of Counseling
• The decision to seek counseling is an important signal of subsequent credit problems. Credit bureau information available at the time of counseling does not yet reflect private information that many counseled clients possess regarding recent changes in their financial condition. Consequently, the act of seeking counseling is a valuable “early warning” indicator that facilitates early intervention.
o Counseled borrowers are much more likely to declare bankruptcy during the two
years following counseling, relative to consumers in a nationally representative sample (17.6% vs. 1.2%), and are much more likely to have a serious public derogatory record item added to their credit report: 23.4% vs. 2.6% (Table 17).
o A counseled borrower’s likelihood of having bankruptcy and negative public
record items being added to their credit files during the two years after counseling is higher even after controlling for initial (2003) levels of a dozen credit bureau characteristics that are predictive of risk, including bankruptcy risk scores (Table 19).
• The credit profile of borrowers who choose face-to-face counseling is different from
borrowers who use telephone counseling. It appears that consumers may be self-selecting into delivery channels based in part on their perception of the severity of their financial problems.
o Consumers counseled in-person generally have a higher risk of future payment
problems, as indicated by lower initial risk scores. They also have more accounts with positive balances, larger mortgage balances, fewer bank card accounts and less unsecured debt (Table 21).
Impact of Delivery Channel on Credit Experience after Counseling
• Controlling for credit bureau information, counselor experience, and the information collected by the counselor during the counseling session (as reflected in the counselor's perception of the client’s primary cause of financial difficulty and the counselor’s recommended plan of action) the delivery channel for the initial counseling session appears to have little impact on two indicators of the client’s creditworthiness measured two years after the initial counseling.
3
o Measured two years after counseling, there is no statistically significant difference between either the bankruptcy risk score or new account delinquency risk score of telephone and face-to-face clients (Table 27).
o Face-to-face clients tend to be more likely to file for bankruptcy in the
subsequent two years (Table 27).
o The counselor’s recommendation conveys information about the client’s future credit performance that is not otherwise observable through the credit report variables. Information obtained during the counseling interview regarding the primary cause of the client’s financial difficulty is also predictive, especially when controlling for the full set of variables in the model (Table 27).
o These results are robust across the entire sample, as well as subsets of clients
from agencies that offer clients a choice between telephone and face-to-face counseling.
• Examination of two additional outcome measures – total non-mortgage dollar balances
and the total number of accounts that were 30 days or more delinquent during the prior 18 months – revealed mixed findings with respect to whether delivery channel is associated with differences in post-counseling experience.
o Total non-mortgage balances of clients measured two years after counseling do
not seem to be affected by the counseling delivery channel (Table 26).
o Consumers who experience face-to-face counseling have a reduced number of delinquencies, as measured two years after the initial counseling (Table 26).
Relationship of DMP to Credit Experience after Counseling
• Consumers who were recommended for a DMP and chose to start payments had a significantly lower incidence of bankruptcy over the two years following counseling, and had higher bankruptcy and delinquency risk scores (signaling lower payment risk) at the end of the two-year period, holding other factors constant (Table 27).
o Clients who were recommended for a DMP but chose not to start did not
experience improved bankruptcy and delinquency scores. o Clients who were not recommended for a DMP but ended up starting one
anyway (possibly because they addressed other problems in order to qualify for a DMP) experienced improved delinquency risk scores two years later, relative to DMP non-starters, but no change in bankruptcy risk scores.
• Further analysis indicates no significant difference in the positive effect of an
engagement in a DMP across delivery channels. DMP clients in both the telephone and in-person delivery groups experienced improvement in risk scores (Table 28).
4
Caveats Several caveats to these findings should be noted. First and foremost, because the sample of participating agencies was not selected to be representative of industry-wide practices, the results cannot be considered representative of the typical experience of counseled consumers nationwide. Instead, they reflect what is obtainable from a group of agencies that emphasize client education and identification of the underlying cause of financial problems. The fact that telephone and face-to-face delivery of counseling services appear to generate equivalent outcomes for consumers in this sample suggests that, when done well, the two delivery channels can be equally effective. We have presented results on four separate indicators of post-counseling outcomes for consumers, measured two years after the initial counseling visit. Two of these indicators (a commercially available bankruptcy risk score product; a commercially available new account delinquency risk score product) represent general measures of creditworthiness. Two indicators (total non-mortgage balances; number of accounts delinquent) reflect specific margins of credit usage. In addition, we also provide results on the incidence of bankruptcy during the two years following counseling. While these indicators examine the consumer’s credit experience from a variety of angles, other measures of the impact of the counseling experience would help to provide a more comprehensive picture. In particular, survey evidence on consumer attitudes, knowledge gained, and perceived financial stress, pre and post-counseling, would augment the objective measures of consumer credit performance and provide a more complete picture of counseling’s impact. It would also be helpful to extend the post-counseling observation period for the sample to see if differences emerge in the credit bureau data for telephone and face-to-face clients. For those clients for whom counseling does change their borrowing and payment behavior, two years may not be enough time for the change to be fully reflected in their credit reports and credit scores, especially if prior financial distress was severe and its impact was not yet reflected in the credit report at the time of counseling. There is some evidence that consumers’ choice of delivery channel is associated with their credit usage patterns and resulting risk profile prior to counseling. The analysis in this report accounted for these differences to the extent allowed by the available data. However, a more detail assessment of borrowers at the time of the initial counseling, either during the interview itself or through supplemental survey work, would allow for more precise controls for this self-selection. Controlling for self-selection would help determine if the equivalence in outcomes across the telephone and face-to-face delivery channels indicated equal effectiveness or was an artifact of initial client characteristics. The results on the role of Debt Management Plans are particularly intriguing, but self-selection may be partly responsible. Clients who start DMPs outperform all other counseling clients on all of our outcome measures. Admittedly, clients who were recommended for DMPs are in better financial shape than clients who do not qualify. But, the evidence also indicates that between two borrowers who are recommended for a DMP (i.e., borrowers for whom a DMP is both a

5
workable option and the best option), the borrower who actually starts payments in a DMP fares significantly better on all outcome measures at a point two years after counseling. Perhaps there is some residual self-selection effect driving this result (e.g., borrowers who make a commitment to start a DMP are more motivated to repay than borrowers that do not). Alternatively, perhaps the DMP experience itself (e.g., budgeting to make regular DMP payments; continued interaction with and reinforcement from the counseling agency) generates the improvement in the outcome indicators. Given the significantly improved credit profiles for clients who do start DMPs, this phenomenon deserves closer study.
1
Evaluating the Impact of Delivery Channels for Credit Counseling Services
by
Michael Staten and John Barron
Introduction In 2004 ten credit counseling agencies were selected through a competitive proposal process to participate in an empirical study of the effect of credit counseling on long-term borrower behavior. This multi-year project is jointly sponsored by the Consumer Federation of America and American Express with the objective of identifying best practices in the counseling industry and quantifying their impact on consumers. The study will examine the effectiveness of face-to-face, telephone and Internet counseling across all types of consumer clients, including those who subsequently enroll in a DMP and those who receive financial counseling only or recommendations for legal and other assistance. Within each of the three major categories of counseling delivery channels, the study will consider how different approaches to the timing, duration and content of counseling influence client outcomes. Effectiveness of counseling will be gauged by using credit bureau data to examine the credit profile of counseled clients at the time of the initial counseling session and subsequently at points two or more years following counseling. The study has been divided into two phases. Phase 1 focuses on an examination of the outcomes of prior counseling activities. The advantage of this retrospective analysis is that we need not wait several years to identify counseling outcomes. A disadvantage is that archived data on individuals who received counseling in the past may not be sufficiently rich to clearly identify the effects of counseling, as opposed to other client characteristics that may also influence subsequent client behavior. A planned Phase 2 will modify the sample design to collect even more detailed information on incoming counseling clients and the treatment they receive, and follow these individuals over time. For Phase 1 of the project, participating agencies supplied detailed data from the counseling “intake” interview on more than 70,000 clients who were counseled during early 2003. The following report presents some of the key findings of the Phase 1 analysis in terms of client credit profiles and payment experience over the two year period following the initial counseling. The findings suggest several issues that should be considered when designing Phase 2 of the study. The report is organized as follows. Section I contains several tables that describe the data received from the ten counseling agencies and the composition of the pooled sample of clients
2
(e.g. distribution of clients across delivery channel, cause of financial problems, and counselor recommendation). Section II presents summary measures of the credit bureau profile of counseled clients in the sample, and how they compare (around the time of initial counseling) with a separate, nationally representative sample of all consumers with credit reports. By pooling the sample of counseled consumers with the nationally representative sample, we examine how differences across individuals in key credit bureau variables (especially risk scores) can be used to predict which consumers will seek counseling services. Section III utilizes the credit bureau data to compare the counseled group vs. the national sample in terms of the incidence of bankruptcy and other derogatory public record information during the two years following counseling, as well as changes in risk scores. Perhaps not surprisingly, we find that the very act of seeking out counseling is an important signal of subsequent credit problems. Individuals who seek counseling reveal themselves to be in financial stress, and that financial stress is often not fully captured by concurrent credit bureau data. Section IV examines observable differences across counseled clients that may lead them to choose one method of counseling delivery vs. another. We use multivariate statistical (Probit) models to identify predictors of the choice of telephone versus face-to-face counseling. The results identify systematic differences in the clients who gravitate toward one channel vs. another. These results are useful for interpreting subsequent performance differences in the two groups during the years following counseling. Section V reports the multivariate analysis that identifies the effect of counseling channel on subsequent credit behavior, controlling for factors identified in Section IV that appear to affect the choice of counseling delivery method. The analysis introduces various client performance measures drawn from the credit bureau data. It provides an initial look at how an individual's credit experience during the two years following counseling is related to variables that were observable at the time of counseling, including dimensions of their counseling experience. A concluding Section VI offers caveats and further discussion of the primary findings. Section I: Counseling Agency Data A total of 34 agencies submitted grant proposals in response to the Request For Proposal (RFP) that was distributed by American Express to 600+ agencies in August 2004. A review committee consisting of representatives from American Express, Consumer Federation of America and Georgetown University evaluated the proposals and met in October 2004 to select finalists. From the group of 34 respondents, 10 agencies were selected as grant finalists. Finalists were those agencies that were responsive in all of the required areas in the RFP, and received high ratings in the subjective areas of evaluation (data capture ability; description of the quality of their programs; evidence of innovative programs). All agency financial reports were screened for evidence of potential conflicts of interest or other problems of the type being investigated by the U.S. Internal Revenue Service. Evidence of such problems (e.g., documented
3
outsourcing of back-office tasks to for-profit companies owned by agency Board members) negatively influenced the overall ranking of the agency. In addition, the proposal review committee used information on agency size and scope of operations (especially the percentage distribution of clients across counseling delivery channels) to select the finalists to achieve representation across several key dimensions of the sample design, as discussed in greater detail below. Site visits were conducted between November 1 and December 20, 2004 for each of the agency finalists. Visits included opportunities to listen to ongoing counseling sessions and intake calls, either “live” or pre-recorded as part of the agency’s quality assurance program. The ten agencies that emerged from this process as participants in the study were Auriton Solutions (Roseville, MN), ClearPoint Financial Solutions, Inc. (Richmond, VA), Consumer Credit Counseling Service of Greater Atlanta, Inc. (Atlanta, GA), Consumer Credit Counseling Service of Los Angeles (Los Angeles, CA), Consumer Credit Counseling Service of Montana (Great Falls, MN), Consumer Credit Counseling Service of North Central Texas (McKinney, TX), InCharge Debt Solutions (Orlando, FL), LSS Financial Counseling Service (Duluth, MN), Novadebt (Freehold, NJ), and Money Management International (Houston, TX). Some are phone specialists, some do just face-to-face counseling, some do both. A number of agencies offer some form of counseling through the Internet. At least one agency has a unique "crisis management" approach to the client; others utilize a somewhat more scripted approach. What they all have in common is an emphasis on client education and identification of the cause of underlying financial problems. In thinking about the sample, it is important to realize that the primary goal of Phase 1 is not to assess how a nationally representative sample of counseled clients performs over time. Rather, the objective is to utilize the experience of agencies that appear to be high-quality providers in order to see if, when done well, counseling makes a difference, and to identify whether effectiveness is influenced by delivery method. Data in the sample reflect information gathered during the first “counseling interview” with the client. All of the agencies in our sample conducted initial client interviews lasting anywhere from 30 minutes to 75 minutes. The interview collected detailed budget and asset information and identified potential causes of the clients’ financial problems. Options were discussed and the counselor made a recommendation to the client. The counselor's recommendation and a written action plan were part of the product delivered to the consumer. This definition of the "first counseling session" or "intake interview" was communicated to all participating agencies. One option that was offered to many clients was enrollment in an agency-administered debt repayment program called a Debt Management Plan (DMP). Consumers recommended for a DMP could choose not to enroll, but the DMP recommendation is a signal that the counselor thought that customer was qualified. Each agency was asked to provide information for all individuals who received a first-counseling session during March and April of 2003. A match of the counseling data to credit bureau data drawn from the second quarters of 2002, 2003, and 2005 was attempted. To maintain confidentiality, these matches were performed by one of the three major U.S. consumer reporting agencies, Trans Union, LLC (TU). Each agency sent their files directly to TU; TU then matched
4
based on available personal identifiers and sent the matched data, stripped of all unique personal identifiers, to the project research team at the Credit Research Center (CRC), Georgetown University. For about 10,000 clients, a successful match across all three years could not be made. Attempts to match failed for a variety of reasons, but the greatest dropout occurred when the agency did not collect the Social Security Number of the individual being counseled. Limited credit histories at the time of counseling also appeared to account for a number of dropouts. Using data collected by the agencies where available, the average size of unsecured debt and the number of unsecured creditors was substantially lower for individuals who could not be matched to credit bureau data Table 1 indicate the total number of observations within the 2003 time period that TU attempted to match and the percent that could not be matched to credit bureau data for all three years (2002, 2003, and 2005). Overall, 61,476 clients (87%) were matched to credit bureau data for all three years. The extent of matching was similar across agencies with the notable exception of Agency B. For this agency, two-thirds of the clients could not be matched to credit bureau data. The credit bureau provided a number of attributes for each individual. Of particular interest are two types of credit scores provided. Both scoring products are risk management tools that TU markets to creditors and other firms making credit-related decisions. One reflects the risk of a serious delinquency on any account (equivalent in concept and roughly equivalent in scaling to the widely-reported FICO score product developed by Fair Isaac, Co.), while the second reflects the risk of bankruptcy. For the set of individuals that were matched to credit bureau data, the credit bureau data did not provide a complete set of risk scores (i.e., both scores for 2002, 2003 and 2005) for 2.4% of the clients.1 The final column in Table 1 indicates the distribution across agencies of the 59,972 clients for whom a complete set of credit reports and credit risk scores were available for subsequent analysis.
1 Note that there is no clear pattern to individuals missing such scores with respect to either the delivery channel or the counseling recommendation.
5
Percent Dropped
Because Visit Occurred
Outside Early 2003 Period
Percent Dropped
Because Not Fully Matched
to Credit Bureau Data
Percent Dropped
Because Of Missing Risk
ScoreAgency
A 0.0% 6.0% 2.3%B 0.0% 66.1% 3.7%C 14.4% 12.8% 3.2%D 6.5% 6.2% 2.1%E 0.0% 4.2% 2.2%F 5.0% 18.9% 2.8%G 0.0% 7.7% 2.3%H 23.3% 9.0% 7.5%I 10.7% 24.5% 3.4%J 2.6% 20.0% 3.2%
Starting Number of Observations 72,253
Starting Number of Observations 71,003
Starting Number of Observations 61,476
Of These, Number Within 2003 Time Period 71,003
Of These, Number Matched to Credit Bureau Data 61,476
Of These, Number With Risk Score 59,972
Percent Dropped 1.7% 13.4% 2.4%
Table 1: Counseling Observations Dropped From Analysis Due to Incorrect Time Period, Inability to Fully Match to Credit Bureau Data,
Or Missing Risk Score
The sample drops 1.7% of the cases when the date of the initial counseling did not occur as specificed by the sampling instructions. For 5 of the 10 agencies, these were cases that were not initiated during the March 2003 to April 2003 period. For one agency, these were cases that were not initiated in March, April, or May 2003. The other four agencies had no observations outside the designated time span. We did retain the observations when the counseling date was not available. For two agencies, this was a sizable proportion of their total observations (i.e., 28% and 62% of their observations). Note that 22 of the 59,972 observations did not provide information on the delivery channel - these observations are omitted from subsequent analysis, leaving 59,950 observations.
6
Table 2 divides counseling clients by the delivery channel for the initial interview. Two agencies provided only telephone counseling, and a third was predominately telephone with less than 5 percent of clients counseled face-to-face. At the other end of the delivery spectrum, two agencies offered primarily face-to-face or internet counseling sessions. The remaining five agencies offered a combination of delivery channels for counseling. For this particular pooled sample, the most common form of the delivery channel is the telephone. However, recall that our sample is not a representative sample of individuals who seek counseling. In particular, the sample is dominated by large volumes of clients from two agencies, one of which does telephone counseling exclusively.
0%
10%
20%
30%
40%
50%
60%
70%
80%
90%
100%
Overall
Table 2: Counseling Delivery Channels Across Agencies In Sample
(10 Agencies: 59,950 Observations)
Face-to-face Internet Telephone
Table 3 indicates differences across the agencies in the recommendations that arose from the counseling session. Note that one agency (E) not only did not distinguish between referral to other services and referral to legal assistance but also did not distinguish between either type of referral and financial counseling only. Table 3 indicates large differences in the extent to which counseling resulted in a debt management plan being proposed. However, when one considers the percent of clients who actually started a DMP (see the last column in Table 3), the differences across agencies are not as pronounced. Table 4 reports the recommendation of the counselor by type of delivery channel. Note that as a percent of all counseling sessions, DMP recommendations were made least frequently for face-to-face counseling clients. Nevertheless, face-to-face sessions display the highest “conversion rate” in terms of percent of clients who start a DMP (see last row in Table 4).
7
Self Manage/ Client Can
HandleDMP
recommended
Financial Counseling
Only
Referral to Other
Agency/ Service
Referral to Legal
AssistanceNot
Available
Some DMP payments
madeAgency
A 3.7% 26.7% 64.8% 0.6% 4.2% 0.0% 16.9%
B 10.3% 59.6% 12.6% 2.2% 4.3% 11.1% 20.2%
C 14.2% 29.8% 41.4% 6.8% 5.6% 2.2% 31.1%
D 3.9% 51.7% 22.2% 15.6% 4.0% 2.7% 35.9%
E 5.3% 64.4% 0.0% 30.1% 0.0% 0.2% 36.3%
F 4.5% 43.2% 26.1% 6.9% 7.8% 11.5% 25.0%
G 5.2% 77.1% 1.1% 7.8% 4.8% 3.9% 27.4%
H 1.5% 32.8% 61.3% 0.0% 1.1% 3.3% 39.1%
I 0.0% 16.9% 83.1% 0.0% 0.0% 0.0% 16.9%
J 0.0% 34.4% 0.2% 0.0% 0.0% 65.5% 25.6%
Total 5.2% 62.1% 9.9% 13.9% 3.0% 5.9% 29.8%
Table 3: Counselor Recommendations Across Agencies and Percent of DMPs Started
Total number of observations is 59,950. With the exception of agency I , the category "DMP recommended" includes individuals who were offerred but chose not to enroll in a debt management plan. For two agencies (A and J ), the variable indicating the number of DMP payments made was missing, so the existence of payments was infered from a variable indicating DMP status. The "self manage" category includes what various agencies refer to as "client can handle", "choose to self manage", or "self administer". "Not available" can be due to an incomplete session.
8
Face-to-face Internet Telephone OverallCounselor Recommendation
Self Manage/Client Can Handle 6.6% 3.3% 5.1% 5.2%
DMP recommended 53.4% 71.9% 63.5% 62.1%
Financial Counseling Only 19.7% 17.8% 5.5% 9.9%
Referal to Other Agency/Service 10.7% 2.6% 16.6% 13.9%
Referral to Legal Assistance 4.9% 2.1% 2.5% 3.0%
Not Available 4.7% 2.3% 6.8% 5.9%
Overall 100.0% 100.0% 100.0% 100.0%
Some DMP payments made 32.9% 21.5% 29.4% 29.4%
Table 4: Delivery Channel By Counselor Recommendation
Percentages are for 59,950 sample of counseling agency clients.
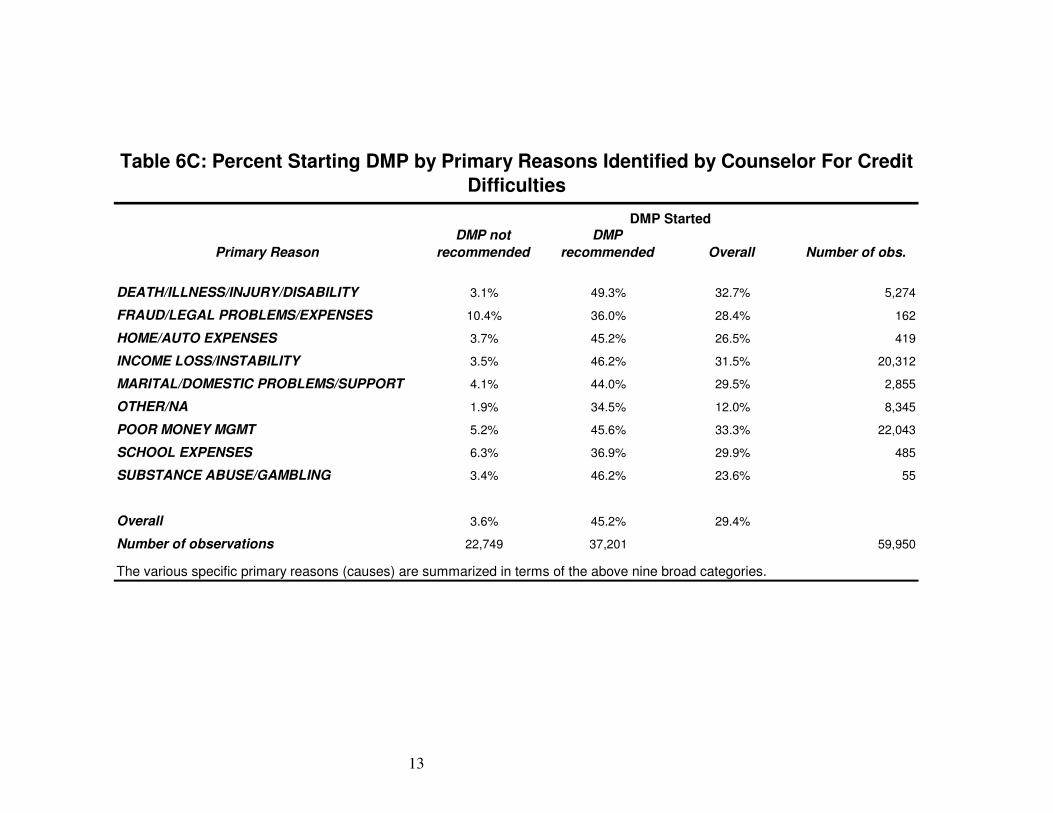
Table 5 summarizes the primary reason identified by the counselor for the credit difficulties of the individual seeking counseling, using nine broad categories. Note that one agency, agency B, provided no reasons. For the other agencies, there is largely agreement that the two most likely reasons are related to either a disruption in income or poor money management. While of value, these responses are subjective. It is not clear that different agencies, or even counselors within the same agency, use the same criteria in selecting a primary cause of credit difficulties. The Appendix indicates the various responses that were collected within each of the nine broad categories. For the various “primary” reasons identified for credit difficulties, Tables 6A, 6B, and 6C indicate how those primary reasons distribute across counselor recommendations. In Table 6A, the percentages by reason sum to 100% across recommendations. In Table 6B, the percentages by recommendation sum to 100% across reasons. Table 6C displays the percent of individuals who start a DMP by primary cause of financial difficulty, subdivided by whether the client was recommended for a DMP. Note that 22,749 clients were not recommended for a DMP, but 3.6% of this group ended up starting a DMP. This can occur when a client’s financial circumstances change subsequent to the initial counseling session, perhaps even as a result of the session (e.g., client sells an asset or obtains a part-time job to supplement income). The first column displays more detail on the “DMP start-rate” for this group, by primary cause of the client’s financial distress. Similarly, the second column shows that 37,201 clients were recommended for a DMP, and 45.2% of this group actually started a DMP.

9
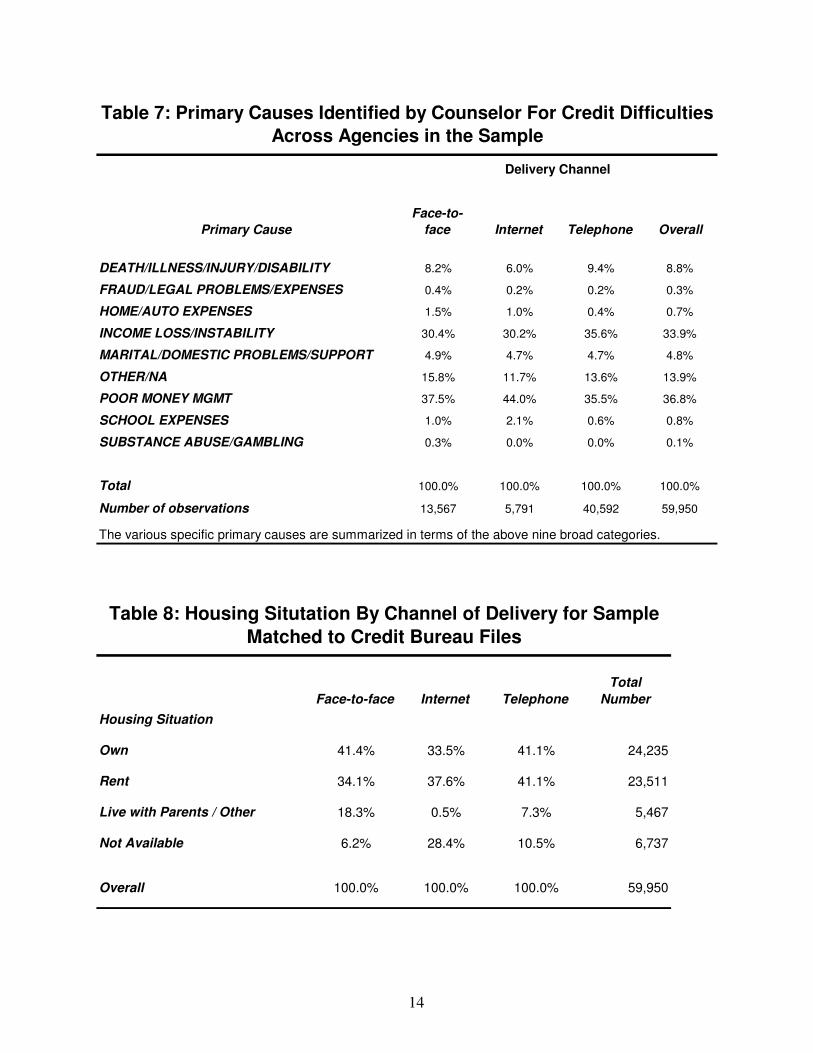
Table 7 indicates how the primary causes distribute across delivery channels. Interestingly, the primary cause for a client's financial problems does not appear to be critical in determining the type of delivery channel chosen. Table 8 provides information on the housing situation of those seeking counseling by delivery channel.
10
Primary Reason A B C D E F G H I J Overall
DEATH/ILLNESS/INJURY/DISABILITY 9.6% 8.1% 7.9% 10.9% 6.8% 7.6% 15.5% 5.9% 13.5% 8.8%
FRAUD/LEGAL PROBLEMS/EXPENSES 0.5% 0.3% 0.5% 1.1% 0.3%
HOME/AUTO EXPENSES 3.8% 1.9% 0.4% 0.9% 0.7% 0.7%
INCOME LOSS/INSTABILITY 32.6% 27.5% 26.2% 40.1% 27.3% 33.5% 10.3% 27.7% 49.1% 33.9%
MARITAL/DOMESTIC PROBLEMS/SUPPORT 5.1% 4.7% 5.9% 4.9% 4.5% 4.8% 5.9% 0.1% 6.3% 4.8%
OTHER/NA 8.9% 100.0% 22.1% 20.6% 7.6% 12.1% 7.0% 45.8% 50.0% 20.4% 13.9%
POOR MONEY MGMT 43.5% 32.4% 36.1% 36.4% 48.1% 44.0% 21.0% 12.7% 10.6% 36.8%
SCHOOL EXPENSES 0.3% 0.7% 0.9% 0.1% 1.6% 3.0% 0.8%
SUBSTANCE ABUSE/GAMBLING 0.4% 0.2% 0.8% 0.1% 0.4% 0.1%
Total 100.0% 100.0% 100.0% 100.0% 100.0% 100.0% 100.0% 100.0% 100.0% 100.0% 100.0%
Number of observations 59,950
Table 5: Primary Causes of Credit Difficulties, As Identified by Counselor
The various specific primary causes are summarized in terms of the above nine broad categories. See Appendix A for detail on category components
Agency
11
Primary Reason
Self Manage/
Client Can Handle
DMP recommended
Financial Counseling
Only
Referal to Other
Agency/ Service
Referral to Legal
AssistanceNot
Available TotalNumber of obs.
DEATH/ILLNESS/INJURY/DISABILITY 3.7% 64.1% 8.1% 15.1% 3.7% 5.3% 100.0% 5,274
FRAUD/LEGAL PROBLEMS/EXPENSES 9.3% 70.4% 6.2% 6.8% 5.6% 1.9% 100.0% 162
HOME/AUTO EXPENSES 16.0% 54.9% 11.5% 12.2% 4.1% 1.4% 100.0% 419
INCOME LOSS/INSTABILITY 4.1% 65.7% 8.3% 14.2% 2.7% 5.1% 100.0% 20,312
MARITAL/DOMESTIC PROBLEMS/SUPPORT 4.8% 63.6% 9.9% 13.5% 3.2% 5.1% 100.0% 2,855
OTHER/NA 10.6% 30.9% 18.6% 16.3% 2.9% 20.7% 100.0% 8,345
POOR MONEY MGMT 4.4% 69.6% 8.6% 12.9% 3.1% 1.5% 100.0% 22,043
SCHOOL EXPENSES 7.6% 77.1% 9.3% 4.3% 1.4% 0.2% 100.0% 485
SUBSTANCE ABUSE/GAMBLING 9.1% 47.3% 16.4% 12.7% 14.5% 0.0% 100.0% 55
Overall 5.2% 62.1% 9.9% 13.9% 3.0% 5.9% 100.0% 59,950
Table 6A: Primary Cause of Financial Difficulty, by Counselor Recommendation
The various specific primary reasons (causes) are summarized in terms of the above nine broad categories. See Appendix A for details
Counselor Recommendation
12
Primary Reason
Self Manage/
Client Can Handle
DMP recommended
Financial Counseling
Only
Referal to Other
Agency/ Service
Referral to Legal
AssistanceNot
Available Overall
DEATH/ILLNESS/INJURY/DISABILITY 6.2% 9.1% 7.2% 9.5% 10.8% 8.0% 8.8%
FRAUD/LEGAL PROBLEMS/EXPENSES 0.5% 0.3% 0.2% 0.1% 0.5% 0.1% 0.3%
HOME/AUTO EXPENSES 2.1% 0.6% 0.8% 0.6% 0.9% 0.2% 0.7%
INCOME LOSS/INSTABILITY 26.5% 35.8% 28.2% 34.5% 30.9% 29.3% 33.9%
MARITAL/DOMESTIC PROBLEMS/SUPPORT 4.4% 4.9% 4.8% 4.6% 5.0% 4.1% 4.8%
OTHER/NA 28.3% 6.9% 26.1% 16.3% 13.5% 48.9% 13.9%
POOR MONEY MGMT 30.8% 41.3% 31.8% 34.0% 37.5% 9.4% 36.8%
SCHOOL EXPENSES 1.2% 1.0% 0.8% 0.3% 0.4% 0.0% 0.8%
SUBSTANCE ABUSE/GAMBLING 0.2% 0.1% 0.2% 0.1% 0.4% 0.0% 0.1%
Total 100.0% 100.0% 100.0% 100.0% 100.0% 100.0% 100.0%
Number of observations 3,139 37,201 5,938 8,345 1,798 3,529 59,950
Table 6B: Primary Cause of Financial Difficulty, by Counselor Recommendation
The various specific primary reasons (causes) are summarized in terms of the above nine broad categories. See Appendix A for details.
Counselor Recommendation
13
Primary ReasonDMP not
recommendedDMP
recommended Overall Number of obs.
DEATH/ILLNESS/INJURY/DISABILITY 3.1% 49.3% 32.7% 5,274
FRAUD/LEGAL PROBLEMS/EXPENSES 10.4% 36.0% 28.4% 162
HOME/AUTO EXPENSES 3.7% 45.2% 26.5% 419
INCOME LOSS/INSTABILITY 3.5% 46.2% 31.5% 20,312
MARITAL/DOMESTIC PROBLEMS/SUPPORT 4.1% 44.0% 29.5% 2,855
OTHER/NA 1.9% 34.5% 12.0% 8,345
POOR MONEY MGMT 5.2% 45.6% 33.3% 22,043
SCHOOL EXPENSES 6.3% 36.9% 29.9% 485
SUBSTANCE ABUSE/GAMBLING 3.4% 46.2% 23.6% 55
Overall 3.6% 45.2% 29.4%
Number of observations 22,749 37,201 59,950
Table 6C: Percent Starting DMP by Primary Reasons Identified by Counselor For Credit Difficulties
The various specific primary reasons (causes) are summarized in terms of the above nine broad categories.
DMP Started
14
Primary CauseFace-to-
face Internet Telephone Overall
DEATH/ILLNESS/INJURY/DISABILITY 8.2% 6.0% 9.4% 8.8%
FRAUD/LEGAL PROBLEMS/EXPENSES 0.4% 0.2% 0.2% 0.3%
HOME/AUTO EXPENSES 1.5% 1.0% 0.4% 0.7%
INCOME LOSS/INSTABILITY 30.4% 30.2% 35.6% 33.9%
MARITAL/DOMESTIC PROBLEMS/SUPPORT 4.9% 4.7% 4.7% 4.8%
OTHER/NA 15.8% 11.7% 13.6% 13.9%
POOR MONEY MGMT 37.5% 44.0% 35.5% 36.8%
SCHOOL EXPENSES 1.0% 2.1% 0.6% 0.8%
SUBSTANCE ABUSE/GAMBLING 0.3% 0.0% 0.0% 0.1%
Total 100.0% 100.0% 100.0% 100.0%
Number of observations 13,567 5,791 40,592 59,950
Table 7: Primary Causes Identified by Counselor For Credit Difficulties Across Agencies in the Sample
The various specific primary causes are summarized in terms of the above nine broad categories.
Delivery Channel
Face-to-face Internet TelephoneTotal
NumberHousing Situation
Own 41.4% 33.5% 41.1% 24,235
Rent 34.1% 37.6% 41.1% 23,511
Live with Parents / Other 18.3% 0.5% 7.3% 5,467
Not Available 6.2% 28.4% 10.5% 6,737
Overall 100.0% 100.0% 100.0% 59,950
Table 8: Housing Situtation By Channel of Delivery for Sample Matched to Credit Bureau Files
15
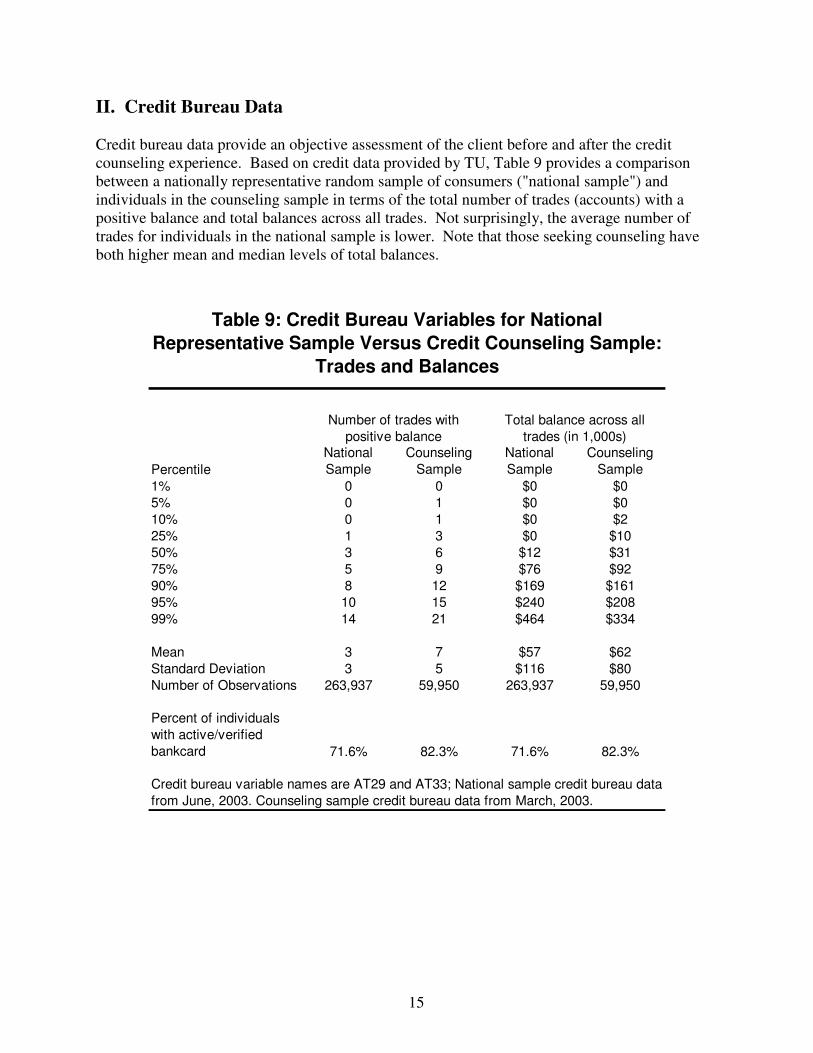
II. Credit Bureau Data Credit bureau data provide an objective assessment of the client before and after the credit counseling experience. Based on credit data provided by TU, Table 9 provides a comparison between a nationally representative random sample of consumers ("national sample") and individuals in the counseling sample in terms of the total number of trades (accounts) with a positive balance and total balances across all trades. Not surprisingly, the average number of trades for individuals in the national sample is lower. Note that those seeking counseling have both higher mean and median levels of total balances.
PercentileNational Sample
Counseling Sample
National Sample
Counseling Sample
1% 0 0 $0 $05% 0 1 $0 $010% 0 1 $0 $225% 1 3 $0 $1050% 3 6 $12 $3175% 5 9 $76 $9290% 8 12 $169 $16195% 10 15 $240 $20899% 14 21 $464 $334
Mean 3 7 $57 $62Standard Deviation 3 5 $116 $80Number of Observations 263,937 59,950 263,937 59,950
Percent of individuals with active/verified bankcard 71.6% 82.3% 71.6% 82.3%
Table 9: Credit Bureau Variables for National Representative Sample Versus Credit Counseling Sample:
Trades and Balances
Number of trades with positive balance
Total balance across all trades (in 1,000s)
Credit bureau variable names are AT29 and AT33; National sample credit bureau data from June, 2003. Counseling sample credit bureau data from March, 2003.
16
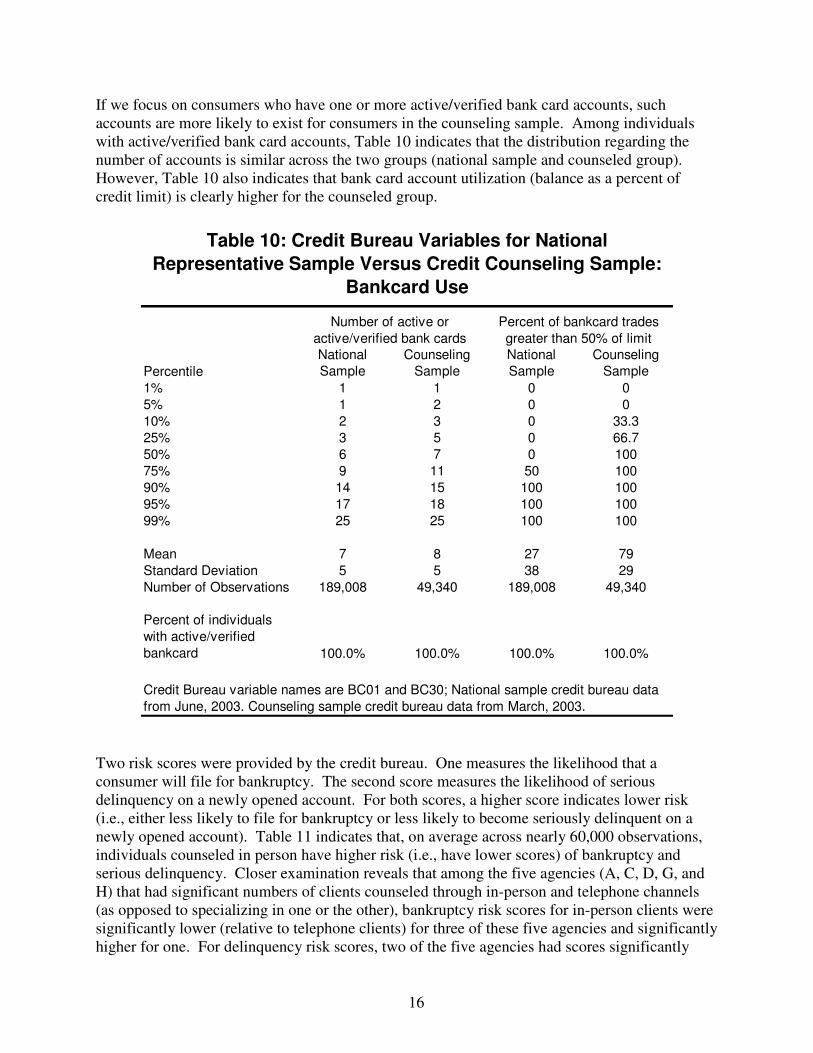
If we focus on consumers who have one or more active/verified bank card accounts, such accounts are more likely to exist for consumers in the counseling sample. Among individuals with active/verified bank card accounts, Table 10 indicates that the distribution regarding the number of accounts is similar across the two groups (national sample and counseled group). However, Table 10 also indicates that bank card account utilization (balance as a percent of credit limit) is clearly higher for the counseled group.
PercentileNational Sample
Counseling Sample
National Sample
Counseling Sample
1% 1 1 0 05% 1 2 0 010% 2 3 0 33.325% 3 5 0 66.750% 6 7 0 10075% 9 11 50 10090% 14 15 100 10095% 17 18 100 10099% 25 25 100 100
Mean 7 8 27 79Standard Deviation 5 5 38 29Number of Observations 189,008 49,340 189,008 49,340
Percent of individuals with active/verified bankcard 100.0% 100.0% 100.0% 100.0%
Table 10: Credit Bureau Variables for National Representative Sample Versus Credit Counseling Sample:
Bankcard Use
Number of active or active/verified bank cards
Percent of bankcard trades greater than 50% of limit
Credit Bureau variable names are BC01 and BC30; National sample credit bureau data from June, 2003. Counseling sample credit bureau data from March, 2003.
Two risk scores were provided by the credit bureau. One measures the likelihood that a consumer will file for bankruptcy. The second score measures the likelihood of serious delinquency on a newly opened account. For both scores, a higher score indicates lower risk (i.e., either less likely to file for bankruptcy or less likely to become seriously delinquent on a newly opened account). Table 11 indicates that, on average across nearly 60,000 observations, individuals counseled in person have higher risk (i.e., have lower scores) of bankruptcy and serious delinquency. Closer examination reveals that among the five agencies (A, C, D, G, and H) that had significant numbers of clients counseled through in-person and telephone channels (as opposed to specializing in one or the other), bankruptcy risk scores for in-person clients were significantly lower (relative to telephone clients) for three of these five agencies and significantly higher for one. For delinquency risk scores, two of the five agencies had scores significantly
17
lower for clients counseled in person. Thus, there is some evidence that in-person clients at these five agencies were, on average, higher risk than their telephone counterparts. [Note: Agency C has a substantially higher average risk score for its telephone clients, relative to any other client subgroup in the sample. Possibly this is due to a targeted marketing effort or affiliation that attracts a group of clients who appear to be lower risk, at least as measured by the credit report around the time of initial counseling.]
Face-to-face Internet Telephone Overall
AgencyA Bankruptcy Risk Score 227 260 252 248
Delinquency Risk Score 595 607 596 600
B Bankruptcy Risk Score 232 232Delinquency Risk Score 580 580
C Bankruptcy Risk Score 260 250 419 333Delinquency Risk Score 594 611 671 630
D Bankruptcy Risk Score 220 210 219Delinquency Risk Score 580 573 579
E Bankruptcy Risk Score 235 235Delinquency Risk Score 592 592
F Bankruptcy Risk Score 268 212 207 255Delinquency Risk Score 603 590 589 600
G Bankruptcy Risk Score 243 256 253 251Delinquency Risk Score 590 600 603 599
H Bankruptcy Risk Score 278 252 273Delinquency Risk Score 597 590 595
I Bankruptcy Risk Score 245 245Delinquency Risk Score 589 589
J Bankruptcy Risk Score 261 233 234Delinquency Risk Score 596 589 589
Overall Bankruptcy Risk Score 239 256 246 245Delinquency Risk Score 588 602 597 595
Table 11: Average 2003 Credit Bureau Bankruptcy and Delinquency Risk Scores By Delivery Channel and Agency
Sample includes only observations with credit bureau risk scores. Note that higher score indicates lower risk of bankruptcy. Total number of observations is 59,950
18
Table 12 indicates the differences in the risk scores between the counseling sample and the nationally representative sample of consumers. Table 12 indicates that the counseling sample has substantially lower bankruptcy and new account delinquency risk scores than the national sample. For instance, whereas around 50% of the national sample has a delinquency risk score over 740, less than 10% of the counseling sample has a delinquency risk score this high or higher. And, this difference occurs even though the national sample includes some individuals very similar to those in the counseling group.
PercentileNational Sample
Counseling Sample
National Sample
Counseling Sample
1% 15 5 424 4195% 128 15 460 44510% 143 37 498 47025% 329 134 614 53150% 693 180 742 58875% 835 333 841 65890% 959 522 880 72395% 976 648 894 75999% 987 870 908 843
Mean 599 245 718 595Standard Deviation 294 190 139 95Number of Observations 263,937 59,950 263,937 59,950
Percent of individuals with risk score 85.7% 97.6% 85.7% 97.6%
Table 12: Credit Bureau Variables for National Representative Sample Versus Credit Counseling
Sample: Risk Scores
Bankruptcy Risk Score New Account Risk Score
National sample credit bureau data from June, 2003. Counseling sample credit bureau data from March, 2003.
19
Credit bureau variables as predictors of decision to seek counseling Individuals in the counseling group are clearly different from individuals in a nationally representative sample of consumers with credit reports. We now consider a wider array of factors that are associated with seeking credit counseling assistance. To do so, we combine the national credit bureau sample with the counseling sample to create a pooled dataset, and define a variable that equals one if the individual is from the counseling sample and zero otherwise. We then estimate a Probit model with the dependent variable indicating whether the individual is from the counseling sample. For the pooled sample, 18.5 percent are directly identified as having sought counseling at approximately the same time as the credit bureau data was pulled. Of course, there are surely individuals within the national sample who also sought counseling during this period that are not identified. Their presence introduces measurement error that, among other things, can lead to a bias toward zero in our estimated coefficients. That is, an observed relationship between credit bureau variables and the choice of counseling must be stronger in this sample (relative to one in which there are no unidentified counseled consumers) to achieve statistical significance.
Table 13 presents the results for the Probit model estimation that includes as explanatory variables selected credit bureau variables as measures of credit profile and creditworthiness. Coefficients on the explanatory variables indicate the marginal effect of a change in the variable on the probability of being in the counseled sample. Table 13 indicates that individuals with lower risk scores, a higher number of trades with positive balances (both overall and bankcard), a greater utilization rate for bank cards, and larger numbers of delinquencies and inquiries are more likely to seek out counseling. Note that in Table 13, the coefficients indicate the marginal effect of a one unit change in the independent variable. For instance, an increase by 100 in the bankruptcy risk score (one unit) is predicted to decrease the likelihood of an individual seeking counseling by .0247 or 2.47%. Table 13 also reports averages for the explanatory variables for the two samples (control and counseling) to provide the reader with a better idea of how the counseling sample differs from the nationally representative sample across various credit bureau variables.
20
Coefficient in Probit Model (z-statistic)
Mean of variables for
control sample
(standard deviation)
Mean of variables for counseling
sample (standard deviation)
Bankruptcy risk score (in 100s) -0.0247*** 5.99 2.45(65.13) (2.94) (1.9)
New account risk score (in 100s) -0.0131*** 7.18 5.95(14.26) (1.39) (0.95)
Total number of trades with balance > 0 0.0096*** 3.39 6.61(35.65) (3.24) (4.53)
Total balance, non-mortgage trades (in 10,000s) -0.0014*** 1.74 2.92(7.41) (4.16) (3.43)
Total balance, mortgages (in 10,000s) -0.0021*** 3.99 3.28(23.88) (10.07) (6.56)
Number of bankcard trades 0.0004*** 5.44 7.44(2.97) (5.27) (5.07)
Proportion of bankcard trades with balance over 50% of limit 0.1202*** 0.19 0.65(53.04) (0.34) (0.4)
Number of non-installment trades over 50 % of limit 0.0106*** 0.92 3.59(24.62) (1.62) (3.1)
Number of trades 30 or more days past due in last 18 mths 0.0077*** 0.73 3.14(25.06) (1.72) (3.24)
Number of currently past due balances 0.0152*** 0.18 1.19(24.58) (0.66) (1.77)
Number of inquiries in last 6 months 0.0041*** 1.06 2.16(16.69) (1.8) (2.72)
Highest retail credit limit (in 1,000s) 0.0018*** 1.47 1.29(5.73) (2.28) (1.89)
Number of observations 323,887 263,937 59,950
Table 13: Probit Model of Factors Affecting Likelihood that an Individual in Credit Bureau Pooled Sample is From Counseling Agency Sample
Not reported is a variable indicating missing values for the variable measuring the percent of bankcard trades with balance over 50%. This variable is not defined if an individual has no bank cards.
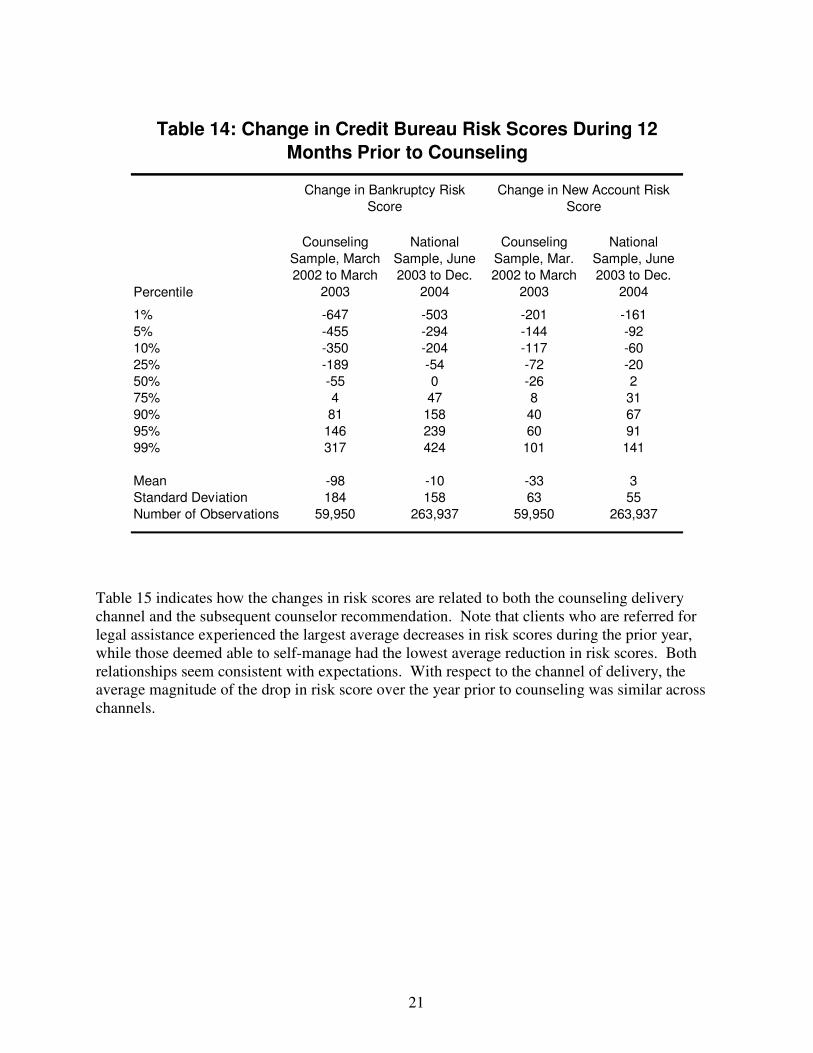
Coefficients indicate marginal effects; * significant at 10%; ** significant at 5%; *** significant at 1% Table 14 suggests that another predictor of an individual seeking out counseling is a decline in the risk score over the preceding 12 months. Consumers who visited a counselor in 2003 experienced a median reduction in their bankruptcy risk score of 55 points, and a median reduction in their delinquency risk score of 26 points during the 12 months prior to their visit. By comparison, the median change in risk scores was at or near zero for consumers in the nationally representative sample over a different (longer) period, June 2003 to December 2004.
21
Percentile
Counseling Sample, March 2002 to March
2003
National Sample, June 2003 to Dec.
2004
Counseling Sample, Mar. 2002 to March
2003
National Sample, June 2003 to Dec.
2004
1% -647 -503 -201 -1615% -455 -294 -144 -9210% -350 -204 -117 -6025% -189 -54 -72 -2050% -55 0 -26 275% 4 47 8 3190% 81 158 40 6795% 146 239 60 9199% 317 424 101 141
Mean -98 -10 -33 3Standard Deviation 184 158 63 55Number of Observations 59,950 263,937 59,950 263,937
Table 14: Change in Credit Bureau Risk Scores During 12 Months Prior to Counseling
Change in Bankruptcy Risk Score
Change in New Account Risk Score
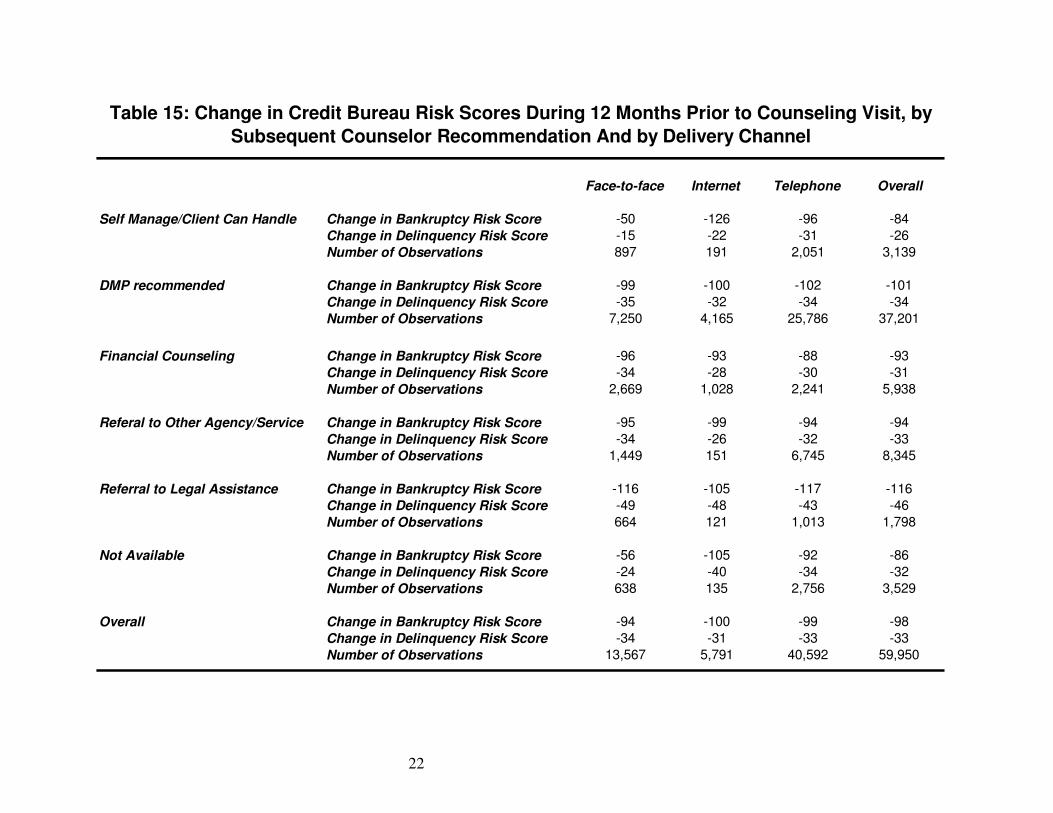
Table 15 indicates how the changes in risk scores are related to both the counseling delivery channel and the subsequent counselor recommendation. Note that clients who are referred for legal assistance experienced the largest average decreases in risk scores during the prior year, while those deemed able to self-manage had the lowest average reduction in risk scores. Both relationships seem consistent with expectations. With respect to the channel of delivery, the average magnitude of the drop in risk score over the year prior to counseling was similar across channels.
22
Face-to-face Internet Telephone Overall
Self Manage/Client Can Handle Change in Bankruptcy Risk Score -50 -126 -96 -84Change in Delinquency Risk Score -15 -22 -31 -26Number of Observations 897 191 2,051 3,139
DMP recommended Change in Bankruptcy Risk Score -99 -100 -102 -101Change in Delinquency Risk Score -35 -32 -34 -34Number of Observations 7,250 4,165 25,786 37,201
Financial Counseling Change in Bankruptcy Risk Score -96 -93 -88 -93Change in Delinquency Risk Score -34 -28 -30 -31Number of Observations 2,669 1,028 2,241 5,938
Referal to Other Agency/Service Change in Bankruptcy Risk Score -95 -99 -94 -94Change in Delinquency Risk Score -34 -26 -32 -33Number of Observations 1,449 151 6,745 8,345
Referral to Legal Assistance Change in Bankruptcy Risk Score -116 -105 -117 -116Change in Delinquency Risk Score -49 -48 -43 -46Number of Observations 664 121 1,013 1,798
Not Available Change in Bankruptcy Risk Score -56 -105 -92 -86Change in Delinquency Risk Score -24 -40 -34 -32Number of Observations 638 135 2,756 3,529
Overall Change in Bankruptcy Risk Score -94 -100 -99 -98Change in Delinquency Risk Score -34 -31 -33 -33Number of Observations 13,567 5,791 40,592 59,950
Table 15: Change in Credit Bureau Risk Scores During 12 Months Prior to Counseling Visit, by Subsequent Counselor Recommendation And by Delivery Channel

23
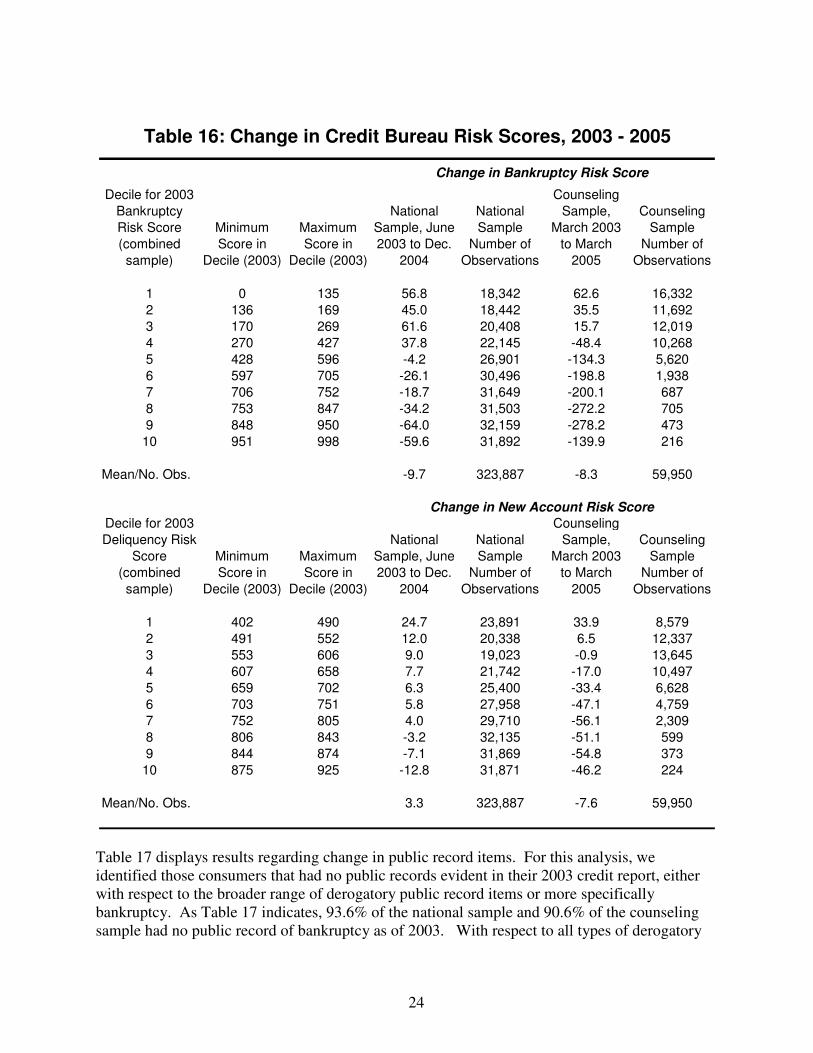
Section III: A Comparison of Outcomes: Counseled Clients vs. Nationally Representative Sample In this section, we examine post-counseling changes in the incidence of negative public record items (including bankruptcy) of the counseled group, relative to a nationally representative sample of consumers. We also examine the post-counseling change in credit risk scores. The results must be viewed only as suggestive, however, because the time period used to measure performance for the counseled group (the 24-month period from March 2003 to March 2005) differs from the time period available for measuring performance of the national sample (the 18-month period from June 2003 to December 2004). Table 16 indicates the changes in bankruptcy risk scores and new account delinquency risk scores for the counseling sample between March 2003 and March 2005, side-by-side with the comparable change for the national sample between June 2003 and December 2004. To account for the fact that those seeking counseling begin the period with significantly lower risk scores compared to consumers in the nationally representative sample, we divide individuals according to their initial score values in 2003. In particular, we separate the combined sample into deciles based on their risk score, and then measure the average subsequent change in the risk score for each decile. The summary statistics reported in Table 16 indicate that among individuals with high initial risk scores, the subsequent drop in risk scores was especially large for individuals who sought counseling. In other words, controlling for the risk score of an individual as of 2003, the extent of the reduction in the risk score is greater for the counseling group over the following period as compared to the national sample. A simple regression analysis (not shown) indicates that, controlling for 2003 bankruptcy risk scores, the subsequent bankruptcy score for individuals in the counseling sample fell by approximately 59 points compared to the control group. Similarly, controlling for 2003 delinquency risk scores, the subsequent delinquency score for individuals in the counseling sample fell by 22 points compared to the control group. Though the differences are slightly less, similar results hold even if one excludes from the analysis those who subsequently filed for bankruptcy.
24
Decile for 2003 Bankruptcy Risk Score (combined sample)
Minimum Score in
Decile (2003)
Maximum Score in
Decile (2003)
National Sample, June 2003 to Dec.
2004
National Sample
Number of Observations
Counseling Sample,
March 2003 to March
2005
Counseling Sample
Number of Observations
1 0 135 56.8 18,342 62.6 16,3322 136 169 45.0 18,442 35.5 11,6923 170 269 61.6 20,408 15.7 12,0194 270 427 37.8 22,145 -48.4 10,2685 428 596 -4.2 26,901 -134.3 5,6206 597 705 -26.1 30,496 -198.8 1,9387 706 752 -18.7 31,649 -200.1 6878 753 847 -34.2 31,503 -272.2 7059 848 950 -64.0 32,159 -278.2 47310 951 998 -59.6 31,892 -139.9 216
Mean/No. Obs. -9.7 323,887 -8.3 59,950
Decile for 2003 Deliquency Risk
Score (combined sample)
Minimum Score in
Decile (2003)
Maximum Score in
Decile (2003)
National Sample, June 2003 to Dec.
2004
National Sample
Number of Observations
Counseling Sample,
March 2003 to March
2005
Counseling Sample
Number of Observations
1 402 490 24.7 23,891 33.9 8,5792 491 552 12.0 20,338 6.5 12,3373 553 606 9.0 19,023 -0.9 13,6454 607 658 7.7 21,742 -17.0 10,4975 659 702 6.3 25,400 -33.4 6,6286 703 751 5.8 27,958 -47.1 4,7597 752 805 4.0 29,710 -56.1 2,3098 806 843 -3.2 32,135 -51.1 5999 844 874 -7.1 31,869 -54.8 37310 875 925 -12.8 31,871 -46.2 224
Mean/No. Obs. 3.3 323,887 -7.6 59,950
Table 16: Change in Credit Bureau Risk Scores, 2003 - 2005
Change in Bankruptcy Risk Score
Change in New Account Risk Score
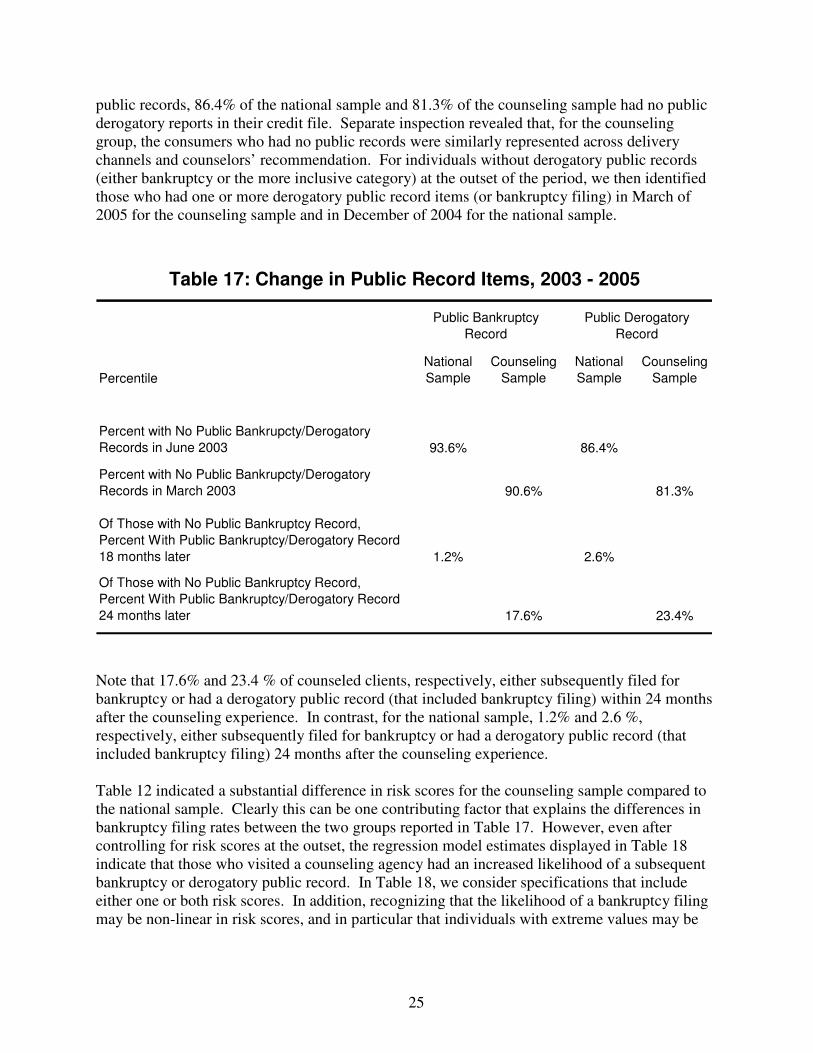
Table 17 displays results regarding change in public record items. For this analysis, we identified those consumers that had no public records evident in their 2003 credit report, either with respect to the broader range of derogatory public record items or more specifically bankruptcy. As Table 17 indicates, 93.6% of the national sample and 90.6% of the counseling sample had no public record of bankruptcy as of 2003. With respect to all types of derogatory
25
public records, 86.4% of the national sample and 81.3% of the counseling sample had no public derogatory reports in their credit file. Separate inspection revealed that, for the counseling group, the consumers who had no public records were similarly represented across delivery channels and counselors’ recommendation. For individuals without derogatory public records (either bankruptcy or the more inclusive category) at the outset of the period, we then identified those who had one or more derogatory public record items (or bankruptcy filing) in March of 2005 for the counseling sample and in December of 2004 for the national sample.
PercentileNational Sample
Counseling Sample
National Sample
Counseling Sample
Percent with No Public Bankrupcty/Derogatory Records in June 2003 93.6% 86.4%
Percent with No Public Bankrupcty/Derogatory Records in March 2003 90.6% 81.3%
Of Those with No Public Bankruptcy Record, Percent With Public Bankruptcy/Derogatory Record 18 months later 1.2% 2.6%
Of Those with No Public Bankruptcy Record, Percent With Public Bankruptcy/Derogatory Record 24 months later 17.6% 23.4%
Table 17: Change in Public Record Items, 2003 - 2005
Public Bankruptcy Record
Public Derogatory Record
Note that 17.6% and 23.4 % of counseled clients, respectively, either subsequently filed for bankruptcy or had a derogatory public record (that included bankruptcy filing) within 24 months after the counseling experience. In contrast, for the national sample, 1.2% and 2.6 %, respectively, either subsequently filed for bankruptcy or had a derogatory public record (that included bankruptcy filing) 24 months after the counseling experience. Table 12 indicated a substantial difference in risk scores for the counseling sample compared to the national sample. Clearly this can be one contributing factor that explains the differences in bankruptcy filing rates between the two groups reported in Table 17. However, even after controlling for risk scores at the outset, the regression model estimates displayed in Table 18 indicate that those who visited a counseling agency had an increased likelihood of a subsequent bankruptcy or derogatory public record. In Table 18, we consider specifications that include either one or both risk scores. In addition, recognizing that the likelihood of a bankruptcy filing may be non-linear in risk scores, and in particular that individuals with extreme values may be

26
different from others, we include as control variables two additional dummy variables for each risk score that equal one if the individual's risk score is in the lowest or highest decile. The first two columns of Table 18 indicate that an increase in either an individual's bankruptcy risk score or an individual's delinquency risk score reduces the likelihood of subsequent bankruptcy, as expected. Recall that these commercial scores are scaled so that higher scores indicate lower risk. However, those with the highest scores (top decile) and those with the lowest scores (bottom decile) are even less likely to subsequently file for bankruptcy than predicted by a simple linear specification. The fourth and fifth columns of Table 18 indicate a similar finding for a derogatory event. Note that for both the bankruptcy and derogatory public record events, an individual in the counseling sample is more likely to experience a "bad" outcome, even after controlling for risk scores. The third and sixth columns in Table 18 include both bankruptcy and delinquency risk score variables. There are two interesting features to note regarding these results. First, it remains the case that individuals in the counseling sample are more likely to experience either a subsequent bankruptcy or derogatory event. Second, with both bankruptcy and delinquency risk scores in the specification, an increase in the delinquency risk score, holding constant the bankruptcy risk score, is associated with an increase in the likelihood of a bankruptcy for those not in the bottom decile. Tables 19 and 20 further illustrate that, controlling for initial risk scores, counseling is an important signal of subsequent credit problems even after adding a number of additional control variables that have been identified as important components of risk scores. Table 19 examines the link between the decision to seek counseling and a subsequent bankruptcy event or a public derogatory event. Table 20 examines the link between the decision to seek counseling and subsequent risk scores.2 Individuals in the counseling sample reveal themselves to be in financial distress. Tables 19 and 20 show that financial stress is not fully captured by the credit bureau data at the time of counseling. Among other implications, this characteristic of counseled clients makes it difficult to isolate the value of counseling itself because contemporaneous credit bureau information often doesn’t immediately capture the private information that induces individuals to seek counseling. Because creditors typically only report updates on account activity to the credit bureau once per month, there is almost always a lag time between a credit event and the time it is first reflected on the credit report. New financial distress takes time to manifest in credit behavior (e.g., delinquency), and additional time to appear on a credit report.
2 Table 19 considers restricted samples of individuals with no bankruptcy filing event (column 1) or no public derogatory event (column 2) in 2003. Table 20 provides predictions of subsequent risk scores for restricted and full samples. For the counseling sample, two years separate the 2003 independent variables and the subsequent event. For the national sample, one and one-half years separate the 2003 independent variables and the subsequent event.
27
Bankruptcy scores only
Delinquency scores only
Bankruptcy and
Delinquency scores
Bankruptcy scores only
Delinquency scores only
Bankruptcy and
Delinquency scores
Counseling group indicator 0.0663*** 0.1052*** 0.0566*** 0.0697*** 0.1109*** 0.0664***(92.39) (111.89) (85.44) (77.98) (104.20) (75.15)
Bankruptcy risk score: 2003 (in 100s) -0.0049*** -0.0060*** -0.0107*** -0.0091***(55.17) (50.96) (79.04) (50.86)
Bankruptcy score in bottom 10% of combined sample: 2003 -0.0036*** -0.0031*** -0.0041*** -0.0027***(8.86) (8.06) (5.72) (3.84)
Bankruptcy score in top 10% of combined sample: 2003 -0.0103*** -0.0076*** -0.0084*** -0.0053**(5.36) (3.92) (3.67) (2.30)
Delinquency risk score: 2003 (in 100s) -0.0083*** 0.0035*** -0.0206*** -0.0028***(36.35) (14.79) (63.84) (7.30)
Delinquency score in bottom 10% of combined sample: 2003 -0.0103*** -0.0038*** -0.0113*** -0.0049***(18.74) (8.04) (13.23) (6.01)
Delinquency score in top 10% of combined sample: 2003 -0.0164*** -0.0114*** -0.0177*** -0.0159***(9.97) (9.47) (8.20) (8.73)
Observations 301492 301492 301492 276865 276865 276865
Coefficients indicate marginal effects. * significant at 10%; ** significant at 5%; *** significant at 1%
Table 18: Predicting Likelihood of Actual Bankruptcy Filings and Public Derogatory Events Based on Credit Bureau Risk Scores and Counseling Event (Probit Model)
Sample resticted to clients that had no record of a public bankruptcy filing in 2003 (first three columns) or no record of a public derogatory event (second three columns). The proportion of individuals who subsequently had a record of a public bankruptcy filing is .042 and the proportion of individuals who subsequently had a record of a public derogatory event is .063.
Bankruptcy Event Derogatory Event
28
Bankruptcy Event
Derogatory Event
Counseling group indicator 0.0414*** 0.0510***(67.94) (59.35)
Bankruptcy risk score (in 100s) -0.0041*** -0.0064***(34.41) (33.79)
Bankruptcy score in bottom 10% of combined sample -0.0038*** -0.0051***(10.20) (7.31)
Bankruptcy score in top 10% of combined sample -0.0072*** -0.0052**(3.84) (2.29)
Delinquency risk score (in 100s) 0.0012*** -0.0061***(4.27) (12.77)
Delinquency score in bottom 10% of combined sample -0.0011** -0.0011(2.10) (1.24)
Delinquency score in top 10% of combined sample -0.0099*** -0.0139***(8.16) (7.55)
Total number of trades with balance > 0 0.0005*** 0.0005***(8.45) (4.71)
Total balance, non-mortgage trades (in 10,000s) 0.0003*** 0.0005***(9.44) (9.21)
Total balance, mortgages (in 10,000s) -0.0000* 0.0001***(1.73) (3.80)
Number of bankcard trades 0.0002*** 0.0005***(5.97) (8.05)
Proportion of bankcard trades with balance over 50% of limit 0.0045*** 0.0064***(7.20) (6.23)
Number of non-inst trades over 50 % of limit 0.0005*** 0.0008***(5.41) (4.84)
Number of trades 30 or more days past due in last 18 mths -0.0001** 0.0001(2.09) (0.51)
Number of currently past due balances 0.0013*** 0.0022***(10.82) (9.71)
Number of inquiries in last 6 months 0.0007*** 0.0012***(12.06) (12.40)
Highest retail credit limit (in 1,000s) 0.0004*** 0.0006***(5.12) (4.62)
Number of Observations 301492 276865
Coefficients indicate marginal effects; * significant at 10%; ** significant at 5%; *** significant at 1%
Table 19: Predicting Likelihood of Actual Bankruptcy Filings and Public Derogatory Events Based on Credit Bureau Data and
Counseling Event (Probit Model)
Samples are resticted to clients that had no record of a public bankruptcy filing in 2003 (column 1) or no record of a public derogatory event (column 2). The proportion of individuals who subsequently had a record of a public bankruptcy filing is .042 and the proportion of individuals who subsequently had a record of a public derogatory event is .063.
29
Subsequent Delinquency Risk Score: Sample with
initial no public
derogatory in 2003
Delinquency Risk Score: Full Sample
Subsequent Bankruptcy Risk Score: Sample with
initial no public
derogatory in 2003
Bankruptcy Risk Score: Full Sample
Counseling group indicator -0.1674*** -0.1557*** -0.5502*** -0.4426***(45.85) (48.37) (56.53) (52.07)
Bankruptcy risk score (in 100s) 0.0428*** 0.0444*** 0.5776*** 0.5957***(50.99) (59.66) (258.10) (303.03)
Bankruptcy score in bottom 10% of combined sample 0.0425*** 0.0452*** 0.0819*** 0.0052(8.01) (10.97) (5.79) (0.48)
Bankruptcy score in top 10% of combined sample -0.0201*** -0.0221*** 0.2388*** 0.2059***(4.91) (5.50) (21.88) (19.42)
Delinquency risk score (in 100s) 0.8076*** 0.8072*** 0.5747*** 0.5810***(395.93) (424.57) (105.66) (115.75)
Delinquency score in bottom 10% of combined sample 0.0366*** 0.0488*** -0.0230 0.0767***(6.68) (10.86) (1.57) (6.47)
Delinquency score in top 10% of combined sample -0.0136*** -0.0140*** -0.1590*** -0.1630***(3.35) (3.48) (14.63) (15.31)
Total number of trades with balance > 0 0.0042*** 0.0042*** -0.0452*** -0.0405***(7.58) (7.95) (30.37) (29.18)
Total balance, non-mortgage trades (in 10,000s) 0.0043*** 0.0040*** 0.0070*** 0.0072***(14.51) (14.35) (8.81) (9.73)
Total balance, mortgages (in 10,000s) 0.0021*** 0.0022*** 0.0028*** 0.0032***(17.39) (18.82) (8.51) (10.52)
Number of bankcard trades 0.0066*** 0.0072*** -0.0120*** -0.0151***(23.85) (27.82) (16.22) (22.02)
Proportion of bankcard trades with balance over 50% of limit -0.0333*** -0.0333*** -0.2337*** -0.2173***(6.82) (7.48) (17.92) (18.50)
Number of non-inst trades over 50 % of limit -0.0238*** -0.0247*** -0.0341*** -0.0303***(24.33) (27.32) (13.07) (12.67)
Number of trades 30 or more days past due in last 18 mths -0.0019** -0.0021*** 0.0133*** 0.0065***(2.18) (2.90) (5.81) (3.38)
Number of currently past due balances 0.0014 0.0052*** 0.0484*** 0.0618***(0.82) (3.60) (10.91) (16.24)
Number of inquiries in last 6 months -0.0059*** -0.0065*** -0.0102*** -0.0084***(9.62) (12.02) (6.18) (5.91)
Highest retail credit limit (in 1,000s) 0.0076*** 0.0081*** 0.0129*** 0.0143***(14.33) (15.64) (9.13) (10.45)
Constant 1.1455*** 1.1307*** -1.4133*** -1.6092***(83.70) (90.83) (38.73) (48.96)
Number of Observations 276865 323887 276865 323887
Table 20: Predicting Subsequent Delinquency and Bankruptcy Risk Scores Based on Credit Bureau Data and Counseling Event (OLS Model)
Samples in columns 1 and 3 are resticted, respectively, to clients that had no record of a public bankruptcy filing in 2003 or no record of a public derogatory event. Samples in columns 2 and 4 are for the full sample.
Coefficients indicate marginal effects; * significant at 10%; ** significant at 5%; *** significant at 1%
30
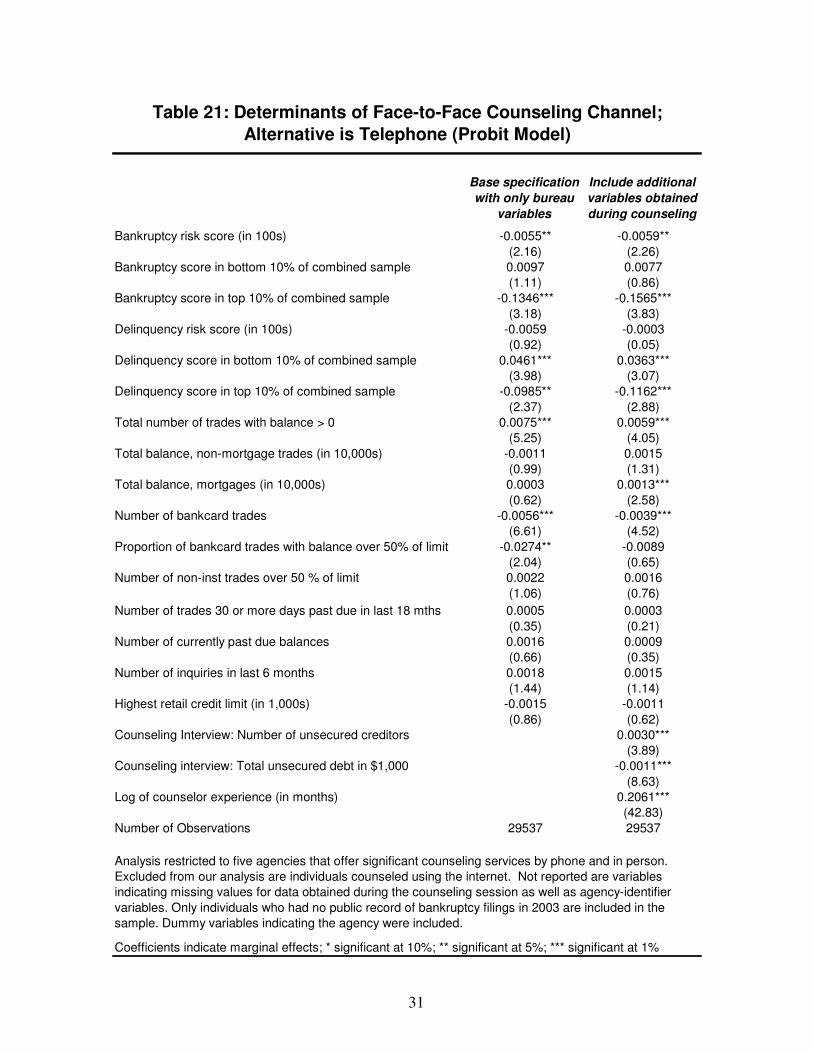
Section IV: Predictors of Choice of Delivery Channel Keeping in mind that the credit bureau information available around the time of counseling has yet to reflect the financial problems experienced by many clients, this section examines whether such observable variables are associated with counseled clients’ choice of delivery channel. To perform this analysis, we consider a sample restricted to the five agencies that, according to Table 2, provided reasonably large samples of individuals counseled both by telephone and in person. These agencies were A, C, D, G, and H. Table 21 reports the results of a Probit analysis for these agencies, restricting our analysis to individuals who used either telephone or face-to-face. These results indicate that individuals seeking with the highest bankruptcy and/or delinquency scores tend to be less likely to seek face-to-face counseling. Also, individuals with delinquency risk scores in the bottom decile of the sample are more likely than others to use face-to-face counseling. With regard to other credit bureau variables, individuals with more accounts with positive balances, larger mortgage balances, but fewer bank cards and less unsecured debt are more likely to seek face-to-face counseling. Finally, counselors involved in face-to-face services tend to be more experienced.
31
Base specification with only bureau
variables
Include additional variables obtained during counseling
Bankruptcy risk score (in 100s) -0.0055** -0.0059**(2.16) (2.26)
Bankruptcy score in bottom 10% of combined sample 0.0097 0.0077(1.11) (0.86)
Bankruptcy score in top 10% of combined sample -0.1346*** -0.1565***(3.18) (3.83)
Delinquency risk score (in 100s) -0.0059 -0.0003(0.92) (0.05)
Delinquency score in bottom 10% of combined sample 0.0461*** 0.0363***(3.98) (3.07)
Delinquency score in top 10% of combined sample -0.0985** -0.1162***(2.37) (2.88)
Total number of trades with balance > 0 0.0075*** 0.0059***(5.25) (4.05)
Total balance, non-mortgage trades (in 10,000s) -0.0011 0.0015(0.99) (1.31)
Total balance, mortgages (in 10,000s) 0.0003 0.0013***(0.62) (2.58)
Number of bankcard trades -0.0056*** -0.0039***(6.61) (4.52)
Proportion of bankcard trades with balance over 50% of limit -0.0274** -0.0089(2.04) (0.65)
Number of non-inst trades over 50 % of limit 0.0022 0.0016(1.06) (0.76)
Number of trades 30 or more days past due in last 18 mths 0.0005 0.0003(0.35) (0.21)
Number of currently past due balances 0.0016 0.0009(0.66) (0.35)
Number of inquiries in last 6 months 0.0018 0.0015(1.44) (1.14)
Highest retail credit limit (in 1,000s) -0.0015 -0.0011(0.86) (0.62)
Counseling Interview: Number of unsecured creditors 0.0030***(3.89)
Counseling interview: Total unsecured debt in $1,000 -0.0011***(8.63)
Log of counselor experience (in months) 0.2061***(42.83)
Number of Observations 29537 29537
Table 21: Determinants of Face-to-Face Counseling Channel; Alternative is Telephone (Probit Model)
Analysis restricted to five agencies that offer significant counseling services by phone and in person. Excluded from our analysis are individuals counseled using the internet. Not reported are variables indicating missing values for data obtained during the counseling session as well as agency-identifier variables. Only individuals who had no public record of bankruptcy filings in 2003 are included in the sample. Dummy variables indicating the agency were included.
Coefficients indicate marginal effects; * significant at 10%; ** significant at 5%; *** significant at 1%
32
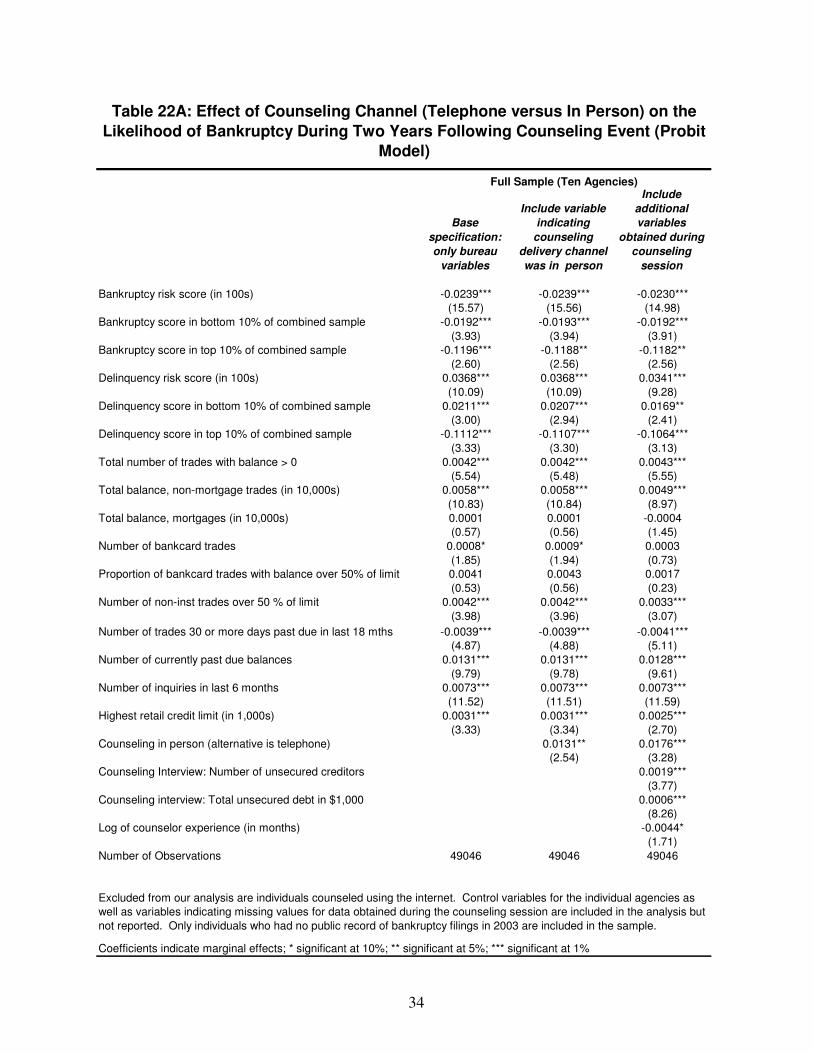
Section V: Counseling Delivery Methods and Outcomes This section provides various tests of the effect of counseling channel on the clients’ credit profile two years later. Because Internet counseling was not consistently defined across agencies in 2003 (e.g., some offered online intake of client financial information but did not classify that as Internet counseling) we limit the analysis to individuals who had an initial counseling session either over the phone or in person. We also restrict the sample to individuals who had no record of bankruptcy filing in their credit report at the time of counseling. For this group, there are two potential samples to consider. One sample includes all agencies, including those that specialize in one type of delivery or the other. Most consumers have a meaningful choice of delivery options because they have two or more counseling agencies from which to choose. It is possible that consumers express a preference for a delivery channel by their selection of a counseling agency that specializes predominantly in telephone counseling (3 agencies in our sample) or in face-to-face counseling (2 agencies). However, while telephone counseling is available and advertised nearly everywhere in the U.S., not all communities have face-to-face counseling options locally or within a short driving distance. Consequently, we utilize a second sample that includes only the five agencies that offered clients a choice of delivery channel and a significant proportion of clients enrolled in each channel. By focusing on these five agencies, we reduce the concern of sample bias due to selection of an agency based on its specialization in a specific delivery channel, and the consumer’s preference for that channel Tables 22 through 24 display the results of Probit models that predict, respectively, the incidence of bankruptcy during the two years following counseling; the client’s bankruptcy risk score measured at a point two years after counseling, and the clients’ delinquency risk score measured at a point two years after counseling. Together these provide three distinct measures of post-counseling credit experience. For each of these tables, we report an "A" version that utilizes the full sample of agencies and a "B" version that is restricted to the five agencies that offered clients a choice of delivery channel and had a significant percent of their clients in either channel. To identify potential determinants of bankruptcy filings, Table 22 reports Probit model estimation results under various specifications. The first column in Table 21 (A and B) adopts a specification that relies only on credit bureau variables, including risk scores. This provides a base-line result. The second column adds a variable to indicate if the counseling was done in person. The third column adds additional variables captured during the counseling interview, including the number of unsecured creditors, size of unsecured debt, and experience of the counselor, in months (log form). Focusing on the third column of Table 22A, note that many of the variables are significant in the expected direction (e.g., higher bankruptcy risk score in 2003 is associated with lower bankruptcy incidence after counseling). As for the impact of the counseling delivery channel, note that among individuals who otherwise appear identical in terms of credit bureau variables (i.e., controlling for credit bureau characteristics), the client who experiences an in-person counseling session is more likely to file for bankruptcy during the two years following the initial counseling session. Also note that an increase in the counselor's experience does reduce the subsequent likelihood of a bankruptcy filing.
33
Tables 23A and 23B consider the same variable specifications as Table 22A and 22B, but adopt as the dependent variable the individual's bankruptcy risk score in 2005, as opposed to the actual bankruptcy incidence between 2003 and 2005 that is modeled in Table 22. In other words, Tables 23A and 23B model the impact of the included variables on one measure of the client’s future creditworthiness, namely the client’s risk of future bankruptcy at a point two years out from counseling as indicated by their bankruptcy risk score at that time. Table 24A and 24B are similar to Tables 23A and 23B, but use the client’s delinquency risk score in 2005 as the dependent variable. For the full specification (third column) in Tables 23A and 24A, the effect of "face-to-face" counseling sessions is not statistically significant with respect to the subsequent bankruptcy risk score, but in-person counseling sessions do appear to be associated with a higher subsequent delinquency risk score.3 As noted earlier, these results for the full sample of ten agencies are similar to ones obtained when the sample is restricted to agencies that offered significant levels of both types of counseling (compare Tables 23A and 24A to Tables 23B and 24B, respectively).
3 The latter result is significant only at the 10% level.
34
Base specification: only bureau
variables
Include variable indicating
counseling delivery channel was in person
Include additional variables
obtained during counseling
session
Bankruptcy risk score (in 100s) -0.0239*** -0.0239*** -0.0230***(15.57) (15.56) (14.98)
Bankruptcy score in bottom 10% of combined sample -0.0192*** -0.0193*** -0.0192***(3.93) (3.94) (3.91)
Bankruptcy score in top 10% of combined sample -0.1196*** -0.1188** -0.1182**(2.60) (2.56) (2.56)
Delinquency risk score (in 100s) 0.0368*** 0.0368*** 0.0341***(10.09) (10.09) (9.28)
Delinquency score in bottom 10% of combined sample 0.0211*** 0.0207*** 0.0169**(3.00) (2.94) (2.41)
Delinquency score in top 10% of combined sample -0.1112*** -0.1107*** -0.1064***(3.33) (3.30) (3.13)
Total number of trades with balance > 0 0.0042*** 0.0042*** 0.0043***(5.54) (5.48) (5.55)
Total balance, non-mortgage trades (in 10,000s) 0.0058*** 0.0058*** 0.0049***(10.83) (10.84) (8.97)
Total balance, mortgages (in 10,000s) 0.0001 0.0001 -0.0004(0.57) (0.56) (1.45)
Number of bankcard trades 0.0008* 0.0009* 0.0003(1.85) (1.94) (0.73)
Proportion of bankcard trades with balance over 50% of limit 0.0041 0.0043 0.0017(0.53) (0.56) (0.23)
Number of non-inst trades over 50 % of limit 0.0042*** 0.0042*** 0.0033***(3.98) (3.96) (3.07)
Number of trades 30 or more days past due in last 18 mths -0.0039*** -0.0039*** -0.0041***(4.87) (4.88) (5.11)
Number of currently past due balances 0.0131*** 0.0131*** 0.0128***(9.79) (9.78) (9.61)
Number of inquiries in last 6 months 0.0073*** 0.0073*** 0.0073***(11.52) (11.51) (11.59)
Highest retail credit limit (in 1,000s) 0.0031*** 0.0031*** 0.0025***(3.33) (3.34) (2.70)
Counseling in person (alternative is telephone) 0.0131** 0.0176***(2.54) (3.28)
Counseling Interview: Number of unsecured creditors 0.0019***(3.77)
Counseling interview: Total unsecured debt in $1,000 0.0006***(8.26)
Log of counselor experience (in months) -0.0044*(1.71)
Number of Observations 49046 49046 49046
Table 22A: Effect of Counseling Channel (Telephone versus In Person) on the Likelihood of Bankruptcy During Two Years Following Counseling Event (Probit
Model)
Excluded from our analysis are individuals counseled using the internet. Control variables for the individual agencies as well as variables indicating missing values for data obtained during the counseling session are included in the analysis but not reported. Only individuals who had no public record of bankruptcy filings in 2003 are included in the sample.
Coefficients indicate marginal effects; * significant at 10%; ** significant at 5%; *** significant at 1%
Full Sample (Ten Agencies)
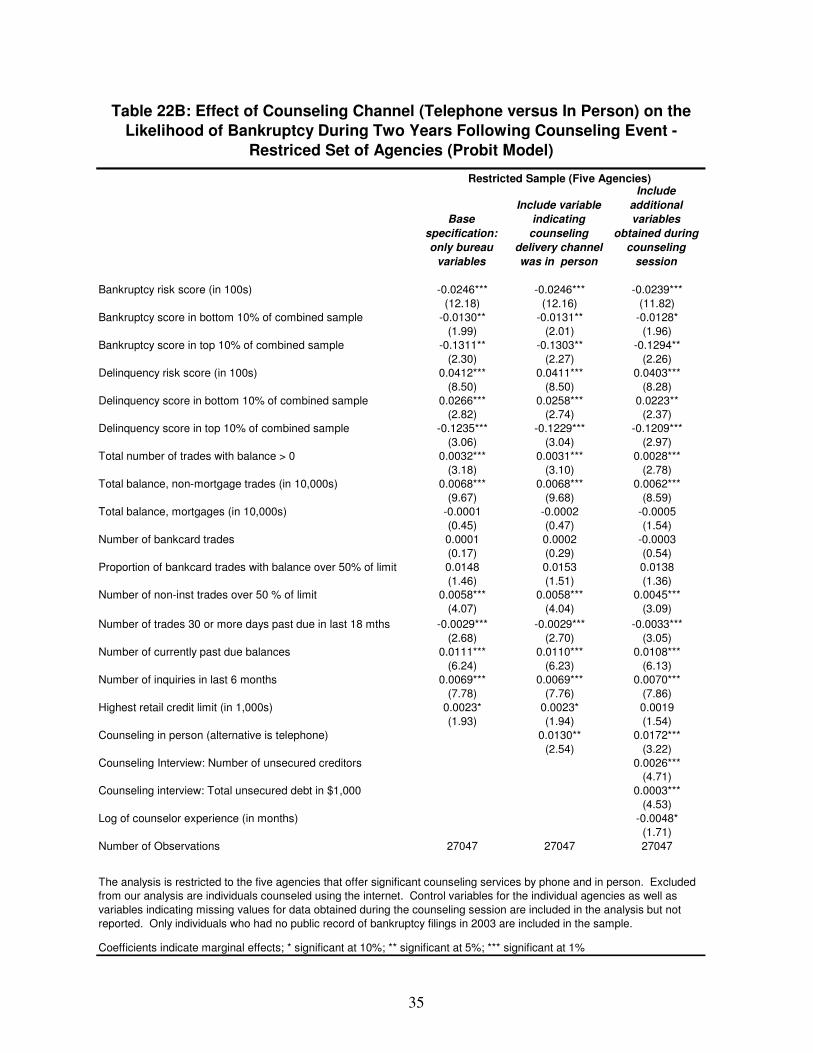
35
Base specification: only bureau
variables
Include variable indicating
counseling delivery channel was in person
Include additional variables
obtained during counseling
session
Bankruptcy risk score (in 100s) -0.0246*** -0.0246*** -0.0239***(12.18) (12.16) (11.82)
Bankruptcy score in bottom 10% of combined sample -0.0130** -0.0131** -0.0128*(1.99) (2.01) (1.96)
Bankruptcy score in top 10% of combined sample -0.1311** -0.1303** -0.1294**(2.30) (2.27) (2.26)
Delinquency risk score (in 100s) 0.0412*** 0.0411*** 0.0403***(8.50) (8.50) (8.28)
Delinquency score in bottom 10% of combined sample 0.0266*** 0.0258*** 0.0223**(2.82) (2.74) (2.37)
Delinquency score in top 10% of combined sample -0.1235*** -0.1229*** -0.1209***(3.06) (3.04) (2.97)
Total number of trades with balance > 0 0.0032*** 0.0031*** 0.0028***(3.18) (3.10) (2.78)
Total balance, non-mortgage trades (in 10,000s) 0.0068*** 0.0068*** 0.0062***(9.67) (9.68) (8.59)
Total balance, mortgages (in 10,000s) -0.0001 -0.0002 -0.0005(0.45) (0.47) (1.54)
Number of bankcard trades 0.0001 0.0002 -0.0003(0.17) (0.29) (0.54)
Proportion of bankcard trades with balance over 50% of limit 0.0148 0.0153 0.0138(1.46) (1.51) (1.36)
Number of non-inst trades over 50 % of limit 0.0058*** 0.0058*** 0.0045***(4.07) (4.04) (3.09)
Number of trades 30 or more days past due in last 18 mths -0.0029*** -0.0029*** -0.0033***(2.68) (2.70) (3.05)
Number of currently past due balances 0.0111*** 0.0110*** 0.0108***(6.24) (6.23) (6.13)
Number of inquiries in last 6 months 0.0069*** 0.0069*** 0.0070***(7.78) (7.76) (7.86)
Highest retail credit limit (in 1,000s) 0.0023* 0.0023* 0.0019(1.93) (1.94) (1.54)
Counseling in person (alternative is telephone) 0.0130** 0.0172***(2.54) (3.22)
Counseling Interview: Number of unsecured creditors 0.0026***(4.71)
Counseling interview: Total unsecured debt in $1,000 0.0003***(4.53)
Log of counselor experience (in months) -0.0048*(1.71)
Number of Observations 27047 27047 27047
Table 22B: Effect of Counseling Channel (Telephone versus In Person) on the Likelihood of Bankruptcy During Two Years Following Counseling Event -
Restriced Set of Agencies (Probit Model)
The analysis is restricted to the five agencies that offer significant counseling services by phone and in person. Excluded from our analysis are individuals counseled using the internet. Control variables for the individual agencies as well as variables indicating missing values for data obtained during the counseling session are included in the analysis but not reported. Only individuals who had no public record of bankruptcy filings in 2003 are included in the sample.
Coefficients indicate marginal effects; * significant at 10%; ** significant at 5%; *** significant at 1%
Restricted Sample (Five Agencies)
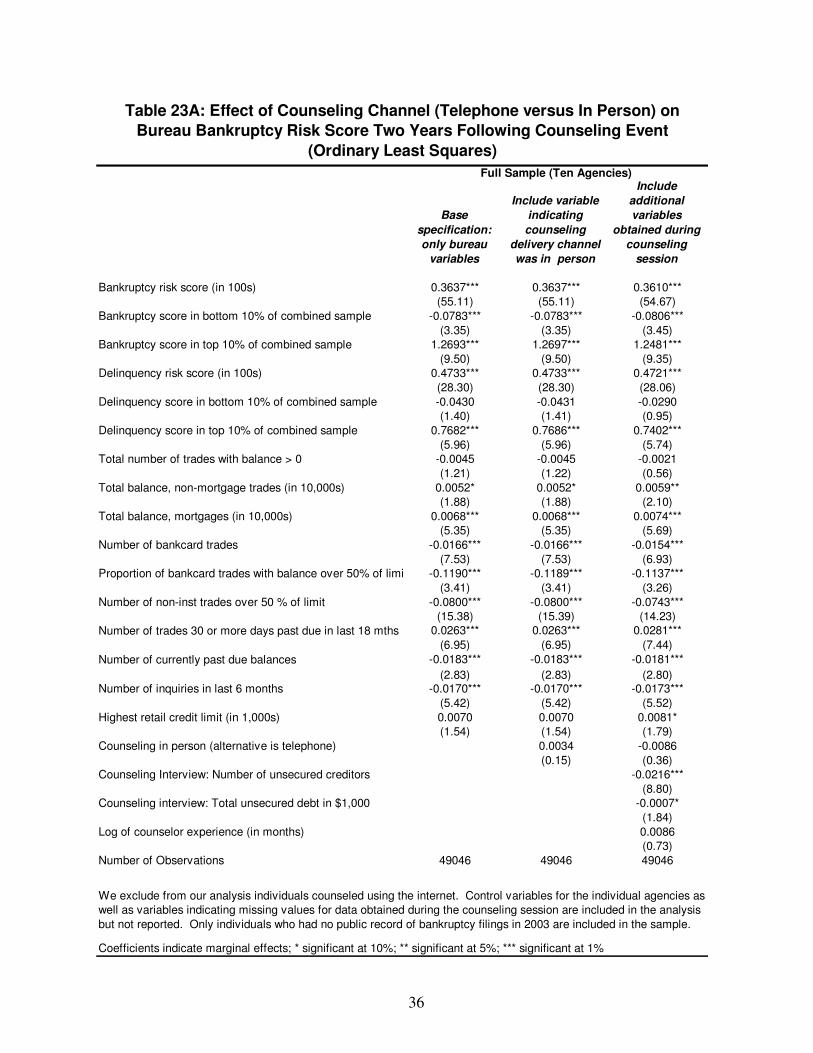
36
Base specification: only bureau
variables
Include variable indicating counseling
delivery channel was in person
Include additional variables
obtained during counseling
session
Bankruptcy risk score (in 100s) 0.3637*** 0.3637*** 0.3610***(55.11) (55.11) (54.67)
Bankruptcy score in bottom 10% of combined sample -0.0783*** -0.0783*** -0.0806***(3.35) (3.35) (3.45)
Bankruptcy score in top 10% of combined sample 1.2693*** 1.2697*** 1.2481***(9.50) (9.50) (9.35)
Delinquency risk score (in 100s) 0.4733*** 0.4733*** 0.4721***(28.30) (28.30) (28.06)
Delinquency score in bottom 10% of combined sample -0.0430 -0.0431 -0.0290(1.40) (1.41) (0.95)
Delinquency score in top 10% of combined sample 0.7682*** 0.7686*** 0.7402***(5.96) (5.96) (5.74)
Total number of trades with balance > 0 -0.0045 -0.0045 -0.0021(1.21) (1.22) (0.56)
Total balance, non-mortgage trades (in 10,000s) 0.0052* 0.0052* 0.0059**(1.88) (1.88) (2.10)
Total balance, mortgages (in 10,000s) 0.0068*** 0.0068*** 0.0074***(5.35) (5.35) (5.69)
Number of bankcard trades -0.0166*** -0.0166*** -0.0154***(7.53) (7.53) (6.93)
Proportion of bankcard trades with balance over 50% of limit -0.1190*** -0.1189*** -0.1137***(3.41) (3.41) (3.26)
Number of non-inst trades over 50 % of limit -0.0800*** -0.0800*** -0.0743***(15.38) (15.39) (14.23)
Number of trades 30 or more days past due in last 18 mths 0.0263*** 0.0263*** 0.0281***(6.95) (6.95) (7.44)
Number of currently past due balances -0.0183*** -0.0183*** -0.0181***(2.83) (2.83) (2.80)
Number of inquiries in last 6 months -0.0170*** -0.0170*** -0.0173***(5.42) (5.42) (5.52)
Highest retail credit limit (in 1,000s) 0.0070 0.0070 0.0081*(1.54) (1.54) (1.79)
Counseling in person (alternative is telephone) 0.0034 -0.0086(0.15) (0.36)
Counseling Interview: Number of unsecured creditors -0.0216***(8.80)
Counseling interview: Total unsecured debt in $1,000 -0.0007*(1.84)
Log of counselor experience (in months) 0.0086(0.73)
Number of Observations 49046 49046 49046
Coefficients indicate marginal effects; * significant at 10%; ** significant at 5%; *** significant at 1%
Table 23A: Effect of Counseling Channel (Telephone versus In Person) on Bureau Bankruptcy Risk Score Two Years Following Counseling Event
(Ordinary Least Squares)
We exclude from our analysis individuals counseled using the internet. Control variables for the individual agencies as well as variables indicating missing values for data obtained during the counseling session are included in the analysis but not reported. Only individuals who had no public record of bankruptcy filings in 2003 are included in the sample.
Full Sample (Ten Agencies)
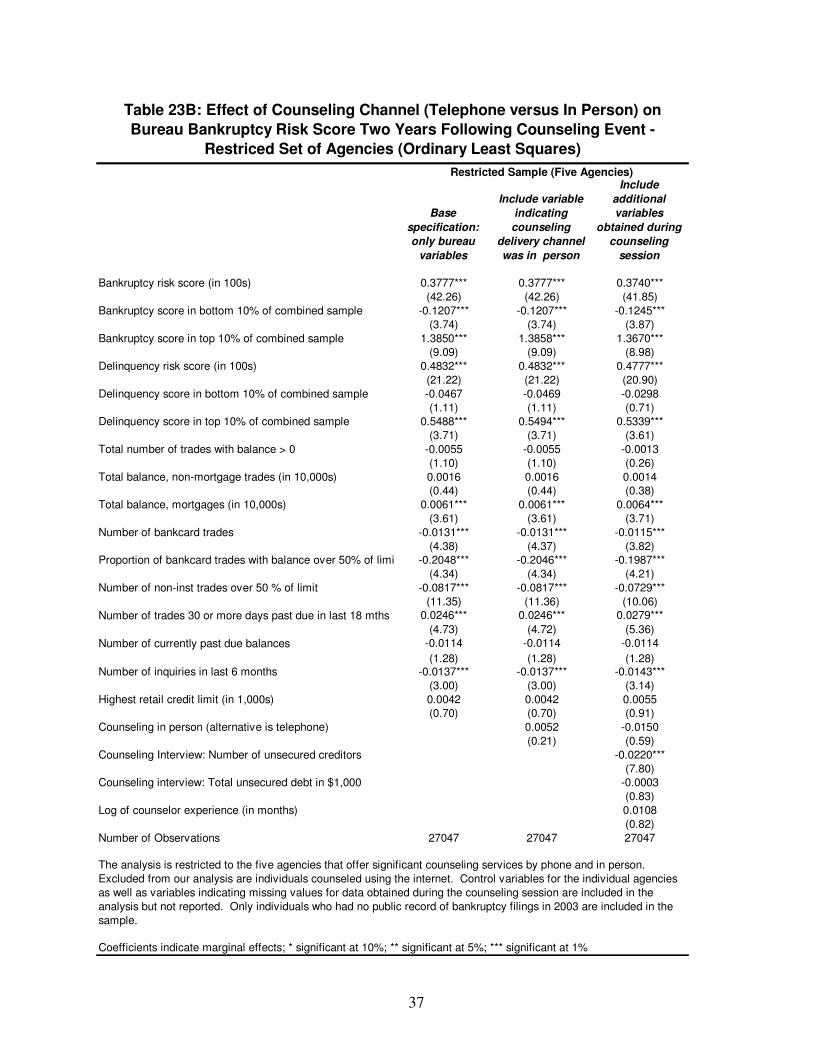
37
Base specification: only bureau
variables
Include variable indicating counseling
delivery channel was in person
Include additional variables
obtained during counseling
session
Bankruptcy risk score (in 100s) 0.3777*** 0.3777*** 0.3740***(42.26) (42.26) (41.85)
Bankruptcy score in bottom 10% of combined sample -0.1207*** -0.1207*** -0.1245***(3.74) (3.74) (3.87)
Bankruptcy score in top 10% of combined sample 1.3850*** 1.3858*** 1.3670***(9.09) (9.09) (8.98)
Delinquency risk score (in 100s) 0.4832*** 0.4832*** 0.4777***(21.22) (21.22) (20.90)
Delinquency score in bottom 10% of combined sample -0.0467 -0.0469 -0.0298(1.11) (1.11) (0.71)
Delinquency score in top 10% of combined sample 0.5488*** 0.5494*** 0.5339***(3.71) (3.71) (3.61)
Total number of trades with balance > 0 -0.0055 -0.0055 -0.0013(1.10) (1.10) (0.26)
Total balance, non-mortgage trades (in 10,000s) 0.0016 0.0016 0.0014(0.44) (0.44) (0.38)
Total balance, mortgages (in 10,000s) 0.0061*** 0.0061*** 0.0064***(3.61) (3.61) (3.71)
Number of bankcard trades -0.0131*** -0.0131*** -0.0115***(4.38) (4.37) (3.82)
Proportion of bankcard trades with balance over 50% of limit -0.2048*** -0.2046*** -0.1987***(4.34) (4.34) (4.21)
Number of non-inst trades over 50 % of limit -0.0817*** -0.0817*** -0.0729***(11.35) (11.36) (10.06)
Number of trades 30 or more days past due in last 18 mths 0.0246*** 0.0246*** 0.0279***(4.73) (4.72) (5.36)
Number of currently past due balances -0.0114 -0.0114 -0.0114(1.28) (1.28) (1.28)
Number of inquiries in last 6 months -0.0137*** -0.0137*** -0.0143***(3.00) (3.00) (3.14)
Highest retail credit limit (in 1,000s) 0.0042 0.0042 0.0055(0.70) (0.70) (0.91)
Counseling in person (alternative is telephone) 0.0052 -0.0150(0.21) (0.59)
Counseling Interview: Number of unsecured creditors -0.0220***(7.80)
Counseling interview: Total unsecured debt in $1,000 -0.0003(0.83)
Log of counselor experience (in months) 0.0108(0.82)
Number of Observations 27047 27047 27047
Coefficients indicate marginal effects; * significant at 10%; ** significant at 5%; *** significant at 1%
Table 23B: Effect of Counseling Channel (Telephone versus In Person) on Bureau Bankruptcy Risk Score Two Years Following Counseling Event -
Restriced Set of Agencies (Ordinary Least Squares)
The analysis is restricted to the five agencies that offer significant counseling services by phone and in person. Excluded from our analysis are individuals counseled using the internet. Control variables for the individual agencies as well as variables indicating missing values for data obtained during the counseling session are included in the analysis but not reported. Only individuals who had no public record of bankruptcy filings in 2003 are included in the sample.
Restricted Sample (Five Agencies)
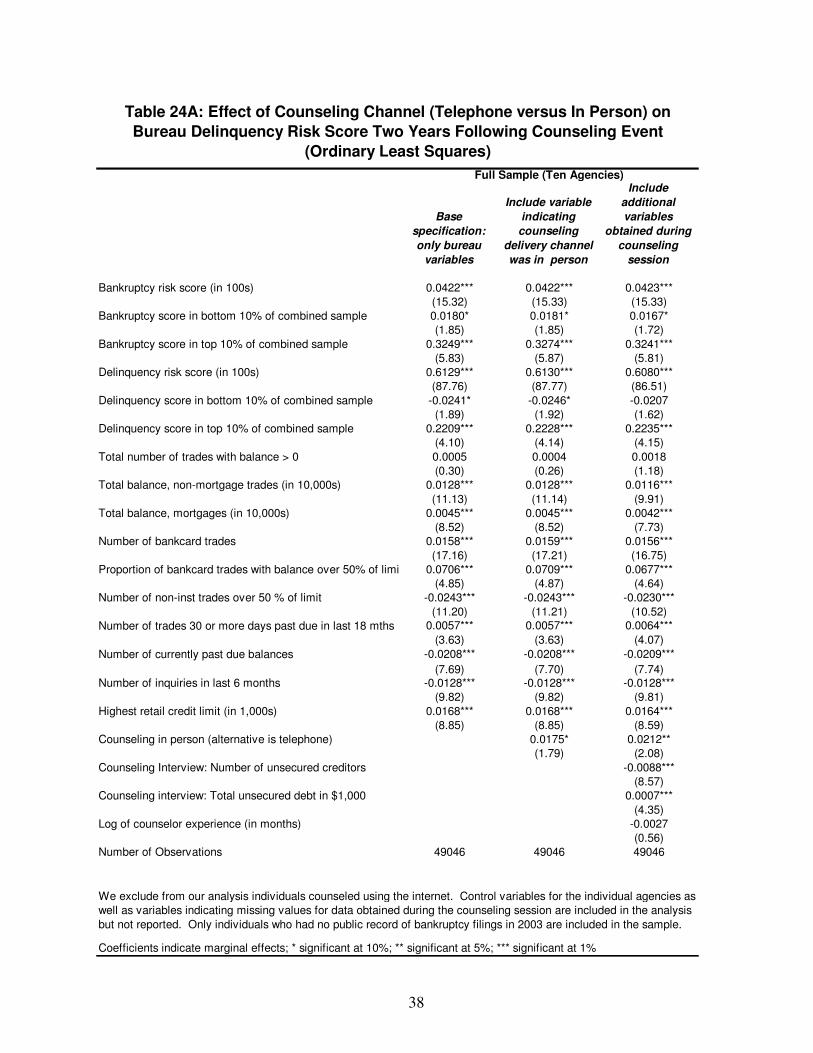
38
Base specification: only bureau
variables
Include variable indicating counseling
delivery channel was in person
Include additional variables
obtained during counseling
session
Bankruptcy risk score (in 100s) 0.0422*** 0.0422*** 0.0423***(15.32) (15.33) (15.33)
Bankruptcy score in bottom 10% of combined sample 0.0180* 0.0181* 0.0167*(1.85) (1.85) (1.72)
Bankruptcy score in top 10% of combined sample 0.3249*** 0.3274*** 0.3241***(5.83) (5.87) (5.81)
Delinquency risk score (in 100s) 0.6129*** 0.6130*** 0.6080***(87.76) (87.77) (86.51)
Delinquency score in bottom 10% of combined sample -0.0241* -0.0246* -0.0207(1.89) (1.92) (1.62)
Delinquency score in top 10% of combined sample 0.2209*** 0.2228*** 0.2235***(4.10) (4.14) (4.15)
Total number of trades with balance > 0 0.0005 0.0004 0.0018(0.30) (0.26) (1.18)
Total balance, non-mortgage trades (in 10,000s) 0.0128*** 0.0128*** 0.0116***(11.13) (11.14) (9.91)
Total balance, mortgages (in 10,000s) 0.0045*** 0.0045*** 0.0042***(8.52) (8.52) (7.73)
Number of bankcard trades 0.0158*** 0.0159*** 0.0156***(17.16) (17.21) (16.75)
Proportion of bankcard trades with balance over 50% of limit 0.0706*** 0.0709*** 0.0677***(4.85) (4.87) (4.64)
Number of non-inst trades over 50 % of limit -0.0243*** -0.0243*** -0.0230***(11.20) (11.21) (10.52)
Number of trades 30 or more days past due in last 18 mths 0.0057*** 0.0057*** 0.0064***(3.63) (3.63) (4.07)
Number of currently past due balances -0.0208*** -0.0208*** -0.0209***(7.69) (7.70) (7.74)
Number of inquiries in last 6 months -0.0128*** -0.0128*** -0.0128***(9.82) (9.82) (9.81)
Highest retail credit limit (in 1,000s) 0.0168*** 0.0168*** 0.0164***(8.85) (8.85) (8.59)
Counseling in person (alternative is telephone) 0.0175* 0.0212**(1.79) (2.08)
Counseling Interview: Number of unsecured creditors -0.0088***(8.57)
Counseling interview: Total unsecured debt in $1,000 0.0007***(4.35)
Log of counselor experience (in months) -0.0027(0.56)
Number of Observations 49046 49046 49046
Coefficients indicate marginal effects; * significant at 10%; ** significant at 5%; *** significant at 1%
Table 24A: Effect of Counseling Channel (Telephone versus In Person) on Bureau Delinquency Risk Score Two Years Following Counseling Event
(Ordinary Least Squares)
We exclude from our analysis individuals counseled using the internet. Control variables for the individual agencies as well as variables indicating missing values for data obtained during the counseling session are included in the analysis but not reported. Only individuals who had no public record of bankruptcy filings in 2003 are included in the sample.
Full Sample (Ten Agencies)
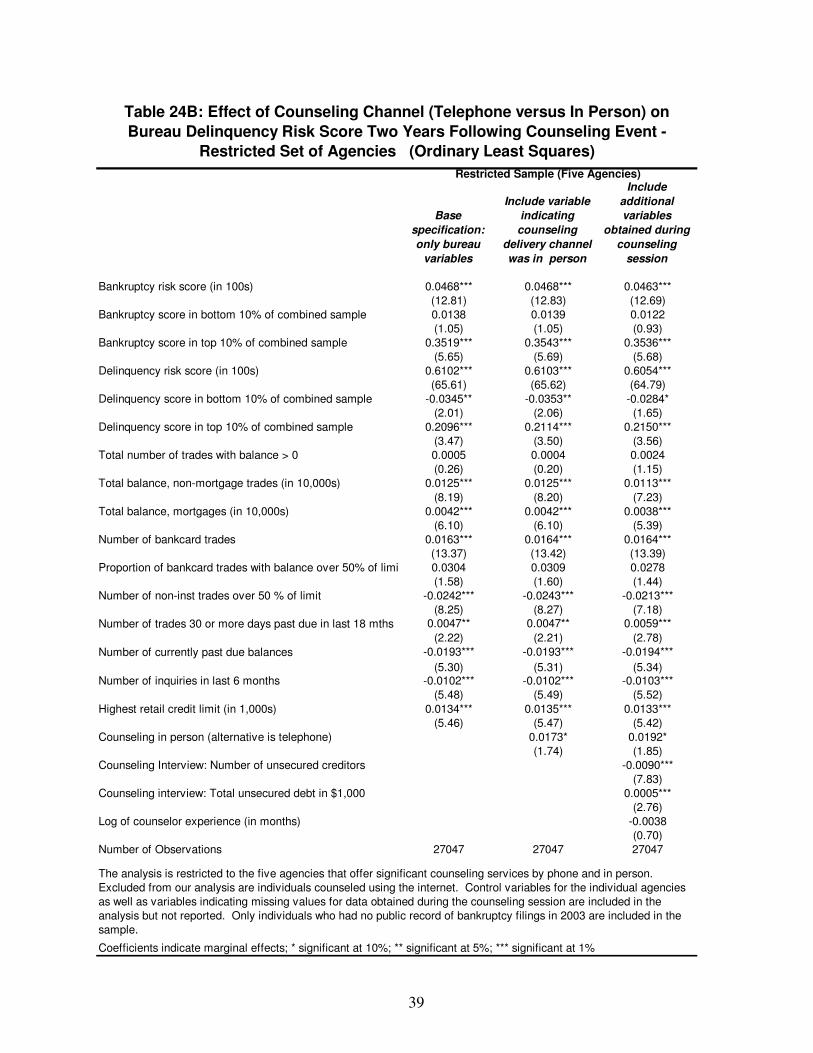
39
Base specification: only bureau
variables
Include variable indicating counseling
delivery channel was in person
Include additional variables
obtained during counseling
session
Bankruptcy risk score (in 100s) 0.0468*** 0.0468*** 0.0463***(12.81) (12.83) (12.69)
Bankruptcy score in bottom 10% of combined sample 0.0138 0.0139 0.0122(1.05) (1.05) (0.93)
Bankruptcy score in top 10% of combined sample 0.3519*** 0.3543*** 0.3536***(5.65) (5.69) (5.68)
Delinquency risk score (in 100s) 0.6102*** 0.6103*** 0.6054***(65.61) (65.62) (64.79)
Delinquency score in bottom 10% of combined sample -0.0345** -0.0353** -0.0284*(2.01) (2.06) (1.65)
Delinquency score in top 10% of combined sample 0.2096*** 0.2114*** 0.2150***(3.47) (3.50) (3.56)
Total number of trades with balance > 0 0.0005 0.0004 0.0024(0.26) (0.20) (1.15)
Total balance, non-mortgage trades (in 10,000s) 0.0125*** 0.0125*** 0.0113***(8.19) (8.20) (7.23)
Total balance, mortgages (in 10,000s) 0.0042*** 0.0042*** 0.0038***(6.10) (6.10) (5.39)
Number of bankcard trades 0.0163*** 0.0164*** 0.0164***(13.37) (13.42) (13.39)
Proportion of bankcard trades with balance over 50% of limit 0.0304 0.0309 0.0278(1.58) (1.60) (1.44)
Number of non-inst trades over 50 % of limit -0.0242*** -0.0243*** -0.0213***(8.25) (8.27) (7.18)
Number of trades 30 or more days past due in last 18 mths 0.0047** 0.0047** 0.0059***(2.22) (2.21) (2.78)
Number of currently past due balances -0.0193*** -0.0193*** -0.0194***(5.30) (5.31) (5.34)
Number of inquiries in last 6 months -0.0102*** -0.0102*** -0.0103***(5.48) (5.49) (5.52)
Highest retail credit limit (in 1,000s) 0.0134*** 0.0135*** 0.0133***(5.46) (5.47) (5.42)
Counseling in person (alternative is telephone) 0.0173* 0.0192*(1.74) (1.85)
Counseling Interview: Number of unsecured creditors -0.0090***(7.83)
Counseling interview: Total unsecured debt in $1,000 0.0005***(2.76)
Log of counselor experience (in months) -0.0038(0.70)
Number of Observations 27047 27047 27047
Coefficients indicate marginal effects; * significant at 10%; ** significant at 5%; *** significant at 1%
Table 24B: Effect of Counseling Channel (Telephone versus In Person) on Bureau Delinquency Risk Score Two Years Following Counseling Event -
Restricted Set of Agencies (Ordinary Least Squares)
The analysis is restricted to the five agencies that offer significant counseling services by phone and in person. Excluded from our analysis are individuals counseled using the internet. Control variables for the individual agencies as well as variables indicating missing values for data obtained during the counseling session are included in the analysis but not reported. Only individuals who had no public record of bankruptcy filings in 2003 are included in the sample.
Restricted Sample (Five Agencies)
40
1. The predictive value of the counselor’s recommendation The previous models assume that risk scores and other credit bureau information, supplemented with counseling interview data, are sufficient to identify factors other than counseling that could affect subsequent bankruptcy experience and future risk scores. However, we have additional information on the financial situation of the individual seeking counseling that can be summarized by the counselor’s outcome recommendation. Insights gained through the counseling interview presumably convey at least some of the client’s private information about financial circumstances that is not otherwise observable through credit report data. Presumably, that information would influence the counselor’s recommended plan of action. To see if such information is important, Table 25 adds to the specification in Tables 22A, 23A, and 24A (third columns) “evaluation” variables that indicate the recommendation of the counselor. The counselor can recommend a debt management plan (DMP), financial counseling/referral, or that the individual can self-manage the situation. Cases in the excluded recommendation category are those for which a recommendation was missing in the database, sometimes due to an incomplete session. We also include two additional variables indicating whether a DMP was actually started. One variable identifies cases where a DMP was recommended and started, and the second variable identified cases in which a DMP was not recommended, but was started anyway (perhaps as a result of a change in the client’s situation). The counselor’s recommendation does indeed convey information not otherwise observable through the credit report variables. Perhaps not surprisingly, individuals who are considered capable of self-management fare best in terms of the lowest incidence of a bankruptcy filing and the highest risk scores (both bankruptcy and delinquency risk scores) by 2005. Interestingly, clients for whom the counselor recommends a DMP, and who actually start payments on a plan, have a significantly lower incidence of bankruptcy and higher risk scores two years later. Those who fare worst are individuals who are referred to other agencies or services (including legal services), consistent with the identification of problems sufficiently serious to need other assistance. Controlling for the different circumstances of individuals as reflected in different counselor recommendations, it remains the case that face-to-face clients have, at best, no statistically significant difference in outcome from telephone clients (delinquency risk score in 2005), and in terms of bankruptcy incidence and subsequent bankruptcy risk, in-person clients fare worse than those who received telephone counseling. Additional specifications that also included geographic controls (namely, variables indicating the state of residence of the individual) provide the same results. Some exploratory analysis was conducted to consider separately each of the five agencies that offered substantial counseling both by telephone and in person. This analysis is confidential, for the agencies are not pooled. The analysis indicates that the result that clients counseled in-person were more likely to declare bankruptcy during the subsequent two years was found in three of the five agencies. For the remaining two agencies, there was no significant difference in the bankruptcy incidence for clients counseled in person vs. by telephone. Interestingly, for
41
three of the five agencies, having a client start payments on a DMP significantly reduced the incidence of bankruptcy over the subsequent two years. It appears that the role of DMPs in improving clients’ post-counseling credit profile and experience is worth exploring in greater detail in the next phase of this project. 2. Alternative measures of client performance after counseling Table 26 considers two additional measures of client performance two years after counseling, namely, total dollar balances for non-mortgage debt and the number of trades (accounts) that were 30 or more days delinquent during the previous 18 months, both measured as of 2005. Table 26 also includes the estimates for bankruptcy incidence during the two years following counseling, for comparative purposes. Total non-mortgage balances do not seem to be affected by the counseling delivery channel. However, individuals who experience face-to-face counseling do better in terms of a reduced number of recent delinquencies two years later
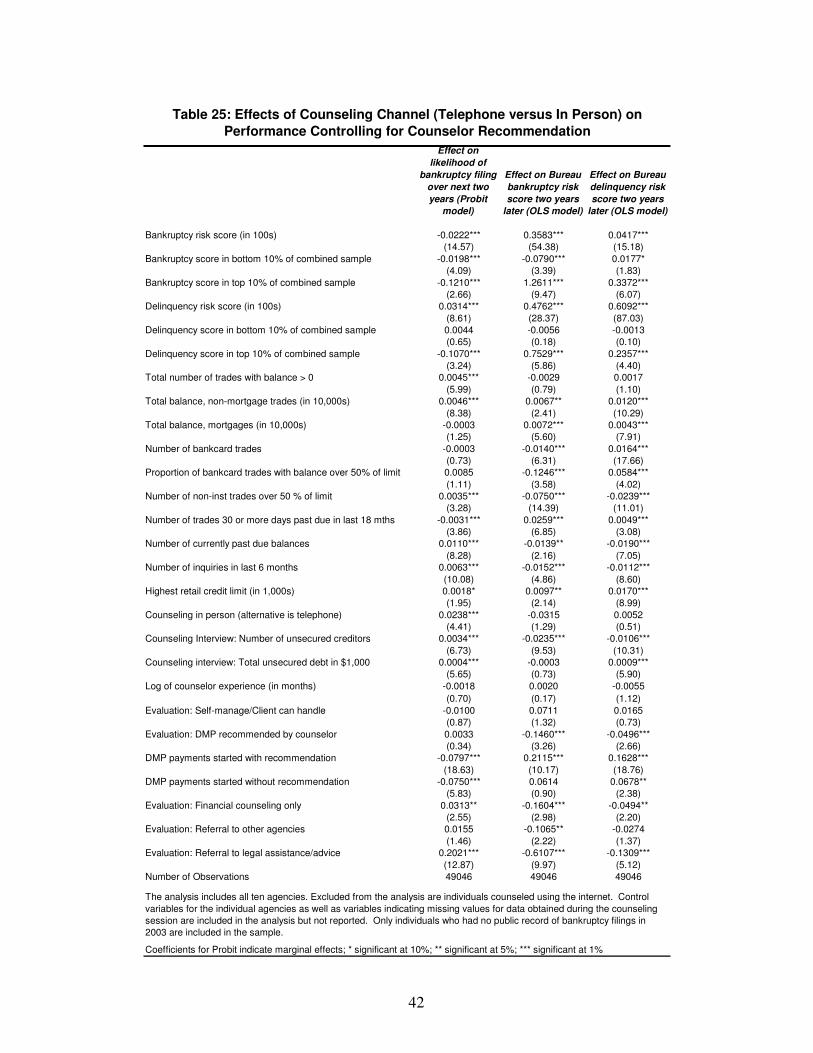
42
Effect on likelihood of
bankruptcy filing over next two years (Probit
model)
Effect on Bureau bankruptcy risk score two years
later (OLS model)
Effect on Bureau delinquency risk score two years
later (OLS model)
Bankruptcy risk score (in 100s) -0.0222*** 0.3583*** 0.0417***(14.57) (54.38) (15.18)
Bankruptcy score in bottom 10% of combined sample -0.0198*** -0.0790*** 0.0177*(4.09) (3.39) (1.83)
Bankruptcy score in top 10% of combined sample -0.1210*** 1.2611*** 0.3372***(2.66) (9.47) (6.07)
Delinquency risk score (in 100s) 0.0314*** 0.4762*** 0.6092***(8.61) (28.37) (87.03)
Delinquency score in bottom 10% of combined sample 0.0044 -0.0056 -0.0013(0.65) (0.18) (0.10)
Delinquency score in top 10% of combined sample -0.1070*** 0.7529*** 0.2357***(3.24) (5.86) (4.40)
Total number of trades with balance > 0 0.0045*** -0.0029 0.0017(5.99) (0.79) (1.10)
Total balance, non-mortgage trades (in 10,000s) 0.0046*** 0.0067** 0.0120***(8.38) (2.41) (10.29)
Total balance, mortgages (in 10,000s) -0.0003 0.0072*** 0.0043***(1.25) (5.60) (7.91)
Number of bankcard trades -0.0003 -0.0140*** 0.0164***(0.73) (6.31) (17.66)
Proportion of bankcard trades with balance over 50% of limit 0.0085 -0.1246*** 0.0584***(1.11) (3.58) (4.02)
Number of non-inst trades over 50 % of limit 0.0035*** -0.0750*** -0.0239***(3.28) (14.39) (11.01)
Number of trades 30 or more days past due in last 18 mths -0.0031*** 0.0259*** 0.0049***(3.86) (6.85) (3.08)
Number of currently past due balances 0.0110*** -0.0139** -0.0190***(8.28) (2.16) (7.05)
Number of inquiries in last 6 months 0.0063*** -0.0152*** -0.0112***(10.08) (4.86) (8.60)
Highest retail credit limit (in 1,000s) 0.0018* 0.0097** 0.0170***(1.95) (2.14) (8.99)
Counseling in person (alternative is telephone) 0.0238*** -0.0315 0.0052(4.41) (1.29) (0.51)
Counseling Interview: Number of unsecured creditors 0.0034*** -0.0235*** -0.0106***(6.73) (9.53) (10.31)
Counseling interview: Total unsecured debt in $1,000 0.0004*** -0.0003 0.0009***(5.65) (0.73) (5.90)
Log of counselor experience (in months) -0.0018 0.0020 -0.0055(0.70) (0.17) (1.12)
Evaluation: Self-manage/Client can handle -0.0100 0.0711 0.0165(0.87) (1.32) (0.73)
Evaluation: DMP recommended by counselor 0.0033 -0.1460*** -0.0496***(0.34) (3.26) (2.66)
DMP payments started with recommendation -0.0797*** 0.2115*** 0.1628***(18.63) (10.17) (18.76)
DMP payments started without recommendation -0.0750*** 0.0614 0.0678**(5.83) (0.90) (2.38)
Evaluation: Financial counseling only 0.0313** -0.1604*** -0.0494**(2.55) (2.98) (2.20)
Evaluation: Referral to other agencies 0.0155 -0.1065** -0.0274(1.46) (2.22) (1.37)
Evaluation: Referral to legal assistance/advice 0.2021*** -0.6107*** -0.1309***(12.87) (9.97) (5.12)
Number of Observations 49046 49046 49046
Table 25: Effects of Counseling Channel (Telephone versus In Person) on Performance Controlling for Counselor Recommendation
The analysis includes all ten agencies. Excluded from the analysis are individuals counseled using the internet. Control variables for the individual agencies as well as variables indicating missing values for data obtained during the counseling session are included in the analysis but not reported. Only individuals who had no public record of bankruptcy filings in 2003 are included in the sample.
Coefficients for Probit indicate marginal effects; * significant at 10%; ** significant at 5%; *** significant at 1%
43
Effect on likelihood of
bankruptcy filing over next two years (Probit
model)
Effect on Total Non-Mortgage Balances two
years later (OLS model)
Effect on Number of Trades 30+
delinquent Over Prior 18 Months two years later (OLS model)
Bankruptcy risk score (in 100s) -0.0222*** 0.0972*** -0.0579***(14.57) (10.38) (5.50)
Bankruptcy score in bottom 10% of combined sample -0.0198*** -0.0324 -0.1835***(4.09) (0.98) (4.92)
Bankruptcy score in top 10% of combined sample -0.1210*** -0.1384 0.3294(2.66) (0.73) (1.55)
Delinquency risk score (in 100s) 0.0314*** -0.0499** -0.5026***(8.61) (2.09) (18.71)
Delinquency score in bottom 10% of combined sample 0.0044 0.0370 -1.0287***(0.65) (0.85) (20.98)
Delinquency score in top 10% of combined sample -0.1070*** -0.2442 0.3242(3.24) (1.34) (1.58)
Total number of trades with balance > 0 0.0045*** 0.1646*** 0.2204***(5.99) (31.38) (37.34)
Total balance, non-mortgage trades (in 10,000s) 0.0046*** 0.3779*** -0.0080*(8.38) (94.84) (1.79)
Total balance, mortgages (in 10,000s) -0.0003 0.0220*** 0.0150***(1.25) (11.97) (7.23)
Number of bankcard trades -0.0003 0.0049 -0.0123***(0.73) (1.54) (3.47)
Proportion of bankcard trades with balance over 50% of limit 0.0085 0.3587*** -0.1102**(1.11) (7.24) (1.98)
Number of non-inst trades over 50 % of limit 0.0035*** -0.2096*** 0.0848***(3.28) (28.30) (10.17)
Number of trades 30 or more days past due in last 18 mths -0.0031*** 0.0230*** 0.1732***(3.86) (4.28) (28.66)
Number of currently past due balances 0.0110*** -0.1036*** 0.0164(8.28) (11.29) (1.59)
Number of inquiries in last 6 months 0.0063*** 0.0033 0.0379***(10.08) (0.75) (7.57)
Highest retail credit limit (in 1,000s) 0.0018* -0.0344*** -0.0179**(1.95) (5.32) (2.45)
Counseling in person (alternative is telephone) 0.0238*** -0.0343 -0.0909**(4.41) (0.99) (2.32)
Counseling Interview: Number of unsecured creditors 0.0034*** -0.0004 0.0272***(6.73) (0.10) (6.89)
Counseling interview: Total unsecured debt in $1,000 0.0004*** -0.0020*** -0.0033***(5.65) (3.89) (5.80)
Log of counselor experience (in months) -0.0018 -0.0282* -0.0060(0.70) (1.70) (0.32)
Evaluation: Self-manage/Client can handle -0.0100 0.1101 0.0514(0.87) (1.44) (0.60)
Evaluation: DMP recommended by counselor 0.0033 0.0484 0.1926***(0.34) (0.76) (2.69)
DMP payments started with recommendation -0.0797*** -0.0096 -0.2399***(18.63) (0.33) (7.21)
DMP payments started without recommendation -0.0750*** -0.1424 -0.0482(5.83) (1.47) (0.44)
Evaluation: Financial counseling only 0.0313** -0.0136 0.1654*(2.55) (0.18) (1.92)
Evaluation: Referral to other agencies 0.0155 -0.0765 0.1215(1.46) (1.12) (1.58)
Evaluation: Referral to legal assistance/advice 0.2021*** -0.6791*** -0.1844*(12.87) (7.80) (1.88)
Number of Observations 49046 49046 49046
Table 26: Effects of Counseling Channel (Telephone versus In Person) on Alternative Performance Measures Controlling for Counselor Recommendation
We exclude from our analysis individuals counseled using the internet. Control variables for the individual agencies as well as variables indicating missing values for data obtained during the counseling session are included in the analysis but not reported. Only individuals who had no public record of bankruptcy filings in 2003 are included in the sample.
Coefficients for Probit indicate marginal effects; * significant at 10%; ** at 5%; *** at 1%
44
3. Predictive value of clients’ primary cause of financial difficulty During the counseling interview, a reason is typically identified as a prime source for the financial difficulties faced by the client. Such primary causes were listed in Tables 5 and 6. It may be that the subsequent performance of the individual is related to the cause. To see if this is the case, Table 27 displays estimates similar to Table 26 but with the inclusion of various “reasons.” In fact, the information collected during the counseling interview regarding primary cause of difficulty is predictive, especially after controlling for the full set of variables in the model. For example, income loss/instability raises the risk of bankruptcy during the next two years, even after controlling for the client’s bankruptcy risk score (second column). It also lowers the client’s bankruptcy and delinquency risk scores measured two years later (third and fourth columns). Two key findings remain robust. First, in-person clients have a higher incidence of bankruptcy following counseling, and the delivery channel has no significant impact on either of the clients’ risk scores measured two years out from counseling. Second, when a DMP is started, the client’s likelihood of bankruptcy over the next two years falls, and client risk scores tend to be higher after two years. To see if this gain to DMP counseling is related to the delivery channel, another specification of the model was estimated in which the DMP variable is interacted with a variable indicating that counseling was conducted in person. Table 28 presents the results. The results indicate no significant difference in the positive effect of engagement in a DMP across delivery channels.
45
Effect on likelihood of bankruptcy
filing over next two years
(Probit model)
Effect on likelihood of bankruptcy
filing over next two years
(Probit model)
Effect on Bureau
bankruptcy risk score two
years later (OLS model)
Effect on Bureau
delinquency risk score two
years later (OLS model)
Cause: income loss / instability 0.0059 0.0156** -0.1779*** -0.0746***(0.92) (2.34) (5.76) (5.80)
Cause: poor money management -0.0053 -0.0015 -0.0470 -0.0133(0.83) (0.23) (1.51) (1.03)
Cause: death / illness / disability 0.0071 0.0141* -0.1604*** -0.0741***(0.87) (1.70) (4.19) (4.64)
Cause: domestic issues 0.0115 0.0207** -0.2462*** -0.1150***(1.17) (2.07) (5.40) (6.05)
Cause: legal -0.0241 -0.0129 0.0530 -0.0103(0.72) (0.38) (0.35) (0.16)
Cause: expenses 0.0340 0.0465** 0.0942 -0.0022(1.47) (1.99) (0.92) (0.05)
Cause: school expenses -0.1106*** -0.0852*** 0.1295 -0.0147(5.38) (3.94) (1.33) (0.36)
Cause: substance abuse 0.0158 -0.0251 -0.0602 -0.1198(0.29) (0.51) (0.25) (1.18)
Bankruptcy risk score (in 100s) -0.0219*** 0.3565*** 0.0410***(14.36) (54.11) (14.92)
Bankruptcy score in bottom 10% of combined sample -0.0192*** -0.0822*** 0.0165*(3.95) (3.53) (1.70)
Bankruptcy score in top 10% of combined sample -0.1212*** 1.2333*** 0.3262***(2.66) (9.26) (5.87)
Delinquency risk score (in 100s) 0.0314*** 0.4746*** 0.6082***(8.62) (28.29) (86.94)
Delinquency score in bottom 10% of combined sample 0.0045 -0.0083 -0.0024(0.66) (0.27) (0.19)
Delinquency score in top 10% of combined sample -0.1067*** 0.7314*** 0.2266***(3.23) (5.69) (4.23)
Counseling in person (alternative is telephone) 0.0238*** -0.0311 0.0054(4.40) (1.27) (0.53)
Log of counselor experience (in months) -0.0023 0.0051 -0.0041(0.89) (0.44) (0.84)
Evaluation: Self-manage/Client can handle -0.0118 0.0979* 0.0290(1.01) (1.80) (1.28)
Evaluation: DMP recommended by counselor 0.0004 -0.0983** -0.0294(0.04) (2.12) (1.52)
DMP payments started with recommendation -0.0795*** 0.2110*** 0.1625***(18.60) (10.14) (18.74)
DMP payments started without recommendation -0.0742*** 0.0671 0.0694**(5.77) (0.98) (2.44)
Evaluation: Financial counseling only 0.0283** -0.1180** -0.0312(2.27) (2.16) (1.37)
Evaluation: Referral to other agencies 0.0131 -0.0715 -0.0124(1.22) (1.47) (0.61)
Evaluation: Referral to legal assistance/advice 0.1966*** -0.5596*** -0.1087***(12.33) (8.98) (4.19)
Number of Observations 49046 49046 49046 49046
Table 27: Effects of Recorded Reason for Counseling on Subsequent Performance (Compare to Table 26)
Coefficients for Probit indicate marginal effects; * significant at 10%; ** significant at 5%; *** significant at 1%
The excluded cause is other/NA. The sample and variables are like those reported in Table 26, although the results for some variables are not reported to save space.
46
Effect on likelihood of
bankruptcy filing over next two years (Probit
model)
Effect on Bureau bankruptcy risk score two years
later (OLS model)
Effect on Bureau delinquency risk score two years
later (OLS model)
Cause: income loss / instability 0.0158** -0.1780*** -0.0752***(2.38) (5.76) (5.84)
Cause: poor money management -0.0012 -0.0473 -0.0141(0.19) (1.52) (1.09)
Cause: death / illness / disability 0.0144* -0.1603*** -0.0745***(1.72) (4.18) (4.66)
Cause: domestic issues 0.0209** -0.2466*** -0.1157***(2.09) (5.41) (6.09)
Cause: legal -0.0128 0.0504 -0.0123(0.38) (0.33) (0.19)
Cause: expenses 0.0466** 0.0939 -0.0023(1.99) (0.91) (0.05)
Cause: school expenses -0.0850*** 0.1297 -0.0153(3.92) (1.34) (0.38)
Cause: substance abuse -0.0250 -0.0593 -0.1195(0.50) (0.24) (1.17)
Bankruptcy risk score (in 100s) -0.0219*** 0.3566*** 0.0410***(14.36) (54.12) (14.94)
Bankruptcy score in bottom 10% of combined sample -0.0192*** -0.0824*** 0.0164*(3.95) (3.54) (1.69)
Bankruptcy score in top 10% of combined sample -0.1211*** 1.2359*** 0.3279***(2.66) (9.28) (5.90)
Delinquency risk score (in 100s) 0.0315*** 0.4750*** 0.6084***(8.63) (28.31) (86.96)
Delinquency score in bottom 10% of combined sample 0.0045 -0.0084 -0.0024(0.65) (0.28) (0.19)
Delinquency score in top 10% of combined sample -0.1067*** 0.7360*** 0.2295***(3.23) (5.73) (4.28)
Counseling in person (alternative is telephone) 0.0259*** -0.0154 0.0117(4.39) (0.56) (1.03)
Log of counselor experience (in months) -0.0023 0.0047 -0.0043(0.90) (0.40) (0.89)
Evaluation: Self-manage/Client can handle -0.0119 0.1025* 0.0327(1.02) (1.89) (1.45)
Evaluation: DMP recommended by counselor 0.0005 -0.0844* -0.0199(0.05) (1.84) (1.04)
DMP started with in-person counseling at outset -0.0777*** 0.1627*** 0.1410***(11.55) (4.52) (9.39)
DMP started with telephone counseling at outset -0.0762*** 0.2111*** 0.1593***(16.79) (9.47) (17.13)
Evaluation: Financial counseling only 0.0271** -0.1278** -0.0356(2.17) (2.32) (1.55)
Evaluation: Referral to other agencies 0.0132 -0.0664 -0.0091(1.23) (1.36) (0.45)
Evaluation: Referral to legal assistance/advice 0.1957*** -0.5569*** -0.1056***(12.28) (8.94) (4.06)
Number of Observations 49046 49046 49046
Table 28: Effects of Counseling Channel On Effectiveness of DMP (Compare to Table 27)
The sample and variables are like those reported in Table 27, although the results for some variables are not reported to save space.
Coefficients for Probit indicate marginal effects; * significant at 10%; ** at 5%; *** at 1%
47
Section VI: Caveats and Discussion Several caveats to these findings should be noted. First and foremost, because the sample of participating agencies was not selected to be representative of industry-wide practices, the results cannot be considered representative of the typical experience of counseled consumers nationwide. Instead, they reflect what is obtainable from a group of agencies that emphasize client education and identification of the underlying cause of financial problems. The fact that telephone and face-to-face delivery of counseling services appear to generate equivalent outcomes for consumers in this sample suggests that, when done well, the two delivery channels can be equally effective. We have presented results on four separate indicators of post-counseling outcomes for consumers, measured two years after the initial counseling visit. Two of these indicators (a commercially available bankruptcy risk score product; a commercially available new account delinquency risk score product) represent general measures of creditworthiness. Two indicators (total non-mortgage balances; number of accounts delinquent) reflect specific margins of credit usage. We also provide results on the incidence of bankruptcy during the two years following counseling. While these indicators examine the consumer’s credit experience from a variety of angles, other measures of the impact of the counseling experience would help to provide a more comprehensive picture. In particular, survey evidence on consumer attitudes, knowledge gained, and perceived financial stress, pre and post-counseling, would augment the objective measures of consumer credit performance and provide a more complete picture of counseling’s impact. It would also be helpful to extend the post-counseling observation period for the sample to see if differences emerge in the credit bureau data for telephone and face-to-face clients. For those clients for whom counseling does change their borrowing and payment behavior, two years may not be enough time for the change to be fully reflected in their credit reports and credit scores, especially if prior financial distress was severe and its impact was not yet reflected in the credit report at the time of counseling. Finally, there is some evidence that consumers’ choice of delivery channel is associated with their credit usage patterns and resulting risk profile prior to counseling. The analysis in this report accounted for these differences to the extent allowed by the available data. However, a more detail assessment of borrowers at the time of the initial counseling, either during the interview itself or through supplemental survey work, would allow for more precise controls for this self-selection. Controlling for self-selection would help determine if the equivalence in outcomes across the telephone and face-to-face delivery channels indicated equal effectiveness or was an artifact of initial client characteristics. The results on the role of Debt Management Plans are particularly intriguing, but self-selection may be partly responsible. Clients who start DMPs outperform all other counseling clients on all of our outcome measures. Admittedly, clients who were recommended for DMPs are in better financial shape than clients who do not qualify. But, the evidence also indicates that between two borrowers who are recommended for a DMP (i.e., borrowers for whom a DMP is both a workable option and the best option), the borrower who actually starts payments in a DMP fares significantly better on all outcome measures at a point two years after counseling. Perhaps there

48
is some residual self-selection effect driving this result (e.g., borrowers who make a commitment to start a DMP are more motivated to repay than borrowers that do not). Alternatively, perhaps the DMP experience itself (e.g., budgeting to make regular DMP payments; continued interaction with and reinforcement from the counseling agency) generates the improvement in the outcome indicators. Given the significantly improved credit profiles for clients who do start DMPs, this phenomenon deserves closer study. Moreover, if improvement in client credit profiles increases with the time a client stays on a DMP (not examined in Phase 1), a more careful assessment of the factors that contribute to a successful DMP, including agency procedures, seems warranted. A more detailed client profile at the outset would support analysis of whether some clients would benefit more from a particular delivery channel, as well as the factors that make a DMP more appropriate treatment for some clients as opposed to others. Both types of analysis would facilitate agency efforts to steer clients toward the most effective treatment. Consequently, we recommend development of expanded data collection procedures for a new sample of incoming clients as a core task in Phase 2 of this project.

49
Appendix: Conversion of Primary Cause Identified by Counselor Into One of Nine Categories
Summary Category Counselor Reported Primary Category
DEATH/ILLNESS/INJURY/DISABILITY ACCIDENT/DISABILITYDEATH/ILLNESS/INJURY/DISABILITY CARING FOR RELATIVES/FRIENDSDEATH/ILLNESS/INJURY/DISABILITY CATASTROPHEDEATH/ILLNESS/INJURY/DISABILITY DEATH IN FAMILYDEATH/ILLNESS/INJURY/DISABILITY DISABILITYDEATH/ILLNESS/INJURY/DISABILITY INJURY/ILLNESSDEATH/ILLNESS/INJURY/DISABILITY MEDICAL EXPENSE, ACCIDENTDEATH/ILLNESS/INJURY/DISABILITY PREGNANCY/CHILDBIRTHFRAUD/LEGAL PROBLEMS/EXPENSES FRAUD ISSUESFRAUD/LEGAL PROBLEMS/EXPENSES LEGAL PROBLEMS/EXPENSESFRAUD/LEGAL PROBLEMS/EXPENSES NSF CHECKSHOME/AUTO EXPENSES AUTO ACCIDENT/REPAIRS/MAINTENANCEHOME/AUTO EXPENSES AUTO REPAIRS/MAINTENANCEHOME/AUTO EXPENSES HABITAT FOR HUMANITYHOME/AUTO EXPENSES HOME EQUITY CONVERSION MORTGAGEHOME/AUTO EXPENSES HOME REPAIRS/MAINTENANCEHOME/AUTO EXPENSES HOUSING PROBLEMSHOME/AUTO EXPENSES INCREASED HOUSING PAYMENTHOME/AUTO EXPENSES INCRESED HOUSING PMTINCOME LOSS/INSTABILITY CHANGE IN EMPLOYMENTINCOME LOSS/INSTABILITY CHANGING EDMP AGENCYINCOME LOSS/INSTABILITY CUT IN HOURSINCOME LOSS/INSTABILITY EAGAN FLOODINCOME LOSS/INSTABILITY FAILED BUSINESSINCOME LOSS/INSTABILITY INCOME REDUCEDINCOME LOSS/INSTABILITY INSUFFICIENT INCOMEINCOME LOSS/INSTABILITY LOSS OF GOVERNMENT SUBSIDYINCOME LOSS/INSTABILITY LOW INCOMEINCOME LOSS/INSTABILITY MOVING/RELOCATION EXPENSEINCOME LOSS/INSTABILITY NEEDS MORE INCOMEINCOME LOSS/INSTABILITY PAY CUT/FURLOUGHINCOME LOSS/INSTABILITY RELOCATION/MOVEINCOME LOSS/INSTABILITY SPORADIC INCOMEINCOME LOSS/INSTABILITY UNDEREMPLOYMENTINCOME LOSS/INSTABILITY UNEMPLOYMENTMARITAL/DOMESTIC PROBLEMS/SUPPORT CHILD CARE EXPENSESMARITAL/DOMESTIC PROBLEMS/SUPPORT CHILD SUPPORT ISSUESMARITAL/DOMESTIC PROBLEMS/SUPPORT DIVORCE/SEPARATIONMARITAL/DOMESTIC PROBLEMS/SUPPORT DOMESTIC TROUBLEMARITAL/DOMESTIC PROBLEMS/SUPPORT LACK OF CHILD SUPPORTMARITAL/DOMESTIC PROBLEMS/SUPPORT MANIPULATIVE DAUGHTERMARITAL/DOMESTIC PROBLEMS/SUPPORT NO/LOST/INCREASED CHILD SUPPORTMARITAL/DOMESTIC PROBLEMS/SUPPORT NONPAYMENTMARITAL/DOMESTIC PROBLEMS/SUPPORT PERSONALMARITAL/DOMESTIC PROBLEMS/SUPPORT SPOUSE UNABLE/UNWILLING WORKMARITAL/DOMESTIC PROBLEMS/SUPPORT SPOUSE WORKING NOT COST EFFECTIVEOTHER/NA ACQUISITION OF ANOTHER AGOTHER/NA NAOTHER/NA NO CODE / OTHEROTHER/NA OTHEROTHER/NA RENT CURRENTOTHER/NA UNKNOWNPOOR MONEY MGMT ATTITUDEPOOR MONEY MGMT BUDGET ADVICE ONLYPOOR MONEY MGMT CHECKING ACCT PROBLEMSPOOR MONEY MGMT CLIENT ATTITUDEPOOR MONEY MGMT CLIENT NEEDS CONSOLIDATIOPOOR MONEY MGMT CRA ISSUEPOOR MONEY MGMT CREDITPOOR MONEY MGMT CREDIT ADVICE ONLYPOOR MONEY MGMT CREDIT REPORT COUNSELINGPOOR MONEY MGMT DELINQUENT HOUSING PAYMENPOOR MONEY MGMT DELINQUENT UTILITIESPOOR MONEY MGMT DEPLETED/NO SAVINGSPOOR MONEY MGMT FIXED INCOMEPOOR MONEY MGMT NO/DEPLETED SAVINGSPOOR MONEY MGMT POOR MONEY MGMT
Appendix A: Conversion of Primary Cause Identified by Counselor Into One of Nine Categories