Embed Size (px)
Citation preview
JOURNAL OF AFRICAN DEVELOPMENT
JAD Journal of African Development
Fall 2014 | Volume 16 #2
Credit Bureaus and Registries and Access to Finance: New Evidence from 42 African Countries
THOURAYA TRIKI1 AND OUSMAN GAJIGO2
ABSTRACT
Using new data from 42 African countries, we investigate the effects of public and private credit registries on firms’ access to finance as well as the effect of public credit registries’ design on the severity of the financing constraint. Our results show that access to finance is on average higher in countries with private credit bureaus (PCBs), relative to countries with public credit registries (PCRs) or countries with neither institution. However, there is a significant heterogeneity in access to finance among countries with PCRs as well as the design of these institutions. We find that countries with PCRs that collect positive and negative information on borrowers’ credit histories are associated with firms reporting smaller obstacles in access to finance. Likewise, we show that provision of online credit information is only beneficial when the internet penetration rate in the country is high and that reducing minimum cut-off for loan coverage by PCRs helps soften the financing constraint only when positive and negative information is provided. Keywords: credit registry, credit bureau, Africa, access to finance JEL codes: G20, G29, O16 1 Chief Country Economist, Development research department, African Development Bank 15 Avenue Du Ghana, BP 323, Belvedere, 1002 Tunis, Tunisia, Email: [email protected], Phone: +216 7110 3009 2 Principal Research Economist, Development research department, African Development Bank 15 Avenue Du Ghana, BP 323, Belvedere, 1002 Tunis, Tunisia, Email: [email protected], Phone: +216 7110 3755
73
JOURNAL OF AFRICAN DEVELOPMENT
1. INTRODUCTION
Access to finance is a major challenge, especially in emerging and
developing economies. A key factor behind the persistence of this problem is the information asymmetry between lenders and borrowers that encourages adverse selection and moral hazard. To address this information asymmetry, credit registries and bureaus have been established around the world to serve as information brokers. The reduction of information asymmetry has positive implications for relaxing credit constraints, increasing competition in the credit market and the efficient allocation of capital.
The two main kinds of institutions for collecting and sharing information on credit transactions are private credit bureaus (PCBs) and public credit registries (PCRs). PCBs are usually created by the private sector, while the PCRs are largely public institutions. This distinction is important. PCBs are likely to be created due to demand in the market for reliable credit information on borrowers. As such, their presence in an economy is in response to demand by lenders where the benefits from sharing credit transaction data exceeds the gains to relying solely on the information rent specific to one lender (Pagano and Jappelli 1993). PCRs, on the other hand, are usually public institutions created with the main goal of supervising the banking sector (Powell et al. 2004). This is particularly relevant when assessing their effects in Africa. For the countries in the 2 monetary unions in West and Central Africa, the PCRs are located at the 2 regional central banks.3 So while lenders can use the information collected by PCRs to better assess the credit-worthiness of borrowers, this is a by-product rather than the main motivation for their creation. Another key difference between the two institutions is that participation of banks in sharing information with PCRs is compulsory (Jappelli and Pagano 2002). This is not the case with PCBs, though some African governments require financial institutions to share information with PCBs. On the other hand, the coverage offered by PCBs is likely to be more comprehensive than PCRs because while the latter focuses only on
3 In our sample, these countries are Benin, Burkina Faso, Cameroon, Chad, Republic of Congo, Gabon, Guinea Bissau, Ivory Coast, Mali, Niger, Senegal and Togo. The PCR for the West African countries is controlled by the regional central bank known as the Banque centrale des Etats de l'Afrique de l'Ouest (BCEAO), the one for the Central African countries is controlled by the Banque des Etats de l'Afrique Centrale (BEAC). The main reason for the location of these PCRs at such regional institutions rather than at country level is mainly due to the fact that these central banks have supervisory oversight over the commercial banks in those monetary unions.
74
TRIKI AND GAJIGO: CREDIT BUREAUS REGISTRIES ACCESS TO FINANCE
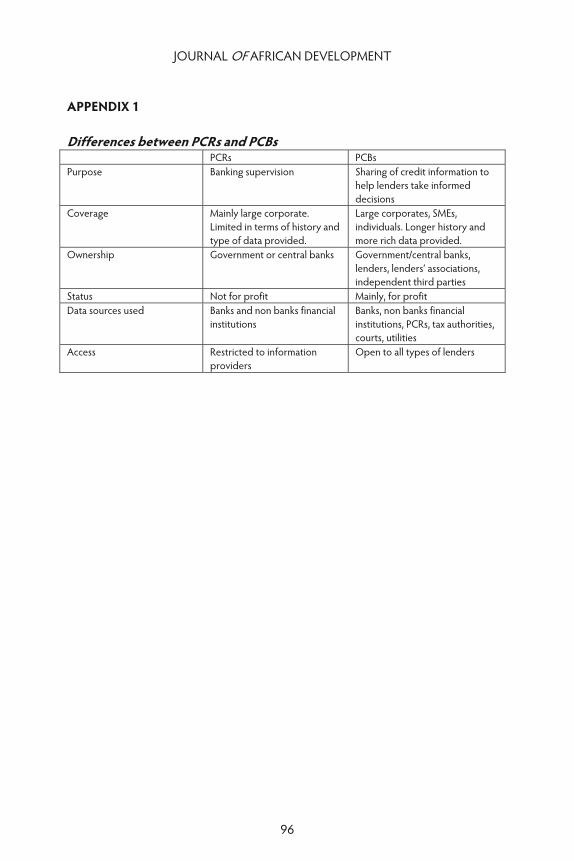
supervised financial institutions, the former can include information on credit transactions by institutions as diverse as retailers and utilities (Miller 2003). It is also worth pointing out that the design and regulation of individual PCBs and PCRs across African countries can be very different, which can influence the degree to which these institutions serve as information brokers in the credit market. Appendix 1 summarizes the main differences between PCRs and PCBs.
Our paper assesses the effects of PCB and PCR availability as well as PCR design on corporate access to finance. Limited access to finance in Africa is particularly acute (Beck et al. 2011). This has repercussions on firm’s growth and productivity (Beck et al. 2006; Dinh et al. 2010; Bigsten and Söderbom 2006) and consequently on the overall level of private sector development. Our results show that firms in countries with PCBs report relatively smaller obstacle in access to finance relative to those in countries with a PCR. However, this effect is not robust to controlling for GDP per capita and the private credit to GDP ratio, which suggests that the presence of a PCB is not exogenous. In other words, the level of financial sector development and the creation of a PCB may be simultaneously determined. We also document significant heterogeneity in PCR design among African countries. This heterogeneity has implications for the degree to which these institutions are able to reduce information asymmetry, and consequently on firms’ access to finance. Specifically, PCRs that collect both negative and positive credit information on borrowers are significantly associated with greater access to finance for firms. Likewise, we show that reducing the minimum cut-off amount for loans covered by PCRs helps soften the financing constraint only when positive and negative information is reported. Similarly, provision of online information by PCRs is only beneficial when the internet penetration rate in the country is high. Our findings are robust to controlling for GDP per capita, institutional quality and private credit to GDP ratio.
Our paper contributes to the literature by focusing on Africa, the region with the least financial development in the world. Our dataset covers 42 African countries, which represents a significant improvement in coverage of this region. For instance, only 9 African countries are covered in Barth et al. (2009), 4 in Love and Mylenko (2003) and 0 in Galindo and Miller (2001). Studying African economies is highly relevant for policy purposes. Indeed, structural characteristics of African economies have prevented many SMEs from accessing credit despite their potential to spur economic growth. According to Mckinsey (2011), Africa has between 55 to 67 million micro, small and medium enterprises
75
JOURNAL OF AFRICAN DEVELOPMENT
out of which 70% are financially underserved.4 Thus, it is value adding to study the role that credit registries and bureaus could play in alleviating the financing constraint in Africa. Further, we analyze the various characteristics of PCRs on firms’ access to finance among countries that have only this type of information sharing mechanism among lenders. To the best of our knowledge, our paper provides the first empirical evidence on the effects of PCRs’ design on firm’s access to finance. The implications of our results for the design of PCRs are particularly relevant for African countries without PCBs because they highlight the essential characteristics of credit registries relevant for reducing information asymmetry, and consequently relaxing financing constraints. The rest of the paper proceeds as follows: Section 2 reviews the relevant literature on credit bureaus and registries as well as their effects on corporate access to finance. Section 3 provides a brief summary of data and sources. The empirical model and estimation results are presented in section 4. Section 5 concludes the paper.
2. LITERATURE REVIEW
The effect of credit registries and bureaus on the credit market has been the subject of several empirical research papers in the past decade. There are two broad strands of literature that are related to our paper. One strand examines the effect of credit registries and bureaus on information sharing and the reduction of information asymmetry between lenders and borrowers. The second strand estimates the direct effect of credit registries and bureaus on credit availability at the economy or firm level. These are not mutually exclusive groups since credit availability is a consequence of the degree of the information asymmetry in the credit market.
While the consequences of information asymmetry between lenders and borrowers have long been recognized (Stiglitz and Weiss 1981), it was not until recently that the effects of specific institutions in reducing this asymmetry have been formally modeled. Pagano and Jappelli (1993) develop a theoretical model to show the endogenous development of PCBs or in general the
4 Demetriades and Fielding (2011) conclude that financial sector underdevelopment and excess liquidity observed in African banking systems are driven by the lack of developed infrastructure that would allow proper screening of borrowers rather than by the absence of credit worthy borrowers.
76
TRIKI AND GAJIGO: CREDIT BUREAUS REGISTRIES ACCESS TO FINANCE
information sharing by lenders, is driven mainly by mobility of borrowers, better information processing and the size of the credit market. They also show that the predictions of their model are consistent with some cross-country evidence. Their finding is supported by Kallberg and Udell (2003) who found that information provided by Dun & Bradstreet, a privately-run information sharing institution, is a robust predictor of business failure among US retailers. Like PCBs, publicly created and maintained credit registries can also alleviate information asymmetry. Barth et al. (2009) found that while greater information sharing reduces bank corruption, PCBs have a greater effect on this variable than PCRs.
The ultimate test of the functioning of the credit market is whether credit-constrained firms are able to access finance when they need it. At the macro level, Djankov et al. (2007) found that private credit is enhanced by the presence of both PCRs and PCBs across the 129 countries covered over 25 years in their sample. This result is consistent with Jappelli and Pagano (2002), who showed that information sharing through PCRs and PCBs increases bank lending and reduces default rates. Likewise, Singh et al. (2009) show that countries from sub-Saharan Africa that encourage credit information sharing report higher levels of credit to the private sector as a share of GDP. Using firm-level data, Love and Mylenko (2003) found that while the presence of PCBs is associated with lower obstacle to access finance, there is no such relationship in the case of PCRs. As pointed out by the authors, this finding does not conclusively show that PCBs have a causal effect on lower access to finance or that PCRs are ineffectual. PCBs are unlikely to be exogenous, as is obvious from predictions of Pagano and Jappelli (1993). For instance, the presence of a PCB is likely determined simultaneously with greater financial development, which can account for its positive relationship with firms’ access to finance.
While all credit bureaus and registries provide information to help reduce information asymmetry between lenders and borrowers, the degree to which this is achieved depends on their design and regulation. Galindo and Miller (2001) created a scalar index (summarizing several features of their design) to capture the extent to which credit registries reduce information asymmetry. Their results show that credit registries that have finer details on credit transactions (less disaggregation), collect both positive and negative payment histories and face less regulation on their ability to share credit data to financial institutions tend to reduce financial constraints in middle and high income countries.
77
JOURNAL OF AFRICAN DEVELOPMENT
3. THE DATA
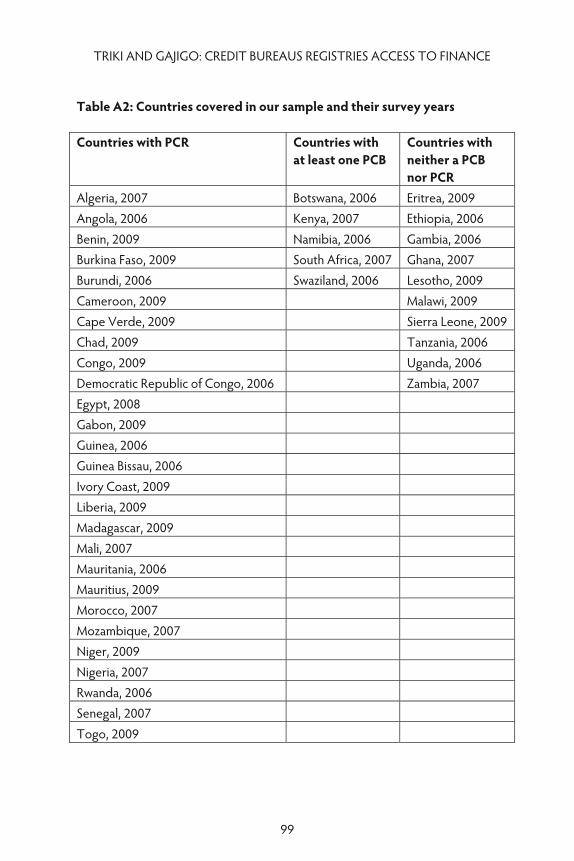
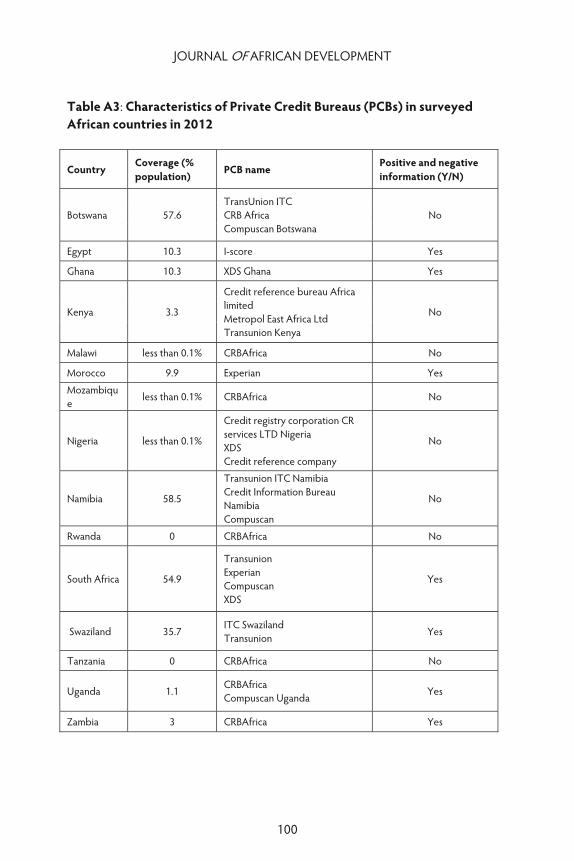
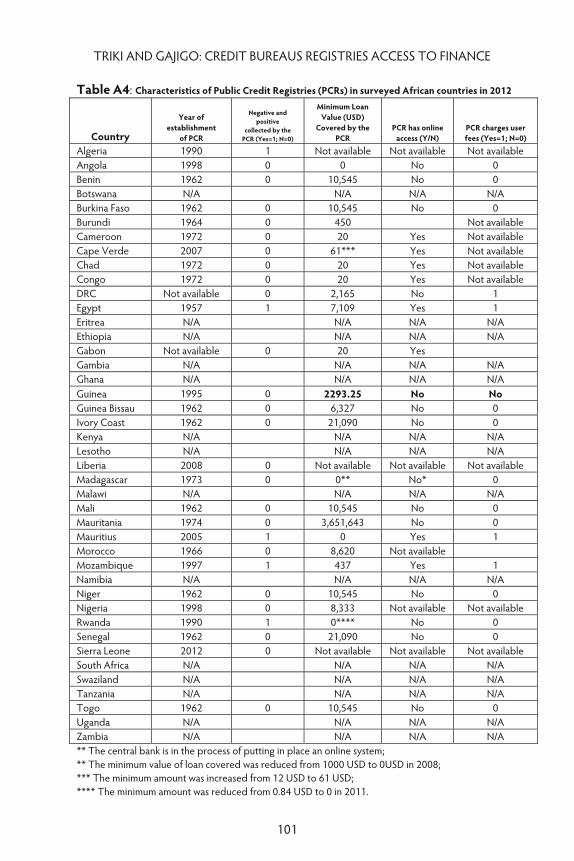
Our data comes from various sources. The firm level data comes from the World Bank Enterprise Surveys (WBES). In our sample, this covers 17,240 small, medium and large enterprises across 42 countries between 2006 and 2009. Among these countries, 27 of them have a PCR, 5 have at least one PCB and 10 countries have neither of these credit sharing institutions. All the surveys are cross-sectional, with no more than one survey per country in our sample. The actual country lists are provided in table A2 while Table A3 and A4 summarize, respectively, characteristics of PCRs and PCBs in 2012 in surveyed African countries.
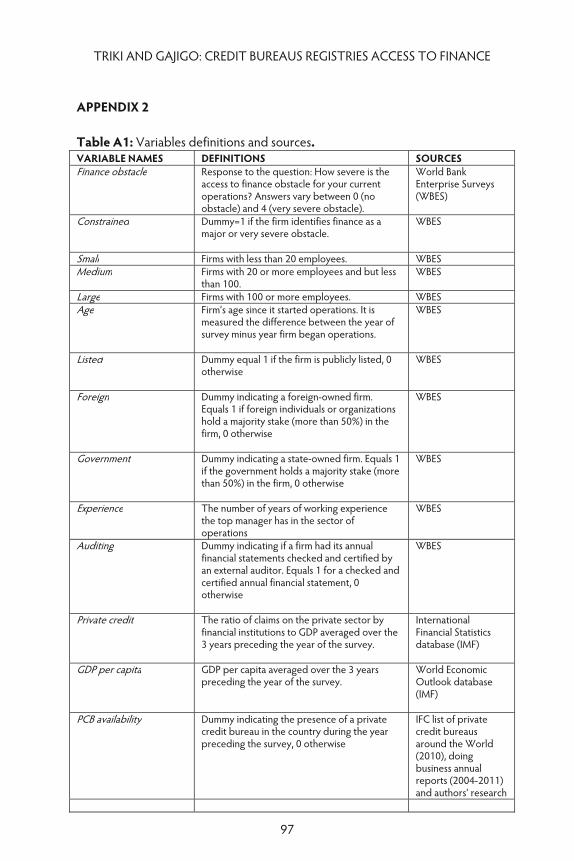
In terms of firm-level data by type of credit sharing institution, about 65% of our firm-level data fall under countries with a PCR (11,241 firms), 16% belong to countries with at least one PCB (2,696 firms) and 19% fall under countries with neither a PCR nor a PCB (3,303 firms). Notably, our sample does not contain a country that has both a PCR and PCB over the time period we cover. We complement our firm-level data with country-level information on private credit bureaus (PCBs) and public credit registries (PCRs) from Djankov et al. (2007), the doing business database and annual reports over the period 2004-2011 and the World Bank survey of credit reporting systems. This was further supplemented with primary data collected directly from African central banks. In addition, country-level macroeconomic variables from the World Development Indicators and other sources were also used. Table A1 summarizes our data sources by variable name.
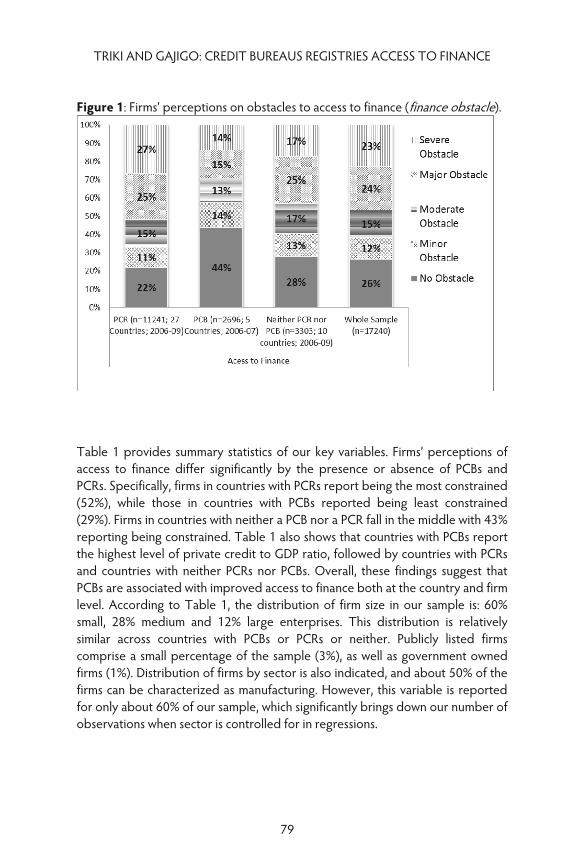
The key dependent variable in our analysis is access to finance. This is a firm-level variable that denotes firms’ subjective perception of whether they face any difficulty with access to finance (finance obstacle). The variable has five categories: 0 (no obstacle), 1 (minor obstacle), 2 (moderate obstacle), 3 (major obstacle) and 4 (severe obstacle). The distribution of this variable across countries with a PCB or a PCR or neither is presented in figure 1. If categories 0, 1 and 2 are grouped into “no obstacles in access to finance” and categories 3 and 4 are grouped into “obstacle in access to finance), then about 47% of firms can be considered constrained (constrained) while 53% are unconstrained. What stands out clearly from the figure is differences between countries with PCBs on one hand and those without. The share of firms reporting themselves as constrained in PCR countries is 23 percentage points higher than those in PCB countries, while firms in countries with neither PCR nor PCBs 13 percentage points higher.
78
TRIKI AND GAJIGO: CREDIT BUREAUS REGISTRIES ACCESS TO FINANCE
Figure 1: Firms’ perceptions on obstacles to access to finance (finance obstacle).
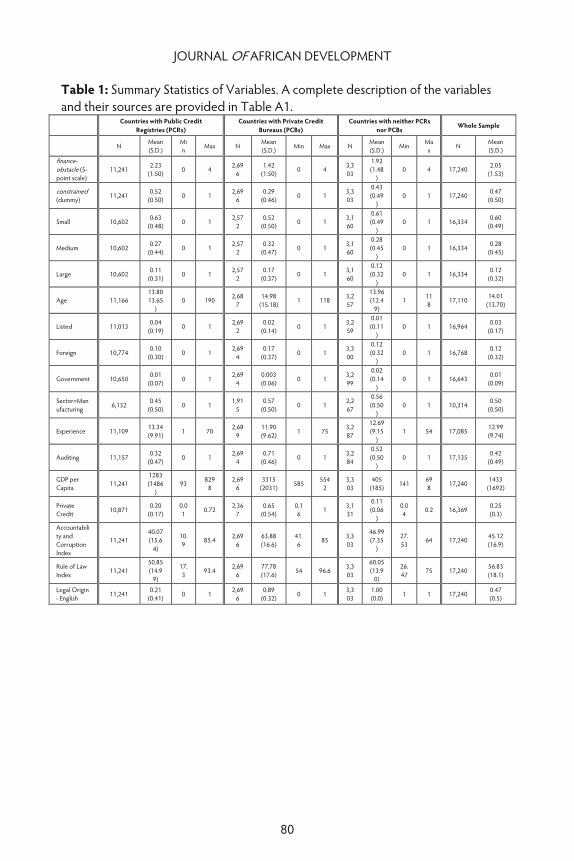
Table 1 provides summary statistics of our key variables. Firms’ perceptions of access to finance differ significantly by the presence or absence of PCBs and PCRs. Specifically, firms in countries with PCRs report being the most constrained (52%), while those in countries with PCBs reported being least constrained (29%). Firms in countries with neither a PCB nor a PCR fall in the middle with 43% reporting being constrained. Table 1 also shows that countries with PCBs report the highest level of private credit to GDP ratio, followed by countries with PCRs and countries with neither PCRs nor PCBs. Overall, these findings suggest that PCBs are associated with improved access to finance both at the country and firm level. According to Table 1, the distribution of firm size in our sample is: 60% small, 28% medium and 12% large enterprises. This distribution is relatively similar across countries with PCBs or PCRs or neither. Publicly listed firms comprise a small percentage of the sample (3%), as well as government owned firms (1%). Distribution of firms by sector is also indicated, and about 50% of the firms can be characterized as manufacturing. However, this variable is reported for only about 60% of our sample, which significantly brings down our number of observations when sector is controlled for in regressions.
79
JOURNAL OF AFRICAN DEVELOPMENT
Table 1: Summary Statistics of Variables. A complete description of the variables and their sources are provided in Table A1.
Countries with Public Credit
Registries (PCRs) Countries with Private Credit
Bureaus (PCBs) Countries with neither PCRs
nor PCBs Whole Sample
N Mean (S.D.)
Min Max N
Mean (S.D.) Min Max N
Mean (S.D.) Min
Max N
Mean (S.D.)
finance-obstacle (5-point scale)
11,241 2.23 (1.50) 0 4 2,69
6 1.42
(1.50) 0 4 3,303
1.92 (1.48
) 0 4 17,240 2.05
(1.53)
constrained (dummy) 11,241 0.52
(0.50) 0 1 2,696
0.29 (0.46) 0 1 3,3
03
0.43 (0.49
) 0 1 17,240 0.47
(0.50)
Small 10,602 0.63 (0.48) 0 1 2,57
2 0.52
(0.50) 0 1 3,160
0.61 (0.49
) 0 1 16,334 0.60
(0.49)
Medium 10,602 0.27 (0.44) 0 1 2,57
2 0.32
(0.47) 0 1 3,160
0.28 (0.45
) 0 1 16,334 0.28
(0.45)
Large 10,602 0.11 (0.31)
0 1 2,572
0.17 (0.37)
0 1 3,160
0.12 (0.32
) 0 1 16,334 0.12
(0.32)
Age 11,166 13.80 13.65
) 0 190 2,68
7 14.98
(15.18) 1 118 3,2
57
13.96 (12.4
9) 1 11
8 17,110 14.01
(13.70)
Listed 11,013 0.04 (0.19)
0 1 2,692
0.02 (0.14)
0 1 3,259
0.01 (0.11
) 0 1 16,964 0.03
(0.17)
Foreign 10,774 0.10
(0.30) 0 1 2,69
4 0.17
(0.37) 0 1 3,300
0.12 (0.32
) 0 1 16,768
0.12 (0.32)
Government 10,650 0.01
(0.07) 0 1 2,69
4 0.003 (0.06) 0 1
3,299
0.02 (0.14
) 0 1 16,643
0.01 (0.09)
Sector=Manufacturing 6,132
0.45 (0.50) 0 1
1,915
0.57 (0.50) 0 1
2,267
0.56 (0.50
) 0 1 10,314
0.50 (0.50)
Experience 11,109 13.34 (9.91) 1 70
2,689
11.90 (9.62) 1 75
3,287
12.69 (9.15
) 1 54 17,085
12.99 (9.74)
Auditing 11,157 0.32 (0.47) 0 1 2,69
4 0.71
(0.46) 0 1 3,284
0.52 (0.50
) 0 1 17,135 0.42
(0.49)
GDP per Capita 11,241
1283 (1486
) 93 829
8 2,69
6 3315
(2031) 585 5542
3,303
405 (185) 141 69
8 17,240 1433 (1692)
Private Credit 10,871 0.20
(0.17) 0.01 0.72 2,36
7 0.65
(0.54) 0.16 1 3,1
31
0.11 (0.06
)
0.04 0.2 16,369 0.25
(0.3)
Accountability and Corruption Index
11,241 40.07 (15.6
4)
10.9
85.4 2,696
63.88 (16.6)
41.6
85 3,303
46.99 (7.35
)
27.53
64 17,240 45.12 (16.9)
Rule of Law Index 11,241
50.85 (14.9
9)
17.3 93.4
2,696
77.78 (17.6) 54 96.6
3,303
60.05 (13.9
0)
26.47 75 17,240
56.83 (18.1)
Legal Origin - English 11,241 0.21
(0.41) 0 1 2,696
0.89 (0.32) 0 1 3,3
03 1.00 (0.0) 1 1 17,240 0.47
(0.5)
80
TRIKI AND GAJIGO: CREDIT BUREAUS REGISTRIES ACCESS TO FINANCE
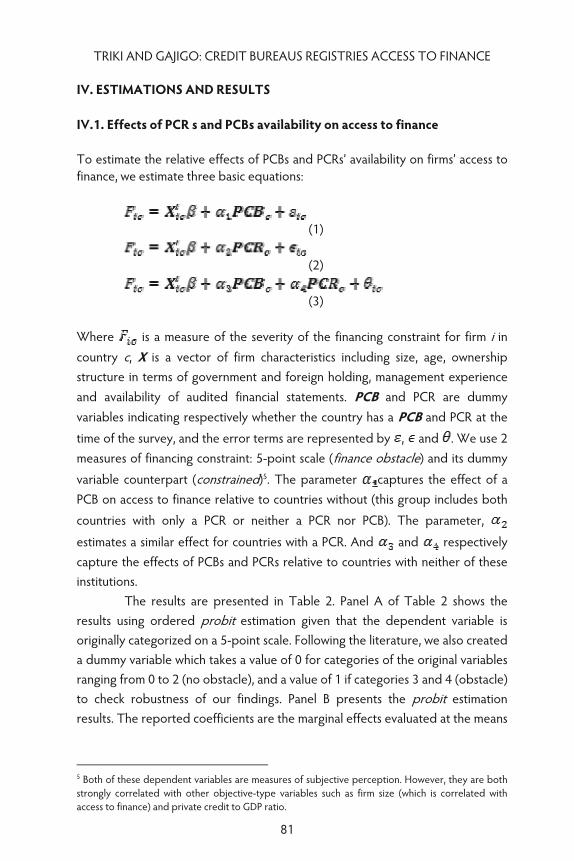
IV. ESTIMATIONS AND RESULTS IV.1. Effects of PCR s and PCBs availability on access to finance To estimate the relative effects of PCBs and PCRs’ availability on firms’ access to finance, we estimate three basic equations:
(1)
(2)
(3)
Where is a measure of the severity of the financing constraint for firm i in country c, X is a vector of firm characteristics including size, age, ownership structure in terms of government and foreign holding, management experience and availability of audited financial statements. PCB and PCR are dummy variables indicating respectively whether the country has a PCB and PCR at the time of the survey, and the error terms are represented by , and . We use 2 measures of financing constraint: 5-point scale (finance obstacle) and its dummy variable counterpart (constrained)5. The parameter captures the effect of a PCB on access to finance relative to countries without (this group includes both countries with only a PCR or neither a PCR nor PCB). The parameter,
estimates a similar effect for countries with a PCR. And and respectively capture the effects of PCBs and PCRs relative to countries with neither of these institutions.
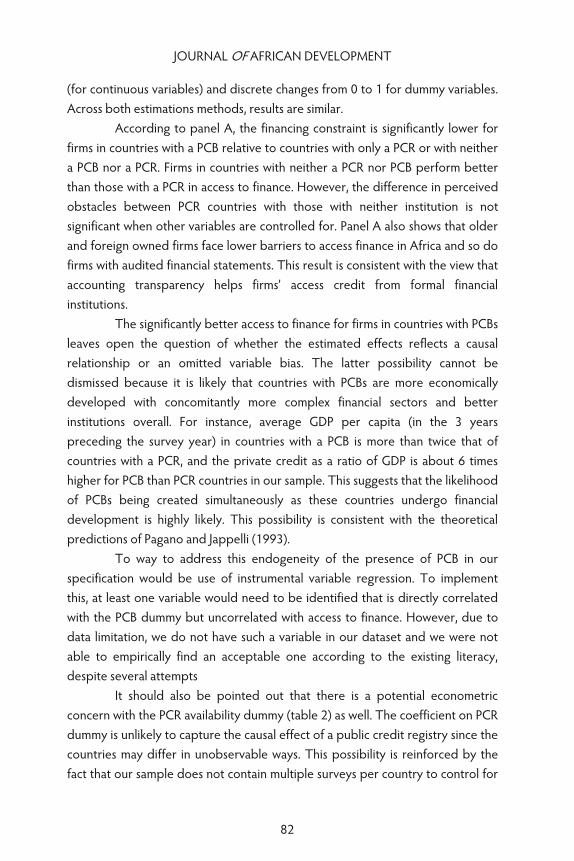
The results are presented in Table 2. Panel A of Table 2 shows the results using ordered probit estimation given that the dependent variable is originally categorized on a 5-point scale. Following the literature, we also created a dummy variable which takes a value of 0 for categories of the original variables ranging from 0 to 2 (no obstacle), and a value of 1 if categories 3 and 4 (obstacle) to check robustness of our findings. Panel B presents the probit estimation results. The reported coefficients are the marginal effects evaluated at the means
5 Both of these dependent variables are measures of subjective perception. However, they are both strongly correlated with other objective-type variables such as firm size (which is correlated with access to finance) and private credit to GDP ratio.
81
JOURNAL OF AFRICAN DEVELOPMENT
(for continuous variables) and discrete changes from 0 to 1 for dummy variables. Across both estimations methods, results are similar.
According to panel A, the financing constraint is significantly lower for firms in countries with a PCB relative to countries with only a PCR or with neither a PCB nor a PCR. Firms in countries with neither a PCR nor PCB perform better than those with a PCR in access to finance. However, the difference in perceived obstacles between PCR countries with those with neither institution is not significant when other variables are controlled for. Panel A also shows that older and foreign owned firms face lower barriers to access finance in Africa and so do firms with audited financial statements. This result is consistent with the view that accounting transparency helps firms’ access credit from formal financial institutions.
The significantly better access to finance for firms in countries with PCBs leaves open the question of whether the estimated effects reflects a causal relationship or an omitted variable bias. The latter possibility cannot be dismissed because it is likely that countries with PCBs are more economically developed with concomitantly more complex financial sectors and better institutions overall. For instance, average GDP per capita (in the 3 years preceding the survey year) in countries with a PCB is more than twice that of countries with a PCR, and the private credit as a ratio of GDP is about 6 times higher for PCB than PCR countries in our sample. This suggests that the likelihood of PCBs being created simultaneously as these countries undergo financial development is highly likely. This possibility is consistent with the theoretical predictions of Pagano and Jappelli (1993).
To way to address this endogeneity of the presence of PCB in our specification would be use of instrumental variable regression. To implement this, at least one variable would need to be identified that is directly correlated with the PCB dummy but uncorrelated with access to finance. However, due to data limitation, we do not have such a variable in our dataset and we were not able to empirically find an acceptable one according to the existing literacy, despite several attempts
It should also be pointed out that there is a potential econometric concern with the PCR availability dummy (table 2) as well. The coefficient on PCR dummy is unlikely to capture the causal effect of a public credit registry since the countries may differ in unobservable ways. This possibility is reinforced by the fact that our sample does not contain multiple surveys per country to control for
82
TRIKI AND GAJIGO: CREDIT BUREAUS REGISTRIES ACCESS TO FINANCE
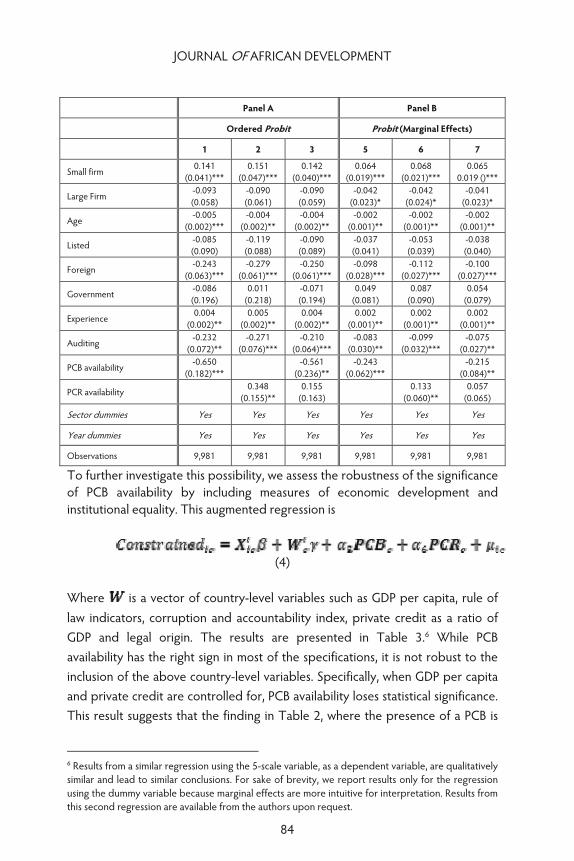
the time-invariant characteristics that could influence access to finance irrespective of the presence of a PCR. Table 2: Effects of PCRs and PCBs on access to finance in 42 African countries The dependent variable in panel A is firms’ perception on the severity of the financing constraint (finance obstacle), a 5-point scale variable: 0 (no obstacle), 1 (minor obstacle), 2 (moderate obstacle), 3 (major obstacle) and 4 (severe obstacle). The dependent variable in Panel B is a dummy variable (constrained) with a value of 1 for the preceding categories of 3 and 4, and 0 if categories 0 to 2. Small is a dummy for firms with less 20 employees; Large is a dummy for firms with at least 100 employees (the omitted category is medium-sized firms with 20 to 99 employees); Age is the firm’s age since it started operations; Listed is a dummy equal to 1 if the firm is publicly listed, 0 otherwise; Foreign is a dummy equal to 1 if the firm is foreign-owned, 0 otherwise; Government is a dummy equal to 1 if the firm is government-owned, 0 otherwise; Experience is the number of working years the top manager has in the sector; Auditing is a dummy equal to 1 if the firm had its annual financial statements certified by an external auditor, 0 otherwise; PCB availability is a dummy equal to 1 if the country has a PCB in place, 0 otherwise; PCR availability is a dummy equal to 1 if the country has a PCR in place, 0 otherwise. Robust and clustered standard errors (at country level) are in parentheses. ***, ** and * describe significance at the 1%, 5% and 10% respectively.
83
JOURNAL OF AFRICAN DEVELOPMENT
Panel A Panel B
Ordered Probit Probit (Marginal Effects)
1 2 3 5 6 7
Small firm 0.141(0.041)***
0.151(0.047)***
0.142 (0.040)***
0.064(0.019)***
0.068(0.021)***
0.0650.019 ()***
Large Firm -0.093(0.058)
-0.090(0.061)
-0.090 (0.059)
-0.042(0.023)*
-0.042(0.024)*
-0.041(0.023)*
Age -0.005
(0.002)*** -0.004
(0.002)** -0.004
(0.002)** -0.002
(0.001)** -0.002
(0.001)** -0.002
(0.001)**
Listed -0.085(0.090)
-0.119(0.088)
-0.090 (0.089)
-0.037(0.041)
-0.053(0.039)
-0.038(0.040)
Foreign -0.243(0.063)***
-0.279(0.061)***
-0.250 (0.061)***
-0.098(0.028)***
-0.112(0.027)***
-0.100(0.027)***
Government -0.086(0.196)
0.011(0.218)
-0.071 (0.194)
0.049(0.081)
0.087(0.090)
0.054(0.079)
Experience 0.004
(0.002)** 0.005
(0.002)** 0.004
(0.002)** 0.002
(0.001)** 0.002
(0.001)** 0.002
(0.001)**
Auditing -0.232
(0.072)** -0.271
(0.076)*** -0.210
(0.064)*** -0.083
(0.030)** -0.099
(0.032)*** -0.075
(0.027)**
PCB availability -0.650(0.182)***
-0.561 (0.236)**
-0.243(0.062)***
-0.215(0.084)**
PCR availability
0.348(0.155)**
0.155 (0.163)
0.133(0.060)**
0.057(0.065)
Sector dummies Yes Yes Yes Yes Yes Yes
Year dummies Yes Yes Yes Yes Yes Yes
Observations 9,981 9,981 9,981 9,981 9,981 9,981
To further investigate this possibility, we assess the robustness of the significance of PCB availability by including measures of economic development and institutional equality. This augmented regression is
(4)
Where is a vector of country-level variables such as GDP per capita, rule of law indicators, corruption and accountability index, private credit as a ratio of GDP and legal origin. The results are presented in Table 3.6 While PCB availability has the right sign in most of the specifications, it is not robust to the inclusion of the above country-level variables. Specifically, when GDP per capita and private credit are controlled for, PCB availability loses statistical significance. This result suggests that the finding in Table 2, where the presence of a PCB is
6 Results from a similar regression using the 5-scale variable, as a dependent variable, are qualitatively similar and lead to similar conclusions. For sake of brevity, we report results only for the regression using the dummy variable because marginal effects are more intuitive for interpretation. Results from this second regression are available from the authors upon request.
84
TRIKI AND GAJIGO: CREDIT BUREAUS REGISTRIES ACCESS TO FINANCE
associated with lower obstacle to access finance, is unlikely to represent a causal effect running from PCB to access to finance. The presence of a PCR continues to be unassociated with lower access to finance as in other preceding estimations.
It is important to point out that our findings are not necessary inconsistent with other papers in the literature that found a positive effect of PCBs on access to finance. For instance, Love and Mylenko (2003) found the presence of PCBs to have a significant effect on softening the financing constraint, albeit with a different sample. In fact, the significance of their PCB dummy persisted even after they controlled for country-level financial development and institutional variables similar to ours. However, even their finding does not constitute a causal relationship, which they pointed out as the endogeneity of the PCB variable could not be ruled out.
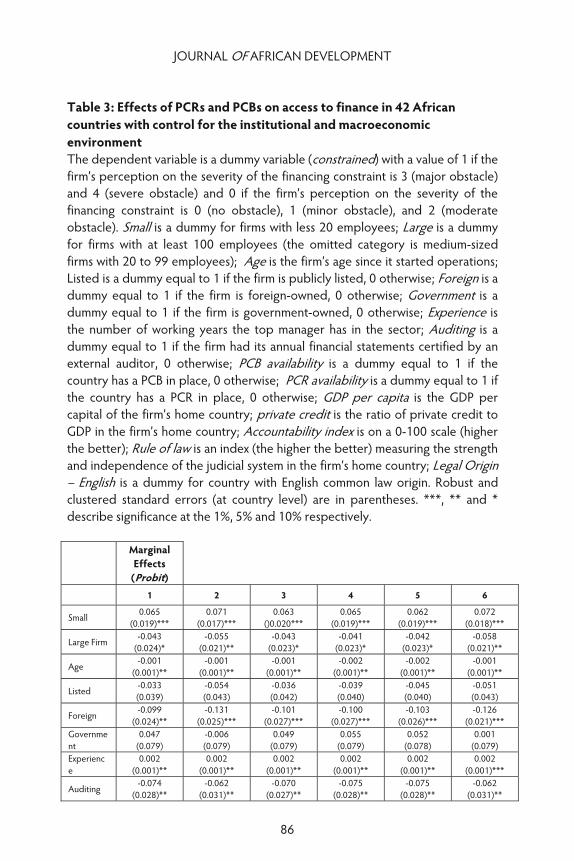
The presence of some correlation between PCBs and firms’ access to finance relative to the presence of PCRs naturally leads to question of why this difference exists. The reason has been hinted at earlier. PCBs are privately originated institutions created mainly to address information asymmetry in the credit market. PCRs, on the other hand, are public institutions designed with the goal of regulating the banking sector (Powell et al. 2004). While PCRs could end up ameliorating the information problem, they are unlikely to be as effective as PCBs in reducing financing constraints that result from information asymmetry between lenders and borrowers. There are several key variables in Tables 3 that are robustly associated with access to finance. Relative to medium-sized firms, large firms face significantly less obstacle to access finance while small firms face higher barriers. This finding is consistently found in the literature (Beck et al. 2005). It also leaves open the possibility that firm size could be both the result of lack of access to finance and a consequence of it. Foreign-owned firms and those that have externally audited financial statements face significantly lower obstacle as well. Unexpectedly, obstacles to finance increases with management experience initially but declines at a gradual rate. In fact, it stops increasing at the experience level of 30 years (90th percentile), beyond which the relationship between the two variable reverses7.
7 This could mean that most managers like to expand their firms over the majority of their tenure. However, at some point later, other aspects of running the firm that require less financing become relatively more paramount.
85
JOURNAL OF AFRICAN DEVELOPMENT
Table 3: Effects of PCRs and PCBs on access to finance in 42 African countries with control for the institutional and macroeconomic environment The dependent variable is a dummy variable (constrained) with a value of 1 if the firm’s perception on the severity of the financing constraint is 3 (major obstacle) and 4 (severe obstacle) and 0 if the firm’s perception on the severity of the financing constraint is 0 (no obstacle), 1 (minor obstacle), and 2 (moderate obstacle). Small is a dummy for firms with less 20 employees; Large is a dummy for firms with at least 100 employees (the omitted category is medium-sized firms with 20 to 99 employees); Age is the firm’s age since it started operations; Listed is a dummy equal to 1 if the firm is publicly listed, 0 otherwise; Foreign is a dummy equal to 1 if the firm is foreign-owned, 0 otherwise; Government is a dummy equal to 1 if the firm is government-owned, 0 otherwise; Experience is the number of working years the top manager has in the sector; Auditing is a dummy equal to 1 if the firm had its annual financial statements certified by an external auditor, 0 otherwise; PCB availability is a dummy equal to 1 if the country has a PCB in place, 0 otherwise; PCR availability is a dummy equal to 1 if the country has a PCR in place, 0 otherwise; GDP per capita is the GDP per capital of the firm’s home country; private credit is the ratio of private credit to GDP in the firm’s home country; Accountability index is on a 0-100 scale (higher the better); Rule of law is an index (the higher the better) measuring the strength and independence of the judicial system in the firm’s home country; Legal Origin – English is a dummy for country with English common law origin. Robust and clustered standard errors (at country level) are in parentheses. ***, ** and * describe significance at the 1%, 5% and 10% respectively.
Marginal Effects
(Probit)
1 2 3 4 5 6
Small 0.065 (0.019)***
0.071(0.017)***
0.063()0.020***
0.065(0.019)***
0.062(0.019)***
0.072 (0.018)***
Large Firm -0.043 (0.024)*
-0.055(0.021)**
-0.043(0.023)*
-0.041(0.023)*
-0.042(0.023)*
-0.058 (0.021)**
Age -0.001
(0.001)** -0.001
(0.001)** -0.001
(0.001)** -0.002
(0.001)** -0.002
(0.001)** -0.001
(0.001)**
Listed -0.033 (0.039)
-0.054(0.043)
-0.036(0.042)
-0.039(0.040)
-0.045(0.040)
-0.051 (0.043)
Foreign -0.099
(0.024)** -0.131
(0.025)*** -0.101
(0.027)*** -0.100
(0.027)*** -0.103
(0.026)*** -0.126
(0.021)*** Government
0.047 (0.079)
-0.006(0.079)
0.049(0.079)
0.055(0.079)
0.052(0.078)
0.001 (0.079)
Experience
0.002 (0.001)**
0.002(0.001)**
0.002(0.001)**
0.002(0.001)**
0.002(0.001)**
0.002 (0.001)***
Auditing -0.074
(0.028)** -0.062
(0.031)** -0.070
(0.027)** -0.075
(0.028)** -0.075
(0.028)** -0.062
(0.031)**
86
TRIKI AND GAJIGO: CREDIT BUREAUS REGISTRIES ACCESS TO FINANCE
PCB availability
-0.131(0.089)
-0.046(0.057)
-0.178(0.092)*
-0.216(0.088)**
-0.239(0.091)**
0.066 (0.107)
PCR availability
0.069(0.066)
0.033(0.053)
0.042(0.067)
0.057(0.070)
-0.097(0.128)
0.144 (0.101)
GDP per Capita
-0.00002(0.00001)**
-0.00002 (0.00002)
Private Credit
-0.302(0.053)***
-0.290 (0.078)***
Accountability and Corruption Index
-0.002 (0.001)
-0.004 (0.002)*
Rule of Law Index
0.0001(0.002)
0.004 (0.003)
Legal Origin - English
-0.151 (0.092)
0.088 (0.074)
Sector dummies Yes Yes Yes Yes Yes Yes
Year dummies Yes Yes Yes Yes Yes Yes
Observations
9,981 9,156 9,981 9,981 9,981 9,156
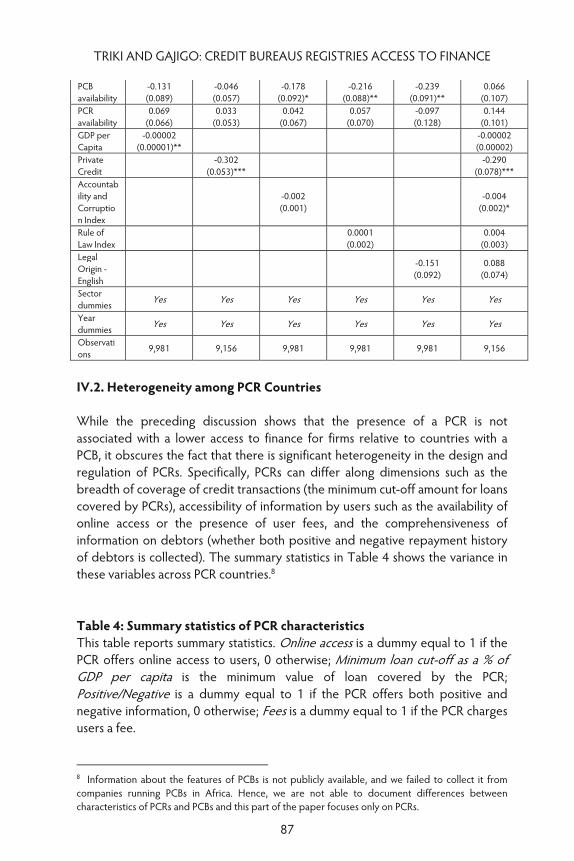
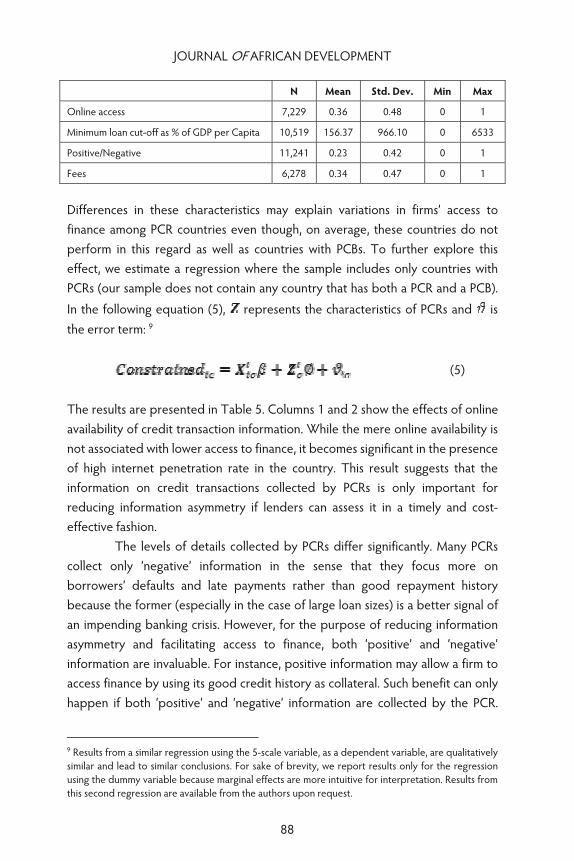
IV.2. Heterogeneity among PCR Countries While the preceding discussion shows that the presence of a PCR is not associated with a lower access to finance for firms relative to countries with a PCB, it obscures the fact that there is significant heterogeneity in the design and regulation of PCRs. Specifically, PCRs can differ along dimensions such as the breadth of coverage of credit transactions (the minimum cut-off amount for loans covered by PCRs), accessibility of information by users such as the availability of online access or the presence of user fees, and the comprehensiveness of information on debtors (whether both positive and negative repayment history of debtors is collected). The summary statistics in Table 4 shows the variance in these variables across PCR countries.8 Table 4: Summary statistics of PCR characteristics This table reports summary statistics. Online access is a dummy equal to 1 if the PCR offers online access to users, 0 otherwise; Minimum loan cut-off as a % of GDP per capita is the minimum value of loan covered by the PCR; Positive/Negative is a dummy equal to 1 if the PCR offers both positive and negative information, 0 otherwise; Fees is a dummy equal to 1 if the PCR charges users a fee. 8 Information about the features of PCBs is not publicly available, and we failed to collect it from companies running PCBs in Africa. Hence, we are not able to document differences between characteristics of PCRs and PCBs and this part of the paper focuses only on PCRs.
87
JOURNAL OF AFRICAN DEVELOPMENT
N Mean Std. Dev. Min Max
Online access 7,229 0.36 0.48 0 1
Minimum loan cut-off as % of GDP per Capita 10,519 156.37 966.10 0 6533
Positive/Negative 11,241 0.23 0.42 0 1
Fees 6,278 0.34 0.47 0 1
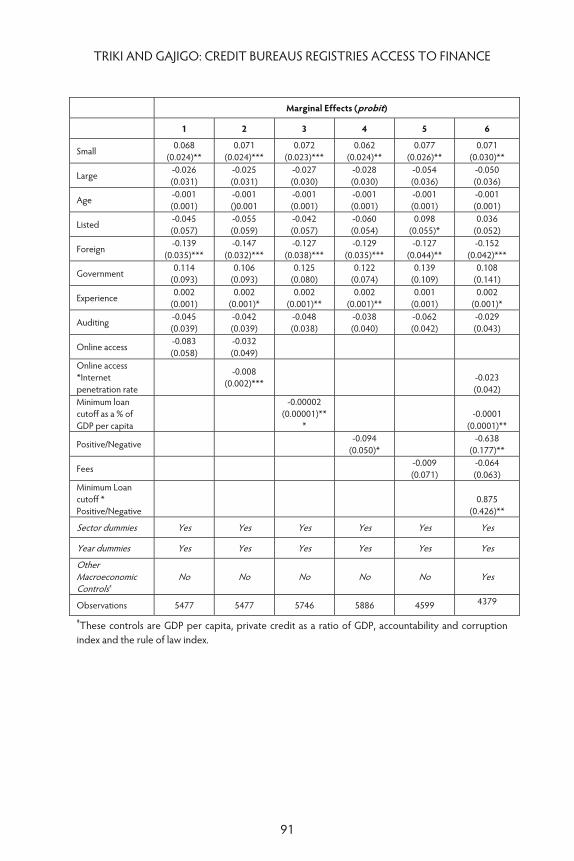
Differences in these characteristics may explain variations in firms’ access to finance among PCR countries even though, on average, these countries do not perform in this regard as well as countries with PCBs. To further explore this effect, we estimate a regression where the sample includes only countries with PCRs (our sample does not contain any country that has both a PCR and a PCB). In the following equation (5), represents the characteristics of PCRs and is the error term: 9
(5) The results are presented in Table 5. Columns 1 and 2 show the effects of online availability of credit transaction information. While the mere online availability is not associated with lower access to finance, it becomes significant in the presence of high internet penetration rate in the country. This result suggests that the information on credit transactions collected by PCRs is only important for reducing information asymmetry if lenders can assess it in a timely and cost-effective fashion.
The levels of details collected by PCRs differ significantly. Many PCRs collect only ‘negative’ information in the sense that they focus more on borrowers’ defaults and late payments rather than good repayment history because the former (especially in the case of large loan sizes) is a better signal of an impending banking crisis. However, for the purpose of reducing information asymmetry and facilitating access to finance, both ‘positive’ and ‘negative’ information are invaluable. For instance, positive information may allow a firm to access finance by using its good credit history as collateral. Such benefit can only happen if both ‘positive’ and ‘negative’ information are collected by the PCR.
9 Results from a similar regression using the 5-scale variable, as a dependent variable, are qualitatively similar and lead to similar conclusions. For sake of brevity, we report results only for the regression using the dummy variable because marginal effects are more intuitive for interpretation. Results from this second regression are available from the authors upon request.
88
TRIKI AND GAJIGO: CREDIT BUREAUS REGISTRIES ACCESS TO FINANCE
Our results (column 4) suggests this is important by showing a significant association between firms’ access to finance and the collection of both ‘positive’ and ‘negative’ information on credit transactions.
Some PCR collects information on credit transactions that only involve loans above a certain size. With the primary objective of supervising the banking sector and identifying potentials systemic risks to the financial or banking system, regulators restrict their regulatory oversight to large credit transactions that have the potential to have economy-wide effects. However, that focus is likely to limit the effect of PCRs in reducing information asymmetry between lenders and borrowers for a large set of transactions involving small loan sizes. So, other variables being equal, one would expect that the higher the minimum loan cut-off, the lower the effect of the PCR in reducing information asymmetry, and consequently reducing access to finance. However, column 3 shows that minimum loan cut-off by itself has a significant negative effect on the severity of the financing constraint which is counter intuitive. A potential explanation is related to the type of information provided by the PCR. In order to check this argument, we rerun specification 3 while adding an interaction term for minimum loan cut-off with positive and negative information collection. Column 6 reports results for this specification and shows that the minimum loan cut-off has the expected effect only if the range of information collected is broad in the sense of capturing both positive and negative repayment history of borrowers.
The levying of user fees for access to the credit information in PCRs has no significant effect on firms’ access to finance (column 5). One would expect the presence of a user fee to restrict access by lenders and accordingly hinders firm’s access to finance. This could mean that the size of the fees presents no significant obstacle for lenders in accessing borrower information. An additional explanation is related to financial sector regulation. If African governments oblige financial institutions to consult PCRs for loan provision, then the PCR fee structure is unlikely to affect their take up or lending behavior. Under such case, it is likely that lenders price the cost of the fee into the loan, which will imply that the presence of a user fee does not limit their ability to access fee-charging PCRs.
89
JOURNAL OF AFRICAN DEVELOPMENT
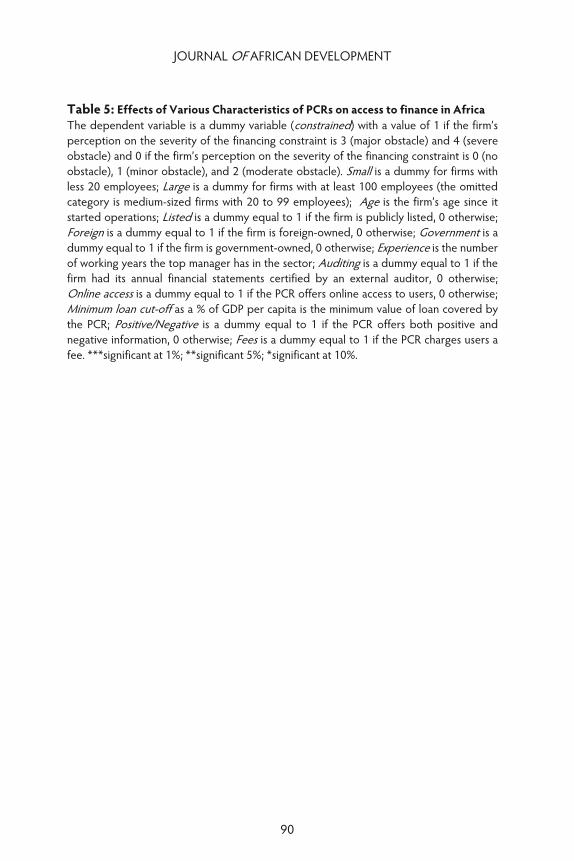
Table 5: Effects of Various Characteristics of PCRs on access to finance in Africa The dependent variable is a dummy variable (constrained) with a value of 1 if the firm’s perception on the severity of the financing constraint is 3 (major obstacle) and 4 (severe obstacle) and 0 if the firm’s perception on the severity of the financing constraint is 0 (no obstacle), 1 (minor obstacle), and 2 (moderate obstacle). Small is a dummy for firms with less 20 employees; Large is a dummy for firms with at least 100 employees (the omitted category is medium-sized firms with 20 to 99 employees); Age is the firm’s age since it started operations; Listed is a dummy equal to 1 if the firm is publicly listed, 0 otherwise; Foreign is a dummy equal to 1 if the firm is foreign-owned, 0 otherwise; Government is a dummy equal to 1 if the firm is government-owned, 0 otherwise; Experience is the number of working years the top manager has in the sector; Auditing is a dummy equal to 1 if the firm had its annual financial statements certified by an external auditor, 0 otherwise; Online access is a dummy equal to 1 if the PCR offers online access to users, 0 otherwise; Minimum loan cut-off as a % of GDP per capita is the minimum value of loan covered by the PCR; Positive/Negative is a dummy equal to 1 if the PCR offers both positive and negative information, 0 otherwise; Fees is a dummy equal to 1 if the PCR charges users a fee. ***significant at 1%; **significant 5%; *significant at 10%.
90
TRIKI AND GAJIGO: CREDIT BUREAUS REGISTRIES ACCESS TO FINANCE
Marginal Effects (probit)
1 2 3 4 5 6
Small 0.068
(0.024)** 0.071
(0.024)*** 0.072
(0.023)*** 0.062
(0.024)** 0.077
(0.026)** 0.071
(0.030)**
Large -0.026(0.031)
-0.025(0.031)
-0.027 (0.030)
-0.028(0.030)
-0.054(0.036)
-0.050 (0.036)
Age -0.001(0.001)
-0.001()0.001
-0.001 (0.001)
-0.001(0.001)
-0.001(0.001)
-0.001 (0.001)
Listed -0.045(0.057)
-0.055(0.059)
-0.042 (0.057)
-0.060(0.054)
0.098(0.055)*
0.036 (0.052)
Foreign -0.139
(0.035)*** -0.147
(0.032)*** -0.127
(0.038)*** -0.129
(0.035)*** -0.127
(0.044)** -0.152
(0.042)***
Government 0.114
(0.093) 0.106
(0.093) 0.125
(0.080) 0.122
(0.074) 0.139
(0.109) 0.108
(0.141)
Experience 0.002
(0.001) 0.002
(0.001)* 0.002
(0.001)** 0.002
(0.001)** 0.001
(0.001) 0.002
(0.001)*
Auditing -0.045(0.039)
-0.042(0.039)
-0.048 (0.038)
-0.038(0.040)
-0.062(0.042)
-0.029 (0.043)
Online access -0.083(0.058)
-0.032(0.049)
Online access *Internet penetration rate
-0.008 (0.002)***
-0.023 (0.042)
Minimum loan cutoff as a % of GDP per capita
-0.00002 (0.00001)**
*
-0.0001 (0.0001)**
Positive/Negative -0.094
(0.050)* -0.638
(0.177)**
Fees -0.009(0.071)
-0.064 (0.063)
Minimum Loan cutoff * Positive/Negative
0.875 (0.426)**
Sector dummies Yes Yes Yes Yes Yes Yes
Year dummies Yes Yes Yes Yes Yes Yes
Other Macroeconomic Controls‡
No No No No No Yes
Observations 5477 5477 5746 5886 4599 4379
‡These controls are GDP per capita, private credit as a ratio of GDP, accountability and corruption index and the rule of law index.
91
JOURNAL OF AFRICAN DEVELOPMENT
4. CONCLUSION
Easing firms' access to finance is a prerequisite for private sector development. Private credit bureaus (PCBs) and public credit registries (PCRs) have important roles in facilitating this process by reducing the information asymmetry between lenders and borrowers so as to limit adverse selection and moral hazard in the credit market. This paper empirically explores the availability of PCRs and PCBs on firms’ access to finance in Africa. Firm-level data from the World Bank Enterprise Surveys was complemented with newly hand collected information on the differences in the structure of PCRs across countries and the availability of PCBs in African countries. We find that the presence of PCBs is associated with smaller obstacles in access to finance relative to the presence of PCRs on average. However, this relationship is not robust to the inclusion of variables that are correlated with the level of economic and financial development. We also document significant heterogeneity in PCRs design. Specifically, PCRs that collect both positive and negative information have a favorable effect on firms’ access to finance. Our results also suggest that provision of online information by PCRs is only beneficial when the internet penetration rate in the country is high and reducing minimum cut-off for loan coverage by PCRs helps soften the financing constraint only when positive and negative information is provided.
These results show the importance of credit bureaus and registries in ensuring that firms have access to finance as well as the importance of PCR design. The fact that differences in PCR characteristics have implications for firms’ access to finance suggest an important role for policy in designing these institutions not only for bank regulations but also for easing credit constraints. This is particularly relevant for African countries which are often unable to attract private initiates to set up PCBs because of their small size.
92
TRIKI AND GAJIGO: CREDIT BUREAUS REGISTRIES ACCESS TO FINANCE
REFERENCES Barth, J.R., C. Lin, P. Lin, F.M. Song. 2009. “Corruption in Bank Lending to Firms:
Cross-Country Micro Evidence on the Beneficial Role of Competition and Information Sharing”, Journal of Financial Economics, 91(3): 361-388.
Bhasin, V. K. and W. Akpalu. 2001. “Impact of micro-finance enterprises on the efficiency of micro-enterprises in Cape Coast”, IFLIP Research Paper 01-5, International Labour Organisation, November.
Beck, T., and A. Demirgüç-Kunt. 2006. “Small and Medium-sized Entrepreneurs: Access to Finance as a Growth Constraints”, Journal of Banking and Finance, 30(11):2931-2943.
Beck, T., A. Demirgüç-Kunt, and V. Maksimovic. 2004. “Bank Competition and Access to Finance: International Evidence”, Journal of Money, Credit and Banking, 36(3): 627-648.
Beck, T., A. Demirgüç-Kunt, and V. Maksimovic. 2005. “Financial and Legal Constraints to Growth: Does Firm Size Matter”, Journal of Finance, 60(1): 137-477.
Beck, T., A. Demirgüç-Kunt, L. Laeven, and V. Maksimovic. 2006. “The Determinants of Financing Obstacles”, Journal of International Money and Finance, 25(6):1-21.
Beck, T., S.M. Maimbo, I. Faye and T. Triki. 2011. “Financing Africa through the Crisis and Beyond”, World Bank Publication.
Bigsten, A., and M. Söderbom. 2006. “What Have We Learned From a Decade of Manufacturing Enterprise Surveys in Africa?” World Bank Research Observer, 21(2): 241-265.
Brown, M., T. Jappelli, and M. Pagano. 2009. “Information Sharing and Credit: Firm-level Evidence from Transition Countries”, Journal of Financial Intermediation, 18 (2):151-172.
Brown, M. and C. Zehnder. 2007. “Credit Reporting, Relationship Banking, and Loan Repayment”, Journal of Money, Credit and Banking”, 39(8): 1883-1918.
Clarke, G. R. G., R. Cull, and M.S. Martinez Peria. 2001. “Does foreign bank penetration reduce access to credit in developing countries? evidence from asking borrowers”, Working Paper, World Bank, Washington, DC.
Clarke, G. R. G., R. Cull, and M.S. Martinez Peria. 2006. “Foreign bank participation and access to credit across firms in developing countries”, Journal of Comparative Economics, 34:774-795.
Didoni, A. 2006. “The impact of liberalisation policies on access to microfinance – the case of Peru”, Working Paper No. 45, International Labour Office, Geneva.
93
JOURNAL OF AFRICAN DEVELOPMENT
Dinh, H., D.A. Mavridis, and H.B. Nguyen. 2010. “The binding constraints on firms’ growth in developing countries”, Working Paper, World Bank, Washington, DC.
Djankov, S., C. McLiesh, and A. Shleifer. 2007. “Private credit in 129 countries”, Journal of Financial Economics, 84:299-329.
Dorbec, A. 2006. “Credit information systems: theoretical and comparative analysis”, Attractivite Economique du Droit (AED), working paper AED-EAL-2006-2.
Ekumah, E.K. and T.T. Essel. 2001. “Gender access to credit under Ghana’s financial sector reforms: a case study of two rural banks in the central region of Ghana”, Working Paper, International Labour Organisation, Geneva.
Demetriades, P. and D. Fielding. 2011. “Information, Institutions and Banking Sector Development in West Africa”, Economic Inquiry, 1465-7295.
Freeman, P. L. and R.W. Click. 2006. “Banks that don’t lend? Unlocking credit to spur growth in developing countries”, Development Policy Review, 24 (3):279-302.
Gallindo, A. and M. Miller. 2001. “Can Credit Registries Reduce Credit Constraints? Empirical Evidence on the Role of Credit Registries in Firm Investment Decisions”, Working Paper, Inter-American Development Bank, Washington DC.
Girault, M.G., and J. Hwang. 2010, “Public credit registries as a tool for bank regulation and supervision”, Working Paper, World Bank, Washington, DC.
Gockel, A. F. and S.K. Akoena. 2002. “Financial intermediation for the poor: credit demand by micro, small and medium scale enterprises in Ghana – a further assignment for financial sector policy?”, Working Paper, International Labour Organisation, Geneva.
Hamada, M. 2010, “Commercialization of microfinance in Indonesia: the shortage of funds and the linkage program”, Developing Economies, 48 (1):156-176.
Hope, O. K., W.B. Thomas, and D. Vyas. 2009. “Transparency, ownership, and financing constraints in private firms”, Working Paper, Rutgers University.
Iossifov, P. and M. Khamis. 2009. “Credit growth in sub-Saharan Africa – sources, risks, and policy responses”, Working Paper, International Monetary Fund, Washington DC.
Jappelli, T. and M. Pagano. 2002. “Information sharing, lending and defaults: cross-country-evidence”, Journal of Banking & Finance, 26:2017-2045.
Kallberg, J. G. and Udell, G. F. (2003), “The value of private sector business credit information sharing: the US case”, Journal of Banking & Finance, 27:449-469.
94
TRIKI AND GAJIGO: CREDIT BUREAUS REGISTRIES ACCESS TO FINANCE
Kounouwewa, J. and Chao, D, 2011, “Financing constraints determinants in African countries”, International Journal of Applied Economics and Finance, Vol.5, Iss.1, 30-45.
La Porta, R., F.A. Lopez-de-Silanes, Shleifer and R. Vishny. 1997. “Legal determinants of external finance”, Journal of Finance, 52 (3):1131-1150.
Love, I. and N. Mylenko. 2003. “Credit reporting and financing constraints”, Working Paper, World Bank, Washington, DC.
McKinsey & Company. 2011. “Enhancing the Contribution of SMEs to Economic Development: Main Barriers and Possible Interventions”, Paper presented at the African Development Bank.
McDonald, C. and Schumacher, L. 2007. “Financial deepening in sub-Saharan Africa: Empirical evidence on the role of creditor rights protection and information sharing”, Working Paper, International Monetary Fund, Washington DC.
Miller, M. 2003. “Credit reporting systems around the Globe: the state of the art in public credit registries and private credit reporting firms”, in Miller, M., (ed), Credit Reporting Systems and International Economy. Cambridge, MA, MIT Press.
Pagano, M. and T. Jappelli. 1993. “Information Sharing in Credit Markets”, Journal of Finance, 48(5): 1693-1718.
Powell, A., N. Mylenko, M. Miller and G. Majnoni. 2004. “Improving Credit Information, Bank Regulation and Supervision”, Working Paper, World Bank, Washington, DC.
Singh, R.J, K. Kpodar, and D. Ghura. 2009. “Financial deepening in the CFA zone: the role of institutions”, Working Paper, International Monetary Fund, Washington DC.
Stiglitz, J. and A. Weiss. 1981. “Credit Rationing in Markets with Imperfect Information”, American Economic Review, 71, 393-410.
95
JOURNAL OF AFRICAN DEVELOPMENT
APPENDIX 1 Differences between PCRs and PCBs PCRs PCBs Purpose Banking supervision Sharing of credit information to
help lenders take informed decisions
Coverage Mainly large corporate. Limited in terms of history and type of data provided.
Large corporates, SMEs, individuals. Longer history and more rich data provided.
Ownership Government or central banks Government/central banks, lenders, lenders’ associations, independent third parties
Status Not for profit Mainly, for profit Data sources used Banks and non banks financial
institutions Banks, non banks financial institutions, PCRs, tax authorities, courts, utilities
Access Restricted to information providers
Open to all types of lenders
96
TRIKI AND GAJIGO: CREDIT BUREAUS REGISTRIES ACCESS TO FINANCE
APPENDIX 2 Table A1: Variables definitions and sources. VARIABLE NAMES DEFINITIONS SOURCES Finance obstacle Response to the question: How severe is the
access to finance obstacle for your current operations? Answers vary between 0 (no obstacle) and 4 (very severe obstacle).
World Bank Enterprise Surveys (WBES)
Constrained Dummy=1 if the firm identifies finance as a major or very severe obstacle.
WBES
Small Firms with less than 20 employees. WBESMedium Firms with 20 or more employees and but less
than 100.WBES
Large Firms with 100 or more employees. WBESAge Firm’s age since it started operations. It is
measured the difference between the year of survey minus year firm began operations.
WBES
Listed Dummy equal 1 if the firm is publicly listed, 0 otherwise
WBES
Foreign Dummy indicating a foreign-owned firm. Equals 1 if foreign individuals or organizations hold a majority stake (more than 50%) in the firm, 0 otherwise
WBES
Government Dummy indicating a state-owned firm. Equals 1 if the government holds a majority stake (more than 50%) in the firm, 0 otherwise
WBES
Experience The number of years of working experience the top manager has in the sector of operations
WBES
Auditing Dummy indicating if a firm had its annual financial statements checked and certified by an external auditor. Equals 1 for a checked and certified annual financial statement, 0 otherwise
WBES
Private credit The ratio of claims on the private sector by financial institutions to GDP averaged over the 3 years preceding the year of the survey.
International Financial Statistics database (IMF)
GDP per capita GDP per capita averaged over the 3 years preceding the year of the survey.
World Economic Outlook database (IMF)
PCB availability Dummy indicating the presence of a private credit bureau in the country during the year preceding the survey, 0 otherwise
IFC list of private credit bureaus around the World (2010), doing business annual reports (2004-2011) and authors’ research
97
JOURNAL OF AFRICAN DEVELOPMENT
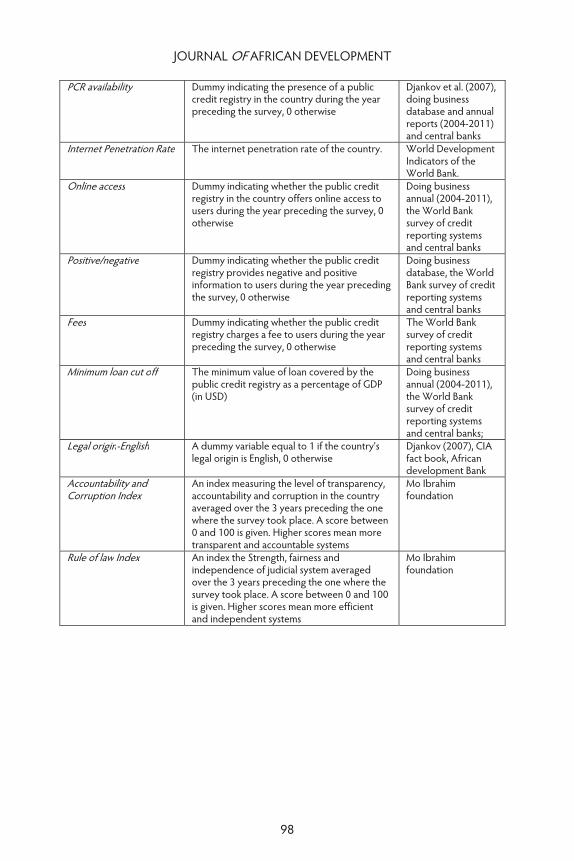
PCR availability Dummy indicating the presence of a public credit registry in the country during the year preceding the survey, 0 otherwise
Djankov et al. (2007), doing business database and annual reports (2004-2011) and central banks
Internet Penetration Rate The internet penetration rate of the country. World Development Indicators of the World Bank.
Online access Dummy indicating whether the public credit registry in the country offers online access to users during the year preceding the survey, 0 otherwise
Doing business annual (2004-2011), the World Bank survey of credit reporting systems and central banks
Positive/negative Dummy indicating whether the public credit registry provides negative and positive information to users during the year preceding the survey, 0 otherwise
Doing business database, the World Bank survey of credit reporting systems and central banks
Fees Dummy indicating whether the public credit registry charges a fee to users during the year preceding the survey, 0 otherwise
The World Bank survey of credit reporting systems and central banks
Minimum loan cut off The minimum value of loan covered by the public credit registry as a percentage of GDP (in USD)
Doing business annual (2004-2011), the World Bank survey of credit reporting systems and central banks;
Legal origin-English A dummy variable equal to 1 if the country’slegal origin is English, 0 otherwise
Djankov (2007), CIA fact book, African development Bank
Accountability and Corruption Index
An index measuring the level of transparency, accountability and corruption in the country averaged over the 3 years preceding the one where the survey took place. A score between 0 and 100 is given. Higher scores mean more transparent and accountable systems
Mo Ibrahim foundation
Rule of law Index An index the Strength, fairness and independence of judicial system averaged over the 3 years preceding the one where the survey took place. A score between 0 and 100 is given. Higher scores mean more efficient and independent systems
Mo Ibrahim foundation
98
TRIKI AND GAJIGO: CREDIT BUREAUS REGISTRIES ACCESS TO FINANCE
Table A2: Countries covered in our sample and their survey years Countries with PCR Countries with
at least one PCB Countries with neither a PCB nor PCR
Algeria, 2007 Botswana, 2006 Eritrea, 2009 Angola, 2006 Kenya, 2007 Ethiopia, 2006 Benin, 2009 Namibia, 2006 Gambia, 2006 Burkina Faso, 2009 South Africa, 2007 Ghana, 2007 Burundi, 2006 Swaziland, 2006 Lesotho, 2009 Cameroon, 2009 Malawi, 2009 Cape Verde, 2009 Sierra Leone, 2009 Chad, 2009 Tanzania, 2006 Congo, 2009 Uganda, 2006 Democratic Republic of Congo, 2006 Zambia, 2007 Egypt, 2008 Gabon, 2009 Guinea, 2006 Guinea Bissau, 2006 Ivory Coast, 2009 Liberia, 2009 Madagascar, 2009 Mali, 2007 Mauritania, 2006 Mauritius, 2009 Morocco, 2007 Mozambique, 2007 Niger, 2009 Nigeria, 2007 Rwanda, 2006 Senegal, 2007 Togo, 2009
99
JOURNAL OF AFRICAN DEVELOPMENT
Table A3: Characteristics of Private Credit Bureaus (PCBs) in surveyed African countries in 2012
Country Coverage (% population) PCB name
Positive and negative information (Y/N)
Botswana 57.6 TransUnion ITC CRB Africa Compuscan Botswana
No
Egypt 10.3 I-score Yes
Ghana 10.3 XDS Ghana Yes
Kenya 3.3
Credit reference bureau Africa limited Metropol East Africa Ltd Transunion Kenya
No
Malawi less than 0.1% CRBAfrica No
Morocco 9.9 Experian Yes
Mozambique less than 0.1% CRBAfrica No
Nigeria less than 0.1%
Credit registry corporation CR services LTD Nigeria XDS Credit reference company
No
Namibia 58.5
Transunion ITC Namibia Credit Information Bureau Namibia Compuscan
No
Rwanda 0 CRBAfrica No
South Africa 54.9
Transunion Experian Compuscan XDS
Yes
Swaziland 35.7 ITC Swaziland Transunion Yes
Tanzania 0 CRBAfrica No
Uganda 1.1 CRBAfrica Compuscan Uganda Yes
Zambia 3 CRBAfrica Yes
100
TRIKI AND GAJIGO: CREDIT BUREAUS REGISTRIES ACCESS TO FINANCE
Table A4: Characteristics of Public Credit Registries (PCRs) in surveyed African countries in 2012
Country
Year of establishment
of PCR
Negative and positive
collected by the PCR (Yes=1; N=0)
Minimum Loan Value (USD)
Covered by the PCR
PCR has online access (Y/N)
PCR charges user fees (Yes=1; N=0)
Algeria 1990 1 Not available Not available Not available Angola 1998 0 0 No 0 Benin 1962 0 10,545 No 0 Botswana N/A N/A N/A N/A Burkina Faso 1962 0 10,545 No 0 Burundi 1964 0 450 Not available Cameroon 1972 0 20 Yes Not available Cape Verde 2007 0 61*** Yes Not available Chad 1972 0 20 Yes Not available Congo 1972 0 20 Yes Not available DRC Not available 0 2,165 No 1 Egypt 1957 1 7,109 Yes 1 Eritrea N/A N/A N/A N/A Ethiopia N/A N/A N/A N/A Gabon Not available 0 20 Yes Gambia N/A N/A N/A N/A Ghana N/A N/A N/A N/A Guinea 1995 0 2293.25 No No Guinea Bissau 1962 0 6,327 No 0 Ivory Coast 1962 0 21,090 No 0 Kenya N/A N/A N/A N/A Lesotho N/A N/A N/A N/A Liberia 2008 0 Not available Not available Not available Madagascar 1973 0 0** No* 0 Malawi N/A N/A N/A N/A Mali 1962 0 10,545 No 0 Mauritania 1974 0 3,651,643 No 0 Mauritius 2005 1 0 Yes 1 Morocco 1966 0 8,620 Not available Mozambique 1997 1 437 Yes 1 Namibia N/A N/A N/A N/A Niger 1962 0 10,545 No 0 Nigeria 1998 0 8,333 Not available Not available Rwanda 1990 1 0**** No 0 Senegal 1962 0 21,090 No 0 Sierra Leone 2012 0 Not available Not available Not available South Africa N/A N/A N/A N/A Swaziland N/A N/A N/A N/A Tanzania N/A N/A N/A N/A Togo 1962 0 10,545 No 0 Uganda N/A N/A N/A N/A Zambia N/A N/A N/A N/A ** The central bank is in the process of putting in place an online system; ** The minimum value of loan covered was reduced from 1000 USD to 0USD in 2008; *** The minimum amount was increased from 12 USD to 61 USD; **** The minimum amount was reduced from 0.84 USD to 0 in 2011.
101