Embed Size (px)
Citation preview

October 2010
Federal Reserve System Monthly Report on
Credit and Liquidity Programs and the
Balance Sheet
Board of Governors of the Federal Reserve System

Purpose
The Federal Reserve prepares this monthly report as
part of its efforts to enhance transparency about the
range of programs and tools that have been imple-
mented in response to the financial crisis and to ensure
appropriate accountability to the Congress and the pub-
lic. The Federal Reserve’s statutory mandate in con-
ducting monetary policy is to foster maximum employ-
ment and stable prices. Financial stability is a critical
prerequisite for achieving sustainable economic growth
and price stability, and the Federal Reserve imple-
mented a number of credit and liquidity programs to
support the liquidity of financial institutions and to
foster improved conditions in financial markets in
response to the extraordinary strains that began to
emerge in the summer of 2007.
This report provides detailed information on the
policy tools that were implemented to address the
financial crisis. In addition, it contains financial report-
ing for the second quarter of 2010.
In fulfillment of Section 129 of the Emergency Eco-
nomic Stabilization Act of 2008, additional information
on the status of certain credit facilities implemented in
response to the financial crisis is included as Appendix
A of this report. Information related to the Federal
Reserve’s temporary liquidity programs and facilities
that have closed or expired is included in Appendix B
of this report.
The Dodd-Frank Wall Street Reform and Consumer
Protection Act (the “Dodd-Frank Act”), which was
signed into law on July 21, 2010, includes provisions
that are designed to promote transparency by requiring
disclosure of certain information about entities that
receive loans or otherwise participate in Federal
Reserve credit and liquidity programs; information
about these provisions of the Dodd-Frank Act is
included in Appendix C of this report.
For prior editions of this report and other resources,
please visit the Board’s public website at
www.federalreserve.gov/monetarypolicy/
clbsreports.htm.Note: Financial information in this report has not been audited.Financial data are audited annually and are available atwww.federalreserve.gov/monetarypolicy/bst_fedfinancials.htm.

Contents
Overview...............................................................................................................................................1
Recent Developments .............................................................................................................................1
System Open Market Account (SOMA) ...............................................................................................4
Domestic SOMA Portfolio ......................................................................................................................4
Liquidity Arrangements with Foreign Central Banks....................................................................................6
Lending Facilities to Support Overall Market Liquidity .....................................................................8
Lending to Depository Institutions............................................................................................................8
Term Asset-Backed Securities Loan Facility (TALF)..................................................................................10
Lending in Support of Specific Institutions ........................................................................................14
Quarterly Developments ........................................................................................................................14
Bear Stearns and Maiden Lane LLC .......................................................................................................14
American International Group, Inc. (AIG)................................................................................................15
Maiden Lane II LLC ............................................................................................................................18
Maiden Lane III LLC ...........................................................................................................................20
Federal Reserve Banks’ Financial Tables ...........................................................................................22
Quarterly Developments ........................................................................................................................22
Combined Statement of Income and Comprehensive Income.......................................................................22
SOMA Financial Summary ....................................................................................................................22
Loan Programs Financial Summary.........................................................................................................24
Consolidated Variable Interest Entities (VIEs) Financial Summary ...............................................................26
Appendix A .........................................................................................................................................27
Additional Information Provided Pursuant to Section 129 of the Emergency Economic Stabilization Act
of 2008 ...........................................................................................................................................27
Appendix B .........................................................................................................................................29
Information about Closed and Expired Credit and Liquidity Facilities and Programs.......................................29
Appendix C.........................................................................................................................................33
Federal Reserve Disclosure Requirements and Other Provisions of the Dodd-Frank Wall Street Reform
and Consumer Protection Act .............................................................................................................33

Tables and Figures
Overview...............................................................................................................................................1
Table 1. Assets, Liabilities, and Capital of the Federal Reserve System .........................................................1
Figure 1. Credit and Liquidity Programs and the Federal Reserve’s Balance Sheet...........................................2
System Open Market Account (SOMA) ...............................................................................................4
Table 2. Domestic SOMA Securities Holdings ...........................................................................................5
Table 3. Amounts Outstanding under Dollar Liquidity Swaps ......................................................................7
Lending Facilities to Support Overall Market Liquidity .....................................................................8
Table 4. Discount Window Credit Outstanding to Depository Institutions ......................................................8
Table 5. Concentration of Discount Window Credit Outstanding to Depository Institutions ...............................9
Table 6. Lendable Value of Collateral Pledged by Borrowing Depository Institutions ......................................9
Table 7. Lendable Value of Securities Pledged by Depository Institutions by Rating ........................................9
Table 8. Discount Window Credit Outstanding to Borrowing Depository Institutions—
Percent of Collateral Used ................................................................................................................10
Table 9. TALF: Number of Borrowers and Loans Outstanding ...................................................................10
Table 10. TALF Collateral by Underlying Loan Type ................................................................................11
Table 11. TALF Collateral by Rating ......................................................................................................11
Table 12A. Issuers of Non-CMBS that Collateralize Outstanding TALF Loans .............................................12
Table 12B. Issuers of Newly Issued CMBS that Collateralize Outstanding TALF Loans .................................12
Table 12C. Issuers of Legacy CMBS that Collateralize Outstanding TALF Loans .........................................12
Lending in Support of Specific Institutions ........................................................................................14
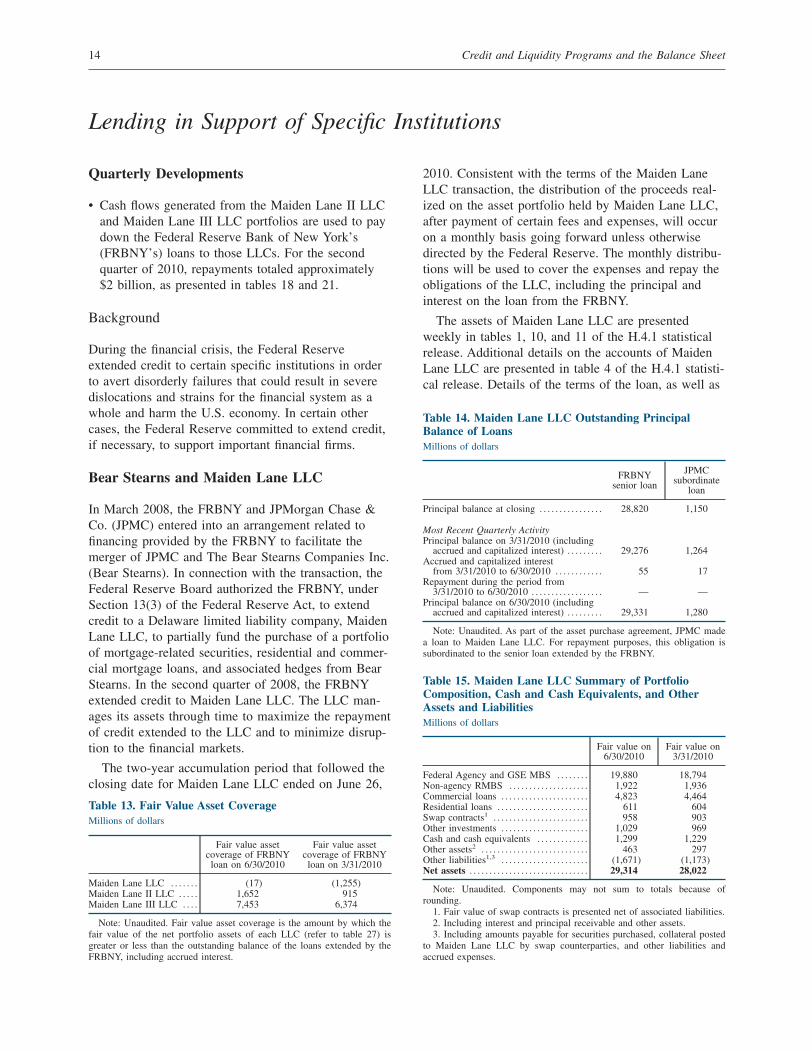
Table 13. Fair Value Asset Coverage ......................................................................................................14
Table 14. Maiden Lane LLC Outstanding Principal Balance of Loans .........................................................14
Table 15. Maiden Lane LLC Summary of Portfolio Composition, Cash and Cash Equivalents,
and Other Assets and Liabilities .........................................................................................................14
Table 16. Maiden Lane LLC Securities Distribution by Sector and Rating ...................................................15
Figure 2. Maiden Lane LLC Securities Distribution as of June 30, 2010.......................................................15
Table 17A. AIG Revolving Credit Facility ..............................................................................................16
Table 17B. Preferred Interests in AIA Aurora LLC and ALICO Holdings LLC .............................................16
Figure 3. AIG Revolving Credit .............................................................................................................17
Table 18. Maiden Lane II LLC Outstanding Principal Balance of Senior Loan and Fixed Deferred
Purchase Price .................................................................................................................................19
Table 19. Maiden Lane II LLC Summary of RMBS Portfolio Composition, Cash and Cash Equivalents,
and Other Assets and Liabilities .........................................................................................................19
Table 20. Maiden Lane II LLC Securities Distribution by Sector and Rating ................................................19
Figure 4. Maiden Lane II LLC Securities Distribution as of June 30, 2010 ...................................................19
Table 21. Maiden Lane III LLC Outstanding Principal Balance of Senior Loan and Equity Contribution ..........20
Table 22. Maiden Lane III LLC Summary of Portfolio Composition, Cash and Cash Equivalents,
and Other Assets and Liabilities .........................................................................................................20
Table 23. Maiden Lane III LLC Securities Distribution by Sector, Vintage, and Rating ..................................20
Figure 5. Maiden Lane III LLC Securities Distribution as of June 30, 2010 ..................................................21

Federal Reserve Banks’ Financial Tables ...........................................................................................22
Table 24. Federal Reserve Banks’ Combined Statement of Income and Comprehensive Income ......................23
Table 25. SOMA Financial Summary .....................................................................................................24
Table 26. Loan Programs Financial Summary ..........................................................................................25
Table 27. Consolidated Variable Interest Entities Financial Summary ..........................................................25


Overview
Recent Developments
• On September 30, 2010, American International
Group, Inc. (AIG) announced an agreement with the
U.S. Department of the Treasury, the Federal
Reserve Bank of New York (FRBNY), and the trust-
ees of the AIG Credit Facility Trust on a comprehen-
sive recapitalization plan designed to repay all its
obligations to American taxpayers. The measures
include an accelerated repayment of the outstanding
balance (including all accrued interest and fees) on
the FRBNY revolving credit facility and termination
of that facility, the acquisition of the majority of the
FRBNY’s preferred interests in the AIA and ALICO
special purpose vehicles (SPVs) by the U.S. Trea-
sury, and the conversion of the AIG preferred stock
Table 1. Assets, Liabilities, and Capital of the Federal Reserve System
Billions of dollars
ItemCurrent
September 29, 2010Change from
August 25, 2010Change from
September 30, 2009
Total assets . . . . . . . . . . . . . . . . . . . . . . . . . . . . . . . . . . . . . . . . . . . . . . . . . . . . . . . . . . . . . . . . . . 2,302 −2 158Selected assets
Securities held outright . . . . . . . . . . . . . . . . . . . . . . . . . . . . . . . . . . . . . . . . . . . . . . . . . . . . 2,044 +* 451U.S. Treasury securities1 . . . . . . . . . . . . . . . . . . . . . . . . . . . . . . . . . . . . . . . . . . . . . . . . 812 28 43Federal agency debt securities1 . . . . . . . . . . . . . . . . . . . . . . . . . . . . . . . . . . . . . . . . . . 154 −3 23Mortgage-backed securities2 . . . . . . . . . . . . . . . . . . . . . . . . . . . . . . . . . . . . . . . . . . . . . 1,079 −24 387Memo: Overnight securities lending3 . . . . . . . . . . . . . . . . . . . . . . . . . . . . . . . . . . . . 8 +* −5Memo: Net commitments to purchase mortgage-backed securities4 . . . . . 0 0 −184
Lending to depository institutions5 . . . . . . . . . . . . . . . . . . . . . . . . . . . . . . . . . . . . . . . . . * +* −29
Central bank liquidity swaps6 . . . . . . . . . . . . . . . . . . . . . . . . . . . . . . . . . . . . . . . . . . . . . . * +* −57
Lending through other credit facilities . . . . . . . . . . . . . . . . . . . . . . . . . . . . . . . . . . . . . 31 −6 −53Net portfolio holdings of Commercial Paper Funding Facility LLC . . . . . 0 0 −41Term Asset-Backed Securities Loan Facility7 . . . . . . . . . . . . . . . . . . . . . . . . . . . . 31 −6 −12
Net portfolio holdings of TALF LLC8 . . . . . . . . . . . . . . . . . . . . . . . . . . . . . . . . . . . . . 1 +* 1
Support for specific institutions . . . . . . . . . . . . . . . . . . . . . . . . . . . . . . . . . . . . . . . . . . . . 112 −2 12Credit extended to American International Group, Inc., net9 . . . . . . . . . . . . 19 −* −20Net portfolio holdings of Maiden Lane LLC10 . . . . . . . . . . . . . . . . . . . . . . . . . . 28 −1 2Net portfolio holdings of Maiden Lane II LLC10 . . . . . . . . . . . . . . . . . . . . . . . . 16 −* 1Net portfolio holdings of Maiden Lane III LLC10 . . . . . . . . . . . . . . . . . . . . . . . 23 −* 2Preferred interests in AIA Aurora LLC and ALICO Holdings LLC7 . . . . . 26 0 26
Total liabilities . . . . . . . . . . . . . . . . . . . . . . . . . . . . . . . . . . . . . . . . . . . . . . . . . . . . . . . . . . . . . . 2,245 −3 152Selected liabilities
Federal Reserve notes in circulation . . . . . . . . . . . . . . . . . . . . . . . . . . . . . . . . . . . . . . . 914 8 41Term deposits held by depository institutions . . . . . . . . . . . . . . . . . . . . . . . . . . . . . . 2 0 2Other deposits held by depository institutions . . . . . . . . . . . . . . . . . . . . . . . . . . . . . 984 −69 136U.S. Treasury, general account . . . . . . . . . . . . . . . . . . . . . . . . . . . . . . . . . . . . . . . . . . . . . 58 52 −50U.S. Treasury, supplementary financing account . . . . . . . . . . . . . . . . . . . . . . . . . . . 200 +* 35Other deposits . . . . . . . . . . . . . . . . . . . . . . . . . . . . . . . . . . . . . . . . . . . . . . . . . . . . . . . . . . . . . * −* −16
Total capital . . . . . . . . . . . . . . . . . . . . . . . . . . . . . . . . . . . . . . . . . . . . . . . . . . . . . . . . . . . . . . . . . 57 1 6
Unaudited. Components may not sum to totals because of rounding.* Less than $500 million.1. Face value.2. Guaranteed by Fannie Mae, Freddie Mac, and Ginnie Mae. Current face value, which is the remaining principal balance of the underlying mortgages.
Does not include unsettled transactions.3. Securities loans under the overnight facility are off-balance-sheet transactions. These loans are shown here as a memo item to indicate the portion of
securities held outright that have been lent through this program.4. Current face value. Includes commitments associated with outright purchases, dollar rolls, and coupon swaps.5. Total of primary, secondary, and seasonal credit.6. Dollar value of the foreign currency held under these agreements valued at the exchange rate to be used when the foreign currency is returned to the
foreign central bank.7. Book value.8. As of September 29, 2010, TALF LLC had purchased no assets from the FRBNY.9. Excludes credit extended to Maiden Lane II and III LLCs.10. Fair value, reflecting values as of June 30, 2010. Fair value reflects an estimate of the price that would be received upon selling an asset if the
transaction were to be conducted in an orderly market on the measurement date. Fair values are updated quarterly.
1

Figure 1. Credit and Liquidity Programs and the Federal Reserve’s Balance Sheet
2 Credit and Liquidity Programs and the Balance Sheet

currently owned by the Treasury and the Credit
Facility Trust into common equity of AIG.
• On September 23, 2010, the FRBNY published the
Reverse Repurchase Transaction Eligibility Criteria
and Application for Money Funds II, allowing a sec-
ond wave of money market mutual funds to apply to
participate in reserve repurchase (reverse repo) trans-
actions. The FRBNY also published an updated ver-
sion of the Reverse Repurchase Program Form Mas-
ter Repurchase Agreement for Money Market Mutual
Funds, including applicable Annexes.
• On October 12, 2010, the FRBNY announced
another series of small-scale, real-value reverse repo
transactions using all eligible collateral types. The
first set of operations, conducted using only the
expanded reverse repo transaction counterparties
announced on August 18, 2010, commenced the fol-
lowing day, on October 13, 2010. The second set of
operations, which was open to all eligible reverse
repo counterparties, commenced on October 18,
2010.
• On October 4, 2010, the Federal Reserve conducted
an auction of $5 billion of 28-day term deposits
through its Term Deposit Facility (TDF). The
awarded deposits settled on October 7, 2010, and
will mature on November 4, 2010. The next auction
of $5 billion of 28-day term deposits will be con-
ducted on November 29, 2010. The schedule,
amounts, and other terms for small-value auctions to
be conducted in 2011 will be announced at later
dates. On September 8, 2010, the Federal Reserve
announced that it has authorized ongoing small-value
offerings of term deposits under the TDF. The devel-
opment of the TDF and the ongoing small-value
TDF offerings are a matter of prudent planning and
have no implications for the near-term conduct of
monetary policy.
October 2010 3

System Open Market Account (SOMA)
Domestic SOMA Portfolio
Recent Developments
• The SOMA portfolio remained stable between
August 25 and September 29, 2010, as maturities of
federal agency debt securities and principal repay-
ments on holdings of mortgage-backed securities
(MBS) were offset by new purchases of Treasury
securities. This is consistent with the Federal Open
Market Committee’s (FOMC’s) August 10, 2010,
announcement to maintain domestic securities hold-
ings at their current level by reinvesting principal
payments from agency debt and agency MBS in
longer-term Treasury securities.1
• On September 23, 2010, the Federal Reserve Bank
of New York (FRBNY) published the Reverse
Repurchase Transaction Eligibility Criteria for
Money Funds II, allowing a second wave of money
market mutual funds to apply to participate in
reverse repurchase (reverse repo) transactions with
the FRBNY. The FRBNY also published an updated
version of the Reverse Repurchase Program Form
Master Repurchase Agreement for Money Funds,
including applicable Annexes, which sets out the
legal terms and conditions under which the FRBNY
and its money market mutual fund counterparties
may undertake reverse repo transactions. (This infor-
mation is available at www.newyorkfed.org/markets/
rrp_counterparties.html.) The FRBNY may engage in
these types of transactions at the direction of the
FOMC in order to drain reserves.
• On October 12, 2010, the FRBNY announced
another series of small-scale, real-value reverse repo
transactions using all eligible collateral types. The
first set of operations, conducted using only the
expanded reverse repo transaction counterparties
announced on August 18, 2010, commenced the fol-
lowing day, on October 13, 2010. The second set of
operations, which was open to all eligible reverse
repo counterparties, commenced on October 18,
2010. The results of these operations are available on
the FRBNY website at www.newyorkfed.org/
markets/omo/dmm/temp.cfm. The outstanding
amounts of reverse repos are reported in tables 1, 2,
9, and 10 of the H.4.1 statistical release. The small-
scale transactions are designed to ensure the opera-
tional readiness of the Federal Reserve, its counter-
parties, and the major clearing banks to engage in
reverse repurchase agreements. These operations do
not represent a change in the stance of monetary
policy, and no inference should be drawn about the
timing of any change in the stance of monetary
policy in the future.
Background
Open market operations (OMOs)—the purchase and
sale of securities in the open market by a central
bank—are a key tool used by the Federal Reserve in
the implementation of monetary policy. Historically,
the Federal Reserve has used OMOs to adjust the sup-
ply of reserve balances so as to keep the federal funds
rate around the target federal funds rate established by
the FOMC. OMOs are conducted by the Trading Desk
at the FRBNY, which acts as agent for the FOMC. The
range of securities that the Federal Reserve is autho-
rized to purchase and sell is relatively limited. The
authority to conduct OMOs is granted under Section
14 of the Federal Reserve Act.
OMOs can be divided into two types: permanent
and temporary. Permanent OMOs are outright pur-
chases or sales of securities for the SOMA, the Federal
Reserve’s portfolio. Permanent OMOs traditionally
have been used to accommodate the longer-term fac-
tors driving the expansion of the Federal Reserve’s
balance sheet, principally the trend growth of currency
in circulation. More recently, the expansion of SOMA
securities holdings has been driven by large-scale asset
purchase programs (LSAPs). Temporary OMOs typi-
cally are used to address reserve needs that are deemed
to be transitory in nature. These operations are either
repurchase agreements (repos) or reverse repurchase
agreements (reverse repos). Under a repo, the Trading
Desk buys a security under an agreement to resell that
security in the future; under a reverse repo, the Trading
Desk sells a security under an agreement to repurchase
that security in the future. A repo is the economic
equivalent of a collateralized loan; conversely, a
reverse repo is the economic equivalent of collateral-
ized borrowing. In both types of transactions, the dif-
ference between the purchase and sale prices reflects
the interest on the loan or borrowing. The composition
of the SOMA is presented in table 2.
Each OMO affects the Federal Reserve’s balance
sheet; the size and nature of the effect depend on the
specifics of the operation. The Federal Reserve pub-
lishes its balance sheet each week in the H.4.1 statisti-
cal release, “Factors Affecting Reserve Balances of
1. The FRBNY has published a tentative schedule for Treasurysecurity purchases at www.newyorkfed.org/markets/tot_operation_schedule.html.
4 Credit and Liquidity Programs and the Balance Sheet

Depository Institutions and Consolidated Statement of
Condition of Reserve Banks” (www.federalreserve.gov/
releases/h41). The release separately reports securities
held outright, repos, and reverse repos.
In addition, the Federal Reserve has long operated
an overnight securities lending facility as a vehicle to
address market pressures for specific Treasury securi-
ties. Since July 9, 2009, this facility has also lent
housing-related government-sponsored enterprise
(GSE) debt securities that are particularly sought after.
Amounts outstanding under this facility are reported in
table 1A of the H.4.1 statistical release.
The FRBNY’s traditional counterparties for OMOs
are the primary dealers with which the FRBNY trades
U.S. government and select other securities. In early
2010, the FRBNY revised its policy regarding the
administration of its relationships with primary dealers
in order to provide greater transparency about the sig-
nificant business standards expected of primary dealers
and to offer clearer guidance on the process to become
a primary dealer. The revised policy offers a more
structured presentation of the business standards
expected of a primary dealer; a more formal applica-
tion process for prospective primary dealers; an
increase in the minimum net capital requirement, from
$50 million to $150 million; a seasoning requirement
of one year of relevant operations before a prospective
dealer may submit an application; and a clear notice of
actions the FRBNY may take against a noncompliant
primary dealer. Since late 2009, the FRBNY has taken
steps to expand the types of counterparties for some
OMOs to include entities other than primary dealers.
Details on the counterparty expansion effort are pre-
sented below.
Large-Scale Asset Purchase Programs (LSAPs)
In November 2008, the Federal Reserve announced
that it would buy direct obligations of Fannie Mae,
Freddie Mac, and the Federal Home Loan Banks, and
MBS guaranteed by Fannie Mae, Freddie Mac, and
Ginnie Mae. The goal of these debt purchases was to
reduce the cost and increase the availability of credit
for the purchase of houses. In March 2009, the FOMC
authorized purchases of up to $1.25 trillion of agency
MBS and up to $200 billion of agency direct obliga-
tions. Subsequently, in November 2009, the FOMC
announced that agency debt purchases would be about
$175 billion. This amount, while somewhat less than
the previously announced maximum of $200 billion,
was consistent with the path of purchases and reflected
the limited availability of agency debt.
The Federal Reserve also determined that supporting
the MBS “dollar roll” market promoted the goals of
the MBS purchase program. Dollar roll transactions
consist of a purchase or sale of “to be announced”
(TBA) MBS combined with an agreement to sell or
purchase TBA MBS on a specified future date.
Because of principal and interest payments and occa-
sional delays in the settlement of transactions, the Fed-
eral Reserve also holds some cash and short-term invest-
ments associated with the MBS purchase program.
In March 2009, the FOMC announced that it would
also purchase up to $300 billion of longer-term Trea-
sury securities to help improve conditions in private
credit markets. The Federal Reserve has purchased a
range of securities across the maturity spectrum,
including Treasury Inflation-Protected Securities
(TIPS). The bulk of purchases have been in intermedi-
ate maturities. In August 2009, the FOMC announced
that it would gradually slow the pace of these transac-
tions in order to promote a smooth transition in mar-
kets as purchases of these Treasury securities were
completed. As anticipated, the purchases were com-
pleted by the end of October 2009.
The FRBNY announced in August 2009 that it
would streamline the set of external investment manag-
ers for the agency-guaranteed MBS purchase program,
reducing the number of investment managers from four
to two. As of March 2, 2010, the FRBNY began to use
its own staff on select days to transact directly in the
secondary market for agency MBS as part of the
FOMC’s LSAPs, consistent with the announcement of
November 2009. These changes were not performance-
related: the FRBNY had anticipated that it would
adjust its use of external investment managers as it
gained more experience with the program.
In September 2009, the Federal Reserve began to
purchase on-the-run agency securities—the most
recently issued securities—in order to mitigate market
dislocations and promote overall market functioning.
Prior to this change, purchases were focused on off-
the-run agency securities.
On September 23, 2009, the FOMC announced its
intention to gradually slow the pace of its purchases of
Table 2. Domestic SOMA Securities Holdings
Billions of dollars, as of September 29, 2010
Security type Total par value
U.S. Treasury bills . . . . . . . . . . . . . . . . . . . . . . . . . . . . . . . . . . . . 18U.S. Treasury notes and bonds, nominal . . . . . . . . . . . . . . 745U.S. Treasury notes and bonds, inflation-indexed1 . . . . . 48Federal agency debt securities2 . . . . . . . . . . . . . . . . . . . . . . . . 154Mortgage-backed securities3 . . . . . . . . . . . . . . . . . . . . . . . . . . . 1,079
Total SOMA securities holdings . . . . . . . . . . . . . . . . . . . . . 2,044
Note: Unaudited. Components may not sum to total because ofrounding. Does not include investments denominated in foreign cur-rencies or unsettled transactions.
1. Includes inflation compensation.2. Direct obligations of Fannie Mae, Freddie Mac, and the Federal
Home Loan Banks.3. Guaranteed by Fannie Mae, Freddie Mac, and Ginnie Mae. Current
face value of the securities, which is the remaining principal balance ofthe underlying mortgages.
October 2010 5

agency-guaranteed MBS and agency debt. In imple-
menting this directive, the Trading Desk of the
FRBNY announced that it would scale back the aver-
age weekly purchase amounts of agency MBS and
reduce the size and frequency of agency debt pur-
chases. As anticipated by the FOMC, these transactions
were completed by the end of the first quarter of 2010.
As of August 19, 2010, the settlement of all remaining
outstanding MBS from these purchases was complete.
The Federal Reserve’s outright holdings of MBS are
reported weekly in tables 1, 3, 10, and 11 of the H.4.1
statistical release. In addition, detailed data on all
settled agency MBS holdings are published weekly on
the FRBNY website at www.newyorkfed.org/markets/
soma/sysopen_accholdings.html.
On August 10, 2010, the FOMC announced that the
Federal Reserve will maintain the level of domestic
securities holdings in the SOMA portfolio by reinvest-
ing principal payments from agency debt and agency
MBS in longer-term Treasury securities. As of August
4, 2010, outright holdings of securities in the SOMA
portfolio totaled roughly $2 trillion. The FRBNY has
published a tentative schedule for Treasury security
purchases at www.newyorkfed.org/markets/
tot_operation_schedule.html.
Reverse Repurchase Agreements (Reverse Repos)
In December 2009, the FRBNY conducted its first set
of small-scale, real-value, triparty reverse repos with
primary dealers. Reverse repos are a tool that could be
used to support a reduction in monetary accommoda-
tion at the appropriate time. These transactions were
conducted to ensure operational readiness at the Fed-
eral Reserve, the major clearing banks, and the pri-
mary dealers, and had no material impact on the avail-
ability of reserves or on market rates. In August 2010,
the FRBNY conducted another series of small-scale,
real-value reverse repos with primary dealers using all
eligible collateral types, including, for the first time,
agency MBS from the SOMA portfolio. The results of
these operations are available on the FRBNY website
at www.newyorkfed.org/markets/omo/dmm/temp.cfm.
The outstanding amounts of reverse repos are reported
in tables 1, 2, 9, and 10 of the H.4.1 statistical release.
On March 8, 2010, the FRBNY announced the
beginning of a program to expand its counterparties for
conducting reverse repos. This expansion is intended to
enhance the capacity of such operations to drain
reserves beyond what could likely be conducted
through primary dealers. The additional counterparties
will not be eligible to participate in transactions con-
ducted by the FRBNY other than reverse repos. Over
time, the FRBNY expects that it will modify the coun-
terparty criteria to include a broader set of counterpar-
ties and anticipates that it will publish criteria for addi-
tional types of firms and for expanded eligibility
within previously identified types of firms. In this con-
text, the FRBNY published the Reverse Repurchase
Transaction Eligibility Criteria for Money Funds for
the first set of expanded counterparties, domestic
money market mutual funds, and on April 30, 2010,
published the Reverse Repurchase Program Form Mas-
ter Repurchase Agreement for Money Funds, which
sets out the legal terms and conditions under which the
FRBNY and its money market mutual fund counterpar-
ties may undertake reverse repos. Updated versions of
these publications were released by the FRBNY in
September 2010 for a second wave of money market
mutual fund counterparties.
On August 18, 2010, the FRBNY published a list of
money market funds that are now eligible to partici-
pate as counterparties to reverse repos with the Federal
Reserve. Each listed fund submitted an application and
meets the criteria published by the FRBNY on March
8, 2010. Inclusion on the list does not constitute a pub-
lic endorsement by the FRBNY of any listed counter-
party and should not substitute for prudent counter-
party risk management and due diligence. The list is
available on the FRBNY’s website at www.newyorkfed
.org/markets/expanded_counterparties.html.
These activities with respect to reverse repos are a
matter of prudent advance planning by the Federal
Reserve. They do not represent any change in the
stance of monetary policy, and no inference should be
drawn about the timing of any change in the stance of
monetary policy in the future.
Liquidity Arrangements with Foreign CentralBanks (FCBs)
Recent Developments
• Amounts outstanding under the dollar liquidity swap
arrangements rose very modestly in September 2010.
As presented in table 3, the total amount of liquidity
provided under these lines was $0.1 billion as of
September 29, 2010.
Background
Because of the global character of bank funding mar-
kets, the Federal Reserve has at times coordinated with
other central banks to provide liquidity. During the
financial crisis, the Federal Reserve entered into agree-
ments to establish temporary reciprocal currency
arrangements (central bank liquidity swap lines) with a
number of foreign central banks (FCBs). Two types of
6 Credit and Liquidity Programs and the Balance Sheet

temporary swap lines were established: dollar liquidity
lines and foreign currency liquidity lines. These tempo-
rary arrangements expired on February 1, 2010. How-
ever, in May 2010, temporary dollar liquidity swap
lines were re-established with certain FCBs in order to
address the re-emergence of strains in global U.S. dol-
lar short-term funding markets.
The FRBNY operates the swap lines under the
authority granted under Section 14 of the Federal
Reserve Act and in compliance with authorizations,
policies, and procedures established by the FOMC.
Dollar Liquidity Swaps
On December 12, 2007, the FOMC announced that it
had authorized dollar liquidity swap lines with the
European Central Bank and the Swiss National Bank
to provide liquidity in U.S. dollars to overseas markets.
Subsequently, the FOMC authorized dollar liquidity
swap lines between the Federal Reserve and each of
the following FCBs: the Reserve Bank of Australia, the
Banco Central do Brasil, the Bank of Canada, the
Bank of Japan, Danmarks Nationalbank, the Bank of
England, the European Central Bank, the Bank of
Korea, the Banco de Mexico, the Reserve Bank of
New Zealand, Norges Bank, the Monetary Authority of
Singapore, Sveriges Riksbank, and the Swiss National
Bank. These temporary dollar liquidity swap arrange-
ments expired on February 1, 2010. In May 2010, the
FOMC re-authorized dollar liquidity swap lines with
the Bank of Canada, the Bank of England, the Euro-
pean Central Bank, the Bank of Japan, and the Swiss
National Bank through January 2011.
Swaps under these lines consist of two transactions.
When an FCB draws on its swap line with the
FRBNY, the FCB sells a specified amount of its cur-
rency to the FRBNY in exchange for dollars at the
prevailing market exchange rate. The FRBNY holds
the foreign currency in an account at the FCB. The
dollars that the FRBNY provides are then deposited in
an account that the FCB maintains at the FRBNY. At
the same time, the FRBNY and the FCB enter into a
binding agreement for a second transaction that obli-
gates the FCB to buy back its currency on a specified
future date at the same exchange rate. The second
transaction unwinds the first at the same exchange rate
used in the initial transaction; as a result, the recorded
value of the foreign currency amounts is not affected
by changes in the market exchange rate. At the conclu-
sion of the second transaction, the FCB compensates
the FRBNY at a market-based interest rate.
When the FCB lends the dollars it obtained by
drawing on its swap line to institutions in its jurisdic-
tion, the dollars are transferred from the FCB account
at the FRBNY to the account of the bank that the bor-
rowing institution uses to clear its dollar transactions.
The FCB is obligated to return the dollars to the
FRBNY under the terms of the agreement, and the
FRBNY is not a counterparty to the loan extended by
the FCB. The FCB bears the credit risk associated with
the loans it makes to institutions in its jurisdiction.
The foreign currency that the Federal Reserve
acquires in these transactions is recorded as an asset
on the Federal Reserve’s balance sheet. In tables 1, 10,
and 11 of the weekly H.4.1 statistical release, the dol-
lar value of amounts that the FCBs have drawn but not
yet repaid is reported in the line entitled “Central bank
liquidity swaps.” Dollar liquidity swaps have maturities
ranging from overnight to three months. Table 2 of the
H.4.1 statistical release reports the maturity distribution
of the outstanding dollar liquidity swaps. Detailed
information about drawings on the swap lines by the
participating FCBs is presented on the FRBNY’s web-
site at www.newyorkfed.org/markets/fxswap.
Foreign-Currency Liquidity Swap Lines
On April 6, 2009, the FOMC announced foreign-
currency liquidity swap lines with the Bank of
England, the European Central Bank, the Bank of
Japan, and the Swiss National Bank. These lines were
designed to provide the Federal Reserve with the
capacity to offer liquidity to U.S. institutions in foreign
currency should a need arise. These lines mirrored the
existing dollar liquidity swap lines, which provided
FCBs with the capacity to offer U.S. dollar liquidity to
financial institutions in their jurisdictions. Foreign-
currency swap lines provided the Federal Reserve with
the ability to address financial strains by providing
foreign currency-denominated liquidity to U.S. institu-
tions in amounts of up to £30 billion (sterling), €80
billion (euro), ¥10 trillion (yen), and CHF 40 billion
(Swiss francs). The Federal Reserve did not draw on
these swap lines, and they expired on February 1,
2010.
Table 3. Amounts Outstanding under Dollar LiquiditySwaps
As of September 29, 2010
Central bankAmount
($ billions)Settlement
dateTerm
Interestrate
Bank of Canada . . . . . . . . — — — —Bank of England . . . . . . . — — — —Bank of Japan . . . . . . . . . * 7/15/2010 84-day 1.21%European Central Bank . 0.1 9/23/2010 7-day 1.18%Swiss National Bank . . . — — — —Total . . . . . . . . . . . . . . . . . . . 0.1 — — —
Note: Unaudited. Components may not sum to totals because ofrounding.
* Less than $50 million.
October 2010 7

Lending Facilities to Support Overall Market Liquidity
Lending to Depository Institutions
Recent Developments
• Credit provided to depository institutions through the
discount window increased slightly in September
2010, but remains generally around the levels seen
prior to 2007. As presented in table 6, the lendable
value of collateral pledged by depository institutions
with discount window loans outstanding on Septem-
ber 29, 2010, was about $4 billion; discount window
credit outstanding on that date amounted to $175
million.
Background
The discount window helps to relieve liquidity strains
for individual depository institutions and for the bank-
ing system as a whole by providing a source of fund-
ing in times of need. Much of the statutory framework
that governs lending to depository institutions is con-
tained in Section 10B of the Federal Reserve Act, as
amended. The general policies that govern discount
window lending are set forth in the Federal Reserve
Board’s Regulation A.
Depository institutions have, since 2003, had access
to three types of discount window credit—primary
credit, secondary credit, and seasonal credit. Primary
credit is available to depository institutions in gener-
ally sound financial condition with few administrative
requirements. Secondary credit may be provided to
depository institutions that do not qualify for primary
credit, subject to review by the lending Reserve Bank.
Seasonal credit provides short-term funds to smaller
depository institutions that experience regular seasonal
swings in loans and deposits.
On August 17, 2007, in order to promote orderly
market functioning, the Federal Reserve narrowed the
spread between the primary credit rate (generally
referred to as the discount rate) and the Federal Open
Market Committee’s (FOMC’s) target federal funds
rate to 50 basis points and began to allow the provi-
sion of primary credit for terms as long as 30 days. On
March 16, 2008, the Federal Reserve further narrowed
the spread between the primary credit rate and the tar-
get federal funds rate to 25 basis points, and increased
the maximum maturity of primary credit loans to 90
days.
On November 17, 2009, in response to improved
financial conditions, the Federal Reserve announced
that the maximum maturity on primary credit loans
would be reduced to 28 days effective January 14,
2010. On February 18, 2010, the Federal Reserve
increased the spread between the primary credit rate
and the top of the target range for the federal funds
rate to 50 basis points, effective February 19, 2010.
The Federal Reserve also announced that, effective
March 18, 2010, the typical maximum maturity of pri-
mary credit loans would be shortened to overnight.
These changes represented further normalization of the
Federal Reserve’s lending facilities and did not signal
any change in the outlook for the economy or for
monetary policy.
On August 6, 2010, the Federal Reserve announced
changes to its practices for disclosure of discount win-
dow lending information in accordance with the provi-
sions of the Dodd-Frank Wall Street Reform and Con-
sumer Protection Act. For discount window loans
extended to depository institutions on or after July 21,
2010, the Federal Reserve will publicly disclose certain
information about the transaction approximately two
years after the loan was extended. The disclosure will
include the name and identifying details of the deposi-
tory institution, the amount borrowed, the interest rate
paid, and information identifying the types and amount
of collateral pledged. More detail on these changes is
reported on the Federal Reserve’s Discount Window
website at www.frbdiscountwindow.org.
In extending credit to depository institutions, the
Federal Reserve closely monitors the financial condi-
Table 4. Discount Window Credit Outstanding toDepository Institutions
Daily average borrowing for each class of borrower over five weeksending September 29, 2010
Type and size of borrowerAverage
number ofborrowers1
Averageborrowing
($ billions)2
Commercial banks3
Assets: more than $50 billion . . . . . . . . . . . * **Assets: $5 billion to $50 billion . . . . . . . . . * **Assets: $250 million to $5 billion . . . . . . . 4 **Assets: less than $250 million . . . . . . . . . . . 34 **
Thrift institutions and credit unions . . . . . . . . 1 **Total . . . . . . . . . . . . . . . . . . . . . . . . . . . . . . . . . . . . . . . 39 **
Note: Unaudited. Includes primary, secondary, and seasonal credit. Sizecategories based on total domestic assets from Call Report data as ofJune 30, 2010. Components may not sum to totals because of rounding.
* Fewer than one borrower.** Less than $500 million.1. Average daily number of depository institutions with credit
outstanding. Over this period, a total of 230 institutions borrowed.2. Average daily borrowing by all depositories in each category.3. Includes branches and agencies of foreign banks.
8 Credit and Liquidity Programs and the Balance Sheet

tion of borrowers. Monitoring the financial condition
of depository institutions is a four-step process
designed to minimize the risk of loss to the Federal
Reserve posed by weak or failing depository institu-
tions. The first step is monitoring, on an ongoing basis,
the safety and soundness of all depository institutions
that access or may access the discount window and the
payment services provided by the Federal Reserve. The
second step is identifying institutions whose condition,
characteristics, or affiliation would present higher-than-
acceptable risk to the Federal Reserve in the absence
of controls on their access to Federal Reserve lending
facilities and other Federal Reserve services. The third
step is communicating—to staff within the Federal
Reserve System and to other supervisory agencies, if
and when necessary—relevant information about those
institutions identified as posing higher risk. The fourth
step is implementing appropriate measures to mitigate
the risks posed by such entities.
At the heart of the condition-monitoring process is
an internal rating system that provides a framework for
identifying institutions that may pose undue risks to
the Federal Reserve. The rating system relies mostly
on information from each institution’s primary supervi-
sor, including CAMELS ratings, to identify potentially
problematic institutions and classify them according to
the severity of the risk they pose to the Federal
Reserve.2 Having identified institutions that pose a
higher risk, the Federal Reserve then puts in place a
standard set of risk controls that become increasingly
stringent as the risk posed by an institution grows;
individual Reserve Banks may implement additional
risk controls to further mitigate risk if they deem it
necessary.
Collateral
All extensions of discount window credit by the Fed-
eral Reserve must be secured to the satisfaction of the
lending Reserve Bank by “acceptable collateral.”
Assets accepted as collateral are assigned a lendable
value deemed appropriate by the Reserve Bank; lend-
able value is determined as the market price of the
asset, less a haircut. When a market price is not avail-
able, a haircut may be applied to the outstanding bal-
ance or a valuation based on an asset’s cash flow.
Haircuts reflect credit risk and, for traded assets, the
historical volatility of the asset’s price and the liquidity
of the market in which the asset is traded; the Federal
Reserve’s haircuts are generally in line with typical
2. CAMELS (Capital, Assets, Management, Earnings, Liquidity,and Sensitivity) is a rating system employed by banking regulatorsto assess the soundness of commercial banks and thrifts. Similar rat-ing systems are used for other types of depository institutions.
Table 5. Concentration of Discount Window CreditOutstanding to Depository Institutions
For five weeks ending September 29, 2010
Rank by amount of borrowingNumber ofborrowers
Daily averageborrowing($ billions)
Top five . . . . . . . . . . . . . . . . . . . . . . . . . . . . . . . . . 5 *Next five . . . . . . . . . . . . . . . . . . . . . . . . . . . . . . . . 5 *Other . . . . . . . . . . . . . . . . . . . . . . . . . . . . . . . . . . . . 29 *Total . . . . . . . . . . . . . . . . . . . . . . . . . . . . . . . . . . . . 39 *
Note: Unaudited. Amount of primary, secondary, and seasonal creditextended to the top five and next five borrowers on each day, as rankedby daily average borrowing. Components may not sum to totals becauseof rounding.
* Less than $500 million.
Table 6. Lendable Value of Collateral Pledged byBorrowing Depository Institutions
Billions of dollars, as of September 29, 2010
Type of collateral Lendable value
LoansCommercial . . . . . . . . . . . . . . . . . . . . . . . . . . . . . . . . . . . . . . . . . 2Residential mortgage . . . . . . . . . . . . . . . . . . . . . . . . . . . . . . . *Commercial real estate . . . . . . . . . . . . . . . . . . . . . . . . . . . . . 1Consumer . . . . . . . . . . . . . . . . . . . . . . . . . . . . . . . . . . . . . . . . . . . 1
SecuritiesU.S. Treasury/agency . . . . . . . . . . . . . . . . . . . . . . . . . . . . . . . *Municipal . . . . . . . . . . . . . . . . . . . . . . . . . . . . . . . . . . . . . . . . . . . *Corporate market instruments . . . . . . . . . . . . . . . . . . . . . . . *MBS/CMO: agency-guaranteed . . . . . . . . . . . . . . . . . . . . . *MBS/CMO: other . . . . . . . . . . . . . . . . . . . . . . . . . . . . . . . . . . . *Asset-backed . . . . . . . . . . . . . . . . . . . . . . . . . . . . . . . . . . . . . . . 0International (sovereign, agency, municipal,
and corporate) . . . . . . . . . . . . . . . . . . . . . . . . . . . . . . . . . . . . 0Total . . . . . . . . . . . . . . . . . . . . . . . . . . . . . . . . . . . . . . . . . . . . . . . . . . 4
Note: Unaudited. Collateral pledged by borrowers of primary,secondary, and seasonal credit as of the date shown. Total primary,secondary, and seasonal credit on this date was $175 million. Thelendable value of collateral pledged by all depository institutions,including those without any outstanding loans, was $1,333 billion.Lendable value is value after application of appropriate haircuts.Components may not sum to total because of rounding.
* Less than $500 million.
Table 7. Lendable Value of Securities Pledged byDepository Institutions by Rating
Billions of dollars, as of September 29, 2010
Type of security and rating Lendable value
U.S. Treasury, agency, and agency-guaranteed securities . 201Other securities
AAA . . . . . . . . . . . . . . . . . . . . . . . . . . . . . . . . . . . . . . . . . . . . . . . . . . 193Aa/AA1 . . . . . . . . . . . . . . . . . . . . . . . . . . . . . . . . . . . . . . . . . . . . . . . 47A2 . . . . . . . . . . . . . . . . . . . . . . . . . . . . . . . . . . . . . . . . . . . . . . . . . . . . . 48Baa/BBB3 . . . . . . . . . . . . . . . . . . . . . . . . . . . . . . . . . . . . . . . . . . . . . 14Other investment-grade4 . . . . . . . . . . . . . . . . . . . . . . . . . . . . . . . 36
Total . . . . . . . . . . . . . . . . . . . . . . . . . . . . . . . . . . . . . . . . . . . . . . . . . . . . . 539
Note: Unaudited. Lendable value for all institutions that have pledgedcollateral, including those that were not borrowing on the date shown.Lendable value is value after application of appropriate haircuts.Components may not sum to total because of rounding.
1. Includes short-term securities with A-1+ or F1+ rating or MIG 1 orSP-1+ municipal bond rating.
2. Includes short-term securities with A-1 or F1 rating or SP-1municipal bond rating.
3. Includes short-term securities with A-2, P-2, A-3, or P-3 rating.4. Determined based on a credit review by a Reserve Bank.
October 2010 9

market practice. The Federal Reserve applies larger
haircuts, and thus assigns lower lendable values, to
assets for which no market price is available relative to
comparable assets for which a market price is avail-
able. A borrower may be required to pledge additional
collateral if its financial condition weakens. Collateral
is pledged by depository institutions under the terms
and conditions specified in the Federal Reserve Banks’
standard lending agreement, Operating Circular No. 10
(www.frbservices.org/files/regulations/pdf/
operating_circular_10.pdf).
Discount window loans are generally made with
recourse to the borrower beyond the pledged collateral.
Nonetheless, collateral plays an important role in miti-
gating the credit risk associated with these extensions
of credit. The Federal Reserve generally accepts as
collateral for discount window loans any assets that
meet regulatory standards for sound asset quality. This
category of assets includes most performing loans and
most investment-grade securities, although for some
types of securities (including commercial mortgage-
backed securities, collateralized debt obligations, col-
lateralized loan obligations, and certain non-dollar-
denominated foreign securities) only AAA-rated
securities are accepted. An institution may not pledge
as collateral any instruments that the institution or its
affiliates have issued. To ensure that they can borrow
from the Federal Reserve should the need arise, many
depository institutions that do not have an outstanding
discount window loan nevertheless routinely pledge
collateral.
The Federal Reserve periodically reviews its collat-
eral valuation practices. The most recent changes to
the lending margins on discount window collateral
took effect on October 19, 2009, and reflected the
results of a broad-based review, which began before
the financial crisis, of methodology and data sources.
For more information on collateral margins, refer to
the Discount Window and Payments System Risk pub-
lic website, www.frbdiscountwindow.org.
As presented in table 8, depository institutions that
borrow from the Federal Reserve generally maintain
collateral in excess of their current borrowing levels.
Term Asset-Backed Securities Loan Facility(TALF)
Recent Developments
• As previously announced, the TALF was closed for
new loan extensions as of June 30, 2010. As of Sep-
tember 29, 2010, the number of TALF borrowers and
loans outstanding had declined from their levels in
August, primarily reflecting loan prepayments by
borrowers. TALF LLC, formed to purchase and man-
age assets received by the Federal Reserve Bank of
New York (FRBNY) from the TALF program,
remains in operation, but as of September 29, 2010,
TALF LLC had not purchased any assets from the
FRBNY.
Background
On November 25, 2008, the Federal Reserve
announced the creation of the TALF under the author-
ity of Section 13(3) of the Federal Reserve Act. The
TALF is a funding facility under which the FRBNY
was authorized to extend up to $200 billion of credit
to holders of eligible asset-backed securities (ABS).3
The TALF was intended to assist financial markets in
accommodating the credit needs of consumers and
businesses of all sizes by facilitating the issuance of
ABS collateralized by a variety of consumer and busi-
ness loans; it was also intended to improve market
conditions for ABS more generally. TALF loans
backed by commercial mortgage-backed securities
(CMBS) or by ABS backed by government guaranteed
loans have maturities of up to five years; all other
TALF loans have three-year maturities. Using funds
authorized under the Troubled Assets Relief Program
(TARP) of the Emergency Economic Stabilization Act
3. For additional information on the TALF, refer towww.federalreserve.gov/monetarypolicy/bst_lendingother.htm.
Table 8. Discount Window Credit Outstanding toBorrowing Depository Institutions—Percent of CollateralUsed
As of September 29, 2010
Percent of collateral usedNumber ofborrowers
Totalborrowing($ billions)
More than 0 and less than 25 . . . . . . . . . . . . . . 18 *25 to 50 . . . . . . . . . . . . . . . . . . . . . . . . . . . . . . . . . . . 5 *50 to 75 . . . . . . . . . . . . . . . . . . . . . . . . . . . . . . . . . . . 5 *75 to 90 . . . . . . . . . . . . . . . . . . . . . . . . . . . . . . . . . . . 7 *More than 90 . . . . . . . . . . . . . . . . . . . . . . . . . . . . . . 4 *Total . . . . . . . . . . . . . . . . . . . . . . . . . . . . . . . . . . . . . . . 39 *
Note: Unaudited. Components may not sum to totals because ofrounding.
*Less than $500 million.
Table 9. TALF: Number of Borrowers and LoansOutstanding
As of September 29, 2010
Lending programNumber ofborrowers
Borrowing($ billions)1
Non-CMBS . . . . . . . . . . . . . . . . . . . . . . . . . . . . . . . . 76 25CMBS . . . . . . . . . . . . . . . . . . . . . . . . . . . . . . . . . . . . . 48 6Total . . . . . . . . . . . . . . . . . . . . . . . . . . . . . . . . . . . . . . . 106 31
Note: Unaudited. “Number of borrowers” may not sum to totalbecause borrowers may be included in more than one category.“Borrowing” amounts may not sum to total because of rounding.
1. Book value.
10 Credit and Liquidity Programs and the Balance Sheet

of 2008, the U.S. Treasury committed to provide $20
billion in credit protection to the FRBNY in connec-
tion with the TALF to support the $200 billion of
authorized lending value under the program. This com-
mitment was reduced to $4.3 billion in July 2010 to
reflect the fact that only $43 billion of TALF loans
were outstanding when the program was closed to new
lending.
Eligible collateral for TALF loans included U.S.
dollar-denominated ABS backed by student loans, auto
loans, credit card loans, equipment loans, floorplan
loans, insurance premium finance loans, loans guaran-
teed by the Small Business Administration (SBA), resi-
dential mortgage servicing advances, or commercial
mortgages. At the time a TALF loan was extended, all
eligible collateral was required to have a credit rating
in the highest investment-grade rating category from
two or more eligible nationally recognized statistical
rating organizations (NRSROs) and could not have a
credit rating below the highest investment-grade rating
category from an eligible NRSRO. Certain collateral
also had to pass an internal risk assessment by the
FRBNY.
Additionally, all or substantially all of the credit
exposures underlying eligible ABS were required to be
exposures to U.S.-domiciled obligors or with respect to
real property located in the United States or its territo-
ries. Except for ABS for which the underlying credit
exposures are SBA-guaranteed loans, eligible newly
issued ABS must have been issued on or after January
1, 2009. Eligible legacy CMBS must have been issued
before January 1, 2009, must be senior in payment
priority to all other interests in the underlying pool of
commercial mortgages, and must meet certain other
criteria designed to protect the Federal Reserve and the
Treasury from credit risk. Collateral would not be
accepted from a particular borrower if the collateral
was backed by loans originated or securitized by that
borrower or its affiliate except in very limited
circumstances.
The loans provided through the TALF were designed
to be limited in recourse to the collateral, generally
allowing borrowers the option of surrendering the col-
lateral to the FRBNY in full satisfaction of the TALF
loan. The FRBNY’s loan is secured by the ABS collat-
eral, with the FRBNY lending an amount equal to the
market value of the ABS, less a haircut. The haircut is
a buffer which protects the FRBNY against a decline
in the collateral’s value. The Federal Reserve set initial
haircuts for each type of eligible collateral to reflect an
assessment of the riskiness and maturity of the various
types of eligible ABS. Breakdowns of TALF collateral
by underlying loan type and credit rating are shown in
tables 10 and 11, respectively.
Consistent with previous announcements, the Federal
Reserve closed the TALF for new loan extensions
against newly issued CMBS on June 30, 2010, and for
new loans against all other types of collateral on
March 31, 2010. TALF loans extended by the FRBNY
during this program will mature over the next several
years, with all loans maturing no later than March 30,
2015.
TALF LLC
TALF LLC, a limited liability company, was formed to
purchase and manage any ABS that might be surren-
dered by a TALF borrower or otherwise claimed by
the FRBNY in connection with its enforcement rights
to the TALF collateral. In certain limited circum-
stances, TALF LLC may also purchase TALF program
loans from the FRBNY. TALF LLC has committed to
purchase, for a fee, all such assets at a price equal to
the TALF loan, plus accrued but unpaid interest.
Purchases of these securities are funded first through
the fees received by TALF LLC and any interest TALF
LLC has earned on its investments. In the event that
Table 10. TALF Collateral by Underlying Loan Type
Billions of dollars, as of September 29, 2010
Type of collateral Value
By underlying loan typeAuto . . . . . . . . . . . . . . . . . . . . . . . . . . . . . . . . . . . . . . . . . . . . . . . . . . 2Commercial mortgages: 7
Newly issued . . . . . . . . . . . . . . . . . . . . . . . . . . . . . . . . . . . . . . . 0Legacy . . . . . . . . . . . . . . . . . . . . . . . . . . . . . . . . . . . . . . . . . . . . . . 7
Credit card . . . . . . . . . . . . . . . . . . . . . . . . . . . . . . . . . . . . . . . . . . . . 10Equipment . . . . . . . . . . . . . . . . . . . . . . . . . . . . . . . . . . . . . . . . . . . . *Floorplan . . . . . . . . . . . . . . . . . . . . . . . . . . . . . . . . . . . . . . . . . . . . . . 4Premium finance . . . . . . . . . . . . . . . . . . . . . . . . . . . . . . . . . . . . . . 2Servicing advances . . . . . . . . . . . . . . . . . . . . . . . . . . . . . . . . . . . . 1Small business . . . . . . . . . . . . . . . . . . . . . . . . . . . . . . . . . . . . . . . . 1Student loan . . . . . . . . . . . . . . . . . . . . . . . . . . . . . . . . . . . . . . . . . . . 8Total . . . . . . . . . . . . . . . . . . . . . . . . . . . . . . . . . . . . . . . . . . . . . . . . . . 34
Note: Unaudited. Components may not sum to total because ofrounding. Data represent the face value of collateral.
* Less than $500 million.
Table 11. TALF Collateral by Rating
Billions of dollars, as of September 29, 2010
Type of collateral Value
Asset-backed securities with minimum rating of:1
AAA/Aaa . . . . . . . . . . . . . . . . . . . . . . . . . . . . . . . . . . . . . . . . . . . 34AA+/Aa+ to AA-/Aa- . . . . . . . . . . . . . . . . . . . . . . . . . . . . . . 0
Total . . . . . . . . . . . . . . . . . . . . . . . . . . . . . . . . . . . . . . . . . . . . . . . . . . 34
Note: Unaudited. Components may not sum to total because ofrounding. Data represent the face value of collateral.
1. Eligible ABS collateral for the TALF was required to have a creditrating in the highest investment-grade rating category from at least twoeligible NRSROs and could not have a credit rating below the highestinvestment-grade rating category from an eligible NRSRO. When pledgedcollateral is downgraded below the highest investment-grade rating,existing loans against the collateral remain outstanding.
October 2010 11

Table 12A. Issuers of Non-CMBS that CollateralizeOutstanding TALF Loans
As of September 29, 2010
Issuers
AH Mortgage Advance Trust 2009-ADV3Ally Master Owner TrustAmerican Express Credit Account Master TrustAmeriCredit Automobile Receivables Trust 2009-1ARI Fleet Lease Trust 2010-ABank of America Auto Trust 2009-1BMW Floorplan Master Owner TrustBMW Vehicle Lease Trust 2009-1Cabela’s Credit Card Master Note TrustCarMax Auto Owner Trust 2009-1CarMax Auto Owner Trust 2009-AChase Issuance TrustChesapeake Funding LLCChrysler Financial Auto Securitization Trust 2009-ACIT Equipment Collateral 2009-VT1CIT Equipment Collateral 2010-VT1Citibank Omni Master TrustCitiFinancial Auto Issuance Trust 2009-1CNH Equipment Trust 2009-BCNH Wholesale Master Note TrustDiscover Card Execution Note TrustFIFC Premium Funding LLCFirst National Master Note TrustFord Credit Auto Lease Trust 2009-AFord Credit Auto Owner Trust 2009-AFord Credit Auto Owner Trust 2009-BFord Credit Floorplan Master Owner Trust AGE Capital Credit Card Master Note TrustGE Dealer Floorplan Master Note TrustGreat America Leasing Receivables Funding, L.L.C.Harley-Davidson Motorcycle Trust 2009-2Honda Auto Receivables 2009-2 Owner TrustMarlin Leasing Receivables XII LLCNavistar Financial Dealer Note Master Owner TrustNissan Auto Lease Trust 2009-AOCWEN Servicer Advance Receivables Funding Company II LTD.PFS Financing Corp.SLC Private Student Loan Trust 2009-ASLC Private Student Loan Trust 2010-BSLM Private Education Loan Trust 2009-BSLM Private Education Loan Trust 2009-CSLM Private Education Loan Trust 2009-CTSLM Private Education Loan Trust 2009-DSLM Private Education Loan Trust 2010-AU.S. Small Business AdministrationVolkswagen Auto Lease Trust 2009-AWHEELS SPV, LLCWorld Financial Network Credit Card Master Note TrustWorld Omni Auto Receivables Trust 2009-AWorld Omni Master Owner Trust
Table 12B. Issuers of Newly Issued CMBS thatCollateralize Outstanding TALF Loans
As of September 29, 2010
Issuers1
1. There are no outstanding TALF loans collateralized with newlyissued CMBS.
Table 12C. Issuers of Legacy CMBS that CollateralizeOutstanding TALF Loans
As of September 29, 2010
Issuers
Banc of America Commercial Mortgage Inc. Series 2004-2Banc of America Commercial Mortgage Inc. Series 2005-1Banc of America Commercial Mortgage Inc. Series 2005-3Banc of America Commercial Mortgage Inc. Series 2005-5Banc of America Commercial Mortgage Inc. Series 2005-6Banc of America Commercial Mortgage Trust 2006-1Banc of America Commercial Mortgage Trust 2006-2Banc of America Commercial Mortgage Trust 2006-4Banc of America Commercial Mortgage Trust 2006-5Banc of America Commercial Mortgage Trust 2006-6Banc of America Commercial Mortgage Trust 2007-1Banc of America Commercial Mortgage Trust 2007-2Banc of America Commercial Mortgage Trust 2007-3Banc of America Commercial Mortgage Trust 2007-5Bear Stearns Commercial Mortgage Securities Trust 2004-PWR4Bear Stearns Commercial Mortgage Securities Trust 2004-TOP16Bear Stearns Commercial Mortgage Securities Trust 2005-PWR7Bear Stearns Commercial Mortgage Securities Trust 2005-PWR8Bear Stearns Commercial Mortgage Securities Trust 2005-PWR9Bear Stearns Commercial Mortgage Securities Trust 2005-PWR10Bear Stearns Commercial Mortgage Securities Trust 2005-TOP18Bear Stearns Commercial Mortgage Securities Trust 2005-TOP20Bear Stearns Commercial Mortgage Securities Trust 2006-PWR11Bear Stearns Commercial Mortgage Securities Trust 2006-PWR12Bear Stearns Commercial Mortgage Securities Trust 2006-PWR13Bear Stearns Commercial Mortgage Securities Trust 2006-PWR14Bear Stearns Commercial Mortgage Securities Trust 2006-TOP24Bear Stearns Commercial Mortgage Securities Trust 2007-PWR16Bear Stearns Commercial Mortgage Securities Trust 2007-PWR17Bear Stearns Commercial Mortgage Securities Trust 2007-PWR18Bear Stearns Commercial Mortgage Securities Trust 2007-TOP26CD 2005-CD1 Commercial Mortgage TrustCD 2006-CD2 Mortgage TrustCD 2006-CD3 Mortgage TrustCD 2007-CD4 Commercial Mortgage TrustCitigroup Commercial Mortgage Trust 2004-C1Citigroup Commercial Mortgage Trust 2008-C7COBALT CMBS Commercial Mortgage Trust 2006-C1COBALT CMBS Commercial Mortgage Trust 2007-C3COMM 2004-LNB2 Mortgage TrustCOMM 2005-C6 Mortgage TrustCOMM 2005-LP5 Mortgage TrustCOMM 2006-C7 Mortgage TrustCOMM 2006-C8 Mortgage TrustCommercial Mortgage Loan Trust 2008-LS1Commercial Mortgage Trust 2004-GG1Commercial Mortgage Trust 2005-GG3Commercial Mortgage Trust 2005-GG5Commercial Mortgage Trust 2007-GG9Credit Suisse Commercial Mortgage Trust Series 2006-C1Credit Suisse Commercial Mortgage Trust Series 2006-C3Credit Suisse Commercial Mortgage Trust Series 2006-C4Credit Suisse Commercial Mortgage Trust Series 2006-C5Credit Suisse Commercial Mortgage Trust Series 2007-C1Credit Suisse Commercial Mortgage Trust Series 2007-C2Credit Suisse Commercial Mortgage Trust Series 2007-C3Credit Suisse Commercial Mortgage Trust Series 2007-C4CSFB Commercial Mortgage Trust 2004-C1CSFB Commercial Mortgage Trust 2004-C3CSFB Commercial Mortgage Trust 2005-C1CSFB Commercial Mortgage Trust 2005-C3CSFB Commercial Mortgage Trust 2005-C4CSFB Commercial Mortgage Trust 2005-C5CSFB Commercial Mortgage Trust 2005-C6GE Commercial Mortgage Corporation Series 2004-C3GE Commercial Mortgage Corporation Series 2005-C1GE Commercial Mortgage Corporation Series 2005-C4GE Commercial Mortgage Corporation Series 2007-C1 TrustGMAC Commercial Mortgage Securities, Inc. Series 2006-C1 TrustGS Mortgage Securities Corporation II Series 2005-GG4GS Mortgage Securities Trust 2006-GG6GS Mortgage Securities Trust 2006-GG8GS Mortgage Securities Trust 2007-GG10
12 Credit and Liquidity Programs and the Balance Sheet

such funding proves insufficient, the U.S. Treasury’s
Troubled Asset Relief Program (TARP) will provide
additional subordinated debt funding to TALF LLC to
finance up to $4.3 billion of asset purchases. Subse-
quently, the FRBNY will finance any additional pur-
chases of securities by providing senior debt funding
to TALF LLC. Thus, the TARP funds provide credit
protection to the FRBNY. Financial information on
TALF LLC is reported weekly in tables 1, 2, 8, 10,
and 11 of the H.4.1 statistical release. As of September
29, 2010, TALF LLC had purchased no assets from the
FRBNY.
Table 12C. Issuers of Legacy CMBS that CollateralizeOutstanding TALF Loans—Continued
As of September 29, 2010
Issuers
J.P. Morgan Chase Commercial Mortgage Securities Corp. Series2004-C2
J.P. Morgan Chase Commercial Mortgage Securities Corp. Series2004-C3
J.P. Morgan Chase Commercial Mortgage Securities Corp. Series2004-CIBC8
J.P. Morgan Chase Commercial Mortgage Securities Corp. Series2004-CIBC10
J.P. Morgan Chase Commercial Mortgage Securities Corp. Series2004-PNC1
J.P. Morgan Chase Commercial Mortgage Securities Corp. Series2005-CIBC11
J.P. Morgan Chase Commercial Mortgage Securities Corp. Series2005-CIBC13
J.P. Morgan Chase Commercial Mortgage Securities Corp. Series2005-LDP3
J.P. Morgan Chase Commercial Mortgage Securities Corp. Series2005-LDP4
J.P. Morgan Chase Commercial Mortgage Securities Corp. Series2005-LDP5
J.P. Morgan Chase Commercial Mortgage Securities Trust 2006-CIBC14J.P. Morgan Chase Commercial Mortgage Securities Trust 2006-CIBC15J.P. Morgan Chase Commercial Mortgage Securities Trust 2006-CIBC16J.P. Morgan Chase Commercial Mortgage Securities Trust 2006-LDP7J.P. Morgan Chase Commercial Mortgage Securities Trust 2006-LDP8J.P. Morgan Chase Commercial Mortgage Securities Trust 2006-LDP9J.P. Morgan Chase Commercial Mortgage Securities Trust 2007-CIBC20J.P. Morgan Chase Commercial Mortgage Securities Trust 2007-LDP11J.P. Morgan Chase Commercial Mortgage Securities Trust 2007-LDP12LB Commercial Mortgage Trust 2007-C3LB-UBS Commercial Mortgage Trust 2004-C1LB-UBS Commercial Mortgage Trust 2004-C4LB-UBS Commercial Mortgage Trust 2004-C7LB-UBS Commercial Mortgage Trust 2005-C2LB-UBS Commercial Mortgage Trust 2005-C3LB-UBS Commercial Mortgage Trust 2006-C1LB-UBS Commercial Mortgage Trust 2006-C3LB-UBS Commercial Mortgage Trust 2006-C6LB-UBS Commercial Mortgage Trust 2006-C7LB-UBS Commercial Mortgage Trust 2007-C1LB-UBS Commercial Mortgage Trust 2007-C2LB-UBS Commercial Mortgage Trust 2007-C6LB-UBS Commercial Mortgage Trust 2007-C7Merrill Lynch Mortgage Trust 2004-KEY2Merrill Lynch Mortgage Trust 2005-CIP1Merrill Lynch Mortgage Trust 2007-C1ML-CFC Commercial Mortgage Trust 2006-4ML-CFC Commercial Mortgage Trust 2007-5ML-CFC Commercial Mortgage Trust 2007-6ML-CFC Commercial Mortgage Trust 2007-7ML-CFC Commercial Mortgage Trust 2007-8Morgan Stanley Capital I Trust 2005-HQ5Morgan Stanley Capital I Trust 2005-HQ6Morgan Stanley Capital I Trust 2005-HQ7Morgan Stanley Capital I Trust 2005-IQ9Morgan Stanley Capital I Trust 2006-HQ10Morgan Stanley Capital I Trust 2006-IQ11Morgan Stanley Capital I Trust 2006-TOP21Morgan Stanley Capital I Trust 2007-HQ11Morgan Stanley Capital I Trust 2007-IQ13Morgan Stanley Capital I Trust 2007-IQ14Morgan Stanley Capital I Trust 2007-IQ15Morgan Stanley Capital I Trust 2007-TOP27
Table 12C. Issuers of Legacy CMBS that CollateralizeOutstanding TALF Loans—Continued
As of September 29, 2010
Issuers
Wachovia Bank Commercial Mortgage Trust Series 2004-C14Wachovia Bank Commercial Mortgage Trust Series 2005-C16Wachovia Bank Commercial Mortgage Trust Series 2005-C17Wachovia Bank Commercial Mortgage Trust Series 2005-C18Wachovia Bank Commercial Mortgage Trust Series 2005-C19Wachovia Bank Commercial Mortgage Trust Series 2005-C20Wachovia Bank Commercial Mortgage Trust Series 2005-C22Wachovia Bank Commercial Mortgage Trust Series 2006-C24Wachovia Bank Commercial Mortgage Trust Series 2006-C25Wachovia Bank Commercial Mortgage Trust Series 2006-C27Wachovia Bank Commercial Mortgage Trust Series 2006-C28Wachovia Bank Commercial Mortgage Trust Series 2006-C29Wachovia Bank Commercial Mortgage Trust Series 2007-C30Wachovia Bank Commercial Mortgage Trust Series 2007-C31Wachovia Bank Commercial Mortgage Trust Series 2007-C32Wachovia Bank Commercial Mortgage Trust Series 2007-C33Wachovia Bank Commercial Mortgage Trust Series 2007-C34
October 2010 13
Lending in Support of Specific Institutions
Quarterly Developments
• Cash flows generated from the Maiden Lane II LLC
and Maiden Lane III LLC portfolios are used to pay
down the Federal Reserve Bank of New York’s
(FRBNY’s) loans to those LLCs. For the second
quarter of 2010, repayments totaled approximately
$2 billion, as presented in tables 18 and 21.
Background
During the financial crisis, the Federal Reserve
extended credit to certain specific institutions in order
to avert disorderly failures that could result in severe
dislocations and strains for the financial system as a
whole and harm the U.S. economy. In certain other
cases, the Federal Reserve committed to extend credit,
if necessary, to support important financial firms.
Bear Stearns and Maiden Lane LLC
In March 2008, the FRBNY and JPMorgan Chase &
Co. (JPMC) entered into an arrangement related to
financing provided by the FRBNY to facilitate the
merger of JPMC and The Bear Stearns Companies Inc.
(Bear Stearns). In connection with the transaction, the
Federal Reserve Board authorized the FRBNY, under
Section 13(3) of the Federal Reserve Act, to extend
credit to a Delaware limited liability company, Maiden
Lane LLC, to partially fund the purchase of a portfolio
of mortgage-related securities, residential and commer-
cial mortgage loans, and associated hedges from Bear
Stearns. In the second quarter of 2008, the FRBNY
extended credit to Maiden Lane LLC. The LLC man-
ages its assets through time to maximize the repayment
of credit extended to the LLC and to minimize disrup-
tion to the financial markets.
The two-year accumulation period that followed the
closing date for Maiden Lane LLC ended on June 26,
2010. Consistent with the terms of the Maiden Lane
LLC transaction, the distribution of the proceeds real-
ized on the asset portfolio held by Maiden Lane LLC,
after payment of certain fees and expenses, will occur
on a monthly basis going forward unless otherwise
directed by the Federal Reserve. The monthly distribu-
tions will be used to cover the expenses and repay the
obligations of the LLC, including the principal and
interest on the loan from the FRBNY.
The assets of Maiden Lane LLC are presented
weekly in tables 1, 10, and 11 of the H.4.1 statistical
release. Additional details on the accounts of Maiden
Lane LLC are presented in table 4 of the H.4.1 statisti-
cal release. Details of the terms of the loan, as well as
Table 13. Fair Value Asset Coverage
Millions of dollars
Fair value assetcoverage of FRBNYloan on 6/30/2010
Fair value assetcoverage of FRBNYloan on 3/31/2010
Maiden Lane LLC . . . . . . . (17) (1,255)Maiden Lane II LLC . . . . . 1,652 915Maiden Lane III LLC . . . . 7,453 6,374
Note: Unaudited. Fair value asset coverage is the amount by which thefair value of the net portfolio assets of each LLC (refer to table 27) isgreater or less than the outstanding balance of the loans extended by theFRBNY, including accrued interest.
Table 14. Maiden Lane LLC Outstanding PrincipalBalance of Loans
Millions of dollars
FRBNYsenior loan
JPMCsubordinate
loan
Principal balance at closing . . . . . . . . . . . . . . . . 28,820 1,150
Most Recent Quarterly ActivityPrincipal balance on 3/31/2010 (including
accrued and capitalized interest) . . . . . . . . . 29,276 1,264Accrued and capitalized interest
from 3/31/2010 to 6/30/2010 . . . . . . . . . . . . 55 17Repayment during the period from
3/31/2010 to 6/30/2010 . . . . . . . . . . . . . . . . . . — —Principal balance on 6/30/2010 (including
accrued and capitalized interest) . . . . . . . . . 29,331 1,280
Note: Unaudited. As part of the asset purchase agreement, JPMC madea loan to Maiden Lane LLC. For repayment purposes, this obligation issubordinated to the senior loan extended by the FRBNY.
Table 15. Maiden Lane LLC Summary of PortfolioComposition, Cash and Cash Equivalents, and OtherAssets and Liabilities
Millions of dollars
Fair value on6/30/2010
Fair value on3/31/2010
Federal Agency and GSE MBS . . . . . . . . 19,880 18,794Non-agency RMBS . . . . . . . . . . . . . . . . . . . . 1,922 1,936Commercial loans . . . . . . . . . . . . . . . . . . . . . . 4,823 4,464Residential loans . . . . . . . . . . . . . . . . . . . . . . . 611 604Swap contracts1 . . . . . . . . . . . . . . . . . . . . . . . . 958 903Other investments . . . . . . . . . . . . . . . . . . . . . . 1,029 969Cash and cash equivalents . . . . . . . . . . . . . 1,299 1,229Other assets2 . . . . . . . . . . . . . . . . . . . . . . . . . . . 463 297Other liabilities1,3 . . . . . . . . . . . . . . . . . . . . . . (1,671) (1,173)Net assets . . . . . . . . . . . . . . . . . . . . . . . . . . . . . . 29,314 28,022
Note: Unaudited. Components may not sum to totals because ofrounding.
1. Fair value of swap contracts is presented net of associated liabilities.2. Including interest and principal receivable and other assets.3. Including amounts payable for securities purchased, collateral posted
to Maiden Lane LLC by swap counterparties, and other liabilities andaccrued expenses.
14 Credit and Liquidity Programs and the Balance Sheet

information on the holdings of the Maiden Lane LLC,
including the CUSIP number, descriptor, and the cur-
rent principal balance or notional amount outstanding
for nearly all of the holdings of Maiden Lane LLC
with the exception of residential whole loans, is pub-
lished on the FRBNY website at www.newyorkfed.org/
markets/maidenlane.html.
Information about the assets and liabilities of
Maiden Lane LLC is presented as of June 30, 2010, in
tables 14 through 16 and figure 2. This information is
updated on a quarterly basis.
American International Group, Inc. (AIG)
Recent Developments
• On September 30, 2010, AIG announced an agree-
ment with the U.S. Department of the Treasury, the
Federal Reserve Bank of New York (FRBNY), and
the trustees of the AIG Credit Facility Trust on a
comprehensive recapitalization plan designed to
repay all its obligations to American taxpayers.4 The
measures include an accelerated repayment of the
outstanding balance (including all accrued interest
and fees) on the FRBNY revolving credit facility
and termination of that facility, the acquisition of the
majority of the FRBNY’s preferred interests in the
AIA and ALICO special purpose vehicles (SPVs) by
the U.S. Treasury, and the conversion of the AIG
preferred stock currently owned by the Treasury and
the Credit Facility Trust into common equity of AIG.
Under the plan, AIG expects to repay the revolving
credit facility with parent company resources as well
as with proceeds from asset dispositions currently
underway, including the initial public offering of
AIA and the pending sale of ALICO to MetLife, Inc.
• To facilitate the acquisition of the FRBNY’s pre-
ferred interests in the AIA and ALICO SPVs by the
U.S. Treasury, AIG will draw down up to $22 billion
4. The AIG Credit Facility Trust, which was established for thesole benefit of the U.S. Treasury, holds the U.S. government’s equityinterest in AIG that was received as a condition of the AIG creditagreement. For more information about the AIG Credit FacilityTrust, refer to www.newyorkfed.org/newsevents/news/markets/2009/an090116.html and www.newyorkfed.org/newsevents/news/markets/2010/Trust_FAQ_Final.pdf
Table 16. Maiden Lane LLC Securities Distribution by Sector and Rating
Percent, as of June 30, 2010
Sector1
Rating
AAA AA+ to AA- A+ to A-BBB+ to
BBB-BB+ and
lowerGov’t/Agency
Not rated Total
Federal Agency and GSE MBS . . 0.0 0.0 0.0 0.0 0.0 87.1 0.0 87.1Non-agency RMBS . . . . . . . . . . . . . . 0.3 0.4 0.5 0.2 7.1 0.0 0.0 8.4Other2 . . . . . . . . . . . . . . . . . . . . . . . . . . . . 1.0 0.5 0.3 1.3 1.3 0.1 0.1 4.5Total . . . . . . . . . . . . . . . . . . . . . . . . . . . . . 1.2 0.9 0.8 1.5 8.4 87.1 0.1 100.0
Note: Unaudited. This table presents the sector and ratings composition of the securities in the Maiden Lane LLC portfolio as a percentage of allsecurities in the portfolio. It is based on the fair value of the securities. Lowest of all ratings is used for purposes of this table. Rows and columns may notsum to totals because of rounding.
1. Does not include Maiden Lane LLC’s swaps and other derivative contracts and commercial and residential mortgage loans.2. Includes all asset sectors that, individually, represent less than 5 percent of the aggregate fair value of securities in the portfolio.
Figure 2. Maiden Lane LLC Securities Distribution as of June 30, 2010
October 2010 15

of undrawn Series F funds available to the company
under the Troubled Asset Relief Program (TARP) to
purchase an equal amount of the FRBNY’s preferred
interests in the SPVs. Immediately thereafter, AIG
will transfer these interests to the U.S. Treasury as
consideration for the Series F preferred shares. AIG
also will apply the proceeds of future asset disposi-
tions, including the announced sales of the AIG Star
Life Insurance Co. and AIG Edison Life Insurance,
discussed below, to retire the remainder of the
FRBNY’s SPV preferred interests. AIG expects that
it will have repaid the FRBNY in full for the revolv-
ing credit facility and preferred interests upon
completion of these transactions.
• Also on September 30, 2010, AIG announced a
definitive agreement to sell its Japan-based life insur-
ance subsidiaries, AIG Star Life Insurance Co., Ltd.
and AIG Edison Life Insurance Company, to Pruden-
tial Financial, Inc., for a total purchase price of $4.8
billion, comprising $4.2 billion in cash and $0.6 bil-
lion in the assumption of third-party debt. The trans-
action is subject to receipt of regulatory approval
and is expected to close in the first quarter of 2011.
• As of September 29, 2010, the maximum principal
amount of credit available under the AIG revolving
credit facility was reduced from $30.0 billion to
approximately $29.3 billion in connection with sales
of Sun America Affordable Housing Partnership tax
credits, Transatlantic Holdings, Inc. stock, and Harch
CLO III Limited, Class A-1 Floating Rate Notes.
• The balance on the AIG revolving credit facility
decreased by $0.5 million between August 25 and
September 29, 2010, as presented in table 17A. The
decline was primarily attributable to principal repay-
ments and reductions, which outpaced principal
drawdowns on the facility.
Background
On September 16, 2008, the Federal Reserve, with the
full support of the Treasury Department, announced
that it would lend to AIG to prevent a disorderly fail-
ure of this systemically important firm, protect the
financial system and the broader economy, and provide
the company time to restructure its operations in an
orderly manner. Initially, the FRBNY extended an $85
billion line of credit to the company. The terms of the
credit facility are disclosed on the Board’s website at
www.federalreserve.gov/monetarypolicy/
bst_supportspecific.htm. Loans outstanding under this
facility are presented weekly in table 1 of the H.4.1
statistical release and included in “Other loans” in
tables 10 and 11 of the H.4.1 statistical release.
On November 10, 2008, the Federal Reserve and the
Treasury announced a restructuring of the govern-
ment’s financial support to AIG. As part of this
restructuring, two new limited liability companies
(LLCs), Maiden Lane II LLC and Maiden Lane III
LLC, were created, and the line of credit extended to
AIG was reduced from $85 billion to $60 billion. (On
October 8, 2008, the FRBNY was authorized to extend
credit under a special securities borrowing facility to
certain AIG subsidiaries. This arrangement was discon-
tinued after the establishment of the Maiden Lane II
facility.) More detail on these LLCs is reported in the
remainder of this section. Additional information is
included in tables 5 and 6 of the H.4.1 statistical
release.
On March 2, 2009, the Federal Reserve and the
Treasury announced further restructuring of the gov-
ernment’s assistance to AIG, designed to enhance the
company’s capital and liquidity in order to facilitate
the orderly completion of the company’s global dives-
titure program. Additional information on the restruc-
turing is available at www.federalreserve.gov/
newsevents/press/other/20090302a.htm.
On April 17, 2009, the FRBNY implemented a loan
restructuring adjustment that was previously approved
and announced on March 2, 2009. The interest rate on
the loan to AIG, the three-month Libor plus 300 basis
points, was modified by removing the existing interest
rate floor of 3.5 percent on the Libor component. Con-
sistent with generally accepted accounting principles
(GAAP), as of July 29, 2009, the reported value of the
AIG revolving credit extension was reduced by a $1.3
billion adjustment to reflect the loan restructuring. This
restructuring adjustment is intended to recognize the
Table 17A. AIG Revolving Credit Facility
Millions of dollars
Value
Balance on August 25, 2010 . . . . . . . . . . . . . . . . . . . . . . . . . . 19,444Principal drawdowns . . . . . . . . . . . . . . . . . . . . . . . . . . . . . . . 1,000Principal repayments and reductions . . . . . . . . . . . . . . . . (1,603)Recapitalized interest and fees . . . . . . . . . . . . . . . . . . . . . . 17Restructuring allowance, net . . . . . . . . . . . . . . . . . . . . . . . . 46
Balance on September 29, 2010 . . . . . . . . . . . . . . . . . . . . . . . 18,904
Note: Unaudited. Components may not sum to total because ofrounding. Does not include Maiden Lane II LLC and Maiden Lane IIILLC. Does not include preferred interests in AIA Aurora LLC andALICO Holdings LLC.
Table 17B. Preferred Interests in AIA Aurora LLC andALICO Holdings LLC
Millions of dollars
Balance on September 29, 2010 Value
Preferred Interests in AIA Aurora LLC and ALICOHoldings LLC1 . . . . . . . . . . . . . . . . . . . . . . . . . . . . . . . . . . . . . 25,733
Accrued dividends on preferred interests in AIAAurora LLC and ALICO Holdings LLC . . . . . . . . . . . . 321
Note: Unaudited.1. Book value.
16 Credit and Liquidity Programs and the Balance Sheet

economic effect of the reduced interest rate and will be
recovered as the adjustment is amortized over the
remaining term of the credit extension. The Federal
Reserve expects that the credit extension, including
interest and commitment fees under the modified
terms, will be fully repaid.
The lending under this facility is secured by a
pledge of assets of AIG and its primary nonregulated
subsidiaries, including all or a substantial portion of
AIG’s ownership interest in its regulated U.S. and for-
eign subsidiaries. Furthermore, AIG’s obligations to
the FRBNY are guaranteed by certain domestic, non-
regulated subsidiaries of AIG with more than $50 mil-
lion in assets.
On June 25, 2009, the FRBNY entered into agree-
ments with AIG to carry out two transactions previ-
ously approved and announced on March 2, 2009, as
part of the restructuring of the U.S. government’s
assistance to AIG. These transactions were completed
on December 1, 2009. Under these agreements, the
FRBNY received preferred interests in two special pur-
pose vehicles (SPVs), AIA Aurora LLC and ALICO
Holdings LLC, formed to hold the outstanding com-
mon stock of AIG’s largest foreign insurance subsidiar-
ies, AIA Group, Limited (AIA) and American Life
Insurance Company (ALICO). In exchange, upon the
closing of each transaction and the resulting issuance
of preferred interests, the outstanding balance of, and
amount available excluding capitalized interest and
fees to AIG under, the revolving credit facility was
reduced by $25 billion. Specifically, the maximum
amount available was reduced from $60 billion to $35
billion. By establishing the AIA and ALICO SPVs as
separate legal entities, these transactions positioned
AIA and ALICO for future initial public offerings
(IPOs) or sale. On the H.4.1 statistical release, accrued
but unpaid dividends on the preferred interests in the
two SPVs are included in “Other Federal Reserve
assets” in table 1, and in “Other assets” in tables 10
and 11.
On March 1, 2010, AIG announced the signing of a
definitive agreement for the sale of AIA to Prudential
plc (Prudential) for approximately $35.5 billion,
including approximately $25 billion in cash, $8.5 bil-
lion in face value of equity and equity-linked securi-
ties, and $2.0 billion in face value of preferred stock
of Prudential, subject to closing adjustments. AIG
stated that the cash portion of the proceeds from the
sale would be used to fully redeem the approximately
$16 billion of preferred interests held by the FRBNY
in the SPV that holds AIA, and to repay approximately
$9 billion of its borrowing under the revolving credit
facility with the FRBNY. The transaction was
approved by the boards of directors of both AIG and
Figure 3. AIG Revolving Credit
Note: The above data illustrate selected components of the amount of credit extended to the American International Group, Inc., including loan prin-cipal, all capitalized interest and fees, and the amortized portion of the initial commitment fee. The data exclude commercial paper sold by AIG andits subsidiaries to the Commercial Paper Funding Facility as well as amounts borrowed prior to December 12, 2008, under a securities borrowingarrangement. The facility ceiling represents the limit on the credit agreement plus capitalized interest and fees. From November 7, 2008, untilDecember 1, 2009, the ceiling was $60 billion (excluding capitalized interest and fees); on December 1, 2009, it was reduced to $35 billion. Theceiling continues to decrease as a result of asset sales.
October 2010 17

Prudential, and was expected to close by the end of
2010, subject to approval by Prudential shareholders,
regulatory approvals, and customary closing
conditions.
In early June 2010, in response to efforts by Pruden-
tial to negotiate for a lower purchase price of $30.4
billion, AIG announced that it would not consider
modification to the agreed-upon terms (described
above) of the transaction. Subsequently, Prudential
announced its intention to not proceed with the trans-
action. On June 3, 2010, Prudential and AIG confirmed
that the parties had agreed to terminate the definitive
agreement for the sale of AIA, as provided for in the
sale agreement. In July 2010, AIG announced plans to
conduct an initial public offering of AIA by seeking a
listing of AIA on the Hong Kong Stock Exchange.
On March 8, 2010, AIG announced the signing of a
definitive agreement for the sale of ALICO to MetLife,
Inc. for approximately $15.5 billion, including $6.8
billion in cash and the remainder in equity securities of
MetLife, subject to closing adjustments. AIG stated
that the cash portion of the proceeds from this sale
would be used to redeem an equivalent amount of the
approximately $9 billion of preferred interests held by
the FRBNY in the SPV that holds ALICO. The trans-
action was approved by the boards of directors of both
AIG and MetLife, and is expected to close by the end
of 2010, subject to the approvals of certain domestic
and international regulatory bodies and to customary
closing conditions. AIG has stated that it intends to
monetize the securities received in the ALICO transac-
tion over time, subject to market conditions, following
the lapse of certain minimum holding periods set forth
in the definitive agreement entered into with Metlife.
Excess cash proceeds and proceeds from AIG’s efforts
to monetize the securities received in the transaction
will be used to redeem any outstanding preferred inter-
ests and then to repay outstanding amounts borrowed
under the revolving credit facility with the FRBNY.
Under the AIG revolving credit facility, as a general
matter, all net cash proceeds received from the sale by
AIG of its subsidiaries or businesses (other than sales
in the ordinary course of business) must be applied to
pay down outstanding borrowings under the facility
(and related accrued and unpaid interest) unless other-
wise waived. Additionally, the maximum amount of
available credit to AIG under the revolving credit facil-
ity is reduced by the amount of net cash proceeds
applied to pay the principal amount of outstanding bor-
rowings under the facility, unless such requirement is
waived by the FRBNY. Between March and September
2010, the maximum amount available under the AIG
revolving credit facility was reduced from $34.4 billion
to approximately $29.3 billion in connection with
AIG’s sale of interests in several subsidiaries. The
largest payment, of approximately $3.95 billion, was
made on August 20, 2010. AIG funded this payment
with proceeds from the issuance of senior secured
notes by International Lease Finance Corporation, a
wholly owned subsidiary.
Figure 3 presents the amount of credit extended to
AIG over time through the credit facility, including the
principal, interest, and commitment fees, along with
the facility ceiling.
Maiden Lane II LLC
Pursuant to authority granted by the Federal Reserve
Board under Section 13(3) of the Federal Reserve Act,
the FRBNY, on December 12, 2008, lent approxi-
mately $19.5 billion to a newly formed Delaware lim-
ited liability company, Maiden Lane II LLC, to par-
tially fund the purchase of residential mortgage-backed
securities (RMBS) from the securities lending portfolio
of several regulated U.S. insurance subsidiaries of
AIG. Maiden Lane II LLC acquired the RMBS, which
had an aggregate par value of approximately $39.3
billion, at the then-current market value of the RMBS
of approximately $20.8 billion, which was substantially
below par value.5 The full portfolio of RMBS held by
Maiden Lane II LLC serves as collateral for the Fed-
eral Reserve’s loan to Maiden Lane II LLC. AIG’s
insurance subsidiaries also have a $1 billion subordi-
nated position in Maiden Lane II LLC that is available
to absorb first any losses that may be realized.
The net portfolio holdings of Maiden Lane II LLC
are presented in tables 1, 10, and 11 of the weekly
H.4.1 statistical release. Additional detail on the
accounts of Maiden Lane II LLC is presented in table
5 of the H.4.1 statistical release. Details on the terms
of the loan, as well as information on the holdings of
the Maiden Lane II LLC, including the CUSIP num-
ber, descriptor, and the current principal balance or
notional amount outstanding for all the positions in the
portfolio, is published on the FRBNY website at
www.newyorkfed.org/markets/maidenlane2.html.
Information about the assets and liabilities of
Maiden Lane II LLC is presented as of June 30, 2010,
in tables 18 through 20 and figure 4. This information
is updated on a quarterly basis.
5. The aggregate amount of interest and principal proceeds fromRMBS received after the announcement date, but prior to the settle-ment date, net of financing costs, amounted to approximately $0.3billion and therefore reduced the amount of funding required atsettlement by $0.3 billion, from $20.8 billion to $20.5 billion.
18 Credit and Liquidity Programs and the Balance Sheet

Table 18. Maiden Lane II LLC Outstanding PrincipalBalance of Senior Loan and Fixed Deferred PurchasePrice
Millions of dollars
FRBNYsenior loan
AIG fixeddeferredpurchase
price
Principal balance at closing . . . . . . . . . . . . . . . . 19,494 1,000
Most Recent Quarterly ActivityPrincipal balance on 3/31/2010 (including
accrued and capitalized interest) . . . . . . . . . 15,283 1,045Accrued and capitalized interest
3/31/2010 to 6/30/2010 . . . . . . . . . . . . . . . . . . 48 9Repayment during the period from
3/31/2010 to 6/30/2010 . . . . . . . . . . . . . . . . . . (660) —Principal balance on 6/30/2010 (including
accrued and capitalized interest) . . . . . . . . . 14,672 1,053
Note: Unaudited. As part of the asset purchase agreement, AIGsubsidiaries were entitled to receive from Maiden Lane II LLC a fixeddeferred purchase price plus interest on the amount. This obligation issubordinated to the senior loan extended by the FRBNY, and it reducedthe amount paid by Maiden Lane II LLC for the assets by acorresponding amount.
Table 19. Maiden Lane II LLC Summary of RMBSPortfolio Composition, Cash and Cash Equivalents, andOther Assets and Liabilities
Millions of dollars
Fair value on6/30/2010
Fair value on3/31/2010
Alt-A ARM . . . . . . . . . . . . . . . . . . . . . . . . . . . . 4,957 4,934Subprime . . . . . . . . . . . . . . . . . . . . . . . . . . . . . . . 8,781 8,791Option ARM . . . . . . . . . . . . . . . . . . . . . . . . . . . 1,089 1,032Other1 . . . . . . . . . . . . . . . . . . . . . . . . . . . . . . . . . . 1,264 1,225Cash and cash equivalents . . . . . . . . . . . . . 230 220Other assets2 . . . . . . . . . . . . . . . . . . . . . . . . . . . 4 3Other liabilities3 . . . . . . . . . . . . . . . . . . . . . . . . (1) (7)Net assets . . . . . . . . . . . . . . . . . . . . . . . . . . . . . . 16,323 16,198
Note: Unaudited. Components may not sum to totals because ofrounding.
1. Includes all asset sectors that, individually, represent less than5 percent of aggregate outstanding fair value of securities in theportfolio.
2. Including interest and principal receivable and other receivables.3. Including accrued expenses and other payables.
Table 20. Maiden Lane II LLC Securities Distribution by Sector and Rating
Percent, as of June 30, 2010
RMBS sectorRating
AAA AA+ to AA- A+ to A- BBB+ to BBB- BB+ and lower Total
Alt-A ARM . . . . . . . . . . . . . . . . . . . . . . 0.4 2.8 1.4 1.3 24.9 30.8Subprime . . . . . . . . . . . . . . . . . . . . . . . . . 4.9 2.9 2.2 1.3 43.3 54.6Option ARM . . . . . . . . . . . . . . . . . . . . . 0.0 0.0 0.0 0.1 6.7 6.8Other1 . . . . . . . . . . . . . . . . . . . . . . . . . . . . 0.1 0.5 0.0 0.1 7.2 7.9Total . . . . . . . . . . . . . . . . . . . . . . . . . . . . . 5.3 6.2 3.7 2.7 82.1 100.0
Note: Unaudited. This table presents the sector and ratings composition of Maiden Lane II LLC’s RMBS portfolio as a percentage of aggregate fairvalue of the securities in the portfolio. Lowest of all ratings is used for the purposes of this table. Rows and columns may not sum to totals because ofrounding.
1. Includes all asset sectors that, individually, represent less than 5 percent of the aggregate fair value of securities in the portfolio.
Figure 4. Maiden Lane II LLC Securities Distribution as of June 30, 2010
October 2010 19

Maiden Lane III LLC
Pursuant to authority granted by the Federal Reserve
Board under Section 13(3) of the Federal Reserve Act,
the FRBNY in November and December 2008, lent
approximately $24.3 billion to a newly formed Dela-
ware limited liability company, Maiden Lane III LLC,
to fund the purchase of certain asset-backed collateral-
ized debt obligations (ABS CDOs) from certain coun-
terparties of AIG Financial Products Corp. (AIGFP) on
which AIGFP had written credit default swaps and
similar contracts. Maiden Lane III LLC acquired these
CDOs, which had an aggregate par value of approxi-
mately $62.1 billion, at the then-current market value
of the CDOs of approximately $29.6 billion, which
was substantially below par value.6 The full portfolio
of CDOs held by Maiden Lane III LLC serves as col-
lateral for the Federal Reserve’s loan to Maiden Lane
III LLC. An AIG subsidiary also has a $5 billion
6. The aggregate amount of interest and principal proceeds fromCDOs received after the announcement date, but prior to the settle-ment dates, net of financing costs, amounted to approximately$0.3 billion and therefore reduced the amount of funding required atsettlement by $0.3 billion, from $29.6 billion to $29.3 billion.
Table 21. Maiden Lane III LLC Outstanding PrincipalBalance of Senior Loan and Equity Contribution
Millions of dollars
FRBNYsenior loan
AIG equitycontribution
Principal balance at closing . . . . . . . . . . . . . . . . 24,339 5,000
Most Recent Quarterly ActivityPrincipal balance on 3/31/2010 (including
accrued and capitalized interest) . . . . . . . . . 17,324 5,235Accrued and capitalized interest
3/31/2010 to 6/30/2010 . . . . . . . . . . . . . . . . . . 54 43Repayment during the period from
3/31/2010 to 6/30/2010 . . . . . . . . . . . . . . . . . . (1,083) —Principal balance on 6/30/2010 (including
accrued and capitalized interest) . . . . . . . . . 16,294 5,278
Note: Unaudited. As part of the asset purchase agreement, AIGpurchased a $5 billion equity contribution, which is subordinated to thesenior loan extended by the FRBNY.
Table 22. Maiden Lane III LLC Summary of PortfolioComposition, Cash and Cash Equivalents, and OtherAssets and Liabilities
Millions of dollars
Fair value on6/30/2010
Fair value on3/31/2010
High-grade ABS CDO . . . . . . . . . . . . . . . . . 15,500 15,437Mezzanine ABS CDO . . . . . . . . . . . . . . . . . . 1,997 2,098Commercial real estate CDO . . . . . . . . . . . 5,564 5,517RMBS, CMBS, and Other . . . . . . . . . . . . . 266 269Cash and cash equivalents . . . . . . . . . . . . . 390 354Other assets1 . . . . . . . . . . . . . . . . . . . . . . . . . . . 32 28Other liabilities2 . . . . . . . . . . . . . . . . . . . . . . . . (3) (5)Net assets . . . . . . . . . . . . . . . . . . . . . . . . . . . . . . 23,747 23,699
Note: Unaudited. Components may not sum to totals because ofrounding.
1. Including interest and principal receivable and other receivables.2. Including accrued expenses.
Table 23. Maiden Lane III LLC Securities Distribution by Sector, Vintage, and Rating
Percent, as of June 30, 2010
Sector and vintage1Rating
AAA AA+ to AA- A+ to A- BBB+ to BBB- BB+ and lower Total
High-grade ABS CDO . . . . . . . . . . . . . 0.0 0.0 0.0 0.0 66.4 66.4Pre-2005 . . . . . . . . . . . . . . . . . . . . . . . . . 0.0 0.0 0.0 0.0 22.8 22.82005 . . . . . . . . . . . . . . . . . . . . . . . . . . . . . 0.0 0.0 0.0 0.0 30.2 30.22006 . . . . . . . . . . . . . . . . . . . . . . . . . . . . . 0.0 0.0 0.0 0.0 6.7 6.72007 . . . . . . . . . . . . . . . . . . . . . . . . . . . . . 0.0 0.0 0.0 0.0 6.8 6.8
Mezzanine ABS CDO . . . . . . . . . . . . . . 0.0 0.0 0.0 0.1 8.4 8.6Pre-2005 . . . . . . . . . . . . . . . . . . . . . . . . . 0.0 0.0 0.0 0.1 5.1 5.22005 . . . . . . . . . . . . . . . . . . . . . . . . . . . . . 0.0 0.0 0.0 0.0 2.7 2.72006 . . . . . . . . . . . . . . . . . . . . . . . . . . . . . 0.0 0.0 0.0 0.0 0.0 0.02007 . . . . . . . . . . . . . . . . . . . . . . . . . . . . . 0.0 0.0 0.0 0.0 0.7 0.7
Commercial real estate CDO . . . . . . . 0.9 0.6 0.0 0.0 22.4 23.9Pre-2005 . . . . . . . . . . . . . . . . . . . . . . . . . 0.9 0.6 0.0 0.0 3.1 4.52005 . . . . . . . . . . . . . . . . . . . . . . . . . . . . . 0.0 0.0 0.0 0.0 0.0 0.02006 . . . . . . . . . . . . . . . . . . . . . . . . . . . . . 0.0 0.0 0.0 0.0 0.0 0.02007 . . . . . . . . . . . . . . . . . . . . . . . . . . . . . 0.0 0.0 0.0 0.0 19.4 19.4
RMBS, CMBS, and Other . . . . . . . . . 0.1 0.2 0.1 0.1 0.7 1.1Pre-2005 . . . . . . . . . . . . . . . . . . . . . . . . . 0.0 0.0 0.0 0.0 0.1 0.22005 . . . . . . . . . . . . . . . . . . . . . . . . . . . . . 0.1 0.1 0.1 0.1 0.5 0.92006 . . . . . . . . . . . . . . . . . . . . . . . . . . . . . 0.0 0.0 0.0 0.0 0.1 0.12007 . . . . . . . . . . . . . . . . . . . . . . . . . . . . . 0.0 0.0 0.0 0.0 0.0 0.0
Total . . . . . . . . . . . . . . . . . . . . . . . . . . . . . . . 0.9 0.7 0.1 0.2 98.0 100.0
Note: Unaudited. This table presents the sector, vintage, and rating composition of the securities in the Maiden Lane III LLC portfolio as a percentageof all securities in the portfolio. It is based on the fair value of the securities. Lowest of all ratings is used for purposes of this table. Rows and columnsmay not sum to totals because of rounding.
1. The year of issuance with the highest concentration of underlying assets as measured by outstanding principal balance determines the vintage of theCDO.
20 Credit and Liquidity Programs and the Balance Sheet

subordinated position in Maiden Lane III LLC that is
available to absorb first any losses that may be real-
ized. Assets of the portfolio of the LLC will be man-
aged to maximize cash flows to ensure repayment of
obligations of the LLC while minimizing disruptions to
financial markets.
The net portfolio holdings of Maiden Lane III LLC
are presented in tables 1, 10, and 11 of the weekly
H.4.1 statistical release. Additional detail on the
accounts of Maiden Lane III LLC is presented in table
6 of the H.4.1 statistical release. Information on the
holdings of the Maiden Lane III LLC, including the
CUSIP number, descriptor, and the current principal
balance or notional amount outstanding for all the
positions in the portfolio, is published on the FRBNY
website at www.newyorkfed.org/markets/
maidenlane3.html.
Information about the assets and liabilities of
Maiden Lane III LLC is presented as of June 30, 2010,
in tables 21 through 23 and figure 5. This information
is updated on a quarterly basis.
Figure 5. Maiden Lane III LLC Securities Distribution as of June 30, 2010
October 2010 21

Federal Reserve Banks’ Financial Tables
Quarterly Developments
• The average daily balance of the Federal Reserve
System Open Market Account (SOMA) holdings was
approximately $2.1 trillion during the first half of
2010, as presented in table 25. Net earnings from the
portfolio were approximately $36.9 billion; most of
the earnings were attributable to interest income on
U.S. Treasury securities and federal agency and
government-sponsored enterprise (GSE) mortgage-
backed securities (MBS).
• Interest earned from Federal Reserve lending pro-
grams was approximately $1.3 billion during the first
half of 2010, as presented in table 26; interest earned
on credit extended to American International Group,
Inc. (AIG) and loans made by the Term Asset-
Backed Securities Loan Facility (TALF) accounted
for most of the total.
• Net income reported on the consolidated financial
statements of the Federal Reserve Bank of New York
(FRBNY) includes changes in valuation for the
Maiden Lane, Maiden Lane II, and Maiden Lane III
LLCs, which were approximately $2.3 billion, $0.7
billion, and $1.6 billion, respectively, in the second
quarter of 2010. Net income for the Commercial
Paper Funding Facility (CPFF) LLC was approxi-
mately $0.2 billion in the first half of 2010, as pre-
sented in table 27.
• After providing for the payment of dividends and
reserving an amount necessary to equate surplus with
capital paid in, distributions to the U.S. Treasury as
interest on Federal Reserve notes totaled $34.1 bil-
lion during the first half of 2010, as presented in
table 24.
Background
The Federal Reserve Banks prepare annual financial
statements reflecting balances as of December 31, and
income and expenses for the year then ended. The
Federal Reserve Bank financial statements also include
the accounts and results of operations of several lim-
ited liability companies (LLCs) that have been consoli-
dated with the FRBNY (the “consolidated LLCs”).
The Board of Governors, the Federal Reserve
Banks, and the consolidated LLCs are all subject to
several levels of audit and review. The Reserve Banks’
financial statements and those of the consolidated LLC
entities are audited annually by an independent audit-
ing firm retained by the Board of Governors. To ensure
auditor independence, the Board requires that the
external auditor be independent in all matters relating
to the audit. Specifically, the external auditor may not
perform services for the Reserve Banks or others that
would place it in a position of auditing its own work,
making management decisions on behalf of the
Reserve Banks, or in any other way impairing its audit
independence. In addition, the Reserve Banks, includ-
ing the consolidated LLCs, are subject to oversight by
the Board.
The Board of Governors’ financial statements are
audited annually by an independent auditing firm
retained by the Board’s Office of Inspector General
(OIG). The audit firm also provides a report on com-
pliance and on internal control over financial reporting
in accordance with government auditing standards. The
OIG also conducts audits, reviews, and investigations
relating to the Board’s programs and operations as
well as of Board functions delegated to the Reserve
Banks.
Audited annual financial statements for the Reserve
Banks and Board of Governors are available at
www.federalreserve.gov/monetarypolicy/
bst_fedfinancials.htm. In this report, the Federal
Reserve prepares unaudited quarterly updates to tables
included in the Federal Reserve Board’s Annual Report
(available at www.federalreserve.gov/boarddocs/
rptcongress/default.htm).
Combined Statement of Income andComprehensive Income
Table 24 presents unaudited combined Reserve Bank
income and expense information for the first half of
2010. Tables 25 through 27 present information for the
SOMA portfolio, the Federal Reserve loan programs,
and the variable interest entities (VIEs)—the CPFF
LLC; Maiden Lane, Maiden Lane II, and Maiden Lane
III LLCs; and TALF LLC—for the period from Janu-
ary 1, 2010, to June 30, 2010. These tables are
updated quarterly.
SOMA Financial Summary
Table 25 shows the Federal Reserve’s average daily
balance of assets and liabilities in the SOMA portfolio
for the period from January 1, 2010, though June 30,
2010, the related interest income and expense, and the
22 Credit and Liquidity Programs and the Balance Sheet

realized and unrealized gains and losses for the year.
U.S. Treasury securities, government-sponsored enter-
prise (GSE) debt securities, as well as federal agency
and GSE mortgage-backed securities (MBS) making
up the SOMA portfolio, are recorded at amortized cost
on a settlement-date basis. Rather than using a fair
value presentation, an amortized cost presentation more
appropriately reflects the Reserve Banks’ purpose for
holding these securities given the Federal Reserve’s
unique responsibility to conduct monetary policy.
Table 24. Federal Reserve Banks’ Combined Statement of Income and Comprehensive Income
Millions of dollars
January 1, 2010 - June 30, 2010
Interest income:Loans to depository institutions (refer to table 26) . . . . . . . . . . . . . . . . . . . . . . . . . . . . . . . . . . . . . . . . . . . . . . . . . . . . . . . . . . . 50Other loans (refer to table 26) . . . . . . . . . . . . . . . . . . . . . . . . . . . . . . . . . . . . . . . . . . . . . . . . . . . . . . . . . . . . . . . . . . . . . . . . . . . . . . . . 1,286System Open Market Account (refer to table 25) . . . . . . . . . . . . . . . . . . . . . . . . . . . . . . . . . . . . . . . . . . . . . . . . . . . . . . . . . . . . . 37,773Consolidated variable interest entities (refer to table 27):
Investments held by consolidated variable interest entities:Maiden Lane, Maiden Lane II, and Maiden Lane III LLCs . . . . . . . . . . . . . . . . . . . . . . . . . . . . . . . . . . . . . . . . . . . . . 2,186Commercial Paper Funding Facility LLC . . . . . . . . . . . . . . . . . . . . . . . . . . . . . . . . . . . . . . . . . . . . . . . . . . . . . . . . . . . . . . . 213
Total interest income . . . . . . . . . . . . . . . . . . . . . . . . . . . . . . . . . . . . . . . . . . . . . . . . . . . . . . . . . . . . . . . . . . . . . . . . . . . . . . . . . . . . 41,508
Interest expense:System Open Market Account (refer to table 25) . . . . . . . . . . . . . . . . . . . . . . . . . . . . . . . . . . . . . . . . . . . . . . . . . . . . . . . . . . . . . 37Depository institution deposits . . . . . . . . . . . . . . . . . . . . . . . . . . . . . . . . . . . . . . . . . . . . . . . . . . . . . . . . . . . . . . . . . . . . . . . . . . . . . . . 1,378Term deposit facility . . . . . . . . . . . . . . . . . . . . . . . . . . . . . . . . . . . . . . . . . . . . . . . . . . . . . . . . . . . . . . . . . . . . . . . . . . . . . . . . . . . . . . . . . 0Beneficial interest in consolidated variable interest entities (refer to table 27) . . . . . . . . . . . . . . . . . . . . . . . . . . . . . . . . 135
Total interest expense . . . . . . . . . . . . . . . . . . . . . . . . . . . . . . . . . . . . . . . . . . . . . . . . . . . . . . . . . . . . . . . . . . . . . . . . . . . . . . . . . . . 1,550
Provision for loan restructuring (refer to table 26) . . . . . . . . . . . . . . . . . . . . . . . . . . . . . . . . . . . . . . . . . . . . . . . . . . . . . . . . . . . —
Net interest income, after provision for loan restructuring . . . . . . . . . . . . . . . . . . . . . . . . . . . . . . . . . . . . . . . . . . . . . . . 39,958
Non-interest income (loss):Other loans unrealized gains1 . . . . . . . . . . . . . . . . . . . . . . . . . . . . . . . . . . . . . . . . . . . . . . . . . . . . . . . . . . . . . . . . . . . . . . . . . . . . . . . . (253)System Open Market Account—realized and unrealized losses, net (refer to table 25) . . . . . . . . . . . . . . . . . . . . . . . (880)Investments held by consolidated variable interest entities gains (losses), net (refer to table 27):
Maiden Lane, Maiden Lane II, and Maiden Lane III LLCs . . . . . . . . . . . . . . . . . . . . . . . . . . . . . . . . . . . . . . . . . . . . . 5,280Commercial Paper Funding Facility LLC . . . . . . . . . . . . . . . . . . . . . . . . . . . . . . . . . . . . . . . . . . . . . . . . . . . . . . . . . . . . . . . 1TALF LLC2 . . . . . . . . . . . . . . . . . . . . . . . . . . . . . . . . . . . . . . . . . . . . . . . . . . . . . . . . . . . . . . . . . . . . . . . . . . . . . . . . . . . . . . . . . . . . . —
Beneficial interest in consolidated variable interest entities gains (losses), net . . . . . . . . . . . . . . . . . . . . . . . . . . . . . . . . (2,687)Dividends on preferred securities . . . . . . . . . . . . . . . . . . . . . . . . . . . . . . . . . . . . . . . . . . . . . . . . . . . . . . . . . . . . . . . . . . . . . . . . . . . . . 626Income from services . . . . . . . . . . . . . . . . . . . . . . . . . . . . . . . . . . . . . . . . . . . . . . . . . . . . . . . . . . . . . . . . . . . . . . . . . . . . . . . . . . . . . . . . 294Reimbursable services to government agencies . . . . . . . . . . . . . . . . . . . . . . . . . . . . . . . . . . . . . . . . . . . . . . . . . . . . . . . . . . . . . . . 195Other income . . . . . . . . . . . . . . . . . . . . . . . . . . . . . . . . . . . . . . . . . . . . . . . . . . . . . . . . . . . . . . . . . . . . . . . . . . . . . . . . . . . . . . . . . . . . . . . . 47
Total non-interest income (loss) . . . . . . . . . . . . . . . . . . . . . . . . . . . . . . . . . . . . . . . . . . . . . . . . . . . . . . . . . . . . . . . . . . . . . . . . . 2,623
Operating expenses:Salaries and other benefits . . . . . . . . . . . . . . . . . . . . . . . . . . . . . . . . . . . . . . . . . . . . . . . . . . . . . . . . . . . . . . . . . . . . . . . . . . . . . . . . . 1,104Occupancy expense . . . . . . . . . . . . . . . . . . . . . . . . . . . . . . . . . . . . . . . . . . . . . . . . . . . . . . . . . . . . . . . . . . . . . . . . . . . . . . . . . . . . . . . . 140Equipment expense . . . . . . . . . . . . . . . . . . . . . . . . . . . . . . . . . . . . . . . . . . . . . . . . . . . . . . . . . . . . . . . . . . . . . . . . . . . . . . . . . . . . . . . . 85Assessments by the Board of Governors . . . . . . . . . . . . . . . . . . . . . . . . . . . . . . . . . . . . . . . . . . . . . . . . . . . . . . . . . . . . . . . . . . . 488Professional fees related to consolidated variable interest entities (refer to table 27) . . . . . . . . . . . . . . . . . . . . . . . 49
Other expenses . . . . . . . . . . . . . . . . . . . . . . . . . . . . . . . . . . . . . . . . . . . . . . . . . . . . . . . . . . . . . . . . . . . . . . . . . . . . . . . . . . . . . . . . . . . . . . . 481
Total operating expenses . . . . . . . . . . . . . . . . . . . . . . . . . . . . . . . . . . . . . . . . . . . . . . . . . . . . . . . . . . . . . . . . . . . . . . . . . . . . . . . . . . . . . 2,348
Net income prior to distribution . . . . . . . . . . . . . . . . . . . . . . . . . . . . . . . . . . . . . . . . . . . . . . . . . . . . . . . . . . . . . . . . . . . . . . . . . . . . . . 40,233
Change in funded status of benefit plans2 . . . . . . . . . . . . . . . . . . . . . . . . . . . . . . . . . . . . . . . . . . . . . . . . . . . . . . . . . . . . . . . . . . . . 158
Comprehensive income prior to distribution . . . . . . . . . . . . . . . . . . . . . . . . . . . . . . . . . . . . . . . . . . . . . . . . . . . . . . . . . . . . . . . 40,391
Distribution of comprehensive income: . . . . . . . . . . . . . . . . . . . . . . . . . . . . . . . . . . . . . . . . . . . . . . . . . . . . . . . . . . . . . . . . . . . . . . .Dividends paid to member banks . . . . . . . . . . . . . . . . . . . . . . . . . . . . . . . . . . . . . . . . . . . . . . . . . . . . . . . . . . . . . . . . . . . . . . . . . . 782Transferred to surplus and change in accumulated other comprehensive income (loss) . . . . . . . . . . . . . . . . . . . . 39,609
Memo: Distributions to U.S. Treasury (interest on Federal Reserve notes)3 . . . . . . . . . . . . . . . . . . . . . . . . . . . . . . . . . . 34,068
Note: Unaudited.1. The fair value option was elected for all TALF loans. Recording all TALF loans at fair value, rather than at the remaining principal amount
outstanding, results in consistent accounting treatment among all TALF-related transactions and provides the most appropriate presentation of the TALFprogram in the financial statements by matching the change in fair value of TALF loans, the related put agreement with the consolidated TALF LLC, andthe valuation of the other beneficial interests in TALF LLC.
2. Represents the recognition of benefit plan deferred actuarial gains and losses and prior service costs.3. The Board of Governors requires each Reserve Bank to distribute any remaining net earnings to the U.S. Treasury as interest on Federal Reserve
notes, after providing for the payment of dividends and reservation of an amount necessary to equate surplus with capital paid-in. These distributions aremade weekly based on estimated net earnings for the preceding week. The amount of each Bank’s weekly distribution to the U.S. Treasury is affected bysignificant losses and increases in capital paid-in at a Reserve Bank, requires that the Reserve Bank retain net earnings until the surplus is equal to thecapital paid-in. The distributions to the U.S. Treasury are reported on an accrual basis; actual payments to the U.S. Treasury during the period fromJanuary 1, 2010, through June 30, 2010, were $35.1 billion.
October 2010 23

Although the fair value of security holdings can be
substantially greater than or less than the recorded
value at any point in time, these unrealized gains or
losses have no effect on the ability of the Reserve
Banks to meet their financial obligations and responsi-
bilities. As of June 30, 2010, the fair value of the U.S.
Treasury securities held in the SOMA, excluding
accrued interest, was $866.0 billion (amortized cost
was $804.2 billion); the fair value of the GSE debt,
excluding accrued interest, was $175.7 billion (amor-
tized cost was $171.5 billion); the fair value of the
federal agency and GSE MBS, excluding accrued
interest, was $1,168.4 billion (amortized cost was
$1,132.7 billion); and the fair value of investments
denominated in foreign currencies was $24.0 billion
(amortized cost was $23.8 billion). Fair value was
determined by reference to quoted prices for identical
securities, except for MBS, for which market values
are determined using a model-based approach based on
observable inputs for similar securities.
The FRBNY conducts purchases and sales of U.S.
government securities under authorization and direction
from the Federal Open Market Committee (FOMC).
The FRBNY buys and sells securities at market prices
from securities dealers and foreign and international
account holders. The FOMC has also authorized the
FRBNY to purchase and sell U.S. government securi-
ties under agreements to resell or repurchase such
securities (commonly referred to as repurchase and
reverse repurchase transactions).
The SOMA holds foreign currency deposits and for-
eign government debt instruments denominated in for-
eign currencies with foreign central banks and the
Bank for International Settlements. Central bank
liquidity swaps are the foreign currencies that the Fed-
eral Reserve acquires and records as an asset (exclud-
ing accrued interest) on the Federal Reserve’s balance
sheet. On January 5, 2009, the Federal Reserve began
purchasing MBS guaranteed by Fannie Mae, Freddie
Mac, and Ginnie Mae. Transactions in MBS are
recorded on settlement dates, which can extend several
months into the future. MBS dollar roll transactions,
which consist of a purchase or sale of “to be
announced” (TBA) MBS combined with an agreement
to sell or purchase TBA MBS on a specified future
date, may generate realized gains and losses.
Loan Programs Financial Summary
Table 26 summarizes the average daily loan balances
and interest income of the Federal Reserve for the first
half of 2010. The most significant loan balance is the
Term Asset-Backed Securities Loan Facility (TALF),
which was established in 2009. As noted earlier in this
report, during 2008 the Federal Reserve established
several lending facilities under authority of Section
13(3) of the Federal Reserve Act. Many of these lend-
Table 25. SOMA Financial Summary
Millions of dollars
January 1, 2010 - June 30, 2010
Average dailybalance
Interest income(expense)
Realized gains(losses)
Unrealizedgains (losses)
Net earnings
SOMA assetsU.S. Treasury securities1 . . . . . . . . . . . . . . . . . . . . . . . . . . . . . . . . . . . . . . . . . . 804,967 13,086 — — 13,086Government-sponsored enterprise debt securities1 . . . . . . . . . . . . . . . . 173,632 1,803 — — 1,803Federal agency and government-sponsored enterprise
mortgage-backed securities2 . . . . . . . . . . . . . . . . . . . . . . . . . . . . . . . . . . . . 1,068,884 22,764 714 — 23,478Investments denominated in foreign currencies3 . . . . . . . . . . . . . . . . . . 24,431 111 — (1,594) (1,483)Central bank liquidity swaps4 . . . . . . . . . . . . . . . . . . . . . . . . . . . . . . . . . . . . . 1,625 9 — — 9Securities purchased under agreements to resell . . . . . . . . . . . . . . . . . . — — — — —Other assets5 . . . . . . . . . . . . . . . . . . . . . . . . . . . . . . . . . . . . . . . . . . . . . . . . . . . . . . 477 — — — —
Total assets . . . . . . . . . . . . . . . . . . . . . . . . . . . . . . . . . . . . . . . . . . . . . . . . . . . . . . . . . 2,074,016 37,773 714 (1,594) 36,893
SOMA liabilitiesSecurities sold under agreements to repurchase . . . . . . . . . . . . . . . . . . . 58,043 (37) — — (37)Other liabilities6 . . . . . . . . . . . . . . . . . . . . . . . . . . . . . . . . . . . . . . . . . . . . . . . . . . 1,438 — — — —
Total liabilities . . . . . . . . . . . . . . . . . . . . . . . . . . . . . . . . . . . . . . . . . . . . . . . . . . . . . 59,481 (37) — — (37)
SOMA assets and liabilities . . . . . . . . . . . . . . . . . . . . . . . . . . . . . . . . . . . . . . . . 2,014,535 37,736 714 (1,594) 36,856
Note: Unaudited. Components may not sum to totals because of rounding.1. Face value, net of unamortized premiums and discounts.2. Guaranteed by Fannie Mae, Freddie Mac, and Ginnie Mae. Current face value of the securities, which is the remaining principal balance of the
underlying mortgages, net of premiums and discounts. Does not include unsettled transactions.3. Includes accrued interest. Investments denominated in foreign currencies are revalued daily at market exchange rates.4. Dollar value of foreign currency held under these agreements valued at the exchange rate to be used when the foreign currency is returned to the
foreign central bank. This exchange rate equals the market exchange rate used when the foreign currency was acquired from the foreign central bank.5. Cash and short-term investments related to the federal agency and government-sponsored enterprise mortgage-backed securities portfolio.6. Related to the purchases of federal agency and government-sponsored enterprise mortgage-backed securities that the seller fails to deliver the
securities on the settlement date.
24 Credit and Liquidity Programs and the Balance Sheet

Table 26. Loan Programs Financial Summary
Millions of dollars
Loan programs1
January 1, 2010 - June 30, 2010
Average dailybalance2 Interest income3 Provision for loan
restructuringTotal
Primary, secondary, and seasonal credit . . . . . . . . . . . . . . . . . . . . . . . . . . . . . . . . . 9,395 32 — 32Term Auction Facility (TAF) . . . . . . . . . . . . . . . . . . . . . . . . . . . . . . . . . . . . . . . . . . . . 14,327 18 — 18
Total loans to depository institutions . . . . . . . . . . . . . . . . . . . . . . . . . . . . . . . . . . 23,722 50 — 50
Credit extended to American International Group, Inc. (AIG), net . . . . . . 24,798 841 — 841Term Asset-Backed Securities Loan Facility (TALF)4 . . . . . . . . . . . . . . . . . . . 46,014 445 — 445
Total loans to others . . . . . . . . . . . . . . . . . . . . . . . . . . . . . . . . . . . . . . . . . . . . . . . . . . 70,812 1,286 — 1,286
Total loan programs . . . . . . . . . . . . . . . . . . . . . . . . . . . . . . . . . . . . . . . . . . . . . . . . . 94,534 1,336 — 1,336Allowance for loan losses . . . . . . . . . . . . . . . . . . . . . . . . . . . . . . . . . . . . . . . . . . . . — — — —Total loan programs, net . . . . . . . . . . . . . . . . . . . . . . . . . . . . . . . . . . . . . . . . . . . . 94,534 1,336 — 1,336
Note: Unaudited. Components may not sum to totals because of rounding.1. Does not include loans to consolidated VIEs. Does not include preferred interests in AIA Aurora LLC and ALICO Holdings LLC.2. Average daily balance includes outstanding principal and capitalized interest net of unamortized deferred commitment fees and allowance for loan
restructuring, and excludes undrawn amounts.3. Interest income includes the amortization of the deferred commitment and administrative fees.4. Book value.
Table 27. Consolidated Variable Interest Entities Financial Summary
Millions of dollars
ItemCPFFLLC
TALFLLC
MLLLC
ML IILLC
ML IIILLC
TotalMaiden
Lane LLCs
Net portfolio assets of the consolidated LLCs and the net position ofFRBNY and subordinated interest holders as of June 30, 2010Net portfolio assets1 . . . . . . . . . . . . . . . . . . . . . . . . . . . . . . . . . . . . . . . . . . . . . . . . . . . . . . . 1 507 30,985 16,325 23,750 71,060Liabilities of consolidated LLCs . . . . . . . . . . . . . . . . . . . . . . . . . . . . . . . . . . . . . . . . . . 0 0 (1,671) (1) (3) (1,675)Net portfolio assets available . . . . . . . . . . . . . . . . . . . . . . . . . . . . . . . . . . . . . . . . . . . . . . 1 507 29,314 16,324 23,747 69,385
Loans extended to the consolidated LLCs by FRBNY2 . . . . . . . . . . . . . . . . . . . 0 0 29,332 14,672 16,294 60,298Other beneficial interests2,3 . . . . . . . . . . . . . . . . . . . . . . . . . . . . . . . . . . . . . . . . . . . . . . . . . . . 104 1,280 1,053 5,278 7,611Total loans and other beneficial interests . . . . . . . . . . . . . . . . . . . . . . . . . . . . . . . . . . 0 104 30,612 15,725 21,572 67,909
Cumulative change in net assets since the inception of the programs
Allocated to FRBNY . . . . . . . . . . . . . . . . . . . . . . . . . . . . . . . . . . . . . . . . . . . . . . . . . . . . . . 1 (255) (18) 499 1,450 1,931Allocated to other beneficial interests . . . . . . . . . . . . . . . . . . . . . . . . . . . . . . . . . . . . . . . . 657 (1,280) 100 725 (455)Cumulative change in net assets . . . . . . . . . . . . . . . . . . . . . . . . . . . . . . . . . . . . . . . . . . 1 402 (1,298) 599 2,175 1,476
Summary of consolidated VIE net income for the current year throughJune 30, 2010, including a reconciliation of total consolidated VIE netincome to the consolidated VIE net income recorded by FRBNYPortfolio interest income4 . . . . . . . . . . . . . . . . . . . . . . . . . . . . . . . . . . . . . . . . . . . . . . . . . 213 0 588 416 1,182 2,186Interest expense on loans extended by FRBNY5 . . . . . . . . . . . . . . . . . . . . . . . . . . 4 0 (99) (95) (107) (301)Interest expense—other . . . . . . . . . . . . . . . . . . . . . . . . . . . . . . . . . . . . . . . . . . . . . . . . . . . 0 (2) (32) (17) (84) (133)Portfolio holdings gains (losses) . . . . . . . . . . . . . . . . . . . . . . . . . . . . . . . . . . . . . . . . . . 1 0 1,754 1,431 (2,095) 5,280Professional fees . . . . . . . . . . . . . . . . . . . . . . . . . . . . . . . . . . . . . . . . . . . . . . . . . . . . . . . . . . (2) 0 (31) (5) (11) (47)Net income (loss) of consolidated LLCs . . . . . . . . . . . . . . . . . . . . . . . . . . . . . . . . . . 216 (2) 2,180 1,730 3,075 6,985
Less: Net income (loss) allocated to other beneficial interests . . . . . . . . . . . . . . . . (42)* (32) 1,136 1,625 2,729Net income (loss) allocated to FRBNY . . . . . . . . . . . . . . . . . . . . . . . . . . . . . . . . . . . 216 40 2,212 593 1,450 4,255Add: Interest expense on loans extended by FRBNY, eliminated inconsolidation5 . . . . . . . . . . . . . . . . . . . . . . . . . . . . . . . . . . . . . . . . . . . . . . . . . . . . . . . . . . . . . (4) 0 99 95 107 301Net income (loss) recorded by FRBNY . . . . . . . . . . . . . . . . . . . . . . . . . . . . . . . . . . . 212 40** 2,311 688 1,557 4,556
Note: Unaudited.* Represents the amount of TALF LLC’s income allocated to the U.S. Treasury.** In addition to the TALF LLC net income of $40 million, the FRBNY reported $192 million of income on TALF loans during the quarter ended June
30, 2010. Earnings on TALF loans include interest income and fees of $445 million and losses on the valuation of loans of $253 million for the first halfof 2010.
1. CPFF LLC commercial paper holdings are recorded at book value; other holdings are recorded at fair value. TALF LLC, Maiden Lane, Maiden LaneII, and Maiden Lane III holdings are recorded at fair value.
2. Includes accrued interest.3. The other beneficial interest holder related to TALF LLC is the U.S. Treasury. JPMC is the beneficial interest holder for Maiden Lane LLC. AIG is
the beneficial interest holder for Maiden Lane II and Maiden Lane III LLCs.4. Interest income is recorded when earned, and it includes amortization of premiums, accretion of discounts, and paydown gains and losses.5. Interest expense recorded by each VIE on the loans extended by the FRBNY is eliminated when the VIEs are consolidated in the FRBNY’s financial
statements and, as a result, the consolidated VIEs’ net income (loss) recorded by the FRBNY is increased by this amount.
October 2010 25

ing facilities have been closed (refer to Appendix B in
this report for a discussion of those facilities). Credit
remains outstanding to American International Group,
Inc. (AIG) and under the TALF; the Reserve Banks
record amounts funded under these programs as loans.
Interest income from these loan programs was about
$1.3 billion during the first half of 2010. All loans
must be fully collateralized to the satisfaction of the
lending Reserve Bank, with an appropriate haircut
applied to the collateral. At June 30, 2010, no loans
were impaired, and an allowance for loan losses was
not required.
Consolidated Variable Interest Entities (VIEs)Financial Summary
Table 27 summarizes the assets and liabilities of vari-
ous consolidated VIEs previously discussed in this
report. It also summarizes the net position of senior
and subordinated interest holders and the allocation of
the change in net assets to interest holders. The
FRBNY is the sole and managing member of TALF
LLC and the primary beneficiary of the Maiden Lane
LLCs. The FRBNY was the sole beneficiary of CPFF
LLC, which was dissolved on August 30, 2010.
Maiden Lane LLC, Maiden Lane II LLC, Maiden
Lane III LLC, and TALF LLC holdings are recorded at
fair value, which reflects an estimate of the price that
would be received upon selling an asset if the transac-
tion were to be conducted in an orderly market on the
measurement date. Consistent with generally accepted
accounting principles (GAAP), the assets and liabilities
of these LLCs have been consolidated with the assets
and liabilities of the FRBNY. As a consequence of the
consolidation, the extensions of credit from the
FRBNY to the LLCs are eliminated.
“Net portfolio assets available” represents the net
assets available to beneficiaries of the consolidated
VIEs and for repayment of loans extended by the
FRBNY. “Net income (loss) allocated to FRBNY” rep-
resents the allocation of the change in net assets and
liabilities of the consolidated VIEs available for repay-
ment of the loans extended by the FRBNY and other
beneficiaries of the consolidated VIEs. The differences
between the fair value of the net assets available and
the face value of the loans (including accrued interest)
are indicative of gains or losses that would have been
incurred by the beneficiaries if the assets had been
fully liquidated at prices equal to the fair value as of
June 30, 2010.
26 Credit and Liquidity Programs and the Balance Sheet

Appendix A
Additional Information Provided Pursuant toSection 129 of the Emergency EconomicStabilization Act of 2008
In light of improved functioning of financial markets,
on February 1, 2010, the Federal Reserve closed the
Term Securities Lending Facility (TSLF), Primary
Dealer Credit Facility (PDCF), Commercial Paper
Funding Facility (CPFF), and the Asset-Backed Com-
mercial Paper Money Market Mutual Fund Liquidity
Facility (AMLF). As of that date, all loans under the
TSLF, PDCF, and AMLF had been repaid in full, with
interest, in accordance with the terms of each facility,
and each of the facilities resulted in no loss to the Fed-
eral Reserve or taxpayers. All remaining commercial
paper holdings of the CPFF matured on April 26,
2010, and the CPFF LLC was dissolved on August 30,
2010, following the payment of expenses and the ter-
mination or expiration of existing contractual agree-
ments. The CPFF did not result in any loss to the Fed-
eral Reserve or the taxpayers.
For the reasons discussed below, the Board does not
anticipate that the Federal Reserve or taxpayers will
incur any net loss on the loans provided by the Federal
Reserve Bank of New York (FRBNY) under the Term
Asset-Backed Securities Loan Facility (TALF), to
American International Group, Inc. (AIG), or to
Maiden Lane LLC, Maiden Lane II LLC, or Maiden
Lane III LLC (collectively, the “Maiden Lane facili-
ties”). In making these assessments, the Board has
considered, among other things, the terms and condi-
tions governing the relevant facility and the type,
nature, and value of the current collateral or other
security arrangements associated with the facility. As
discussed earlier in this report, the Federal Reserve has
established various terms and conditions governing the
types of collateral that may be pledged in support of a
loan under a facility in order to mitigate the risk of
loss. In the case of the Maiden Lane facilities, the
Board also has considered analyses of the projected
returns on the portfolio holdings of the respective spe-
cial purpose vehicle (SPV) (the assets of which serve
as collateral for the loan(s) extended to the SPV) con-
ducted by the FRBNY or its advisors in connection
with the most recent quarterly revaluation of the assets
of each SPV.
Term Asset-Backed Securities Loan Facility
Under the TALF, the FRBNY made loans on a collat-
eralized basis to holders of eligible asset-backed secu-
rities (ABS) and commercial mortgage-backed securi-
ties (CMBS). The potential for the Federal Reserve or
taxpayers to incur any net loss on the TALF loans
extended by the FRBNY to the holders of ABS and
CMBS is mitigated by the quality of the collateral, the
risk assessment performed by the FRBNY on all
pledged collateral, and the margin by which the value
of the collateral exceeds the amount of the loan (the
haircut). Potential losses to the Federal Reserve also
are mitigated by the portion of interest on the TALF
loans to borrowers transferred to TALF LLC and by
the credit protection provided by the Treasury under
the Troubled Asset Relief Program (TARP) (initially
$20 billion and subsequently reduced to $4.3 billion in
light of the $43 billion in TALF loans outstanding
when the TALF closed to new lending on June 30,
2010), both of which are available to TALF LLC to
purchase any collateral received by the FRBNY from a
borrower in lieu of repaying a TALF loan or fore-
closed upon due to a default by the borrower. The
TALF closed to new lending on June 30, 2010. TALF
loans extended by the FRBNY during the program will
mature over the next several years, with all loans
maturing no later than March 30, 2015.
Loans to Maiden Lane LLC, Maiden Lane IILLC, and Maiden Lane III LLC
The portfolio holdings of each of Maiden Lane LLC
(Maiden Lane), Maiden Lane II LLC (ML-II), and
Maiden Lane III LLC (ML-III) are revalued in accor-
dance with generally accepted accounting principles
(GAAP) as of the end of each quarter to reflect an
estimate of the fair value of the assets on the measure-
ment date. The fair value determined through these
revaluations may fluctuate over time. In addition, the
fair value of the portfolio holdings that is reported on
the weekly H.4.1 statistical release reflects any accrued
interest earnings, principal repayments, expense pay-
ments and, to the extent any may have occurred since
the most recent measurement date, realized gains or
losses. The fair values as of September 29, 2010—as
shown in table 1 of this report and reported in the
H.4.1 release for that date—are based on quarterly
revaluations as of June 30, 2010.
October 2010 27

Because the collateral assets for the loans to Maiden
Lane, ML-II, and ML-III are expected to generate cash
proceeds and may be sold over time or held to matu-
rity, the current reported fair values of the net portfolio
holdings of Maiden Lane, ML-II, and ML-III do not
reflect the amount of aggregate proceeds that the Fed-
eral Reserve could receive from the assets of the
respective entity over the extended term of the loan to
the entity. The extended terms of the loans provide an
opportunity to dispose of the assets of each entity in
an orderly manner over time and to collect interest on
the assets held by the entity prior to their sale, other
disposition, or maturity. Each of the loans extended to
Maiden Lane, ML-II, and ML-III is current under the
terms of the relevant loan agreement.
In addition, JPMorgan Chase will absorb the first
$1.15 billion of realized losses on the assets of Maiden
Lane, should any occur. Similarly, certain U.S. insur-
ance subsidiaries of AIG have a $1 billion subordi-
nated position in ML-II and an AIG affiliate has a $5
billion subordinated position in ML-III, which are
available to absorb first any loss that ultimately may
be incurred by ML-II or ML-III, respectively. More-
over, under the terms of the agreements, the FRBNY is
entitled to any residual cash flow generated by the col-
lateral assets held by Maiden Lane after the loans
made by the FRBNY and JPMorgan Chase are repaid,
and five-sixths and two-thirds of any residual cash
flow generated by the assets held by ML-II and
ML-III, respectively, after the senior note of the
FRBNY and the subordinate positions of AIG affiliates
for these facilities are repaid.
Revolving Credit Facility and Preferred InterestsRelating to American International Group, Inc.
In light of the extremely broad and diverse range of
collateral (including AIG’s ownership interest in
numerous nonpublic companies) and guarantees secur-
ing advances under the Revolving Credit Facility and
the term of the credit facility, it is difficult to estimate
with precision the aggregate value that ultimately will
or may be received in the future from the sale of col-
lateral or the enforcement of guarantees supporting the
Revolving Credit Facility or from the sale of assets of
the two SPVs, AIA Aurora LLC and ALICO Holdings
LLC (including any noncash consideration that may be
received in connection with the sale of the assets of
the AIA or ALICO SPVs), and disclosure of any such
estimate could interfere with the goal of maximizing
value through the company’s global divestiture pro-
gram and, consequently, diminish the proceeds avail-
able to repay the loan or redeem the preferred interests
held by the FRBNY in the AIA and ALICO SPVs.
However, based on the substantial assets and opera-
tions supporting repayment of the loan or redemption
of the preferred interests, the terms of the agreement
entered into by AIG for the sale of American Life
Insurance Company (ALICO), the capital and capital
commitments provided to AIG under the TARP, and
the most recently completed quarterly review of the
security arrangements supporting the Revolving Credit
Facility conducted as of June 30, 2010, by the FRBNY
supported by analyses performed by its advisors, and
the terms of the comprehensive recapitalization plan
announced by AIG on September 30, 2010, the Federal
Reserve anticipates that the loans provided by the Fed-
eral Reserve under the Revolving Credit Facility,
including interest and commitment fees under the
modified terms of the facility, will be fully repaid and
the face value of the preferred interests in the AIA and
ALICO SPVs, plus accrued dividends, will be
received. Accordingly, the Federal Reserve anticipates
that the facility will not result in any net loss to the
Federal Reserve or taxpayers.
28 Credit and Liquidity Programs and the Balance Sheet

Appendix B
Information about Closed and Expired Creditand Liquidity Facilities and Programs
During the financial crisis that emerged during the
summer of 2007, the Federal Reserve took a number
of important steps aimed at providing liquidity to
important financial markets and institutions to support
overall financial stability. Financial stability is a critical
prerequisite for achieving sustainable economic
growth, and all of the Federal Reserve’s actions were
directed toward achieving the Federal Reserve’s statu-
tory monetary policy objectives. Specifically, the Fed-
eral Reserve implemented a number of programs
designed to support the liquidity of financial institu-
tions and foster improved conditions in financial mar-
kets, and also extended credit to certain specific insti-
tutions and committed to extend credit to support
systemically important financial firms.
In light of ongoing improvements in the functioning
of financial markets, many of the facilities and pro-
grams established to help address the financial crisis
have closed or expired. Specifically, on February 1,
2010, the Federal Reserve closed the Asset-Backed
Commercial Paper Money Market Mutual Fund
Liquidity Facility (AMLF), the Commercial Paper
Funding Facility (CPFF), the Primary Dealer Credit
Facility (PDCF), and the Term Securities Lending
Facility (TSLF). On April 26, 2010, all remaining
commercial paper holdings of the CPFF matured, and
the CPFF LLC was dissolved on August 30, 2010, fol-
lowing the payment of expenses and the termination or
expiration of existing contractual agreements. Also in
April 2010, the credit extended through the last Term
Auction Facility (TAF) auction in March matured,
marking the close of that facility.
The temporary liquidity swap arrangements between
the Federal Reserve and other foreign central banks
(FCBs) also expired on February 1, 2010. However,
the Federal Reserve re-established temporary liquidity
swap arrangements with a group of FCBs in May
2010, enabling them to offer U.S. dollar liquidity to
financial institutions in their jurisdictions. Information
related to these arrangements can be found in the body
of this report.
Background information about the TAF, the PDCF,
the TSLF, the CPFF, and the AMLF, previously
included in the body of this report, as well as informa-
tion about the support provided to Citigroup and Bank
of America is presented in this appendix. Historical
data related to these facilities, previously reported on
the H.4.1 statistical release, “Factors Affecting Reserve
Balances of Depository Institutions and Condition
Statement of Federal Reserve Banks,” which includes
the weekly publication of the Federal Reserve’s bal-
ance sheet, is available through the Data Download
Program, available at www.federalreserve.gov/
datadownload. The Data Download Program provides
interactive access to Federal Reserve statistical data in
a variety of formats.
Lending Facilities to Support Overall MarketLiquidity
Term Auction Facility (TAF)
On December 12, 2007, the Federal Reserve created
the TAF to improve depository institutions’ access to
term funding. The TAF provided credit through an auc-
tion mechanism to depository institutions in generally
sound financial condition. The TAF offered 28-day
loans and, beginning in August 2008, 84-day
loans.
On September 24, 2009, the Federal Reserve
announced that the TAF would be scaled back in
response to continued improvements in financial mar-
ket conditions. The auction amount for the 84-day auc-
tions was reduced in late 2009 and the maturity dates
of the 84-day auctions were adjusted over time to align
with the maturity dates of the 28-day auctions. Subse-
quently, the auction amount for the remaining 28-day
auctions was tapered, and the final TAF auction was
held on March 8, 2010. Credit extended under the
March 2010 auction matured on April 8, 2010. All
TAF loans were fully collateralized to the satisfaction
of the lending Reserve Bank, with an appropriate
“haircut” applied to the value of the collateral and
were repaid in full, with interest, in accordance with
the terms of the facility.
Lending to Primary Dealers
On March 16, 2008, the Federal Reserve announced
the creation of the PDCF, an overnight loan facility
that provided funding to primary dealers and helped
foster improved conditions in financial markets more
generally. All credit provided under the PDCF was
fully secured by collateral with appropriate haircuts—
that is, the value of the collateral exceeded the value
October 2010 29

of the loan extended. Initially, eligible collateral was
restricted to investment-grade securities. On September
14, 2008, however, the set of eligible collateral was
broadened to closely match the types of instruments
that can be pledged in the tri-party repurchase agree-
ment systems of the two major clearing banks. On
September 21, 2008, and November 23, 2008, the Fed-
eral Reserve authorized the extension of credit to a set
of other securities dealers on terms very similar to the
PDCF. There was no borrowing at the PDCF after
mid-May 2009. The Federal Reserve closed the PDCF
on February 1, 2010. All loans extended under this
facility were repaid in full, with interest, in accordance
with the terms of the facility.
Eligible collateral for loans extended through the
PDCF included all assets eligible for tri-party repur-
chase agreement arrangements through the major clear-
ing banks as of September 12, 2008. The amount of
PDCF credit extended to any dealer could not exceed
the lendable value of eligible collateral that the dealer
provided to the Federal Reserve Bank of New York
(FRBNY). The collateral was valued by the clearing
banks; values were based on prices reported by a num-
ber of private-sector pricing services widely used by
market participants. Loans extended under the PDCF
were made with recourse beyond the collateral to the
primary dealer entity itself.
On March 11, 2008, the Federal Reserve announced
the creation of the TSLF. Under the TSLF, the FRBNY
lent Treasury securities to primary dealers for 28 days
against eligible collateral in two types of auctions. For
“Schedule 1” auctions, the eligible collateral consisted
of Treasury securities, agency securities, and agency-
guaranteed mortgage-backed securities (MBS). For
“Schedule 2” auctions, the eligible collateral included
Schedule 1 collateral plus highly rated private securi-
ties. In mid-2008, the Federal Reserve introduced the
Term Securities Lending Facility Options Program
(TOP), which offered options to primary dealers to
draw upon short-term, fixed-rate TSLF loans from the
System Open Market Account (SOMA) portfolio in
exchange for program-eligible collateral. The TOP was
intended to enhance the effectiveness of the TSLF by
offering added liquidity over periods of heightened
collateral market pressures, such as quarter-end
dates.
Transactions under the TSLF involved lending secu-
rities rather than cash: A dealer borrowed Treasury
securities from the Federal Reserve and provided
another security as collateral. Eligible collateral was
determined by the Federal Reserve. Two schedules of
collateral were defined. Schedule 1 collateral consisted
of Treasury, agency, and agency-guaranteed MBS.
Schedule 2 collateral included investment-grade corpo-
rate, municipal, mortgage-backed, and asset-backed
securities, as well as Schedule 1 collateral. Haircuts on
posted collateral were determined by the FRBNY using
methods consistent with current market practices.
TSLF Schedule 1 and TOP auctions were suspended
effective July 2009 in light of considerably lower use
of the facility. Furthermore, in September 2009 the
Federal Reserve announced its intention to scale back
the size of TSLF auctions held between October 2009
and January 2010. The size of TSLF auctions was
reduced to $50 billion in October 2009 and $25 billion
in November 2009; offering amounts remained at $25
billion in December 2009 and January 2010. Since
mid-August 2009, borrowing from the TSLF had
remained unchanged at zero. The January 7, 2010,
TSLF Schedule 2 auction was the last auction con-
ducted prior to the closure of the TSLF on February 1,
2010. All loans extended under these facilities were
repaid in full, with interest, in accordance with the
terms of the facility.
Commercial Paper Funding Facility (CPFF)
The CPFF, which was authorized under Section 13(3)
of the Federal Reserve Act, was designed to support
liquidity in the commercial paper markets. The CPFF
provided a liquidity backstop to U.S. issuers of com-
mercial paper through a specially created limited liabil-
ity company (LLC) called CPFF LLC. This LLC pur-
chased three-month unsecured and asset-backed
commercial paper directly from eligible issuers. The
FRBNY provided financing to the LLC, and the FRB-
NY’s loan to the LLC was secured by all of the assets
of the LLC, including those purchased with the accu-
mulated upfront fees paid by the issuers. Outstanding
assets and liabilities of the CPFF LLC were consoli-
dated onto the balance sheet of the FRBNY.
The CPFF was announced on October 7, 2008, and
purchases of commercial paper began on October 27,
2008. The FRBNY administered the program until it
was closed on February 1, 2010. The CPFF incurred
no losses on its commercial paper holdings, and accu-
mulated nearly $5 billion in earnings primarily from
interest income, credit enhancement fees, and registra-
tion fees, which has been paid to the FRBNY as Man-
aging Member. The CPFF’s holdings of commercial
paper, which peaked at $350 billion in January 2009,
fell to zero on April 26, 2010, as remaining issuers
repaid their commercial paper at maturity. The cash
equivalents and other securities held by the CPFF LLC
have matured, and the LLC was dissolved on August
30, 2010, following the payment of accrued profes-
sional fees and the termination or expiration of exist-
ing contractual arrangements. The final audited finan-
30 Credit and Liquidity Programs and the Balance Sheet

cial statements for the CPFF LLC are available at
www.federalreserve.gov/monetarypolicy/
bst_fedfinancials.htm.
Asset-Backed Commercial Paper Money Market
Mutual Fund Liquidity Facility (AMLF)
The AMLF was a lending facility that financed the
purchase of high-quality asset-backed commercial
paper from money market mutual funds (MMMFs) by
U.S. depository institutions and bank holding compa-
nies. The program was intended to assist money funds
that held such paper in meeting the demand for
redemptions by investors and to foster liquidity in the
asset-backed commercial paper (ABCP) market and
money markets more generally. The loans extended
through the AMLF were non-recourse loans; as a
result, the Federal Reserve had rights to only the col-
lateral securing the loan if the borrower elected not to
repay. To help ensure that the AMLF was used for its
intended purpose of providing a temporary liquidity
backstop to MMMFs, the Federal Reserve established
a redemption threshold for use of the facility. Under
this requirement, a MMMF had to experience material
outflows—defined as at least five percent of net assets
in a single day or at least 10 percent of net assets
within the prior five business days—before the ABCP
that it sold was eligible collateral for AMLF loans to
depository institutions and bank holding companies.
Any eligible ABCP purchased from a MMMF that had
experienced redemptions at these thresholds could have
been pledged to the AMLF at any time within the five
business days following the date that the threshold
level of redemptions was reached.
The creation of the AMLF, announced on September
19, 2008, relied on authority under Section 13(3) of
the Federal Reserve Act. It was administered by the
Federal Reserve Bank of Boston, which was authorized
to make AMLF loans to eligible borrowers in all 12
Federal Reserve Districts.
AMLF Collateral. Collateral eligible for the AMLF
was limited to ABCP that:
— was purchased by the borrower on or after Sep-
tember 19, 2008, from a registered investment
company that held itself out as a MMMF and
had experienced recent material outflows;
— was purchased by the borrower at the mutual
fund’s acquisition cost as adjusted for amortiza-
tion of premium or accretion of discount on the
ABCP through the date of its purchase by the
borrower;
— was not rated lower than A-1, P-1, or F1 at the
time it was pledged to the Federal Reserve Bank
of Boston (this would exclude paper that is rated
A-1/P-1/F1 but was on watch for downgrade by
any major rating agency);
— was issued by an entity organized under the laws
of the United States or a political subdivision
thereof under a program that was in existence on
September 18, 2008; and
— had a stated maturity that did not exceed 120
days if the borrower is a bank, or 270 days if the
borrower is a non-bank.
The qualifying ABCP was transferred to the Federal
Reserve Bank of Boston’s restricted account at the
Depository Trust Company before an advance, collater-
alized by that ABCP, was approved. The collateral was
valued at the amortized cost (as defined in the Letter
of Agreement) of the eligible ABCP pledged to secure
an advance. Advances made under the facility were
made without recourse, provided the requirements in
the Letter of Agreement were met.
Since May 8, 2009, there had been no new borrow-
ing through the AMLF, and as of October 13, 2009, all
prior outstanding AMLF credit had matured. The
AMLF was closed on February 1, 2010. All loans
made under the facility were repaid in full, with inter-
est, in accordance with the terms of the facility.
Lending in Support of Specific Institutions
During the financial crisis, the Federal Reserve agreed
to provide credit, if necessary, to support Citigroup
Inc. (Citigroup) and Bank of America Corporation
(Bank of America), two important financial firms, as
part of a package of supports for these institutions
made available by the Treasury Department, the Fed-
eral Deposit Insurance Corporation (FDIC), and the
Federal Reserve.
Citigroup
On November 23, 2008, the Treasury, the Federal
Reserve, and the FDIC jointly announced that the U.S.
government would provide support to Citigroup in an
effort to support financial markets. The terms of the
arrangement, under which the government parties had
agreed to provide certain loss protections and liquidity
supports to Citigroup with respect to a designated pool
of $301 billion of assets, are provided on the Federal
Reserve website at www.federalreserve.gov/
monetarypolicy/bst_supportspecific.htm. The FRBNY
did not extend credit to Citigroup under this
arrangement.
On December 23, 2009, the Treasury, the Federal
Reserve, and the FDIC agreed to terminate the Master
October 2010 31

Agreement dated January 15, 2009, with Citigroup. In
consideration for terminating the Master Agreement,
the FRBNY received a $50 million termination fee
from Citigroup. Outstanding expenses in connection
with the Master Agreement and not yet reimbursed by
Citigroup will continue to be reimbursable.
Bank of America
On January 16, 2009, the Treasury, the Federal
Reserve, and the FDIC jointly announced that the U.S.
government had agreed to provide certain support to
Bank of America to promote financial market stability.
Information concerning these actions is available on
the Federal Reserve website at www.federalreserve
.gov/monetarypolicy/bst_supportspecific.htm.
On May 7, 2009, following the release of the results
of the Supervisory Capital Assessment Program, Bank
of America announced that it did not plan to move
forward with a part of the package of supports
announced in January 2009—specifically, a residual
financing arrangement with the Federal Reserve and
the related guarantee protections that would be pro-
vided by the Treasury and the FDIC with respect to an
identified pool of approximately $118 billion in assets.
In September 2009, Bank of America paid an exit
fee in order to terminate the term sheet, which was
never implemented, with the Treasury, the Federal
Reserve, and the FDIC. The Federal Reserve’s portion
of the exit fee was $57 million.
32 Credit and Liquidity Programs and the Balance Sheet

Appendix C
Federal Reserve Disclosure Requirements andOther Provisions of the Dodd-Frank WallStreet Reform and Consumer Protection Act
On July 21, 2010, the Dodd-Frank Wall Street Reform
and Consumer Protection Act (the “Dodd-Frank Act”)
was signed into law.7 The Dodd-Frank Act includes
changes that are designed to promote transparency
while protecting monetary policy independence and the
efficacy of the Federal Reserve’s liquidity programs
and open market operations (OMOs). In addition, the
Dodd-Frank Act modifies the Federal Reserve’s author-
ity to provide emergency liquidity to nondepository
institutions under Section 13(3) of the Federal Reserve
Act in light of other amendments that provide the U.S.
government with new authority to resolve failing, sys-
temically important nonbank financial institutions in an
orderly manner.
Under the provisions of the Dodd-Frank Act, the
Federal Reserve must disclose certain information, by
December 1, 2010, about entities that received loans or
other financial assistance under a Section 13(3) credit
facility between December 1, 2007, and July 21,
2010.8 Disclosure is also required for persons or enti-
ties that participated in the agency mortgage-backed
securities (MBS) purchase program, used foreign cur-
rency liquidity swap lines, or borrowed through the
Term Auction Facility (TAF) during that time frame.
Information to be disclosed will include the identity of
each entity to which the Federal Reserve has provided
assistance; the type, value, and dates of the assistance;
the specific terms of any repayment expected, includ-
ing the repayment time period, interest charges, collat-
eral, limitations on executive compensation or divi-
dends, and other material terms; and the specific
rationale for each such facility or program.
The Dodd-Frank Act also establishes a framework
for the delayed disclosure of information on entities
that, after July 21, 2010, received a loan from the dis-
count window under Section 10B of the Federal
Reserve Act or from a Section 13(3) facility, or partici-
pated in OMO transactions. Generally, this framework
requires the Federal Reserve to publicly disclose cer-
tain information about these discount window borrow-
ers and OMO counterparties approximately two years
after the relevant loan or transaction; information about
borrowers under future Section 13(3) facilities will be
disclosed one year after the authorization for the facil-
ity is terminated. Information to be disclosed will
include the names and identifying details of each bor-
rower or counterparty, the amount borrowed, the inter-
est rate paid, and information identifying the types and
amounts of collateral pledged or assets transferred in
connection with the borrowing or transaction.
The Federal Reserve plans to implement these new
disclosure requirements in a timely and effective
manner.
Going forward, any emergency lending programs
and facilities authorized by the Federal Reserve under
Section 13(3) of the Federal Reserve Act must have
broad-based eligibility, and must be approved by the
Secretary of the Treasury.
7. The full text of the Dodd-Frank Act is available atwww.gpo.gov/fdsys/pkg/BILLS-111hr4173ENR/pdf/BILLS-111hr4173ENR.pdf.
8. These facilities include the Primary Dealer Credit Facility, theTerm Securities Lending Facility, the Commercial Paper FundingFacility, the Asset-Backed Commercial Paper Money Market MutualFund Liquidity Facility, the Term Asset-Backed Securities LoanFacility, Maiden Lane LLC, Maiden Lane II LLC, and Maiden LaneIII LLC.
October 2010 33