Embed Size (px)
Citation preview
IOSR Journal of Research & Method in Education (IOSR-JRME)
e- ISSN: 2320–7388,p-ISSN: 2320–737X Volume 8, Issue 2 Ver. IV (Mar. – Apr. 2018), PP 72-84
www.iosrjournals.org
DOI: 10.9790/7388-0802047284 www.iosrjournals.org 72 | Page
Creation of Geospatial Database for Educational Facilities in
Oredo Local Government Area of Edo State, Nigeria
Ojiako, J.C, Igbokwe, E.C and Oliha, A
Abstract: This study aimed at creating a robust geospatial database for educational facilities in Oredo LGA of
Edo State. This aim was achieved by: acquiring primary and secondary dataset of the study area, creating a
geospatial database of educational facilities in Oredo LGA of Edo State, Nigeria, developing spatial and
attribute queries that will aid in the management of educational facilities in the study area. The map of the study
area was acquired and used to derive the base map through the process of digitizing using ArcGIS10.4.1. The
coordinates of each school was obtained using a hand-held global positioning system (GPS) receiver and
plotted on the base map. A very robust geospatial database was created after which spatial and attribute
queries were carried out. The results show that the Oredo LGA has a very low teacher – student ratio of 1:43 as
against 1:25 advocated by the National policy on Education 2011. Results further reveals that about five
settlements in the study area do not have post primary school and majority of the schools are over populated.
Spatial and attribute queries generated shows that only two (2) schools have toilet facilities with water while the
remaining eleven (11) schools have no toilet facilities. Five (5) out of the thirteen (13) schools are built within
about 500m to the moat which are seriously threatened by gully erosion from the moat. About three (3) schools
have dilapidated buildings.
Keywords: Database, Education, Facilities, Geographic Information System, Management
----------------------------------------------------------------------------------------------------------------------------- --------
Date of Submission: 20-03-2018 Date of acceptance: 05-04-2018
----------------------------------------------------------------------------------------------------------------------------- ----------
I. Introduction
Education is a basic human right and is indispensable for the realization of other human rights as a
means for accessing broader social, economic, political and cultural benefits. This is because it is transformative
and empowering. Education contributes to building more just societies through reducing poverty and
inequalities, enhancing acceptance of diversity, and promoting respect for the rule of law (Aliyu et al., 2012).
The challenge of making adequate provision of facilities in the educational system lies in the management of
facilities and the use of Geographic Information System tool is necessary. In a general sense the term GIS
describes any information system that integrates, stores, edits analyzes, shares and display geographic
information for informed decision making. GIS applications are tools that allow users to create interactive
queries, analyze spatial information, edit data in maps and present the results of all these operations (Clarke,
1986).
Geographic information system (GIS) and education share common characteristics that cross the
boundaries of disciplines and application areas. Similarly, education has been a subject of interest to every areas
of our life and as such, the potential for GIS application in education is significant (Ayeni et al., 2012).
GIS is now recognized widely as a valuable tool for managing, analyzing, displaying large volumes of
diverse data pertinent to many local, regional and national activities. Its use in environmental planning is rapidly
increasing. Education management is an activity highly dependent on environmental resources since the process
most time involves structures and is a phenomenon which in event of lack of planning is likely to erode its base;
hence its strength can be enhanced by GIS application (Ayeni et al., 2012).
Yoko and Seisuke (2004) stated that schools in Bangkok have their databases scattered all over
different agencies and are not integrated into digital format thereby preventing location analysis using GIS.
Ojiako and Igbokwe (2009) identify the same at Nnewi Urban area of Anambra State. They stated “The learning
conditions in schools are alarming with lack of teaching materials, overcrowded classrooms and generally run-
down condition of many of the schools buildings. The significance of these cited reviews is that the introduction
of GIS as a tool helps data presentation easier to access, provide more flexible assistance in prospective
planning at multiple unit of analysis and carrying out queries at any time.
GIS is a computerized tool that consist of (computerized) map, a database of descriptive information
(attributes) and a set of software that performs complex spatial operations. It is one of the new technologies
available for management of resources. Using GIS management and allocation of resources through the
effective use of shared data can provide better service through efficient decision making. The current roles of
both NPEC and UBE demand quick and accurate decision making. None of these agencies uses GIS, therefore
Creation of Geospatial Database for Educational Facilities in Oredo Local Government Area of ..
DOI: 10.9790/7388-0802047284 www.iosrjournals.org 73 | Page
most of their responsibilities are discharged using other tools that may be deemed fit. These other tools are
however not adequate to justify quick and accurate discharge of these responsibilities.
The unevenness in the distribution of educational facilities and the inadequate management of the
educational facilities is a common feature in most Secondary School System.
The educational authorities of the school system try to even the distribution of these facilities but the
population keeps increasing, enrolment figures of student keep changing from year to year, the number of
teachers is not constant and the physical facilities keep depreciating over a period of time. There is need to
replace and redistribute these educational facilities in order to determine areas with poor utilization. The task
requires several sources of data including facilities location, population statistics of teachers and students, road
map, information about the school itself, recreational facilities etc.
Disparity in the distribution of schools is noticeable in Oredo LGA of Edo State; this may hinder the
national objectives of establishing them. In terms of accessibility some students have to walk a long distance to
get to school and the available classrooms, tables and chairs are not sufficient as a result of increased population
and enrolment. The qualified teachers to manage the huge number of students in terms of teaching are not
available.
According to Onyidoh (2007) there is nothing wrong with the formulation of the educational
curriculum and policy but, the implementation is the main problem. The implementation of laudable policies has
often been hampered by incessant change of government, unstable academic calendars, poor and inadequate
facilities, lack of motivation for staff, insecurity of life and property and the unwillingness of the products to
make positive contribution to society. As a result of Faculty implementation of the National Policy on
Education, these have resulted into morally decadent and intellectually inept child who is a threat to both parents
and society (Onyidoh, 2007).
In order to eradicate these problems there is need for proper planning, monitoring and management of
these facilities in the school system. In Nigeria, the management of educational facilities is facing a lot of
challenges. The population growth has out grown the management capacity of various sectors. There is therefore
the need for a more effective management approach to face the current challenges. The Geographic Information
System (GIS) provides solution to these management problems. Since majority of information and decision in
all educational institutions are land based, the Geographic Information System (GIS) becomes a very useful
management tool. The spatial modelling capability offered by GIS is directly applicable to understand the
spatial variations in educational facilities. Also, the GIS school mapping information forms a basic support for
proper planning, monitoring and co-ordination management of the education sector at all levels. Therefore
research intends to create a robust Geospatial database for education facilities for accurate decision making and
the effective management of educational facilities in the study area.
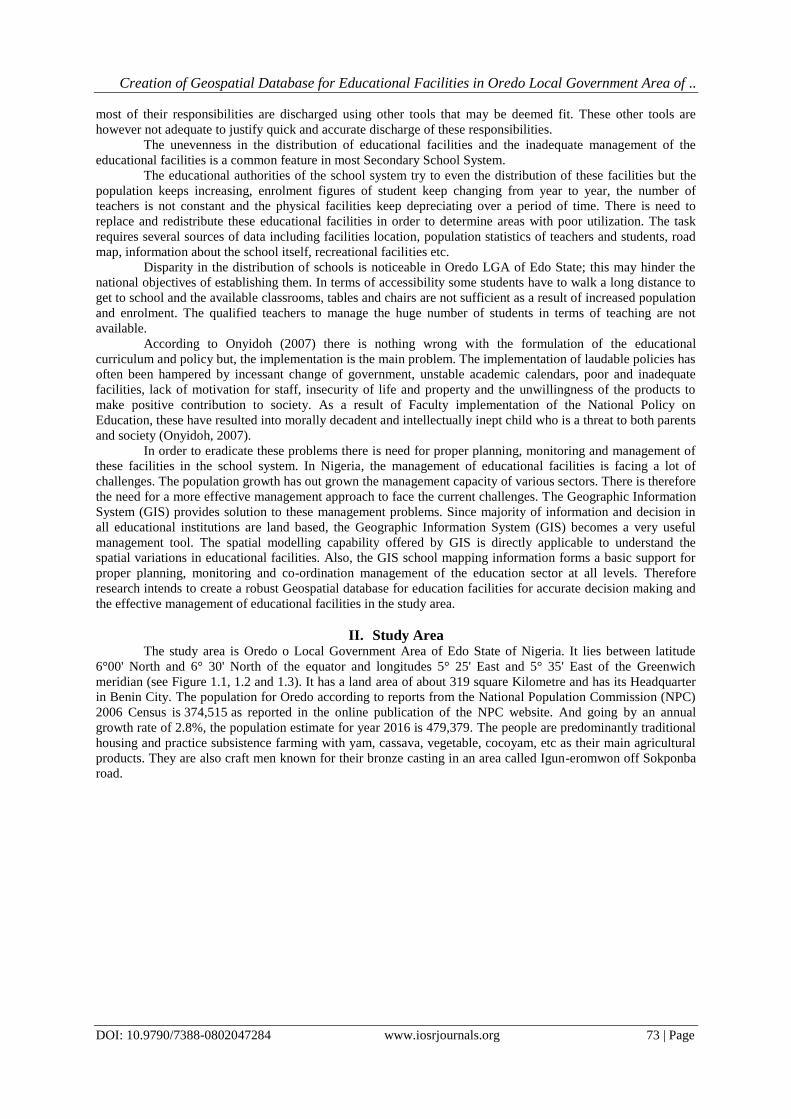
II. Study Area The study area is Oredo o Local Government Area of Edo State of Nigeria. It lies between latitude
6°00' North and 6° 30' North of the equator and longitudes 5° 25' East and 5° 35' East of the Greenwich
meridian (see Figure 1.1, 1.2 and 1.3). It has a land area of about 319 square Kilometre and has its Headquarter
in Benin City. The population for Oredo according to reports from the National Population Commission (NPC)
2006 Census is 374,515 as reported in the online publication of the NPC website. And going by an annual
growth rate of 2.8%, the population estimate for year 2016 is 479,379. The people are predominantly traditional
housing and practice subsistence farming with yam, cassava, vegetable, cocoyam, etc as their main agricultural
products. They are also craft men known for their bronze casting in an area called Igun-eromwon off Sokponba
road.
Creation of Geospatial Database for Educational Facilities in Oredo Local Government Area of ..
DOI: 10.9790/7388-0802047284 www.iosrjournals.org 74 | Page
Fig 1: (a) Map of Nigeria showing Edo State, (b) Map of Edo state showing Oredo L.G.A, (c) Map of Oredo
L.G.A (Study Area)
III. Methodology This section details the methodology adopted in this study. The methodology is subdivided into various steps
such as: data requirement and sources, GIS database modelling and creation, integration of data layers in the
GIS database and GIS analysis.
3.1 Data Requirement and Sources
The data required for this study includes the following:
a. The administrative maps of Nigeria, Edo state and Oredo Local Government Area. These were sourced
from Ministry of Lands and survey Benin City.
b. Educational facilities Directory for Oredo Local Government, this was sourced from the Ministry of
Education, Edo State
c. Location of educational facilities in Oredo LGA. Handheld GPS was used to collect the coordinates of the
educational facilities.
d. Demographic data was sourced from the National Population Commission, Edo state office.
Creation of Geospatial Database for Educational Facilities in Oredo Local Government Area of ..
DOI: 10.9790/7388-0802047284 www.iosrjournals.org 75 | Page
3.1.1 Acquisition of Primary Datasets
The primary datasets that was obtained through field visits are:
i. Positions or location of Educational facilities in Oredo LGA. Handheld GPS Garmin 76 was used to collect
the coordinates of the educational facilities
ii. Attribute data: This includes non-spatial descriptive information of the educational facilities. This too was
collected in the field.
3.1.2 Acquisition of Secondary Datasets
The secondary datasets was gotten from digitization of available map data and attribute data such as:
a. The administrative map of Nigeria, Edo state, and map of Oredo LGA were sourced from the Ministry
of Land and Survey Benin City.
b. The Directory of educational facilities in Oredo Local Government was sourced from the Ministry of
Education, Benin City.
c. Attribute data: This includes non spatial descriptive information of the educational facilities; these were
gotten from the records kept by the Ministry of Education, Demographic data was collected from the
National Population Commission.
3.2 GIS Database Creation and Modelling
The methodology that was employed in this study involves conversion of analogue map into digital
map, plotting of coordinate points, Geo-database creation and queries generations. First, the analogue map of
Oredo LGA was converted to digital through the process of scanning, georeferenced and digitizing. The
coordinates of educational facilities gotten during field work was plotted on the map, after which a robust
geospatial database was created with the attribute and demographic data. Consequently, the database was
analysed and various queries generated for the study, such queries includes locational query, accessibility query, and
query on suitability of location educational facilities.
In achieving the objectives of the study, a geospatial database of the educational facilities in Oredo
LGA was created. To achieve this, the database creation stages was categorised into conceptual modelling,
logical data modelling, and physical database design.
3.2.1 Conceptual Modelling
This is a representation of human conceptualizing of reality of the entire information content of the database.
Here decision on how the view of reality was presented in a simplified manner and to the satisfaction of the
information requirement of the project was made.
The stages in the conceptual data modelling involved the four steps: identification of entities, identification of
attributes, determining relationships, drawing of entity-relationship diagram.
a. Identification of Entities: Here all the entities relevant to educational facilities database were identified.
In identifying the entities, the researcher ensured that the entities; are of great interest to the study, have multiple
occurrence, and are unique.
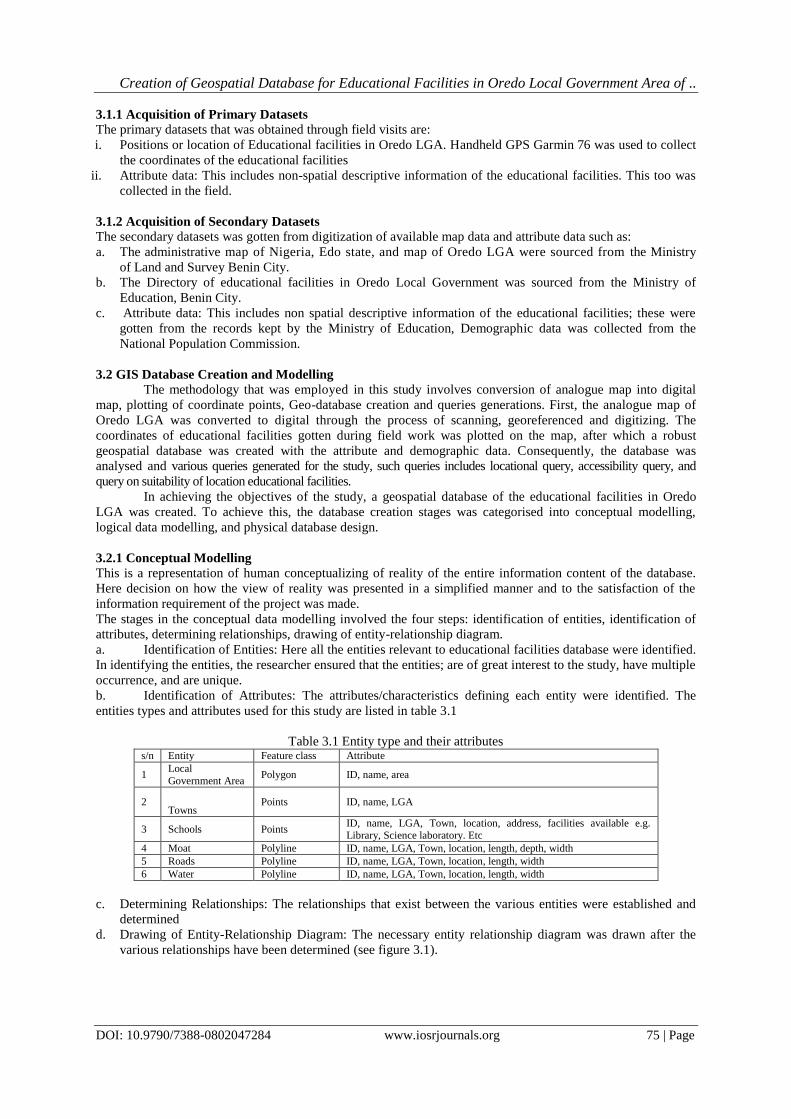
b. Identification of Attributes: The attributes/characteristics defining each entity were identified. The
entities types and attributes used for this study are listed in table 3.1
Table 3.1 Entity type and their attributes s/n Entity Feature class Attribute
1 Local
Government Area Polygon ID, name, area
2 Towns
Points ID, name, LGA
3 Schools Points ID, name, LGA, Town, location, address, facilities available e.g. Library, Science laboratory. Etc
4 Moat Polyline ID, name, LGA, Town, location, length, depth, width
5 Roads Polyline ID, name, LGA, Town, location, length, width
6 Water Polyline ID, name, LGA, Town, location, length, width
c. Determining Relationships: The relationships that exist between the various entities were established and
determined
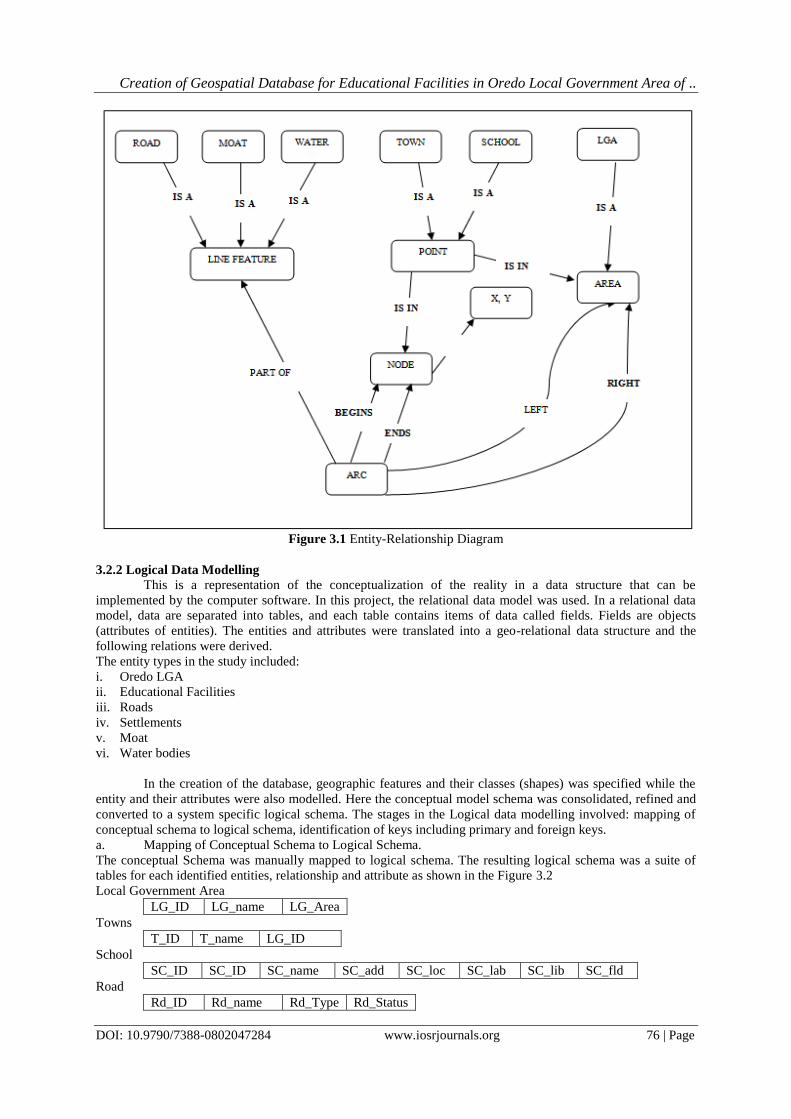
d. Drawing of Entity-Relationship Diagram: The necessary entity relationship diagram was drawn after the
various relationships have been determined (see figure 3.1).
Creation of Geospatial Database for Educational Facilities in Oredo Local Government Area of ..
DOI: 10.9790/7388-0802047284 www.iosrjournals.org 76 | Page
Figure 3.1 Entity-Relationship Diagram
3.2.2 Logical Data Modelling
This is a representation of the conceptualization of the reality in a data structure that can be
implemented by the computer software. In this project, the relational data model was used. In a relational data
model, data are separated into tables, and each table contains items of data called fields. Fields are objects
(attributes of entities). The entities and attributes were translated into a geo-relational data structure and the
following relations were derived.
The entity types in the study included:
i. Oredo LGA
ii. Educational Facilities
iii. Roads
iv. Settlements
v. Moat
vi. Water bodies
In the creation of the database, geographic features and their classes (shapes) was specified while the
entity and their attributes were also modelled. Here the conceptual model schema was consolidated, refined and
converted to a system specific logical schema. The stages in the Logical data modelling involved: mapping of
conceptual schema to logical schema, identification of keys including primary and foreign keys.
a. Mapping of Conceptual Schema to Logical Schema.
The conceptual Schema was manually mapped to logical schema. The resulting logical schema was a suite of
tables for each identified entities, relationship and attribute as shown in the Figure 3.2
Local Government Area
LG_ID LG_name LG_Area
Towns
T_ID T_name LG_ID
School
SC_ID SC_ID SC_name SC_add SC_loc SC_lab SC_lib SC_fld
Road
Rd_ID Rd_name Rd_Type Rd_Status
Creation of Geospatial Database for Educational Facilities in Oredo Local Government Area of ..
DOI: 10.9790/7388-0802047284 www.iosrjournals.org 77 | Page
Settlements
ST_ID ST_name LG_ID T_ID
Moat
MT_ID MT_ID MT_ID
Water body
W_ID W_name LG_ID T_ID
Figure 3.2 Logical Schema of the entities
b. Identification of Primary Keys and Foreign Keys
The identification of the primary keys was done to ensure entity integrity constraint which requires that the
column for the primary key do not contain any null value and all the values in the column were unique.
3.2.3 Physical Data Modelling
The representation of the data structure in the format of the implementation software is usually done at
the beginning of the database creation phase. This involves the translation of the real world entities into the
computer compatible forms of the chosen structuring methods i.e. network, hierarchical and relational. In this
study, the relational (table) structuring method was used. In this method, tables consisting of columns (fields)
and rows (records) were created to show the relationship between different data. The tables were structured in
such a way that they can be linked with one another for connectivity.
3.3 Integration of Data layers in the GIS Database
This is the final process whereby data layers are brought together to facilitate searching and analysis
using multiple criteria. The linking of spatial and attribute data was done through identifiers, which are common
to records in both data. The linkage operation provided an ideal chance to verify the quality of both spatial and
attribute data. It was also used to check whether links have been properly made or not. Linking of spatial and
attribute data completed the geographic database creation after which analysis operations were undertaken
which allowed users to create maps, integrate information, present powerful idea and develop effective
solutions. The user can either view the map in the computer screen or receive the output on plotters and printer.
Based on relational data model, an educational facilities attribute database was modelled and developed for the
purpose of interactiveness. A relational database is efficient and flexible for data search, data retrieval and
creation of tabular reports. Each table in the database was prepared, maintained and edited separately from other
tables. The tables remained separated until linked up by query or analysis.
3.4 GIS Analysis
Different types of database queries were framed and executed. Database query is referred to as the
selection of various combination tables for examination; it involves the retrieval of information stored in the
database using structured query language (SQL). SQL is a database sub language for querying and modifying
relational databases (RDBMS). Queries were generated for the purpose of this study.
IV. Results In this section, the results obtained from the analysis performed using the Arc GIS 10 software are presented.
The results of the database queries were presented in form of digital maps, graphic displays and tables.
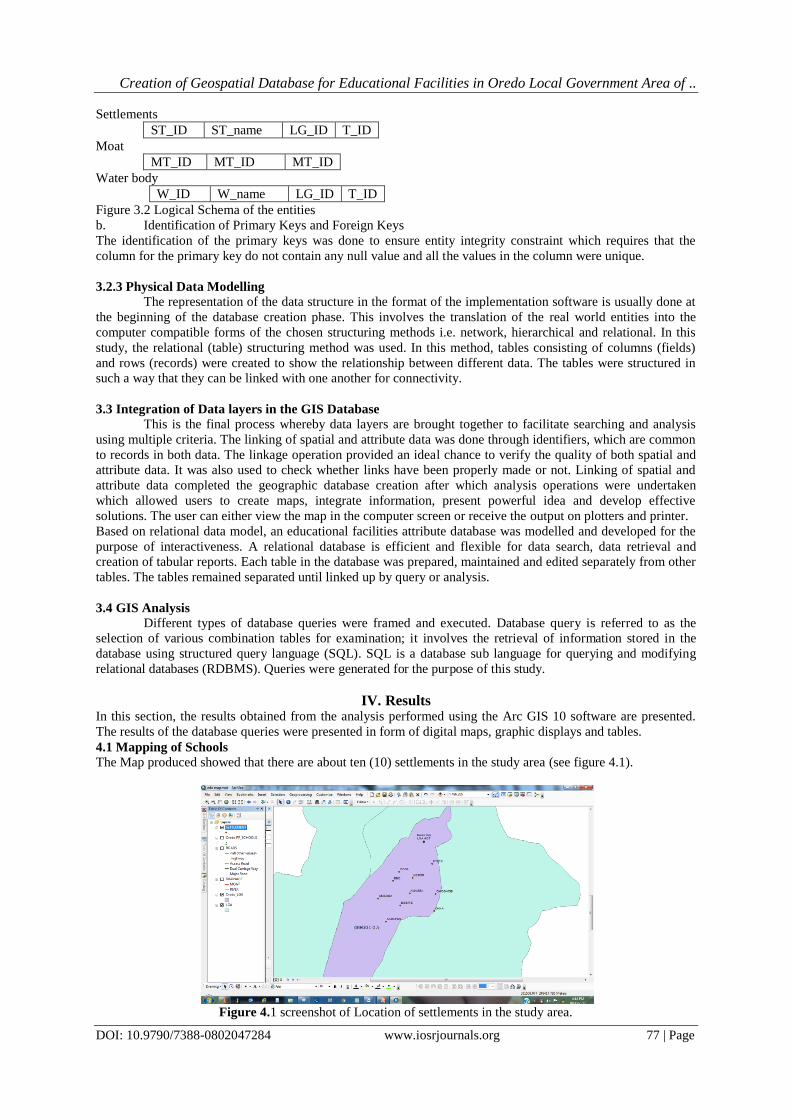
4.1 Mapping of Schools
The Map produced showed that there are about ten (10) settlements in the study area (see figure 4.1).
Figure 4.1 screenshot of Location of settlements in the study area.
Creation of Geospatial Database for Educational Facilities in Oredo Local Government Area of ..
DOI: 10.9790/7388-0802047284 www.iosrjournals.org 78 | Page
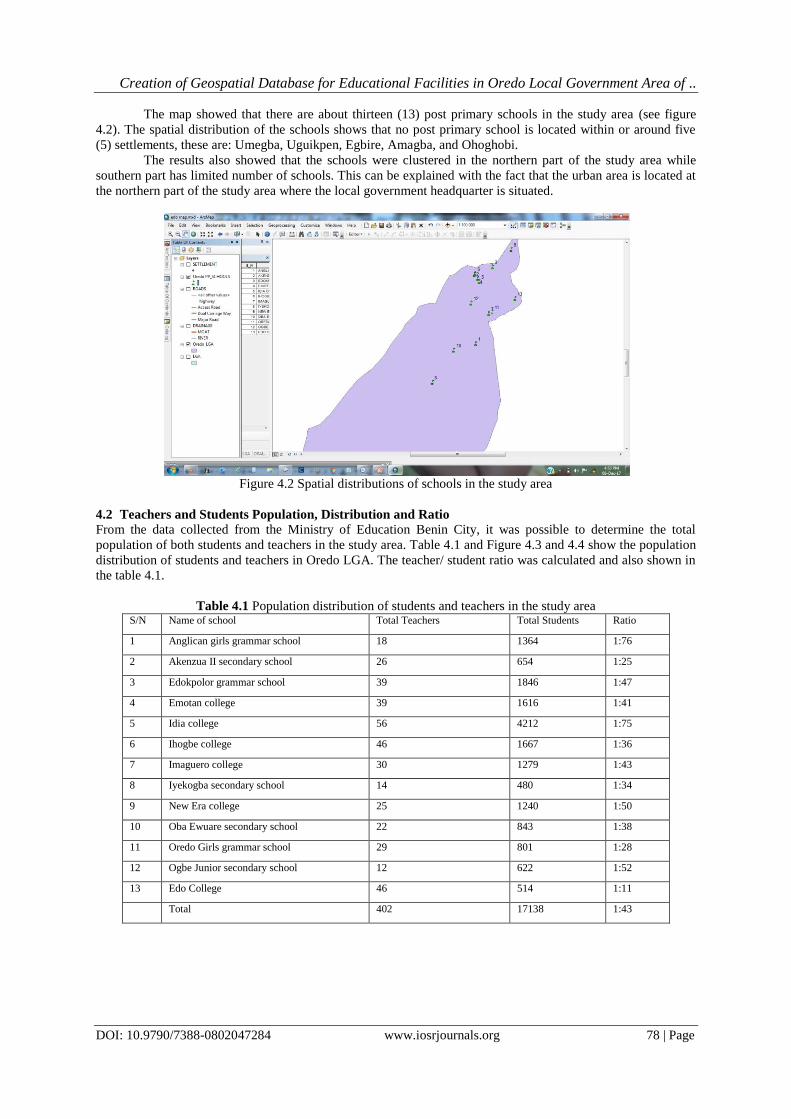
The map showed that there are about thirteen (13) post primary schools in the study area (see figure
4.2). The spatial distribution of the schools shows that no post primary school is located within or around five
(5) settlements, these are: Umegba, Uguikpen, Egbire, Amagba, and Ohoghobi.
The results also showed that the schools were clustered in the northern part of the study area while
southern part has limited number of schools. This can be explained with the fact that the urban area is located at
the northern part of the study area where the local government headquarter is situated.
Figure 4.2 Spatial distributions of schools in the study area
4.2 Teachers and Students Population, Distribution and Ratio
From the data collected from the Ministry of Education Benin City, it was possible to determine the total
population of both students and teachers in the study area. Table 4.1 and Figure 4.3 and 4.4 show the population
distribution of students and teachers in Oredo LGA. The teacher/ student ratio was calculated and also shown in
the table 4.1.
Table 4.1 Population distribution of students and teachers in the study area S/N Name of school Total Teachers Total Students Ratio
1 Anglican girls grammar school 18 1364 1:76
2 Akenzua II secondary school 26 654 1:25
3 Edokpolor grammar school 39 1846 1:47
4 Emotan college 39 1616 1:41
5 Idia college 56 4212 1:75
6 Ihogbe college 46 1667 1:36
7 Imaguero college 30 1279 1:43
8 Iyekogba secondary school 14 480 1:34
9 New Era college 25 1240 1:50
10 Oba Ewuare secondary school 22 843 1:38
11 Oredo Girls grammar school 29 801 1:28
12 Ogbe Junior secondary school 12 622 1:52
13 Edo College 46 514 1:11
Total 402 17138 1:43
Creation of Geospatial Database for Educational Facilities in Oredo Local Government Area of ..
DOI: 10.9790/7388-0802047284 www.iosrjournals.org 79 | Page
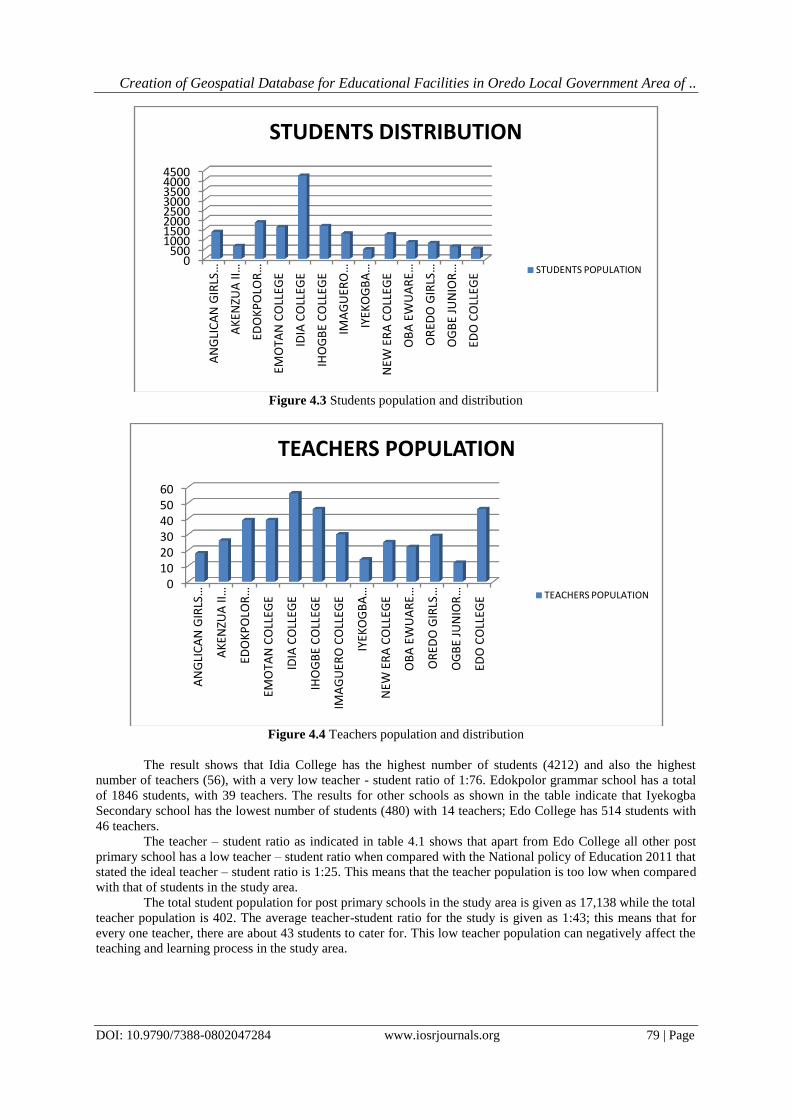
Figure 4.3 Students population and distribution
Figure 4.4 Teachers population and distribution
The result shows that Idia College has the highest number of students (4212) and also the highest
number of teachers (56), with a very low teacher - student ratio of 1:76. Edokpolor grammar school has a total
of 1846 students, with 39 teachers. The results for other schools as shown in the table indicate that Iyekogba
Secondary school has the lowest number of students (480) with 14 teachers; Edo College has 514 students with
46 teachers.
The teacher – student ratio as indicated in table 4.1 shows that apart from Edo College all other post
primary school has a low teacher – student ratio when compared with the National policy of Education 2011 that
stated the ideal teacher – student ratio is 1:25. This means that the teacher population is too low when compared
with that of students in the study area.
The total student population for post primary schools in the study area is given as 17,138 while the total
teacher population is 402. The average teacher-student ratio for the study is given as 1:43; this means that for
every one teacher, there are about 43 students to cater for. This low teacher population can negatively affect the
teaching and learning process in the study area.
0500
10001500200025003000350040004500
AN
GLI
CA
N G
IRLS
…
AK
ENZU
A II
…
EDO
KP
OLO
R …
EMO
TAN
CO
LLEG
E
IDIA
CO
LLEG
E
IHO
GB
E C
OLL
EGE
IMA
GU
ERO
…
IYEK
OG
BA
…
NEW
ER
A C
OLL
EGE
OB
A E
WU
AR
E …
OR
EDO
GIR
LS …
OG
BE
JUN
IOR
…
EDO
CO
LLEG
E
STUDENTS DISTRIBUTION
STUDENTS POPULATION
0102030405060
AN
GLI
CA
N G
IRLS
…
AK
ENZU
A II
…
EDO
KP
OLO
R …
EMO
TAN
CO
LLEG
E
IDIA
CO
LLEG
E
IHO
GB
E C
OLL
EGE
IMA
GU
ERO
CO
LLEG
E
IYEK
OG
BA
…
NEW
ER
A C
OLL
EGE
OB
A E
WU
AR
E …
OR
EDO
GIR
LS …
OG
BE
JUN
IOR
…
EDO
CO
LLEG
E
TEACHERS POPULATION
TEACHERS POPULATION
Creation of Geospatial Database for Educational Facilities in Oredo Local Government Area of ..
DOI: 10.9790/7388-0802047284 www.iosrjournals.org 80 | Page
4.3 Queries Generation
Database query is referred to as the selection of various combination tables for examination; it involves the
retrieval of information stored in the database using structured query language (SQL). SQL is a database
sublanguage for querying and modifying relational databases (RDBMS). The section following outline the
various queries and the results.
a. Query to Determine Schools With Dilapidated Buildings
This query was formulated and performed in other to determine the schools whose buildings are dilapidated (see
figure 4.5). It was done based on the fact that; conducive environment for learning enhances education and a
good solid building/structure with standard roofing and ventilated classrooms is one of the key factors of
conducive environment for education.
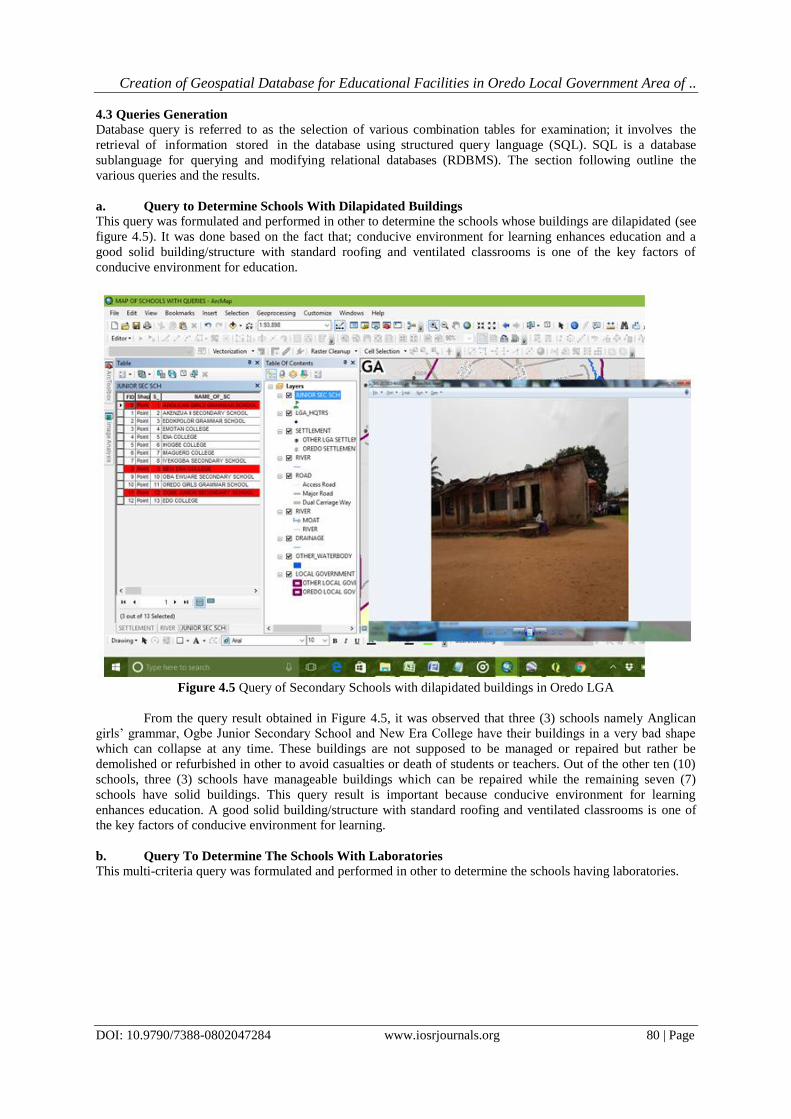
Figure 4.5 Query of Secondary Schools with dilapidated buildings in Oredo LGA
From the query result obtained in Figure 4.5, it was observed that three (3) schools namely Anglican
girls’ grammar, Ogbe Junior Secondary School and New Era College have their buildings in a very bad shape
which can collapse at any time. These buildings are not supposed to be managed or repaired but rather be
demolished or refurbished in other to avoid casualties or death of students or teachers. Out of the other ten (10)
schools, three (3) schools have manageable buildings which can be repaired while the remaining seven (7)
schools have solid buildings. This query result is important because conducive environment for learning
enhances education. A good solid building/structure with standard roofing and ventilated classrooms is one of
the key factors of conducive environment for learning.
b. Query To Determine The Schools With Laboratories
This multi-criteria query was formulated and performed in other to determine the schools having laboratories.
Creation of Geospatial Database for Educational Facilities in Oredo Local Government Area of ..
DOI: 10.9790/7388-0802047284 www.iosrjournals.org 81 | Page
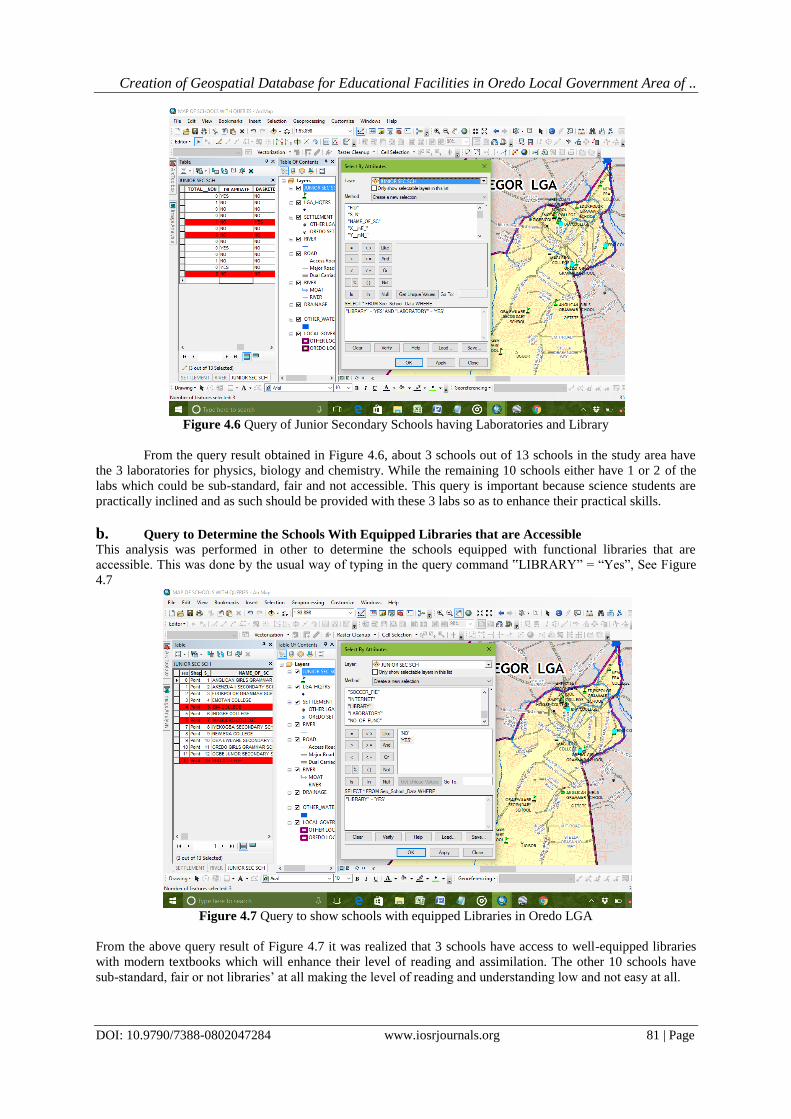
Figure 4.6 Query of Junior Secondary Schools having Laboratories and Library
From the query result obtained in Figure 4.6, about 3 schools out of 13 schools in the study area have
the 3 laboratories for physics, biology and chemistry. While the remaining 10 schools either have 1 or 2 of the
labs which could be sub-standard, fair and not accessible. This query is important because science students are
practically inclined and as such should be provided with these 3 labs so as to enhance their practical skills.
b. Query to Determine the Schools With Equipped Libraries that are Accessible
This analysis was performed in other to determine the schools equipped with functional libraries that are
accessible. This was done by the usual way of typing in the query command ‟LIBRARY” = “Yes”, See Figure
4.7
Figure 4.7 Query to show schools with equipped Libraries in Oredo LGA
From the above query result of Figure 4.7 it was realized that 3 schools have access to well-equipped libraries
with modern textbooks which will enhance their level of reading and assimilation. The other 10 schools have
sub-standard, fair or not libraries’ at all making the level of reading and understanding low and not easy at all.
Creation of Geospatial Database for Educational Facilities in Oredo Local Government Area of ..
DOI: 10.9790/7388-0802047284 www.iosrjournals.org 82 | Page
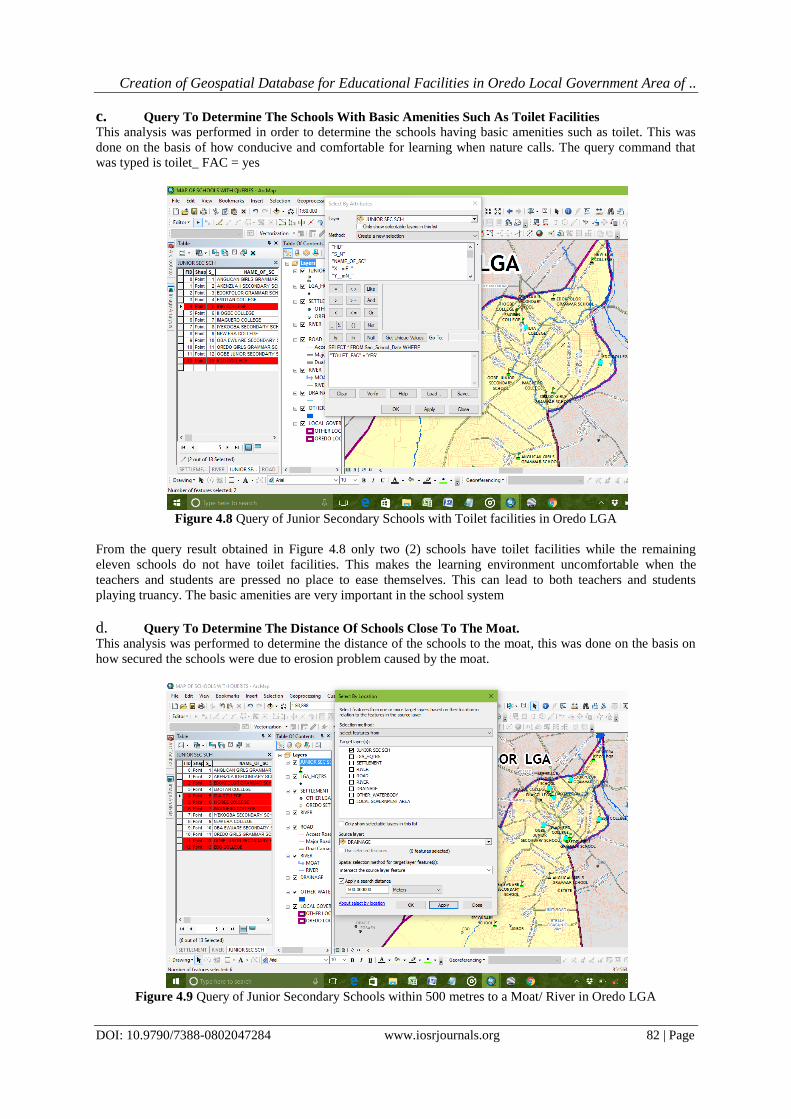
c. Query To Determine The Schools With Basic Amenities Such As Toilet Facilities
This analysis was performed in order to determine the schools having basic amenities such as toilet. This was
done on the basis of how conducive and comfortable for learning when nature calls. The query command that
was typed is toilet_ FAC = yes
Figure 4.8 Query of Junior Secondary Schools with Toilet facilities in Oredo LGA
From the query result obtained in Figure 4.8 only two (2) schools have toilet facilities while the remaining
eleven schools do not have toilet facilities. This makes the learning environment uncomfortable when the
teachers and students are pressed no place to ease themselves. This can lead to both teachers and students
playing truancy. The basic amenities are very important in the school system
d. Query To Determine The Distance Of Schools Close To The Moat. This analysis was performed to determine the distance of the schools to the moat, this was done on the basis on
how secured the schools were due to erosion problem caused by the moat.
Figure 4.9 Query of Junior Secondary Schools within 500 metres to a Moat/ River in Oredo LGA
Creation of Geospatial Database for Educational Facilities in Oredo Local Government Area of ..
DOI: 10.9790/7388-0802047284 www.iosrjournals.org 83 | Page
From the query result obtained in Figure 4.9 five (5) schools were closed to the moat. This serve as a threat to
the school buildings because area close to the moat are prone to erosion and this can lead to the destruction of
the buildings and threat to life of the students and teachers.
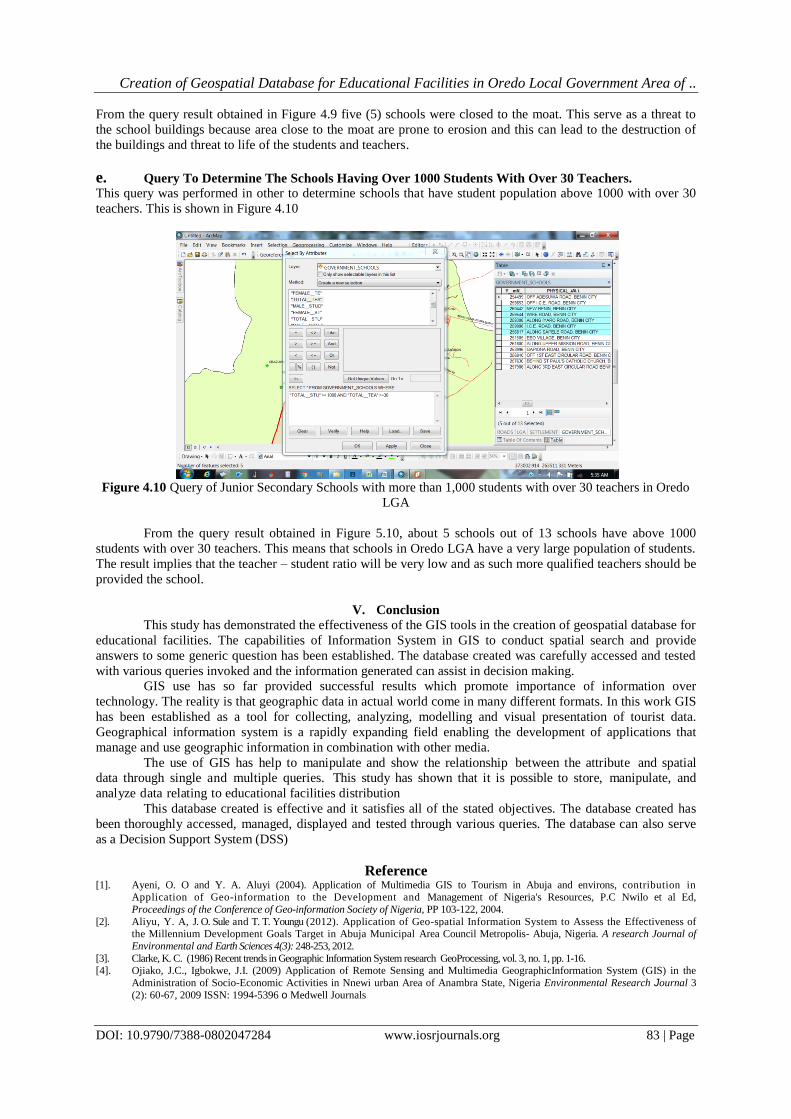
e. Query To Determine The Schools Having Over 1000 Students With Over 30 Teachers.
This query was performed in other to determine schools that have student population above 1000 with over 30
teachers. This is shown in Figure 4.10
Figure 4.10 Query of Junior Secondary Schools with more than 1,000 students with over 30 teachers in Oredo
LGA
From the query result obtained in Figure 5.10, about 5 schools out of 13 schools have above 1000
students with over 30 teachers. This means that schools in Oredo LGA have a very large population of students.
The result implies that the teacher – student ratio will be very low and as such more qualified teachers should be
provided the school.
V. Conclusion
This study has demonstrated the effectiveness of the GIS tools in the creation of geospatial database for
educational facilities. The capabilities of Information System in GIS to conduct spatial search and provide
answers to some generic question has been established. The database created was carefully accessed and tested
with various queries invoked and the information generated can assist in decision making.
GIS use has so far provided successful results which promote importance of information over
technology. The reality is that geographic data in actual world come in many different formats. In this work GIS
has been established as a tool for collecting, analyzing, modelling and visual presentation of tourist data.
Geographical information system is a rapidly expanding field enabling the development of applications that
manage and use geographic information in combination with other media.
The use of GIS has help to manipulate and show the relationship between the attribute and spatial
data through single and multiple queries. This study has shown that it is possible to store, manipulate, and
analyze data relating to educational facilities distribution
This database created is effective and it satisfies all of the stated objectives. The database created has
been thoroughly accessed, managed, displayed and tested through various queries. The database can also serve
as a Decision Support System (DSS)
Reference [1]. Ayeni, O. O and Y. A. Aluyi (2004). Application of Multimedia GIS to Tourism in Abuja and environs, contribution in
Application of Geo-information to the Development and Management of Nigeria's Resources, P.C Nwilo et al Ed,
Proceedings of the Conference of Geo-information Society of Nigeria, PP 103-122, 2004.
[2]. Aliyu, Y. A, J. O. Sule and T. T. Youngu (2012). Application of Geo-spatial Information System to Assess the Effectiveness of the Millennium Development Goals Target in Abuja Municipal Area Council Metropolis- Abuja, Nigeria. A research Journal of
Environmental and Earth Sciences 4(3): 248-253, 2012.
[3]. Clarke, K. C. (1986) Recent trends in Geographic Information System research GeoProcessing, vol. 3, no. 1, pp. 1-16. [4]. Ojiako, J.C., Igbokwe, J.I. (2009) Application of Remote Sensing and Multimedia GeographicInformation System (GIS) in the
Administration of Socio-Economic Activities in Nnewi urban Area of Anambra State, Nigeria Environmental Research Journal 3
(2): 60-67, 2009 ISSN: 1994-5396 o Medwell Journals
Creation of Geospatial Database for Educational Facilities in Oredo Local Government Area of ..
DOI: 10.9790/7388-0802047284 www.iosrjournals.org 84 | Page
[5]. Onyidoh H. (2007). The Decline of the Education System in Nigeria . Retrievedfrom:ht://www.helium.com/items/525840-
the-decline-of-the-education-system-in-Nigeria. Accessed on: March 13, 2015.
[6]. Yoko, M. and Seisuke, W. (2004). “The Application of GIS to School Mapping in Bangkok.” Available at www.gisdevelopment.net.Accessed on 28/12/2012.
Ojiako, J.C "Creation of Geospatial Database for Educational Facilities in Oredo Local
Government Area of Edo State, Nigeria.” IOSR Journal of Research & Method in Education
(IOSR-JRME) , vol. 8, no. 2, 2018, pp. 72-84.