Embed Size (px)
Citation preview
WP-2014-041
Creating Youth Employment in Asia
S.Mahendra Dev
Indira Gandhi Institute of Development Research, MumbaiOctober 2014
http://www.igidr.ac.in/pdf/publication/WP-2014-041.pdf
Creating Youth Employment in Asia
S.Mahendra DevIndira Gandhi Institute of Development Research (IGIDR)
General Arun Kumar Vaidya Marg Goregaon (E), Mumbai- 400065, INDIA
Email(corresponding author): [email protected]
AbstractSeveral countries in the Asia-Pacific region are experiencing demographic changes. Over 60 per cent of
the world's youth live in Asia and the Pacific, which translates into more than 750 million young women
and men aged 15 to 24 years. They represent a key asset for the countries of this region. Young people
are a major human resource for development, key agents for social change and driving force for
economic development and technological innovation. But harnessing these resources is a major
challenge. The youth challenge is considered as the most critical of the 21st century's economic
development challenge.
In this context, this paper examines the labour market characteristics for adults and the entire
population. Then it analyses challenges and opportunities in labour market for youth. Next, the paper
discusses the existing and needed policies for taking care of the challenges in overall and youth labour
markets. It also provides conclusions and recommendations. We also highlight the gender issues in the
paper. The recommendations include direct policies such as active lbour market policies, social
protection programmes, fair migration and indirect policies like pro employment macro policies.
There are significant links between creating employment opportunities for the youth and enhancement
of human development. Employment and livelihoods particularly productive youth employment has
impact on most of the indicators of Sustainable Development Goals (SDGs). They can reduce poverty,
under nutrition, improve the education, health and gender equality.
Keywords: Youth employment, unemployment, active labour market policies, social protection,maternity benefits, employment injury, disability benefits, migration, skill development, proemployment macro policies
JEL Code: J21, J23, J24, J28, J30, J61, J83
1
CREATING YOUTH EMPLOYMENT IN ASIA1
S.Mahendra Dev
1. INTRODUCTION
Expanding productive employment is central for sustained poverty reduction and food security in
developing countries, as labour is the main asset for majority of the poor. It is also known that a
high output elasticity of employment generally ensures that growth is egalitarian. However,
inspite of its importance, the concern for employment in development thinking has been pushed
aside particularly in the last two decades. It is important to place the employment issue at the
centre of the national and international agenda. Post-2015 MDG agenda provides this
opportunity of focus on employment. Productive employment is also crucial for the success of
MDGs and achieving human development. Creating employment for the youth in Asia and
Pacific provides an opportunity for achieving some of these goals.
Several countries in the Asia-Pacific region are experiencing demographic changes. Over 60 per
cent of the world’s youth live in Asia and the Pacific, which translates into more than 750
million young women and men aged 15 to 24 years. They represent a key asset for the countries
of this region. Young people are a major human resource for development, key agents for social
change and driving force for economic development and technological innovation. But
harnessing these resources is a major challenge (see Box 1). The youth challenge is considered as
the most critical of the 21st century’s economic development challenge.
Moreover, the decline in fertility rate has led to the bulge in working age population which is
considered as the demographic dividend. It is a great concern that how this bulge in working age
population presents the opportunities for growth and prosperity of the region. The critical aspects
of the challenge are mostly related to labour market entry where young people encounter
difficulties in finding and maintaining a decent job. The growing large number of unemployed
youth is one of the most daunting problems faced by developed and developing countries alike. It
is known that with demographic dividend, as more people enter the working age, there will be
large numbers joining labour force. It is a challenge for many countries to create employment in
order to absorb the increased labour force. But, demographic changes and implications for work
force vary across countries. In South Asian countries, working age population will increase
further while East Asian countries are gradually experiencing ageing. 12th
Plan Approach paper
in India says that the labour force in India is expected to increase by 32 per cent while it will
decline by nearly 5 per cent in China over the next 20 years.
There will be challenges and opportunities for young population in getting productive and decent
employment. Draft 12th
Plan of India indicates that young population is an asset only if it is (a)
educated (b) skilled and (c) finds productive employment.
1 Different version of the Background Technical paper for Asia Pacific Human Development Report, UNDP, New
York. The author is grateful to APHDR team in New York for useful comments.
2
Box 1 Why focus on youth? Youth unemployment and situations in which young people give up on the job search or work under inadequate
conditions incur costs to the economy, to society and to the individual and their family. A lack of decent work, if
experienced at an early age, threatens to compromise a person’s future employment prospects and frequently leads
to unsuitable labour behaviour patterns that last a lifetime. There is a demonstrated link between youth
unemployment and social exclusion. An inability to find employment creates a sense of uselessness and idleness
among young people that can lead to increased crime, mental health problems, violence, conflicts and drug taking.
The most obvious gains then, in making the most of the productive potential of youth and ensuring the availability
of decent employment opportunities for youth, are the personal gains to the young people themselves. The second
obvious gain to recapturing the productive potential of underutilized youth is an economic one. Idleness among
youth can come at great costs. They are not contributing to the economic welfare of the country – quite the contrary.
The loss of income among the younger generation translates into a lack of savings as well as a loss of aggregate
demand. Some youth who are unable to earn their own income have to be financially supported by the family,
leaving less for spending and investments at the household level. Societies lose their investment in education.
Governments fail to receive contributions to social security systems and are forced to increase spending on remedial
services, including on crime or drug use prevention efforts and on unemployment benefits in the countries where
they exist. All this is a threat to the growth and development potential of economies. Focusing on youth, therefore,
makes sense to a country from a cost-benefit point of view. Young people might lack experience but they tend to be
highly motivated and capable of offering new ideas or insights. They are the drivers of economic development in a
country. Foregoing this potential is an economic waste.
Source: ILO (2010), Global Employment Trends for Youth 2010
Against this background, this paper examines challenges and opportunities in creating
employment for Young Population in the Asia-Pacific region. Apart from youth, we also
examine the labour market challenges for adults and total working age population as they
influence the challenges and opportunities for the youth. The paper is organized as follows.
Section 2 examines the labour market characteristics for adults and the entire population while
Section 3 analyses challenges and opportunities in labour market for youth. Section 4 discusses
the existing and needed policies for taking care of the challenges in overall and youth labour
markets. The last section provides conclusions and recommendations. We will also highlight the
gender issues in the paper.
2. LABOUR MARKET CHALLENGES FOR WORKING AGE POPULATION AND
ADULTS
In this section, we examine challenges in labour market for adults and working age population. It
covers employment trends, unemployment, structure of employment, wages, working poor,
gender etc. Basically it gives a descriptive account of trends in these indicators in recent years.
The recent challenges for the region are summarized in the Statistical Year Book for Asia and the
Pacific 2013 of UN ESCAP. It says the following.
“The Asian and Pacific labour market faced varied employment challenges in 2012. Employment growth
decelerated and unemployment among young people remained high. Low job quality persisted. Poor working
conditions were pervasive in developing economies in the region, characterized by widespread vulnerability and
working poverty. In the context of a fragile global economic recovery, creating more productive jobs, and
opportunities for women in particular, is critical throughout the region” (p.235, ESCAP, 2013)
3
The Asia Pacific region has nearly 2 billion workers or about two thirds of global work force.
Three large developing economies of China (775.8 million) India (473.1 million) and Indonesia
(113.7 million) together account for 70 per cent of workers in the Asia Pacific region.
2.1. Labour force and work participation rates
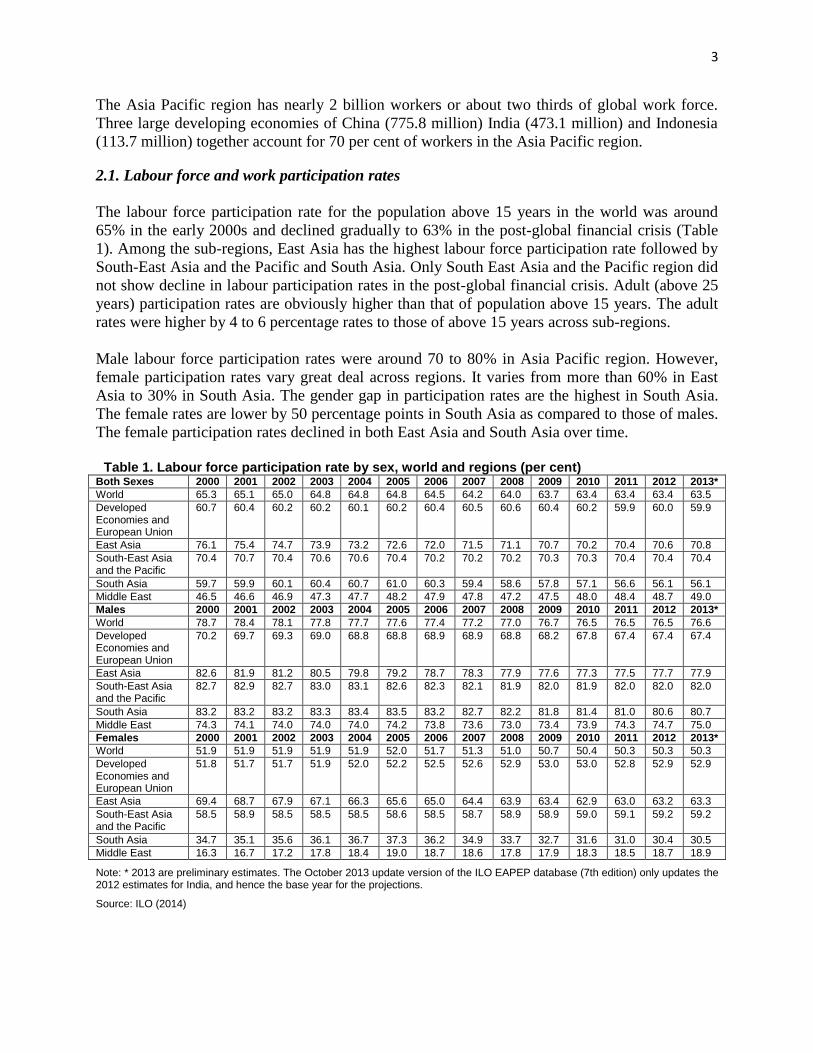
The labour force participation rate for the population above 15 years in the world was around
65% in the early 2000s and declined gradually to 63% in the post-global financial crisis (Table
1). Among the sub-regions, East Asia has the highest labour force participation rate followed by
South-East Asia and the Pacific and South Asia. Only South East Asia and the Pacific region did
not show decline in labour participation rates in the post-global financial crisis. Adult (above 25
years) participation rates are obviously higher than that of population above 15 years. The adult
rates were higher by 4 to 6 percentage rates to those of above 15 years across sub-regions.
Male labour force participation rates were around 70 to 80% in Asia Pacific region. However,
female participation rates vary great deal across regions. It varies from more than 60% in East
Asia to 30% in South Asia. The gender gap in participation rates are the highest in South Asia.
The female rates are lower by 50 percentage points in South Asia as compared to those of males.
The female participation rates declined in both East Asia and South Asia over time.
Table 1. Labour force participation rate by sex, world and regions (per cent) Both Sexes 2000 2001 2002 2003 2004 2005 2006 2007 2008 2009 2010 2011 2012 2013*
World 65.3 65.1 65.0 64.8 64.8 64.8 64.5 64.2 64.0 63.7 63.4 63.4 63.4 63.5
Developed Economies and European Union
60.7 60.4 60.2 60.2 60.1 60.2 60.4 60.5 60.6 60.4 60.2 59.9 60.0 59.9
East Asia 76.1 75.4 74.7 73.9 73.2 72.6 72.0 71.5 71.1 70.7 70.2 70.4 70.6 70.8
South-East Asia and the Pacific
70.4 70.7 70.4 70.6 70.6 70.4 70.2 70.2 70.2 70.3 70.3 70.4 70.4 70.4
South Asia 59.7 59.9 60.1 60.4 60.7 61.0 60.3 59.4 58.6 57.8 57.1 56.6 56.1 56.1
Middle East 46.5 46.6 46.9 47.3 47.7 48.2 47.9 47.8 47.2 47.5 48.0 48.4 48.7 49.0
Males 2000 2001 2002 2003 2004 2005 2006 2007 2008 2009 2010 2011 2012 2013*
World 78.7 78.4 78.1 77.8 77.7 77.6 77.4 77.2 77.0 76.7 76.5 76.5 76.5 76.6
Developed Economies and European Union
70.2 69.7 69.3 69.0 68.8 68.8 68.9 68.9 68.8 68.2 67.8 67.4 67.4 67.4
East Asia 82.6 81.9 81.2 80.5 79.8 79.2 78.7 78.3 77.9 77.6 77.3 77.5 77.7 77.9
South-East Asia and the Pacific
82.7 82.9 82.7 83.0 83.1 82.6 82.3 82.1 81.9 82.0 81.9 82.0 82.0 82.0
South Asia 83.2 83.2 83.2 83.3 83.4 83.5 83.2 82.7 82.2 81.8 81.4 81.0 80.6 80.7
Middle East 74.3 74.1 74.0 74.0 74.0 74.2 73.8 73.6 73.0 73.4 73.9 74.3 74.7 75.0
Females 2000 2001 2002 2003 2004 2005 2006 2007 2008 2009 2010 2011 2012 2013*
World 51.9 51.9 51.9 51.9 51.9 52.0 51.7 51.3 51.0 50.7 50.4 50.3 50.3 50.3
Developed Economies and European Union
51.8 51.7 51.7 51.9 52.0 52.2 52.5 52.6 52.9 53.0 53.0 52.8 52.9 52.9
East Asia 69.4 68.7 67.9 67.1 66.3 65.6 65.0 64.4 63.9 63.4 62.9 63.0 63.2 63.3
South-East Asia and the Pacific
58.5 58.9 58.5 58.5 58.5 58.6 58.5 58.7 58.9 58.9 59.0 59.1 59.2 59.2
South Asia 34.7 35.1 35.6 36.1 36.7 37.3 36.2 34.9 33.7 32.7 31.6 31.0 30.4 30.5
Middle East 16.3 16.7 17.2 17.8 18.4 19.0 18.7 18.6 17.8 17.9 18.3 18.5 18.7 18.9
Note: * 2013 are preliminary estimates. The October 2013 update version of the ILO EAPEP database (7th edition) only updates the 2012 estimates for India, and hence the base year for the projections.
Source: ILO (2014)
4
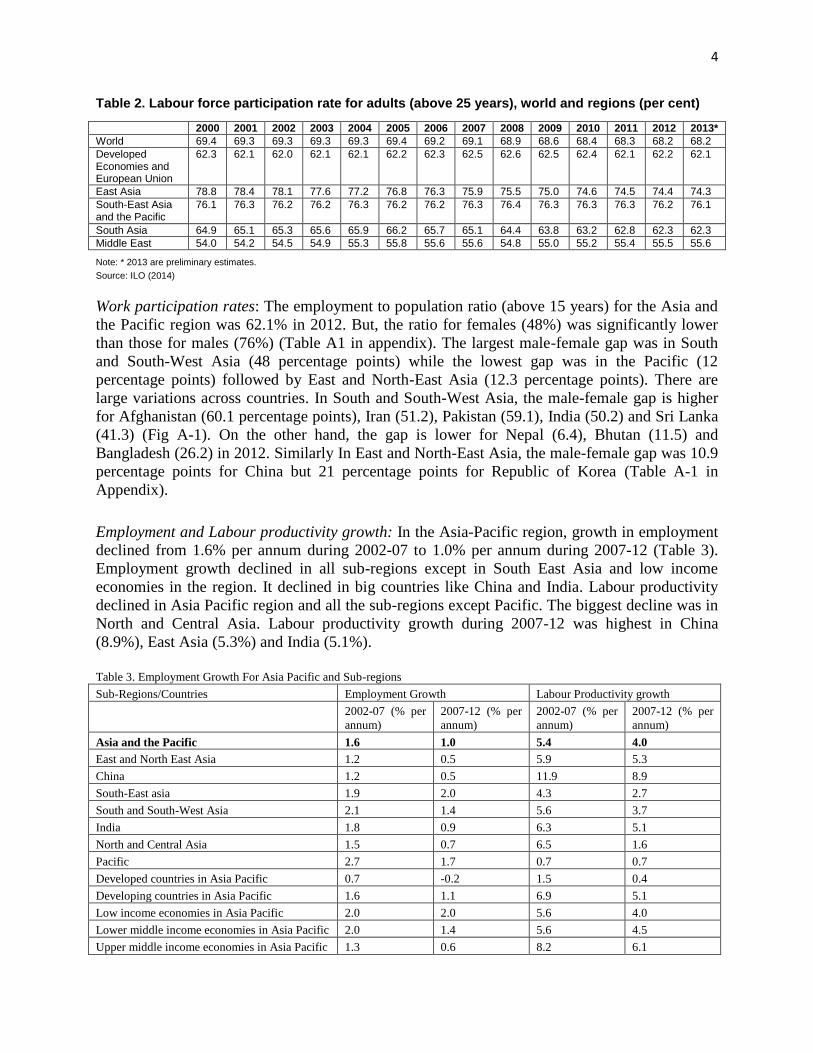
Table 2. Labour force participation rate for adults (above 25 years), world and regions (per cent)
2000 2001 2002 2003 2004 2005 2006 2007 2008 2009 2010 2011 2012 2013*
World 69.4 69.3 69.3 69.3 69.3 69.4 69.2 69.1 68.9 68.6 68.4 68.3 68.2 68.2
Developed Economies and European Union
62.3 62.1 62.0 62.1 62.1 62.2 62.3 62.5 62.6 62.5 62.4 62.1 62.2 62.1
East Asia 78.8 78.4 78.1 77.6 77.2 76.8 76.3 75.9 75.5 75.0 74.6 74.5 74.4 74.3
South-East Asia and the Pacific
76.1 76.3 76.2 76.2 76.3 76.2 76.2 76.3 76.4 76.3 76.3 76.3 76.2 76.1
South Asia 64.9 65.1 65.3 65.6 65.9 66.2 65.7 65.1 64.4 63.8 63.2 62.8 62.3 62.3
Middle East 54.0 54.2 54.5 54.9 55.3 55.8 55.6 55.6 54.8 55.0 55.2 55.4 55.5 55.6
Note: * 2013 are preliminary estimates.
Source: ILO (2014)
Work participation rates: The employment to population ratio (above 15 years) for the Asia and
the Pacific region was 62.1% in 2012. But, the ratio for females (48%) was significantly lower
than those for males (76%) (Table A1 in appendix). The largest male-female gap was in South
and South-West Asia (48 percentage points) while the lowest gap was in the Pacific (12
percentage points) followed by East and North-East Asia (12.3 percentage points). There are
large variations across countries. In South and South-West Asia, the male-female gap is higher
for Afghanistan (60.1 percentage points), Iran (51.2), Pakistan (59.1), India (50.2) and Sri Lanka
(41.3) (Fig A-1). On the other hand, the gap is lower for Nepal (6.4), Bhutan (11.5) and
Bangladesh (26.2) in 2012. Similarly In East and North-East Asia, the male-female gap was 10.9
percentage points for China but 21 percentage points for Republic of Korea (Table A-1 in
Appendix).
Employment and Labour productivity growth: In the Asia-Pacific region, growth in employment
declined from 1.6% per annum during 2002-07 to 1.0% per annum during 2007-12 (Table 3).
Employment growth declined in all sub-regions except in South East Asia and low income
economies in the region. It declined in big countries like China and India. Labour productivity
declined in Asia Pacific region and all the sub-regions except Pacific. The biggest decline was in
North and Central Asia. Labour productivity growth during 2007-12 was highest in China
(8.9%), East Asia (5.3%) and India (5.1%).
Table 3. Employment Growth For Asia Pacific and Sub-regions
Sub-Regions/Countries Employment Growth Labour Productivity growth
2002-07 (% per
annum)
2007-12 (% per
annum)
2002-07 (% per
annum)
2007-12 (% per
annum)
Asia and the Pacific 1.6 1.0 5.4 4.0
East and North East Asia 1.2 0.5 5.9 5.3
China 1.2 0.5 11.9 8.9
South-East asia 1.9 2.0 4.3 2.7
South and South-West Asia 2.1 1.4 5.6 3.7
India 1.8 0.9 6.3 5.1
North and Central Asia 1.5 0.7 6.5 1.6
Pacific 2.7 1.7 0.7 0.7
Developed countries in Asia Pacific 0.7 -0.2 1.5 0.4
Developing countries in Asia Pacific 1.6 1.1 6.9 5.1
Low income economies in Asia Pacific 2.0 2.0 5.6 4.0
Lower middle income economies in Asia Pacific 2.0 1.4 5.6 4.5
Upper middle income economies in Asia Pacific 1.3 0.6 8.2 6.1
5
High income economies in Asia Pacific 0.8 0.1 2.0 0.9
Source: ESCAP (2013)
Output and Employment Growth
The growth of output was more than 5% for many countries while employment growth was less
between 2 to 3% for many countries during 1999-2007. During the 2008-11 period, the
employment elasticity seems to have declined for some countries while it increased for some
countries.
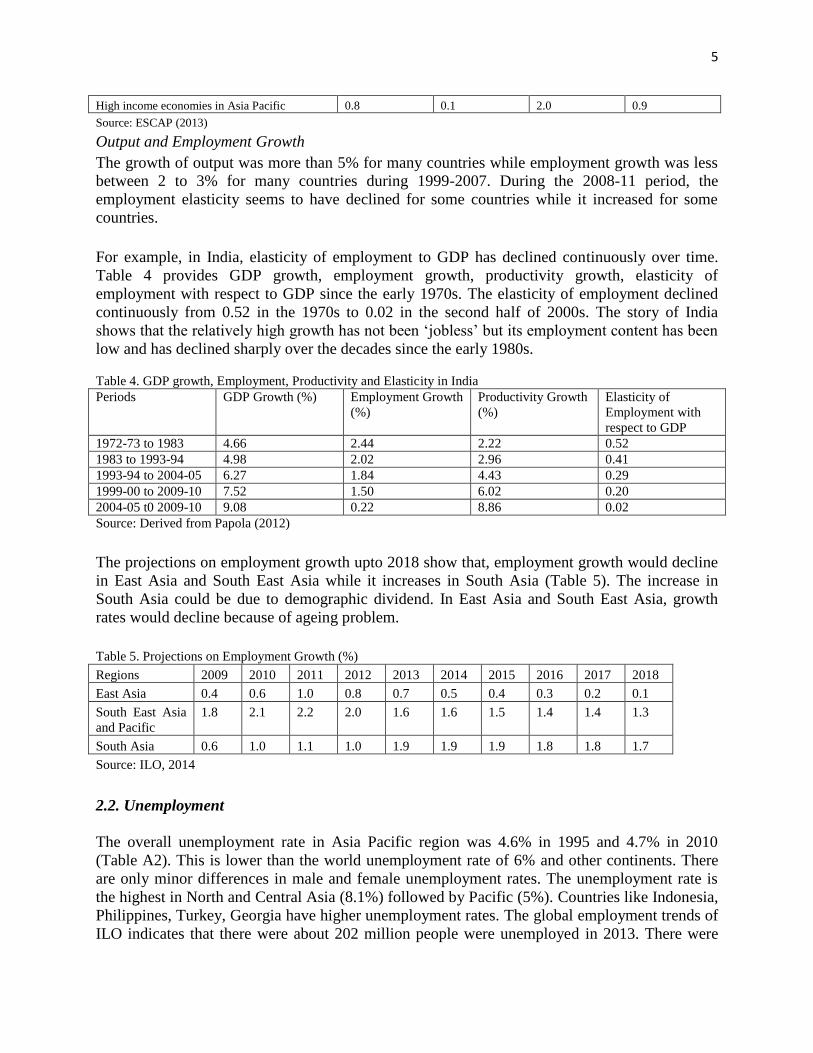
For example, in India, elasticity of employment to GDP has declined continuously over time.
Table 4 provides GDP growth, employment growth, productivity growth, elasticity of
employment with respect to GDP since the early 1970s. The elasticity of employment declined
continuously from 0.52 in the 1970s to 0.02 in the second half of 2000s. The story of India
shows that the relatively high growth has not been ‘jobless’ but its employment content has been
low and has declined sharply over the decades since the early 1980s.
Table 4. GDP growth, Employment, Productivity and Elasticity in India
Periods GDP Growth (%) Employment Growth
(%)
Productivity Growth
(%)
Elasticity of
Employment with
respect to GDP
1972-73 to 1983 4.66 2.44 2.22 0.52
1983 to 1993-94 4.98 2.02 2.96 0.41
1993-94 to 2004-05 6.27 1.84 4.43 0.29
1999-00 to 2009-10 7.52 1.50 6.02 0.20
2004-05 t0 2009-10 9.08 0.22 8.86 0.02
Source: Derived from Papola (2012)
The projections on employment growth upto 2018 show that, employment growth would decline
in East Asia and South East Asia while it increases in South Asia (Table 5). The increase in
South Asia could be due to demographic dividend. In East Asia and South East Asia, growth
rates would decline because of ageing problem.
Table 5. Projections on Employment Growth (%)
Regions 2009 2010 2011 2012 2013 2014 2015 2016 2017 2018
East Asia 0.4 0.6 1.0 0.8 0.7 0.5 0.4 0.3 0.2 0.1
South East Asia
and Pacific
1.8 2.1 2.2 2.0 1.6 1.6 1.5 1.4 1.4 1.3
South Asia 0.6 1.0 1.1 1.0 1.9 1.9 1.9 1.8 1.8 1.7
Source: ILO, 2014
2.2. Unemployment
The overall unemployment rate in Asia Pacific region was 4.6% in 1995 and 4.7% in 2010
(Table A2). This is lower than the world unemployment rate of 6% and other continents. There
are only minor differences in male and female unemployment rates. The unemployment rate is
the highest in North and Central Asia (8.1%) followed by Pacific (5%). Countries like Indonesia,
Philippines, Turkey, Georgia have higher unemployment rates. The global employment trends of
ILO indicates that there were about 202 million people were unemployed in 2013. There were
6
about 5 million more than previous year. In other words, employment growth is not matching
with labour force growth. According to this report, the bulk of the increase in global
unemployment is in the East Asia and South Asia regions. They together represent more than 45
per cent of additional jobseekers.
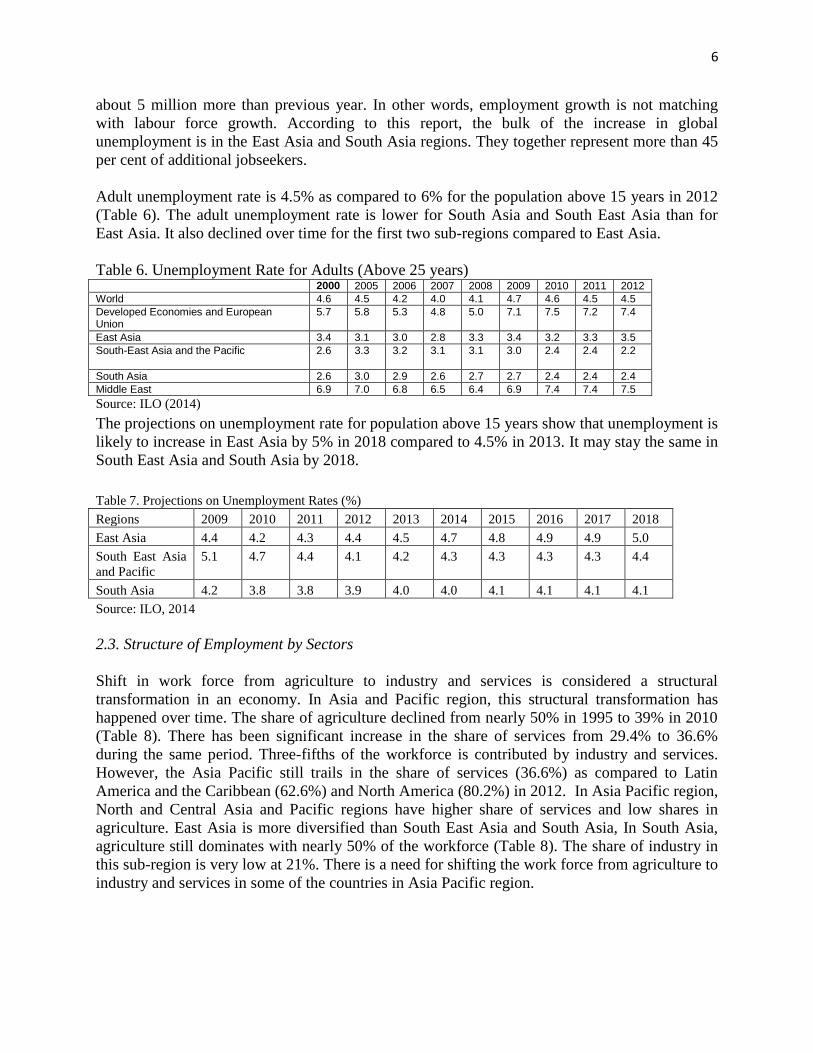
Adult unemployment rate is 4.5% as compared to 6% for the population above 15 years in 2012
(Table 6). The adult unemployment rate is lower for South Asia and South East Asia than for
East Asia. It also declined over time for the first two sub-regions compared to East Asia.
Table 6. Unemployment Rate for Adults (Above 25 years) 2000 2005 2006 2007 2008 2009 2010 2011 2012
World 4.6 4.5 4.2 4.0 4.1 4.7 4.6 4.5 4.5
Developed Economies and European Union
5.7 5.8 5.3 4.8 5.0 7.1 7.5 7.2 7.4
East Asia 3.4 3.1 3.0 2.8 3.3 3.4 3.2 3.3 3.5
South-East Asia and the Pacific 2.6 3.3 3.2 3.1 3.1 3.0 2.4 2.4 2.2
South Asia 2.6 3.0 2.9 2.6 2.7 2.7 2.4 2.4 2.4
Middle East 6.9 7.0 6.8 6.5 6.4 6.9 7.4 7.4 7.5
Source: ILO (2014)
The projections on unemployment rate for population above 15 years show that unemployment is
likely to increase in East Asia by 5% in 2018 compared to 4.5% in 2013. It may stay the same in
South East Asia and South Asia by 2018.
Table 7. Projections on Unemployment Rates (%)
Regions 2009 2010 2011 2012 2013 2014 2015 2016 2017 2018
East Asia 4.4 4.2 4.3 4.4 4.5 4.7 4.8 4.9 4.9 5.0
South East Asia
and Pacific
5.1 4.7 4.4 4.1 4.2 4.3 4.3 4.3 4.3 4.4
South Asia 4.2 3.8 3.8 3.9 4.0 4.0 4.1 4.1 4.1 4.1
Source: ILO, 2014
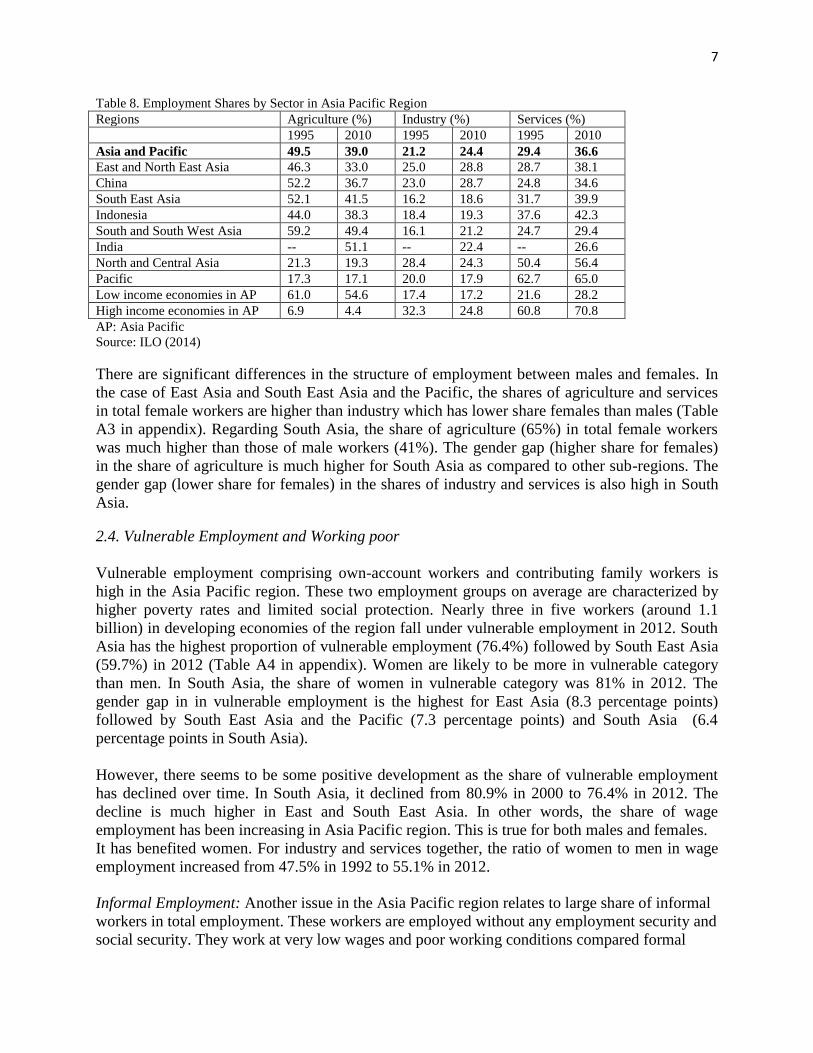
2.3. Structure of Employment by Sectors
Shift in work force from agriculture to industry and services is considered a structural
transformation in an economy. In Asia and Pacific region, this structural transformation has
happened over time. The share of agriculture declined from nearly 50% in 1995 to 39% in 2010
(Table 8). There has been significant increase in the share of services from 29.4% to 36.6%
during the same period. Three-fifths of the workforce is contributed by industry and services.
However, the Asia Pacific still trails in the share of services (36.6%) as compared to Latin
America and the Caribbean (62.6%) and North America (80.2%) in 2012. In Asia Pacific region,
North and Central Asia and Pacific regions have higher share of services and low shares in
agriculture. East Asia is more diversified than South East Asia and South Asia, In South Asia,
agriculture still dominates with nearly 50% of the workforce (Table 8). The share of industry in
this sub-region is very low at 21%. There is a need for shifting the work force from agriculture to
industry and services in some of the countries in Asia Pacific region.
7
Table 8. Employment Shares by Sector in Asia Pacific Region
Regions Agriculture (%) Industry (%) Services (%)
1995 2010 1995 2010 1995 2010
Asia and Pacific 49.5 39.0 21.2 24.4 29.4 36.6
East and North East Asia 46.3 33.0 25.0 28.8 28.7 38.1
China 52.2 36.7 23.0 28.7 24.8 34.6
South East Asia 52.1 41.5 16.2 18.6 31.7 39.9
Indonesia 44.0 38.3 18.4 19.3 37.6 42.3
South and South West Asia 59.2 49.4 16.1 21.2 24.7 29.4
India -- 51.1 -- 22.4 -- 26.6
North and Central Asia 21.3 19.3 28.4 24.3 50.4 56.4
Pacific 17.3 17.1 20.0 17.9 62.7 65.0
Low income economies in AP 61.0 54.6 17.4 17.2 21.6 28.2
High income economies in AP 6.9 4.4 32.3 24.8 60.8 70.8
AP: Asia Pacific
Source: ILO (2014)
There are significant differences in the structure of employment between males and females. In
the case of East Asia and South East Asia and the Pacific, the shares of agriculture and services
in total female workers are higher than industry which has lower share females than males (Table
A3 in appendix). Regarding South Asia, the share of agriculture (65%) in total female workers
was much higher than those of male workers (41%). The gender gap (higher share for females)
in the share of agriculture is much higher for South Asia as compared to other sub-regions. The
gender gap (lower share for females) in the shares of industry and services is also high in South
Asia.
2.4. Vulnerable Employment and Working poor
Vulnerable employment comprising own-account workers and contributing family workers is
high in the Asia Pacific region. These two employment groups on average are characterized by
higher poverty rates and limited social protection. Nearly three in five workers (around 1.1
billion) in developing economies of the region fall under vulnerable employment in 2012. South
Asia has the highest proportion of vulnerable employment (76.4%) followed by South East Asia
(59.7%) in 2012 (Table A4 in appendix). Women are likely to be more in vulnerable category
than men. In South Asia, the share of women in vulnerable category was 81% in 2012. The
gender gap in in vulnerable employment is the highest for East Asia (8.3 percentage points)
followed by South East Asia and the Pacific (7.3 percentage points) and South Asia (6.4
percentage points in South Asia).
However, there seems to be some positive development as the share of vulnerable employment
has declined over time. In South Asia, it declined from 80.9% in 2000 to 76.4% in 2012. The
decline is much higher in East and South East Asia. In other words, the share of wage
employment has been increasing in Asia Pacific region. This is true for both males and females.
It has benefited women. For industry and services together, the ratio of women to men in wage
employment increased from 47.5% in 1992 to 55.1% in 2012.
Informal Employment: Another issue in the Asia Pacific region relates to large share of informal
workers in total employment. These workers are employed without any employment security and
social security. They work at very low wages and poor working conditions compared formal
8
sector workers. The numbers ON informal employment shares for selected countries in Asia
show that the share varies from 30% to 70%.
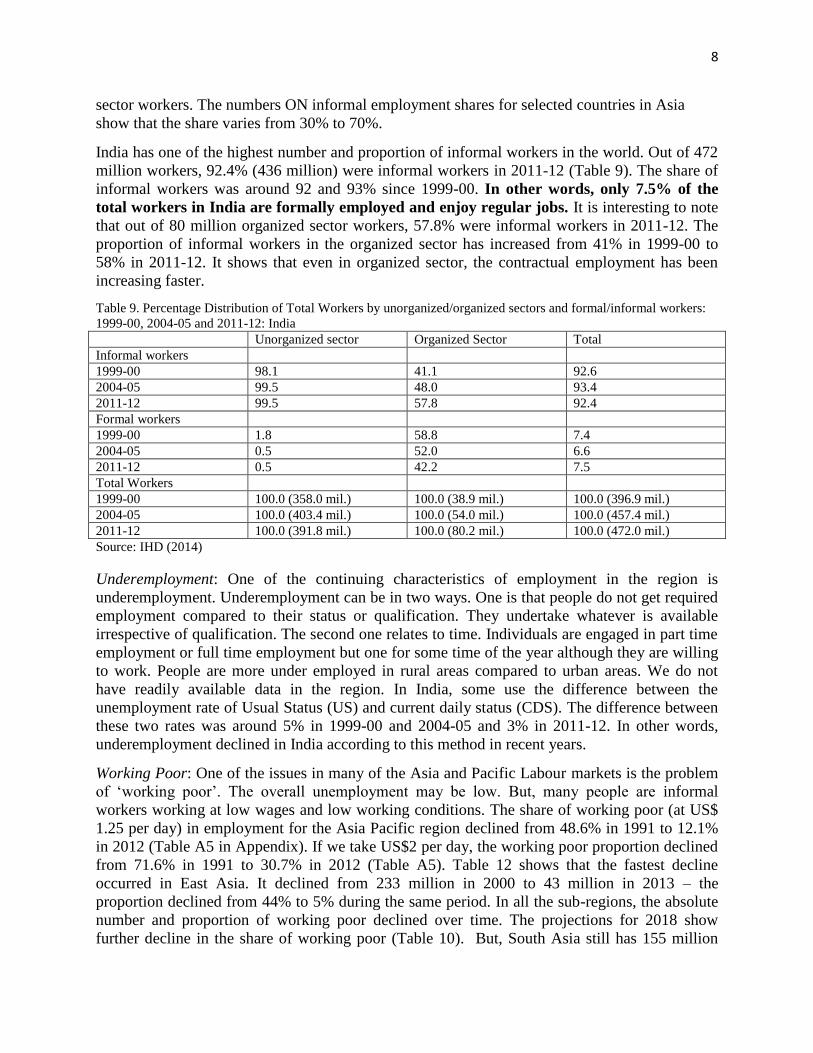
India has one of the highest number and proportion of informal workers in the world. Out of 472
million workers, 92.4% (436 million) were informal workers in 2011-12 (Table 9). The share of
informal workers was around 92 and 93% since 1999-00. In other words, only 7.5% of the
total workers in India are formally employed and enjoy regular jobs. It is interesting to note
that out of 80 million organized sector workers, 57.8% were informal workers in 2011-12. The
proportion of informal workers in the organized sector has increased from 41% in 1999-00 to
58% in 2011-12. It shows that even in organized sector, the contractual employment has been
increasing faster.
Table 9. Percentage Distribution of Total Workers by unorganized/organized sectors and formal/informal workers:
1999-00, 2004-05 and 2011-12: India
Unorganized sector Organized Sector Total
Informal workers
1999-00 98.1 41.1 92.6
2004-05 99.5 48.0 93.4
2011-12 99.5 57.8 92.4
Formal workers
1999-00 1.8 58.8 7.4
2004-05 0.5 52.0 6.6
2011-12 0.5 42.2 7.5
Total Workers
1999-00 100.0 (358.0 mil.) 100.0 (38.9 mil.) 100.0 (396.9 mil.)
2004-05 100.0 (403.4 mil.) 100.0 (54.0 mil.) 100.0 (457.4 mil.)
2011-12 100.0 (391.8 mil.) 100.0 (80.2 mil.) 100.0 (472.0 mil.)
Source: IHD (2014)
Underemployment: One of the continuing characteristics of employment in the region is
underemployment. Underemployment can be in two ways. One is that people do not get required
employment compared to their status or qualification. They undertake whatever is available
irrespective of qualification. The second one relates to time. Individuals are engaged in part time
employment or full time employment but one for some time of the year although they are willing
to work. People are more under employed in rural areas compared to urban areas. We do not
have readily available data in the region. In India, some use the difference between the
unemployment rate of Usual Status (US) and current daily status (CDS). The difference between
these two rates was around 5% in 1999-00 and 2004-05 and 3% in 2011-12. In other words,
underemployment declined in India according to this method in recent years.
Working Poor: One of the issues in many of the Asia and Pacific Labour markets is the problem
of ‘working poor’. The overall unemployment may be low. But, many people are informal
workers working at low wages and low working conditions. The share of working poor (at US$
1.25 per day) in employment for the Asia Pacific region declined from 48.6% in 1991 to 12.1%
in 2012 (Table A5 in Appendix). If we take US$2 per day, the working poor proportion declined
from 71.6% in 1991 to 30.7% in 2012 (Table A5). Table 12 shows that the fastest decline
occurred in East Asia. It declined from 233 million in 2000 to 43 million in 2013 – the
proportion declined from 44% to 5% during the same period. In all the sub-regions, the absolute
number and proportion of working poor declined over time. The projections for 2018 show
further decline in the share of working poor (Table 10). But, South Asia still has 155 million
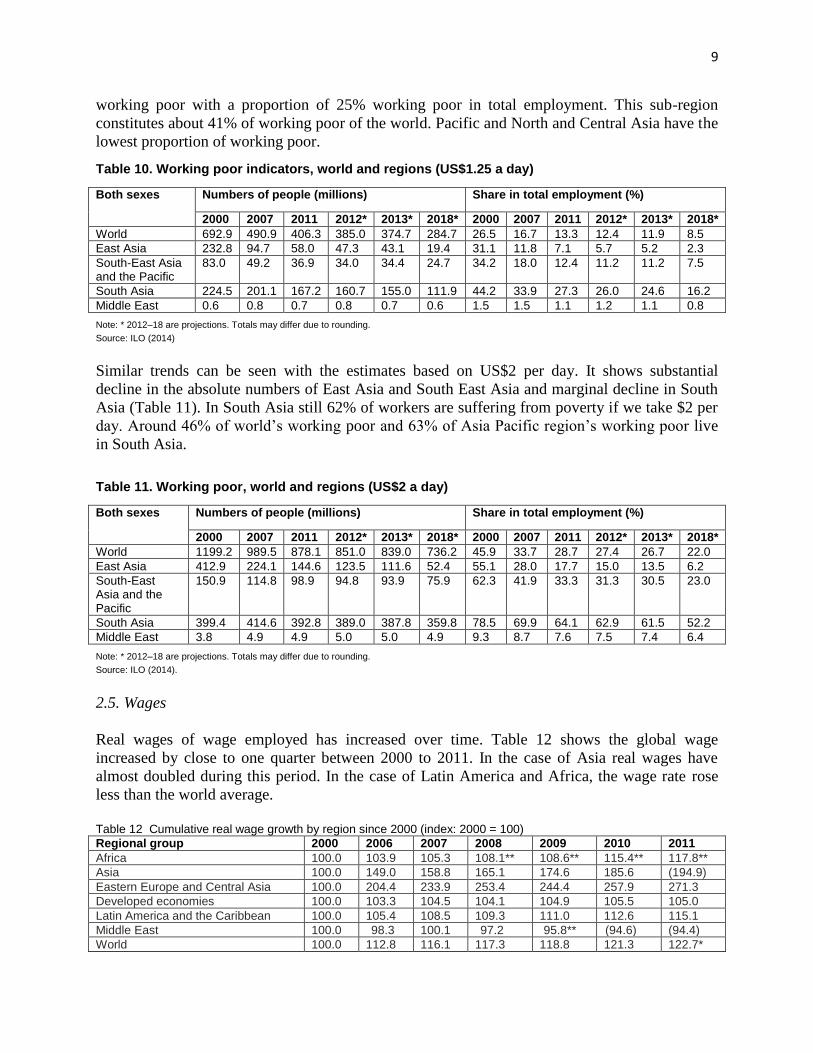
9
working poor with a proportion of 25% working poor in total employment. This sub-region
constitutes about 41% of working poor of the world. Pacific and North and Central Asia have the
lowest proportion of working poor.
Table 10. Working poor indicators, world and regions (US$1.25 a day)
Both sexes
Numbers of people (millions) Share in total employment (%)
2000 2007 2011 2012* 2013* 2018* 2000 2007 2011 2012* 2013* 2018*
World 692.9 490.9 406.3 385.0 374.7 284.7 26.5 16.7 13.3 12.4 11.9 8.5
East Asia 232.8 94.7 58.0 47.3 43.1 19.4 31.1 11.8 7.1 5.7 5.2 2.3
South-East Asia and the Pacific
83.0 49.2 36.9 34.0 34.4 24.7 34.2 18.0 12.4 11.2 11.2 7.5
South Asia 224.5 201.1 167.2 160.7 155.0 111.9 44.2 33.9 27.3 26.0 24.6 16.2
Middle East 0.6 0.8 0.7 0.8 0.7 0.6 1.5 1.5 1.1 1.2 1.1 0.8
Note: * 2012–18 are projections. Totals may differ due to rounding.
Source: ILO (2014)
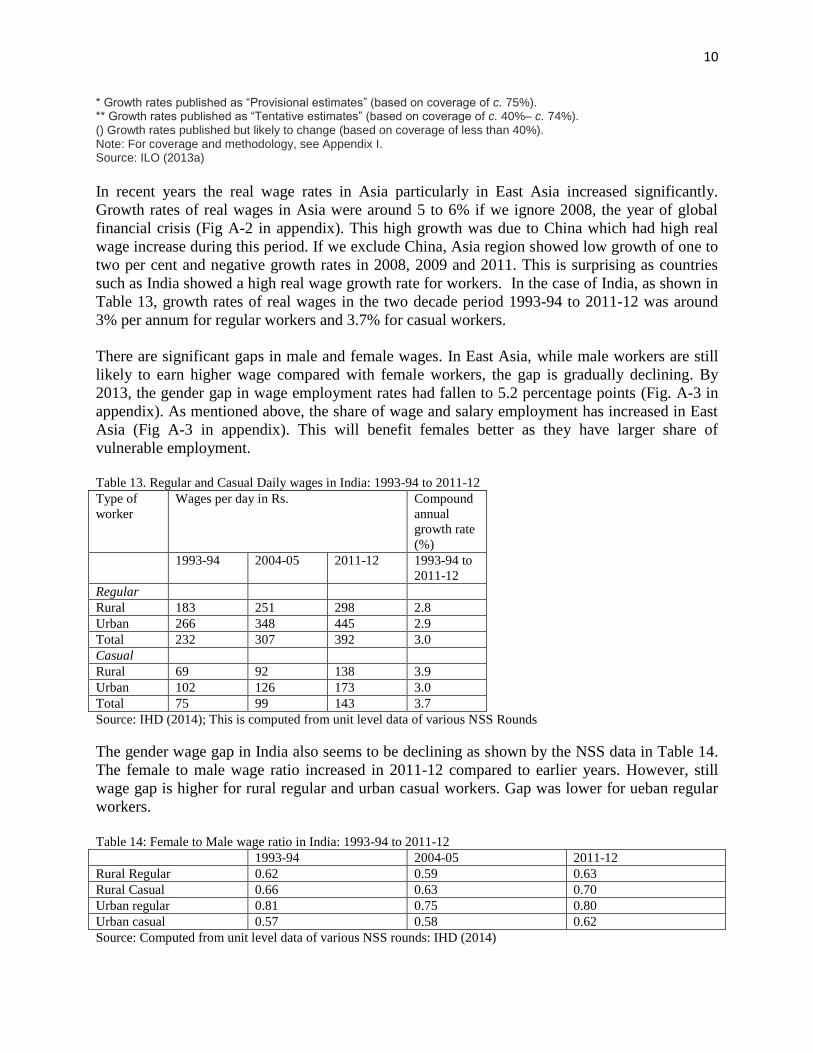
Similar trends can be seen with the estimates based on US$2 per day. It shows substantial
decline in the absolute numbers of East Asia and South East Asia and marginal decline in South
Asia (Table 11). In South Asia still 62% of workers are suffering from poverty if we take $2 per
day. Around 46% of world’s working poor and 63% of Asia Pacific region’s working poor live
in South Asia.
Table 11. Working poor, world and regions (US$2 a day)
Both sexes
Numbers of people (millions) Share in total employment (%)
2000 2007 2011 2012* 2013* 2018* 2000 2007 2011 2012* 2013* 2018*
World 1199.2 989.5 878.1 851.0 839.0 736.2 45.9 33.7 28.7 27.4 26.7 22.0
East Asia 412.9 224.1 144.6 123.5 111.6 52.4 55.1 28.0 17.7 15.0 13.5 6.2
South-East Asia and the Pacific
150.9 114.8 98.9 94.8 93.9 75.9 62.3 41.9 33.3 31.3 30.5 23.0
South Asia 399.4 414.6 392.8 389.0 387.8 359.8 78.5 69.9 64.1 62.9 61.5 52.2
Middle East 3.8 4.9 4.9 5.0 5.0 4.9 9.3 8.7 7.6 7.5 7.4 6.4
Note: * 2012–18 are projections. Totals may differ due to rounding.
Source: ILO (2014).
2.5. Wages
Real wages of wage employed has increased over time. Table 12 shows the global wage
increased by close to one quarter between 2000 to 2011. In the case of Asia real wages have
almost doubled during this period. In the case of Latin America and Africa, the wage rate rose
less than the world average.
Table 12 Cumulative real wage growth by region since 2000 (index: 2000 = 100)
Regional group 2000 2006 2007 2008 2009 2010 2011
Africa 100.0 103.9 105.3 108.1** 108.6** 115.4** 117.8**
Asia 100.0 149.0 158.8 165.1 174.6 185.6 (194.9)
Eastern Europe and Central Asia 100.0 204.4 233.9 253.4 244.4 257.9 271.3
Developed economies 100.0 103.3 104.5 104.1 104.9 105.5 105.0
Latin America and the Caribbean 100.0 105.4 108.5 109.3 111.0 112.6 115.1
Middle East 100.0 98.3 100.1 97.2 95.8** (94.6) (94.4)
World 100.0 112.8 116.1 117.3 118.8 121.3 122.7*
10
* Growth rates published as “Provisional estimates” (based on coverage of c. 75%). ** Growth rates published as “Tentative estimates” (based on coverage of c. 40%– c. 74%). () Growth rates published but likely to change (based on coverage of less than 40%). Note: For coverage and methodology, see Appendix I. Source: ILO (2013a)
In recent years the real wage rates in Asia particularly in East Asia increased significantly.
Growth rates of real wages in Asia were around 5 to 6% if we ignore 2008, the year of global
financial crisis (Fig A-2 in appendix). This high growth was due to China which had high real
wage increase during this period. If we exclude China, Asia region showed low growth of one to
two per cent and negative growth rates in 2008, 2009 and 2011. This is surprising as countries
such as India showed a high real wage growth rate for workers. In the case of India, as shown in
Table 13, growth rates of real wages in the two decade period 1993-94 to 2011-12 was around
3% per annum for regular workers and 3.7% for casual workers.
There are significant gaps in male and female wages. In East Asia, while male workers are still
likely to earn higher wage compared with female workers, the gap is gradually declining. By
2013, the gender gap in wage employment rates had fallen to 5.2 percentage points (Fig. A-3 in
appendix). As mentioned above, the share of wage and salary employment has increased in East
Asia (Fig A-3 in appendix). This will benefit females better as they have larger share of
vulnerable employment. Table 13. Regular and Casual Daily wages in India: 1993-94 to 2011-12
Type of
worker
Wages per day in Rs. Compound
annual
growth rate
(%)
1993-94 2004-05 2011-12 1993-94 to
2011-12
Regular
Rural 183 251 298 2.8
Urban 266 348 445 2.9
Total 232 307 392 3.0
Casual
Rural 69 92 138 3.9
Urban 102 126 173 3.0
Total 75 99 143 3.7
Source: IHD (2014); This is computed from unit level data of various NSS Rounds
The gender wage gap in India also seems to be declining as shown by the NSS data in Table 14.
The female to male wage ratio increased in 2011-12 compared to earlier years. However, still
wage gap is higher for rural regular and urban casual workers. Gap was lower for ueban regular
workers.
Table 14: Female to Male wage ratio in India: 1993-94 to 2011-12
1993-94 2004-05 2011-12
Rural Regular 0.62 0.59 0.63
Rural Casual 0.66 0.63 0.70
Urban regular 0.81 0.75 0.80
Urban casual 0.57 0.58 0.62
Source: Computed from unit level data of various NSS rounds: IHD (2014)
11
It may be noted that the differences may not indicate differentials within similar jobs,
occupations and activities in India. It is possible that women may be working in low paid jobs.
However, significant differences are are found within the same type of activity as well. Across
activities in agriculture, manufacturing and services show the ratio varies from 0.51 to 0.66 for
casual workers while it varies from 0.29 in agriculture to 0.79 in services (community, social,
personal) for regular workers (IHD, 2014).
One of the issues on wages is the trends in labour income share in value added. In many of the
emerging economies, the share of labour income declined (ILO 2013a). For example, in China
wages tripled in the last decade. But, GDP grew faster than wage bill in China and labour income
share decline drastically particularly since 2003 .
A look at the wages and productivity show that in general growth rates have been positive and
substantial both before and after the global crisis. But some countries like Thailand and India
showed low growth of wages. As mentioned earlier, the NSS (National Sample Survey) data
shows that India's growth rates in wages were in the range of 3 per cent per annum. In fact,
growth rates of wages for agricultural labourers were in the range of 6 per cent per annum.
Labour productivity growth was also high in India. As shown in Table 4 above, productivity
growth in India was 6% per annum was 6% during 1999-2000 to 2009-10 and 8.9% during 2004-
05 to 2009-10.
3. YOUTH LABOUR MARKET: CHALLENGES AND OPPORTUNITIES
This section presents trends in youth employment and unemployment in the Asia-Pacific region.
The definition and age grouping of the youth may vary in different socio-cultural contexts across
countries. The sociological viewpoint might wish to define ‘youth’ as the transition stage from
childhood to adulthood. But the age at which this transition begins will vary greatly between
societies and indeed within the same society. However, differences continue to exist in the way
national statistics programmes in different countries define and measure youth. Some countries
defines youth upto 29 years or 35 years. The United Nations (UN) and the International Labour
Organisation (ILO), however, defined the youth as persons between 15 and 24 years of age for
cross-country comparison and analysis. In the present paper, the youth definition of UN and ILO
will be followed. We also compare youth employment/unemployment rates with those of adults
in the region.
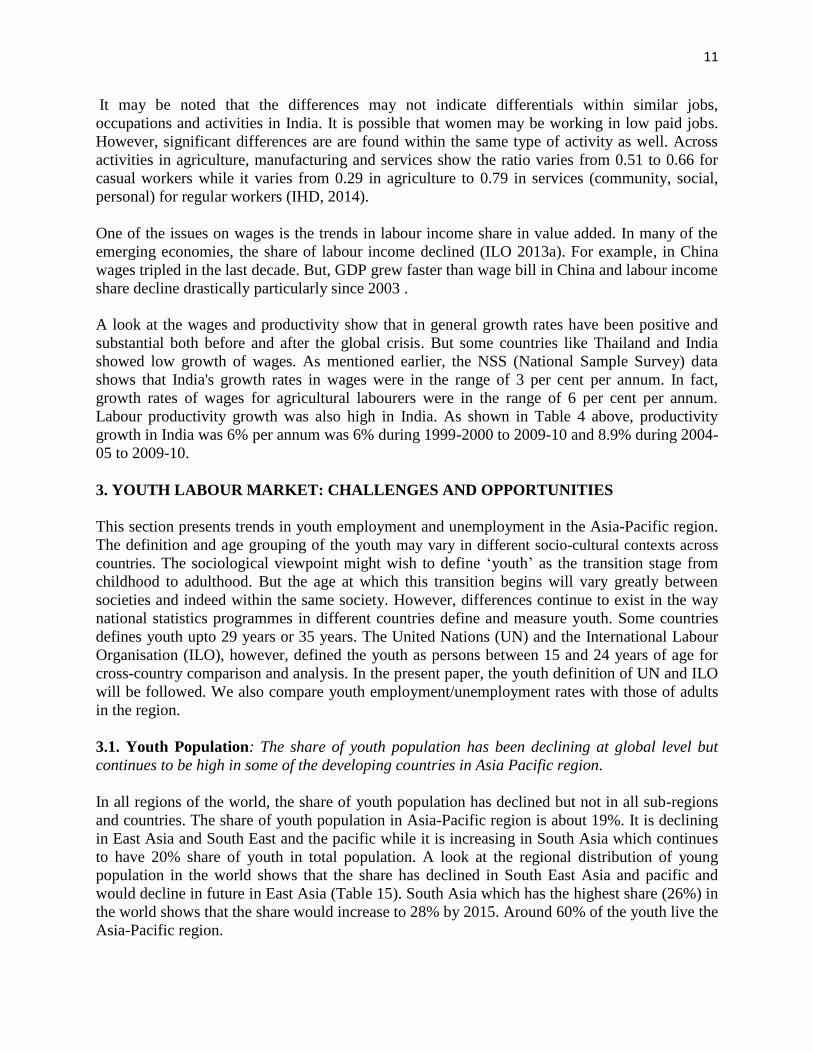
3.1. Youth Population: The share of youth population has been declining at global level but
continues to be high in some of the developing countries in Asia Pacific region.
In all regions of the world, the share of youth population has declined but not in all sub-regions
and countries. The share of youth population in Asia-Pacific region is about 19%. It is declining
in East Asia and South East and the pacific while it is increasing in South Asia which continues
to have 20% share of youth in total population. A look at the regional distribution of young
population in the world shows that the share has declined in South East Asia and pacific and
would decline in future in East Asia (Table 15). South Asia which has the highest share (26%) in
the world shows that the share would increase to 28% by 2015. Around 60% of the youth live the
Asia-Pacific region.
12
Table 15. Regional Distribution of Youth Population
Source: United Nations, World Population Prospects; ILO (2010)
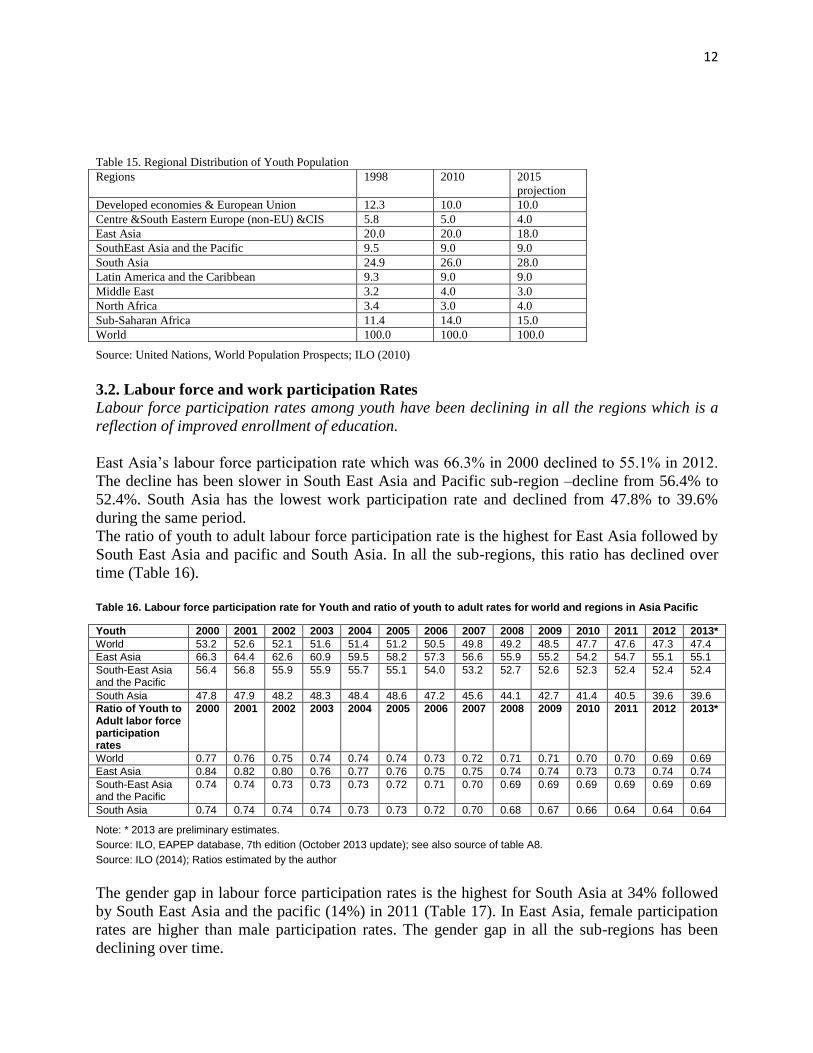
3.2. Labour force and work participation Rates
Labour force participation rates among youth have been declining in all the regions which is a
reflection of improved enrollment of education.
East Asia’s labour force participation rate which was 66.3% in 2000 declined to 55.1% in 2012.
The decline has been slower in South East Asia and Pacific sub-region –decline from 56.4% to
52.4%. South Asia has the lowest work participation rate and declined from 47.8% to 39.6%
during the same period.
The ratio of youth to adult labour force participation rate is the highest for East Asia followed by
South East Asia and pacific and South Asia. In all the sub-regions, this ratio has declined over
time (Table 16).
Table 16. Labour force participation rate for Youth and ratio of youth to adult rates for world and regions in Asia Pacific
Youth 2000 2001 2002 2003 2004 2005 2006 2007 2008 2009 2010 2011 2012 2013*
World 53.2 52.6 52.1 51.6 51.4 51.2 50.5 49.8 49.2 48.5 47.7 47.6 47.3 47.4
East Asia 66.3 64.4 62.6 60.9 59.5 58.2 57.3 56.6 55.9 55.2 54.2 54.7 55.1 55.1
South-East Asia and the Pacific
56.4 56.8 55.9 55.9 55.7 55.1 54.0 53.2 52.7 52.6 52.3 52.4 52.4 52.4
South Asia 47.8 47.9 48.2 48.3 48.4 48.6 47.2 45.6 44.1 42.7 41.4 40.5 39.6 39.6
Ratio of Youth to Adult labor force participation rates
2000 2001 2002 2003 2004 2005 2006 2007 2008 2009 2010 2011 2012 2013*
World 0.77 0.76 0.75 0.74 0.74 0.74 0.73 0.72 0.71 0.71 0.70 0.70 0.69 0.69
East Asia 0.84 0.82 0.80 0.76 0.77 0.76 0.75 0.75 0.74 0.74 0.73 0.73 0.74 0.74
South-East Asia and the Pacific
0.74 0.74 0.73 0.73 0.73 0.72 0.71 0.70 0.69 0.69 0.69 0.69 0.69 0.69
South Asia 0.74 0.74 0.74 0.74 0.73 0.73 0.72 0.70 0.68 0.67 0.66 0.64 0.64 0.64
Note: * 2013 are preliminary estimates.
Source: ILO, EAPEP database, 7th edition (October 2013 update); see also source of table A8.
Source: ILO (2014); Ratios estimated by the author
The gender gap in labour force participation rates is the highest for South Asia at 34% followed
by South East Asia and the pacific (14%) in 2011 (Table 17). In East Asia, female participation
rates are higher than male participation rates. The gender gap in all the sub-regions has been
declining over time.
Regions 1998 2010 2015
projection
Developed economies & European Union 12.3 10.0 10.0
Centre &South Eastern Europe (non-EU) &CIS 5.8 5.0 4.0
East Asia 20.0 20.0 18.0
SouthEast Asia and the Pacific 9.5 9.0 9.0
South Asia 24.9 26.0 28.0
Latin America and the Caribbean 9.3 9.0 9.0
Middle East 3.2 4.0 3.0
North Africa 3.4 3.0 4.0
Sub-Saharan Africa 11.4 14.0 15.0
World 100.0 100.0 100.0
13
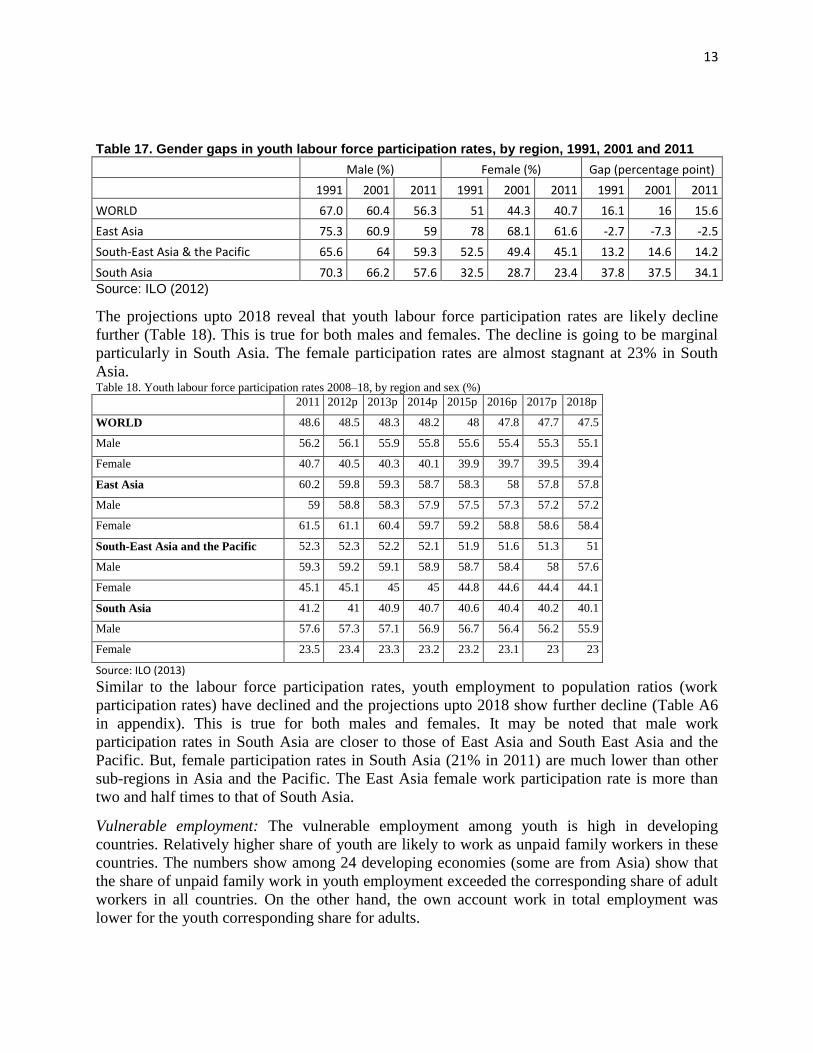
Table 17. Gender gaps in youth labour force participation rates, by region, 1991, 2001 and 2011
Male (%) Female (%) Gap (percentage point)
1991 2001 2011 1991 2001 2011 1991 2001 2011
WORLD 67.0 60.4 56.3 51 44.3 40.7 16.1 16 15.6
East Asia 75.3 60.9 59 78 68.1 61.6 -2.7 -7.3 -2.5
South-East Asia & the Pacific 65.6 64 59.3 52.5 49.4 45.1 13.2 14.6 14.2
South Asia 70.3 66.2 57.6 32.5 28.7 23.4 37.8 37.5 34.1 Source: ILO (2012)
The projections upto 2018 reveal that youth labour force participation rates are likely decline
further (Table 18). This is true for both males and females. The decline is going to be marginal
particularly in South Asia. The female participation rates are almost stagnant at 23% in South
Asia. Table 18. Youth labour force participation rates 2008–18, by region and sex (%)
2011 2012p 2013p 2014p 2015p 2016p 2017p 2018p
WORLD 48.6 48.5 48.3 48.2 48 47.8 47.7 47.5
Male 56.2 56.1 55.9 55.8 55.6 55.4 55.3 55.1
Female 40.7 40.5 40.3 40.1 39.9 39.7 39.5 39.4
East Asia 60.2 59.8 59.3 58.7 58.3 58 57.8 57.8
Male 59 58.8 58.3 57.9 57.5 57.3 57.2 57.2
Female 61.5 61.1 60.4 59.7 59.2 58.8 58.6 58.4
South-East Asia and the Pacific 52.3 52.3 52.2 52.1 51.9 51.6 51.3 51
Male 59.3 59.2 59.1 58.9 58.7 58.4 58 57.6
Female 45.1 45.1 45 45 44.8 44.6 44.4 44.1
South Asia 41.2 41 40.9 40.7 40.6 40.4 40.2 40.1
Male 57.6 57.3 57.1 56.9 56.7 56.4 56.2 55.9
Female 23.5 23.4 23.3 23.2 23.2 23.1 23 23
Source: ILO (2013)
Similar to the labour force participation rates, youth employment to population ratios (work
participation rates) have declined and the projections upto 2018 show further decline (Table A6
in appendix). This is true for both males and females. It may be noted that male work
participation rates in South Asia are closer to those of East Asia and South East Asia and the
Pacific. But, female participation rates in South Asia (21% in 2011) are much lower than other
sub-regions in Asia and the Pacific. The East Asia female work participation rate is more than
two and half times to that of South Asia.
Vulnerable employment: The vulnerable employment among youth is high in developing
countries. Relatively higher share of youth are likely to work as unpaid family workers in these
countries. The numbers show among 24 developing economies (some are from Asia) show that
the share of unpaid family work in youth employment exceeded the corresponding share of adult
workers in all countries. On the other hand, the own account work in total employment was
lower for the youth corresponding share for adults.
14
Part Time Employment
Since global financial crisis, part time employment among youth increased in some countries
particularly in South East Asia and the Pacific. For example, in Philippines, the share of youth
working part time (less than 30 hours per week) rose from 26.6% in 2008 to 32% in 2009. In
Indonesia, 31.5% of the employed youth were working part time in 31.5%. These workers are
involved in voluntary and involuntary part time employment in Inomesia. The voluntary part
time for young women (17.1%) was higher than that for men ((13.3%) while involuntary part
was higher for men (18.3%) compared with young women (14.3%).
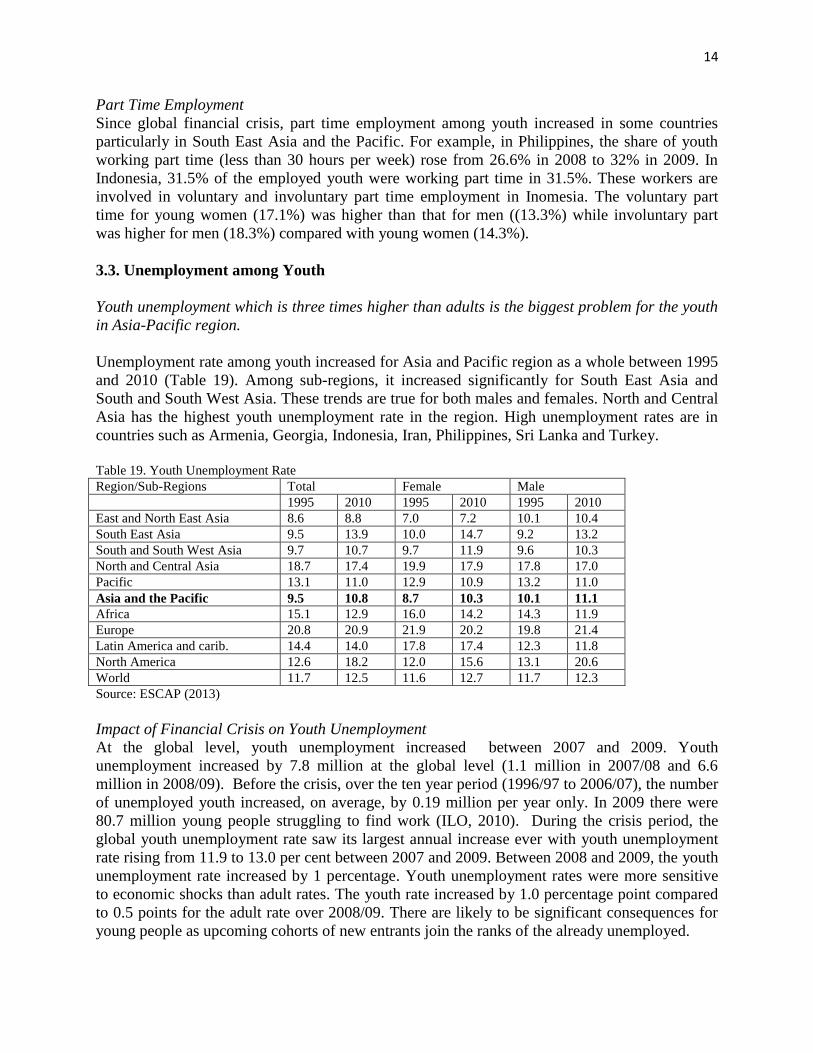
3.3. Unemployment among Youth
Youth unemployment which is three times higher than adults is the biggest problem for the youth
in Asia-Pacific region.
Unemployment rate among youth increased for Asia and Pacific region as a whole between 1995
and 2010 (Table 19). Among sub-regions, it increased significantly for South East Asia and
South and South West Asia. These trends are true for both males and females. North and Central
Asia has the highest youth unemployment rate in the region. High unemployment rates are in
countries such as Armenia, Georgia, Indonesia, Iran, Philippines, Sri Lanka and Turkey.
Table 19. Youth Unemployment Rate
Region/Sub-Regions Total Female Male
1995 2010 1995 2010 1995 2010
East and North East Asia 8.6 8.8 7.0 7.2 10.1 10.4
South East Asia 9.5 13.9 10.0 14.7 9.2 13.2
South and South West Asia 9.7 10.7 9.7 11.9 9.6 10.3
North and Central Asia 18.7 17.4 19.9 17.9 17.8 17.0
Pacific 13.1 11.0 12.9 10.9 13.2 11.0
Asia and the Pacific 9.5 10.8 8.7 10.3 10.1 11.1
Africa 15.1 12.9 16.0 14.2 14.3 11.9
Europe 20.8 20.9 21.9 20.2 19.8 21.4
Latin America and carib. 14.4 14.0 17.8 17.4 12.3 11.8
North America 12.6 18.2 12.0 15.6 13.1 20.6
World 11.7 12.5 11.6 12.7 11.7 12.3
Source: ESCAP (2013)
Impact of Financial Crisis on Youth Unemployment
At the global level, youth unemployment increased between 2007 and 2009. Youth
unemployment increased by 7.8 million at the global level (1.1 million in 2007/08 and 6.6
million in 2008/09). Before the crisis, over the ten year period (1996/97 to 2006/07), the number
of unemployed youth increased, on average, by 0.19 million per year only. In 2009 there were
80.7 million young people struggling to find work (ILO, 2010). During the crisis period, the
global youth unemployment rate saw its largest annual increase ever with youth unemployment
rate rising from 11.9 to 13.0 per cent between 2007 and 2009. Between 2008 and 2009, the youth
unemployment rate increased by 1 percentage. Youth unemployment rates were more sensitive
to economic shocks than adult rates. The youth rate increased by 1.0 percentage point compared
to 0.5 points for the adult rate over 2008/09. There are likely to be significant consequences for
young people as upcoming cohorts of new entrants join the ranks of the already unemployed.
15
Young women have more difficulty than young men in finding work. The female youth
unemployment rate in 2009 was at 13.2 per cent compared to the male rate of 12.9 per cent.
The timing of the impact differs by region. Youth unemployment rates began to increase in the
2007/08 period in the Developed Economies & European Union, East Asia, Latin America & the
Caribbean and the Middle East, while in the other regions the crisis-specific impact on youth
unemployment rates is reflected in the 2008/09 period.
Youth in Developed Economies & European Union and Central & South-Eastern Europe (non-
EU) & CIS were hit hard. Youth unemployment rates increased by 4.6 percentage points in the
Developed Economies & European Union between 2008 and 2009 and by 3.5 points in Central
& South-Eastern Europe (non-EU) & CIS (ILO, 2010). Among the developing regions
dominated by the more vulnerable forms of employment, the youth unemployment rate did not
increase at all between 2007 and 2009 increased by less than 1 percentage point in Middle East
(0.4), North Africa (0.4), South Asia (Sub-Saharan Africa (0.1), and even decreased slightly in
South-East Asia & the Pacific (-0.1 percentage point) (ILO, 2010).
Some evidence showed that there was rising discouragement increase in inactivity among youth
in the crisis years in some countries. This led some young people to give up the job search.
In developing economies, the crisis adds to the ranks of vulnerable employment and informal
sector employment.
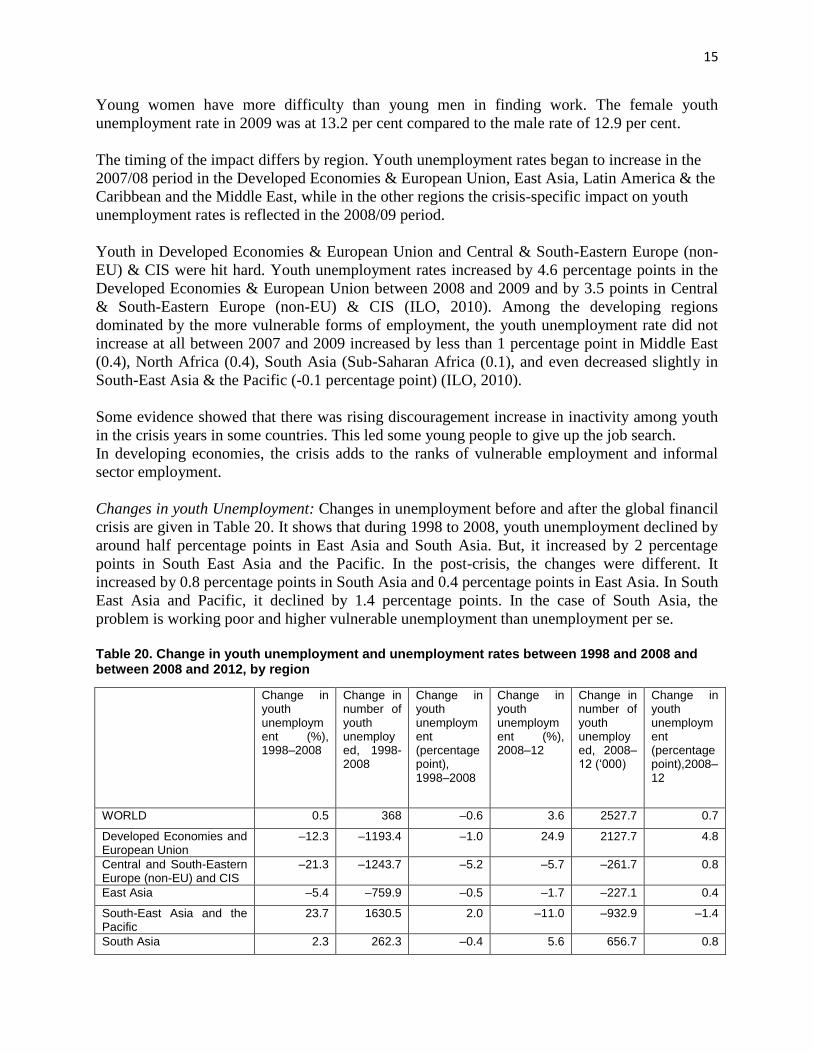
Changes in youth Unemployment: Changes in unemployment before and after the global financil
crisis are given in Table 20. It shows that during 1998 to 2008, youth unemployment declined by
around half percentage points in East Asia and South Asia. But, it increased by 2 percentage
points in South East Asia and the Pacific. In the post-crisis, the changes were different. It
increased by 0.8 percentage points in South Asia and 0.4 percentage points in East Asia. In South
East Asia and Pacific, it declined by 1.4 percentage points. In the case of South Asia, the
problem is working poor and higher vulnerable unemployment than unemployment per se.
Table 20. Change in youth unemployment and unemployment rates between 1998 and 2008 and between 2008 and 2012, by region
Change in youth unemployment (%), 1998–2008
Change in number of youth unemployed, 1998-2008
Change in youth unemployment (percentage point), 1998–2008
Change in youth unemployment (%), 2008–12
Change in number of youth unemployed, 2008–12 (‘000)
Change in youth unemployment (percentage point),2008–12
WORLD 0.5 368 –0.6 3.6 2527.7 0.7
Developed Economies and European Union
–12.3 –1193.4 –1.0 24.9 2127.7 4.8
Central and South-Eastern Europe (non-EU) and CIS
–21.3 –1243.7 –5.2 –5.7 –261.7 0.8
East Asia –5.4 –759.9 –0.5 –1.7 –227.1 0.4
South-East Asia and the Pacific
23.7 1630.5 2.0 –11.0 –932.9 –1.4
South Asia 2.3 262.3 –0.4 5.6 656.7 0.8
16
Latin America and the Caribbean
–7.4 –610.0 –1.5 –5.1 –387.5 –0.6
Middle East 31.1 783.7 1.8 8.8 291.9 3
North Africa –7.2 –221.3 –3.8 13.8 395.1 3.4
Sub-Saharan Africa 21 1719.8 –1.0 8.7 865.5 0
Source: ILO (2013)
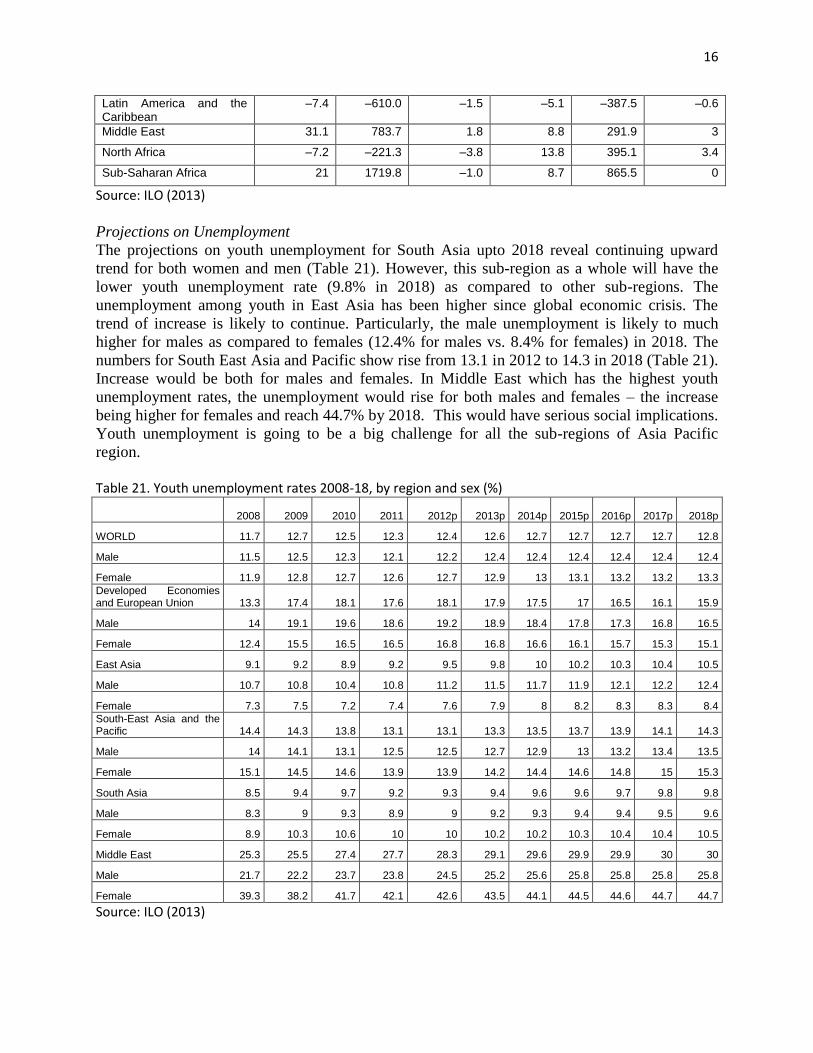
Projections on Unemployment
The projections on youth unemployment for South Asia upto 2018 reveal continuing upward
trend for both women and men (Table 21). However, this sub-region as a whole will have the
lower youth unemployment rate (9.8% in 2018) as compared to other sub-regions. The
unemployment among youth in East Asia has been higher since global economic crisis. The
trend of increase is likely to continue. Particularly, the male unemployment is likely to much
higher for males as compared to females (12.4% for males vs. 8.4% for females) in 2018. The
numbers for South East Asia and Pacific show rise from 13.1 in 2012 to 14.3 in 2018 (Table 21).
Increase would be both for males and females. In Middle East which has the highest youth
unemployment rates, the unemployment would rise for both males and females – the increase
being higher for females and reach 44.7% by 2018. This would have serious social implications.
Youth unemployment is going to be a big challenge for all the sub-regions of Asia Pacific
region. Table 21. Youth unemployment rates 2008-18, by region and sex (%) 2008 2009 2010 2011 2012p 2013p 2014p 2015p 2016p 2017p 2018p
WORLD 11.7 12.7 12.5 12.3 12.4 12.6 12.7 12.7 12.7 12.7 12.8
Male 11.5 12.5 12.3 12.1 12.2 12.4 12.4 12.4 12.4 12.4 12.4
Female 11.9 12.8 12.7 12.6 12.7 12.9 13 13.1 13.2 13.2 13.3
Developed Economies and European Union 13.3 17.4 18.1 17.6 18.1 17.9 17.5 17 16.5 16.1 15.9
Male 14 19.1 19.6 18.6 19.2 18.9 18.4 17.8 17.3 16.8 16.5
Female 12.4 15.5 16.5 16.5 16.8 16.8 16.6 16.1 15.7 15.3 15.1
East Asia 9.1 9.2 8.9 9.2 9.5 9.8 10 10.2 10.3 10.4 10.5
Male 10.7 10.8 10.4 10.8 11.2 11.5 11.7 11.9 12.1 12.2 12.4
Female 7.3 7.5 7.2 7.4 7.6 7.9 8 8.2 8.3 8.3 8.4
South-East Asia and the Pacific 14.4 14.3 13.8 13.1 13.1 13.3 13.5 13.7 13.9 14.1 14.3
Male 14 14.1 13.1 12.5 12.5 12.7 12.9 13 13.2 13.4 13.5
Female 15.1 14.5 14.6 13.9 13.9 14.2 14.4 14.6 14.8 15 15.3
South Asia 8.5 9.4 9.7 9.2 9.3 9.4 9.6 9.6 9.7 9.8 9.8
Male 8.3 9 9.3 8.9 9 9.2 9.3 9.4 9.4 9.5 9.6
Female 8.9 10.3 10.6 10 10 10.2 10.2 10.3 10.4 10.4 10.5
Middle East 25.3 25.5 27.4 27.7 28.3 29.1 29.6 29.9 29.9 30 30
Male 21.7 22.2 23.7 23.8 24.5 25.2 25.6 25.8 25.8 25.8 25.8
Female 39.3 38.2 41.7 42.1 42.6 43.5 44.1 44.5 44.6 44.7 44.7
Source: ILO (2013)
17
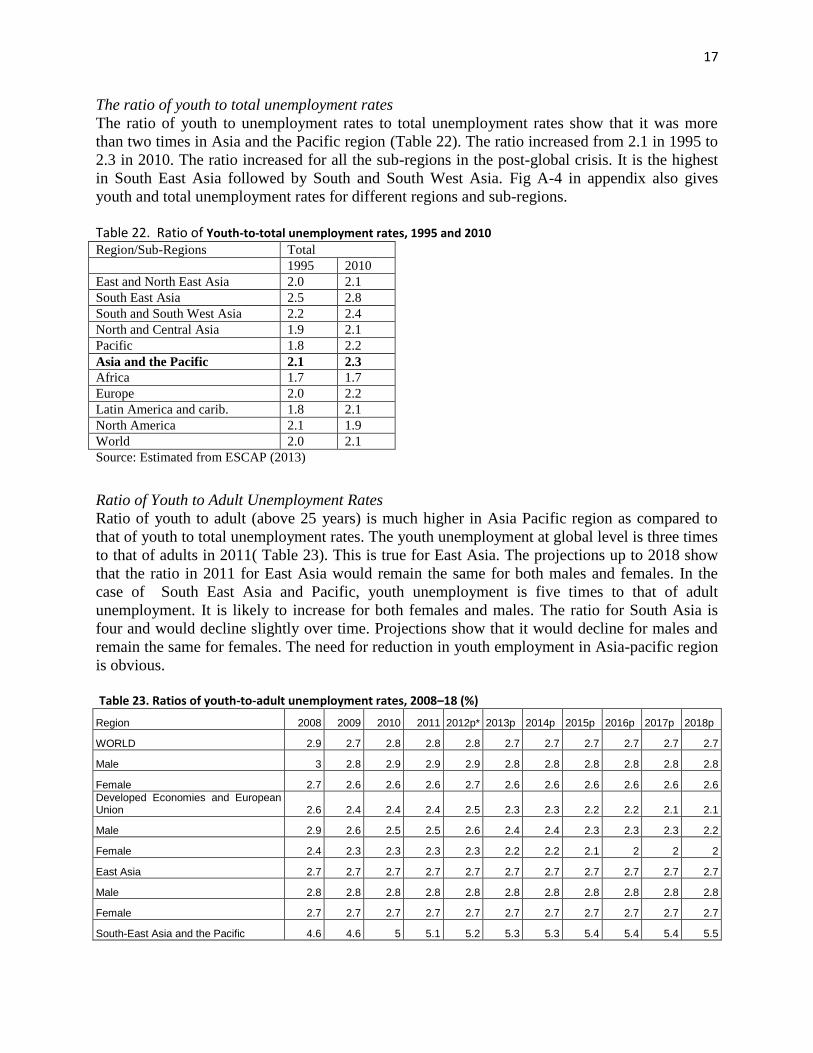
The ratio of youth to total unemployment rates
The ratio of youth to unemployment rates to total unemployment rates show that it was more
than two times in Asia and the Pacific region (Table 22). The ratio increased from 2.1 in 1995 to
2.3 in 2010. The ratio increased for all the sub-regions in the post-global crisis. It is the highest
in South East Asia followed by South and South West Asia. Fig A-4 in appendix also gives
youth and total unemployment rates for different regions and sub-regions. Table 22. Ratio of Youth-to-total unemployment rates, 1995 and 2010
Region/Sub-Regions Total
1995 2010
East and North East Asia 2.0 2.1
South East Asia 2.5 2.8
South and South West Asia 2.2 2.4
North and Central Asia 1.9 2.1
Pacific 1.8 2.2
Asia and the Pacific 2.1 2.3
Africa 1.7 1.7
Europe 2.0 2.2
Latin America and carib. 1.8 2.1
North America 2.1 1.9
World 2.0 2.1
Source: Estimated from ESCAP (2013)
Ratio of Youth to Adult Unemployment Rates
Ratio of youth to adult (above 25 years) is much higher in Asia Pacific region as compared to
that of youth to total unemployment rates. The youth unemployment at global level is three times
to that of adults in 2011( Table 23). This is true for East Asia. The projections up to 2018 show
that the ratio in 2011 for East Asia would remain the same for both males and females. In the
case of South East Asia and Pacific, youth unemployment is five times to that of adult
unemployment. It is likely to increase for both females and males. The ratio for South Asia is
four and would decline slightly over time. Projections show that it would decline for males and
remain the same for females. The need for reduction in youth employment in Asia-pacific region
is obvious. Table 23. Ratios of youth-to-adult unemployment rates, 2008–18 (%)
Region 2008 2009 2010 2011 2012p* 2013p 2014p 2015p 2016p 2017p 2018p
WORLD 2.9 2.7 2.8 2.8 2.8 2.7 2.7 2.7 2.7 2.7 2.7
Male 3 2.8 2.9 2.9 2.9 2.8 2.8 2.8 2.8 2.8 2.8
Female 2.7 2.6 2.6 2.6 2.7 2.6 2.6 2.6 2.6 2.6 2.6
Developed Economies and European Union 2.6 2.4 2.4 2.4 2.5 2.3 2.3 2.2 2.2 2.1 2.1
Male 2.9 2.6 2.5 2.5 2.6 2.4 2.4 2.3 2.3 2.3 2.2
Female 2.4 2.3 2.3 2.3 2.3 2.2 2.2 2.1 2 2 2
East Asia 2.7 2.7 2.7 2.7 2.7 2.7 2.7 2.7 2.7 2.7 2.7
Male 2.8 2.8 2.8 2.8 2.8 2.8 2.8 2.8 2.8 2.8 2.8
Female 2.7 2.7 2.7 2.7 2.7 2.7 2.7 2.7 2.7 2.7 2.7
South-East Asia and the Pacific 4.6 4.6 5 5.1 5.2 5.3 5.3 5.4 5.4 5.4 5.5
18
Male 4.5 4.5 5.3 5.4 5.4 5.5 5.5 5.5 5.5 5.6 5.6
Female 4.7 4.7 4.8 4.9 5 5.1 5.1 5.2 5.2 5.3 5.3
South Asia 3.5 3.9 4.1 4 4 3.9 3.9 3.9 3.8 3.8 3.8
Male 3.9 4.4 4.7 4.5 4.4 4.3 4.2 4.2 4.1 4.1 4.1
Female 2.9 3.1 3.2 3.2 3.2 3.2 3.2 3.2 3.2 3.2 3.2
Middle East 3.9 3.6 3.7 3.8 3.8 3.8 3.8 3.8 3.8 3.8 3.7
Male 4 3.8 3.9 3.9 4 4 4 4 3.9 3.9 3.9
Female 3.3 3.1 3.1 3.1 3.2 3.2 3.2 3.2 3.2 3.2 3.2
Source: ILO (2013)
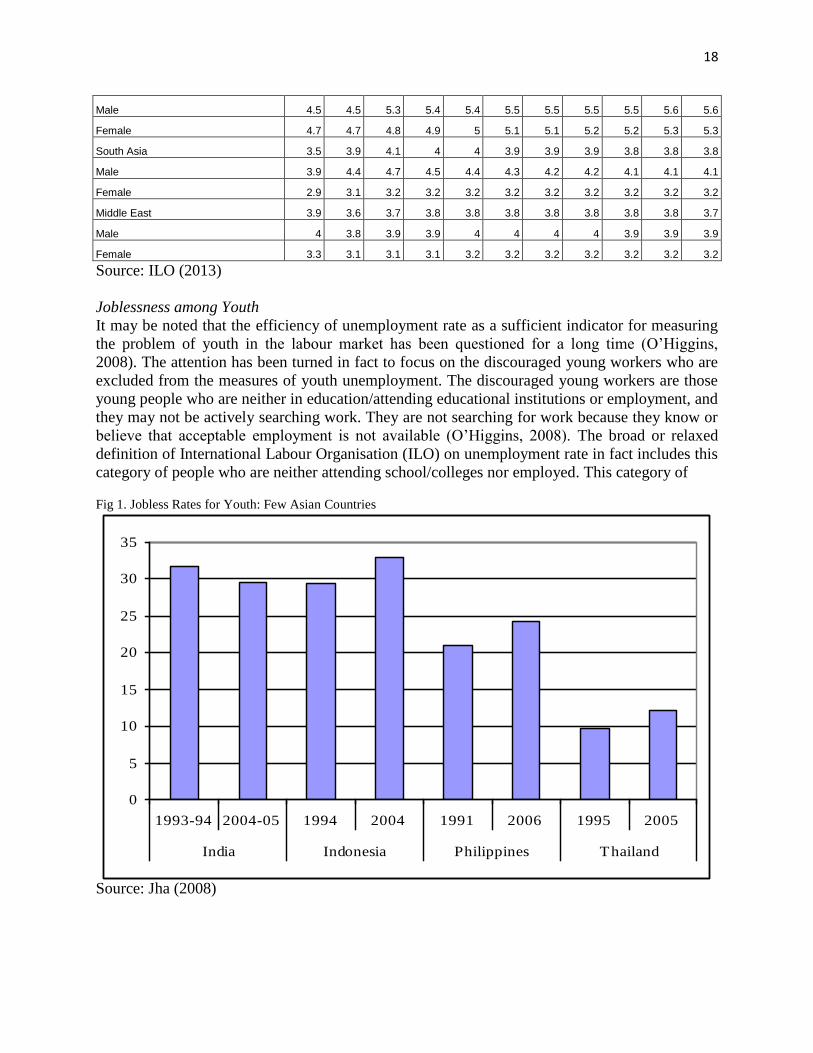
Joblessness among Youth
It may be noted that the efficiency of unemployment rate as a sufficient indicator for measuring
the problem of youth in the labour market has been questioned for a long time (O’Higgins,
2008). The attention has been turned in fact to focus on the discouraged young workers who are
excluded from the measures of youth unemployment. The discouraged young workers are those
young people who are neither in education/attending educational institutions or employment, and
they may not be actively searching work. They are not searching for work because they know or
believe that acceptable employment is not available (O’Higgins, 2008). The broad or relaxed
definition of International Labour Organisation (ILO) on unemployment rate in fact includes this
category of people who are neither attending school/colleges nor employed. This category of
Fig 1. Jobless Rates for Youth: Few Asian Countries
Source: Jha (2008)
0
5
10
15
20
25
30
35
1993-94 2004-05 1994 2004 1991 2006 1995 2005
India Indonesia Philippines Thailand
19
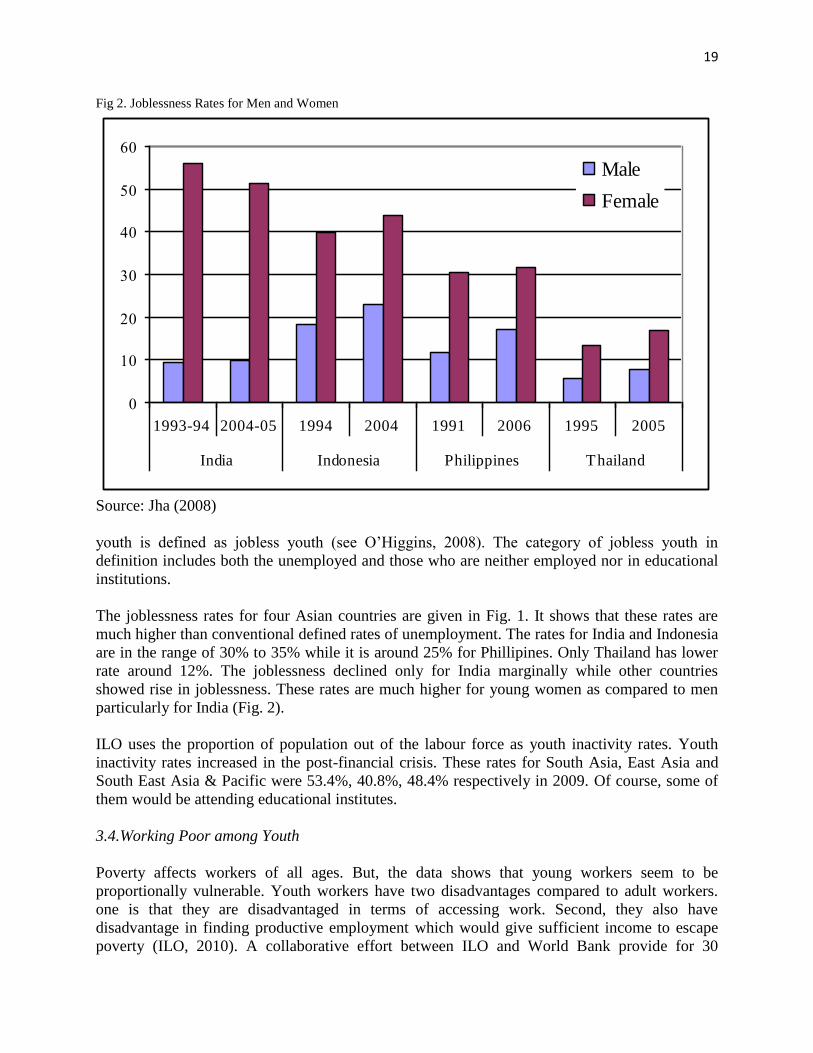
Fig 2. Joblessness Rates for Men and Women
Source: Jha (2008)
youth is defined as jobless youth (see O’Higgins, 2008). The category of jobless youth in
definition includes both the unemployed and those who are neither employed nor in educational
institutions.
The joblessness rates for four Asian countries are given in Fig. 1. It shows that these rates are
much higher than conventional defined rates of unemployment. The rates for India and Indonesia
are in the range of 30% to 35% while it is around 25% for Phillipines. Only Thailand has lower
rate around 12%. The joblessness declined only for India marginally while other countries
showed rise in joblessness. These rates are much higher for young women as compared to men
particularly for India (Fig. 2).
ILO uses the proportion of population out of the labour force as youth inactivity rates. Youth
inactivity rates increased in the post-financial crisis. These rates for South Asia, East Asia and
South East Asia & Pacific were 53.4%, 40.8%, 48.4% respectively in 2009. Of course, some of
them would be attending educational institutes.
3.4.Working Poor among Youth
Poverty affects workers of all ages. But, the data shows that young workers seem to be
proportionally vulnerable. Youth workers have two disadvantages compared to adult workers.
one is that they are disadvantaged in terms of accessing work. Second, they also have
disadvantage in finding productive employment which would give sufficient income to escape
poverty (ILO, 2010). A collaborative effort between ILO and World Bank provide for 30
0
10
20
30
40
50
60
1993-94 2004-05 1994 2004 1991 2006 1995 2005
India Indonesia Philippines Thailand
Male
Female
20
countries estimates of working poor for youth and adults for the period 1998-2006. Among these
30 countries, there are many countries from Asia such as India, Pakistan, Nepal, Bhutan,
Vietnam, Cambodia, Philippines, Kazakistan, Armenia, Timor-Leste. The poverty line is
US$1.25 a day. According to these estimates 27 out of 30 countries show that poverty among
youth workers was higher than that for adult workers. In Bhutan, youth working poverty rate
exceeds adult rate by 10 percentage points while in Vietnam it exceeds by 5 percentage points
(ILO, 2010).
ILO estimates global level poverty for youth workers based on 30 countries using US$1.25 day
poverty line. It is estimated that around 152 million young workers were living in poor
households in 2008 (28% of youth workers). The poverty among youth came down from 46.2%
in 1998 to 28.1% in 2008. Youth accounted for 24% of global working poor with 18% of total
world’s employment in 1998.
3.5. Education, Skills and Wages
Lack of education and skills for youth workers are the major problems in developing economies
of Asia and Pacific for unemployment, joblessness, employability problems and low wages.
Youth population often reach working age without education and basic skills which are
important for employment prospects.
In the last two decades, the primary school enrolment ratios have increased significantly. More
than 95% of youth are literate. Gender inequalities are high at secondary and tertiary level. The
enrolment in tertiary education was 26% in East Asia, 25% in Central Asia and only 13% in
South Asia (UN, 2011). Enrolment in technical and vocational education is low in some sub-
regions of the Asia-Pacific region. In East Asia and the Pacific, the share of technical and
vocational education in secondary enrolment is higher at 14% followed by 12% in Central Asia.
It is only 2% in South and South West Asia (UN, 2011).
We have some information on education and skills of youth workers in India as given below.
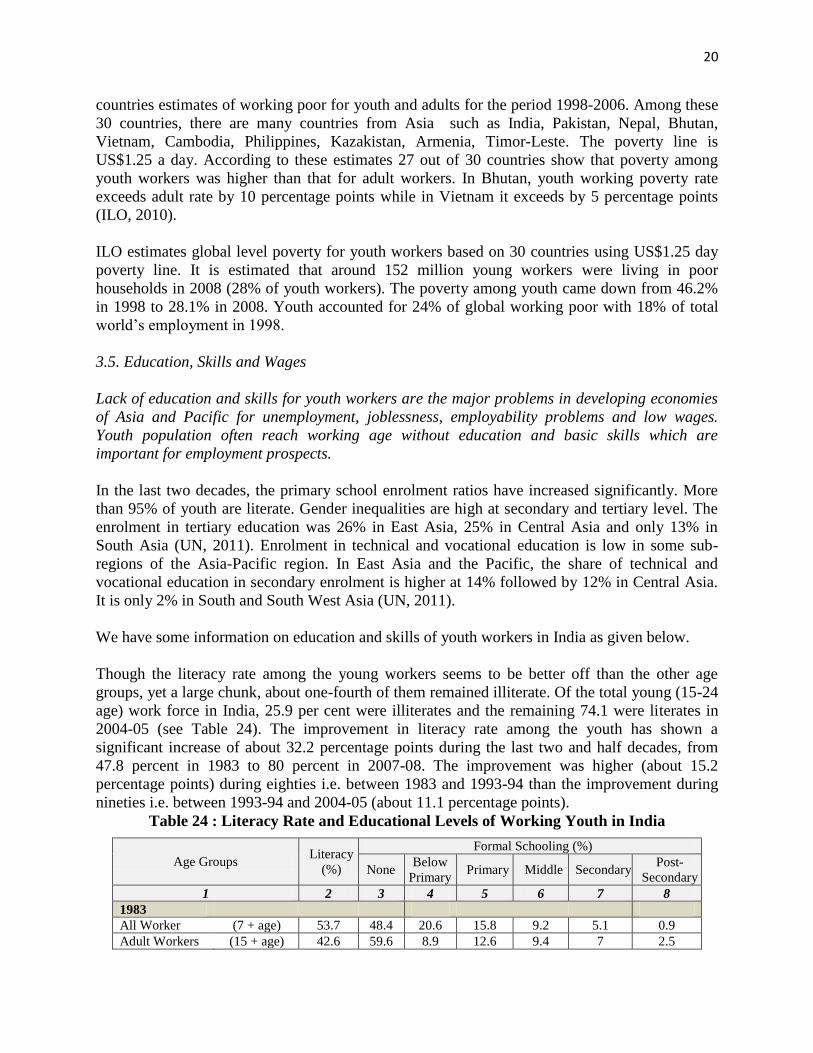
Though the literacy rate among the young workers seems to be better off than the other age
groups, yet a large chunk, about one-fourth of them remained illiterate. Of the total young (15-24
age) work force in India, 25.9 per cent were illiterates and the remaining 74.1 were literates in
2004-05 (see Table 24). The improvement in literacy rate among the youth has shown a
significant increase of about 32.2 percentage points during the last two and half decades, from
47.8 percent in 1983 to 80 percent in 2007-08. The improvement was higher (about 15.2
percentage points) during eighties i.e. between 1983 and 1993-94 than the improvement during
nineties i.e. between 1993-94 and 2004-05 (about 11.1 percentage points).
Table 24 : Literacy Rate and Educational Levels of Working Youth in India
Age Groups Literacy
(%)
Formal Schooling (%)
None Below
Primary Primary Middle Secondary
Post-
Secondary
1 2 3 4 5 6 7 8
1983
All Worker (7 + age) 53.7 48.4 20.6 15.8 9.2 5.1 0.9
Adult Workers (15 + age) 42.6 59.6 8.9 12.6 9.4 7 2.5
21
Young Workers (15-24 age) 47.8 53.6 9.5 15.9 12.7 7 1.3
1993-94
All Worker (7 + age) 50 51.2 11.2 11.9 11.2 10.4 4.1
Adult Workers (15 + age) 50.5 50.8 10.9 11.8 11.5 10.8 4.2
Young Workers (15-24 age) 58.9 42.2 11 15 17 13 1.8
2004-05
All Worker (7 + age) 60.3 42.1 8.8 14 15.2 14.2 5.7
Adult Workers (15 + age) 60.3 42.1 8.6 13.7 15.3 14.5 5.8
Young Workers (15-24 age) 74.1 28.0 9.8 18.7 24.2 16.6 2.7
2007-08
All Worker (7 + age) 64.7 36.5 9.2 15.1 16.7 14.8 7.7
Adult Workers (15 + age) 64.7 36.5 9.1 14.9 16.8 15.0 7.8
Young Workers (15-24 age) 80.7 20.0 9.5 20.4 26.4 18.8 4.9
Note: 1. Figures presented above are in percentages; 2. Secondary includes higher secondary below
graduation; 5. Rural-urban and male-female combined.
Source: Dev and Venkatanarayana (2011)
With respect to the levels of education among the youth workforce in India, only 4.9 percent of
young workers had post-secondary level of education in 2007-08 (see Table 24). It is about 3.6
percentage point increase from the base 1.3% in 1983. The young workers those who had
completed secondary level of education were about 18.8 per cent; it is 19.6 percentage points
increase from 7% in 1983. About 24.2 percent of the young workers completed the middle
school education. Those who had the education level middle school and above in the elementary
school education formed about 21% and increased to 45% in 2007-08. It was 24 percentage
points improvement in the young workers who completed elementary school education during
the last two and half decades between 1983 and 2007-08.
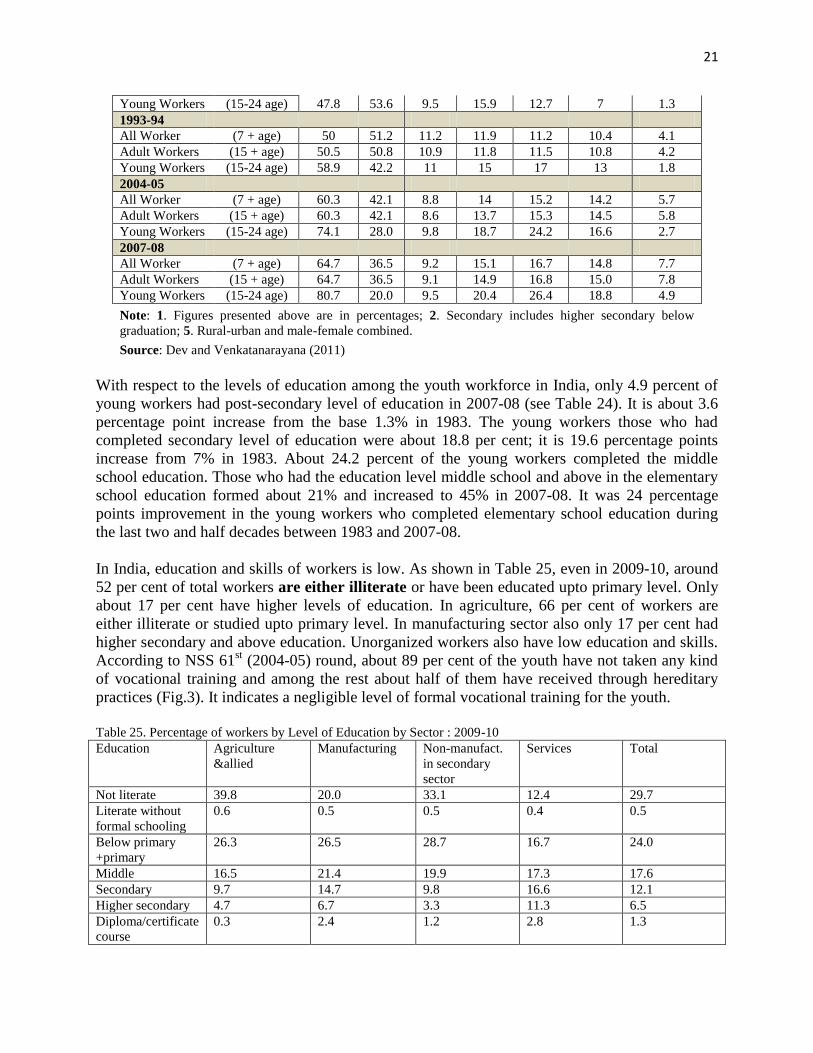
In India, education and skills of workers is low. As shown in Table 25, even in 2009-10, around
52 per cent of total workers are either illiterate or have been educated upto primary level. Only
about 17 per cent have higher levels of education. In agriculture, 66 per cent of workers are
either illiterate or studied upto primary level. In manufacturing sector also only 17 per cent had
higher secondary and above education. Unorganized workers also have low education and skills.
According to NSS 61st (2004-05) round, about 89 per cent of the youth have not taken any kind
of vocational training and among the rest about half of them have received through hereditary
practices (Fig.3). It indicates a negligible level of formal vocational training for the youth.
Table 25. Percentage of workers by Level of Education by Sector : 2009-10
Education Agriculture
&allied
Manufacturing Non-manufact.
in secondary
sector
Services Total
Not literate 39.8 20.0 33.1 12.4 29.7
Literate without
formal schooling
0.6 0.5 0.5 0.4 0.5
Below primary
+primary
26.3 26.5 28.7 16.7 24.0
Middle 16.5 21.4 19.9 17.3 17.6
Secondary 9.7 14.7 9.8 16.6 12.1
Higher secondary 4.7 6.7 3.3 11.3 6.5
Diploma/certificate
course
0.3 2.4 1.2 2.8 1.3
22
Graduate 1.8 6.3 2.9 16.2 6.2
Graduate and
above
0.3 1.5 0.6 6.4 2.1
Total 100.0
(219.23)
100.0
(47.90)
100.0
(43.50)
100.0
(109.96)
100.0
(420.59)
Note: Figures in Parentheses refer to estimated number of workers in Millions.
Source: Estimated from GOI (2012) based on NSS (66th
Round), 2009-10
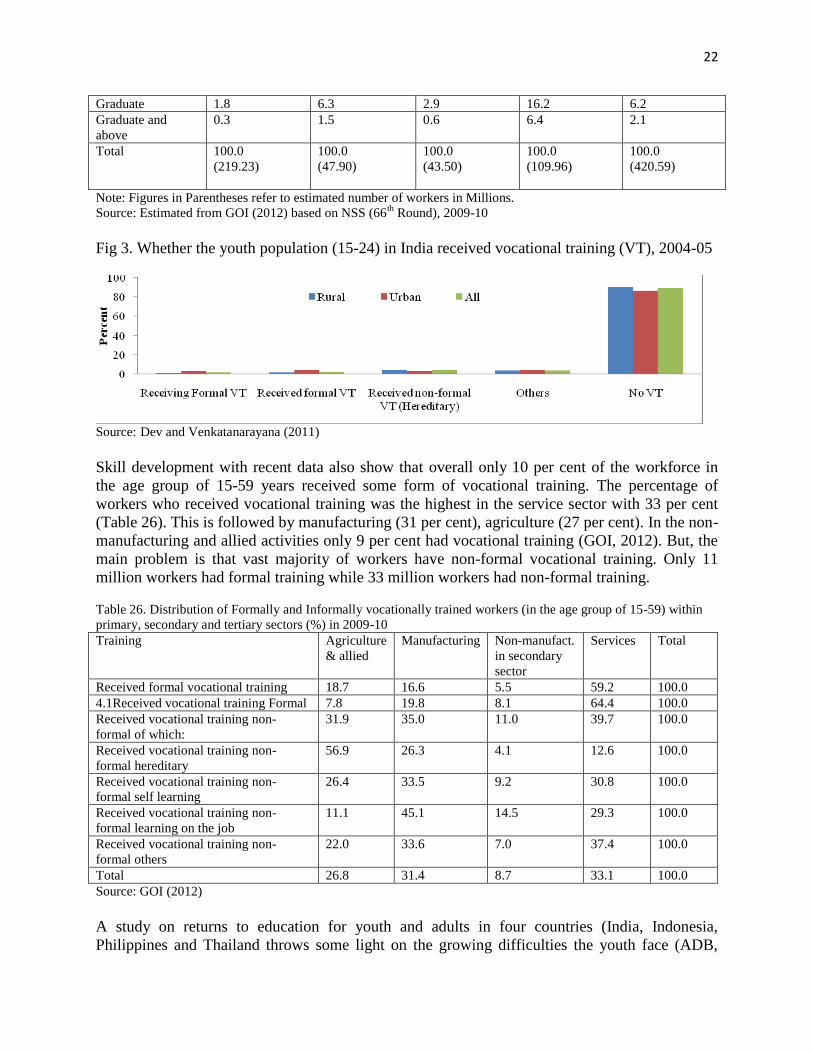
Fig 3. Whether the youth population (15-24) in India received vocational training (VT), 2004-05
Source: Dev and Venkatanarayana (2011)
Skill development with recent data also show that overall only 10 per cent of the workforce in
the age group of 15-59 years received some form of vocational training. The percentage of
workers who received vocational training was the highest in the service sector with 33 per cent
(Table 26). This is followed by manufacturing (31 per cent), agriculture (27 per cent). In the non-
manufacturing and allied activities only 9 per cent had vocational training (GOI, 2012). But, the
main problem is that vast majority of workers have non-formal vocational training. Only 11
million workers had formal training while 33 million workers had non-formal training.
Table 26. Distribution of Formally and Informally vocationally trained workers (in the age group of 15-59) within
primary, secondary and tertiary sectors (%) in 2009-10
Training Agriculture
& allied
Manufacturing Non-manufact.
in secondary
sector
Services Total
Received formal vocational training 18.7 16.6 5.5 59.2 100.0
4.1Received vocational training Formal 7.8 19.8 8.1 64.4 100.0
Received vocational training non-
formal of which:
31.9 35.0 11.0 39.7 100.0
Received vocational training non-
formal hereditary
56.9 26.3 4.1 12.6 100.0
Received vocational training non-
formal self learning
26.4 33.5 9.2 30.8 100.0
Received vocational training non-
formal learning on the job
11.1 45.1 14.5 29.3 100.0
Received vocational training non-
formal others
22.0 33.6 7.0 37.4 100.0
Total 26.8 31.4 8.7 33.1 100.0
Source: GOI (2012)
A study on returns to education for youth and adults in four countries (India, Indonesia,
Philippines and Thailand throws some light on the growing difficulties the youth face (ADB,
23
2008). According to this study, median wages for young workers are generally below their adult
counterparts for the same level of education. A gender bias exists in returns to higher education.
Men and boys receive higher median wages than girls and women for the same level of
education.
The wage gap is not much for those upto primary and middle schooling. However, the wage gap
widens when the levels of education goes beyond middle school (ADB, 2008). In other words, at
higher levels of education adult workers are preferred because of experience. The returns to
education alone may not be higher if higher skills are not acquired.
This is clearer with Indian data as shown below.
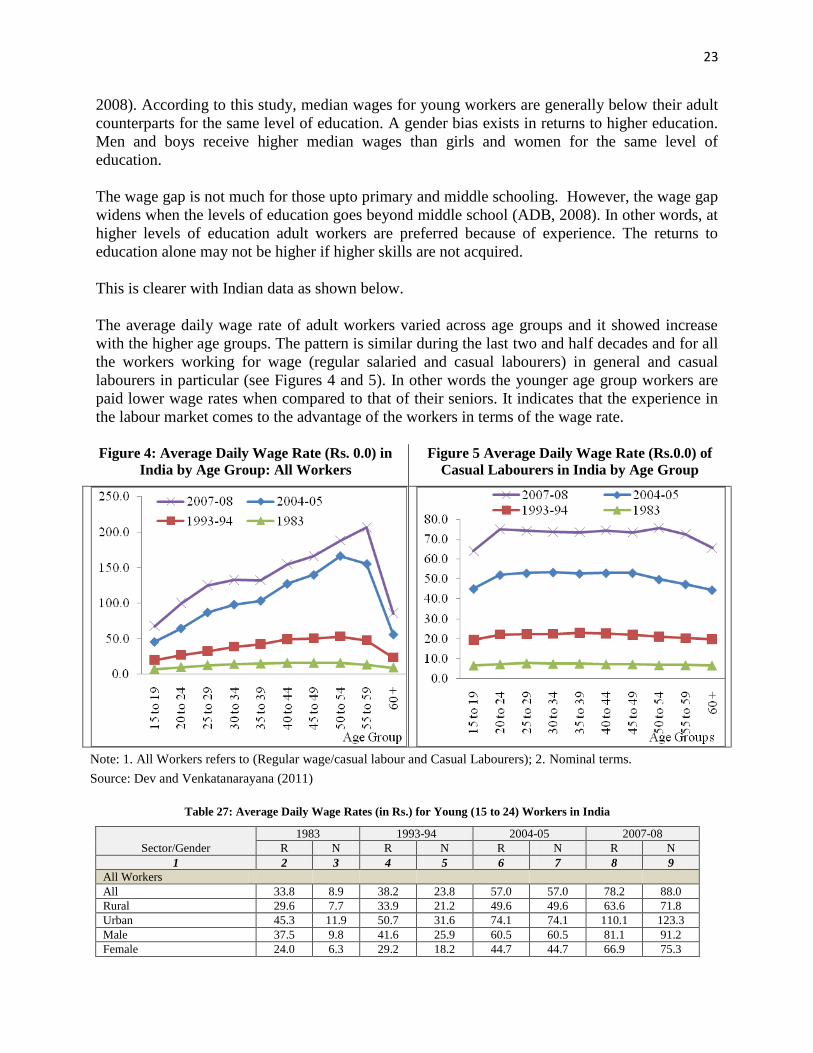
The average daily wage rate of adult workers varied across age groups and it showed increase
with the higher age groups. The pattern is similar during the last two and half decades and for all
the workers working for wage (regular salaried and casual labourers) in general and casual
labourers in particular (see Figures 4 and 5). In other words the younger age group workers are
paid lower wage rates when compared to that of their seniors. It indicates that the experience in
the labour market comes to the advantage of the workers in terms of the wage rate.
Figure 4: Average Daily Wage Rate (Rs. 0.0) in
India by Age Group: All Workers
Figure 5 Average Daily Wage Rate (Rs.0.0) of
Casual Labourers in India by Age Group
Note: 1. All Workers refers to (Regular wage/casual labour and Casual Labourers); 2. Nominal terms.
Source: Dev and Venkatanarayana (2011)
Table 27: Average Daily Wage Rates (in Rs.) for Young (15 to 24) Workers in India
Sector/Gender
1983 1993-94 2004-05 2007-08
R N R N R N R N
1 2 3 4 5 6 7 8 9
All Workers
All 33.8 8.9 38.2 23.8 57.0 57.0 78.2 88.0
Rural 29.6 7.7 33.9 21.2 49.6 49.6 63.6 71.8
Urban 45.3 11.9 50.7 31.6 74.1 74.1 110.1 123.3
Male 37.5 9.8 41.6 25.9 60.5 60.5 81.1 91.2
Female 24.0 6.3 29.2 18.2 44.7 44.7 66.9 75.3
24
Casual Labour
All 26.4 6.9 33.4 20.8 48.9 48.9 62.2 70.2
Rural 25.4 6.7 32.0 20.0 46.8 46.8 59.9 67.7
Urban 32.1 8.4 41.5 25.9 61.3 61.3 76.1 85.3
Male 30.1 7.9 37.3 23.3 53.5 53.5 66.9 75.5
Female 19.2 5.0 24.2 15.1 34.4 34.4 45.2 51.0
Note: 1. R – Real in terms of 2004-05 prices; N – Nominal or actual.
Source: Dev and Venkatanarayana (2011)
The average daily wage rate for youth workers (15 to 24 age group) who are working for wage
(including regular salaried and casual laborers) in nominal (or actual) terms was Rs. 57.0 in
2004-05, Rs. 23.8 in 1993-94 and Rs. 8.9 in 1983 (see Table 27). The wage rate for casual
labourers is significantly lower than that of the other workers working for wages especially
regular salaried persons. The average daily nominal wage rate for casual labourers was Rs. 48.9
in 2004-05, Rs. 20.8 in 1993-94 and Rs. 6.9 in 1983. The real wage rate in terms of the 2004-05
prices, for all the youth workers working for wages, was Rs. 33.8 in 1983 and increased to Rs.
38.2 in 1993-94 and to Rs. 57.0 in 2004-05. Whereas for the casual labourers among the young
workers, the real wage had increased from Rs. 26.4 to Rs. 33.4 and to 48.9 respectively during
the same period (Table 27).
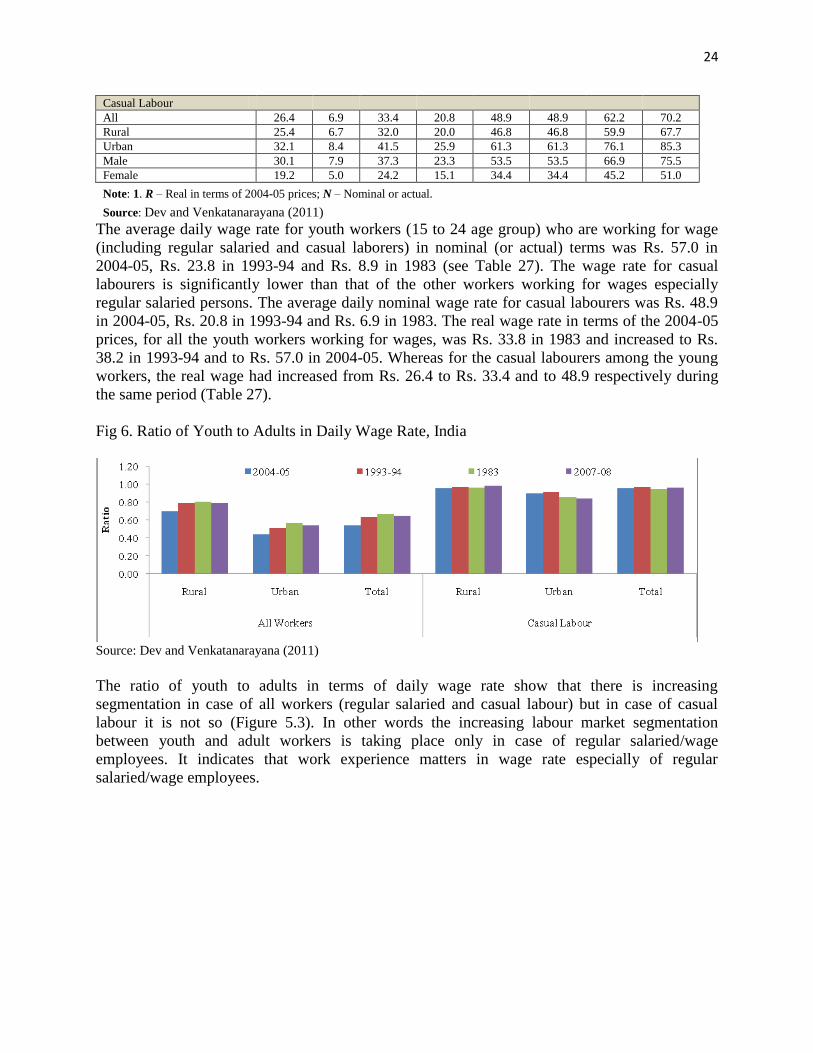
Fig 6. Ratio of Youth to Adults in Daily Wage Rate, India
Source: Dev and Venkatanarayana (2011)
The ratio of youth to adults in terms of daily wage rate show that there is increasing
segmentation in case of all workers (regular salaried and casual labour) but in case of casual
labour it is not so (Figure 5.3). In other words the increasing labour market segmentation
between youth and adult workers is taking place only in case of regular salaried/wage
employees. It indicates that work experience matters in wage rate especially of regular
salaried/wage employees.
25
4. POLICIES FOR YOUTH POPULATION
This section examines policies needed for creating quality employment for youth in order to
improve well being of the youth. It examines direct policies and indirect policies to achieve this
objective.
4.1. Direct policies for creation of quality employment for youth
The challenges for young workers particularly for developing economies like South Asia are:
unemployment, high share in informal sector, underemployment, working poor, low paid jobs,
low working conditions, lack of structural transformation to industry and services, lack of
education, skills and training.
Unemployment is the result of the combined effect of (1) mismatch between the skills level of
jobseekers and the skills demanded by enterprises; (2) the supply of workers seeking a job
exceeds the demand of enterprises/vacancies available; and (3) imperfect information on the jobs
available, skills mismatches or low demand for workers – induce a process of de-motivation and,
as a result, individuals reduce their job search activity thus decreasing the probability of getting
jobs.
In order to address some of the above challenges and to have decent work we need to have
active labour market policies (ALMP) and social protection measures.
Active Labour Market Policies (ALMPs) ALMPs have been used to facilitate young people to integrate with labour market. “Their
function is to mediate between labour supply and demand, mitigate educationand labour market
failures, and promote efficiency, equity, growth and social justice. “ALMPs attempt to remedy
failures of educational systems in equipping young people with employable skills and improve
the efficiency of labour market matching”.(p.1, ILO, 2010a). “Active labour market policies
include measures such asjob training and search assistance, remedial education, and direct job
creation to help young people who are not employed or working in the informal economy find
decent formal employment (for example, Betcherman et al. 2007). These policies largely fulfill a
remedial role in correcting malfunctions in the educational system and in labor markets. The
main options usually involve skills training, support for youth business start-ups, and a
combination of support services” (p.55, ADB, 2008).
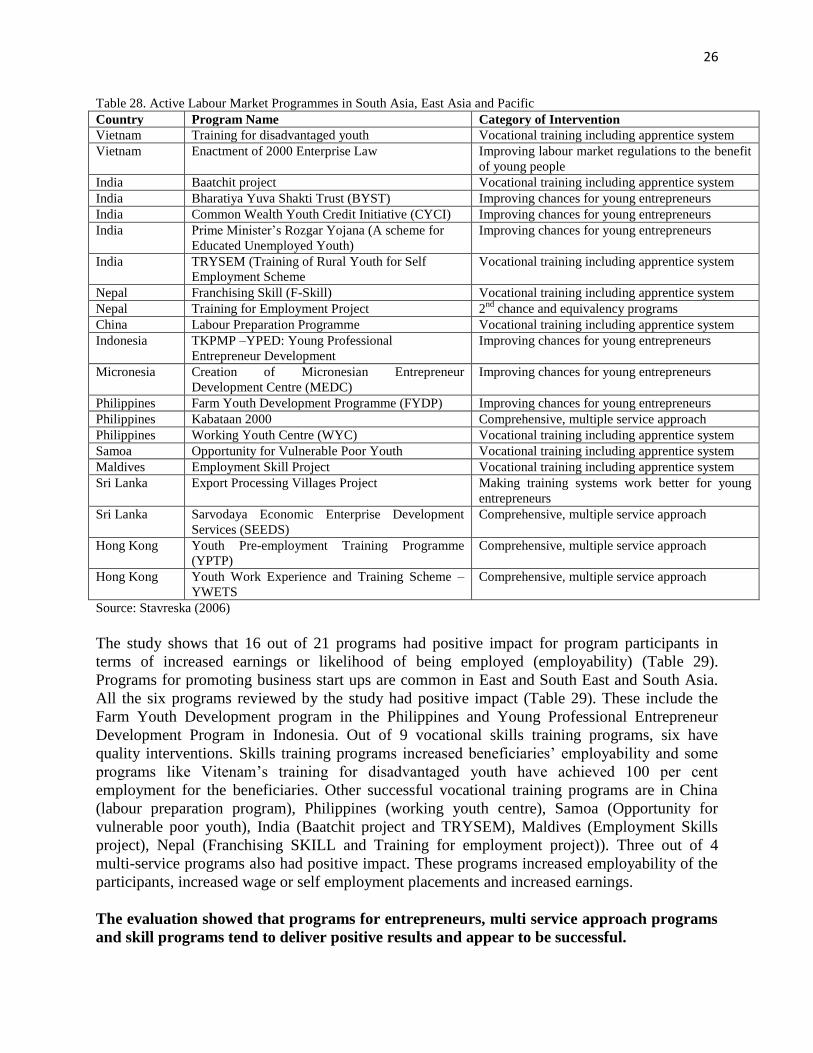
As part of Youth Employment Inventory (YEI), Stavreska (2006) examines 21 active labour
market programs (ALMPs) in 11 countries in South, East Asia and the Pacific sub-regions. The
objectives of the study are: “(i) document the types of programs that have been implemented to
support young workers to find work; and (ii) identify what appears to work in terms of
improving employment outcomes for youth” (p.2, Stavreska ,2006).Table 28 provides the 21
interventions in the 11 countries.
26
Table 28. Active Labour Market Programmes in South Asia, East Asia and Pacific
Country Program Name Category of Intervention
Vietnam Training for disadvantaged youth Vocational training including apprentice system
Vietnam Enactment of 2000 Enterprise Law Improving labour market regulations to the benefit
of young people
India Baatchit project Vocational training including apprentice system
India Bharatiya Yuva Shakti Trust (BYST) Improving chances for young entrepreneurs
India Common Wealth Youth Credit Initiative (CYCI) Improving chances for young entrepreneurs
India Prime Minister’s Rozgar Yojana (A scheme for
Educated Unemployed Youth)
Improving chances for young entrepreneurs
India TRYSEM (Training of Rural Youth for Self
Employment Scheme
Vocational training including apprentice system
Nepal Franchising Skill (F-Skill) Vocational training including apprentice system
Nepal Training for Employment Project 2nd
chance and equivalency programs
China Labour Preparation Programme Vocational training including apprentice system
Indonesia TKPMP –YPED: Young Professional
Entrepreneur Development
Improving chances for young entrepreneurs
Micronesia Creation of Micronesian Entrepreneur
Development Centre (MEDC)
Improving chances for young entrepreneurs
Philippines Farm Youth Development Programme (FYDP) Improving chances for young entrepreneurs
Philippines Kabataan 2000 Comprehensive, multiple service approach
Philippines Working Youth Centre (WYC) Vocational training including apprentice system
Samoa Opportunity for Vulnerable Poor Youth Vocational training including apprentice system
Maldives Employment Skill Project Vocational training including apprentice system
Sri Lanka Export Processing Villages Project Making training systems work better for young
entrepreneurs
Sri Lanka Sarvodaya Economic Enterprise Development
Services (SEEDS)
Comprehensive, multiple service approach
Hong Kong Youth Pre-employment Training Programme
(YPTP)
Comprehensive, multiple service approach
Hong Kong Youth Work Experience and Training Scheme –
YWETS
Comprehensive, multiple service approach
Source: Stavreska (2006)
The study shows that 16 out of 21 programs had positive impact for program participants in
terms of increased earnings or likelihood of being employed (employability) (Table 29).
Programs for promoting business start ups are common in East and South East and South Asia.
All the six programs reviewed by the study had positive impact (Table 29). These include the
Farm Youth Development program in the Philippines and Young Professional Entrepreneur
Development Program in Indonesia. Out of 9 vocational skills training programs, six have
quality interventions. Skills training programs increased beneficiaries’ employability and some
programs like Vitenam’s training for disadvantaged youth have achieved 100 per cent
employment for the beneficiaries. Other successful vocational training programs are in China
(labour preparation program), Philippines (working youth centre), Samoa (Opportunity for
vulnerable poor youth), India (Baatchit project and TRYSEM), Maldives (Employment Skills
project), Nepal (Franchising SKILL and Training for employment project)). Three out of 4
multi-service programs also had positive impact. These programs increased employability of the
participants, increased wage or self employment placements and increased earnings.
The evaluation showed that programs for entrepreneurs, multi service approach programs
and skill programs tend to deliver positive results and appear to be successful.
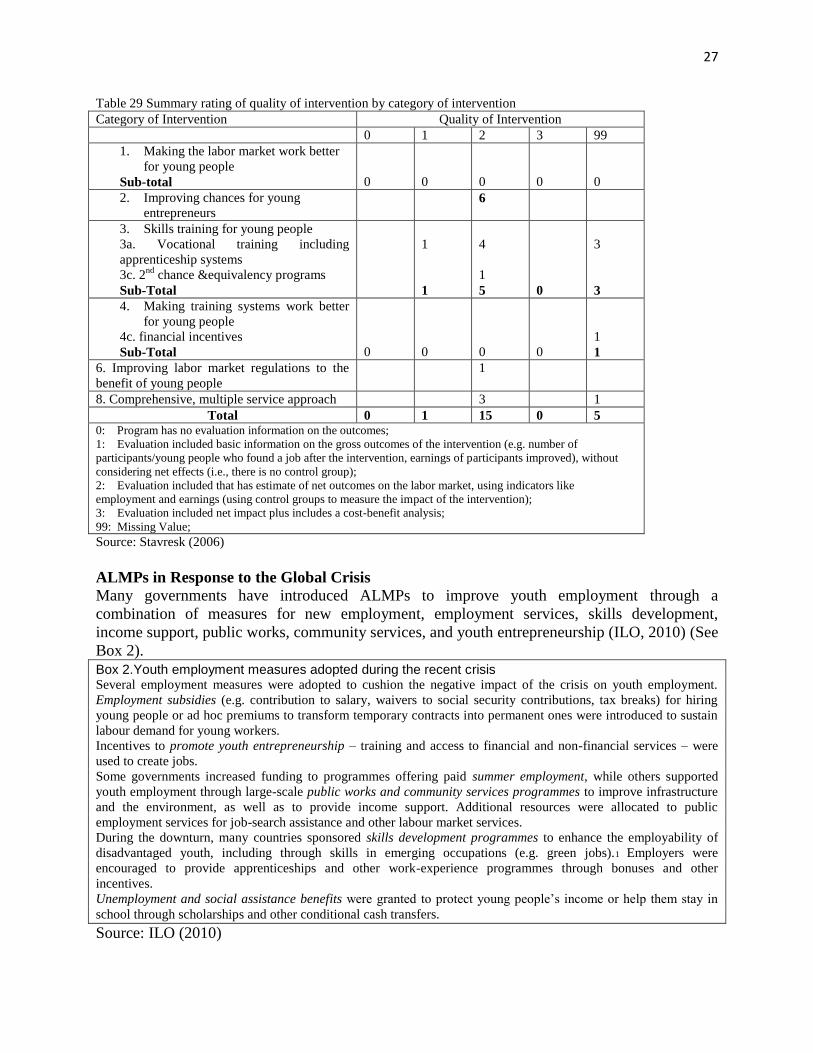
27
Table 29 Summary rating of quality of intervention by category of intervention
Category of Intervention Quality of Intervention
0 1 2 3 99
1. Making the labor market work better
for young people
Sub-total
0
0
0
0
0
2. Improving chances for young
entrepreneurs
6
3. Skills training for young people
3a. Vocational training including
apprenticeship systems
3c. 2nd
chance &equivalency programs
Sub-Total
1
1
4
1
5
0
3
3
4. Making training systems work better
for young people
4c. financial incentives
Sub-Total
0
0
0
0
1
1
6. Improving labor market regulations to the
benefit of young people
1
8. Comprehensive, multiple service approach 3 1
Total 0 1 15 0 5 0: Program has no evaluation information on the outcomes;
1: Evaluation included basic information on the gross outcomes of the intervention (e.g. number of
participants/young people who found a job after the intervention, earnings of participants improved), without
considering net effects (i.e., there is no control group);
2: Evaluation included that has estimate of net outcomes on the labor market, using indicators like
employment and earnings (using control groups to measure the impact of the intervention);
3: Evaluation included net impact plus includes a cost-benefit analysis;
99: Missing Value;
Source: Stavresk (2006)
ALMPs in Response to the Global Crisis
Many governments have introduced ALMPs to improve youth employment through a
combination of measures for new employment, employment services, skills development,
income support, public works, community services, and youth entrepreneurship (ILO, 2010) (See
Box 2).
Box 2.Youth employment measures adopted during the recent crisis Several employment measures were adopted to cushion the negative impact of the crisis on youth employment.
Employment subsidies (e.g. contribution to salary, waivers to social security contributions, tax breaks) for hiring
young people or ad hoc premiums to transform temporary contracts into permanent ones were introduced to sustain
labour demand for young workers.
Incentives to promote youth entrepreneurship – training and access to financial and non-financial services – were
used to create jobs.
Some governments increased funding to programmes offering paid summer employment, while others supported
youth employment through large-scale public works and community services programmes to improve infrastructure
and the environment, as well as to provide income support. Additional resources were allocated to public
employment services for job-search assistance and other labour market services.
During the downturn, many countries sponsored skills development programmes to enhance the employability of
disadvantaged youth, including through skills in emerging occupations (e.g. green jobs).1 Employers were
encouraged to provide apprenticeships and other work-experience programmes through bonuses and other
incentives.
Unemployment and social assistance benefits were granted to protect young people’s income or help them stay in
school through scholarships and other conditional cash transfers.
Source: ILO (2010)
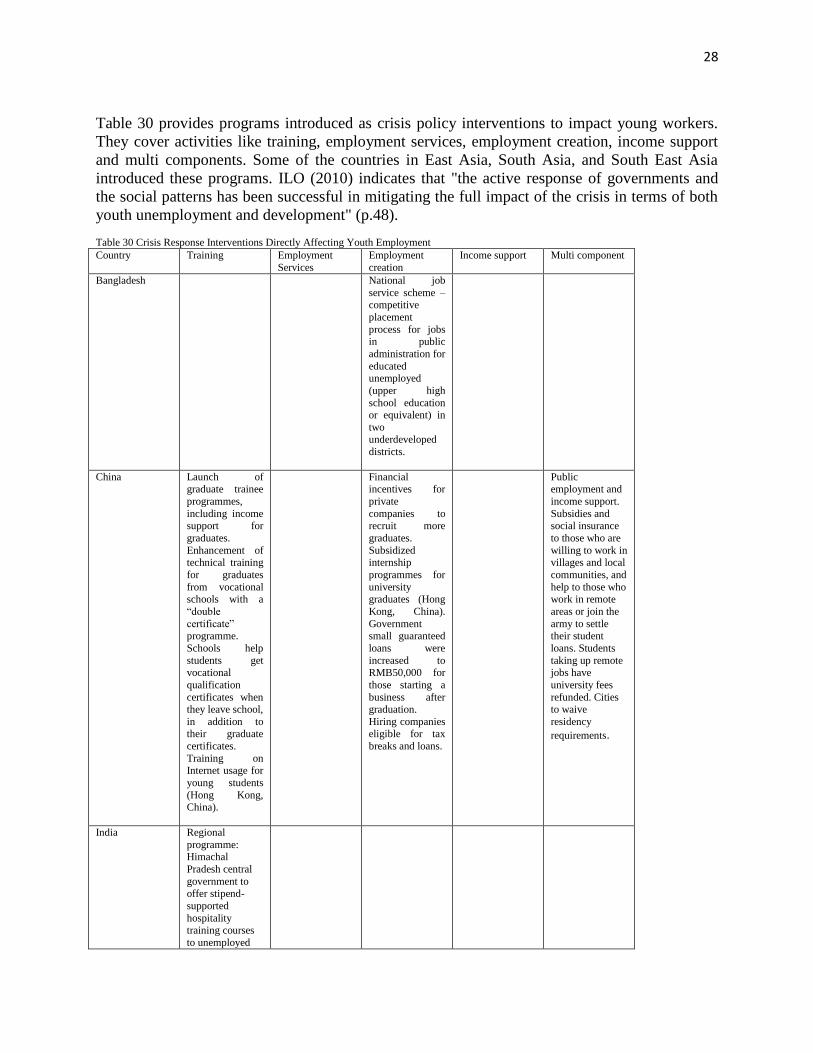
28
Table 30 provides programs introduced as crisis policy interventions to impact young workers.
They cover activities like training, employment services, employment creation, income support
and multi components. Some of the countries in East Asia, South Asia, and South East Asia
introduced these programs. ILO (2010) indicates that "the active response of governments and
the social patterns has been successful in mitigating the full impact of the crisis in terms of both
youth unemployment and development" (p.48).
Table 30 Crisis Response Interventions Directly Affecting Youth Employment
Country Training Employment
Services
Employment
creation
Income support Multi component
Bangladesh National job
service scheme – competitive
placement
process for jobs in public
administration for
educated unemployed
(upper high
school education or equivalent) in
two underdeveloped
districts.
China Launch of
graduate trainee
programmes,
including income support for
graduates.
Enhancement of technical training
for graduates
from vocational schools with a
“double
certificate” programme.
Schools help
students get vocational
qualification
certificates when they leave school,
in addition to their graduate
certificates.
Training on Internet usage for
young students
(Hong Kong, China).
Financial
incentives for
private
companies to recruit more
graduates.
Subsidized internship
programmes for
university graduates (Hong
Kong, China).
Government small guaranteed
loans were
increased to RMB50,000 for
those starting a
business after graduation.
Hiring companies eligible for tax
breaks and loans.
Public
employment and
income support.
Subsidies and social insurance
to those who are
willing to work in villages and local
communities, and
help to those who work in remote
areas or join the
army to settle their student
loans. Students
taking up remote jobs have
university fees
refunded. Cities to waive
residency
requirements.
India Regional
programme: Himachal
Pradesh central
government to offer stipend-
supported
hospitality training courses
to unemployed
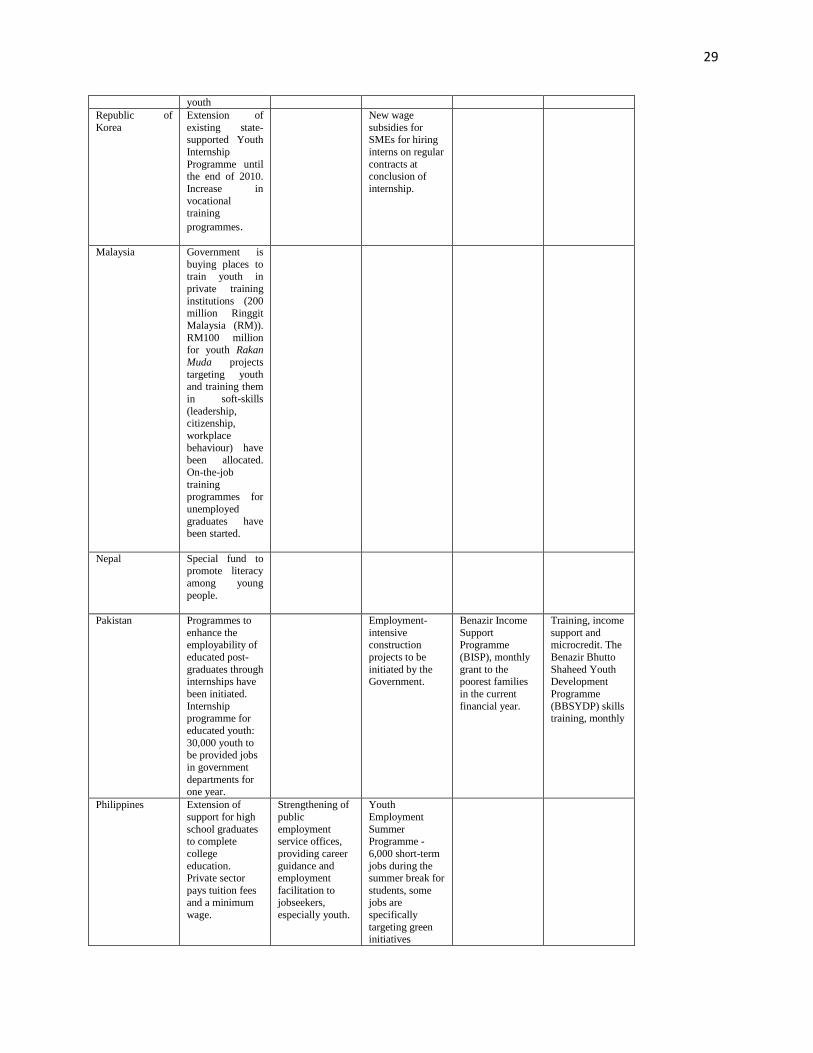
29
youth
Republic of
Korea
Extension of
existing state-supported Youth
Internship
Programme until the end of 2010.
Increase in
vocational training
programmes.
New wage
subsidies for SMEs for hiring
interns on regular
contracts at conclusion of
internship.
Malaysia Government is
buying places to train youth in
private training
institutions (200 million Ringgit
Malaysia (RM)).
RM100 million for youth Rakan
Muda projects
targeting youth and training them
in soft-skills
(leadership, citizenship,
workplace
behaviour) have been allocated.
On-the-job
training
programmes for
unemployed
graduates have been started.
Nepal Special fund to promote literacy
among young
people.
Pakistan Programmes to
enhance the employability of
educated post-
graduates through internships have
been initiated.
Internship programme for
educated youth:
30,000 youth to be provided jobs
in government
departments for one year.
Employment-
intensive construction
projects to be
initiated by the Government.
Benazir Income
Support Programme
(BISP), monthly
grant to the poorest families
in the current
financial year.
Training, income
support and microcredit. The
Benazir Bhutto
Shaheed Youth Development
Programme
(BBSYDP) skills training, monthly
Philippines Extension of
support for high
school graduates to complete
college
education. Private sector
pays tuition fees and a minimum
wage.
Strengthening of
public
employment service offices,
providing career
guidance and employment
facilitation to jobseekers,
especially youth.
Youth
Employment
Summer Programme -
6,000 short-term
jobs during the summer break for
students, some jobs are
specifically
targeting green initiatives
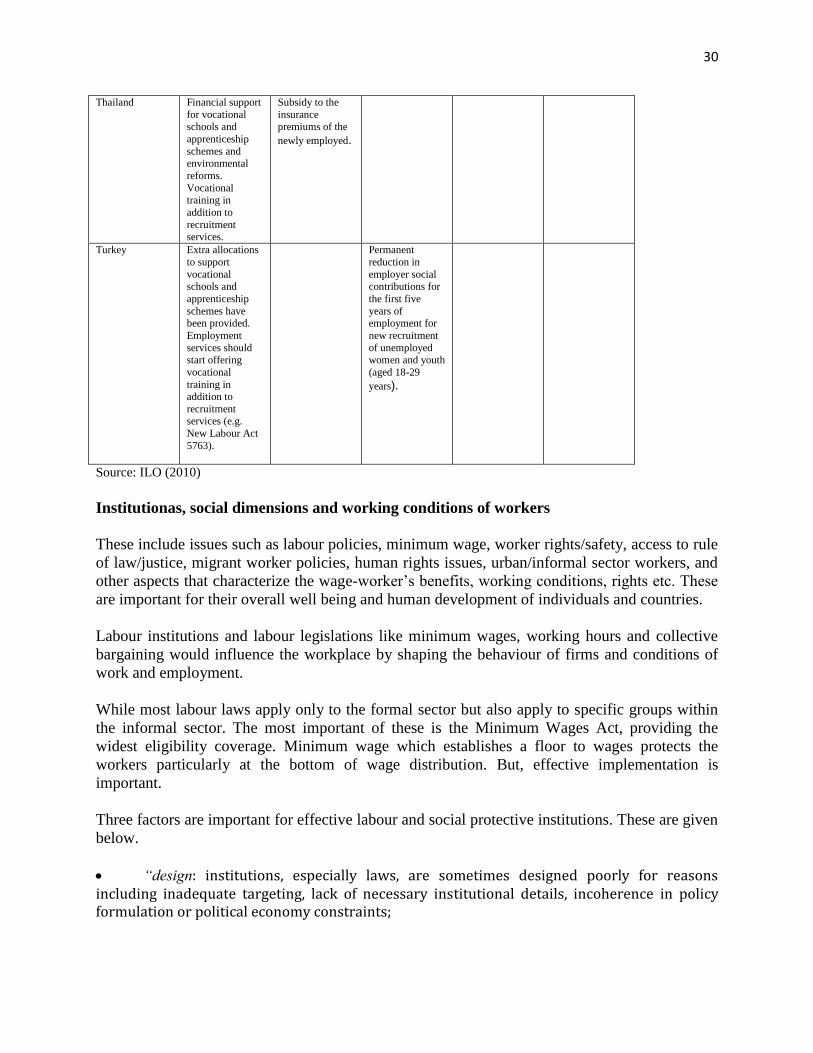
30
Thailand Financial support
for vocational schools and
apprenticeship
schemes and environmental
reforms.
Vocational training in
addition to
recruitment services.
Subsidy to the
insurance premiums of the
newly employed.
Turkey Extra allocations
to support
vocational schools and
apprenticeship
schemes have been provided.
Employment
services should start offering
vocational
training in addition to
recruitment services (e.g.
New Labour Act
5763).
Permanent
reduction in
employer social contributions for
the first five
years of employment for
new recruitment
of unemployed women and youth
(aged 18-29
years).
Source: ILO (2010)
Institutionas, social dimensions and working conditions of workers
These include issues such as labour policies, minimum wage, worker rights/safety, access to rule
of law/justice, migrant worker policies, human rights issues, urban/informal sector workers, and
other aspects that characterize the wage-worker’s benefits, working conditions, rights etc. These
are important for their overall well being and human development of individuals and countries.
Labour institutions and labour legislations like minimum wages, working hours and collective
bargaining would influence the workplace by shaping the behaviour of firms and conditions of
work and employment.
While most labour laws apply only to the formal sector but also apply to specific groups within
the informal sector. The most important of these is the Minimum Wages Act, providing the
widest eligibility coverage. Minimum wage which establishes a floor to wages protects the
workers particularly at the bottom of wage distribution. But, effective implementation is
important.
Three factors are important for effective labour and social protective institutions. These are given
below.
“design: institutions, especially laws, are sometimes designed poorly for reasons including inadequate targeting, lack of necessary institutional details, incoherence in policy formulation or political economy constraints;
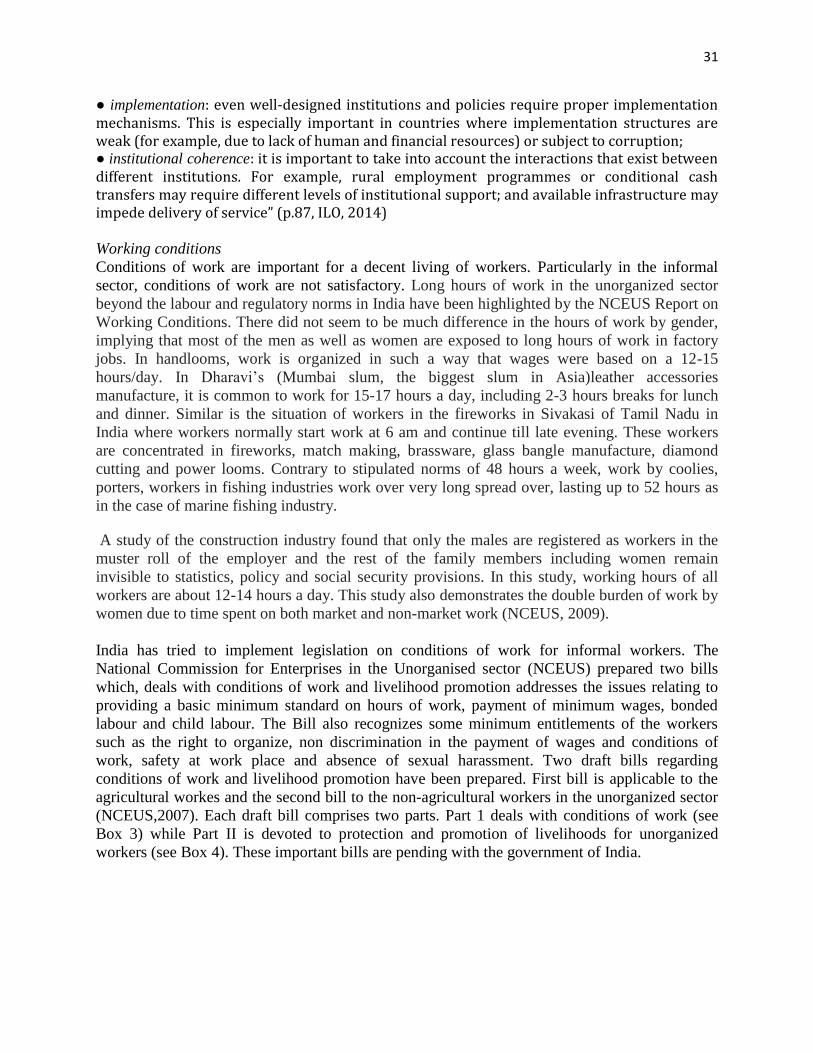
31
● implementation: even well-designed institutions and policies require proper implementation mechanisms. This is especially important in countries where implementation structures are weak (for example, due to lack of human and financial resources) or subject to corruption; ● institutional coherence: it is important to take into account the interactions that exist between different institutions. For example, rural employment programmes or conditional cash transfers may require different levels of institutional support; and available infrastructure may impede delivery of service” (p.87, ILO, 2014)
Working conditions
Conditions of work are important for a decent living of workers. Particularly in the informal
sector, conditions of work are not satisfactory. Long hours of work in the unorganized sector
beyond the labour and regulatory norms in India have been highlighted by the NCEUS Report on
Working Conditions. There did not seem to be much difference in the hours of work by gender,
implying that most of the men as well as women are exposed to long hours of work in factory
jobs. In handlooms, work is organized in such a way that wages were based on a 12-15
hours/day. In Dharavi’s (Mumbai slum, the biggest slum in Asia)leather accessories
manufacture, it is common to work for 15-17 hours a day, including 2-3 hours breaks for lunch
and dinner. Similar is the situation of workers in the fireworks in Sivakasi of Tamil Nadu in
India where workers normally start work at 6 am and continue till late evening. These workers
are concentrated in fireworks, match making, brassware, glass bangle manufacture, diamond
cutting and power looms. Contrary to stipulated norms of 48 hours a week, work by coolies,
porters, workers in fishing industries work over very long spread over, lasting up to 52 hours as
in the case of marine fishing industry.
A study of the construction industry found that only the males are registered as workers in the
muster roll of the employer and the rest of the family members including women remain
invisible to statistics, policy and social security provisions. In this study, working hours of all
workers are about 12-14 hours a day. This study also demonstrates the double burden of work by
women due to time spent on both market and non-market work (NCEUS, 2009).
India has tried to implement legislation on conditions of work for informal workers. The
National Commission for Enterprises in the Unorganised sector (NCEUS) prepared two bills
which, deals with conditions of work and livelihood promotion addresses the issues relating to
providing a basic minimum standard on hours of work, payment of minimum wages, bonded
labour and child labour. The Bill also recognizes some minimum entitlements of the workers
such as the right to organize, non discrimination in the payment of wages and conditions of
work, safety at work place and absence of sexual harassment. Two draft bills regarding
conditions of work and livelihood promotion have been prepared. First bill is applicable to the
agricultural workes and the second bill to the non-agricultural workers in the unorganized sector
(NCEUS,2007). Each draft bill comprises two parts. Part 1 deals with conditions of work (see
Box 3) while Part II is devoted to protection and promotion of livelihoods for unorganized
workers (see Box 4). These important bills are pending with the government of India.
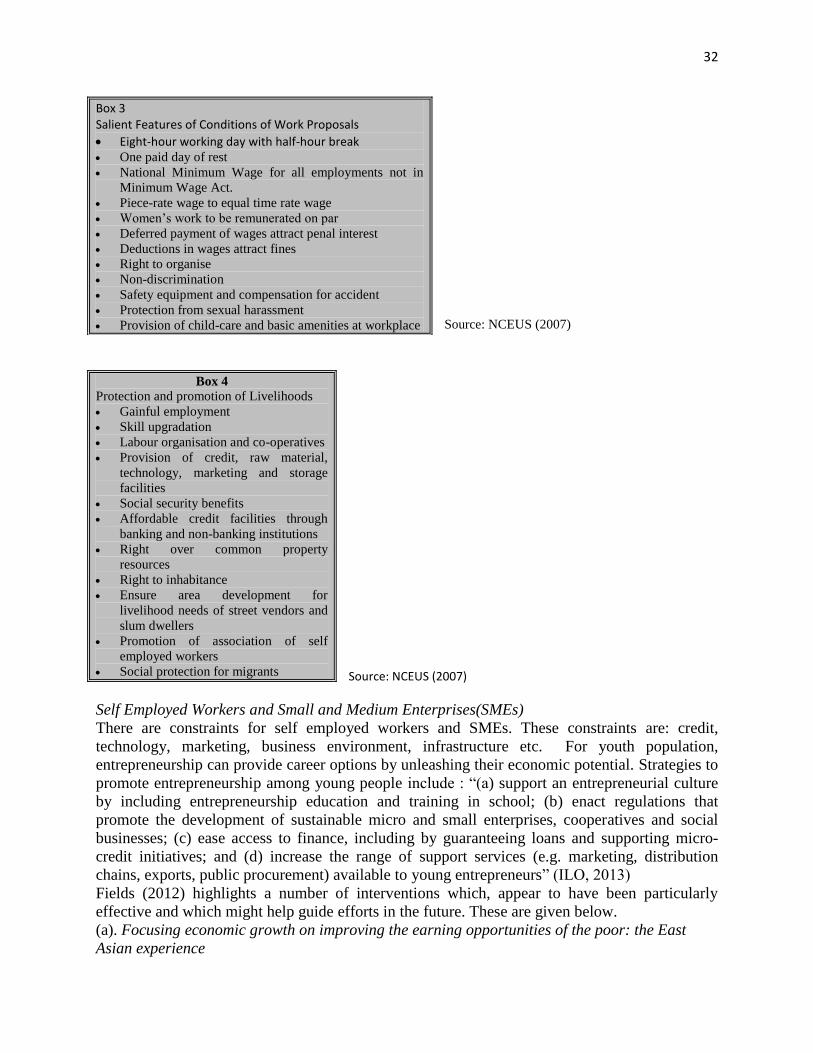
32
Source: NCEUS (2007)
Source: NCEUS (2007)
Self Employed Workers and Small and Medium Enterprises(SMEs)
There are constraints for self employed workers and SMEs. These constraints are: credit,
technology, marketing, business environment, infrastructure etc. For youth population,
entrepreneurship can provide career options by unleashing their economic potential. Strategies to
promote entrepreneurship among young people include : “(a) support an entrepreneurial culture
by including entrepreneurship education and training in school; (b) enact regulations that
promote the development of sustainable micro and small enterprises, cooperatives and social
businesses; (c) ease access to finance, including by guaranteeing loans and supporting micro-
credit initiatives; and (d) increase the range of support services (e.g. marketing, distribution
chains, exports, public procurement) available to young entrepreneurs” (ILO, 2013)
Fields (2012) highlights a number of interventions which, appear to have been particularly
effective and which might help guide efforts in the future. These are given below.
(a). Focusing economic growth on improving the earning opportunities of the poor: the East
Asian experience
Box 3 Salient Features of Conditions of Work Proposals
Eight-hour working day with half-hour break One paid day of rest
National Minimum Wage for all employments not in
Minimum Wage Act.
Piece-rate wage to equal time rate wage
Women’s work to be remunerated on par
Deferred payment of wages attract penal interest
Deductions in wages attract fines
Right to organise
Non-discrimination
Safety equipment and compensation for accident
Protection from sexual harassment
Provision of child-care and basic amenities at workplace
Box 4
Protection and promotion of Livelihoods
Gainful employment
Skill upgradation
Labour organisation and co-operatives
Provision of credit, raw material,
technology, marketing and storage
facilities
Social security benefits
Affordable credit facilities through
banking and non-banking institutions
Right over common property
resources
Right to inhabitance
Ensure area development for
livelihood needs of street vendors and
slum dwellers
Promotion of association of self
employed workers
Social protection for migrants
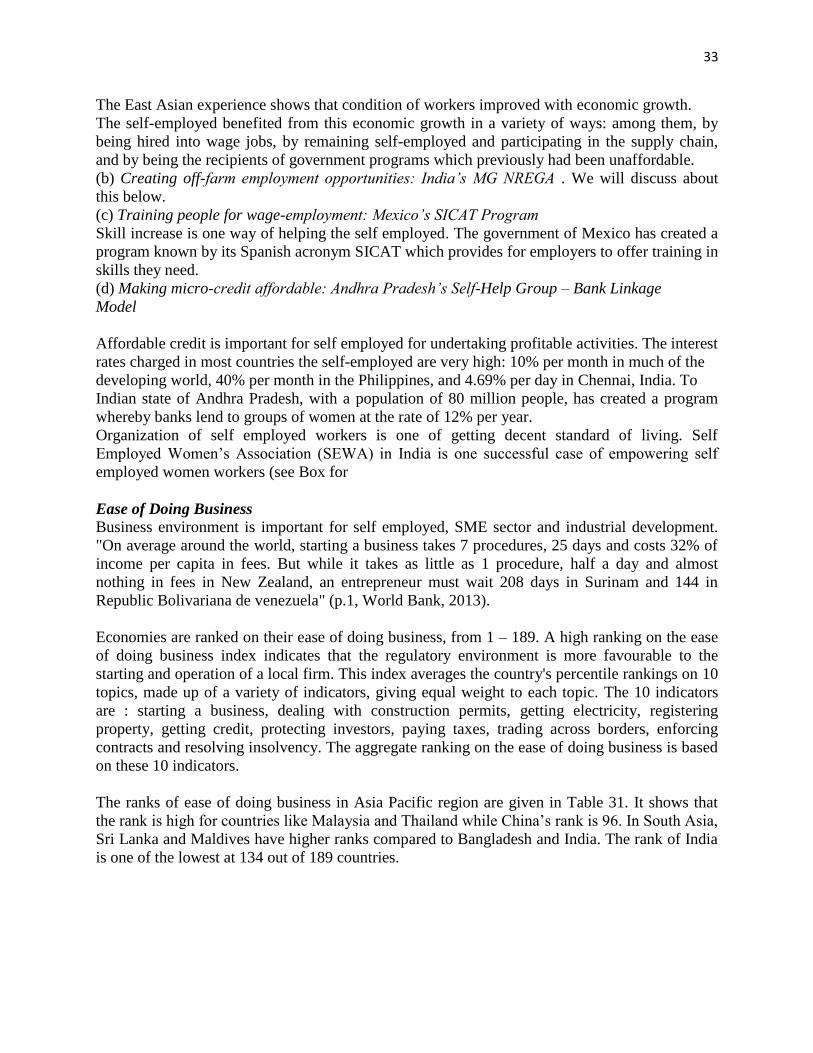
33
The East Asian experience shows that condition of workers improved with economic growth.
The self-employed benefited from this economic growth in a variety of ways: among them, by
being hired into wage jobs, by remaining self-employed and participating in the supply chain,
and by being the recipients of government programs which previously had been unaffordable.
(b) Creating off-farm employment opportunities: India’s MG NREGA . We will discuss about
this below.
(c) Training people for wage-employment: Mexico’s SICAT Program
Skill increase is one way of helping the self employed. The government of Mexico has created a
program known by its Spanish acronym SICAT which provides for employers to offer training in
skills they need.
(d) Making micro-credit affordable: Andhra Pradesh’s Self-Help Group – Bank Linkage
Model
Affordable credit is important for self employed for undertaking profitable activities. The interest
rates charged in most countries the self-employed are very high: 10% per month in much of the
developing world, 40% per month in the Philippines, and 4.69% per day in Chennai, India. To
Indian state of Andhra Pradesh, with a population of 80 million people, has created a program
whereby banks lend to groups of women at the rate of 12% per year.
Organization of self employed workers is one of getting decent standard of living. Self
Employed Women’s Association (SEWA) in India is one successful case of empowering self
employed women workers (see Box for
Ease of Doing Business
Business environment is important for self employed, SME sector and industrial development.
"On average around the world, starting a business takes 7 procedures, 25 days and costs 32% of
income per capita in fees. But while it takes as little as 1 procedure, half a day and almost
nothing in fees in New Zealand, an entrepreneur must wait 208 days in Surinam and 144 in
Republic Bolivariana de venezuela" (p.1, World Bank, 2013).
Economies are ranked on their ease of doing business, from 1 – 189. A high ranking on the ease
of doing business index indicates that the regulatory environment is more favourable to the
starting and operation of a local firm. This index averages the country's percentile rankings on 10
topics, made up of a variety of indicators, giving equal weight to each topic. The 10 indicators
are : starting a business, dealing with construction permits, getting electricity, registering
property, getting credit, protecting investors, paying taxes, trading across borders, enforcing
contracts and resolving insolvency. The aggregate ranking on the ease of doing business is based
on these 10 indicators.
The ranks of ease of doing business in Asia Pacific region are given in Table 31. It shows that
the rank is high for countries like Malaysia and Thailand while China’s rank is 96. In South Asia,
Sri Lanka and Maldives have higher ranks compared to Bangladesh and India. The rank of India
is one of the lowest at 134 out of 189 countries.
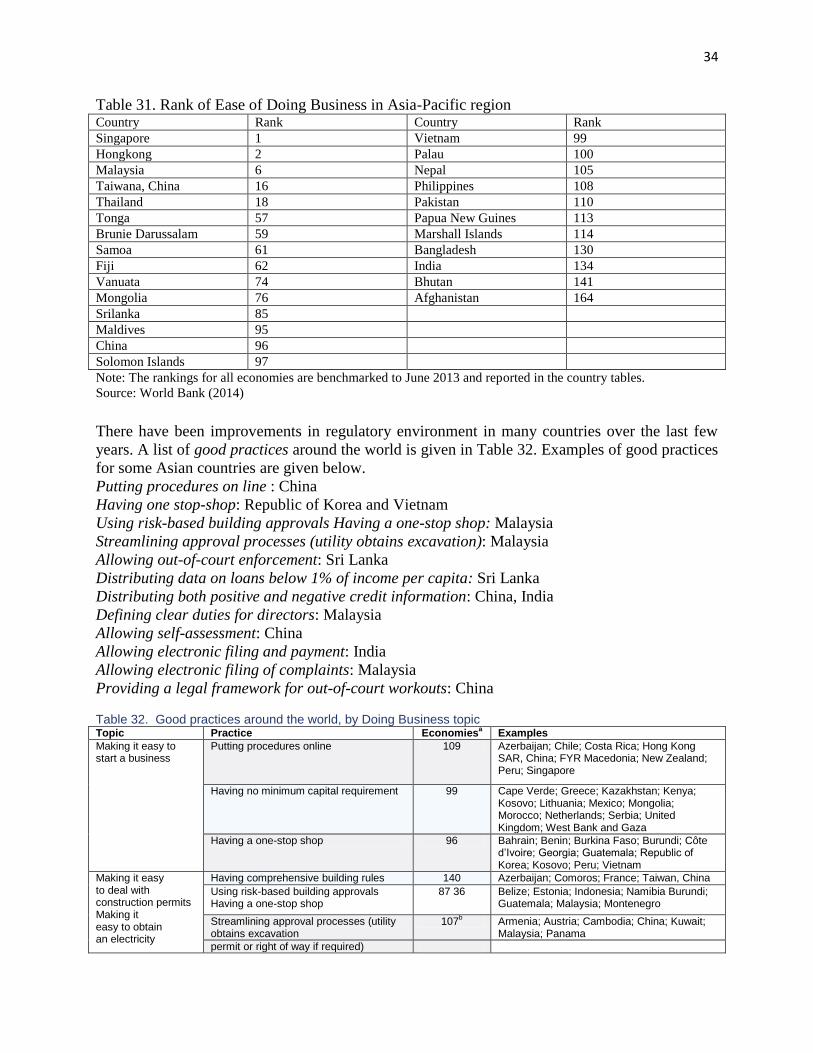
34
Table 31. Rank of Ease of Doing Business in Asia-Pacific region Country Rank Country Rank
Singapore 1 Vietnam 99
Hongkong 2 Palau 100
Malaysia 6 Nepal 105
Taiwana, China 16 Philippines 108
Thailand 18 Pakistan 110
Tonga 57 Papua New Guines 113
Brunie Darussalam 59 Marshall Islands 114
Samoa 61 Bangladesh 130
Fiji 62 India 134
Vanuata 74 Bhutan 141
Mongolia 76 Afghanistan 164
Srilanka 85
Maldives 95
China 96
Solomon Islands 97
Note: The rankings for all economies are benchmarked to June 2013 and reported in the country tables.
Source: World Bank (2014)
There have been improvements in regulatory environment in many countries over the last few
years. A list of good practices around the world is given in Table 32. Examples of good practices
for some Asian countries are given below.
Putting procedures on line : China
Having one stop-shop: Republic of Korea and Vietnam
Using risk-based building approvals Having a one-stop shop: Malaysia
Streamlining approval processes (utility obtains excavation): Malaysia
Allowing out-of-court enforcement: Sri Lanka
Distributing data on loans below 1% of income per capita: Sri Lanka
Distributing both positive and negative credit information: China, India
Defining clear duties for directors: Malaysia
Allowing self-assessment: China
Allowing electronic filing and payment: India
Allowing electronic filing of complaints: Malaysia
Providing a legal framework for out-of-court workouts: China Table 32. Good practices around the world, by Doing Business topic Topic Practice Economies
a Examples
Making it easy to start a business
Putting procedures online 109 Azerbaijan; Chile; Costa Rica; Hong Kong SAR, China; FYR Macedonia; New Zealand; Peru; Singapore
Having no minimum capital requirement 99 Cape Verde; Greece; Kazakhstan; Kenya; Kosovo; Lithuania; Mexico; Mongolia; Morocco; Netherlands; Serbia; United Kingdom; West Bank and Gaza
Having a one-stop shop 96 Bahrain; Benin; Burkina Faso; Burundi; Côte d’Ivoire; Georgia; Guatemala; Republic of Korea; Kosovo; Peru; Vietnam
Making it easy to deal with construction permits Making it easy to obtain an electricity
Having comprehensive building rules 140 Azerbaijan; Comoros; France; Taiwan, China
Using risk-based building approvals Having a one-stop shop
87 36 Belize; Estonia; Indonesia; Namibia Burundi; Guatemala; Malaysia; Montenegro
Streamlining approval processes (utility obtains excavation
107b Armenia; Austria; Cambodia; China; Kuwait;
Malaysia; Panama
permit or right of way if required)
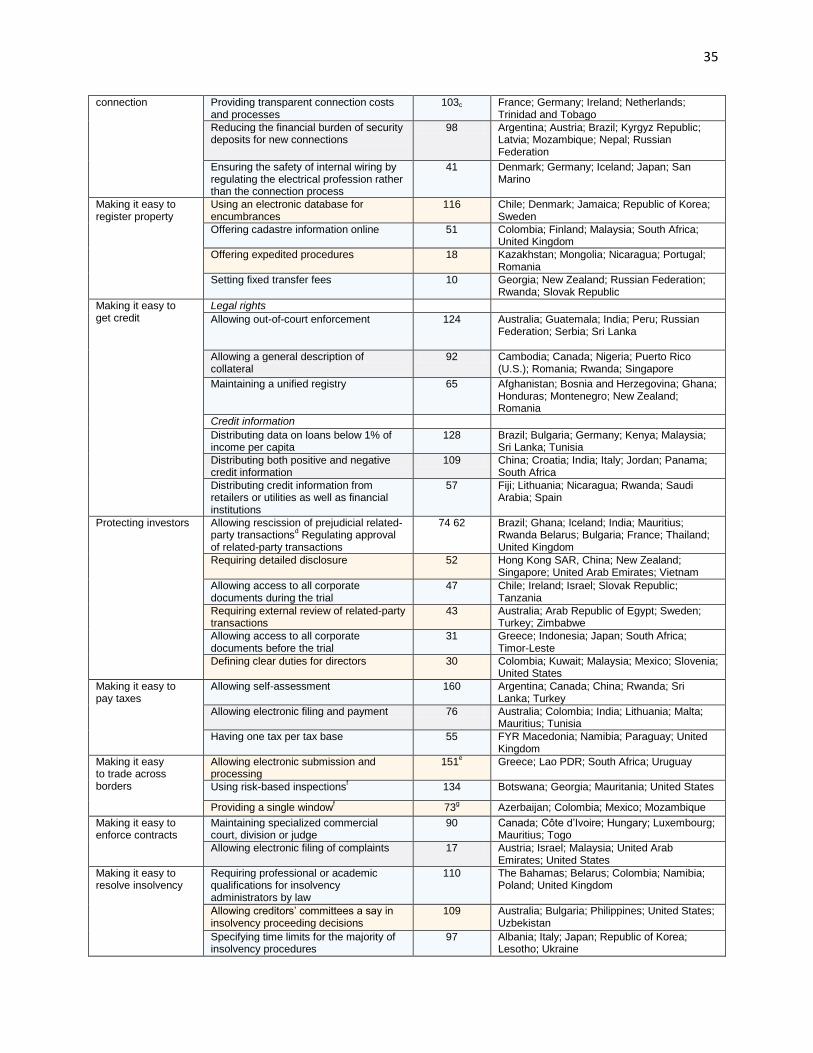
35
connection Providing transparent connection costs and processes
103c France; Germany; Ireland; Netherlands; Trinidad and Tobago
Reducing the financial burden of security deposits for new connections
98 Argentina; Austria; Brazil; Kyrgyz Republic; Latvia; Mozambique; Nepal; Russian Federation
Ensuring the safety of internal wiring by regulating the electrical profession rather than the connection process
41 Denmark; Germany; Iceland; Japan; San Marino
Making it easy to register property
Using an electronic database for encumbrances
116 Chile; Denmark; Jamaica; Republic of Korea; Sweden
Offering cadastre information online 51 Colombia; Finland; Malaysia; South Africa; United Kingdom
Offering expedited procedures 18 Kazakhstan; Mongolia; Nicaragua; Portugal; Romania
Setting fixed transfer fees 10 Georgia; New Zealand; Russian Federation; Rwanda; Slovak Republic
Making it easy to get credit
Legal rights
Allowing out-of-court enforcement 124 Australia; Guatemala; India; Peru; Russian Federation; Serbia; Sri Lanka
Allowing a general description of collateral
92 Cambodia; Canada; Nigeria; Puerto Rico (U.S.); Romania; Rwanda; Singapore
Maintaining a unified registry 65 Afghanistan; Bosnia and Herzegovina; Ghana; Honduras; Montenegro; New Zealand; Romania
Credit information
Distributing data on loans below 1% of income per capita
128 Brazil; Bulgaria; Germany; Kenya; Malaysia; Sri Lanka; Tunisia
Distributing both positive and negative credit information
109 China; Croatia; India; Italy; Jordan; Panama; South Africa
Distributing credit information from retailers or utilities as well as financial institutions
57 Fiji; Lithuania; Nicaragua; Rwanda; Saudi Arabia; Spain
Protecting investors Allowing rescission of prejudicial related-party transactions
d Regulating approval
of related-party transactions
74 62 Brazil; Ghana; Iceland; India; Mauritius; Rwanda Belarus; Bulgaria; France; Thailand; United Kingdom
Requiring detailed disclosure 52 Hong Kong SAR, China; New Zealand; Singapore; United Arab Emirates; Vietnam
Allowing access to all corporate documents during the trial
47 Chile; Ireland; Israel; Slovak Republic; Tanzania
Requiring external review of related-party transactions
43 Australia; Arab Republic of Egypt; Sweden; Turkey; Zimbabwe
Allowing access to all corporate documents before the trial
31 Greece; Indonesia; Japan; South Africa; Timor-Leste
Defining clear duties for directors 30 Colombia; Kuwait; Malaysia; Mexico; Slovenia; United States
Making it easy to pay taxes
Allowing self-assessment 160 Argentina; Canada; China; Rwanda; Sri Lanka; Turkey
Allowing electronic filing and payment 76 Australia; Colombia; India; Lithuania; Malta; Mauritius; Tunisia
Having one tax per tax base 55 FYR Macedonia; Namibia; Paraguay; United Kingdom
Making it easy to trade across borders
Allowing electronic submission and processing
151e Greece; Lao PDR; South Africa; Uruguay
Using risk-based inspectionsf 134 Botswana; Georgia; Mauritania; United States
Providing a single windowf 73
g Azerbaijan; Colombia; Mexico; Mozambique
Making it easy to enforce contracts
Maintaining specialized commercial court, division or judge
90 Canada; Côte d’Ivoire; Hungary; Luxembourg; Mauritius; Togo
Allowing electronic filing of complaints 17 Austria; Israel; Malaysia; United Arab Emirates; United States
Making it easy to resolve insolvency
Requiring professional or academic qualifications for insolvency administrators by law
110 The Bahamas; Belarus; Colombia; Namibia; Poland; United Kingdom
Allowing creditors’ committees a say in insolvency proceeding decisions
109 Australia; Bulgaria; Philippines; United States; Uzbekistan
Specifying time limits for the majority of insolvency procedures
97 Albania; Italy; Japan; Republic of Korea; Lesotho; Ukraine
36
Providing a legal framework for out-of-court workouts
84 Argentina; Hong Kong SAR, China; Latvia; Philippines; Romania
a. Among 189 economies surveyed, unless otherwise specified. b. Among 154 economies surveyed. c. Based on data from Doing Business 2013. d. Rescission is the right of parties involved in a contract to return to a state identical to that before they entered into the agreement. e. Forty-four have a full electronic data interchange system, 107 a partial one. f. Among 181 economies surveyed. g. Eighteen have a single-window system that links all relevant government agencies, 55 a system that does so partially. Source: World Bank (2014)
Migrant workers
Mobility in the labor market may be across sectors, occupations, work statuses, and location. On
Geographical migration is the most important and complex one. Regarding internal migration,
Indian experience shows that distress migration by the rural poor, due to lack of local livelihood
opportunities, is most common. In India, Census and National Sample Survey mainly identify
permanent and semi-permanent migration but fail to capture seasonal migration, the magnitude
of which is both large and growing (Srivastava, 2011). Only primary surveys tend to reveal the
high incidence of migration that is seasonal, intermittent, circular or temporary. There has been
increase in migration in Bihar state of India over time (see Box 5)
Box 5. Increase of Migration in Bihar, India Recent longitudinal survey data of the IHD's (Institute for Human Development) Bihar Research
Programme shows that more than one-fourth of all workers constituted out-migrants in 2010 in the state.
It also reveals that there has been a substantial increase in the incidence of migration from rural areas over
the last decades. The percentage of migrant workers to total workers in Bihar increased from 9.7% in
1981-82 to 19% in 1999-00 and 27% in 2009-10.
Source: IHD (2014)
According to a study, that there could be about 80 million migrant labourers concentrated in the
non-agricultural sector (Srivastava, 2011). These numbers are still smaller than the recent
estimates of labour migration in China. However, they contribute a very large proportion of the
waged and self employed workers in the non-agricultural informal economy. Irrespective of
urban or rural areas, men migrate into non-agricultural work. Urban women migrants are
generally absorbed in the services setor, often as domestic help. The basic human rights of such
workers are often violated and a coherent policy which could support migrant workers needs to
be formulated and implemented (Srivastava, 2011).
Turning to international migration, during the 1990-2000 decade, South-North migration was the
main driver of increase in migration at global level. However, during the decade 2000-2013,
migration flows within the South region contribute 57% to the global flows. South Asian
countries to gulf region contributed bulk of the South-South migration (ILO,2014a).
As ILO (2014a) says that the increase in South-South migration has coincided with the increased
incidence of abuse and exploitation of low skilled workers particularly in the gulf countries.
Asian migrant workers in the gulf are vulnerable to exploitation and face significant abuse of
workers' rights, including forced overtime, delayed wages, poor working and living conditions,
and limited access to health care. There are also issues of trafficking and forced labour. Box 6
provides abuses of migrant workers in gulf countries.
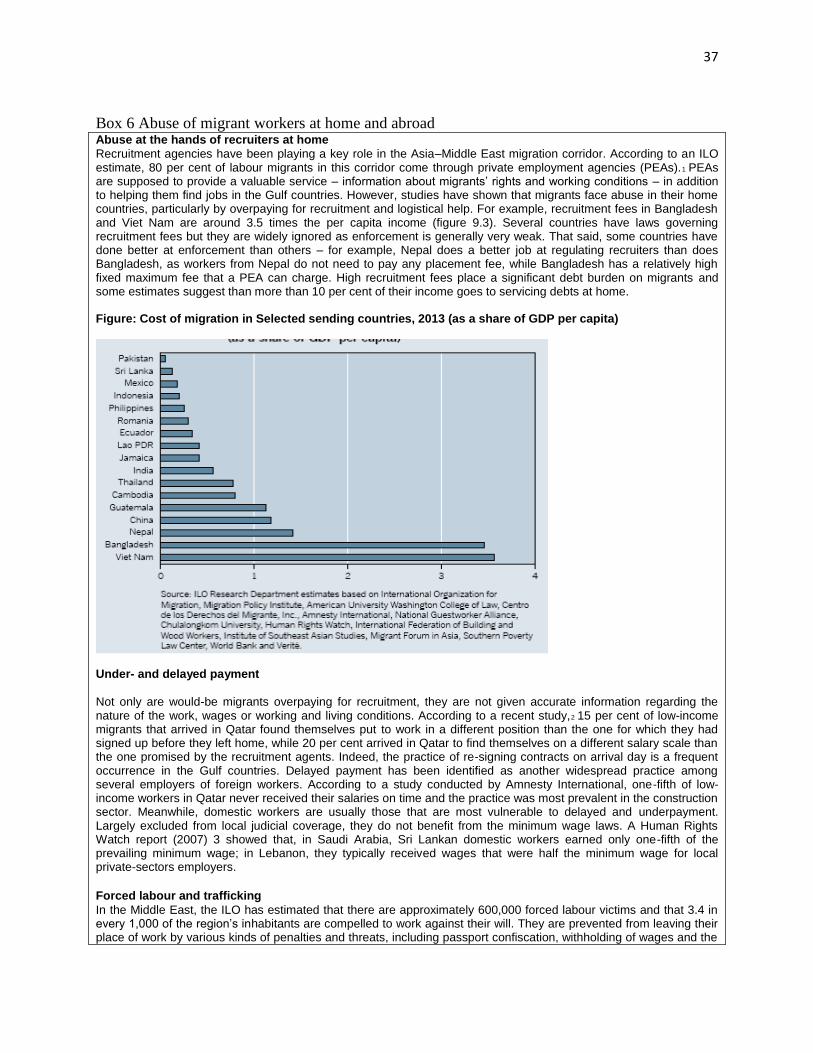
37
Box 6 Abuse of migrant workers at home and abroad Abuse at the hands of recruiters at home
Recruitment agencies have been playing a key role in the Asia–Middle East migration corridor. According to an ILO estimate, 80 per cent of labour migrants in this corridor come through private employment agencies (PEAs).1 PEAs are supposed to provide a valuable service – information about migrants’ rights and working conditions – in addition to helping them find jobs in the Gulf countries. However, studies have shown that migrants face abuse in their home countries, particularly by overpaying for recruitment and logistical help. For example, recruitment fees in Bangladesh and Viet Nam are around 3.5 times the per capita income (figure 9.3). Several countries have laws governing recruitment fees but they are widely ignored as enforcement is generally very weak. That said, some countries have done better at enforcement than others – for example, Nepal does a better job at regulating recruiters than does Bangladesh, as workers from Nepal do not need to pay any placement fee, while Bangladesh has a relatively high fixed maximum fee that a PEA can charge. High recruitment fees place a significant debt burden on migrants and some estimates suggest than more than 10 per cent of their income goes to servicing debts at home. Figure: Cost of migration in Selected sending countries, 2013 (as a share of GDP per capita)
Under- and delayed payment
Not only are would-be migrants overpaying for recruitment, they are not given accurate information regarding the nature of the work, wages or working and living conditions. According to a recent study,2 15 per cent of low-income migrants that arrived in Qatar found themselves put to work in a different position than the one for which they had signed up before they left home, while 20 per cent arrived in Qatar to find themselves on a different salary scale than the one promised by the recruitment agents. Indeed, the practice of re-signing contracts on arrival day is a frequent occurrence in the Gulf countries. Delayed payment has been identified as another widespread practice among several employers of foreign workers. According to a study conducted by Amnesty International, one-fifth of low-income workers in Qatar never received their salaries on time and the practice was most prevalent in the construction sector. Meanwhile, domestic workers are usually those that are most vulnerable to delayed and underpayment. Largely excluded from local judicial coverage, they do not benefit from the minimum wage laws. A Human Rights Watch report (2007) 3 showed that, in Saudi Arabia, Sri Lankan domestic workers earned only one-fifth of the prevailing minimum wage; in Lebanon, they typically received wages that were half the minimum wage for local private-sectors employers. Forced labour and trafficking
In the Middle East, the ILO has estimated that there are approximately 600,000 forced labour victims and that 3.4 in every 1,000 of the region’s inhabitants are compelled to work against their will. They are prevented from leaving their place of work by various kinds of penalties and threats, including passport confiscation, withholding of wages and the
38
use of psychological, physical and sexual violence. Other research shows that, in Qatar, 90 per cent of the respondents to the survey reported having their passports confiscated by employers. The report from Amnesty International in 2013 4 also suggested that dozens of construction workers were prevented from leaving the country and were trapped in Qatar. In addition to threats from employer, the sponsorship system called kafala 5 fuels exploitation and forced labour. The kafala system is used in all of the six Gulf Cooperation Council (GCC) states and keeps the worker’s visa and legal status tied to the employer, which severely constrains workers’ mobility. Health and safety issues
There have been several incidents of workplace accidents in the Middle East that have brought healthy and safety issues (long hours, inadequate supply of water, limited access to health facilities, etc.) to the fore. For example, in 2012, 276 Nepali workers died in Qatar, 20 per cent of whom died at their workplace. According to the research done by Amnesty International, workers in the construction sector are the most vulnerable to workplace accidents, due in no small part to demanding hours in hot weather. Furthermore, the study showed that some employers penalized their workers (through pay cuts) for taking medical leave. In addition to the risky working conditions, migrant workers are also facing significant challenges in trying to access the local health services.6 One study showed that 56 per cent of the workers in Qatar lacked a government-mandated “health card” for accessing health care in the state’s public health system. Degrading living conditions
Migrant workers in the Middle East are often housed by their sponsors in dormitorystyle blocks called “labour camps”. Evidence from various field studies has shown that most of them live in unacceptable and degrading conditions: with overflowing sewage, septic tanks left uncovered, lack of power and clean water, missing or malfunctioning air conditioning, etc.7 The working and living conditions for migrant workers in Qatar have even been described as “modern-day slavery”.8 In Doha, it is routine for between ten and 15 workers to sleep in one small room. Similarly, in Dubai, a township of more than 150,000 migrant workers lies between a waste dump and a cemetery. The accommodation unit looks like prison block with six or more men living in each of the 3 × 3 metre rooms, where they sleep on the floor. It should be noted that, given the harsh criticisms in the global media, some countries such as Qatar and the United Arab Emirates have started to take action to improve the working conditions of migrant workers.9
1 Harroff-Tavel and Nasri (2013). 2 A survey of 1,189 low-income migrant workers in Qatar carried out by a study funded by the Qatar National Research Fund, published in the Journal of Arabian Studies, June 2013, pp. 1–17. 3 Human Rights Watch conducted research in 2006, based on in-depth interviews with 100 women migrant domestic workers from Sri Lanka and published their findings in the report: Exported and exposed. 4 Amnesty International carried out research in Qatar, from October 2012 to March 2013, interviewing 210 male construction workers, 47 women domestic workers and 32 workers from other sectors. 5 ITUC (International Trade Union Confederation), 2011. 6 International Organization for Migration- Migration Policy Institute Issue in Brief No. 2 – Asian Labour Migrants and Health: Exploring Policy Routes, 2012. 7 Amnesty International research in Qatar. 8 In a statement issued by ITUC’s General Secretary during the International Labour Conference in Geneva, 2012. 9 ITUC, 2011. Source: ILO (2014 a)
On the positive side, international migration has improved remittances to many developing
countries. Empirical analysis shows that remittances are a strong determinant of savings and
investments. Studies have shown that there is a link between remittances and development in
terms of poverty reduction, health and educational improvements and, local development (ILO,
2014a).
Fair migration: There is a need to have policies for fair migration and decent work for migrants.
Some of these measures are: (a) promoting decent work in countries of origin making migration
an option rather than obligation; (b) formulating orderly and fair migration schemes in regional
integration processes; (c) promoting bilateral agreements for well regulated and fair migration
between member states (d) instituting fair recruitment processes (e) countering unacceptable
situations; (f) realizing the rights based approach (g) contributing to a strengthened multilateral
rights based agenda on migration; (h) tripartism, knowledge and capacity building as cross
cutting issues; (i) introducing measures to improve pre-departure information; (j) continuing to
provide assistance to migrants while abroad; (k) reintegration upon return; (k) incentive scheme
for investment in the form of preferential treatment for migrants that buy land, build business,
invest in machinery and equipment etc (ILO, 2014c). These measures are needed for decent work
of migrants in international as well as internal migration.
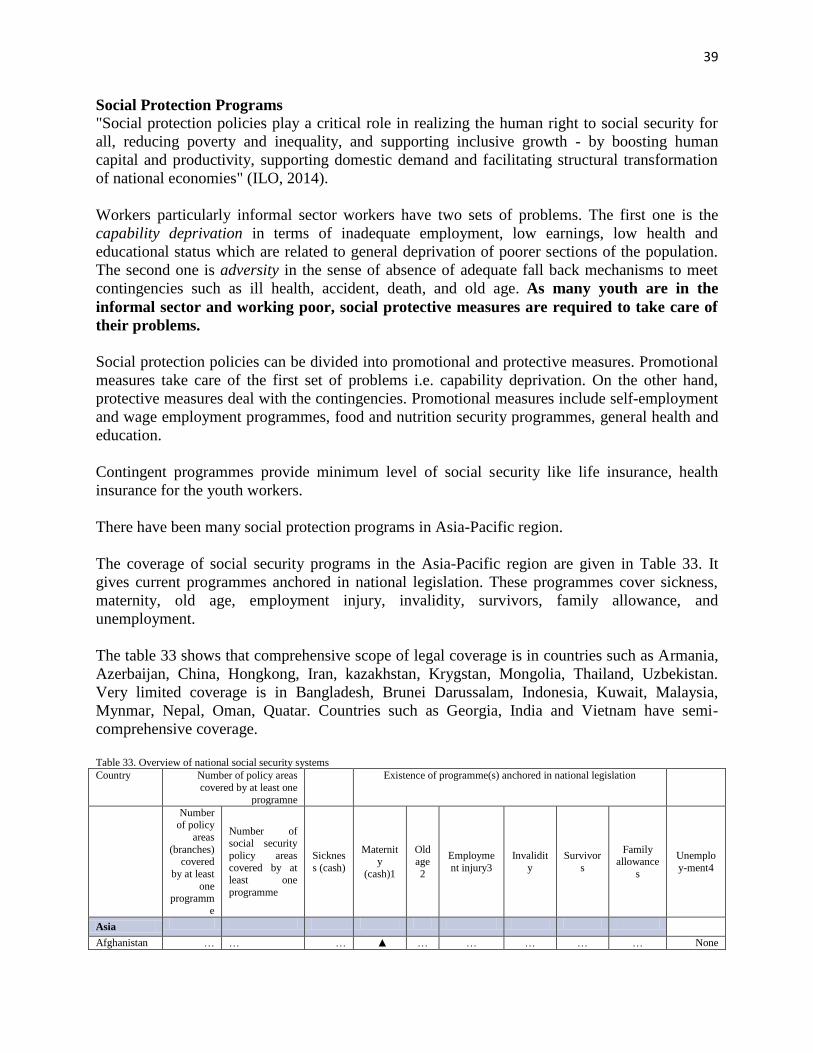
39
Social Protection Programs
"Social protection policies play a critical role in realizing the human right to social security for
all, reducing poverty and inequality, and supporting inclusive growth - by boosting human
capital and productivity, supporting domestic demand and facilitating structural transformation
of national economies" (ILO, 2014).
Workers particularly informal sector workers have two sets of problems. The first one is the
capability deprivation in terms of inadequate employment, low earnings, low health and
educational status which are related to general deprivation of poorer sections of the population.
The second one is adversity in the sense of absence of adequate fall back mechanisms to meet
contingencies such as ill health, accident, death, and old age. As many youth are in the
informal sector and working poor, social protective measures are required to take care of
their problems.
Social protection policies can be divided into promotional and protective measures. Promotional
measures take care of the first set of problems i.e. capability deprivation. On the other hand,
protective measures deal with the contingencies. Promotional measures include self-employment
and wage employment programmes, food and nutrition security programmes, general health and
education.
Contingent programmes provide minimum level of social security like life insurance, health
insurance for the youth workers.
There have been many social protection programs in Asia-Pacific region.
The coverage of social security programs in the Asia-Pacific region are given in Table 33. It
gives current programmes anchored in national legislation. These programmes cover sickness,
maternity, old age, employment injury, invalidity, survivors, family allowance, and
unemployment.
The table 33 shows that comprehensive scope of legal coverage is in countries such as Armania,
Azerbaijan, China, Hongkong, Iran, kazakhstan, Krygstan, Mongolia, Thailand, Uzbekistan.
Very limited coverage is in Bangladesh, Brunei Darussalam, Indonesia, Kuwait, Malaysia,
Mynmar, Nepal, Oman, Quatar. Countries such as Georgia, India and Vietnam have semi-
comprehensive coverage.
Table 33. Overview of national social security systems
Country Number of policy areas
covered by at least one
programne
Existence of programme(s) anchored in national legislation
Number of policy
areas
(branches) covered
by at least
one programm
e
Number of social security
policy areas
covered by at
least one
programme
Sicknes
s (cash)
Maternity
(cash)1
Old age
2
Employme
nt injury3
Invalidit
y
Survivor
s
Family allowance
s
Unemplo
y-ment4
Asia
Afghanistan … … … ▲ … … … … … None
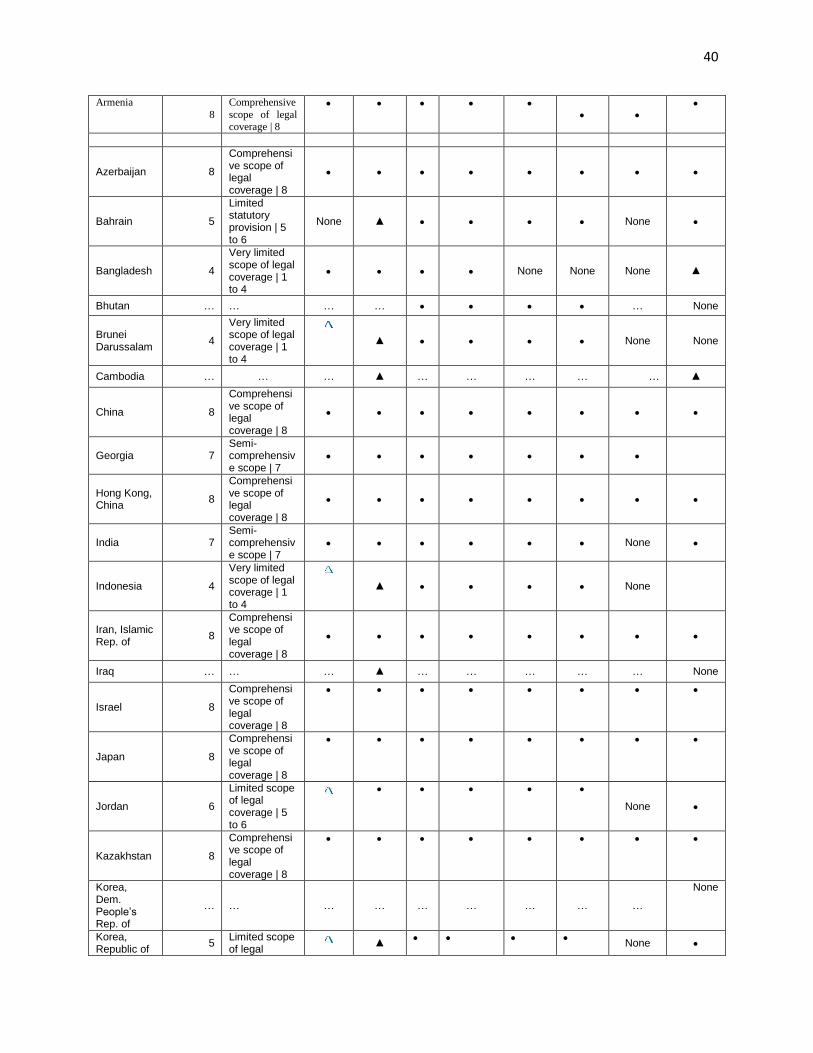
40
Armenia
8
Comprehensive
scope of legal coverage | 8
Azerbaijan 8
Comprehensive scope of legal coverage | 8
Bahrain 5
Limited statutory provision | 5 to 6
None ▲ None
Bangladesh 4
Very limited scope of legal coverage | 1 to 4
None None None ▲
Bhutan … … … … … None
Brunei Darussalam
4
Very limited scope of legal coverage | 1 to 4
▲ None None
Cambodia … … … ▲ … … … … … ▲
China 8
Comprehensive scope of legal coverage | 8
Georgia 7 Semi-comprehensive scope | 7
Hong Kong, China
8
Comprehensive scope of legal coverage | 8
India 7 Semi-comprehensive scope | 7
None
Indonesia 4
Very limited scope of legal coverage | 1 to 4
▲ None
Iran, Islamic Rep. of
8
Comprehensive scope of legal coverage | 8
Iraq … … … ▲ … … … … … None
Israel 8
Comprehensive scope of legal coverage | 8
Japan 8
Comprehensive scope of legal coverage | 8
Jordan 6
Limited scope of legal coverage | 5 to 6
None
Kazakhstan 8
Comprehensive scope of legal coverage | 8
Korea, Dem. People’s Rep. of
… … … … … … … … …
None
Korea, Republic of
5 Limited scope of legal
▲
None
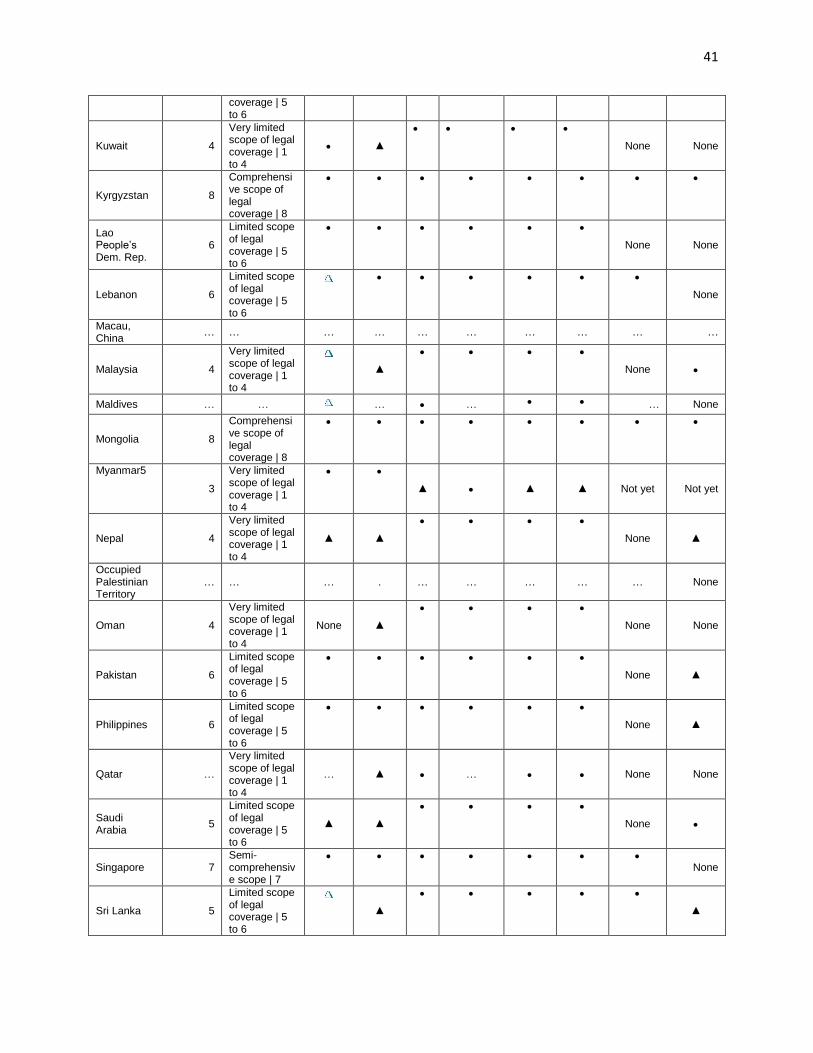
41
coverage | 5 to 6
Kuwait 4
Very limited scope of legal coverage | 1 to 4
▲
None None
Kyrgyzstan 8
Comprehensive scope of legal coverage | 8
Lao People’s Dem. Rep.
6
Limited scope of legal coverage | 5 to 6
None None
Lebanon 6
Limited scope of legal coverage | 5 to 6
None
Macau, China
… … … … … … … … … …
Malaysia 4
Very limited scope of legal coverage | 1 to 4
▲
None
Maldives … … … … … None
Mongolia 8
Comprehensive scope of legal coverage | 8
Myanmar5
3
Very limited scope of legal coverage | 1 to 4
▲ ▲ ▲ Not yet Not yet
Nepal 4
Very limited scope of legal coverage | 1 to 4
▲ ▲
None ▲
Occupied Palestinian Territory
… … … . … … … … … None
Oman 4
Very limited scope of legal coverage | 1 to 4
None ▲
None None
Pakistan 6
Limited scope of legal coverage | 5 to 6
None ▲
Philippines 6
Limited scope of legal coverage | 5 to 6
None ▲
Qatar …
Very limited scope of legal coverage | 1 to 4
… ▲ … None None
Saudi Arabia
5
Limited scope of legal coverage | 5 to 6
▲ ▲
None
Singapore 7 Semi-comprehensive scope | 7
None
Sri Lanka 5
Limited scope of legal coverage | 5 to 6
▲
▲
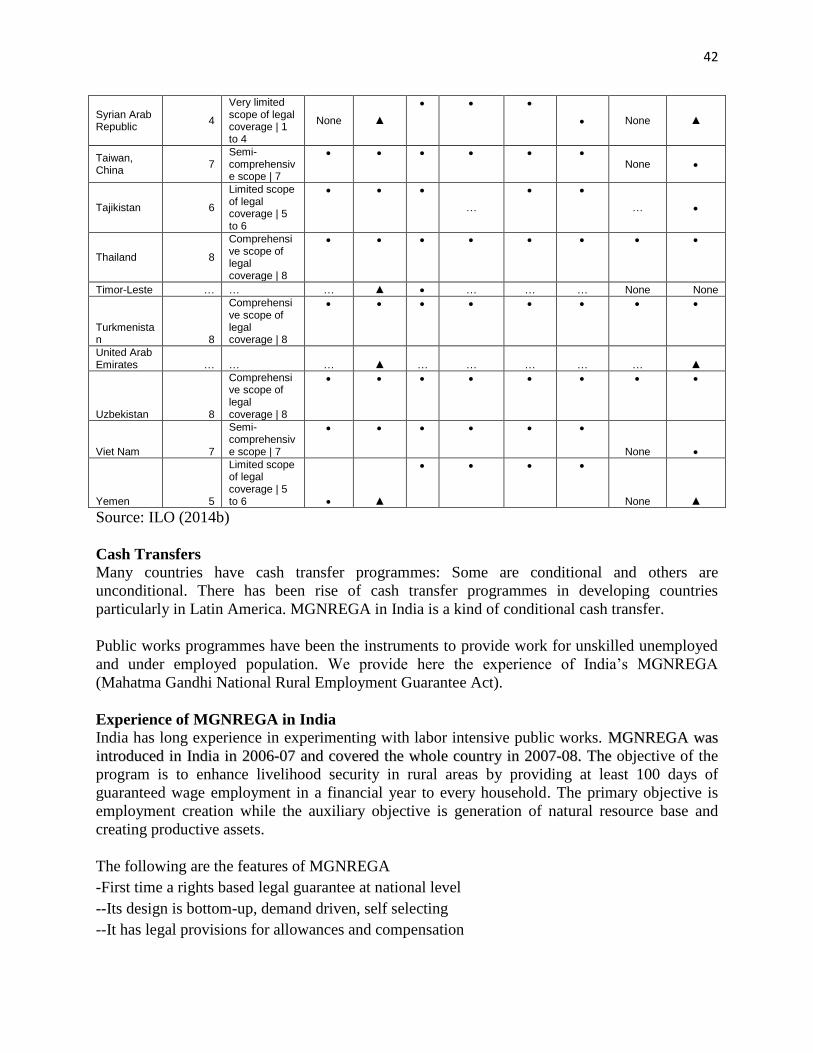
42
Syrian Arab Republic
4
Very limited scope of legal coverage | 1 to 4
None ▲
None ▲
Taiwan, China
7 Semi-comprehensive scope | 7
None
Tajikistan 6
Limited scope of legal coverage | 5 to 6
…
…
Thailand 8
Comprehensive scope of legal coverage | 8
Timor-Leste … … … ▲ … … … None None
Turkmenistan 8
Comprehensive scope of legal coverage | 8
United Arab Emirates … … … ▲ … … … … … ▲
Uzbekistan 8
Comprehensive scope of legal coverage | 8
Viet Nam 7
Semi-comprehensive scope | 7
None
Yemen 5
Limited scope of legal coverage | 5 to 6 ▲
None ▲
Source: ILO (2014b)
Cash Transfers
Many countries have cash transfer programmes: Some are conditional and others are
unconditional. There has been rise of cash transfer programmes in developing countries
particularly in Latin America. MGNREGA in India is a kind of conditional cash transfer.
Public works programmes have been the instruments to provide work for unskilled unemployed
and under employed population. We provide here the experience of India’s MGNREGA
(Mahatma Gandhi National Rural Employment Guarantee Act).
Experience of MGNREGA in India
India has long experience in experimenting with labor intensive public works. MMGGNNRREEGGAA wwaass
iinnttrroodduucceedd iinn IInnddiiaa iinn 22000066--0077 aanndd ccoovveerreedd tthhee wwhhoollee ccoouunnttrryy iinn 22000077--0088.. TThhee objective of the
program is to enhance livelihood security in rural areas by providing at least 100 days of
guaranteed wage employment in a financial year to every household. The primary objective is
employment creation while the auxiliary objective is generation of natural resource base and
creating productive assets.
The following are the features of MGNREGA
-First time a rights based legal guarantee at national level
--Its design is bottom-up, demand driven, self selecting
--It has legal provisions for allowances and compensation
43
--It incentivizes states to provide employment as 100% of unskilled labor cost and 75% material
cost are done by centre
--It has integrated natural resource management and livelihoods generation perspective
--Resources to states are transferred based on demand rather than just transfering resources on
some formula
--The order of devolution of financial resources to Gram Panchayats is unprecedented
--Social audit creates unprecedented accountability
-- A report on the outcome of the scheme is presented annually to the Indian Parliament and
State legislatures
There are direct benefits and indirect benefits. There can be ten benefits due to MGNREGA as
given below.
1. Creation of wage employment to the beneficiaries. It provides income and livelihood
security which can have impact on increase in consumption and food security and
nutrition, reduction in poverty and hunger. It can also have positive impact on health and
education.
2. According to some of the NREGA workers, the most important benefit according to
workers is self respect. Earlier they were dependent only on landlords for agriculture
work. Landlords were monopoly. The workers now feel that they are liberated from some
kind of bonded labour. Now they have alternative employment and they feel they have
self respect now. Bargaining of power workers increased.
3. Asset creation which benefits agricultural and rural development and environmental
protection.
4. Positive impact on agriculture wages
5. Impact on women’s empowerment
6. Helping the marginalized sections like Scheduled Castes and Scheduled Tribes
7. Reduction in distress migration
8. Seasonal benefits and insurance function
9. Financial inclusion
10. Strengthening grass root processes of democracy infusing transparency and
accountability in governance. Particularly involvement and strengthening panachayats.
Similarly social audit can improve governance.
There are thousands of research studies and evaluations on MGNREGA. The employment
creation peaked in 2009-10. More than 2.8 billion person days were created at the national level.
Thereafter it declined. The households provided employment increased from 21 million
households in 2006-7 to 55 million households in 2010-11 and declined subsequently. So, in the
last two to three years the employment created declined.
The macro studies and micro surveys provide a mixed picture on the ten benefits of MGMREGA
in different parts of the country. It has a positive impact on livelihood and food security,
nutrition, agriculture wages have increased, assets were created in some areas, it has impact on
44
women empowerment and marginalized sections, reduced migration, it had acted as insurance
function, financial inclusion increased, in some areas panchayat involvement and improvement
in grass root level democracy.
But, in a vast country like India, the benefits are even. Performance has been good in some states
and not doing well in some other states. For example, Andhra Pradesh, Tamil Nadu, Tripura
have done well. In fact in states where NREGA is needed like Bihar, Jharkhand, U.P. Orissa,
NREGA is not doing well.
It is true that there are many problems in NREGA: corruption, inadequate implementation where
most of the rules guiding the program are ignored, delayed payments, lack of social audit and
accountability. If properly implemented, the potential benefits as the ten benefits listed above are
large. It can be used not only as social protection program but also as rural transformation
program which would help the youth in rural areas. There is also a demand for including skill
based activities in MGNREGA.
There are many social protection programs in many countries of the Asia-Pacific region.
However, the impact of several programs on the beneficiaries is far from satisfactory. The need
for effective implementation of the programs through proper governance is obvious.
Reintegrating Unemployed workers into the labour market
Measures are needed to help unemployed particularly mothers with young children return to
work. Developed countries and developing countries have taken measures to integrate or
reintegrate unemployed workers into the labour market. For example, Pakistan has introduced
Benazir Income Support Programme (BISP) in 2009. The programme supports women in poor
households with cash and in-kind social services. This measure facilitates the employment of
parents particularly women with young children.
Employment Injury
One of the oldest benefits of social security is employment injury. Only around 34 per cent of
labour force is covered by law for employment injury through mandatory and social insurance
(ILO, 2014b). There have been significant deaths and injuries to employees due to accidents. For
example, a disaster occurred at Rana Plaza in Dhaka, Bangladesh in April 2013. Rana Plaza
housed five garments factories which collapsed killing over 1000 workers and injuring 2,500
workers. Low and middle income countries have very low coverage and there is a need to
improve coverage on employment injury including social insurance.
Disability benefits
Around 15 per cent of the world are disabled population. The key messages of disability benefits
are the following.
" Effective measures to support persons with disabilities in finding and retaining quality employment
are a key element of non-discriminatory and inclusive policies that help to realize their rights and
aspirations as productive members of society.
Complementing contributory schemes, non-contributory disability benefits play a key role in protecting
45
those persons with disabilities who have not (yet) earned entitlements to contributory schemes, in
particular those disabled from birth or before working age, and those who for any reason have not
had the opportunity to contribute to social insurance for long enough to be eligible for benefits.
Activation policies can play an important role in supporting persons with disabilities in finding suitable
employment. They should be designed in such a way that they protect the rights of those who,
for various reasons, are not able to find suitable employment, and for whom the introduction of such
policies may result in a reduction of income security and potentially higher risk of poverty.
Policy reforms should therefore pay special attention to finding the right balance between supporting
engagement in employment and providing an adequate level of income security for persons with disabilities" (p.53,
ILO, (2014b))
Recently, policies have been made to bring beneficiaries of disability benefits to return to work
which strengthen the employability of population with disabilities. Social protection helps in
gaining access to employment for the disabled.
Maternity Cash Benefits
Maternity cash benefits are an important part of social security. These benefits ensure income
security for pregnant women and mothers of new born children and their families. It also leads to
effective access to quality maternal health care. At the global level, less than 40% of women in
employment are covered by maternity benefits under the law. But, it is much lower in some
regions such as Asia-Pacific, Africa and Latin America, An increasing number of countries have
introduced non-contributory maternity cash benefits. For example, in Asia Bangladesh, India
and Indonesia, they are linked to certain conditions. Ensuring maternal benefits and quality
maternal health care are of importance particularly in countries with large informal employment.
Programmes for old age population
In many countries, old age pensions are accessible mainly to formal sector and majority of
workers in informal sector workers do not have these pensions. Many countries have tried to
expand coverage of contributory pension schemes and non-contributory pensions to guarantee
basic income security guarantee to all old age population. Old age effective coverage shows that
India has 7.4% as compared to China’s 46.4% coverage. Income security for old people depends
also on their access to social services including health care and long term care.
Health Coverage
Health coverage is important for improving for human development. Several countries are now
supporting universal coverage of health for their population and workers. "In developing
countries the economic returns on investing in health are estimated at 24 per cent of economic
growth between 2000 and 2011, taking into account increases in both national income and life
years gained" (The Lancet Commission, 2013 quoted in ILO, 2014b, p.100). The extent of
health coverage as percentage of total population was 1.4% in Bangladesh, 12.5% in India, 59%
in Indonesia, 96.9% in China and 100% in Republic of Korea. Other countries in the region
should learn from East Asia and some countries in South East Asia on how to have effective
health coverage. "Today, the principle of universal health coverage has gained momentum and
the UN General Assembly has asked the WHO and other UN agencies, including the ILO, to
46
give high priority to working jointly towards universal health coverage in the context of wider
approach to social protection, in consultation with UN Member States" (ILO, 2014b).
Social Protection and Poverty Reduction
Social protection policies led to poverty reduction in many developing countries. The social
protection policies in Argentina and Brazil reduced poverty. Similarly, MGNREGA increased
real wages of agricultural labourers which in turn reduced rural poverty in India.
Need for Social Protection Floor
It has been recognized that all countries should have social protection floor. According to ILO
(2014a), there are three reasons why social protection is needed. These are: (a) human right; (b)
social and political necessity; (c) economic necessity. Investing in social protection leads to
healthy, productive and equitable society.
4.2. Indirect Measures for Improving Youth employment
Pro employment Macroeconomic policies
Appropriate macro policies are important for generating employment for youth. Investments are
needed for higher growth which can improve employment if invested in labour intensive sectors.
Both public and private investments are important. Macro policies such as trade, fiscal and
monetary policies should promote employment by providing appropriate policies and
institutions.
Monetary stimulus in advanced countries helped preventing worse outcomes. In response to the
global crisis developed countries reduced short term lending rates. These measures prevented a
larger fall in employment. However, the extended period of low interest rates and
unconventional monetary policy measures seem to have adverse effects on employment by
encouraging capital intensive industries (ILO, 2014). In other words, monetary policies might
have indirectly contributed to observed weaknesses in labour market and increased inequality.
The share of wages in output has declined. ILO (2014) argues for addressing weak aggregate
demand through improved labour incomes and less fiscal consolidation. Similulations of ILO
show that employment-friendly policies are likely lead to improvements in the labour market,
without harming fiscal sustainability disproportionately.
Macro policies that enhance strong aggregate demand, raise productive investment and improve
access to finance can have a positive impact employment prospects of youth workers (Box 7).
Box 7. Approaches to boost aggregate demand and promote youth employment Policies that promote employment-centred and sustainable growth are vital if young people are to be given a fair
chance at a decent job. Youth labour market outcomes are closely related to overall employment trends but are more
sensitive to the business cycle. A boost in aggregate demand is key to addressing the youth employment crisis as this
will create more job opportunities for young people. ILO research shows that macroeconomic policies can influence
youth employment by:
(a) encouraging economic diversification and productive transformation;
(b) reducing macroeconomic volatility by engaging in timely and targeted countercyclical policies;
(c) loosening constraints on private sector growth, with a particular emphasis on access to finance for
micro, small and medium-sized enterprises;
47
(d) focusing on targeted demand-side interventions with particular impact on youth employment (e.g.
labour intensive infrastructure works, public employment programmes, wage and training subsidies); and
(e)ensuring adequate and predictable funding for targeted youth employment interventions.
Source: ILO (p.62, 2013).
Macroeconomic policies can enhance youth employment by encouraging economic
diversification and the development of sectors that can create jobs for youth.
For example, in India, policies that promote manufacturing sector can improve productive
employment for youth. However, agriculture growth also has to be improved as it provides
employment to 50% of the work force. Crop sector can’t absorb any more workers but allied
activities and agro processing etc. can absorb some of the growing labour force. Global
experience shows that GDP growth originating in agriculture is at least twice as effective in
reducing poverty as GDP growth originating outside agriculture. The index of total factor
productivity (TFP) in agriculture in India increased from 100 in 1961 to 170 in 2009. During the
same time it increased from 100 to 270 in Brazil, China and Indonesia. The yields of many crops
in India are lower than many countries. Thus, there is lot of opportunity for increase in TFP and
yields in India with appropriate price and non-price policies (technology and extension, water
management, marketing and rural infrastructure). Diversification of agriculture, focus on Eastern
and Central regions, increase in supply chains and links to agro processing can increase
productive employment. Higher agri. growth also increases rural non-farm sector because of
linkages.
Over time, however, as shown by the East Asian experience, we need labour intensive
manufacturing to shift workers from agriculture. The share of manufacturing employment in
India is only 13% as compared to 30 to 40% in East Asian countries in 2012. In a study of
comparison between manufacturing and services in India, Ramaswamy and Agarwal (2013)
suggest that “services sector would be an unlikely destination for the millions of low skilled job
seekers. India needs to focus on manufacturing sector to provide large scale employment.
Manufacturing has the capability because it has stronger backward linkages unlike the services
sector. We cannot afford to neglect manufacturing at this stage of development. The policy
signals have to clearly say that we stand to support manufacturing activity in a big way.” Labour
intensity of organizing manufacturing sector has to be improved apart from increasing the
productive employment in SMEs and unorganized manufacturing.
It does not mean that service sector has no potential to add to the growing labour force. In fact, a
study by Eichengreen and Gupta (2010) suggest a complementary relationship between
manufacturing and services as both are required to absorb India’s large additions to the labour
force. However, service sector has greater duality in terms of informality and wage inequality.
On the one hand, we have highly skilled activities like IT getting very high salaries. On the other
hand, we have low productive large informal sector getting very low incomes and wages.
Regarding international experience, a study by Pasha and Palanivel (2003) on Asian countries
show that the key macroeconomic determinants of the degree of pro-poor growth appear to be
the rates of employment and agricultural growth. The study argues, given the inflation rates, that
countries can be more flexible in their policy stance with regard to the adoption of more growth
oriented as opposed to stabilization policies. Developing countries should learn from China on
48
agricultural growth, rural non-farm employment, public investment and human development (see
Rao, 2005). The impact of growth on poverty reduction is quite significant in China. These
policies provide employment opportunities for youth.
As mentioned above, related one is the improvement in business environment in the region.
Easing obstacles for entrepreneurs is one of the important measures for creating more jobs for
youth. An enabling business climate, sound management, labour market reforms can provide
incentives for formal sector job creation.
Productive transformation and decent work
It may be noted diversified productive capacity and transformation are needed for creating
decent work. Just liberalizing trade may not be enough. Generally manufacturing sector is
associated with higher economic growth. Apart from manufacturing, agriculture, services,
natural resource management can also create quality employment. There is no single
development path and success stories can be found at all levels. Typically, extraction of natural
resources creates only a limited number of jobs. However, if properly managed, natural resource
extraction can create backward and forward linkages with the rest of the economy. This can
become an engine of broad based growth as shown by the developmental management of natural
resources in Malaysia. Diversify natural resource base by diversifying the scope of forest use
from timber to paper making and furniture production. The fiscal revenues from the
diversification can be used to build productive capabilities and employment. The case of
Malaysia shows that this can be a win-win situation.
High road approaches
Competitiveness among industries is a good thing but it should be viewed through the lens of
decent work. The Rana-Plaza tragedy in Bagladesh shows that there are risks if firms take a low-
road approach. In contrast, high road approach by following better workplace practices,
improving health and safety outcomes, boosting employee morale, focusing on environmentally-
sustainable production methods. These will help in successfully following high road strategies.
The ILO's Better Factories Cambodia programme shows that training services to help about
workers' skills have raised their productivity and contributed to enhanced enterprise
competitiveness. Monitoring of performance of Better Factories Cambodia over a decade
indicates that improved working conditions have gone hand in hand with enhanced
competitiveness and better economic results.
Education, Skill Improvement and Employability
Development economics now lays great importance on the concept of human capital. Education,
defined in terms of literacy rate and schooling levels (enrolment ratios - in primary and
secondary schools - mean years of schooling), is an important component of human capital.
These indicators proximately represent the level of human capital in society.
Education is the key determinant of employment prospects. There is a strong link between
educational attainment and employment outcomes, and people with higher levels of education
enjoy a competitive advantage in the labour market, including higher wage levels. The level of
human capital in terms of literacy, educational levels and specific skills raise the productivity
49
and incomes of workers in the labour market. Education is crucial for improving quality of
employment. There is inverse relationship between education level and jobless rates of 25-34 age
group in some of the South East Asian countries like Indonesia, Thailand and Philippines. In
Thailand, those without any education are five times more likely to be jobless than those having
completed a bachelor’s degree. Temporary work is disproportionately filled by younger, less-
educated workers.
Education and knowledge for the current generation (particularly for girl children) are likely to
be transmitted to their children and creating sustainable benefits to the society. Conditional cash
transfers for education in Latin American countries (e.g. Mexico) are another way of improving
education. We also programs like food for education in Bangladesh and mid-day meal scheme in
India
Apart from quantity, the quality of education is crucial. In India, Inspite of higher levels of
enrollment at all levels of education, and a massive rise in physical infrastructure, the value
added by formal education is still weak. “Poor quality of education resulting in weak learning
outcomes at each stage of education is the central challenge facing the Indian education sector
today” (p.49, 12th
Plan report). The learning outcomes are disturbingly low. Annual Status of
Education Report (ASER) 2012 of Pradham (one of the largest NGO working to improve quality
of education) indicates that more than more than half 53 of all children in Std. V were able to
read a Std. II level text in 2012. Similarly, 46% of children enrolled in Std. V were not able to
solve simple-two digit subtraction problems.
The facts on primary education reveal that school quality as measured by inputs and
infrastructure have improved while student learning levels are disturbingly low. The evidence
also shows that parents are moving their children to high fee charging private schools
(Muralidharan, 2013).
Structure of Pedagogy seems to be solution for translating these investments into learning
outcomes. Remedial instruction and the use of technology in the class room are relevant in the
South Asian context. Remedial programs can focus on those students who are lagging behind.
The teaching for these students can be at a level that is appropriate for their achievement. Several
research studies have shown strong impact of remedial instruction programs on learning
outcomes. Banerjee and Duflo (2011) also show that remedial programs improved student test
scores with most of the gains to the students with lower end of the class. The need for
improvement in quality applies also to secondary and tertiary education in India.
The nature of labour market has been transforming from unskilled to highly skilled. There has
been increasing demand for skilled labour and declining demand for the unskilled ones
especially in the non-agriculture sector. The level of human capital in terms of literacy,
educational levels and specific skills raise the productivity and incomes of workers in the labour
market.
The concept of employability is gaining momentum in the labour market literature. It indicates
the person’s capability of gaining initial employment, maintaining employment and moving to
new employment by choice. It depends on the knowledge, skills and attitudes possessed by the
50
individual, and also the labour market information (Weinert at al 2001). There is a changing
policy agenda related to labour market from the ‘job protection’ to ‘security through
employability’. The policy agenda needs to equip the job-seekers with skills that match the
demand in the market. It is definitely a challenge in the context of increasing pace of
globalization and technological change, both of which increase the job insecurity and job
displacement where the unskilled are getting excluded from the labour market. Skill formation
involves schooling, professional or technical education, and vocational training.
The main problem is the mismatch between the skills of young workers and the emerging
needs of the market. Education alone will not lead to employability unless workers are skilled.
Employability of youth has to be increased through skill development and vocational training.
The policies have to gear the system towards knowledge/ skills relevant for emerging labor
market demand. As mentioned below, India announced National Skill Development Council.
There are also lessons from advanced countries like Germany regarding training system. In
Germany, education and training simultaneously has improved the quality of youth employment.
Germany's ratio of youth to adult unemployment rates is about one to one which is a remarkable
achievement. One of the important ingredient of German system is the strong involvement of
employers in the provision of training which has labour market relevance (ADB, 2008).
Developing countries in Asia Pacific region can learn from specific design features of the system
in Germany. We have already mentioned above the programs in Asia Pacific region on skill
improvement.
4.3. Post-2015 Development Agenda and Employment
The progress on MDGs has been impressive but uneven across countries and within countries.
There have been significant achievements in some indicators such as poverty reduction,
education and gender equality. But, the progress on some other indicators such as malnutrition,
health, child and maternal mortality has been slow.
There have been some issues that have not been considered at the beginning when MDGs were
set. Some of these issues are: climate change and natural hazards, demographic transition,
increased migration, productive employment, social protection, peace and security, governance.
Of course continuation of many of the present MDGs is important. For example, My World
survey provides some clues on the people’s expectations about post-2015 development agenda.
In this survey, people were asked to choose six priorities out of 16 options. The top three
priorities are: (a) an honest and responsive government; (b) a good education and (c) better
health care (The Guardian, 2013). Other top priorities include food, water, better job
opportunities, protection from crime and violence and, protecting forests, rivers and oceans.
Following RIO+20 conference it is recognized that countries should have a holistic view of
combining economic, social and environmental goals for sustainable development. Recent
literature has suggested several approaches as a framework for post-2015 agenda2.
One of the missing things in the original agenda setting of MDGs in 2000 was productive
employment. The objective of achieving ‘full and productive employment and decent work’ was
2 See research papers from ODI and IDS Sussex. For example, see Koehler et al (2012), Karver et al (2012),
Melamed (2013), Melamed and Ludd (2013).
51
added to the MDGs in 2005 as one of the targets (target 1 B) of the first MDG goal to eradicate
extreme poverty and hunger (ILO, 2012). Under this there are four indicators for monitoring
progress. These are: (a) 1.4 growth rate of GDP per person employed; (b) 1.5. Employment to
population ratio; (c) 1.6 proportion of employed people living below $1 (ppp) per day; (d) 1.7.
proportion of own account and contributing family workers in total employment.
ILO (2012) argues for upgradation of the target on productive employment as a central goal of
the post-2015 development agenda. Setting it as a full and explicit goal and target will lead to
greater attention to this critical objective of productive employment.
At the global level, the thinking is that productive employment should be one of the focus areas
in post-2015 agenda. As ILO (2012) says ‘development happens through jobs’. In other words,
productive and decent employment is the best economies grow and diversify. As inequalities are
rising, creation of productive employment is the best way of achieving inclusive growth. The
report of the first thematic consultation on the post-2015 framework for development held at
Tokyo3 provides the thinking on employment and growth by the stakeholders. The meet
discussed both broad outlines of the new development agenda. Along with that, the meet also
discussed specific challenges and policies for growth, structural transformation and employment.
The consensus is that rather than growth, goals and targets on employment may be appropriate.
Some of the goals and targets are: progress for different population quintiles (poor people, the
unemployed, working poor in both formal and informal sectors), social protection, inclusive
forms of employment, women and chidren’s employment, technical, vocational and
entrepreneurial skills, structure of employment, access to natural resources, health and education
to workers and, green growth indicators could include a combination of change in pollution and
change in employment.
Decent jobs should be one of the goals in the post-2015 development agenda. Current MDGs
should be modified in order to capture improvements in the quality of jobs and workers’ lives,
and identify those who are excluded. For example, social protection plays a fundamental role in
creating more inclusive and sustainable development pathways. Because of its importance, an
indicator on social protection programmes has been widely proposed (ILO, 2014).
Full and productive employment and decent work under the post-2015 development framework
require a set of targets and indicators going beyond the existing MDG indicators. Some of the
indicators can be in the areas of working poor, youth unemployment, informality, female labour
force participation and social protection (ILO, 2014). They should be adapted according to
countries’ circumstances. Structural change in employment is an important indicator as it a major
driver of productivity increases as well as the creation of better jobs in developing economies.
Thinking of Policy Makers on Employment in India
The five year plans provide the thinking of the policies needed to face future development
challenges in India. The broad vision of India and the fresh perspective are reflected in the 12th
Five Year Plan’ sub-title “faster, sustainable and more inclusive growth’. It also indicates the
need for simultaneous achievement of these goals for the success of the plan. While striving for
3 The consultation was held in Tokyo during 15-16 May, 2012.See http://www.worldwewant2015.org/employment
52
faster and more inclusive growth, the 12th
five year plan also pays attention to the problem of
sustainability. It shows that Indian thinking on development challenges also matches with the
global thinking on post-2015 development agenda.
The 12th
plan draft report also provides different aspects of inclusiveness. These are:
inclusiveness as poverty reduction, inclusiveness as group equality, inclusiveness as regional
balance, inclusiveness and inequality, inclusiveness as empowerment, inclusiveness through
employment programmes and inclusiveness through gender equality. Economic growth is
important for two reasons. First, it leads to large expansion in income and if growth is inclusive
the living standards of majority can improve. Second, it generates resources for financing
government programmes. Moreover, growth process has to be inclusive. For example, rapid
growth with focus on agriculture and small and medium enterprises can be more inclusive as
compared to the growth generated by mining or extraction of mining resources for exports. Vol.1
of 12th
plan provides 25 indicators to be monitored during the plan period.
Both 11th
and 12th
five year plans recognize that generation of productive employment is crucial
for achieving inclusive growth. The 12th
plan draft report says that “Generation of productive and
gainful employment with decent working conditions on a sufficient scale to absorb the growing labour force was a
critical element in the Eleventh Plan strategy for achieving inclusive growth” (p.124, Vol.3, GOI, 2012). Out
of the 25 targets, one target relates to employment as given below.
“Generate 50 million new work opportunities in the non-farm sector and provide skill certification to equivalent
numbers” (p.35, Vo.1. GOI, 2012).
The 12th
plan document on employment focuses, apart from quantity, on quality of employment
and skill development. Apart from diversification of employment across sectors, there is a need
to look into the qualitative dimensions of employment in terms of equity, dignity, social security,
status of employment etc. This is important for formulating strategy for India’s future challenges
in generating productive employment with decent working conditions (GOI, 2012).
According to the 12th
plan report, there are four challenges for employment policy. First,
employment opportunities have to be expanded. Here government focuses on manufacturing
sector. It hopes to makes manufacturing sector as an engine of growth and expects to generate
100 million work opportunities by 2022. The government will have supportive policies for
labour intensive manufacturing segments like textiles and garments, leather and footwear, gems
and jewelry, food processing etc. Services like information technology, finance and banking,
tourism, trade and transport etc. will also be major generators of employment. Second, there is a
need to simplify regulatory framework particularly some of the labour laws. Social security
should be provided for both organized and unorganized sectors. Third, address the problems of
specific categories such as female employment, unemployment among educated people,
promoting employment opportunities for minorities, Scheduled castes/scheduled tribes and
disabled people. Fourth and most important one is promoting skill development. “The employment
challenges as reflected above needs to be addressed so as to meet the faster and inclusive growth agenda for the
Twefth Plan. Skill development should, therefore, occupy centre-stage in any employment strategy for the Twefth
Plan” (p.139, Vo.1, GOI, 2012).
53
The above thinking relates to both general and youth employment. Biggest focus of the policy
makers in India is going to be on education and skill development of workers predominantly
youth workers. This is essential for taking advantages of 'demographic dividend'.
5. CONCLUSIONS
Developing regions in Asia-Pacific region face major youth employment and unemployment
challenges. The conclusions of the study are the following.
Labour market challenges for working age population and adults
(1) Labour force participation rates declined for East Asia and South Asia in the post-global
crisis while it did not show decline for South East Asia and Pacific. The gender gap in
participation rates was the highest for South Asia. The females rates were lower by 50
percentage points in South Asia.
(2) The employment-population ratio for the Asia Pacific region was 62%. But the ratio was
significantly lower for females (48%) than males (76%). Again the largest gender gap was in
South Asia and South-West Asia.
(3) Employment and labour productivity growth declined in the region in 2007-12 period as
compared to the period 2002-07. Employment growth during 2007-12 was the highest for South
East Asia, followed by Pacific, South and South West Asia and East Asia. The employment
elasticity declined for some countries and increased for some others. For example, in India
employment elasticity declined from 0.41 during 1983 to 1993-94 to 0.20 during 1999-00 to
2009-10. However, labour productivity growth in India increased significantly over time.
(4) Unemployment rate in Asia Pacific region was around 4.7% in 2010. This is lower than the
world unemployment rate of 6% and other continents. Adult unemployment rates are lower than
for the population above 15 years. Projections of overall unemployment show that it would rise
for East Asia while it may stay the same in South East Asia and South Asia.
(5) Structural transformation from agriculture to industry and services happened over time
particularly for East Asia. In South Asia, agriculture still dominates with nearly 50% of the work
force. The share of agriculture for females is very high for South Asia.
(6) Apart from unemployment, those who are working in Asia Pacific region suffer from
vulnerable employment comprising own account workers and contributing family workers.
Nearly three in five workers (around 1.1 billion) in developing economies of the region fall
under vulnerable employment in 2012. However, there seems to be positive development as the
share of wage employment increased in the region. This would benefit the women as their share
in vulnerable employment is high.
(7) Workers in the region also have large share of informal sector. The share of informal sector
varies from 30% to 70%. In India, 92% of total were informal workers in 2011-12.
Underemployment is also in the region particularly in South Asia. The overall unemployment
54
may be low in the region but ‘working poor’ is a major problem. The proportion of working poor
declined fast in East Asia and South East Asia. But, it is still quite high in South Asia.
(8) Real wages of wage employed have been increasing. It doubled during 2000 to 2011. If we
exclude China, growth rate for Asia was lower. But, it is surprising as India also high growth of
real wages including those of agricultural labourers. Gender gap is high in wages in South Asia
although it is declining over time.
Trends and Challenges in youth labour market
(1) The share of youth population has been declining at global level but continues to be high in
some of the developing economies of Asia Pacific region. Labour force participation rates among
youth have been declining in all the regions which are a reflection of improved enrolment of
education. The gender gap in labour force participation is the highest for South Asia. The
projections show that youth participation rates are likely to decline further.
(2) Youth unemployment which is three times higher than adults is the biggest problem for the
youth in the Asia-Pacific region. The ratio of youth to adult unemployment rate is five times and
is likely to increase over time. In South Asia it was four times and is likely to decline for males.
(3) The joblessness rate (neither attending school/college nor employed) is much higher than
unemployment rate for youth. A four country study showed that these rates for India and
Indonesia were in the range of 30% to 35% while it was 25% and 12% for Phillippines and
Thailand respectively in the middle of 2000s. These rates are much higher for young females
compared to men particularly for India.
(4) Vulnerability of employment is much higher for youth as compared to adults. Part time
employment also increased for youth in some countries in the post-global crisis. According to a
study, 27 out of 30 countries studied showed that poverty among youth workers was higher than
that for adults.
(5) Lack of education and skills for youth workers are the major problems in developing
economies of Asia and Pacific for unemployment, joblessness, employability problems and low
wages. Youth population often reach working age without education and basic skills which are
important for employment prospects. Enrolment in technical and vocational education is low in
some sub-regions of the region. This percentage is only 2% in South and South West Asia
compared to 14% in East Asia and 12% in Central Asia.
(6) In India, only 4.9% of youth workers had post-secondary level of education and 19% had
completed secondary level of education in 2007-08. Nearly 90% of youth have not taken any lind
of vocational training.
The challenges vary across countries.
South Asia constitutes large shares of youth workers and unemployed. Unemployment and
joblessness is high. However, low quality employment is the biggest challenge in South Asia
55
because of several problems. As mentioned above, these problems are: high share in informal
sector, underemployment, high working poverty, low paid jobs, unsatisfactory working
conditions, lack of structural transformation to industry and services, lack of education, skills and
training, low wages employability problem and gender bias. The countries in the sub-region of
South Asia have to work on reducing the problems in order to take advantage of demographic
dividend. Fortunately, there is recognition of improving the quality of employment particularly
with skill development as shown by the thinking of the policy makers in India.
East Asia has its own challenges. China’s long term strategy of economy away from exports and
investments towards domestic consumption will pose challenges for employment particularly for
youth. Due to demographic changes, the labour force in East Asia has grown relatively little in
the last decade. This is due to ageing of economically active population and delaying of youth
from school to labour markets (ILO, 2014). Similar to labour force growth, employment growth
is also slow. There will be problems for young graduates to get employment. There is a positive
development in East Asia as the share of salaried has been increasing while that of vulnerable
employment has been declined. However, East Asia still employ nearly 400 million own account
and family workers. There has been restructuring in industry from low skilled to high skilled
industries. Therefore, skill upgrading is needed in East Asia for improving job quality and higher
incomes for workers.
In South East Asia and Pacific, youth unemployment rate is nearly three times that of the total
unemployment rate and five times to that the adult unemployment rate. Many of the countries in
this sub-region have young demographic profile. In order to increase productive jobs for youth,
education and skills are needed. There is also a need for structural transformation of workers
from agriculture to non-agriculture. Vulnerable employment continues to affect women more
than men. For ASEAN member countries, there are new challenges and opportunities for young
workers. The labour force will continue to grow rapidly at more than 1.5% per annumin
countries such as Cambodia, Lao PDR, Malaysia and the Philippines. On the other hand, labour
force growth will be less than 1% per annum in countries like Myanmar, Singapore, Thailand
and Vietnam. There is a need to improved labour market information systems, job placement
mechanisms, cross country skills recognition framework. In Pacific Island countries, stimulation
of broad based agricultural productivity, investments in labour intensive manufacturing and
investments in education and skills are required for catering to the changing labour markets
(ILO, 2014). Natural disasters is also another problem in South East Asia and pacific islands.
At global level, the International Labour conference 2012, five key policy areas that can be
adapted to local circumstances were identified and these were included in the resolution “The
Youth Employment Crisis: A call for Action”. The five policy areas include: “(i) employment
and economic policies to increase aggregate demand and improve access to finance; (ii)
education and training to ease the school-to-work transition and to prevent labour market
mismatches; (iii) labour market policies to target employment of disadvantaged youth; (iv)
entrepreneurship and self-employment to assist potential young entrepreneurs; and (v) labour
rights that are based on international labour standards to ensure that young people receive equal
treatment” (p.6, ILO, 2013). After global financial crisis, one of the focus areas at international
level is youth employment. ILO (2011) provides recommended policy measures for promoting
youth employment given in Box 8.
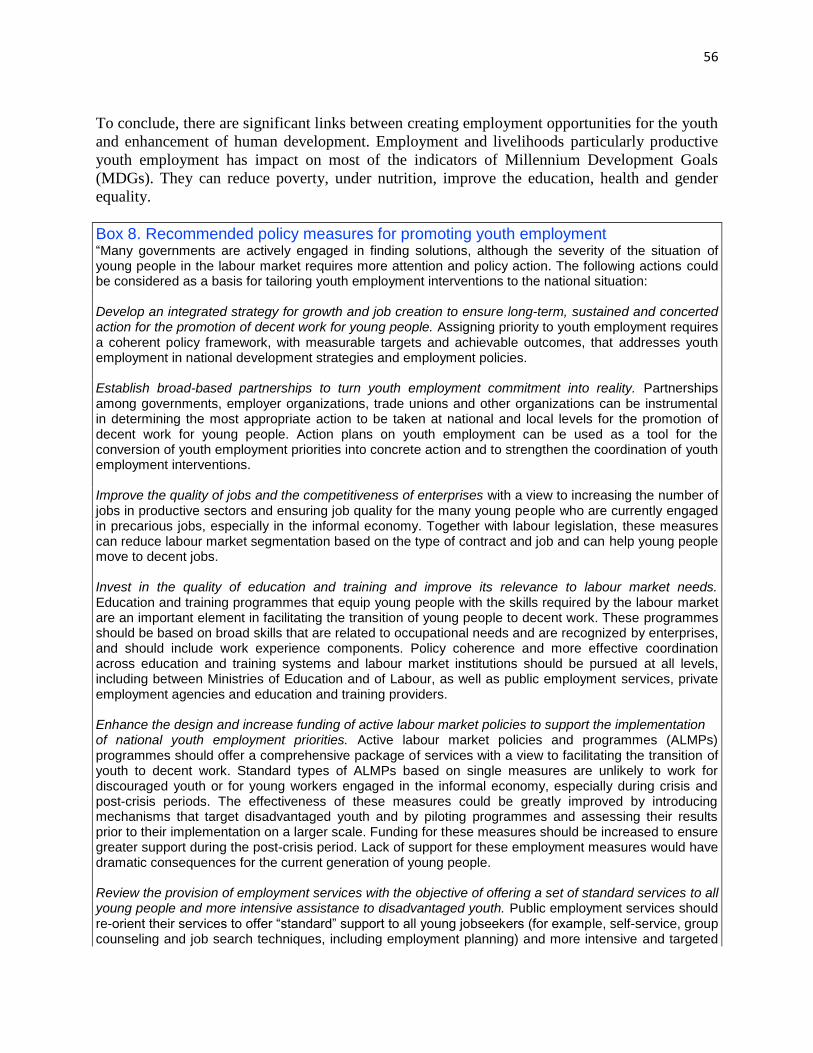
56
To conclude, there are significant links between creating employment opportunities for the youth
and enhancement of human development. Employment and livelihoods particularly productive
youth employment has impact on most of the indicators of Millennium Development Goals
(MDGs). They can reduce poverty, under nutrition, improve the education, health and gender
equality.
Box 8. Recommended policy measures for promoting youth employment “Many governments are actively engaged in finding solutions, although the severity of the situation of young people in the labour market requires more attention and policy action. The following actions could be considered as a basis for tailoring youth employment interventions to the national situation: Develop an integrated strategy for growth and job creation to ensure long-term, sustained and concerted action for the promotion of decent work for young people. Assigning priority to youth employment requires a coherent policy framework, with measurable targets and achievable outcomes, that addresses youth employment in national development strategies and employment policies. Establish broad-based partnerships to turn youth employment commitment into reality. Partnerships among governments, employer organizations, trade unions and other organizations can be instrumental in determining the most appropriate action to be taken at national and local levels for the promotion of decent work for young people. Action plans on youth employment can be used as a tool for the conversion of youth employment priorities into concrete action and to strengthen the coordination of youth employment interventions. Improve the quality of jobs and the competitiveness of enterprises with a view to increasing the number of jobs in productive sectors and ensuring job quality for the many young people who are currently engaged in precarious jobs, especially in the informal economy. Together with labour legislation, these measures can reduce labour market segmentation based on the type of contract and job and can help young people move to decent jobs. Invest in the quality of education and training and improve its relevance to labour market needs. Education and training programmes that equip young people with the skills required by the labour market are an important element in facilitating the transition of young people to decent work. These programmes should be based on broad skills that are related to occupational needs and are recognized by enterprises, and should include work experience components. Policy coherence and more effective coordination across education and training systems and labour market institutions should be pursued at all levels, including between Ministries of Education and of Labour, as well as public employment services, private employment agencies and education and training providers. Enhance the design and increase funding of active labour market policies to support the implementation of national youth employment priorities. Active labour market policies and programmes (ALMPs) programmes should offer a comprehensive package of services with a view to facilitating the transition of youth to decent work. Standard types of ALMPs based on single measures are unlikely to work for discouraged youth or for young workers engaged in the informal economy, especially during crisis and post-crisis periods. The effectiveness of these measures could be greatly improved by introducing mechanisms that target disadvantaged youth and by piloting programmes and assessing their results prior to their implementation on a larger scale. Funding for these measures should be increased to ensure greater support during the post-crisis period. Lack of support for these employment measures would have dramatic consequences for the current generation of young people. Review the provision of employment services with the objective of offering a set of standard services to all young people and more intensive assistance to disadvantaged youth. Public employment services should re-orient their services to offer “standard” support to all young jobseekers (for example, self-service, group counseling and job search techniques, including employment planning) and more intensive and targeted
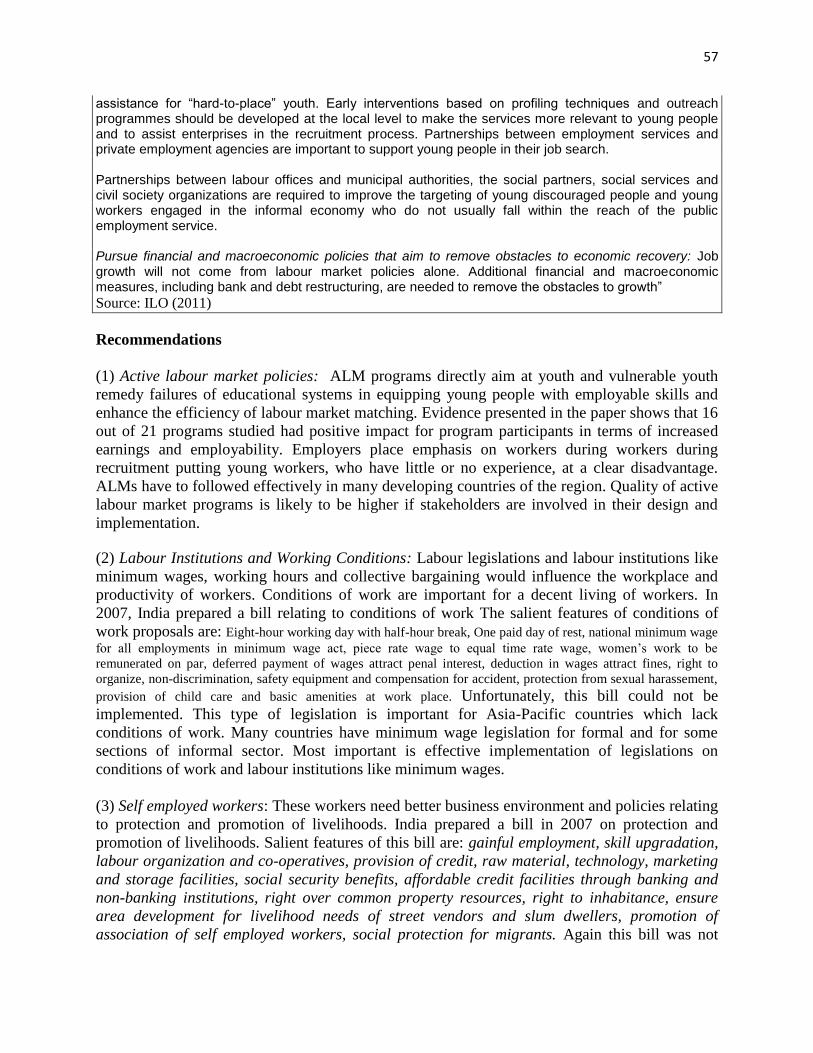
57
assistance for “hard-to-place” youth. Early interventions based on profiling techniques and outreach programmes should be developed at the local level to make the services more relevant to young people and to assist enterprises in the recruitment process. Partnerships between employment services and private employment agencies are important to support young people in their job search. Partnerships between labour offices and municipal authorities, the social partners, social services and civil society organizations are required to improve the targeting of young discouraged people and young workers engaged in the informal economy who do not usually fall within the reach of the public employment service. Pursue financial and macroeconomic policies that aim to remove obstacles to economic recovery: Job growth will not come from labour market policies alone. Additional financial and macroeconomic measures, including bank and debt restructuring, are needed to remove the obstacles to growth”
Source: ILO (2011)
Recommendations
(1) Active labour market policies: ALM programs directly aim at youth and vulnerable youth
remedy failures of educational systems in equipping young people with employable skills and
enhance the efficiency of labour market matching. Evidence presented in the paper shows that 16
out of 21 programs studied had positive impact for program participants in terms of increased
earnings and employability. Employers place emphasis on workers during workers during
recruitment putting young workers, who have little or no experience, at a clear disadvantage.
ALMs have to followed effectively in many developing countries of the region. Quality of active
labour market programs is likely to be higher if stakeholders are involved in their design and
implementation.
(2) Labour Institutions and Working Conditions: Labour legislations and labour institutions like
minimum wages, working hours and collective bargaining would influence the workplace and
productivity of workers. Conditions of work are important for a decent living of workers. In
2007, India prepared a bill relating to conditions of work The salient features of conditions of
work proposals are: Eight-hour working day with half-hour break, One paid day of rest, national minimum wage
for all employments in minimum wage act, piece rate wage to equal time rate wage, women’s work to be
remunerated on par, deferred payment of wages attract penal interest, deduction in wages attract fines, right to
organize, non-discrimination, safety equipment and compensation for accident, protection from sexual harassement,
provision of child care and basic amenities at work place. Unfortunately, this bill could not be
implemented. This type of legislation is important for Asia-Pacific countries which lack
conditions of work. Many countries have minimum wage legislation for formal and for some
sections of informal sector. Most important is effective implementation of legislations on
conditions of work and labour institutions like minimum wages.
(3) Self employed workers: These workers need better business environment and policies relating
to protection and promotion of livelihoods. India prepared a bill in 2007 on protection and
promotion of livelihoods. Salient features of this bill are: gainful employment, skill upgradation,
labour organization and co-operatives, provision of credit, raw material, technology, marketing
and storage facilities, social security benefits, affordable credit facilities through banking and
non-banking institutions, right over common property resources, right to inhabitance, ensure
area development for livelihood needs of street vendors and slum dwellers, promotion of
association of self employed workers, social protection for migrants. Again this bill was not
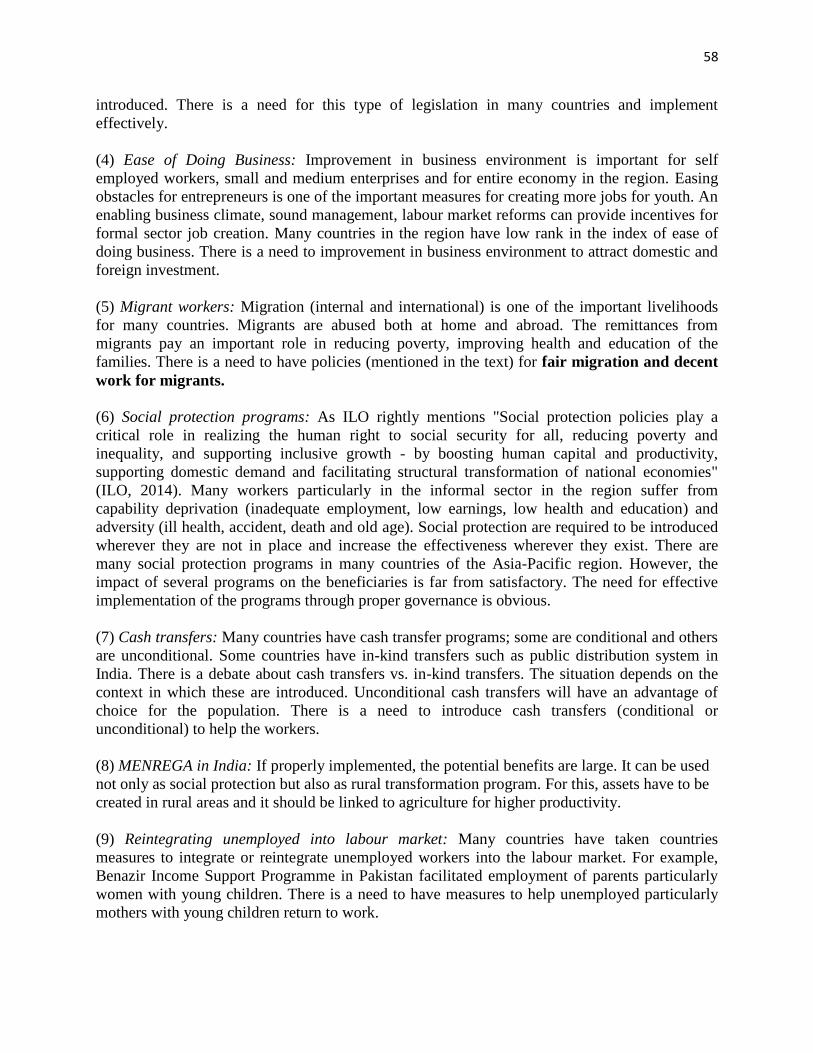
58
introduced. There is a need for this type of legislation in many countries and implement
effectively.
(4) Ease of Doing Business: Improvement in business environment is important for self
employed workers, small and medium enterprises and for entire economy in the region. Easing
obstacles for entrepreneurs is one of the important measures for creating more jobs for youth. An
enabling business climate, sound management, labour market reforms can provide incentives for
formal sector job creation. Many countries in the region have low rank in the index of ease of
doing business. There is a need to improvement in business environment to attract domestic and
foreign investment.
(5) Migrant workers: Migration (internal and international) is one of the important livelihoods
for many countries. Migrants are abused both at home and abroad. The remittances from
migrants pay an important role in reducing poverty, improving health and education of the
families. There is a need to have policies (mentioned in the text) for fair migration and decent
work for migrants.
(6) Social protection programs: As ILO rightly mentions "Social protection policies play a
critical role in realizing the human right to social security for all, reducing poverty and
inequality, and supporting inclusive growth - by boosting human capital and productivity,
supporting domestic demand and facilitating structural transformation of national economies"
(ILO, 2014). Many workers particularly in the informal sector in the region suffer from
capability deprivation (inadequate employment, low earnings, low health and education) and
adversity (ill health, accident, death and old age). Social protection are required to be introduced
wherever they are not in place and increase the effectiveness wherever they exist. There are
many social protection programs in many countries of the Asia-Pacific region. However, the
impact of several programs on the beneficiaries is far from satisfactory. The need for effective
implementation of the programs through proper governance is obvious.
(7) Cash transfers: Many countries have cash transfer programs; some are conditional and others
are unconditional. Some countries have in-kind transfers such as public distribution system in
India. There is a debate about cash transfers vs. in-kind transfers. The situation depends on the
context in which these are introduced. Unconditional cash transfers will have an advantage of
choice for the population. There is a need to introduce cash transfers (conditional or
unconditional) to help the workers.
(8) MENREGA in India: If properly implemented, the potential benefits are large. It can be used
not only as social protection but also as rural transformation program. For this, assets have to be
created in rural areas and it should be linked to agriculture for higher productivity.
(9) Reintegrating unemployed into labour market: Many countries have taken countries
measures to integrate or reintegrate unemployed workers into the labour market. For example,
Benazir Income Support Programme in Pakistan facilitated employment of parents particularly
women with young children. There is a need to have measures to help unemployed particularly
mothers with young children return to work.
59
(10) Social Security : The relatively adequate level of social security available for formal
workers is in striking contrast to the almost total lack of social security for informal workers.
Security for employment injury, disability, maternity, old age population and health coverage are
required for the workers as a human right and improving productivity of workers. There is a need
to have these securities in many of the region's low income and middle income countries which
have low coverage particularly for informal workers.
(11) Need for Social Protection Floor: It is by now recognized that all developing countries
should have a social protection floor. This is needed from the point of view of economic need,
social need and human rights. For example, in India, suggestions are made to have the following
as minimum social security or social protection floor.
(a) Extending the non-contributory old age pension schemes at a reasonable level to the old age population,
including the physically disadvantaged and windows.
(b) Providing access to health services to the poor, either through public provision or through a social health
insurance scheme such Rashtriya Swastya Bima Yojana (RSBY) in which all workers in the unorganized sector
belonging to the BPL (Below poverty line) category and their families are covered and
(c) Expanding within a specified period of time the Unorganized Sectors workers Social Security Act, 2008, in order
to ensure that it guarantees statutory and universal provision of national minimum social security (IHD, 2014).
Apart the above elements, social protection floor also can promote self employed workers,
lacking individual or houeshold security to undertake productive including risky investments. (12) Pro employment macro policies: Macroeconomic policies could be much more important
than direct programmes in generating employment for youth. The integration of the employment
objective with the overall growth strategy is needed. In many countries, liberalization and reform
policies had envisaged to generate a substantial employment by restructuring of production in
favour of labur intensive activities. However, evidence indicate that this expectation has not been
realized despite relatively high growth. Hard fiscal and monetary policies can hurt growth and
employment. Thus, macro policies such as fiscal and monetary policies should promote
employment by providing appropriate policies and institutions. Trade policies have been
effective in promoting export growth strategies and employment. However, in the post-global
financial crisis period, expansion of trade on employment in accordance with the comparative
advantage of labour intensive aspects should not be taken granted. Domestic demand is equally
important now.
(13) Product diversification: Generally, manufacturing sector development is expected to
provide greater employment than other sectors. However, with product diversification, it is
possible to generate in agriculture, services and natural resources sectors.
(14) Education, skill improvement and employability: The nature of labour market has been
transforming from unskilled to highly skilled. There has been increasing demand for skilled
labour and declining demand for the unskilled ones especially in the non-agriculture sector. The
level of human capital in terms of literacy, educational levels and specific skills raise the
productivity and incomes of workers in the labour market. The concept of employability is
gaining momentum in the labour market literature. It indicates the person’s capability of gaining
initial employment, maintaining employment and moving to new employment by choice. There
is a changing policy agenda related to labour market from the ‘job protection’ to ‘security
through employability’. The policy agenda needs to equip the job-seekers with skills that match
60
the demand in the market. Skill formation involves schooling, professional or technical
education, and vocational training. The main problem is the mismatch between the skills of
young workers and the emerging needs of the market. Education alone will not lead to
employability unless workers are skilled. Employability of youth has to be increased through
skill development and vocational training. The policies have to gear the system towards
knowledge/ skills relevant for emerging labor
(15) Post-2015 development agenda and employment: One of the missing things in the original
agenda setting of MDGs in 2000 was productive employment. It was introduced as a target in
and 2005. ILO argues that productive employment should be made one of the central goals of
post-2015 development agenda. Setting a full goal will receive greater attention as 'development
happens with jobs'. Decent jobs should be one of the goals in the post-MDG agenda. Similarly,
social protection should be one of the important indicators in this agenda. Particularly social
protection floor should be adopted by many countries included in the post-2015 development
agenda. Education and skill development are crucial for many countries particularly the countries
which have 'demographic dividend'.
References
ADB (2008), 'Asian Development Outlook 2008", Asian Development Outlook, Manila
Banerjee, Abhijit and Esthar Duflo (2011) “Poor Economics: A Radical Rethinking of the Way to Fight Global
Poverty’, Public Affairs, USA
Betcherman, G., M. Godfrey, S. Puerto, F. Rother, and A. Stavreska. 2007. “Global Inventory of Interventions to
Support Young Workers: Synthesis Report.” World Bank, Washington, DC.
Dev, S. Mahendra and Venkatanarayana, S. (2011), "Youth Employment and Unemployment in India", working
paper 2011-009, IGIDR, Mumbai
Eichengreen, Barry and Poonam Gupta (2010), “The service sector as India’s Road to Economic Growth”, working
paper no. 249, ICRIER, New Delhi
ESCAP (2013) “Statistical Year Book for Asia and the Pacific 2013”, UN ESCAP, Bangkok
GOI (2012), “Twlefth Five Year Plan”, Planning Commission, Government of India
Fields, Gary S., Working Hard, Working Poor, Oxford University Press, New York, 2012.
IHD (2014), “India Labour and Employment Report 2014”, Institute for Human Development, New Delhi
ILO (2010), “Global Employment Trends for Youth 2010” International Labour Organization, Geneva
ILO (2010a), “Online Discussion Forum on Active Labour Market Policies for Young People”, http://ap-
youthnet.ilobkk.or.th
ILO (2012), “Global Employment Trends for Youth 2012”, International Labour Organization, Geneva
ILO (2012a), “Jobs and Livelihoods at the heart of the post-2015 development agenda”, ILO concept note for the
post-2016 development agenda, http://www.ilo.org/global/about-the-ilo/media-centre/statements-and-
speeches/WCMS_193483/lang--en/index.htm
61
ILO (2013), “Global Employment Trends for Youth 2013”, International Labour Organization, Geneva
ILO (2013a), “Global Wage Report 2012/13: Wages and Equitable Growth”, International Labour Organization,
Geneva
ILO (2014), “Global Employment Trends 2014: Risk of Jobless Recovery”, International Labour Organization,
Geneva
ILO (2014a), "World of Work Report 2014, Developing Jobs", ILO Research Department, ILO, Geneva
ILO (2014b) "World Social Protection Report, Building Economic Recovery, Inclusive Development and Social
Justice", ILO, Geneva
ILO (2014c), “Fair Migration: Setting an ILO Agenda”, ILO, Geneva
Jha, S. (2008), "Young Workers in Asia" presentation at Asian Development Outlook workshop, 2008, Manila
Karver, Jonathan., Charles Kenny, and Andy Sumner (2012), “MDG 2.0: What Goals, Targets and time Frame?”
IDS working paper, vol.2012, No.398, IDS, Sussex.
Koehler, G., Des Gasper, Richard Jolly and Mara Simane (2012)Human Security and the Next Generation of
Comprehensive Human Development Goals, IDS Sussex.
Muralidharan (2013), Priorities for Primary education Policy in India’s 12th
Five Year Plan”, India Policy Forum
2013, NCAER-Brookings, New Delhi
Melamed, Claire (2013), “Economic growth and transformation in a post-2015 agreement” Background paper
prepared for the 3rd meeting of the High Level Panel of Eminent Persons on the post-2015 agenda Monrovia,
Liberia, 30 Jan – 1 Feb 2013
Melamed, Claire and Paul Ladd (2013), “How to build sustainable development goals: integrating human
development and environmental sustainability in a new global agenda”, Research reports and studies, ODI,
March 2013.
NCEUS (2007), “Report on Conditions of Work for Unorganised Workers”, National Commission on Enterprises
for Unorganised Workers, New Delhi
NCEUS (2009), “ The Challenge of Employment in India: An Informal Employment Perspective”, NCEUS, New
Delhi
Papola, T.S. (2012), " Economic growth and employment linkages: The Indian experience", Keynote paper
presented at the 95th annual conference of the Indian Economic Association, Geetam University, Visakhapatnam,
27-29 December, 2012
Pasha, H.a. and T. Palanivel (2003), “Macroeconomics of Poverty Reduction: An Analysis of Experience in 11
Asian countries’, Discussion paper no.3, UNDP Asia-Pacific Regional Programme on macroeconomics of poverty
Reduction, Colombo, UNDP.
Rao, CHH (2005), “Agriculture, Food Security and Environment” Oxford University Press, New Delhi
Ramaswamy, K.V. and T. Agarwal (2013), “Services-led growth, employment, skill, and job quality: A Study of
Manufacturing and Service sectors in Urban India”, in Dev, S. Mahendra (ed.) India Development Report 2012-
13, Oxford University Press
Srivastava, R (2011), “Labour Migration in India: Recent Trends, Patterns and Policy Issues”, Indian Journal of
Labour economics, Vol.54, No.3
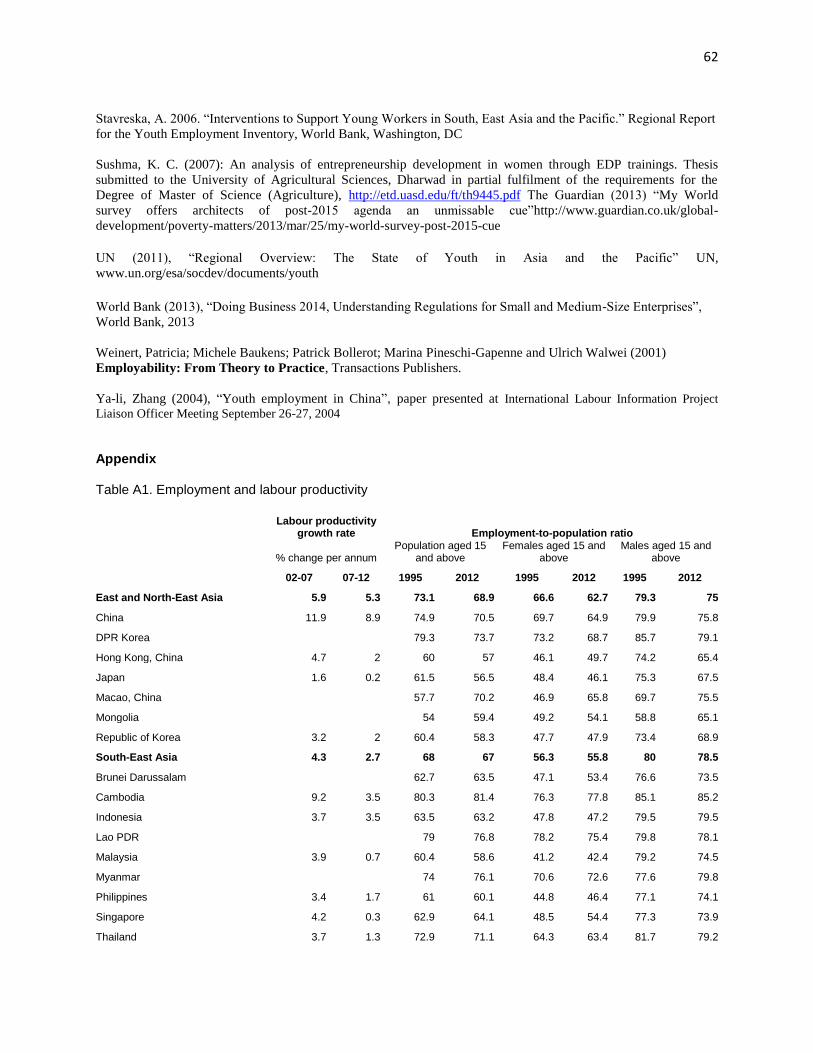
62
Stavreska, A. 2006. “Interventions to Support Young Workers in South, East Asia and the Pacific.” Regional Report
for the Youth Employment Inventory, World Bank, Washington, DC
Sushma, K. C. (2007): An analysis of entrepreneurship development in women through EDP trainings. Thesis
submitted to the University of Agricultural Sciences, Dharwad in partial fulfilment of the requirements for the
Degree of Master of Science (Agriculture), http://etd.uasd.edu/ft/th9445.pdf The Guardian (2013) “My World
survey offers architects of post-2015 agenda an unmissable cue”http://www.guardian.co.uk/global-
development/poverty-matters/2013/mar/25/my-world-survey-post-2015-cue
UN (2011), “Regional Overview: The State of Youth in Asia and the Pacific” UN,
www.un.org/esa/socdev/documents/youth
World Bank (2013), “Doing Business 2014, Understanding Regulations for Small and Medium-Size Enterprises”,
World Bank, 2013
Weinert, Patricia; Michele Baukens; Patrick Bollerot; Marina Pineschi-Gapenne and Ulrich Walwei (2001)
Employability: From Theory to Practice, Transactions Publishers.
Ya-li, Zhang (2004), “Youth employment in China”, paper presented at International Labour Information Project
Liaison Officer Meeting September 26-27, 2004
Appendix Table A1. Employment and labour productivity
Labour productivity growth rate Employment-to-population ratio
% change per annum
Population aged 15 and above
Females aged 15 and above
Males aged 15 and above
02-07 07-12 1995 2012 1995 2012 1995 2012
East and North-East Asia 5.9 5.3 73.1 68.9 66.6 62.7 79.3 75
China 11.9 8.9 74.9 70.5 69.7 64.9 79.9 75.8
DPR Korea
79.3 73.7 73.2 68.7 85.7 79.1
Hong Kong, China 4.7 2 60 57 46.1 49.7 74.2 65.4
Japan 1.6 0.2 61.5 56.5 48.4 46.1 75.3 67.5
Macao, China
57.7 70.2 46.9 65.8 69.7 75.5
Mongolia
54 59.4 49.2 54.1 58.8 65.1
Republic of Korea 3.2 2 60.4 58.3 47.7 47.9 73.4 68.9
South-East Asia 4.3 2.7 68 67 56.3 55.8 80 78.5
Brunei Darussalam
62.7 63.5 47.1 53.4 76.6 73.5
Cambodia 9.2 3.5 80.3 81.4 76.3 77.8 85.1 85.2
Indonesia 3.7 3.5 63.5 63.2 47.8 47.2 79.5 79.5
Lao PDR
79 76.8 78.2 75.4 79.8 78.1
Malaysia 3.9 0.7 60.4 58.6 41.2 42.4 79.2 74.5
Myanmar
74 76.1 70.6 72.6 77.6 79.8
Philippines 3.4 1.7 61 60.1 44.8 46.4 77.1 74.1
Singapore 4.2 0.3 62.9 64.1 48.5 54.4 77.3 73.9
Thailand 3.7 1.3 72.9 71.1 64.3 63.4 81.7 79.2
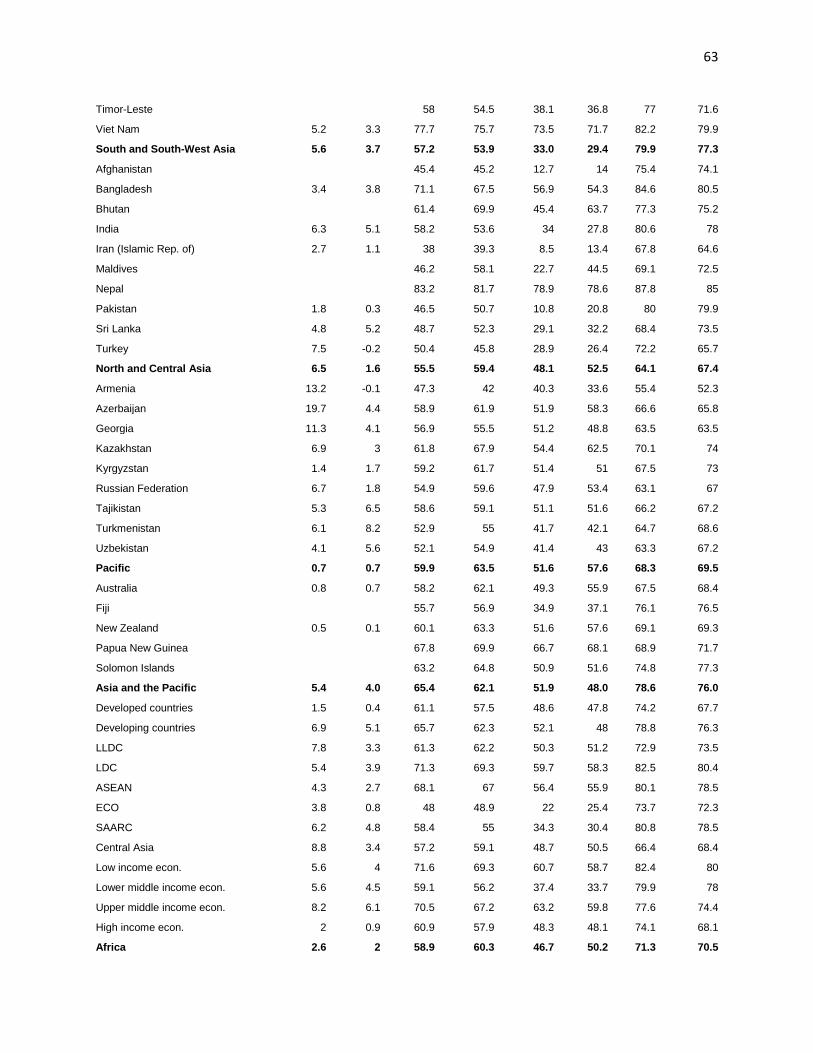
63
Timor-Leste
58 54.5 38.1 36.8 77 71.6
Viet Nam 5.2 3.3 77.7 75.7 73.5 71.7 82.2 79.9
South and South-West Asia 5.6 3.7 57.2 53.9 33.0 29.4 79.9 77.3
Afghanistan
45.4 45.2 12.7 14 75.4 74.1
Bangladesh 3.4 3.8 71.1 67.5 56.9 54.3 84.6 80.5
Bhutan
61.4 69.9 45.4 63.7 77.3 75.2
India 6.3 5.1 58.2 53.6 34 27.8 80.6 78
Iran (Islamic Rep. of) 2.7 1.1 38 39.3 8.5 13.4 67.8 64.6
Maldives
46.2 58.1 22.7 44.5 69.1 72.5
Nepal
83.2 81.7 78.9 78.6 87.8 85
Pakistan 1.8 0.3 46.5 50.7 10.8 20.8 80 79.9
Sri Lanka 4.8 5.2 48.7 52.3 29.1 32.2 68.4 73.5
Turkey 7.5 -0.2 50.4 45.8 28.9 26.4 72.2 65.7
North and Central Asia 6.5 1.6 55.5 59.4 48.1 52.5 64.1 67.4
Armenia 13.2 -0.1 47.3 42 40.3 33.6 55.4 52.3
Azerbaijan 19.7 4.4 58.9 61.9 51.9 58.3 66.6 65.8
Georgia 11.3 4.1 56.9 55.5 51.2 48.8 63.5 63.5
Kazakhstan 6.9 3 61.8 67.9 54.4 62.5 70.1 74
Kyrgyzstan 1.4 1.7 59.2 61.7 51.4 51 67.5 73
Russian Federation 6.7 1.8 54.9 59.6 47.9 53.4 63.1 67
Tajikistan 5.3 6.5 58.6 59.1 51.1 51.6 66.2 67.2
Turkmenistan 6.1 8.2 52.9 55 41.7 42.1 64.7 68.6
Uzbekistan 4.1 5.6 52.1 54.9 41.4 43 63.3 67.2
Pacific 0.7 0.7 59.9 63.5 51.6 57.6 68.3 69.5
Australia 0.8 0.7 58.2 62.1 49.3 55.9 67.5 68.4
Fiji
55.7 56.9 34.9 37.1 76.1 76.5
New Zealand 0.5 0.1 60.1 63.3 51.6 57.6 69.1 69.3
Papua New Guinea 67.8 69.9 66.7 68.1 68.9 71.7
Solomon Islands 63.2 64.8 50.9 51.6 74.8 77.3
Asia and the Pacific 5.4 4.0 65.4 62.1 51.9 48.0 78.6 76.0
Developed countries 1.5 0.4 61.1 57.5 48.6 47.8 74.2 67.7
Developing countries 6.9 5.1 65.7 62.3 52.1 48 78.8 76.3
LLDC 7.8 3.3 61.3 62.2 50.3 51.2 72.9 73.5
LDC 5.4 3.9 71.3 69.3 59.7 58.3 82.5 80.4
ASEAN 4.3 2.7 68.1 67 56.4 55.9 80.1 78.5
ECO 3.8 0.8 48 48.9 22 25.4 73.7 72.3
SAARC 6.2 4.8 58.4 55 34.3 30.4 80.8 78.5
Central Asia 8.8 3.4 57.2 59.1 48.7 50.5 66.4 68.4
Low income econ. 5.6 4 71.6 69.3 60.7 58.7 82.4 80
Lower middle income econ. 5.6 4.5 59.1 56.2 37.4 33.7 79.9 78
Upper middle income econ. 8.2 6.1 70.5 67.2 63.2 59.8 77.6 74.4
High income econ. 2 0.9 60.9 57.9 48.3 48.1 74.1 68.1
Africa 2.6 2 58.9 60.3 46.7 50.2 71.3 70.5
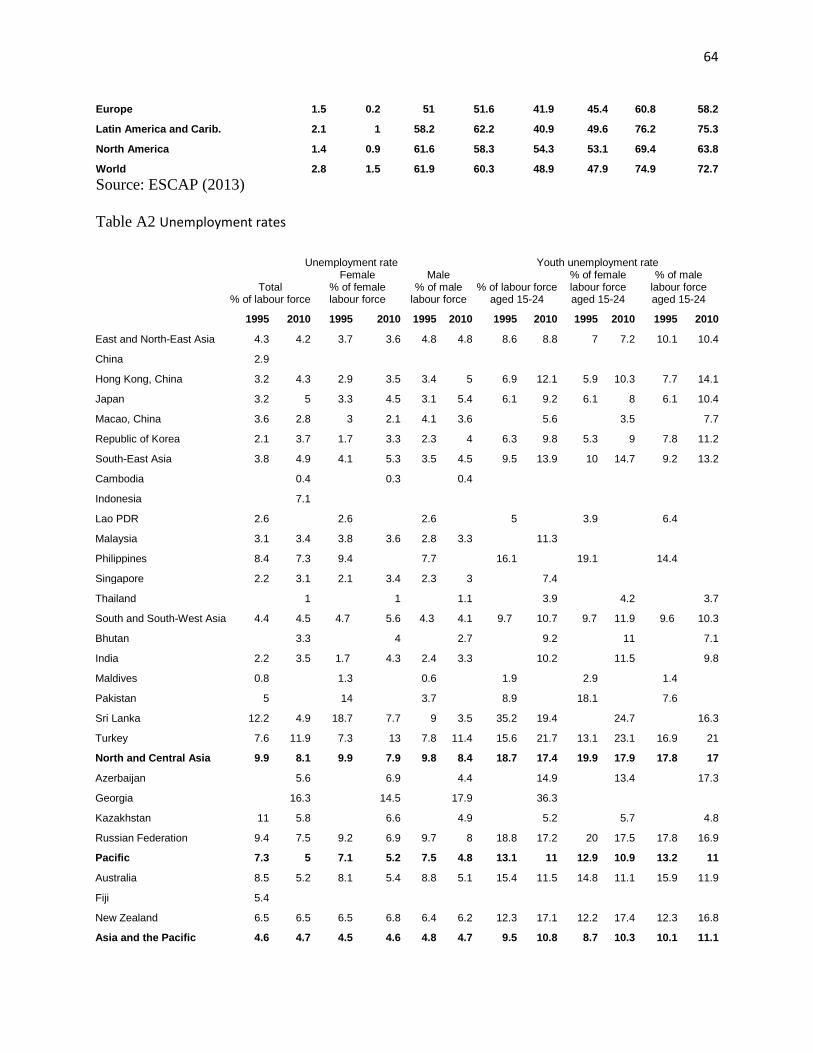
64
Europe 1.5 0.2 51 51.6 41.9 45.4 60.8 58.2
Latin America and Carib. 2.1 1 58.2 62.2 40.9 49.6 76.2 75.3
North America 1.4 0.9 61.6 58.3 54.3 53.1 69.4 63.8
World 2.8 1.5 61.9 60.3 48.9 47.9 74.9 72.7
Source: ESCAP (2013)
Table A2 Unemployment rates
Unemployment rate Youth unemployment rate
Total % of labour force
Female % of female labour force
Male % of male
labour force % of labour force
aged 15-24
% of female labour force aged 15-24
% of male labour force aged 15-24
1995 2010 1995 2010 1995 2010 1995 2010 1995 2010 1995 2010
East and North-East Asia 4.3 4.2 3.7 3.6 4.8 4.8 8.6 8.8 7 7.2 10.1 10.4
China 2.9
Hong Kong, China 3.2 4.3 2.9 3.5 3.4 5 6.9 12.1 5.9 10.3 7.7 14.1
Japan 3.2 5 3.3 4.5 3.1 5.4 6.1 9.2 6.1 8 6.1 10.4
Macao, China 3.6 2.8 3 2.1 4.1 3.6
5.6
3.5
7.7
Republic of Korea 2.1 3.7 1.7 3.3 2.3 4 6.3 9.8 5.3 9 7.8 11.2
South-East Asia 3.8 4.9 4.1 5.3 3.5 4.5 9.5 13.9 10 14.7 9.2 13.2
Cambodia 0.4
0.3
0.4
Indonesia 7.1
Lao PDR 2.6
2.6
2.6
5
3.9
6.4
Malaysia 3.1 3.4 3.8 3.6 2.8 3.3
11.3
Philippines 8.4 7.3 9.4
7.7
16.1
19.1
14.4
Singapore 2.2 3.1 2.1 3.4 2.3 3
7.4
Thailand
1
1
1.1
3.9
4.2
3.7
South and South-West Asia 4.4 4.5 4.7 5.6 4.3 4.1 9.7 10.7 9.7 11.9 9.6 10.3
Bhutan 3.3 4 2.7 9.2 11 7.1
India 2.2 3.5 1.7 4.3 2.4 3.3 10.2 11.5 9.8
Maldives 0.8 1.3 0.6 1.9 2.9 1.4
Pakistan 5 14 3.7 8.9 18.1 7.6
Sri Lanka 12.2 4.9 18.7 7.7 9 3.5 35.2 19.4 24.7 16.3
Turkey 7.6 11.9 7.3 13 7.8 11.4 15.6 21.7 13.1 23.1 16.9 21
North and Central Asia 9.9 8.1 9.9 7.9 9.8 8.4 18.7 17.4 19.9 17.9 17.8 17
Azerbaijan 5.6 6.9 4.4 14.9 13.4 17.3
Georgia 16.3 14.5 17.9 36.3
Kazakhstan 11 5.8 6.6 4.9 5.2 5.7 4.8
Russian Federation 9.4 7.5 9.2 6.9 9.7 8 18.8 17.2 20 17.5 17.8 16.9
Pacific 7.3 5 7.1 5.2 7.5 4.8 13.1 11 12.9 10.9 13.2 11
Australia 8.5 5.2 8.1 5.4 8.8 5.1 15.4 11.5 14.8 11.1 15.9 11.9
Fiji 5.4
New Zealand 6.5 6.5 6.5 6.8 6.4 6.2 12.3 17.1 12.2 17.4 12.3 16.8
Asia and the Pacific 4.6 4.7 4.5 4.6 4.8 4.7 9.5 10.8 8.7 10.3 10.1 11.1
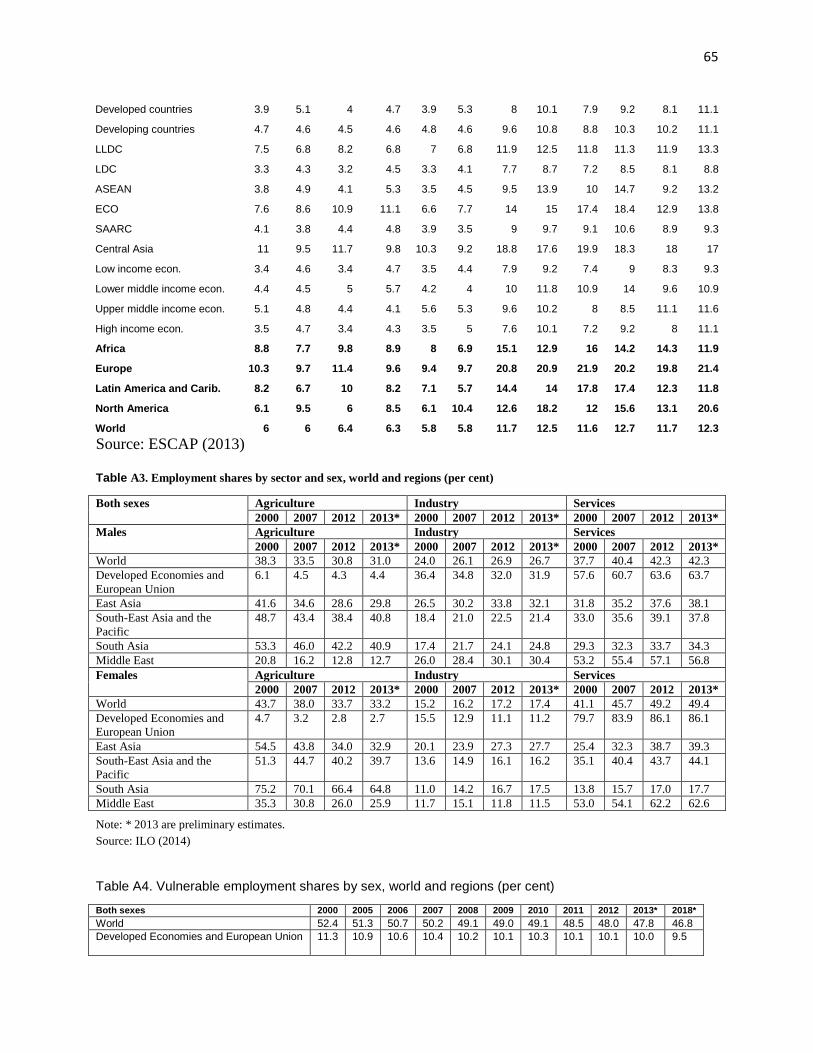
65
Developed countries 3.9 5.1 4 4.7 3.9 5.3 8 10.1 7.9 9.2 8.1 11.1
Developing countries 4.7 4.6 4.5 4.6 4.8 4.6 9.6 10.8 8.8 10.3 10.2 11.1
LLDC 7.5 6.8 8.2 6.8 7 6.8 11.9 12.5 11.8 11.3 11.9 13.3
LDC 3.3 4.3 3.2 4.5 3.3 4.1 7.7 8.7 7.2 8.5 8.1 8.8
ASEAN 3.8 4.9 4.1 5.3 3.5 4.5 9.5 13.9 10 14.7 9.2 13.2
ECO 7.6 8.6 10.9 11.1 6.6 7.7 14 15 17.4 18.4 12.9 13.8
SAARC 4.1 3.8 4.4 4.8 3.9 3.5 9 9.7 9.1 10.6 8.9 9.3
Central Asia 11 9.5 11.7 9.8 10.3 9.2 18.8 17.6 19.9 18.3 18 17
Low income econ. 3.4 4.6 3.4 4.7 3.5 4.4 7.9 9.2 7.4 9 8.3 9.3
Lower middle income econ. 4.4 4.5 5 5.7 4.2 4 10 11.8 10.9 14 9.6 10.9
Upper middle income econ. 5.1 4.8 4.4 4.1 5.6 5.3 9.6 10.2 8 8.5 11.1 11.6
High income econ. 3.5 4.7 3.4 4.3 3.5 5 7.6 10.1 7.2 9.2 8 11.1
Africa 8.8 7.7 9.8 8.9 8 6.9 15.1 12.9 16 14.2 14.3 11.9
Europe 10.3 9.7 11.4 9.6 9.4 9.7 20.8 20.9 21.9 20.2 19.8 21.4
Latin America and Carib. 8.2 6.7 10 8.2 7.1 5.7 14.4 14 17.8 17.4 12.3 11.8
North America 6.1 9.5 6 8.5 6.1 10.4 12.6 18.2 12 15.6 13.1 20.6
World 6 6 6.4 6.3 5.8 5.8 11.7 12.5 11.6 12.7 11.7 12.3
Source: ESCAP (2013) Table A3. Employment shares by sector and sex, world and regions (per cent)
Both sexes Agriculture Industry Services
2000 2007 2012 2013* 2000 2007 2012 2013* 2000 2007 2012 2013*
Males Agriculture Industry Services
2000 2007 2012 2013* 2000 2007 2012 2013* 2000 2007 2012 2013*
World 38.3 33.5 30.8 31.0 24.0 26.1 26.9 26.7 37.7 40.4 42.3 42.3
Developed Economies and
European Union
6.1 4.5 4.3 4.4 36.4 34.8 32.0 31.9 57.6 60.7 63.6 63.7
East Asia 41.6 34.6 28.6 29.8 26.5 30.2 33.8 32.1 31.8 35.2 37.6 38.1
South-East Asia and the
Pacific
48.7 43.4 38.4 40.8 18.4 21.0 22.5 21.4 33.0 35.6 39.1 37.8
South Asia 53.3 46.0 42.2 40.9 17.4 21.7 24.1 24.8 29.3 32.3 33.7 34.3
Middle East 20.8 16.2 12.8 12.7 26.0 28.4 30.1 30.4 53.2 55.4 57.1 56.8
Females Agriculture Industry Services
2000 2007 2012 2013* 2000 2007 2012 2013* 2000 2007 2012 2013*
World 43.7 38.0 33.7 33.2 15.2 16.2 17.2 17.4 41.1 45.7 49.2 49.4
Developed Economies and
European Union
4.7 3.2 2.8 2.7 15.5 12.9 11.1 11.2 79.7 83.9 86.1 86.1
East Asia 54.5 43.8 34.0 32.9 20.1 23.9 27.3 27.7 25.4 32.3 38.7 39.3
South-East Asia and the
Pacific
51.3 44.7 40.2 39.7 13.6 14.9 16.1 16.2 35.1 40.4 43.7 44.1
South Asia 75.2 70.1 66.4 64.8 11.0 14.2 16.7 17.5 13.8 15.7 17.0 17.7
Middle East 35.3 30.8 26.0 25.9 11.7 15.1 11.8 11.5 53.0 54.1 62.2 62.6
Note: * 2013 are preliminary estimates.
Source: ILO (2014)
Table A4. Vulnerable employment shares by sex, world and regions (per cent)
Both sexes 2000 2005 2006 2007 2008 2009 2010 2011 2012 2013* 2018*
World 52.4 51.3 50.7 50.2 49.1 49.0 49.1 48.5 48.0 47.8 46.8
Developed Economies and European Union 11.3 10.9 10.6 10.4 10.2 10.1 10.3 10.1 10.1 10.0 9.5
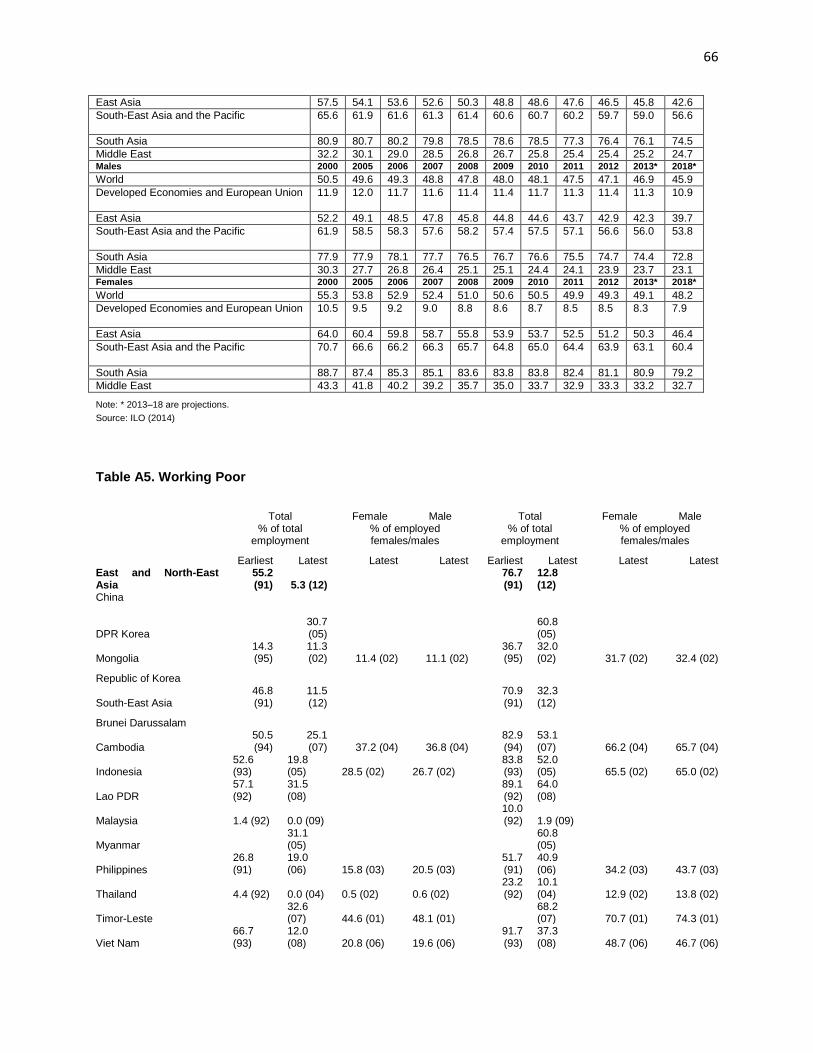
66
East Asia 57.5 54.1 53.6 52.6 50.3 48.8 48.6 47.6 46.5 45.8 42.6
South-East Asia and the Pacific 65.6 61.9 61.6 61.3 61.4 60.6 60.7 60.2 59.7 59.0 56.6
South Asia 80.9 80.7 80.2 79.8 78.5 78.6 78.5 77.3 76.4 76.1 74.5
Middle East 32.2 30.1 29.0 28.5 26.8 26.7 25.8 25.4 25.4 25.2 24.7 Males 2000 2005 2006 2007 2008 2009 2010 2011 2012 2013* 2018*
World 50.5 49.6 49.3 48.8 47.8 48.0 48.1 47.5 47.1 46.9 45.9
Developed Economies and European Union 11.9 12.0 11.7 11.6 11.4 11.4 11.7 11.3 11.4 11.3 10.9
East Asia 52.2 49.1 48.5 47.8 45.8 44.8 44.6 43.7 42.9 42.3 39.7
South-East Asia and the Pacific 61.9 58.5 58.3 57.6 58.2 57.4 57.5 57.1 56.6 56.0 53.8
South Asia 77.9 77.9 78.1 77.7 76.5 76.7 76.6 75.5 74.7 74.4 72.8
Middle East 30.3 27.7 26.8 26.4 25.1 25.1 24.4 24.1 23.9 23.7 23.1 Females 2000 2005 2006 2007 2008 2009 2010 2011 2012 2013* 2018*
World 55.3 53.8 52.9 52.4 51.0 50.6 50.5 49.9 49.3 49.1 48.2
Developed Economies and European Union 10.5 9.5 9.2 9.0 8.8 8.6 8.7 8.5 8.5 8.3 7.9
East Asia 64.0 60.4 59.8 58.7 55.8 53.9 53.7 52.5 51.2 50.3 46.4
South-East Asia and the Pacific 70.7 66.6 66.2 66.3 65.7 64.8 65.0 64.4 63.9 63.1 60.4
South Asia 88.7 87.4 85.3 85.1 83.6 83.8 83.8 82.4 81.1 80.9 79.2
Middle East 43.3 41.8 40.2 39.2 35.7 35.0 33.7 32.9 33.3 33.2 32.7
Note: * 2013–18 are projections.
Source: ILO (2014)
Table A5. Working Poor
Total Female Male Total Female Male
% of total employment
% of employed females/males
% of total employment
% of employed females/males
Earliest Latest Latest Latest Earliest Latest Latest Latest
East and North-East Asia
55.2 (91) 5.3 (12)
76.7 (91)
12.8 (12)
China
DPR Korea 30.7 (05)
60.8 (05)
Mongolia 14.3 (95)
11.3 (02) 11.4 (02) 11.1 (02)
36.7 (95)
32.0 (02) 31.7 (02) 32.4 (02)
Republic of Korea
South-East Asia 46.8 (91)
11.5 (12)
70.9 (91)
32.3 (12)
Brunei Darussalam
Cambodia 50.5 (94)
25.1 (07) 37.2 (04) 36.8 (04)
82.9 (94)
53.1 (07) 66.2 (04) 65.7 (04)
Indonesia 52.6 (93)
19.8 (05) 28.5 (02) 26.7 (02)
83.8 (93)
52.0 (05) 65.5 (02) 65.0 (02)
Lao PDR 57.1 (92)
31.5 (08)
89.1 (92)
64.0 (08)
Malaysia 1.4 (92) 0.0 (09) 10.0 (92) 1.9 (09)
Myanmar 31.1 (05)
60.8 (05)
Philippines 26.8 (91)
19.0 (06) 15.8 (03) 20.5 (03)
51.7 (91)
40.9 (06) 34.2 (03) 43.7 (03)
Thailand 4.4 (92) 0.0 (04) 0.5 (02) 0.6 (02) 23.2 (92)
10.1 (04) 12.9 (02) 13.8 (02)
Timor-Leste 32.6 (07) 44.6 (01) 48.1 (01)
68.2 (07) 70.7 (01) 74.3 (01)
Viet Nam 66.7 (93)
12.0 (08) 20.8 (06) 19.6 (06)
91.7 (93)
37.3 (08) 48.7 (06) 46.7 (06)
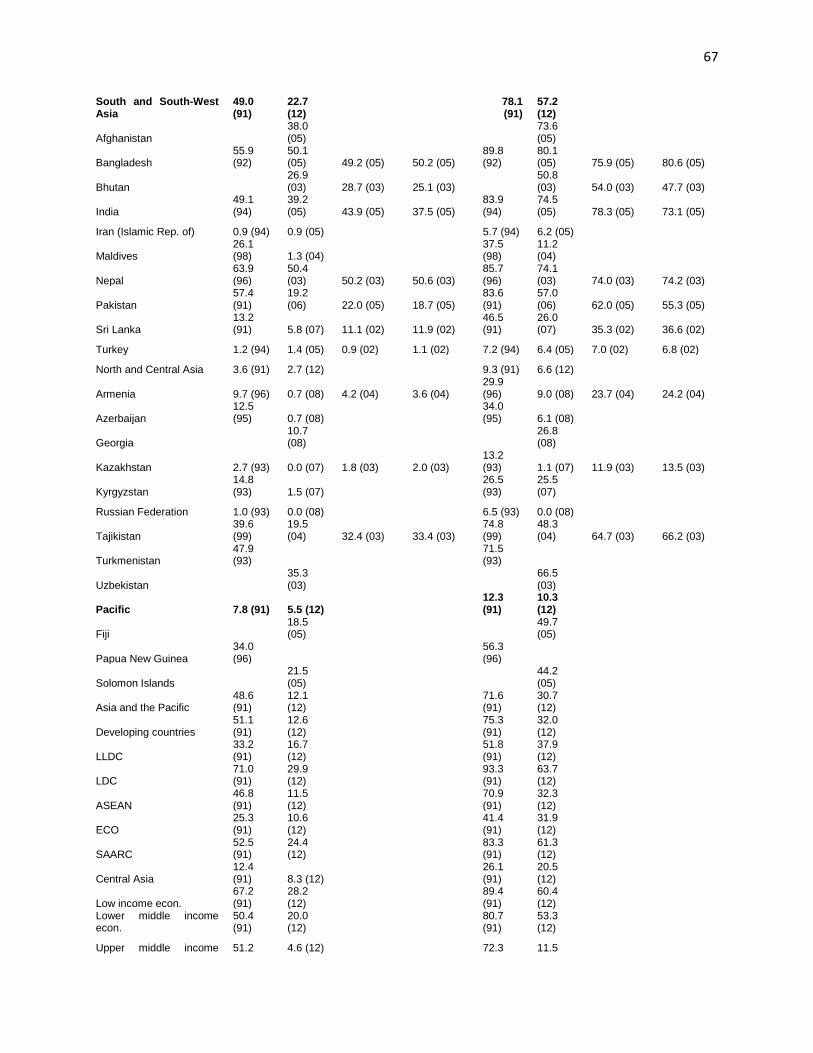
67
South and South-West Asia
49.0 (91)
22.7 (12)
78.1 (91)
57.2 (12)
Afghanistan 38.0 (05)
73.6 (05)
Bangladesh 55.9 (92)
50.1 (05) 49.2 (05) 50.2 (05)
89.8 (92)
80.1 (05) 75.9 (05) 80.6 (05)
Bhutan 26.9 (03) 28.7 (03) 25.1 (03)
50.8 (03) 54.0 (03) 47.7 (03)
India 49.1 (94)
39.2 (05) 43.9 (05) 37.5 (05)
83.9 (94)
74.5 (05) 78.3 (05) 73.1 (05)
Iran (Islamic Rep. of) 0.9 (94) 0.9 (05) 5.7 (94) 6.2 (05)
Maldives 26.1 (98) 1.3 (04)
37.5 (98)
11.2 (04)
Nepal 63.9 (96)
50.4 (03) 50.2 (03) 50.6 (03)
85.7 (96)
74.1 (03) 74.0 (03) 74.2 (03)
Pakistan 57.4 (91)
19.2 (06) 22.0 (05) 18.7 (05)
83.6 (91)
57.0 (06) 62.0 (05) 55.3 (05)
Sri Lanka 13.2 (91) 5.8 (07) 11.1 (02) 11.9 (02)
46.5 (91)
26.0 (07) 35.3 (02) 36.6 (02)
Turkey 1.2 (94) 1.4 (05) 0.9 (02) 1.1 (02) 7.2 (94) 6.4 (05) 7.0 (02) 6.8 (02)
North and Central Asia 3.6 (91) 2.7 (12) 9.3 (91) 6.6 (12)
Armenia 9.7 (96) 0.7 (08) 4.2 (04) 3.6 (04) 29.9 (96) 9.0 (08) 23.7 (04) 24.2 (04)
Azerbaijan 12.5 (95) 0.7 (08)
34.0 (95) 6.1 (08)
Georgia 10.7 (08)
26.8 (08)
Kazakhstan 2.7 (93) 0.0 (07) 1.8 (03) 2.0 (03) 13.2 (93) 1.1 (07) 11.9 (03) 13.5 (03)
Kyrgyzstan 14.8 (93) 1.5 (07)
26.5 (93)
25.5 (07)
Russian Federation 1.0 (93) 0.0 (08) 6.5 (93) 0.0 (08)
Tajikistan 39.6 (99)
19.5 (04) 32.4 (03) 33.4 (03)
74.8 (99)
48.3 (04) 64.7 (03) 66.2 (03)
Turkmenistan 47.9 (93)
71.5 (93)
Uzbekistan 35.3 (03)
66.5 (03)
Pacific 7.8 (91) 5.5 (12) 12.3 (91)
10.3 (12)
Fiji 18.5 (05)
49.7 (05)
Papua New Guinea 34.0 (96)
56.3 (96)
Solomon Islands 21.5 (05)
44.2 (05)
Asia and the Pacific 48.6 (91)
12.1 (12)
71.6 (91)
30.7 (12)
Developing countries 51.1 (91)
12.6 (12)
75.3 (91)
32.0 (12)
LLDC 33.2 (91)
16.7 (12)
51.8 (91)
37.9 (12)
LDC 71.0 (91)
29.9 (12)
93.3 (91)
63.7 (12)
ASEAN 46.8 (91)
11.5 (12)
70.9 (91)
32.3 (12)
ECO 25.3 (91)
10.6 (12)
41.4 (91)
31.9 (12)
SAARC 52.5 (91)
24.4 (12)
83.3 (91)
61.3 (12)
Central Asia 12.4 (91) 8.3 (12)
26.1 (91)
20.5 (12)
Low income econ. 67.2 (91)
28.2 (12)
89.4 (91)
60.4 (12)
Lower middle income econ.
50.4 (91)
20.0 (12)
80.7 (91)
53.3 (12)
Upper middle income 51.2 4.6 (12) 72.3 11.5
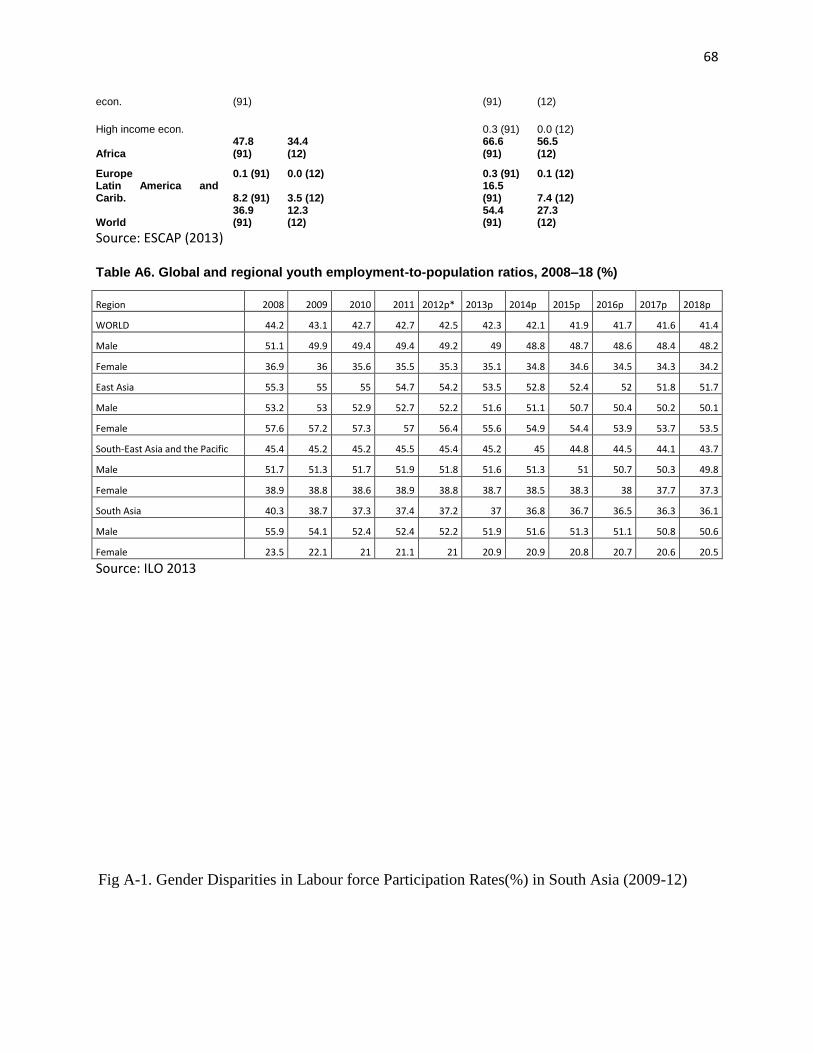
68
econ. (91) (91) (12)
High income econ. 0.3 (91) 0.0 (12)
Africa 47.8 (91)
34.4 (12)
66.6 (91)
56.5 (12)
Europe 0.1 (91) 0.0 (12) 0.3 (91) 0.1 (12) Latin America and Carib. 8.2 (91) 3.5 (12)
16.5 (91) 7.4 (12)
World 36.9 (91)
12.3 (12)
54.4 (91)
27.3 (12)
Source: ESCAP (2013) Table A6. Global and regional youth employment-to-population ratios, 2008–18 (%)
Region 2008 2009 2010 2011 2012p* 2013p 2014p 2015p 2016p 2017p 2018p
WORLD 44.2 43.1 42.7 42.7 42.5 42.3 42.1 41.9 41.7 41.6 41.4
Male 51.1 49.9 49.4 49.4 49.2 49 48.8 48.7 48.6 48.4 48.2
Female 36.9 36 35.6 35.5 35.3 35.1 34.8 34.6 34.5 34.3 34.2
East Asia 55.3 55 55 54.7 54.2 53.5 52.8 52.4 52 51.8 51.7
Male 53.2 53 52.9 52.7 52.2 51.6 51.1 50.7 50.4 50.2 50.1
Female 57.6 57.2 57.3 57 56.4 55.6 54.9 54.4 53.9 53.7 53.5
South-East Asia and the Pacific 45.4 45.2 45.2 45.5 45.4 45.2 45 44.8 44.5 44.1 43.7
Male 51.7 51.3 51.7 51.9 51.8 51.6 51.3 51 50.7 50.3 49.8
Female 38.9 38.8 38.6 38.9 38.8 38.7 38.5 38.3 38 37.7 37.3
South Asia 40.3 38.7 37.3 37.4 37.2 37 36.8 36.7 36.5 36.3 36.1
Male 55.9 54.1 52.4 52.4 52.2 51.9 51.6 51.3 51.1 50.8 50.6
Female 23.5 22.1 21 21.1 21 20.9 20.9 20.8 20.7 20.6 20.5
Source: ILO 2013
Fig A-1. Gender Disparities in Labour force Participation Rates(%) in South Asia (2009-12)
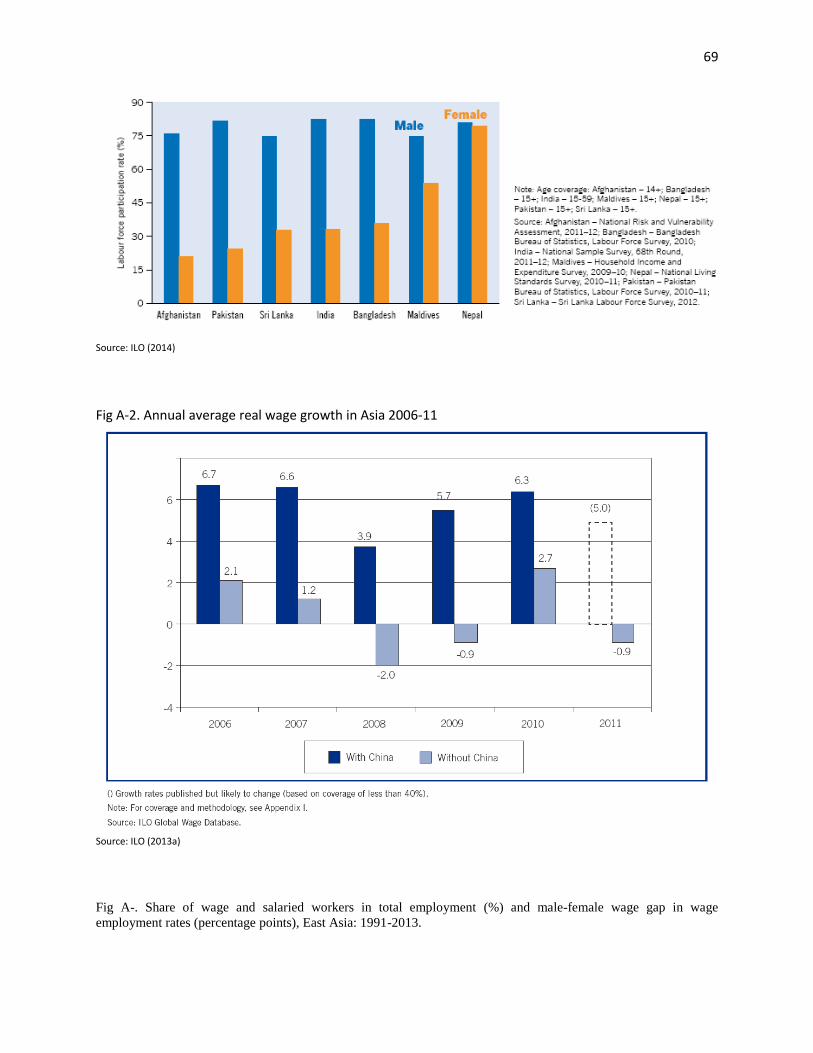
69
Source: ILO (2014)
Fig A-2. Annual average real wage growth in Asia 2006-11
Source: ILO (2013a)
Fig A-. Share of wage and salaried workers in total employment (%) and male-female wage gap in wage
employment rates (percentage points), East Asia: 1991-2013.
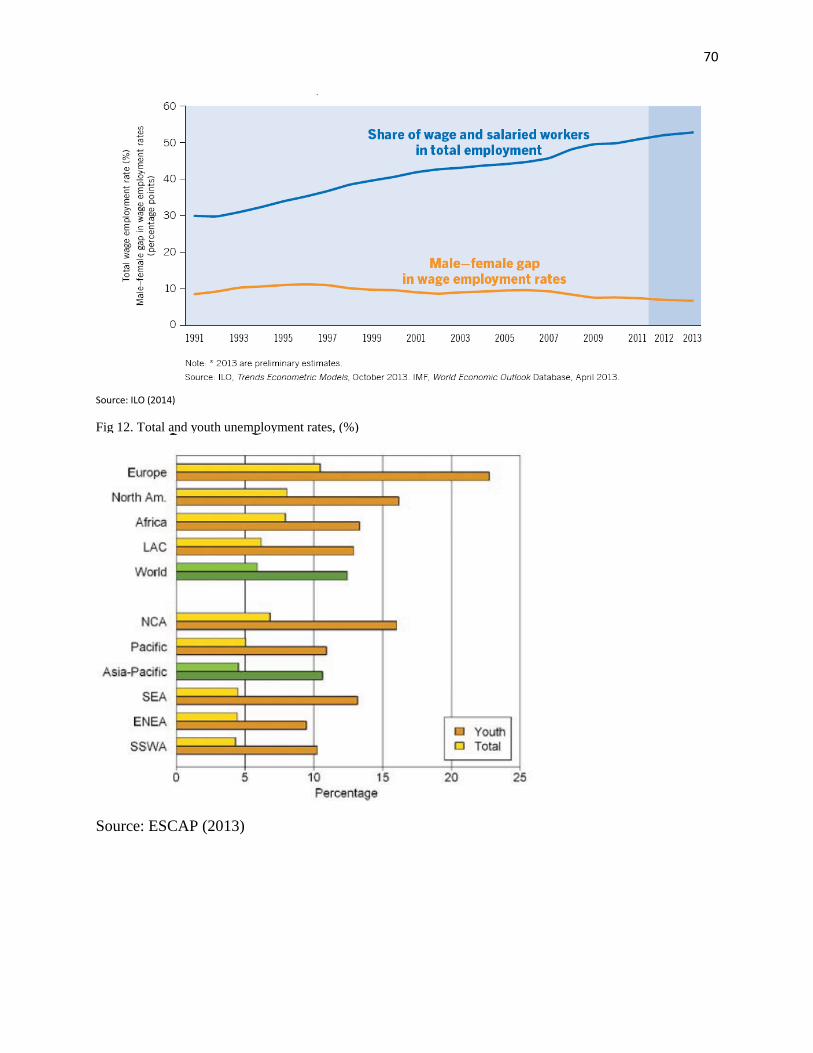
70
Source: ILO (2014)
Fig 12. Total and youth unemployment rates, (%)
Source: ESCAP (2013)


![[Challenge:Future] YOUTH EMPLOYMENT CENTER](https://img.pdfslide.us/doc/110x75/55ca4a42bb61eba7298b4720/challengefuture-youth-employment-center.jpg)