Embed Size (px)
Citation preview

Georgia State UniversityScholarWorks @ Georgia State University
Business Administration Dissertations Programs in Business Administration
Spring 2-26-2016
Creating Value with Acquisition Based DynamicCapabilities (ABDC): A Study of Mergers andAcquisitions in the Regulated Energy IndustryRich Berard Jr.Georgia State University
Follow this and additional works at: http://scholarworks.gsu.edu/bus_admin_diss
This Dissertation is brought to you for free and open access by the Programs in Business Administration at ScholarWorks @ Georgia State University. Ithas been accepted for inclusion in Business Administration Dissertations by an authorized administrator of ScholarWorks @ Georgia State University.For more information, please contact [email protected].
Recommended CitationBerard, Rich Jr., "Creating Value with Acquisition Based Dynamic Capabilities (ABDC): A Study of Mergers and Acquisitions in theRegulated Energy Industry." Dissertation, Georgia State University, 2016.http://scholarworks.gsu.edu/bus_admin_diss/64

PERMISSION TO BORROW
In presenting this dissertation as a partial fulfillment of the requirements for an advanced degree
from Georgia State University, I agree that the Library of the University shall make it available
for inspection and circulation in accordance with its regulations governing materials of this type.
I agree that permission to quote from, to copy from, or publish this dissertation may be granted
by the author or, in his/her absence, the professor under whose direction it was written or, in his
absence, by the Dean of the Robinson College of Business. Such quoting, copying, or publishing
must be solely for the scholarly purposes and does not involve potential financial gain. It is
understood that any copying from or publication of this dissertation which involves potential
gain will not be allowed without written permission of the author.
Rich Berard, Jr.

NOTICE TO BORROWERS
All dissertations deposited in the Georgia State University Library must be used only in
accordance with the stipulations prescribed by the author in the preceding statement.
The author of this dissertation is:
Rich Berard, Jr.
Georgia State University
Robinson College of Business
35 Broad Street NW
Atlanta, GA 30303
The director of this dissertation is:
Dr. Conrad Ciccotello
Atlanta, GA 30326
Georgia State University
3344 Peachtree Road,
Atlanta, GA 30326

Creating Value with Acquisition Based Dynamic Capabilities (ABDC):
A Study of Mergers and Acquisitions in the Regulated Energy Industry
BY
Rich Berard, Jr.
A Dissertation Submitted in Partial Fulfillment of the Requirements for the Degree
Of
Executive Doctorate in Business
In the Robinson College of Business
Of
Georgia State University
GEORGIA STATE UNIVERSITY
ROBINSON COLLEGE OF BUSINESS
2016

Copyright by:
Rich Berard, Jr.
2016
ACCEPTANCE
This dissertation was prepared under the direction of the Rich Berard, Jr. dissertation
Committee. It has been approved and accepted by all members of that committee, and it has
been accepted in partial fulfillment of the requirements for the degree of Doctoral of Philosophy
in Business Administration in the J. Mack Robinson College of Business of Georgia State
University.
Richard D. Phillips, Dean
DISSERTATION COMMITTEE
Dr. Conrad Ciccotello (Chair)
Dr. Steven Dionne
Dr. Felix Rioja

ABSTRACT
Creating Value with Acquisition Based Dynamic Capabilities (ABDC):
A Study of Mergers and Acquisitions in the Regulated Energy Industry
BY
Rich Berard, Jr.
Committee Chair: Conrad Ciccotello
Major Academic Unit: Robinson School of Business
M&A research has consistently shown that value is destroyed for a majority of acquirers. Despite initial
small positive gains at deal announcement, within a year of closing the transaction a majority of acquirers
experience overall negative returns. Nevertheless, the constant pressures to grow leave company leaders
few other viable options than pursuing M&A. This ever present cycle of value destruction is of interest to
both scholars and practitioners. Of interest is what can be done differently by the acquirer to prevent the
inevitable value erosion from occurring. To investigate this question, the author develops an adapted
version of the Acquisition Based Dynamic Capabilities (ABDC) framework, a theoretical extension of
Dynamic Capability theory. The framework is helpful in identifying what corporate M&A capabilities
contribute to value creation through a transaction lifecycle. The adapted ABDC framework provides a
means to quantify the differing impacts to value creation among the M&A capabilities of “Selecting and
Identifying”, “Transacting and Executing” and “Reconfiguring and Integrating”.
The empirical study utilizes 337 regulated energy, public company transactions, closed between 1995 and
2014. This industry is appropriate to study the application of this theory as it benefits from long dated
deal timelines and specific milestone events (deal announcement, regulatory approval, financial closing,
etc.) providing clear points of delineation for measurement purposes. Performance is measured using
weak and semi-strong specifications of shareholder returns with a “golden set” of measures identified.
Additionally, the impacts on the ABDC measures from shock waves, bandwagon effects, management
traits, financial factors, deal complexity and other relevant factors are all evaluated to test for their
impacts on the analyzed transactions. The results suggest that despite many acquirers receiving some
positive value accretion from announcement and short-term post-closing returns, larger one year post-
close reductions in value eclipse previous gains for most acquirers. The results validate the importance of
the Reconfiguring and Integrating (R&I) phase of an acquisition. Comparisons to Top and Poor
Performers provide a clear set of recommendations for future energy industry acquirers.

v
TABLE OF CONTENTS
ABSTRACT ...................................................................................................................... vii
TABLE OF CONTENTS .....................................................................................................v
LIST OF TABLES ........................................................................................................... viii
LIST OF FIGURES .............................................................................................................x
ABBREVIATIONS AND DEFINITIONS ........................................................................ xi
CHAPTER I - INTRODUCTION .......................................................................................1
The Problem ...................................................................................................................1
Theoretical Framing .......................................................................................................2
Methods..........................................................................................................................5
Analysis..........................................................................................................................9
Results ..........................................................................................................................10
Contributions................................................................................................................11
Dissertation Outline .....................................................................................................12
CHAPTER II - LITERATURE REVIEW .........................................................................13
M&A Overview ...........................................................................................................13
M&A Research Approaches ..................................................................................14
Measurement of M&A Performance .....................................................................17
Merger Wave Theory .............................................................................................19
Regulated Energy Industry Considerations ...........................................................22
The Theoretical Evolution from RBV to ABDC .........................................................26
Resource Based View of the Firm (RBV) .............................................................26
Dynamic Capabilities (DC)....................................................................................30
Acquisition Based Dynamic Capabilities (ABDC)................................................34
CHAPTER III - APPLYING THE ADAPTED ABDC FRAMEWORK ..........................37
CHAPTER IV - METHODS .............................................................................................45

vi
Data Sampling and Collection .....................................................................................45
Theoretical Constructs .................................................................................................49
Groupings for Analytical Purposes ..............................................................................54
“Industry Groups” ..................................................................................................54
“Leaders and Laggards” .........................................................................................55
ABDC “Top Performers” and “Poor Performers” .................................................56
Dependent and Independent Variables ........................................................................57
Dependent Variables ..............................................................................................57
Independent Variables ...........................................................................................69
Operational Models ......................................................................................................79
Selecting and Identifying .......................................................................................80
Transacting and Executing .....................................................................................81
Reconfiguring and Integrating ...............................................................................82
Analysis........................................................................................................................83
CHAPTER V - RESULTS .................................................................................................87
Summarized Results.....................................................................................................87
Selecting and Identifying .............................................................................................97
Transacting and Executing .........................................................................................113
Reconfiguring and Integrating ...................................................................................129
CHAPTER VI - DISCUSSION .......................................................................................152
Key Findings from the Evaluation of Regulated Energy M&A ................................152
Creating Value through Acquisition Based Dynamic Capabilities............................154
Creating Value through Selecting and Identifying ..............................................155
Creating Value through Transacting and Executing ............................................158
Creating Value through Reconfiguring and Integrating ......................................161
CHAPTER VII - CONTRIBUTIONS .............................................................................166
Contribution to Theory ..............................................................................................166
Contribution to Practice .............................................................................................168

vii
CHAPTER VIII - CONCLUSION ..................................................................................170
Limitations .................................................................................................................170
Future Research .........................................................................................................172
Summary ....................................................................................................................174
APPENDIX I: Supporting Correlation Statistics .............................................................176
APPENDIX II: Industry and Segment Regression Results .............................................183
Selecting and Identifying ...........................................................................................183
Transacting and Executing .........................................................................................185
Reconfiguring and Integrating ...................................................................................187
APPENDIX III: Industry Quantile Regression Results ...................................................190
REFERENCES ................................................................................................................194
ABOUT THE AUTHOR .................................................................................................204

viii
LIST OF TABLES
Number Page
Table 1: Dependent Variable Descriptions ........................................................................65
Table 2: Return Statistics by Performance Group .............................................................67
Table 3: Return Statistics by Industry Group ....................................................................68
Table 4: Independent Variable Descriptions ......................................................................77
Table 5: Summary Statistics by Performance Grouping....................................................78
Table 6: Summary Statistics by Industry Segment ............................................................78
Table 7: Independent Variable Correlation Matrix ............................................................79
Table 8: Return Results by ABDC Category .....................................................................90
Table 9: Factor Differences among Leaders and Laggards ...............................................92
Table 10: Factor Differences among Industry Groups ......................................................95
Table 11: Factor Differences among Top and Poor Performers – S&I .............................98
Table 12: Model 1 – S&I Abnormal 3 Day (-3, +3) Returns ...........................................101
Table 13: Model 1 Quantile Regression – S&I Abnormal 3 Day (-3, +3) Returns .........104
Table 14: Model 2 – S&I Simple 3 Day (-3, +3) Returns................................................108
Table 15: Model 2 Quantile Regression – S&I Simple 3 Day (-3, +3) Returns ..............111
Table 16: Factor Differences among Top and Poor Performers – T&E ..........................114
Table 17: Model 3 - T&E Abnormal 30 Day (-30, +30) Returns ....................................117
Table 18: Model 3 Quantile Regression – T&E Abnormal 30 Day (-30, +30) Returns ..120
Table 19: Model 4 – T&E Executing Simple 30 Day (-30, +30) Returns .......................124
Table 20: Model 4 Quantile Regression – T&E Simple 30 Day (-30, +30) Returns .......127
Table 21: Factor Differences among Top and Poor Performers – R&I ...........................130
Table 22: Model 5 – R&I Buy and Hold 360 Day (0, +360) Returns .............................133
Table 23: Model 5 Quantile Regression – R&I Buy & Hold 360 Day (0, +360) Returns136

ix
Table 24: Model 6 – R&I Abnormal 360 Day (0, +360) Returns....................................140
Table 25: Model 6 Quantile Regression – R&I Abnormal 360 Day (0, +360) Returns ..143
Table 26: Model 7 – R&I Simple 360 Day (0, +360) Returns ........................................147
Table 27: Model 7 Quantile Regression – Simple 360 Day (0, +360) Returns ...............150
Table 28: Correlation Matrix – All ..................................................................................176
Table 29: Correlation Matrix – Leaders ...........................................................................176
Table 30: Correlation Matrix – Laggards ........................................................................177
Table 31: Correlation Matrix – Industry Group 1 ............................................................177
Table 32: Correlation Matrix – Industry Group 2 ............................................................178
Table 33: Correlation Matrix – Industry Group 3 ............................................................178
Table 34: Correlation Matrix – Industry Group 4 ............................................................179
Table 35: Dependent Variable Correlation Matrix – All Transactions............................180
Table 36: Dependent Variable Correlation Matrix – Leaders .........................................181
Table 37: Dependent Variable Correlation Matrix – Laggards .......................................182
Table 38: Selecting and Identifying Abnormal 3 Day (-3, +3) Returns ..........................183
Table 39: Selecting and Identifying Simple 3 Day (-3, +3) Returns ...............................184
Table 40: Transacting and Executing Abnormal 30 Day (-30, +30) Returns ..................185
Table 41: Transacting and Executing Simple 30 Day (-30, +30) Returns .......................186
Table 42: Reconfiguring and Integrating Abnormal 360 Day (0, +360) Returns ............187
Table 43: Reconfiguring and Integrating Buy and Hold 360 Day (0, +360) Returns .....188
Table 44: Reconfiguring and Integrating Simple 360 Day (0, +360) Returns ................189
Table 45: Selecting and Identifying Quantile Regression Results...................................190
Table 46: Transacting and Executing Quantile Regression Results ................................191
Table 47: Reconfiguring and Integrating Quantile Regression Results...........................192

x
LIST OF FIGURES
Number Page
Figure 1: Waves Bandwagons and Returns .......................................................................21
Figure 2: Acquisition Based Dynamic Capability Framework ..........................................38
Figure 3: ABDC Applied to an M&A Transaction ............................................................41
Figure 4: Construct Model .................................................................................................50
Figure 5: Model 1: Selecting and Identifying Abnormal Returns .....................................80
Figure 6: Model 2: Selecting and Identifying Simple Returns ..........................................80
Figure 7: Model 3: Transacting and Executing Abnormal Returns ...................................81
Figure 8: Model 4: Transacting and Executing Simple Returns ........................................81
Figure 9: Model 5: Reconfiguring and Integrating Buy and Hold Returns .......................82
Figure 10: Model 6: Reconfiguring and Integrating Abnormal Returns ...........................82
Figure 11: Model 7: Reconfiguring and Integrating Simple Returns ................................83
Figure 12: Returns By Transaction Stage – All Transactions ............................................88
Figure 13: Top and Poor Performer Differences .............................................................155

xi
ABBREVIATIONS AND DEFINITIONS
ABDC – Acquisition Based Dynamic Capabilities
BHAR – Buy and Hold Abnormal Returns
CAR – Cumulative Abnormal Return
DC – Dynamic Capabilities
DOE – Department of Energy
EPA – Environmental Protection Agency
FMA – First Mover Advantage
GSU – Georgia State University
“Laggard” – A company that exhibits bottom quartile performance prior to its acquisition
“Leader” – A company that exhibits top quartile performance prior to an acquisition
LOI – Letter of Intent
M&A – Mergers and Acquisitions
NDA – Non Disclosure Agreement
OLS – Ordinary Least Squares
“Poor Performer” – A company that has bottom quartile performance in an ABDC category
R&I – Reconfiguring and Integrating
RBV – Resource Based View of the Firm
S&I – Selecting and Identifying
SEC – Securities and Exchange Commission
“Top Performer” – A company that has top quartile performance in an ABDC category
T&E – Transacting and Executing
VRIN – Valuable, Rare, Inimitable and Non Substitutable
8K – Form 8-K signed and submitted to the SEC

1
CHAPTER I - INTRODUCTION
The Problem
Researchers have provided a rather robust body of scholarly work in the field of
mergers and acquisitions. It has been over four decades since the pioneers in the field such as:
Fama, Pfeifer, Gort, Chandler and Rumelt published their foundational works in industrial
organization and applied merger and acquisition research, thus jumpstarting the academic inquiry
of why firms merge, acquire or are sold. Throughout the 1970s and 1980s hundreds of journal
articles were published, further advancing theory as new contributors stood on the shoulders of
the early luminaries. The 1990s with the advancements in technology, the field continued its
rapid advancement with many contributions featuring massive data sets and increasingly
complex quantitative methodologies. By the 2000s the body of research had become so vast that
dozens of literature, meta and systematic review articles were published to assist the academic
community in synthesizing the hundreds of M&A related papers spanning fields such as
economics, finance, management, sociology, accounting, and organizational behavior.
There is ample support in the literature to conclude that when taken on average
and across industries from a value creation perspective: targets (sellers) gain, bidders (buyers)
lose or break even and the combined returns to the combined firms are modest but positive
(Becher et al. 2012). More specifically average premiums paid to sellers have been estimated to
be between 12-14%, while buyer gains hover around 0%. The positive performance of the
targets is not surprising. In most situations, if it were not for an attractive deal (oftentimes via
some material transaction premium) a target is highly unlikely to transact. Nevertheless, to some
the performance findings regarding the bidders are far more surprising. Specifically, evaluating
50 M&A studies evaluating buyer performance by transaction (Bruner 2009 and 2011), found
that 26% of deals show value destruction (significant negative returns), 31% show value
conservation (returns insignificant from zero) and only 43% show value creation (significant
positive returns). Although the averages derived from the Bruner analysis is enlightening it
should be digested with some caution. Bruner‟s methodology was to take an average of
2
estimates across 50 published studies irrespective of industry or geography. The Bruner results
also failed to take into account the importance of time horizons. Buyer positive returns tend to
primarily exist around the period of deal announcement and some short time window following
deal closing. Returns from the acquirer‟s perspective tend to deteriorate soon thereafter.
The primary focus of this Dissertation is an attempt to provide a new
methodology of evaluating M&A transactions where results are provided across specific periods
of time throughout a deal lifecycle. This multiple measurement approach when mapped to
critical business activities is informative in determining what capabilities add or destroy value at
different critical M&A milestone points. To accomplish this, the research is framed in an
adapted theoretical context that provides an enhancement to common practice.
Theoretical Framing
To gain insight into what drives the acquirer‟s true financial outcome and to help
inform practitioners on what can be done differently, a better theoretical approach to analyzing
an M&A transaction is needed. The simple financial algorithmic approach of a single metric of
return calculated once at some interval (often 3, 10 or 30 days) post-closing (or post-
announcement) of the transaction is somewhat limited. A far superior approach would be to
evaluate the transaction through an alternative lens to observe how the firm‟s resources deployed
on the deal are creating or destroying value throughout the deal lifecycle. The regulated energy
industry is a rather attractive industry for such an analysis as its transactions tend to have long
deal cycles with multiple critical and publicly disclosed transaction milestone dates. To
operationalize this approach requires first introducing the Resource Based View of the Firm
(RBV) theory and working up through Dynamic Capability (DC) theory and ultimately adapt
Acquisition Based Dynamic Capability (ABDC) concepts.
To fully grasp the saliency of ABDC theory in addressing the primary research
question of this study, one needs to start with a brief introduction of RBV. Despite RBV being
able to trace its origin all the way back to Ricardian economics, it was another economist Edith
Penrose who is widely considered as the single individual whose contribution is the most

3
influential in the development of what is now known as the RBV. Penrose‟s master work “The
Theory of the Growth of the Firm” (Penrose, 1959), conceptualized the firm as an entity meaning
much more than a simple administrative unit by adding depth to the definition. Penrose regarded
the firm as a complex institution created by people to serve the needs of people and with its
success linked to the efficient deployment of productive resources. According to Penrose,
dynamic interactions between resources and managerial decisions organized within an
administrative framework not only provide a thorough explanation of heterogeneity between
firms but also enable firms to have unique advantages relative to their competitors. Additionally,
according to Penrose, in order for a firm to have a true lasting competitive advantage, the transfer
of resources between firms must be difficult and the chance or ability of replication also made
difficult. Cut to its core, Penrose provided the notion that firms are people, people are resources
with heterogeneous skill sets, to the extent that these abilities are organized and managed
efficiently they have the potential of providing a competitive advantage. This competitive
advantage is sustainable as long as the skills are not easily imitable and the resources (people)
are not free to flow from one administrative unit (firm) to another. Much of modern day RBV is
built on these basic Penrose conclusions that were established six decades ago.
Whereas RBV provides a well thought out theory of how firms can earn super
normal profits in equilibrium in a static world, the RBV has a limited ability to address several
aspects of how firms today should develop and deploy their resources to achieve sustainable
competitive advantage. The theory of Dynamic Capabilities (DC) evolved from the static
limitations of RBV and is better equipped to dealing with a dynamic world. As a result, DC
should be viewed as a logical extension and compliment to RBV and in many aspects an
improved method of evaluating and understanding firm performance in today‟s business
environment (Kamasak, 2013).
Teece is considered by most to be the forefather of Dynamic Capability theory.
In seminal works first published in 1997 with Pisano and Shuen and then in multiple individual
contributions in the following years, most academics credit Teece with not only the initial
labeling of Dynamic Capabilities but also the widespread acceptance that the theory now enjoys.
According to Teece, the Dynamic Capabilities framework provides that organizations must
integrate and reconfigure their resources and capabilities to renew or alter their resource mix to

4
be able to maintain competitive advantage in a dynamic and changing environment (Teece,
1997). Furthermore, according to Teece, resources are acquired from a “sensing”, “seizing” and
“reconfiguring” process which provides a fundamental theoretical framework with regards to
how DC theory addresses resource acquisition or M&A activity in general. However, this
simplistic framework is generally light on specifics and is purely theoretical in nature.
So, to better understand the theoretical application of Dynamic Capabilities under
the situation of a corporate acquisition, the focus must shift from Dynamic Capabilities and
introduce its extension, Acquisition Based Dynamic Capabilities (ABDC) theory. According to
the pioneers of the theory including Helfat, Anand, Capron and Mitchell, Acquisition Based
Dynamic Capabilities (ABDC) includes three main elements; acquisition Selection,
Identification and Reconfiguration activities (Helfat, 2009) thus shifting from the Teece general
model.
An enhancement to the Capron and Anand ABDC framework can be
accomplished via a few slight definitional modifications. Whereas Capron and Anand divided
the ABDC capabilities into “Selection”, “Identification” and “Reconfiguration” a more
practitioner friendly (or stated differently, what happens in the real world) approach would be to
define the groupings as “Selecting and Identifying”, “Transacting and Executing” and
“Reconfiguring and Integrating”. Capron and Anand were correct to identify the importance of
Selection and Identification. However, in practice these are activities that are occurring
simultaneously and in many ways are interlinked with each other. Additionally, these activities
are almost always performed by the same individuals (resources) within an acquiring firm. To
have them as two of the three identified ABDC groupings distorts the manner in which these
activities are performed as well as how resources performing these activities are deployed. Thus
the first modification to the Capron and Anand ABDC model is the combining of what were
once the two categories of Selection and Identification.
One additional necessary modification to the Capron and Anand framework is the
identification of the unique category of “Transacting and Executing”. In the original framework
these critical capabilities (and resources) appear to be embedded in the “Identification” category.
Grouping these critical capabilities into the “Identification” category distorts what
“Identification” is intended to capture. Additionally, it also muddies the waters as to what

5
capabilities that are really being identified in addition to the resources that are being deployed to
perform these activities. Similar to the redefining of “Selection and Identification” the creation
of the “Transacting and Executing” grouping is an enhancement to the original Capron and
Anand framework.
The final Capron and Anand grouping, “Reconfiguration” and “Reconfiguring
and Integrating” in this author‟s enhancement is virtually identical. The only practical difference
is a slight modification to the grouping name to reflect the term “integration” which is a term of
art for M&A practitioners. Otherwise the capabilities and resources necessary to be deployed to
be successful are the same for “Reconfiguration” and “Reconfiguring and Integrating”. Making
these slight modifications to the ABDC framework of Capron and Anand provides a practical
enhancement to the ABDC theory and has the added benefit of closer resembling the true real
world process and necessary capability and resource requirements of M&A practitioners.
Once the modified ABDC approach is developed, the researcher is now well
positioned to query this Dissertation‟s primary research question:
“What Acquisition Based Dynamic Capabilities (ABDC) are the most
critical in enhancing value for energy companies engaged in M&A?”
Methods
To attempt to answer the question of “What acquisition based dynamic
capabilities are the most critical in enhancing value for energy companies engaged in M&A?” a
methodology was needed to be established. The sections below summarize the data sampling
and collection method, identified theoretical constructs, definitions of groupings, descriptions of
dependent and independent variables, specified models and the approach to the analysis.
The subject of the research is the effectiveness of ABDC capabilities in M&A
transactions occurring in US investor owned (excludes municipal “munis” and cooperative “co-
ops”) regulated energy companies. As the research utilizes equity stock returns as part of the
calculation of the dependent variable, the sample set is limited to publicly owned and traded

6
companies as there is a daily near real time public mark of their traded equity. To provide for a
robust data set the study contains all the regulated energy transactions that have occurred over
the twenty year time horizon 1995 to 2014. The twenty year window provided adequate
variation among industry conditions and also provided a robust set of observations for the
analytical inquiry.
The desire to bind the study to the regulated energy industry had some attractive
benefits. For example, by keeping the study focused within one industry provides for a more
controlled environment where factor effects were more easily isolated and evaluated. An
additional benefit of utilizing the regulated energy industry was the long transaction cycles that
occurs from deal origination to when the acquisition is finally approved and eventually
integrated into the acquirer. It is not uncommon for regulatory cycles to occur over a period of
multiple months and for deals to span from start to finish 18 months or more. This amount of
elapsed time provided for very discernible periods to test the ABDC capability groups.
The study was limited to using public companies. As a limitation of utilizing
shareholder value metrics (stock price) as a means of determining changes in equity value, the
study was limited in using firms that have publicly available reporting of the their share prices.
Private companies by their general nature do not have this requirement. SNL Energy
Transaction Database, Thompson Reuters and Bloomberg Financial Services provided some of
the necessary transaction data for the M&A deals that are the focus of this study. Capital IQ and
SNL databases were helpful in providing additional industry specific transaction detail and some
company specific financial and performance data. These data sources also provided basic
information on the management teams and leadership experience of the acquiring firms.
Company website and SEC filings were also helpful in filling in additional data gaps.
Overall 1,075 transactions were considered for inclusion into the study. 545 of
the transactions were discarded as a result of having a closing cycle (the amount of time lapse
between when a deal was announced to when it closed) of less than 30 days. An additional 193
transactions were excluded from the data set as a result of the corporate ownership structure of
the acquirer being private (unlisted).

7
After discarding the private entity transactions and short cycled minor
transactions, the dataset was reduced to include 337 successful acquisitions of regulated energy
entities (some were entire company, some assets or subsidiary transactions) made by publicly
traded companies between 1995 and 2014. As the research investigates ABDC capabilities as
measured through the lens of the acquirer, the target companies need not be public companies
and in many of the studied transactions they were not.
In order to evaluate the effectiveness of specific Acquisition Based Dynamic
Capabilities at the firm and transaction level, a quantitative general M&A transaction model was
developed. ABDC and general M&A theory was helpful in suggesting a series of theoretical
constructs that should be modeled in the development of a theoretically sound set of variance
models. The general research model identifies constructs (Industry Specific Shock,
Consolidation Wave, Industry Dynamics, Bandwagon Factors Impacting Management,
Management Traits of the Buyer, Financial Environment and Structure of the Transaction,
Complexity of the Deal). The rather robust body of merger and acquisition literature was
utilized to determine that these constructs should be included in the general model and also
suggests what relationships these constructs should have among each other and the dependent
variable.
In order to evaluate the effectiveness of specific Acquisition Based Dynamic
Capabilities at the firm and transaction level, the acquisitions were classified into different
groupings. One classification was based on the primary sector of the industry that the target
business represented (“Industry Groups”). Another classification was based on overall company
performance (“Leaders and Laggards”). One grouping was based on ABDC performance of
each acquirer as measured at various timing intervals of the transaction (“Top Performers” and
“Poor Performers”).
Dependent variables were defined to quantify the variance observed across the
ABDC groupings. As proxy measures for the effectiveness of a company‟s efforts towards S&I,
T&E and R&I, value creation (or destruction) measurements were calculated and defined as the
acquirer‟s change in market equity value over a specified period of time. This approach allows
for the measure of the relative value enhancement (or destruction) caused by the firm‟s resource

8
performance within the various ABDC time intervals throughout the deal lifecycle. Admittedly,
these are proxy measures of theoretical constructs but arguably a well-reasoned approach.
Additionally, the analysis focused on both weak and semi-strong approaches to
measuring value creation. The weak forms included simple return metrics whereas the semi-
strong approaches included methodologies that attempt to determine how much better off the
returns are for the acquiring firm was as a result of performing a certain action vis-à-vis a
hypothetical situation of having done nothing. This approach controlled for the fact that markets
are dynamic and looking at static returns of a transaction without normalizing for market activity
provides an inaccurate measure of true value creation.
The combination of weak and semi-strong methods in addition to the multitudes
of timing horizons that could be utilized provides for ample ways of measuring the S&I, T&I and
R&I capabilities. As a result, where it makes sense to work with one set of measures, a “Golden
Measure” has been defined to reflect the single best way to evaluate each of the ABDC
capabilities.
To operationalize the Construct Model into actual testable equations the
constructs needed to be developed into a set of quantifiable independent variables to help explain
variation in the dependent variables. Prior research was informative with regards to the
appropriate variables to utilize and their expected impact on the ABDC categories. The prior
work of Anand (2005), Capron and Pistre (2002), Capron, Dussauge and Mitchell (1998),
Capron, Mitchell and Swaminathan (2001), Bruner (2011), Haleblian (2009), Helfat, et al. (2009)
Teece (2009) among many others provide the guiding principles for much of the variable design.
With the construct model developed, variables defined, descriptive statistics
provided and data collected, a set of empirical models was provided so that the relationships and
impacts of the independent variables on the specified dependent (ABDC) variables could be
evaluated. Separate models are defined for each of the ABDC categories, Selecting and
Identifying, Transacting and Executing and Reconfiguring and Integrating.

9
Analysis
Standard analytical techniques were utilized to test for central tendencies,
significant relationships and differences and to quantify expected impacts of the defined factors
on the ABDC category variables in the context of the 337 regulated public company energy
transaction dataset.
Central tendencies were evaluated using statistical techniques on the descriptive
data. Means and medians were analyzed to determine central tendencies and data skewness was
evaluated via histogram and scatterplot analysis. Outliers were evaluated to ensure data
consistency throughout the data set. T-testing for the differences of the means of the variables
was utilized to determine significant differences across subgroups of the transaction data set.
This included analysis comparing Leaders versus Laggards, across industry segment and analysis
of the factors differentiating Top Performers (for each ABDC category) with Poor Performers
(for each ABDC category). Correlation analysis was used to describe the strength and the
direction of the linear relationships between the variables. Pearson Moment Correlation
Coefficients (r) were calculated for the continuous variables in the study, whereas Spearman
(rho) was calculated for the binary dummy variables.
Seven specified models were run through ordinary least squares (OLS)
multivariate and quantile regression to determine the variation in the dependent variables that are
explained by the predictor variables and to also evaluate what factors have a statistically
significant relationship and their impact on the dependent variables. Results were evaluated
across industry groups and comparisons across Leaders and Laggards. The Models overall
adequacy was evaluated utilizing the F statistic and its associated p factor. R square and adjusted
R square metrics were reviewed to determine how much of the variation in the dependent
variable was explained by the predictor variables. Each model was also evaluated for power and
the implied factor effects of its results. The residuals of the models were evaluated to ensure for
normality and to also evaluate for heteroscedasticity. Similarly, Variable Inflation Factors
(VIFs) were analyzed to check for any problematic levels of multicollinearity of the independent
variables. Additionally, individual independent variable analysis was conducted for significance
and impact evaluating beta coefficients, t-scores and p-values.

10
The results were then compared to determine common themes across the data set
and to help provide insight into the topic of where value is created and lost across the ABDC
categories and whether certain factors are significantly contributing to the value enhancement (or
destruction) during each ABDC phase of a regulated energy acquisition. This analysis provides
the insight necessary to properly address the research question:
“What Acquisition Based Dynamic Capabilities (ABDC) are the most
critical in enhancing value for energy companies engaged in M&A.
Results
Overall, companies on average do see some small value enhancement from
announcement returns as a result of their performance in Selecting and Identifying. These results
suggest on average about 0-1% value enhancement for the acquirer when a transaction is
announced. Of the 337 transactions studied, 184 (56.4%) had positive announcement returns
when measured on a 3 day abnormal basis. On average Utility and Midstream and
Transportation transactions had better announcement returns than Resource and Electric
company transactions. Overall, the Top Performers gain averaged 2.2%, whereas, the Poor
Performers experienced value destruction of -1.5% during S&I.
Furthermore, companies on average experience additional value enhancement at
the closing of their transactions (measured on a 30 day post-close timing window) during the
Transacting and Executing phase of the deal. These results suggest on average about 0.3% value
enhancement for the acquirer after the closing of the transaction. Of the 337 transactions
studied, 176 (52.2%) had positive post-closing short-term returns as measured on a 30 day
abnormal basis. On average Resources and Utility transactions had better short-term post-close
transaction results than Midstream and Transportation and Electric company transactions. The
spreads between the Top Performers and Poor Performers also widened. The gains of the better
acquirers averaged 5.1% short-term post-close, whereas the poorer acquirers experienced value
destruction of -3.6%.

11
Despite the value enhancement experienced by a majority of firms between deal
announcement and short-term post-close, a large majority of firms gave back those gains (and
often times much more value) over the first year post-close during Reconfiguring and
Integrating. The median value loss over the first 360 days post-close for the 337 studied
transactions was -7.4% as only 99 of the 337 (29.4%) deals had positive returns during the
Reconfiguring and Integrating phase of the transaction. Results on average were poor across all
of the industry segments ranging from a high of -4.9% for the Utility deals to a low of -9.8% for
the Midstream and Transportation transactions. Each industry group experienced value
destruction in approximately 65-70% of the transactions in their energy segment during R&I.
Even companies that are considered as being strong at R&I, averaged a mere 3.3% gain, whereas
the companies who exhibited poor R&I performance experienced a loss in value of over 20%
during the first 360 days.
When viewed in totality, these results are consistent with previous research
concerning the relatively poor performance of acquisition returns for the acquirer. However, the
results do suggest that some of the differences can be traced to different approaches to
measurement and timing differences of the event window. Furthermore, what does appear to be
even more interesting are the significant differences between Top Performers and Poor
Performers for the individual ABDC categories. There appears to be significant differences in
how these two groups approach M&A and a very significant difference in market returns as a
result.
Contributions
Contributions are provided to both theory and practice as a result of the findings
of this research. The theoretical contribution is twofold. Firstly, the study provides a much
needed quantification of ABDC theory and, secondly, the ABDC theoretical model is extended
to better reflect the M&A transaction process. Practical contributions can be grouped into three
categories. Firstly, the better approach to measurement of M&A performance across critical
steps of a deal transaction. Secondly, the identification of what factors contribute to differences
in M&A return performance across transactions. Lastly, the reiteration of the importance of the
12
capabilities involved in Reconfiguring and Integrating to overall M&A deal transaction success
and the large gap between Top and Poor Performers in R&I.
Dissertation Outline
This Dissertation is organized into eight primary chapters: 1) this Introduction
section which provides an outline and summary of the Dissertation, 2) a Literature Review
chapter which provides the theoretical framing and buildup of the applicable theory, 3) the
Adapted ABDC Framework chapter develops the argument for the need to extend the existing
ABDC theory, 4) the Methods section describes the study‟s methodology and analytical
approach and utilized techniques, 5) the Results section contains the analysis and results of the
utilized analytical techniques, 6) the Discussion chapter evaluates the results and provides the
key findings of the research, 7) the chapter on Contributions highlight the potential contributions
to both practice and theory as a result of this research, and 8) the Conclusion chapter concludes
the Dissertation with the author‟s view on limitations, some recommendations for future research
and a brief summary of the Dissertation.
13
CHAPTER II - LITERATURE REVIEW
M&A Overview
Researchers have provided a rather robust body of scholarly work in the field of
mergers and acquisitions. It has been over four decades since the pioneers in the field published
their foundational works in industrial organization and applied merger and acquisition research,
thus jumpstarting the academic inquiry into why firms merge, acquire or are sold. Throughout
the 1970s and 1980s hundreds of journal articles were published, further advancing theory as
new contributors stood on the shoulders of the early luminaries. The 1990s with the
advancements in technology and with the availability of enhanced data, the field continued its
rapid advancement with many contributions featuring massive data sets and increasingly
complex quantitative methodologies. By the 2000s the body of research had become so vast that
dozens of literature, meta and systematic review articles were published to assist the academic
community in synthesizing the vast array of M&A related papers spanning fields such as
economics, finance, management, sociology, accounting, and organizational behavior.
There is ample support in the literature to conclude that when taken on average
and across industries from a value creation perspective: targets (sellers) gain, bidders (buyers)
lose or break even and the combined returns to the combined firms are modest but positive
(Becher et al. 2012). More specifically average premiums paid to sellers have been estimated to
be between 12-14%, while buyer gains hover around 0%. The positive performance of the
targets is not surprising. In most situations, if it were not for an attractive deal (oftentimes via
some material transaction premium) a target is highly unlikely to transact. However, to some the
findings regarding the bidders are far more surprising. Specifically, evaluating 50 M&A studies
evaluating buyer performance by transaction (Bruner 2009 and 2011), found that 26% of deals
show value destruction (significant negative returns), 31% show value conservation (returns
insignificant from zero) and only 43% show value creation (significant positive returns).
Although the averages derived from the Bruner analysis is enlightening it should be digested
14
with some caution. Bruner‟s methodology was to take an average of estimates across 50
published studies irrespective of industry, time horizon or geography. Nevertheless, the
conclusion of poor buyer results was consistent across these studies as buyers only added value
on two out of every five transactions. The Bruner results did fail to take into account the
importance of time horizons. Buyer positive returns tended to primarily exist around the period
of deal announcement and some short time window following deal closing. Returns from the
acquirer‟s perspective tended to deteriorate soon thereafter. What is unclear is how acquirers
perform over the entire deal lifecycle. Although the Bruner analysis (and other papers with
similar methodologies and consistent findings) is helpful in the understanding of “How?”
unattractive M&A performance is for the acquirer, we need to look to merger wave theory for a
slightly better explanation as to the “why?”
M&A Research Approaches
To explore potential reasons of why acquirers‟ performance is poor t first needs to
be established how transaction and deal return measurement is performed. Four research
approaches offer a means to forming a view regarding M&A success (profitability); they are
Accounting Studies, Surveys of Executives, Clinical (Case) Studies and Event Studies. Each of
these approaches offers its own weaknesses and strengths which are highlighted below. No
research approach is perfect, however some command more respect in the academic community
than others, whereas other methods tend to be the preferred method of evaluation for
practitioners. For reasons that should become clear, the event study approach defined below is
the most appropriate method for this research project.
Accounting Studies examine the reported financial results of acquirers before and
after acquisitions to determine how financial performance changed. The focus of these studies
often range across net income, return on equity or assets, earnings per share (EPS) and other
standard financial metrics. A preferred approach is to utilize a method of matched sample
comparisons as they benchmark firms that acquire, with a control group of firms that do not

15
acquire. The most appropriate comparisons commonly utilized control for drivers such as
industry, size, scope of operations and other key company differentiating factors. The thrust of
these studies is to determine if those who have made acquisitions have outperformed those who
have not over a specific time horizon. One of the advantages of accounting studies is that the
financial data is certified through an audit function and are thus deemed as trustworthy.
Weaknesses of utilizing accounting studies are the timeliness (and backward looking nature) of
the financial statements, as well as the actual comparability of the target and control groups
being utilized (Bruner, 2011).
The Surveying of Executives is another approach utilized to study M&A
performance. By asking key stakeholders (often through structured and semi-structured
interviews and questionnaires) their point of view, often provides interesting insight towards the
motivations, challenges and eventual effectiveness of a company specific M&A transaction. The
more powerful studies (although somewhat rare in form) are conducting in a manner that
provides for a statistically significant amount of informants across each study transaction to
provide for data that can be analyzed through widely accepted analytical techniques. Benefits of
this approach are that it provides insights into value creation that may not be understood or
generally apparent in the broader equity markets. Additionally, this approach can often provide
insight into nuanced specifics of the transaction otherwise unobtainable from a broader market or
accounting base approach. The survey approach does have its own limitations that researchers
need to work through. Low participation rates in most survey instruments and accurate
recollection of past events are two weaknesses of most concern (Bruner, 2011). Additionally,
rules of disclosure and treatment of Material Non Public Information (MNPI) also often prevent
research programs from utilizing this design methodology from being fully transparent (Yin,
1997).
Clinical Studies are another approach commonly utilized by researchers to study
M&A performance. Clinical studies focus on one transaction or on a small sample in great
depth, usually deriving insights from field interviews with executives and knowledgeable
observers. By its general nature it is inductive research (Myers, 2012). By drilling down into
lower levels of background and detail of the target transaction, researchers can often add a
16
richness to their data and analysis that would otherwise not be possible. One of the strengths of
this inductive research method is that it is ideal for discovering new patterns of behavior that
might not be otherwise noticeable. However, like most case study research this approach does
have some limitations as far as generalizability and statistical rigor. Furthermore, the time
investment required to conduct a rigorous case study in the hopes of uncovering meaningful
results is somewhat of a gamble (Yin, 2005).
M&A Event Studies examine the abnormal returns to shareholders in the period
surrounding key dates of a transaction. One method that is commonly used is to calculate the
simple return for one period, calculated as the change in share price and any dividend that is
paid, divided by the closing share price over the same period. An abnormal return is simply the
simple return less an industry standard measure over the same period. These studies are regarded
to be forward looking on the assumption that share prices equal the present value of expected
future cash flows to shareholders. Event studies come with many advantages. They provide a
direct measure of the value that is created to an investor for the given event and are typically the
standard approach that is utilized when evaluating the overall effectiveness of a transaction over
a given time period. Despite their popularity, event studies do have some negative aspects.
They do require a firm belief that equity markets are efficient, including being transparent and
rational and that they provide a near real time indication of value.
Additionally, event studies are subject to confounding events which could skew
the returns within a specified time window and cloud the analysis of the studied phenomenon.
Nevertheless, despite the limitations, since the 1970s, event studies have dominated the field of
M&A scholarship (Bruner, 2011). For the purposes of this research project the event study
approach is most appropriate.

17
Measurement of M&A Performance
Regardless of which of the four study design approaches described above, is
deemed to be optimal for the given M&A research project, the researcher must still determine the
appropriate manner to measure performance for the transactions in the study. Three broad
groupings exist, defined by Bruner as, “Weak form”, “Semi-strong form” and “Strong form”.
Each measurement approach provides for its own strengths and weaknesses and is discussed
below (Bruner, 2011).
Weak form methods are generally concerned with the basic question of whether
the share price increased or did it decrease over a specified period of time. Is the stock price
higher after the transaction than it was before? And from the answer the conclusion of whether
the equity investor is better off after the transaction than they were before the transaction would
be addressed. This “before and after” approach is widespread, especially in the popular press
and in most practitioner based business periodicals. However, it is considered a weak form test
as it neglects to control for any of the countless other factors that could have been the cause of
the change in stock price. Stock prices are impacted by company events, industry events, general
world and economic conditions, and a near infinite amount of other factors that could have
impacted whether a given stock had a positive or negative price adjustment over a giver period.
As a result, weak form test are notoriously unreliable. However, they are in many cases the
standard that which company leaders (CEOs, Boards of Directors, and others) are held to and
cannot be summarily discarded. Weak form performance measures though imperfect play an
important role in bridging academic research with practitioner based behavior. Company leaders
are well aware of the weak form performance metrics and tend to be rather oblivious to semi-
strong or strong metrics so completely ignoring the inferior methods run the risk of making the
research less approachable to the typical practitioner (Bruner, 2011).
An improvement from a weak form analysis is an obtained by utilizing a semi-
strong form approach. Did the acquirer‟s returns exceed a certain benchmark? Are shareholders
better off compared to the return on a benchmark investment? To the extent that the benchmark
is a close proxy for what an alternative investment with a similar return and risk profile further
18
enhances the strength of this analysis. The semi-strong approach is widely utilized in academic
research because it is far superior to the weak form approach as it controls for the possibility that
the observed returns were actually driven by broader industry or economic factors out of the
control of the acquiring company or directly related to the merger. Although far superior to a
weak form approach, the semi-strong approach is also not perfect as it is highly sensitive to the
benchmark that is selected. Researchers attempt to limit this effect by taking great care in
choosing appropriate benchmarks and also whenever possible utilizing large sample sizes
(Bruner, 2011).
Strong form approaches attempt to answer the question of whether shareholders
are better off after the transaction than what they would have been had the deal never taken
place. This approach attempts to quantify the true opportunity cost of a given transaction and
would be considered the “gold standard” of M&A performance measurement. The problem is
that in an absolute sense the concept is purely theoretical and unobservable. In reality,
companies either transact or not and having a parallel existence of studying the acquiring
company over one period of time under two versions of reality (1-transaction completed and, 2-
transaction not completed) is purely theoretical and immeasurable, thus the strong form is not
operational in the real research world. As a result, researchers are left with various derivations of
semi-strong approaches whereas practitioners latch onto weak form measures for the reasons
suggested above (Bruner, 2011).
This research project primarily utilizes semi-strong form approaches.
Additionally, much care and effort is utilized in choosing appropriate benchmarks and control
groups when quantifying the abnormal returns reported here. Nevertheless, a theoretical
weakness of any project like this will be the appropriateness of the chosen controlling
benchmarks. Additionally, despite being weak form approaches, simple returns are also reported
and analyzed in this research project. Admittedly, inferior to semi-strong metrics in many
instances, they are the standard bearer from a practitioner perspective and should not be
summarily discarded. Many a CEO has been fired; shareholder lawsuit filed and Board of
Directors reconstituted as a result of absolute poor stock performance. Whether the equity
returns would have been viewed in this situation in a more positive manner on an abnormal

19
return basis is irrelevant. As this project attempts to tap into the motivations of CEOs and
management teams to acquire despite the historically poor performance of acquirers, further
supporting the fact that simple weak form return approaches should be included in this analysis
Merger Wave Theory
In addition to the importance of study approach (event study) and measurement
approach (weak form and semi-strong form) timing also matters. To help in understanding
M&A timing impacts on performance, merger wave theory needs to be discussed. A merger
wave can be defined as a short period of intense merger activity resulting from a material
industry event. Merger waves happen at the aggregate level (across industries) and within
industries. Merger waves are not new although the study of them by academics is an area of
relative recent interest. It is estimated that nearly 50% of the mergers that have occurred in the
United States between 1890 and 1990 occurred during one of four merger waves.
Merger wave theory and its impact on the M&A research literature has really
caught traction in the past decade and is now considered widely accepted across academia.
Andrade et al. (2001) reasons that merger waves are the result of sudden and unexpected shocks
to industry structure. Andrade, analyzing 4,300 deals over a 26 year period concluded that not
only does merger activity cluster by industry into waves; these waves are the result of industry
shocks. Andrade further argued that the most impactful shock to any industry is one that results
in widespread deregulation. Deregulation is not the only shock capable of triggering a merger
wave, although it appears to be the stimulus with the most direct result.
Continuing the work of Andrade, the contributions of Harford (2004), Carow et
al. (2004) and McNamara et al. (2008), significantly advanced the study of wave impacts on
M&A. Harford came first in his paper titled “What Drives Merger Waves?” The author studied
M&A activity over a twenty year period with results that supported the earlier findings of
Andrade. He concluded that waves are the result of shocks and are often caused by deregulation.
Merger waves tended to be industry specific and when enough industries were in a simultaneous

20
wave, a market wide wave would be experienced. Harford also introduced market liquidity as a
necessary condition to have a wave. The liquidity requirement was an enhancement building on
the research of Andrade.
Andrade and Harford were among the first to identify (or at least name) merger
wave theory and what causes them within industries, whereas Carow et al. (2004) was among the
first to suggest that M&A transactions within a wave vary in expected financial outcome
depending on the timing of the transaction. The Carow paper even asks within its title “Do Early
Birds Get the Returns?” Carow finds that early adopters (companies that complete transactions
early within a wave) have far superior financial results (wealth creation above normal expected
market returns). He reasons that the company that picks first usually gets the best picking.
Specifically, “strategic pioneers” are the most likely to gain value, because the pool of potential
targets is the largest and the most attractive options remain available (Carow et al. 2004).
Despite the contribution, Carow did not address either the apparent acceleration of M&A activity
occurring at the end of an M&A cycle, or the motivations of companies to jump into the M&A
game late (when terms are less attractive and number of potential counterparties dwindling).
McNamara et al. (2008) continued down a similar path to Carow. Using a twenty
year sample 1984-2004 and a similar wave definition as to Carow; McNamara‟s results not only
support the advantages of transacting early (using the phrase “first mover advantage” – FMA)
with similar findings to Carow‟s “early birds” but also quantified the penalty of coming late to
the game (defined by McNamara as “bandwagon jumpers” and by Carow as “copy cats”). The
logic provided for the existence of a significant “lateness penalty” was the near equivalent to the
inverse of the first mover advantage. This argument suggests that as options lessen for a
potential acquirer, they may feel compelled to do a marginal deal. Simultaneously, as the market
perceives an industry merger wave is in effect, all likely potential targets tend to experience an
appreciation in equity value as the market bids up these expected targets in anticipation. Thus,
further enhancing the potential transaction cost (and penalty) for the late participant.
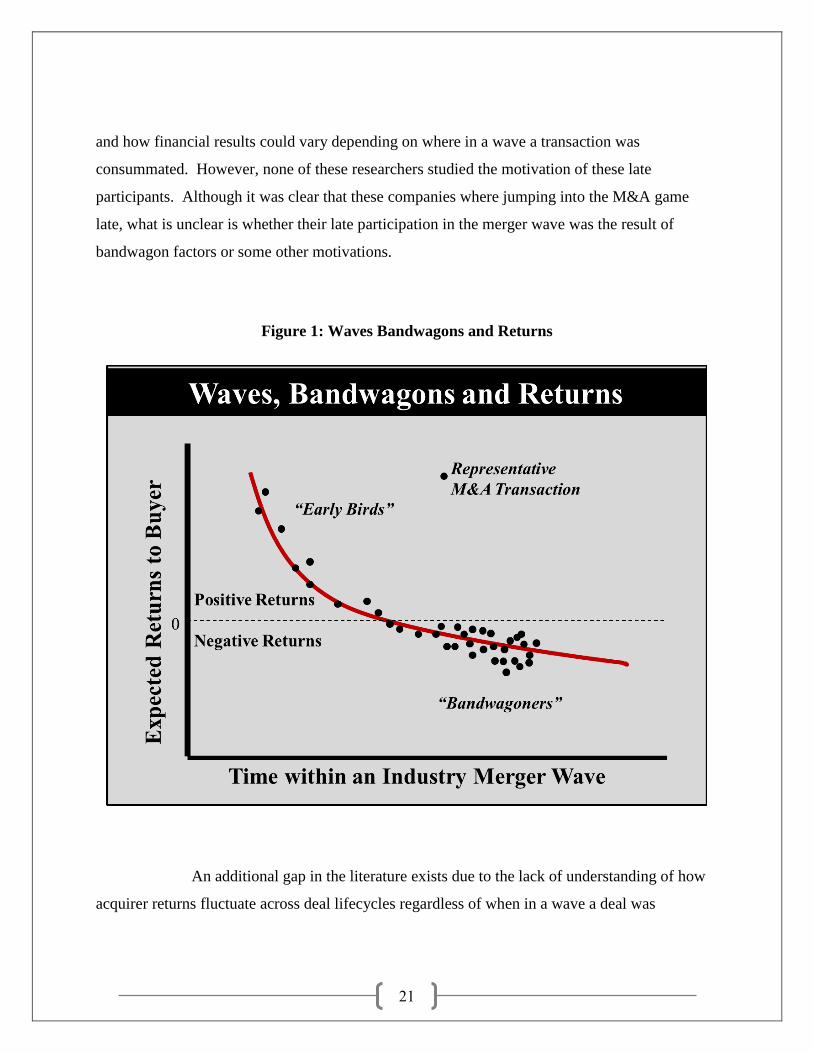
Collectively, the contributions of Andrade (2001), Harford (2004), Carow (2004)
and McNamara et al. (2008) better defined what a merger wave was, what caused them (shocks),
21
and how financial results could vary depending on where in a wave a transaction was
consummated. However, none of these researchers studied the motivation of these late
participants. Although it was clear that these companies where jumping into the M&A game
late, what is unclear is whether their late participation in the merger wave was the result of
bandwagon factors or some other motivations.
Figure 1: Waves Bandwagons and Returns
An additional gap in the literature exists due to the lack of understanding of how
acquirer returns fluctuate across deal lifecycles regardless of when in a wave a deal was

22
occurring. This is of particular interest in transactions that span multiple years from initial
screening to the completion of full integration.
Although merger wave theory helps explain some of the variation found across
acquirers expected results over time; the findings remain intellectually interesting but not
operationally satisfying. Unfortunately, acquirers never know precisely where they are in a
merger wave or cycle. Astute M&A practitioners understand the basics of buying into a heated
and perhaps overpriced M&A market as well as the difference between being an early bird
versus a late comer to a rising market. However, most after the fact assessments provide little
value to a firm that has already signed a deal and is contractually committed.
To develop a more useful analysis of when there are opportunities for firms to
create value or when is the time to avoid certain opportunities, the M&A transaction needs to be
disaggregated into component parts, the elements identified within those parts and then
determine what skills or capabilities are available to create value during a discrete time interval
within a M&A transaction. To accomplish this, M&A transactions need to be evaluated from a
resource perspective and specifically be utilizing some of the theoretical insights developed in
the Resource Based View of the Firm (RBV), Dynamic Capabilities (DC) and Acquisition Based
Dynamic Capabilities (ABDC).
Regulated Energy Industry Considerations
Interestingly, the regulated energy sector has been somewhat of an ignored
industry in much of the M&A literature. Arguments for this exclusion have been justified for
various reasons. For example, regulated utilities by their very nature operate in non-competitive
markets (and in many cases are true monopolies). Also, they often have a controlled economic
and financial composition, including: approved rate base, regulated rates of equity return and
mandated debt to equity capital structures. Whereas regulated energy M&A activity may share
some of the same psychological motivations, the economic drivers are less critical and are often
under the control of the regulator. Furthermore, regulated energy transactions tend to be

23
motivated by reasons such as: a means to address low organic growth or a way to offset some of
the risk of pending regulatory changes. As a result, special treatment for the regulated energy
industry in the M&A research literature has been justified.
Historically, regulation (state and Federal) has had a material effect on utility
M&A activity. The phenomenon of regulation driving industry consolidation is not unique to
utilities (e.g. banking, insurance, financial services, airlines, etc.), however, the relevant pieces of
regulation tend to be industry specific. The 1935 Public Utility Company Holding Act
(PUCHA), the Energy Policy Act of 1992 (EPAct 1992) and the Energy Policy Act of 2005
(EPAct 2005) among other landmark legislation collectively re-shaped the scope and scale of
M&A activity in the regulated energy industry. These landmark pieces of legislation provided
clear inflection points of consolidation over the past 80 years.
In their extensive evaluation of 384 utility transactions from 1980 to 2004, Becher
et al (2012) provided a stirring endorsement for utility M&A. Utility M&A was found to be a
significant value creating experience for the combined shareholders of the buyer and seller,
providing positive and significant wealth effects. Rate payers also benefitted from these
transactions, via realized cost synergies that were provided as either part of the regulatory
approval or subsequent rate case. Becher et all (2012) provided a foundation by suggesting that
utility M&A provides significant overall cumulative net benefits to stakeholders (buyer, seller
and consumer) that far exceed results in other industries. However, the research was unclear as
to what extent this trend is sustainable. Similarly, although Becher centered his study on a major
shock wave event (the 1992 EPAct) this was not the focus of his study. It was unclear if this
study simply measured the early stages of a wave when multiple attractive transactions were
available.
There are other industry specific factors that need to be addressed to properly
determine if bandwagoning impacts regulated energy industry acquisition performance.
Although not as bountiful as the multi-industry M&A research that has been conducted over the
past four decades, there is a growing body of industry specific research that applies. Leggio and
Lien (2000) argued that researchers need to consider the role of the regulator and its impact on
24
return expectations of deal participants engaged in the transaction. Leggio and Lien (2000) was
consistent with the arguments of Bartunek et al. (1993) in their earlier study of 57 electric utility
deals from 1980 to 1991. Leggio and Lien (2000) in their study of 76 electric utility deals
announced between 1983 to 1996 found that for reasons such as the time necessary for
regulatory approval, the less than certainty that the deal will be ultimately approved and the fact
that merger related benefits need to be shared with the consumer, targets received significantly
lower premiums from buyers. Both Bartunek (1993) and Leggio and Lien (2000) suggested that
despite the upside on these transactions being muted, the downside was also essentially capped.
As there was a tendency for the regulatory process to kill deals that appeared to be too costly to
the buyer by refusing approval (essentially protecting the buyer from themselves). Also, on
cases where the buyers were positioned for an economic profit, the regulators tended to provide
conditional regulatory approvals so that those windfalls were passed onto the consumer. Thus
the argument for the existence of a tighter return distribution (and lower risk) paradigm is
supportable.
The work of Becker-Blease et al. (2007) continued the line of thinking that major
regulatory events create shocks and these shocks in turn have the potential of spawning a merger
wave if the capital markets are receptive. They also anchored on the EPACT of 1992 and
analyzed 70 announced energy deals announced between 1992 and 2001. Interestingly they
viewed the entire period as a single wave. They concluded similar to Berry (2000) that generally
speaking, deals during this period destroyed shareholder value. Interestingly, the results for the
1992 to 2001 period used by Becker-Blease were not as negative as the Berry sample of 1995 to
1998. The studies did have some differences as well with respect to approach on the treatment of
diversifying mergers (electric utilities buying a gas utility) and how best to deal with complexity
of geographical scope. Nevertheless, as it relates to regulated energy M&A, the period from
1995 to 1998 was harsh from a wealth creation perspective as argued by Berry, whereas the
broader 1992 to 2001 period was not great but overall not nearly as bad. Suggesting that there
were perhaps periods within the 1992 to 2001 range where results should have been positive
(offsetting the 1995 to 1998 results some). These results support the argument that wealth
creation via regulated energy M&A transactions is not consistent across all periods all times

25
within a wave. Stated another way, “early birds” get the returns, “bandwagon jumpers” tend to
get crushed.
Despite the growing understanding of merger wave dynamics and its impact on
expected acquirer returns, the literature is thin on evaluating the true decision making process
that companies go through before making an acquisition decision. Furthermore, the related
concept of how this decision making process changes as an industry moves deeper into a merger
wave, where mounting peer pressure to transact increases or the sense of lost opportunity and
diminishing viable options become more real to any company that has not consummated a
transaction is also not fully understood. Although the psychology of acquirer purchasing
behavior is outside the scope of this project the impact of timing and merger waves and company
performance in evaluated.
To gain insight into what drives the acquirer‟s true motivation to transact and
potential effect on financial outcomes and to help inform practitioners on what can be done
better, a better theoretical approach to analyzing an M&A transaction is needed. The simple
financial algorithmic approach of a single metric of return calculated once at some interval (often
3, 10 or 30 days) post-closing (or post-announcement) of the transaction is somewhat limited. A
far superior approach would be to evaluate the transaction through an alternative lens to observe
how the firm‟s resources on the deal are creating or destroying value throughout the deal
lifecycle. The regulated energy industry is a rather attractive industry for such an analysis as its
transactions tend to have long deal cycles with multiple critical and publicly disclosed
transaction milestone dates. Furthermore, to operationalize this approach requires first
introducing the Resource Based View of the Firm (RBV) theory and working up through
Dynamic Capability (DC) theory and ultimately an adaptation of Acquisition Based Dynamic
Capability (ABDC) concepts which is a far better approach to analyzing this topic than what is
currently utilized as common practice.

26
The Theoretical Evolution from RBV to ABDC
Resource Based View of the Firm (RBV)
To fully grasp the saliency of ABDC theory in addressing the primary research
question of this study, you have to start with the building blocks and a brief introduction of RBV.
Although the term RBV is only three decades old its roots can be traced back for centuries.
Despite Wernerfelt being given credit for the inclusion of the Resource Based
View (RBV) into mainstream strategic management theory, its basic tenets can be traced as far
back as David Ricardo in 19th
century England. As it was Ricardo who argued that rents could be
earned due to the ownership of valuable resources that are scarce, immobile and likely to persist
in equilibrium. This mindset influenced early RBV theorists from the perspective that these
superior Ricardian resources (such as land rights, benefits of prime location, patents, copyrights,
etc.) can be acquired by superior resource picking skills of the organization (Ricardo 1817).
Although this perspective focused on static resources, it considered the resource picking skills as
an organizational skill critical in the determination of resource acquisition which is a core
building block to creating competitive advantage.
Despite RBV being able to trace its origin all the way back to Ricardian
economics, it was another economist, Edith Penrose who is widely considered as the single
individual whose contribution is the most influential in the development of what is now known
as the RBV. Penrose‟s master work “The Theory of the Growth of the Firm” (Penrose, 1959),
conceptualized the firm as an entity meaning much more than a simple administrative unit.
Penrose regarded the firm as a complex institution created by people to serve the needs of people
and with its success linked to the efficient deployment of productive resources. According to
Penrose, dynamic interactions between resources and managerial decisions organized within an
administrative framework not only provide a thorough explanation of heterogeneity between
firms but also enable firms to have unique advantages relative to their competitors. Additionally,

27
according to Penrose, in order for a firm to have a true lasting competitive advantage, the transfer
of resources between firms must be difficult and the chance or ability of replication also made
difficult. Cut to its core, Penrose provided the notion that firms are people, people are resources
with heterogeneous skill sets, to the extent that these abilities are organized and managed
efficiently they have the potential of providing a competitive advantage. This competitive
advantage is sustainable as long as the skills are not easily imitable and the resources (people)
are not free to flow from one administrative unit (firm) to another. Much of modern day RBV is
built on these basic Penrose conclusions that were established six decades ago.
Despite developing the foundational concepts of RBV, Penrose is not given credit
for naming the theory. The credit for the formal labeling of the developing RBV theory is given
to Wernerfelt. Wernerfelt‟s 1984 Strategic Management Review paper is the first occurrence of
the theory being referred to as the “Resource Based View”. Wernerfelt‟s contribution was much
richer than simply naming rights as he also provided that firms should be analyzed from the
resource side at the level of the firm, not just from the product side at the level of the industry
(Wernerfelt, 1984). Whereas, Wernerfelt did not dismiss many of the important aspects of
industry structure, he did link firm performance to the idiosyncratic and heterogeneous resources
found within the firm. Wernerfelt argued that firm resources were leveraged inside the firm and
that all firms had a unique collection of resources. These unique combinations of resources
enable firms to create business strategies that rival firms are unable to exactly replicate and to the
extent that these resource combinations and deployment strategies are market efficient
competitive advantage is created. Among Wernerfelt‟s most significant contribution to the
literature is the conclusion that it is the strategy utilized in deploying heterogeneous resource
combinations that determines a firm‟s strength and ability to compete. This basic premise
would be challenged for decades by the legion of industrial organization and economic
strategists that suggest the critical element to sustained competitive advantage is inherently
industry organization (I/O) driven, (Porter, 1985).
Strategic management scholars have always maintained the importance of
Wenerfelt‟s contribution, although it was not until 1991 that RBV was christened as a full-
fledged strategic management theory. In a 1991 Journal of Management (JOM) paper, titled
28
“Firm Resources and Sustainable Competitive Advantage”, J.B. Barney defined competitive
advantage as “an advantage that continues to hold after efforts of others to duplicate the
advantage have ceased …furthermore, sustained competitive advantage is the higher levels of
performance that accrue to a firm with resources advantages…due to the efficiency of these
firms in exploiting those advantages” (Barney, 1991).
In a subsequent 1991 JOM special issue, the RBV theory was debated at length
and much progress made in providing specificity as to its theoretical elements. This debate led
to the conclusion that sustained competitive advantage can only be obtained from resources that
are valuable (V), rare (R), inimitable (I), and non-substitutable (N). This development of the
VRIN framework attributed to Barney, has been adopted into the strategy literature and has been
extensively used to define the strategic resources for firms. Barney argued that only the resources
which meet the VRIN criteria should be considered strategic resources and it is only these
resources that can improve the firm‟s efficiency and effectiveness in a sustainable way. Barney
eventually defined these strategic resources as managerial skills, organizational process and
routines, and information and knowledge under the control of the firm (Barney, 2001).
Some authors have criticized Barney‟s VRIN framework because the fluid
dynamic of resource creation had been overlooked in the framework. Some have suggested that
resource imitation could occur through direct duplication or through substitution and for this
reason non-substitutability (N) was not an adequate criterion but rather a form of inimitability
(Black, 1994). In response to this criticism, Barney modified the VRIN framework to include an
organization element (O) which included a focus on the role of organization in exploiting the full
competitive potential of a firms resources (Barney, 1997). Thus the standard VRIN framework
morphed into a more generally accepted VRIO construct. Barney and Hesterley state that a firm
must be appropriately organized in order to take full advantage of the potential of its resources
and they consider the components of a firm‟s organization that can affect the exploitation of
resources as a firm‟s structure, management control systems, formal reporting structures and
compensation policies (Barney and Hesterley 2010). Over time, the VRIO framework increased
the practicability of the RBV for firms exploring the necessary and collectively sufficient
resource characteristics that provide the firm with sustained competitive advantage.
29
Since the seminal works of Penrose, Wernerfelt and Barney the RBV has been
extensively studied by scholars and practitioners. As the conversation has continued, the RBV
has been extended and enhanced over the decades; however, much of the basic premise remains.
As described by Kamasak (Kamasak, 2013), the general RBV theory can be defined as:
The primary focus of the RBV is to sustain a competitive advantage that enables firms
to accrue above normal returns
Heterogeneous firm level resources along with capabilities controlled by a firm are the
ultimate sources for providing the basis of competitive advantage
The systematic difference between resources can be sustained over time
Heterogeneity creates immobility that prevents resources to be transferred from firm to
firm easily
Performance variations among firms can be explained by the differences in firms‟
resource endowments
Intangible resources rather than tangibles are the most effective resources in explaining
firm performance differentials
In the past 15 years significant new developments have emerged in the field of
RBV. One of the drivers of the need for a refreshed view of RBV is the rapid technological
development across the globe. The emergence of new technologies (internet, near real-time
information and communication flow, CPU processing speeds and near costless mass data
storage options, etc.) was radically altering the interconnectedness of the global business world
and thus the appropriate way to evaluate business management and strategy was forever altered.
From its genesis, RBV was a rather static theoretical framework that worked best in a non-
changing world. As the world and business changed and pace of change accelerating over the
past two decades, RBV needed to evolve as well. Similarly, all strategic frameworks designed to
help explain the creation and sustainability of competitive advantage were threatened to either
evolve with the times or become obsolete. The collective RBV school of theorists‟ responded by
30
addressing the evolving world and its somewhat static theories with the development of Dynamic
Capabilities (DC) theory.
Dynamic Capabilities (DC)
Whereas RBV is a well thought out theory of how firms can earn super normal
profits in equilibrium in a static world, the RBV has a limited ability to address several aspects of
how firms today should develop and deploy their resources to achieve sustainable competitive
advantage. The theory of Dynamic Capabilities (DC) evolved from the static limitations of RBV
and is better equipped to dealing with a dynamic world. As a result, DC should be viewed as a
logical extension and compliment to RBV and in many aspects an improved method of
evaluating and understanding firm performance in today‟s business environment (Kamasak,
2013).
Teece is considered by most to be the forefather of Dynamic Capability theory.
In seminal works first published in 1997 with Pisano and Shuen and then in multiple individual
contributions in the following years, most academics credit Teece with not only the initial
labeling of Dynamic Capabilities theory but also the widespread acceptance that the theory now
enjoys. According to Teece, the Dynamic capabilities framework provides that organizations
must integrate and reconfigure their resources and capabilities to renew or alter their resource
mix to be able to maintain competitive advantage in a dynamic and changing environment
(Teece, 1997).
Furthermore, Dynamic Capabilities suggest that it is no longer possible for firms
to gain any lasting competitive advantage with a static resource mix and in actuality with an ever
changing resource mix not only is competitive advantage not possible, long-term sustainability
becomes in question (Fiol, 2001). Whereas Teece‟s original definition of DC of “the firm‟s
ability to integrate, build and reconfigure internal and external competencies to address rapidly
changing environments” (Teece, 1997), Eisenhardt and Martin developed a slightly different
definition: “dynamic capabilities are the organizational and strategic routines by which firms

31
achieve new resource configurations as markets emerge, collide, split, evolve and die”
(Eisenhardt and Martin, 2000).
Alternatively, for Zollo a Dynamic Capability was defined as a “learned and
stable pattern of collective activity through which the organization systematically generates and
modifies its operating routines in pursuit of improved effectiveness” (Zollo, 2002). Further
definitional fragmentation has evolved for defining DC including: Zahra‟s, “dynamic capabilities
are the abilities to reconfigure a firm‟s resources and routines in the manner envisioned and
deemed appropriate by its principal decision maker” (Zahra, 2006). Alternatively, DC as defined
by Helfat as, “the capacity of an organization to purposefully create, extend or modify its
resource base” (Helfat, 2009). Further muddying the waters is the assertion by Ambrosini that
Dynamic Capabilities are not really resources but a process that helps develop the most adequate
resource base. This line of thinking is consistent with the evolution of Acquisition Based
Dynamic Capabilities (ABDC) which is the applicable theory that will be used when applying
much of this scholarship into a mergers and acquisition (M&A) context.
Despite the lack of perfect alignment on the definitional aspects of DC, the
contributions of many of the pioneering DC theorists, provides for a middle ground description
of Dynamic Capabilities as a combination of Kamasak and Ambrosini “…the ability to perceive
and adapt to rapidly changing competitive markets through the integration and continuous
reconfiguration of organizational skills, assets and functional competencies” (Kamasak, 2013),
and “to assess the firm‟s extant resource base and transform it to create a new configuration of
resources that can sustain competitive advantage” (Ambrosini, 2008).
Despite the wide breadth of definitions used to describe exactly what Dynamic
Capabilities are, most scholars have agreed to the existence of four categories of capabilities.
Collis is credited with this disaggregation of the broader Dynamic Capability grouping (Collis,
2008). The four groupings according to Collis:
1) Capabilities that enable firms to perform the basic functional activities of the firm
such as plant layout and distribution logistics

32
2) Activities which deal with dynamic improvements of the firm such as learning
and adapting to changing environmental conditions
3) Specific activities which provide for a finer defined set of dynamic improvements
than that provided by the general improvements in category number 2
4) Meta-capabilities that relate to the ability of a capability to renew the other
existing capabilities with the expectation of developing capabilities today to take
advantage of opportunities tomorrow
Some researchers do not consider a dynamic capability as a resource but rather an
evolving process that transforms firms by developing and shifting resource in the most efficient
resource combination. In addition to this self-correcting concept, this would also imply that the
difference between simple (or ordinary) capabilities and what is being described as a dynamic
capability has a timing element. Whereas, ordinary capabilities are valuable and can be viewed
as helpful in competing in the present and perhaps somewhat static, dynamic capabilities can be
viewed as more future looking and about competing and evolving over time and thus non-static
(dynamic) (Helfalt, 2011). Even though some lines can be drawn between ordinary and dynamic
capabilities from a definitional perspective, in practice they are much harder to differentiate
when firms are managing their existing resource bases.
Much work has been devoted towards the study of dynamic capabilities in evolving
industries. Additionally, it was the rapid changing of the business climate with the rapid
adoption of technology that has led to the extension of RBV theory into Dynamic Capabilities,
nevertheless there is a role for Dynamic Capability Theory in slower changing and more mature
industries (Zahra, 2006). This fine point is relevant as few would ever confuse the regulated
energy industry (the subject of this research) with the rapidly changing environments of
industries such as high tech.
As argued by Kamasak, the Dynamic Capabilities approach is considered as an
offshoot of the RBV since it provides thorough explanation about how the current stock of VRIN
resources can be regenerated (Kamasak, 2013). In order for firms to achieve a sustainable
competitive advantage, firms need the ability to identify and invest in the resources that have the

33
capability of providing advantage. This adaptation of their resource base can be done via
enhancements and development to internal existing resources or the introduction of new
resources and resource combinations that can be obtained through some form of business
combination (join venture, other forms of partnering or via acquisition).
There exist only a few published studies on acquisition capabilities that have
evaluated the acquisition process through a Dynamic Capabilities lens. Teece viewed
“Acquisition Capability” as a single dynamic capability that was further broken down into the
“micro processes” of “sensing”, “seizing” and “reconfiguring” (Teece, 1997 and 2007). Others
have come along and worked with the Teece framework on acquisitions and attempted to
develop an enhanced topology of the M&A process. Researchers have taken varied approaches
attempting to operationalize the theoretical foundations first established by Teece regarding the
dynamic capabilities associated with the acquisition process. This work has included some
researchers extending the conceptual underpinnings focusing on reconfiguration (Amiryany et
al., 2012), acquisition as a core capability (Keil et al., 2012) and integration capabilities (Zollo
and Winter, 2002).
Other researchers have utilized a qualitative case study approach to explore specific
aspects of acquisition capabilities; this has included (Hemeriks et al., 2012) integration
capabilities, (Oladottir, 2010) acquisition infrastructure, and (Capasso and Meglio, 2005) on
integration effectiveness. While still others have utilized a quantitative approach to study
Acquisition Capabilities, including (Zollo and Singh, 2004) evaluating learning aspects of
acquisition experience, (Mitchell and Shaver, 2003) focusing on integration capabilities and
(Capron and Anand, 2007) where the actual Acquisition Base Dynamic Capabilities (ABDC)
framework was first introduced. To better understand the theoretical application of Dynamic
Capabilities under the situation of a corporate acquisition, the focus must shift from Dynamic
Capabilities and introduce the Capron and Anand extension, Acquisition Based Dynamic
Capabilities (ABDC) theory.

34
Acquisition Based Dynamic Capabilities (ABDC)
Firms commonly attempt to use acquisitions to acquire new resources that are
distant from their current resource base. Internal development commonly facilitates extension of
the incumbent resource base and is often referred to as resource exploration. Resource
exploration is the resource development and selection process that requires firms to seek outside
resources external to the firm. Although the reach outside the firm offers the potential for
development and acquisition of new resource pools previously untapped by the acquiring firm,
successful acquisition requires a skill set and set of capabilities that are often foreign to the
acquiring firm. Firms that are more endowed with a resource base skilled in exploration will
outperform their rivals who have resources less expert in this area. Acquisition Based Dynamic
Capabilities (ABDC) is a valuable theoretical framework to evaluate a firm‟s existing resource
capabilities in the area of acquisition.
According to the pioneers of the theory including Helfat, Anand, Capron and
Mitchell, Acquisition Based Dynamic Capabilities (ABDC) includes three main elements;
acquisition Selection, Identification and Reconfiguration activities (Helfat, 2007). Acquisition
Selection capability is the capability to recognize when an acquisition would be the appropriate
mode for obtaining new resources into the firm. As suggested above, due to the relatively high
risk of financial success for most acquisitions (from the acquirers perspective), acquisitions
should be viewed as a means of last resort for resource enhancement. Although this point is
intellectually consistent when viewed from a risk and reward perspective through a purely
theoretical lens, in practice many firms take an alternative view and perceive acquisitions as the
most attractive means to resource development and often deploy company resources towards
high risk resource acquisition at the expense of fully capitalizing on internal resource
development or through simpler modes of partnership, joint venture or alliance methods of
resource exchange.
If a firm possesses relevant internal resources then it should consider internal
development rather than exploration outside the firm. Capron and Mitchell (2004) argue that

35
acquisitions should be the preferred mode of materially altering a firm‟s resource base only when
three conditions hold: 1) when a firm‟s existing base set of skills has little relevance for the
targeted resource, 2) when the target resources would face substantial market failures in discrete
resource exchange, and 3) when utilizing the new resources involves multiple points of contact
with a firm‟s existing resource base.
In situations where resource enhancement is best accomplished through
acquisition, three distinct Acquisition Based Dynamic Capabilities become critical, namely the
capabilities of resource “Selection”, “Identification” and “Reconfiguration” (Capron and Anand,
2007). As defined by Capron and Anand:
Acquisition “Selection” capability includes the ability to assess a firm‟s existing
resource base relative to desired new resources and capabilities, to assess the degree of
market failure with respect to resources that are beyond the firm‟s existing resource
relevance and to assess the number of points of contact that inter-organizational creation
or new resources would require. Firms that can accurately assess these criteria and select
acquisitions as a mode of seeking new resources only when simpler modes fail, if
successful can create substantial competitive advantage.
Acquisition “Identification” Capability is the capacity to detect and negotiate with
appropriate targets. This capability requires that a firm be able to carry out effective due
diligence of potential targets in order to determine the value of the target to the acquirer,
to negotiate appropriate terms with the a target‟s owner, and to walk away from a target if
it lacks needed resources or its owners demand payment that exceeds value to the
acquirer.
Acquisition “Reconfiguration” Capability is the capacity to reshape resources
within the target and acquiring firms. This involves the capacity to combine resources
from the target and acquirer in order to create new resources, whether at the target or
within the acquirer‟s original business units or in some new organizational unit. This
capability also requires the capacity to selectively divest unneeded resources from the

36
target as well as old resource for the acquirer that have become obsolete as a result of the
reconfiguration process.
Thus Acquisition Based Dynamic Capabilities include a hierarchy of Selection,
Identification and Reconfiguration abilities. These are nontrivial skills, requiring substantial
organizational discipline and coordination. As a result, firms that develop effective acquisition
based dynamic capabilities may gain substantial and sustainable competitive advantage (Helfat,
2007).
One sharp criticism often lobbed at the advocates of Dynamic Capabilities is the
apparent lack of empirical support for its theoretical arguments (Kamasak, 2013). The Capron
and Anand framework (“Selection”, “Identification” and “Reconfiguration”) for ABDC is a vast
enhancement over the generalized treatment of the concept of resource acquisition found within
the original Dynamic Capabilities literature and is an advancement in moving the theory from the
purely theoretical. The framework brings scholars and practitioners one step closer to a point
where they can operationalize the theoretical DC and ABDC concepts. Although an
improvement, Capron and Anand‟s framework should be modified slightly without torturing its
theoretical strength in hopes of developing a framework that more closely resembles reality to
actual practitioners conducting resource acquisition. It is with this modification that an adapted
form of the ABDC framework is developed and can be used to address the primary research
question of this Dissertation:
“What Acquisition Based Dynamic Capabilities (ABDC) are the most
critical in enhancing value for energy companies engaged in M&A?”

37
CHAPTER III - APPLYING THE ADAPTED ABDC FRAMEWORK
An enhancement to the Capron and Anand ABDC framework can be
accomplished via a few slight definitional modifications. Whereas Capron and Anand divided
the ABDC capabilities into “Selection”, “Identification” and “Reconfiguration” a more
practitioner friendly (or stated differently, what happens in the real world) approach would be to
define the groupings as “Selecting and Identifying”, “Transacting and Executing” and
“Reconfiguring and Integrating”.
Capron and Anand were correct to identify the importance of Selection and
Identification. However, in practice these are activities that are occurring simultaneously and in
many ways are interlinked with each other. Additionally, these activities are almost always
performed by the same individuals (resources) in an acquiring firm. To have them as two of the
three identified ABDC groupings distorts the manner in which these activities are performed as
well as how resources performing these activities are deployed. Thus the first modification to
the Capron and Anand ABDC model is the combining of what was once Selection and
Identification.
One additional necessary modification to the Capron and Anand framework is the
identification of the unique category of “Transacting and Executing”. In the original framework
these critical capabilities (and resources) appear to be embedded in the “Identification” category.
Grouping these critical capabilities into the “Identification” category distorts what
“Identification” is intended to capture. Additionally, it also muddies the waters as to what
capabilities that are really being identified in addition to the resources that are being deployed to
perform these activities. Similar to the redefining of “Selecting and Identifying” the creation of
the “Transacting and Executing” grouping is an enhancement to the original Capron and Anand
framework.
The final Capron and Anand grouping, “Reconfiguration” and “Reconfiguring
and Integrating” in this author‟s enhancement is virtually identical. The only practical difference
is a slight modification to the grouping name to reflect the term “integration” which is a term of

38
art for M&A practitioners. Otherwise the capabilities and resources necessary to be deployed to
be successful are the same for “Reconfiguration” as they are for “Reconfiguring and
Integrating”. Making these slight modifications to the ABDC framework of Capron and Anand
provides a practical enhancement to the ABDC theory and has the added benefit of closer
resembling the true real world process and necessary capability and resource requirements of
successful practitioners. A visual depiction of the revised ABDC framework is provided below
in Figure 2.
Figure 2: Acquisition Based Dynamic Capability Framework

39
Adapting the ABDC framework provides for slightly modified definitions of the ABDC
groupings.
Acquisition “Selecting and Identifying” capability includes the ability to assess a
firm‟s existing resource base relative to desired new resources and capabilities, to
assess the degree of market failure with respect to resources that are beyond the firm‟s
existing resource base and to assess the number of points of contact that inter-
organizational creation or new resources would require. It also includes the capability
to be able to carry out effective due diligence of potential targets in order to determine
the value of the target to the acquirer, to negotiate appropriate terms with the a target‟s
owner, and to walk away from a target if it lacks needed resources or its owners
demand a price that exceeds the value to the acquirer. Firms that can efficiently
perform these tasks and have resources with well-developed capabilities can be
positioned to create substantial competitive advantage.
Activities may include: Valuation Work, Due Diligence, Target
Approaching, Signing Non-Disclosure Agreements (NDAs), Two-Sided
Confirmatory Diligence, Negotiating, Financial Engineering, Deal
Documentation, Deal Announcement, etc.
Acquisition “Transacting and Executing” Capability is the capacity to manage and
execute efficiently the transaction closing process, including meeting all conditions
precedent in the acquisition which may involve arranging financing, obtaining
approvals and consents, (regulatory, shareholder, other) and consummating all other
deal closing mechanics. Firms that can manage efficiently these processes are

40
positioned to take advantage of the opportunity that was created in “Selecting and
Identifying” and can create substantial competitive advantage.
Activities may include: Filing For Regulatory Approval, Negotiating with
3rd Parties, Finalizing Lending Terms and Conditions, Obtaining
Shareholder Support, Developing Transition Services, Preparing Deal
Closing Documentation, Deal Signing, Final Deal Announcement, etc.
Acquisition “Reconfiguring and Integrating” Capability is the capacity to reshape
resources within the target and acquiring firms. This involves the capacity to combine
resources from the target and acquirer in order to create new resources, whether at the
target or within the acquirer‟s original business units or in some new organizational
unit. This capability also requires the capacity to selectively divest unneeded
resources from the target as well as old resource for the acquirer that have become
obsolete as a result of the Reconfiguration process.
Activities may include: Effectuate Transition Services, Transitioning
Employees, Redesigning/Rightsizing Organization, Harmonizing Policies
and Procedures, Streamlining Systems and Infrastructure, etc.
While this adaptation of the Capron and Anand ABDC framework is a
modification (and arguably an enhancement) from a definitional perspective it does maintain the
implied linear progression of each capability grouping. Stated differently “Selecting and
Identifying” will always predate “Transacting and Executing” which itself always occurs prior to
“Reconfiguring and Integrating”. This logical sequencing is apparent in the graphic below in
Figure 3.

41
Figure 3: ABDC Applied to an M&A Transaction
An additional benefit of the adapted ABDC framework is the now clearly defined milestones and
dates that occur at the start and completion of each ABDC phase, to be illustrative:
“Selecting and Identifying”:
o Begins with the initial thoughts of a particular target, resource gap or
identified resource opportunity that a firm is about to pursue. Operationally,

42
it coincides with the point at which a firm deploys firm resources to pursue
or identify an opportunity.
o Ends with the announcement of a deal between acquirer and target.
Operationally, this will usually result in a press release for most companies
and a filing of Form 8-K with the SEC for any public company if the
transaction is deemed as “material”.
“Transacting and Executing”:
o Begins with the point at which the deal has been agreed commercially by the
counterparties and is about to be announced and is now in preparing for
execution mode as the firm deploys resources to meet all deal conditions,
approvals and consents.
o Ends soon after the actual deal closing date and funding (or transfer of other
form of financial consideration) necessary for the transaction to close. This
is most often accompanied by a press release for most companies and a
filing of Form 8-K with the SEC for any public company if the transaction is
deemed to be “material”.
“Reconfiguring and Integrating”:
o Begins with the moment after the deal is consummated at financial close.
o Ends with the point in time when the company stops deploying firm
resources on the integration and reconfiguration of the acquired firm or its
firm resources. In practice, the absolute ending point of “Reconfiguring and
Integrating” may vary considerably by transaction.

43
As each ABDC category has a clear beginning and end date, measurement points for each ABDC
category can be identified. This becomes critical as value creation (or destruction) can be
calculated across these discrete time intervals and can be linked to each ABDC category. For
example:
Economic value that is created (or destroyed) between the time a firm starts
working on an opportunity to when a deal is announced can be linked to the net
value impact of a firm‟s “Selecting and Identifying” capability. The measurement
of this is most important when it is believed to be noticed and valued by the market.
This is best measured over a short time horizon around announcement date of the
transaction.
Similarly, the incremental economic value that is created (or destroyed) between
when a firm announces a deal and when a firm closes the transaction can be linked
to the net value impact of a firm‟s “Transacting and Executing” capability. This is
best measured as some relatively short-term window around the closing of the
transaction as this is when the market will place value on the company‟s
Transacting and Executing performance capability.
Lastly, the incremental economic value that is created or destroyed (between) when
the transaction closes and when a firm has completed its work on the transaction
can be linked to the net value impact of a firm‟s “Reconfiguring and Integrating”
performance and capability. This is best measures as some relatively long period
post-closing of the transaction as this is when the market will evaluate and place
value on the company‟s Reconfiguring and Integrating performance and capability.
It is worth noting that this all assumes everything else is constant (ceteris paribus)
and that the net effect is an abnormal effect (capturing what would have been the expected effect
had the firm not taken its course of action). These last two caveats (ceteris paribus and abnormal
44
returns) are rather critical assumptions, but can be dealt with analytically and are discussed in
greater detail below.
So with this theoretical foundation established and with the adapted ABDC
framework introduced, an empirical research methodology can be developed to evaluate the
ABDC categories in a regulated energy M&A deal context. This empirical approach allows for a
deeper investigation into which ABDC categories matter the most (in terms of impacts to
acquirer shareholder returns) and what factors influence difference in performance among Top
and Poor Performers.

45
CHAPTER IV - METHODS
In attempt to quantify an answer the question of “What acquisition based dynamic capabilities
are the most critical in enhancing value for energy companies engaged in M&A?” an empirical
methodology was needed to be developed. The sections below define the data sampling and
collection method, identified theoretical constructs, definitions of groupings, descriptions of
dependent and independent variables, specified models and the general approach utilized for the
analysis.
Data Sampling and Collection
The subject of the research is the effectiveness of ABDC capabilities in M&A
transactions occurring in US investor owned (excludes municipal “munis” and cooperative “co-
ops”) regulated energy companies. As the research utilizes equity stock returns as part of the
calculation of the dependent variable, the sample set is limited to publicly owned and traded
companies as there is a daily near real time public mark of their traded equity. To provide for a
robust data set the study contains all the regulated energy transactions that have occurred over
the twenty year time horizon 1995 to 2014. The twenty year window provided adequate
variation among industry conditions and also provided a robust set of observations for the
analytical inquiry. Whereas an enhanced data set with additional observations is always
preferable, the benefit of going further back in time than the prescribed twenty years was
outweighed by the reality of constraints of data availability and accuracy.
The desire to bind the study to the regulated energy industry had some attractive
benefits. For example, by keeping the study focused within one industry provides for a more
controlled environment where factor effects were more easily isolated and evaluated. For
example, the set of industry shocks within the narrowly defined sample set is known and any
apparent industry specific merger wave would be affecting all firms similarly. Stated

46
simplistically, an M&A study within a narrowly defined industry has less noise to deal with in an
attempt to isolate industry specific variable impacts. An additional benefit of utilizing the
regulated energy industry was the long transaction cycles that occurs from deal origination to
when the acquisition is finally approved and eventually integrated into the acquirer. It is not
uncommon for regulatory cycles to occur over a period of multiple months and for deals to span
from start to finish periods of 18 months or more. This amount of elapsed time provided for very
discernible periods to test the ABDC capability groups. Whereas for transactions where the deal
is announced and rapidly closed (less than 30 days for example) many of the activities associated
with the ABDC capability groupings would be occurring simultaneously and thus very difficult
to differentiate each capability‟s unique contribution to value enhancement.
The study was limited to using public companies. As a result of utilizing
shareholder value metrics (stock price) as a means of determining changes in equity value, the
study was limited to using firms that have publicly available reporting of the their share prices.
Private companies by their general nature do not have this requirement. Fortunately, the
regulated energy industry is dominated by publicly traded companies. So no systematic
sampling bias was found to impact the quantitative results. Additionally, excluded from the
study are entities that are organizationally set up as a municipal utility or cooperatives in addition
to some privately owned enterprises. Despite the exclusion logic, these firms represent a small
portion of the participants in the regulated energy industry and by omitting them it was expected
to have little impact in the relevance of the study or the ability to generalize its results.
Transaction data was collected from various data sources. SNL Energy
Transaction Database, Thompson Reuters and Bloomberg Financial Services provided some of
the necessary transaction data for the M&A deals that are the focus of this study. This includes
the critical dates that identify deal announcement and financial closing of the transaction. These
dates were necessary to determine the timing of the individual ABDC groupings. Additionally,
these datasets also contain some of the financial transaction data helpful in defining the deal
including the transaction‟s proposed capital structure and other basic financial aspects of the
deal. Capital IQ and SNL databases were helpful in providing additional industry specific
transaction detail. This was critical in helping to determine some of the industry and competitive

47
dynamics of the transactions. These data sources also provided basic information on the
management teams and leadership experience of the acquiring firms. Company website and SEC
filings were also helpful in filling in additional data gaps and informational needs.
Overall 1,075 transactions were considered for inclusion into the study. 545 of
the transactions were discarded as a result of having a closing cycle (the amount of time lapse
between when a deal was announced to when it closed) of less than 30 days. The average
closing cycle for transactions that fell into this category was 14 days. This is compared to the
average cycle time for transactions that required above 30 days was 140 days. Many of these
transactions closed on an accelerated timeline as a result of not requiring any meaningful
mandated approval process (which would include any local, state or federal regulatory process,
or company or SEC specific shareholder voting requirements).
Energy deals that are able to be closed over such a short cycle tend to be very
small in nature (both in absolute size and in size relative to the scale of the acquirer) and do not
trigger the lengthy regulatory processes that will often stretch out over many months. Excluding
these transactions was not expected to provide any meaningful bias in the results as determining
the impacts of these minor transactions on the acquirer‟s ABDC capabilities would have been
difficult with the overlapping ABDC efforts occurring essentially at the same moment in time.
Additionally, as these transactions tended to be relatively small from the acquirer‟s perspective
(in most cases less than 5% of the acquirer‟s enterprise value versus an average deal size of 34%
of the acquirer‟s enterprise value for the included transactions), any expected impact of the
acquisition on the acquirer from a M&A perspective (and measured through valuation of the
acquirer‟s market value) would expected to be negligible.
An additional 193 transactions were excluded from the data set as a result of the
corporate ownership structure of the acquirer being private (unlisted). As a result of much of the
measurement rubric utilized in this research design being centered on movements in public
valuation metrics (listed equity values) to the extent that a company is private and not listed
makes the observation unusable for this analysis. As a result of the acquirer being private some
of these transactions also had less available information as their reporting requirements were less

48
stringent than that of public companies. As the research investigates ABDC capabilities as
measured through the lens of the acquirer‟, the target companies need not be public companies as
traded equity values were necessary to conduct the analysis. As a result, these 193 transactions
were discarded.
A cursory review of the excluded private company transactions revealed a few
interesting observations. Private investing entities (private equity funds, hedge funds and others)
have increased their involvement in energy company M&A post 2000 and despite a relative lull
during the market correction of 2007 have been very active investors since 2008. Whereas, in
the early 2000s and before it was somewhat unusual for a private firm (or consortium of private
firms) to attempt to acquire a regulated energy company through traditional M&A, the
involvement of these firms is now very common. Additionally, their appetite for financial
exposure for these types of deals over the past decade has upsized considerably in terms of the
absolute size of some of the transactions that they have considered in addition to the absolute
equity dollars they are willing to invest individually to take a position. It is now very common
for traditional private equity firms (and other financial players) to partner with peer firms to pool
their resources and be active participants in all but the largest of energy transactions.
It is also worth noting that failed transactions are not part of the research design.
As the thrust of the project involves the evaluation of how dynamic capabilities impact value
over the entire lifecycle of an M&A transaction (deal origination through full post acquisition
integration) failed transactions (deals that are announced but never make it to the closing table
and thus abandoned) never mature through the Transacting and Executing and Reconfiguring and
Integrating stages of a deal‟s lifecycle. Admittedly, this leaves the research design with
somewhat of a success bias in terms of studying Selecting and Identifying capabilities, it is a
limitation worth noting but not one that should alter the view of how best to define the sample
transactions in the study.
As a result of consolidation within the industry some of the acquiring companies
in the data set were eventually acquired themselves and „delisted‟. Furthermore, a few entities
that consummated a transaction in the data set were also „delisted‟ for a period of time as a result

49
of filing for bankruptcy and going through some form of corporate restructuring. Despite the
challenges of obtaining historical data for delisted companies, the delisted acquirers remain in
the study as the necessary data elements utilized in the study were obtained through various
alternative means. As a result, no transaction was discarded from the data set because of
unavailable financial or operation information.
After discarding the private entity transactions and short cycled minor
transactions, the dataset was reduced to include 337 successful acquisitions of regulated energy
entities (some were entire company, some assets or subsidiary transactions) made by public
companies between 1995 and 2014.
Capital IQ and Bloomberg Financial Services provided the data for the daily stock
performance and return data of each of the companies. As the study evaluated transactions over
time, and looks to calculate performance over very specific time spans, a continuous data set of
daily company specific stock prices was required to make the appropriate calculations.
Similarly, daily price data over the study time horizon was required for the calculation of certain
critical indices and benchmark companies that are required to calculate various specifications of
normalized and abnormal returns. Capital IQ and Bloomberg Financial Services also provided
the data utilized to calculate the necessary financial metrics (return, performance and others) of
the acquiring companies necessary to classify acquirers into groupings from a performance
perspective. The different groupings are defined below.
Theoretical Constructs
In order to evaluate the effectiveness of specific Acquisition Based Dynamic
Capabilities at the firm and transaction level, a quantitative general M&A transaction model was
developed. ABDC and general M&A theory was helpful in suggesting a series of theoretical
constructs that should be modeled in the development of a general M&A transaction model.
The general research model identifies theoretical constructs (Industry Specific Shock,

50
Consolidation Wave, Industry Dynamics, Bandwagon Factors Impacting Management,
Management Traits of the Buyer, Financial Environment and Structure of the Transaction,
Complexity of the Deal). The rather robust body of merger and acquisition literature was
utilized to determine that these constructs should be included in the general model and also
suggests what relationships these constructs should have among each other and the dependent
variable (see Figure below).
Figure 4: Construct Model

51
The theoretical constructs are described below:
Industry Specific Shock: Industry shocks (regulatory and others) can have an
effect of triggering a merger wave. The introduction and approval cycle of
landmark legislation has been found to be a primary factor resulting in an industry
shock. For the regulated energy industry some of the more critical pieces of
legislation have included the passage of Public Utility Regulatory Policy Act of
1978, Energy Policy Act (EPAct of 1992 and 2005), FERC orders 636 and 888
(1992 and 1996) and the changes to the Greenhouse Tax Laws and Clean Power
Act (2012 and 2015).
Consolidation Wave: The ripeness of the M&A market contributes to M&A
success. Shocks cause waves and when in the wave that you transact dictates
whether you are a value hunting “early bird” or an over spending “band wagon
jumper”. Also how quickly you close the transaction also impacts where you are
in a wave. Historians have identified seven distinct merger waves throughout the
course of history: First wave 1893-1904, Second Wave 1919-1929, Third Wave
1955-1970, Fourth Wave 1974-1989, Fifth Wave 1993-2000, Sixth Wave 2003-
2008 and the ongoing Seventh Wave that started in 2014. The study period of
twenty years covers portions of the Fifth Wave, the entire Sixth Wave and the
start of the Seventh Wave. Chronologically, the twenty year study period, has
thirteen years of being in a global merger wave. It is worth noting that industry
specific dynamics play a critical role in determining whether a specific industry
will follow the global trend and itself enter a consolidation phase.
Industry Dynamics: Industry dynamics of bringing the two firms together
contribute to M&A success. Industry dynamics include: cost and operational

52
synergies, strategic fit of the merged firms and impacts of the market
consolidating by the exit of a firm. Companies acquire to gain a competitive
advantage. To the extent that the perceived competitive advantage becomes to
advantageous (and thus anti-competitive) the transaction may ultimately be
rejected. Any material transaction will require approval from the Department of
Justice (and perhaps other agencies as well) via a Hart-Scott-Rodino (HSR) filing
that addresses the impact of the transaction on industry competitiveness. At the
state level regulators are also mindful of potential excess returns and attempt to
regulate accordingly.
Bandwagon Factors: The existence of “Bandwagoning” behavior and the
motivations of the management team has a potential impact on M&A success. Is
the firm decision maker(s) influenced by emotional factors or do they resemble
and act purely in a rational manner? If in a merger wave, do firms act differently
if they have not consummated their own transaction? Also of interest is whether
firms will acquire as a form of protection for themselves in the hopes of not being
acquired under a “kill or be killed” mentality. To the extent that these thoughts
impact behavior will have a direct consequence of the effectiveness of a deal.
M&A Approach of the Buyer: The aggressiveness of buyer (is it buy at any cost
or be patient till the right deal comes along) and also the level of engagement in
actively pursuing corporate opportunities (proactive business development or
passive action waiting for the phone to ring) behaviors will impact performance.
Management Traits: Characteristics of the existing management team of the
acquirer as it relates to their ability to transact, directly impacts M&A
performance. This includes past experience (is it the team‟s first deal or are they
serial acquirers well down the experience curve) in transactions and their general

53
leadership capabilities during times of change and willingness to accept material
risk.
Financial Environment and Structure: “How you pay” is nearly as important as
“what you pay”. Factors include whether the deal is a stock or cash deal and how
much leverage is utilized. The size of the firm being acquired relative to the
acquirer, and whether the transaction was initiated as a multi-party auction, or
single party (friendly or hostile) deal is also informative. Equally important is the
general business climate of when the transaction is being consummated. Is the
economy in rapid growth where equity values are rising (both buyers and sellers);
is the access to debt capital available and affordable? The time horizon of the
study (1995-2014) is conducted through a relatively prosperous period up through
2000, then a recession in 2001, followed by a recovery period and then the Great
Recession from December 2007 through June 2009, followed by a long and
sluggish recovery. The financial environment plays a role in how companies
think about structuring their deals as well as the overall market receptiveness of
the timing of any transaction which directly impacts expected M&A performance.
Deal Complexity: Factors that account for the complexity of the deal include the
business complexity of the firm being acquired (number of business segments,
scope of operations, number of regulatory jurisdictions, etc.). Whether or not the
companies fit with each other. Is it a “like buying like” transaction or a company
diversification play into new jurisdictions or businesses? How complex (and
lengthy) the expected approval process for the acquirer will also directly impact
expected M&A results.
Effectiveness of ABDC (S&I, T&E, R&I): This construct represents the study‟s
dependent variable. This captures the returns (abnormal and other measures) that
the M&A transaction has created at various time intervals across the deal lifecycle

54
to obtain a proxy for the relative effectiveness of the firm‟s resources at
performing the three ABDC capabilities. In the construct model the individual
ABDC capabilities are shown together, but when the construct model is
operationalized below, the ABDC categories are all described independently with
appropriate proxy variables identified.
Groupings for Analytical Purposes
In order to evaluate the effectiveness of specific Acquisition Based Dynamic
Capabilities at the firm and transaction level the acquisitions were classified into different
groupings. One classification was based on the primary sector of the industry that the targets
business represented (“Industry Groups”). Another classification was based on overall company
performance (“Leaders and Laggards”). One grouping was based on ABDC performance of
each acquirer as measured at various timing intervals of the transaction (“Top Performers and
Poor Acquirers”). Admittedly, some power is lost when the dataset of 337 transactions is
reduced to define subsets of logical groupings; however, the probative value of splitting the data
set in this manner was a worthwhile tradeoff. It is also worth noting that for analytical purposes
the broader data set was only split by one method at a time. Additionally, Bruner (2004) cites 15
different quantitative studies of acquirer M&A performance that utilized data sets of 50 or less
where the authors argue that despite the sizes of their data sets, their samples are sufficient for
empirical modeling and providing for robust and generalizable results. Each grouping is defined
below.
“Industry Groups”
To enhance the analytical granularity of the project each acquisition was
classified into one of four primary industry groups. “Resources” are companies whose primary

55
core business involved the extraction or production of natural resources. This classification
includes all the transactions involving coal companies and oil and gas exploration and production
companies. 47 of the transactions in this study involved companies defined as “Resource”
companies.
The classification “Utilities” was used to define companies whose primary line
of business is regulated energy utilities. These companies include both gas and electric utilities
and include both local distribution and retail operations. 76 of the transactions in this study
involved companies defined as “Utilities”.
The classification “Midstream and Transportation” defines companies whose
primary line of business is the processing and transportation of energy products. This includes,
gas, oil and product processing, treatment and transportation. 143 of the transactions in this
study are defined as “Midstream and Transportation”.
The classification “Electric” defines companies whose primary line of business is
the generation and long hall transmission of electricity. This includes electric generation
regardless of fuel source (coal, gas, oil, wind, solar, etc.). 71 of the transactions in this study
involved companies defined as “Electric”.
“Leaders and Laggards”
Across any industry certain companies will outperform (on a variety of
performance or financial based metrics) its peers and be viewed as an attractive company.
Similarly, certain companies will underperform (on a variety of performance or financial based
metrics) their industry peers and be considered less attractive to the investment community. This
reality is best evidenced by the varying valuation multiples that companies trade at despite
having similar risk profiles and expected return profiles. This phenomenon is also apparent in
the M&A world where industry leaders are for the most part given the benefit of the doubt in
their business decisions and the market will act in a somewhat favorable manner for a proposed
course of action or new strategic direction. Unfortunately for some would be acquirers the

56
opposite is also true, where for the less desirables the market may take a somewhat skeptical
look at what new course of action that is being proposed (such as an M&A transaction) and
maintain that market skepticism until proven otherwise. To evaluate whether historically “good
companies” are also „good acquirers” and also the negative alternative of whether historically
“poor” companies are also “poor” acquirers two groupings were defined.
“Leaders” are defined as top quartile companies within their industry grouping.
“Laggards” are defined as bottom quartile companies within their industry grouping. The
financial measure utilized to determine the quartiling was a simple 3 year average return on
shareholder equity (ROE) calculated as total return of stock appreciation and dividends paid as
calculated 3 years prior to date of a company transaction. Stated another way, taking the three
years prior to the date of a transaction announcement was the company on a shareholder returns
basis a top or bottom quartile performer. A 3 year time internal was chosen to account for any
single year anomaly that may have impacted any companies‟ individual results. In this analysis
Top quartile performers are referred to as Leaders while bottom quartile performing companies
are referred to as Laggards. 81 transactions were consummated by Leaders, 87 by Laggards and
the remaining fell into the inter quartile range and labeled “All Other”.
ABDC “Top Performers” and “Poor Performers”
Similar to the analytical benefits provided by classifying acquirers as Leaders and
Laggards prior to the announcement of any M&A transaction, to provide a baseline of the market
perception of these acquirers pre transaction, it is also informative to isolate performance
differences across the ABDC time intervals to determine which acquirers exhibited strong or
poor performance for each ABDC category (S&I, T&E, R&I). “Top Performers” are defined as
the top quartile performing acquirers from a returns perspective for each ABDC interval.
Similarly, “Poor Performers” are defined as the bottom quartile performing acquirers from a
returns perspective for each ABDC interval. 82 transactions were classified as “Top
Performers”, 82 transactions as “Poor Performers” with the reminder falling into the inter

57
quartile range and labeled “All Other”. It is important to note that for each ABDC measurement
point (S&I, T&E, R&I) Top and Poor Performers were identified so these groups are not
comprised of the same exact set of acquirers across all ABDC intervals. As an example just
because a company exhibited strong S&I skills and is top quartile in that, does not necessarily
imply that they are also strong in T&E and R&I and may or may not be among the top quartile
performers in those categories. Although it is worth noting that many of the Top performers
have top quartile performance in two of the categories, however, any one acquirer having top
quartile performance across all ABDC categories was rather rare.
Dependent and Independent Variables
Dependent Variables
Dependent variables were defined to quantify the variance observed across the
ABDC groupings. As proxy measures for the effectiveness of a company‟s efforts towards S&I,
T&E and R&I, value creation (or destruction) measurements were calculated and defined as the
acquirer‟s change in market equity value over a specified period of time. For the purposes of this
research the focus was on specifications of the dependent variable that are evaluated at various
measurement points coinciding with the time horizons associated with the ABDC capabilities of
“Selecting and Identifying”, “Transacting and Executing” and “Reconfiguring and Integrating”.
This approach allows for the measure of the relative value enhancement (or destruction) caused
by the firm‟s resource performance within the various ABDC time intervals throughout the deal
lifecycle. Admittedly, these are proxy measures of theoretical constructs but arguably a well-
reasoned approach.
Additionally, as discussed above the analysis focused on both weak and semi-
strong approaches to measuring value creation. The weak forms included simple return metrics
whereas the semi-strong approaches included methodologies that attempt to determine how

58
much better off the returns are for the acquiring firm was as a result of performing a certain
action vis-à-vis a hypothetical situation of having done nothing. This approach controlled for the
fact that markets are dynamic (constantly moving) and looking at static returns of a transaction
without normalizing for market activity provides an inaccurate measure of true value creation.
Stated simplistically, a transaction that provided a positive net return of 10% over
a time frame when that firm‟s market of peers only experienced a 7% average return over the
same period would be said to have a cumulative abnormal return of 3%. Similarly, if a net return
of 5% was obtained on an opportunity when the industry market benchmark grew by 9%, this
would be interpreted as the firm had a -4% abnormal return and thus would be actually
destroying value relative to the industry benchmark and the “do nothing scenario”.
Selecting and Identifying (S&I)
“Selecting and Identifying” capability includes the ability to assess a firm‟s
existing resource base relative to desired new resources and capabilities, to assess the degree of
market failure with respect to resources that are beyond the firm‟s existing resource base and to
assess the number of points of contact that inter-organizational creation or new resources would
require. It also includes the capability to be able to carry out effective due diligence of potential
targets in order to determine the value of the target to the acquirer, to negotiate appropriate terms
with the a target‟s owner, and to walk away from a target if it lacks needed resources or its
owners demand a price that exceeds the value to the acquirer. Firms that can efficiently perform
these tasks and have resources with well-developed capabilities can be positioned to create
substantial competitive advantage.
As a proxy to measure the effectiveness of a firm‟s S&I capabilities, short-term
value measurements are most appropriate. Additionally, the market‟s response to the
effectiveness of these capabilities is best evidenced by how it responds when it is informed of
what the acquirer intends to do. The announcement of the intentions and the market‟s response
to how well the company has identified and selected a target becomes apparent at the
announcement date of the transaction. Utilizing value measures straddling the announcement

59
date of the transaction is an appropriate gauge of the market‟s judgment of a company‟s S&I
capabilities. Furthermore, as the market tends to be somewhat efficient, the window of time
necessary to measure its response is relatively short.
A large body of literature exists that studies short-term acquirer returns. Some of
the more recent work includes, Mulherin (2000), Kohers and Kohers (2000 and 2001), Beitel et
al, (2002), Fuller, Netter, Stegemoller (2002), Ghosh (2002), Kuiper, Miller and Patel (2003).
Each study had its own definition of short-term and how it specified its straddle logic around the
announcement date. Of note is the common practice to peg the straddle date around the
announcement of the transaction (not the closing date). Event windows of (-10, +10) (-5, +5), (-
3, +3), (-1, +1), (0, +1), (0, +3) are pretty common in the literature.
Interestingly the event windows that are being utilized in M&A research for
announcement returns are tending to be shorter than what was used decades ago. Perhaps this is
a byproduct of the faster flowing of information now available and the speed at which markets
are able to re-price assets. As an example 30 years ago an investor would read about a deal
announcement in the Wall Street Journal, a day after the announcement, perhaps call his broker
that afternoon and over the next day or two place a trade that may settle in an additional day or
two. Whereas, today with the advancements of technology, the investor probably knows about
the transaction just prior to the press conference announcing the deal, is able to log in online and
consummate a trade in almost real time. Thus the market impact of news and events are being
captured over very short (and further shortening) time horizons.
Nevertheless, our proxy measures for value created through S&I was evaluated
over multiple time horizons. Weak measurements (simple returns) and semi-strong (abnormal
returns) measurements were evaluated. Different time horizons were calculated all anchored
around the announcement date of the transaction. Simple and abnormal returns were calculated
on a (-1, +1), (-3, +3), (-5, +5) and (-10, +10) basis. For the calculation of abnormal returns the
transactions in the various industry groupings were compared to the following indices: Resources
- S&P Market 500 Index (S&P 500), Utility - Dow Jones Utility Index (DJUI), Midstream and
Transportation – Alerian Midstream Infrastructure Index (AZL), Electric - Dow Jones Utility
60
Index (DJUI). These market based indices reflect peer performance and are most appropriate
when calculating abnormal returns for transactions in each of the industry groups. Summary
statistics for various specifications of the S&I variable are provided in Table 2 and Table 3.
To keep the presentment of the findings manageable, much of the analysis is
centered on two specifications of the S&I variable; one a weak form, one a semi-strong form.
Semi-strong specification of SI_CAR_AN_3DAY (Abnormal returns on a -3, +3 day event
window anchored off of the announcement date) and weak form SI_CAR_AN_3DAY (Simple
returns on a -3, +3 day event window anchored off of the announcement date). In instances
throughout this document where a single measure was required for discussion or analytical
purposes the 3 day abnormal semi-strong measure was utilized.
Transacting and Executing (T&E)
Transacting and Executing capability is the capacity to manage and execute
efficiently the transaction closing process, including meeting all conditions precedent in the
acquisition which may involve arranging financing, obtaining approvals and consents,
(regulatory, shareholder, other) and consummating all other deal closing mechanics. Firms that
can manage efficiently these processes are positioned to take advantage of the opportunity that
was created in “Selecting and Identifying” and can create substantial competitive advantage.
As a proxy to measure the effectiveness of a firm‟s T&E capabilities, short-term
value measurements are most appropriate but anchored around the closing date of the
transaction. Additionally, the market‟s response to the effectiveness of these capabilities is best
evidenced by how it responds when it is informed of how the acquirer expects to close the
transaction and its strategy for satisfying any commitments it made during the announcement
phase of the transaction in its short-term execution plan. Utilizing value measures straddling the
closing date of the transaction is an appropriate gauge of the market‟s judgment of a company‟s
T&E capabilities. Furthermore, as the market tends to be somewhat efficient, the window of
time necessary to measure its response is relatively short, however, the company will spend some
fair amounts of time completing the tasks necessary to effectuate the transaction and get through

61
its first accounting cycle and post-close critical Day 1 transition items which are all part of T&E.
Even though this time period can linger for months as companies work through final regulatory
approvals and meeting conditions necessary to close the transaction, the completion of and
communication of outcomes for many of these tasks occur in the last month pre-closing of a
transaction. Similarly the one month post-closing of the transaction and the completion of the
companies first accounting cycle often is the first indication of how well much of the T&E tasks
were conducted.
Unlike the scholarship done around announcement returns and long-term post-
closing returns which cover many of the S&I and R&I factors, the literature does not provide
much insight into how best to measure these intermediate term capabilities. This is partly the
result of the fact that much of the literature does not deal well with the T&E activities and
measurement at all. In most research design, much of the effects of T&E is muddled in the S&I
and R&I phases as many of the studied transactions in the literature deal with virtually no
approval cycle and do not account for the lag between announcement and closing. Although this
treatment of the T&E aspect of the deal lifecycle is perhaps where much of this study‟s
contribution may ultimately rest, it is the one area with the least theoretical basis to build upon.
Our proxy measures for value created through T&E was evaluated over multiple
time horizons. Weak measurements (simple returns) and semi-strong (abnormal returns)
measurements were evaluated. Different time horizons were calculated all anchored around the
closing date of the transaction. Simple and abnormal returns were calculated on a (-30, +30), (0,
+30), (0, +90) and (0, +180) basis. For the calculation of abnormal returns the transactions in the
various industry groupings were compared to the following indices: Resources - S&P Market
500 Index (S&P 500), Utility - Dow Jones Utility Index (DJUI), Midstream and Transportation –
Alerian Midstream Infrastructure Index (AZL), Electric - Dow Jones Utility Index (DJUI). These
market based indices reflect peer performance and are most appropriate when calculating
abnormal returns for transactions in each of the industry groups.
Summary statistics for various specifications of the T&E variable are provided in
Table 2 and Table 3. To keep the presentment of the findings manageable, much of the analysis

62
is centered on two specifications of the T&E variable one a weak form and one a semi-strong
form. Semi-strong specification of TE_CAR_Clsd_30DAY (Abnormal returns on a -30, +30
event window anchored off of the closing date) and weak form TE_SIM_Clsd_30DAY (Simple
returns on a -30, +30 day event window anchored off of the closing date). In instances in this
Dissertation where a single measure was required for discussion or analytical purposes, the 30
day abnormal semi-strong measure was utilized.
Reconfiguring and Integrating (R&I)
Reconfiguring and Integrating capability is the capacity to reshape resources
within the target and acquiring firms. This involves the capacity to combine resources from the
target and acquirer in order to create new resources, whether at the target or within the acquirer‟s
original business units or in some new organizational unit. This capability also requires the
capacity to selectively divest unneeded resources from the target as well as divest obsolete
resources for the acquirer that have become unnecessary or sub optimal as a result of the R&I
process.
As a proxy to measure the effectiveness of a firm‟s R&I capabilities, long-term
value measurements are most appropriate. Additionally, the market‟s response to the
effectiveness of these capabilities is best evidenced by how it responds when it has an
opportunity to observe how the company performs (operationally and financially) over multiple
reporting cycles. Utilizing value measures post-closing date of the transaction is an appropriate
gauge of the market‟s judgment of a company‟s R&I capabilities.
A large body of literature exists that studies long-term acquirer returns.
Including in this research stream are the works of Pettit (2000), Kohers and Kohers (2001),
Ferris and Park (2001), and Moeller, Sclingemann and Stulz (2003). Each study had its own
specification of a long-term time horizon. Interestingly these studies also pegged their anchor
date to announcement date. This would be somewhat problematic in this study‟s industry
context as in some instances the lag between announcement and closing exceeds a year. So
depending on how long the long-term horizon was set, in this industry context much of that time

63
span could be elapsed pre-closing and not indicative of any actual R&I activities. Some of these
studies did have rather robust time horizons (some upwards of 3 to 5 years). However, the
longer the window, the more noise in the results as other factors become more impactful and the
true effects of the acquisition on company performance becomes more muted over time. As a
result, much of the literature on long-term returns pegs the event window to 360 (or 365) days
out, although some variation exists on whether this is based off of announcement or closing.
The most common timing sequence appears to be one year out and no backward
look (0, +365). This also seems appropriate in this study with the one adjustment that the date
should be anchored off of the closing of the transaction and not the announcement date to better
isolate the effect of R&I. This is also consistent with the desire of utilizing the long-term return
calculation as a proxy for effectiveness of post-closing R&I capabilities.
Similar to the treatment with S&I and T&E, the proxy measures for value created
through R&I was evaluated over multiple time horizons. Weak measurements (simple returns)
and semi-strong (abnormal returns, both CAR and BHAR methodologies) were evaluated.
Different time horizons were calculated all anchored around the closing date of the transaction.
Simple and abnormal (BHAR and CAR) returns were calculated on a (0, +180), (0, +270) and (0,
+360) basis. For the calculation of CAR abnormal returns the transactions in the various
industry groupings were compared to the following indices: Resources - S&P Market 500 Index
(S&P 500), Utility - Dow Jones Utility Index (DJUI), Midstream and Transportation – Alerian
Midstream Infrastructure Index (AZL), Electric - Dow Jones Utility Index (DJUI). These market
based indices reflect peer performance and are most appropriate when calculating abnormal
returns for transactions in each of the industry groups. For the calculation of BHAR (Buy and
Hold Abnormal Returns), representative companies within each industry grouping were selected.
These representative companies were targeted to be similar in size and also one that did not
conduct a M&A transaction over the study period to reflect a baseline of how a representative
company would have performed over the time horizon in the same industries had they not done
an M&A transaction. See Barber and Lyon (1997) for a well-respected discussion of the nuances
of this approach.
64
Summary statistics for various specifications of the R&I variable are provided in
Table 2 and Table 3. To keep the presentment of the findings manageable, much of the analysis
is centered on three specifications of the S&I variable, one a weak form and two semi-strong
forms. Semi-strong specification of RI_BHAR_Clsd_360DAY (BHAR returns on a 0, +360 day
event window anchored off of the closing date), RI_CAR_Clsd_360DAY (CAR returns on a 0,
+360 day event window anchored off of the closing date), and weak form
RI_CAR_Clsd_360DAY (Simple returns on a 0, +360 day event window anchored off of the
closing date). In instances in this Dissertation where a single measure was required for
discussion or analytical purposes, the 0, +360 day BHAR semi-strong measure was utilized.
“Golden Measures”
The combination of weak and semi-strong methods in addition to the multitudes
of timing horizons that could be utilized provides for ample ways of measuring the S&I, T&I and
R&I capabilities. Table 1 provides a listing of the selected variables as well as the multiple
alternative specifications that were calculated and reviewed as part of the study. Furthermore, in
the hopes of keeping the analysis manageable, throughout the Analysis, Results and Discussion
sections below, where it makes sense to work with one set of measures, a “Golden Measure” has
been defined to reflect the single best way to evaluate each of the ABDC capabilities. The
selected Golden Measures are:
S&I – SI_CAR_AN_3DAY (CARs, -3, +3 horizon from announced date)
T&E – TE_CAR_Clsd_30DAY (CARs, -30, +30 day horizon from closed date)
R&I – RI_BHAR_Clsd_360DAY (BHARs, 0, +360 day horizon from closed
date)

65
Table 1: Dependent Variable Descriptions

66
Tables 2 and 3 contain some of the descriptive statistics for the weak and semi-
strong calculations for transaction returns at various timing intervals and methodologies.
Generally speaking transactions appear to have small positive returns on average at
announcement, they are approximately breakeven when evaluated at short time intervals around
the closing and then generally speaking most transaction have negative longer term post-close
returns.
Additionally, when viewed across a deal lifecycle, the small but positive gains
obtained at announcement and shortly after closing are wiped away within the first year after
closing. The findings on average of small initial gains (CARs) is consistent with much of the
past research on expected returns to acquirers and supportive of findings including; Kohers and
Kohers (2000 and 2001), Mulherin (2000), Floreani and Rigamonti (2001), Beitel, et al (2002),
Fuller, Netter and Stegomoller (2002), and Rennenboog and Goergen (2003). Additionally, the
findings of long-term larger negative returns (CARs and BHARs) is consistent with the previous
work of Pettit (2000), Ferris and Park (2001), Kohers and Kohers (2001) and Moeller,
Schlingemann and Stulz (2003). Differences do exist when evaluating the Leaders versus the
Laggards as well as across the different industry subgroups. A much richer discussion of the
factor impacts and differences across transactions on the estimations of the S&I, T&E and R&I
variables is provided in the Results and Discussion sections below.

67
Table 2: Return Statistics by Performance Group
Min Max Mean STD Min Max Mean STD Min Max Mean STD Min Max Mean STD
SimRet_An_1day -0.16 0.52 0.006 0.049 -0.04 0.19 0.008 0.032 -0.16 0.52 0.018 0.078 -0.16 0.16 -0.001 0.034
SimRet_An_3day -0.27 0.32 0.007 0.057 -0.07 0.21 0.013 0.040 -0.27 0.32 0.021 0.078 -0.25 0.22 -0.004 0.050
SimRet_An_5day -0.27 0.36 0.010 0.061 -0.08 0.22 0.018 0.043 -0.19 0.36 0.030 0.078 -0.27 0.2 -0.003 0.056
SimRet_An_10day -0.58 0.9 0.016 0.096 -0.08 0.23 0.021 0.051 -0.33 0.9 0.036 0.130 -0.58 0.66 0.003 0.090
SimRet_An_30day -0.47 0.88 0.019 0.125 -0.47 0.22 0.022 0.094 -0.26 0.72 0.030 0.147 -0.38 0.88 0.011 0.125
SimRet_An_180day -0.91 2.11 0.058 0.282 -0.88 0.39 0.087 0.184 -0.91 1.98 0.051 0.399 -0.65 2.11 0.048 0.245
SimRet_An_270day -0.76 3.03 0.085 0.362 -0.52 0.57 0.132 0.222 -0.76 3.03 0.091 0.518 0.72 2.85 0.061 0.318
SimRet_An_360day -0.91 3.86 0.121 0.410 -0.91 0.64 0.173 0.230 -0.91 3.86 0.138 0.636 -0.72 2.93 0.090 0.327
CAR_An_1day -0.17 0.5 0.005 0.048 -0.06 0.18 0.008 0.032 -0.17 0.5 0.016 0.075 -0.17 0.15 -0.002 0.033
CAR_An_3day -0.28 0.32 0.005 0.053 -0.11 0.21 0.009 0.038 -0.28 0.32 0.016 0.073 -0.26 0.21 -0.003 0.046
CAR_An_5day -0.25 0.36 0.008 0.057 -0.15 0.21 0.012 0.042 -0.19 0.36 0.024 0.074 -0.25 0.24 -0.003 0.050
CAR_An_10day -0.59 0.84 0.009 0.089 -0.07 0.2 0.012 0.046 -0.32 0.84 0.026 0.118 -0.59 0.66 0.000 0.086
CAR_An_30day -0.46 0.85 0.012 0.117 -0.46 0.23 0.013 0.086 -0.31 0.64 0.022 0.135 -0.44 0.85 0.007 0.121
CAR_An_180day -0.82 2.06 0.032 0.254 -0.62 0.42 0.041 0.166 -0.82 1.87 0.032 0.354 -0.56 2.06 0.028 0.227
CAR_An_270day -0.77 2.87 0.040 0.322 -0.72 0.56 0.062 0.189 -0.77 2.87 0.039 0.450 -0.54 2.76 0.029 0.293
CAR_An_360day -0.91 3.65 0.054 0.363 -0.25 0.84 0.086 0.192 -0.91 3.65 0.059 0.552 -0.59 2.81 0.037 0.299
BHAR_An_1day -0.18 0.53 0.007 0.051 -0.06 0.19 0.010 0.035 -0.15 0.53 0.017 0.078 -0.18 0.17 -0.001 0.036
BHAR_An_3day -0.3 0.32 0.004 0.057 -0.13 0.22 0.008 0.049 -0.29 0.32 0.015 0.073 -0.3 0.24 -0.003 0.051
BHAR_An_5day -0.3 0.35 0.004 0.062 -0.21 0.2 0.009 0.054 -0.23 0.35 0.020 0.077 -0.3 0.24 -0.006 0.056
BHAR_An_10day -0.65 0.84 0.005 0.096 -0.22 0.2 0.008 0.055 -0.36 0.84 0.021 0.123 -0.65 0.64 -0.005 0.095
BHAR_An_30day -0.43 0.84 0.001 0.125 -0.33 0.24 -0.001 0.095 -0.29 0.62 0.012 0.141 -0.43 0.84 -0.003 0.130
BHAR_An_180day -0.82 2.08 -0.023 0.285 -0.82 0.44 -0.017 0.193 -0.61 1.94 -0.037 0.389 -0.65 2.08 -0.018 0.259
BHAR_An_270day -0.82 2.93 -0.042 0.348 -0.82 0.47 -0.014 0.228 -0.72 2.93 -0.052 0.467 -0.62 2.81 -0.049 0.324
BHAR_An_360day -0.88 3.71 -0.065 0.391 -0.88 0.58 -0.027 0.246 -0.77 3.71 -0.056 0.575 -0.78 2.87 -0.088 0.326
SimRet_Clsd_1day -0.43 0.19 0.002 0.032 -0.03 0.05 0.003 0.014 -0.43 0.12 -0.001 0.054 -0.06 0.19 0.003 0.022
SimRet_Clsd_3day -0.47 0.2 0.001 0.046 -0.07 0.07 0.006 0.025 -0.47 0.2 0.000 0.071 -0.19 0.19 0.000 0.038
SimRet_Clsd_5day -0.63 0.27 0.000 0.061 -0.14 0.08 0.004 0.034 -0.63 0.27 0.000 0.089 -0.33 0.19 -0.001 0.053
SimRet_Clsd_10day -0.83 0.23 -0.004 0.079 -0.21 0.1 0.002 0.052 -0.83 0.23 -0.003 0.113 -0.39 0.2 -0.007 0.068
SimRet_Clsd_30day -0.9 1.31 0.005 0.147 -0.17 0.21 0.030 0.078 -0.9 1.31 0.012 0.228 -0.62 0.33 -0.010 0.113
SimRet_Clsd_180day -0.99 1.98 0.032 0.274 -0.72 0.52 0.083 0.278 -0.99 1.98 0.022 0.383 -0.82 0.75 0.013 0.196
SimRet_Clsd_270day -0.94 2 0.046 0.327 -0.64 0.74 0.113 0.257 -0.88 2 0.042 0.462 -0.94 1.23 0.018 0.267
SimRet_Clsd_360day -0.72 2.77 0.084 0.360 -0.42 0.77 0.145 0.273 -0.72 2.77 0.088 0.544 -0.66 1.18 0.056 0.273
CAR_Clsd_1day -0.42 0.21 0.002 0.033 -0.03 0.05 0.002 0.012 -0.42 0.12 -0.001 0.053 -0.06 0.21 0.003 0.024
CAR_Clsd_3day -0.47 0.2 0.004 0.041 -0.05 0.09 0.007 0.023 -0.47 0.14 0.004 0.062 -0.09 0.2 0.002 0.032
CAR_Clsd_5day -0.61 0.2 0.003 0.051 -0.06 0.14 0.005 0.030 -0.61 0.15 0.003 0.079 -0.14 0.2 0.001 0.040
CAR_Clsd_10day -0.85 0.18 -0.001 0.068 -0.11 0.09 0.002 0.035 -0.85 0.18 -0.001 0.106 -0.24 0.18 -0.003 0.054
CAR_Clsd_30day -0.9 1.29 0.003 0.133 -0.17 0.25 0.018 0.067 -0.9 1.29 0.014 0.212 -0.65 0.22 -0.009 0.099
CAR_Clsd_180day -0.88 1.88 0.012 0.234 -0.63 0.54 0.036 0.229 -0.88 1.88 0.010 0.329 -0.7 0.74 0.002 0.170
CAR_Clsd_270day -0.87 2.01 0.020 0.271 -0.77 0.59 0.059 0.209 -0.87 2.01 0.016 0.388 -0.7 0.97 0.003 0.218
CAR_Clsd_360day -0.87 2.64 0.031 0.310 -0.72 0.67 0.064 0.211 -0.87 2.64 0.033 0.459 -0.43 0.99 0.015 0.250
BHAR_Clsd_1day -0.41 0.21 0.002 0.032 -0.03 0.05 0.003 0.015 -0.41 0.11 0.000 0.051 -0.06 0.21 0.002 0.026
BHAR_Clsd_3day -0.43 0.22 0.004 0.046 -0.05 0.1 0.007 0.025 -0.43 0.13 0.002 0.063 -0.13 0.22 0.003 0.043
BHAR_Clsd_5day -0.58 0.21 0.002 0.059 -0.09 0.16 0.007 0.035 -0.58 0.2 0.001 0.082 -0.17 0.21 0.000 0.053
BHAR_Clsd_10day -0.81 0.36 -0.002 0.078 -0.19 0.12 0.002 0.047 -0.81 0.2 -0.006 0.108 -0.22 0.36 -0.002 0.072
BHAR_Clsd_30day -0.76 1.28 -0.008 0.143 -0.3 0.25 0.000 0.092 -0.76 1.28 -0.004 0.215 -0.62 0.24 -0.014 0.114
BHAR_Clsd_180day -0.84 1.86 -0.046 0.252 -0.82 0.38 -0.028 0.254 -0.84 1.86 -0.054 0.331 -0.73 0.61 -0.051 0.198
BHAR_Clsd_270day -0.72 1.98 -0.066 0.289 -0.52 0.65 -0.028 0.251 -0.72 1.98 -0.067 0.390 -0.63 0.91 -0.085 0.241
BHAR_Clsd_360day -0.82 2.63 -0.092 0.330 -0.58 0.65 -0.068 0.265 -0.53 2.63 -0.085 0.452 -0.82 0.86 -0.108 0.281
All
n=337
Leaders
n=81
Laggards
n=87
All Others
n=169

68
Table 3: Return Statistics by Industry Group
Min Max Mean STD Min Max Mean STD Min Max Mean STD Min Max Mean STD
SimRet_An_1day -0.16 0.21 0.003 0.057 -0.16 0.07 -0.002 0.034 -0.14 0.52 0.013 0.055 -0.1 0.29 0.003 0.045
SimRet_An_3day -0.15 0.22 0.004 0.067 -0.27 0.15 -0.001 0.058 -0.25 0.26 0.013 0.056 -0.09 0.32 0.006 0.053
SimRet_An_5day -0.27 0.22 0.006 0.079 -0.19 0.17 0.002 0.056 -0.25 0.22 0.014 0.058 -0.1 0.36 0.014 0.059
SimRet_An_10day -0.15 0.23 0.013 0.076 -0.33 0.29 0.005 0.069 -0.58 0.9 0.018 0.113 -0.12 0.66 0.024 0.096
SimRet_An_30day -0.24 0.37 0.019 0.128 -0.26 0.28 0.010 0.086 -0.47 0.72 0.018 0.137 -0.26 0.88 0.029 0.133
SimRet_An_180day -0.8 0.61 0.091 0.279 -0.88 0.42 0.048 0.198 -0.91 1.98 0.038 0.304 -0.24 2.11 0.088 0.314
SimRet_An_270day -0.81 0.8 0.082 0.374 -0.81 0.7 0.072 0.265 -0.76 3.03 0.086 0.391 -0.47 2.85 0.100 0.390
SimRet_An_360day -0.91 1.68 0.178 0.447 -0.91 0.65 0.114 0.273 -0.91 3.86 0.112 0.460 -0.85 2.93 0.109 0.414
CAR_An_1day -0.17 0.19 0.004 0.052 -0.17 0.07 -0.003 0.033 -0.15 0.5 0.012 0.053 -0.1 0.29 0.001 0.047
CAR_An_3day -0.07 0.21 0.005 0.049 -0.28 0.17 -0.001 0.058 -0.26 0.22 0.009 0.051 -0.11 0.32 0.003 0.056
CAR_An_5day -0.13 0.2 0.004 0.061 -0.19 0.2 0.002 0.054 -0.25 0.21 0.011 0.051 -0.15 0.36 0.010 0.067
CAR_An_10day -0.12 0.19 0.009 0.057 -0.32 0.27 0.002 0.065 -0.59 0.84 0.012 0.103 -0.1 0.66 0.012 0.098
CAR_An_30day -0.23 0.37 0.005 0.110 -0.31 0.26 0.011 0.090 -0.46 0.64 0.012 0.125 -0.22 0.85 0.018 0.132
CAR_An_180day -0.75 0.5 0.055 0.239 -0.62 0.46 0.026 0.188 -0.82 1.87 0.016 0.254 -0.35 2.06 0.055 0.318
CAR_An_270day -0.79 0.69 0.045 0.302 -0.72 0.58 0.036 0.226 -0.77 2.87 0.039 0.341 -0.59 2.76 0.041 0.381
CAR_An_360day -0.88 1.56 0.123 0.403 -0.91 0.64 0.053 0.214 -0.91 3.65 0.050 0.392 -0.81 2.81 0.019 0.401
BHAR_An_1day -0.15 0.22 0.004 0.056 -0.18 0.09 0.001 0.039 -0.14 0.53 0.012 0.056 -0.09 0.29 0.003 0.045
BHAR_An_3day -0.13 0.24 0.007 0.064 -0.29 0.17 -0.002 0.061 -0.3 0.22 0.006 0.053 -0.13 0.32 0.005 0.057
BHAR_An_5day -0.14 0.23 0.003 0.069 -0.23 0.18 -0.002 0.063 -0.3 0.2 0.005 0.056 -0.21 0.35 0.012 0.071
BHAR_An_10day -0.13 0.16 0.006 0.069 -0.36 0.23 -0.002 0.069 -0.65 0.84 0.004 0.111 -0.22 0.64 0.014 0.106
BHAR_An_30day -0.26 0.37 -0.006 0.121 -0.29 0.27 0.006 0.103 -0.43 0.62 -0.003 0.128 -0.29 0.84 0.010 0.145
BHAR_An_180day -0.87 0.8 -0.021 0.277 -0.82 0.55 -0.005 0.226 -0.61 1.94 -0.059 0.283 -0.44 2.08 0.030 0.341
BHAR_An_270day -0.86 0.8 -0.069 0.311 -0.82 0.4 -0.007 0.249 -0.72 2.93 -0.064 0.371 -0.67 2.81 -0.015 0.410
BHAR_An_360day -0.91 1.72 -0.048 0.419 -0.88 0.51 -0.023 0.237 -0.77 3.71 -0.094 0.425 -0.87 2.87 -0.063 0.433
SimRet_Clsd_1day -0.43 0.07 -0.002 0.067 -0.06 0.06 0.003 0.020 -0.07 0.19 0.003 0.026 -0.06 0.05 0.001 0.016
SimRet_Clsd_3day -0.47 0.1 0.002 0.078 -0.19 0.1 -0.005 0.036 -0.16 0.2 0.004 0.045 -0.07 0.08 0.003 0.029
SimRet_Clsd_5day -0.63 0.11 -0.001 0.102 -0.33 0.11 -0.009 0.059 -0.2 0.27 0.003 0.052 -0.1 0.15 0.006 0.040
SimRet_Clsd_10day -0.83 0.14 -0.009 0.135 -0.39 0.15 -0.016 0.077 -0.26 0.23 0.000 0.062 -0.18 0.2 0.005 0.059
SimRet_Clsd_30day -0.9 0.23 -0.006 0.171 -0.44 0.22 0.003 0.095 -0.67 1.31 0.016 0.169 -0.62 0.22 -0.007 0.126
SimRet_Clsd_180day -0.77 0.63 0.005 0.351 -0.99 0.69 0.045 0.200 -0.81 1.98 0.038 0.305 -0.82 0.49 0.023 0.217
SimRet_Clsd_270day -0.87 0.8 0.049 0.354 -0.64 1.04 0.061 0.294 -0.88 2 0.051 0.369 -0.95 0.74 0.017 0.252
SimRet_Clsd_360day -0.77 0.97 0.103 0.465 -0.58 0.81 0.101 0.213 -1.5 2.77 0.082 0.427 -0.66 0.77 0.059 0.270
CAR_Clsd_1day -0.42 0.05 -0.005 0.065 -0.07 0.11 0.003 0.024 -0.08 0.21 0.004 0.025 -0.06 0.08 0.003 0.019
CAR_Clsd_3day -0.47 0.1 0.003 0.078 -0.09 0.07 -0.001 0.026 -0.09 0.2 0.007 0.034 -0.05 0.09 0.004 0.029
CAR_Clsd_5day -0.61 0.14 -0.002 0.100 -0.14 0.07 -0.003 0.034 -0.07 0.2 0.005 0.039 -0.09 0.12 0.008 0.040
CAR_Clsd_10day -0.85 0.09 -0.015 0.132 -0.24 0.09 -0.010 0.051 -0.21 0.18 0.004 0.049 -0.21 0.18 0.006 0.055
CAR_Clsd_30day -0.9 0.2 -0.012 0.155 -0.39 0.25 0.006 0.087 -0.55 1.29 0.013 0.149 -0.65 0.34 -0.010 0.124
CAR_Clsd_180day -0.77 0.69 -0.017 0.316 -0.79 0.57 0.024 0.167 -0.74 1.88 0.023 0.257 -0.88 0.44 -0.004 0.179
CAR_Clsd_270day -0.87 0.85 0.038 0.313 -0.77 0.98 0.022 0.231 -0.75 2.01 0.034 0.304 -0.69 0.51 -0.023 0.202
CAR_Clsd_360day -0.77 0.99 0.071 0.445 -0.87 0.8 0.046 0.197 -0.72 2.64 0.034 0.341 -0.43 0.42 -0.016 0.226
BHAR_Clsd_1day -0.41 0.04 -0.004 0.063 -0.03 0.09 0.000 0.026 -0.08 0.21 0.005 0.026 -0.04 0.04 0.002 0.015
BHAR_Clsd_3day -0.43 0.11 0.002 0.076 -0.13 0.19 -0.002 0.045 -0.08 0.22 0.005 0.039 -0.05 0.08 0.007 0.029
BHAR_Clsd_5day -0.58 0.16 -0.004 0.101 -0.17 0.21 -0.004 0.052 -0.14 0.2 0.005 0.048 -0.15 0.13 0.007 0.045
BHAR_Clsd_10day -0.81 0.12 -0.012 0.128 -0.22 0.36 -0.012 0.073 -0.21 0.17 0.003 0.061 -0.22 0.2 0.005 0.072
BHAR_Clsd_30day -0.76 0.23 -0.025 0.142 -0.32 0.25 0.004 0.107 -0.6 1.28 -0.007 0.163 -0.62 0.28 -0.011 0.135
BHAR_Clsd_180day -0.63 0.54 -0.079 0.317 -0.84 0.36 -0.039 0.181 -0.84 1.86 -0.045 0.280 -0.73 0.37 -0.034 0.205
BHAR_Clsd_270day -0.97 0.71 -0.069 0.323 -0.52 0.72 -0.050 0.224 -0.72 1.98 -0.070 0.328 -0.63 0.65 -0.074 0.245
BHAR_Clsd_360day -0.52 0.7 -0.078 0.400 -0.53 0.63 -0.033 0.244 -0.53 2.63 -0.124 0.369 -0.82 0.57 -0.101 0.265
Resource Based
n=47
Utilities
n=76
Midstream and Transportation
n=143
Electric
n=71

69
Independent Variables
To operationalize the Construct Model (Figure 1) into testable equations, the
constructs needed to be developed into a set of quantifiable independent variables that attempt to
explain variation in the dependent variables defined above. Prior research was informative with
regards to the appropriate variables to utilize and their expected impact on the ABDC categories.
The independent variables were defined as follows:
Like Buying Like Business: This is a dummy variable and set equal to 1 if both
the acquirer and the target company are classified as being within the same
industry segment, otherwise the variable is set equal to 0. Consistent with
(Haywood and Hambrick, 1997), (Lubatkin, et al. 1997) and (Walker, 2000) the
literature provides a mix basis for how this variable should behave. In some
instances markets appreciate a diversification play, whereas in other situations the
market prefers companies to stick to their core competencies and buy similarly
situated companies. From a resource and ABDC perspective acquirers know what
they already know and buying like businesses can be a great advantage from an
S&I, T&E and R&I perspective. In this transaction dataset, 60.5% of the
evaluated deals involved companies purchasing like businesses.
Lag from a Critical Regulatory Date: Consistent with (Andrade, 2001), (Carow et
al., 2004) and (Harford, 2005), this variable measures the number of months
elapsed since the last major Federal energy law that was passed that would be
expected to have a substantial impact on industry consolidation within the four
defined industry segments. For each of the four industry groupings only the
timing of relevant Federal legislation was factored into this variable. As an
example the “Resource” transactions are impacted by the timing of EPAct 1992
and 2005 and the Greenhouse Tax Law of 2012. The “Utilities” grouping is

70
triggered off of PURPA 1978, EPAct 1992 and 2005. Whereas, the “Midstream
and Transportation” transactions are influenced by FERC 636 and FERC 888,
(1992 and 1996) and the “Power” transactions, PURPA 1978 and Clean Power
Act of 2015.
Approval Cycle: The number of days required to get approval of the transaction.
For planning purposes is the number of days that after deal announcement the
transaction is expected to take to close (based off of the proposed approval
schedule) and after the close, it is the actual number of days it takes for the
transaction to go from announced to close. As described above, only transactions
with a deal cycle of at least 30 days were included. Consistent with (Homburg
and Bucerius, 2006) and (Vester, 2002) to the extent that the approval cycle is
long and arduous, this will place considerable strain on company resources
focused on ABDC activities. Similarly the longer the approval process goes the
more likely the deal gets modified from an economic perspective as additional
concessions are requested and thus becomes potentially less attractive to
investors. The average deal cycle time for the included transactions was 140
days with the longest deal taken almost 3 years to close.
Stock Deal: This is a dummy variable set to equal 1 if at least half of the amount
paid for the acquisition was attributed to issuance of company stock. The variable
is set equal to 0 otherwise. Consistent with (Franks et al., 1988) and (Walker,
2000) past research has suggested that markets tend not to favor (from the
acquirers‟ perspective) stock based deals as much as they do deals with alternative
payment options. As the markets perceive the company to believe that its own
equity might be somewhat overvalued as it uses this inflated form of currency to
finance the acquisition. As a result, the response of the markets tends to be a
negative one. Of the 337 transactions only 18.4% were stock purchases.

71
Announced Deal During a Recession: This is a dummy variable set to equal 1 if
the deal was announced during a US economic recession. The variable is set to 0
otherwise. Consistent with (Geroski, 1994), (Becketti, 1986) and (Yagil, 1996)
the effect of an economic recession impacts the purchasing environment for the
buyer. In many cases it has a negative impact on equity markets and oftentimes
has a chilling effect on debt markets. Arranging for a deal during a recession
becomes a challenge in the capital markets. Equity outlooks tend to be less than
ideal and the availability and cost of capital (debt and equity) makes
consummating a transaction difficult and oftentimes relatively expensive. The
existence of a recession is expected to slow down deal velocity and also makes
completing a successful transaction more difficult. For the purposes of this study,
the National Bureaus of Economic Research (NBER) definition of recession was
utilized. According to this standard the US economy was in recession from
March 2001 to November 2001 and from December 2007 through June 2009.
Only 8.0% of the transactions in the dataset were announced during a recession.
Closed During a Recession: This is a dummy variable set to equal 1 if the deal
was closed during a US economic recession. The variable is set to equal 0
otherwise. Consistent with (Geroski, 1994), (Becketti, 1986) and (Yagil, 1996)
the effect of an economic recession impacts the purchasing environment for the
buyer. In many cases it has a negative impact on equity markets and often times
has a chilling effect on debt markets. Closing a deal during a recession with
turbulent capital markets is somewhat of a challenge. The existence of a
recession is expected to slow down deal velocity and also make completing a
successful transaction more difficult. For the purposes of this study, the National
Bureaus of Economic Research (NBER) definition of recession was utilized.
According to this standard the US economy was in recession from March 2001 to
November 2001 and from December 2007 through June 2009. Only 8.3% of the
transactions in the dataset were closed during a recession.
72
Announced During a Merger Wave: This is a dummy variable set to equal 1 if the
transaction was announced during an industry group merger wave. For the
purposes of this study, merger waves were defined for each industry group (group
specific waves) comparing both the existence of a broader merger wave with the
level of consolidation occurring at the industry grouping level. Consistent with
(Andrade, 2001), (Carow et al., 2004) and (Harford, 2005) in the event that over 5
transactions of meaningful size occurred over a 12 month time horizon, then it
was defined as an industry segment that was in a consolidation wave. For the
purposes of this analysis, Resource companies were in a wave from 2009-2011,
Utilities, 1999, 2006, 2010-2011, Midstream and Transportation 2010 to 2015 and
Electric 1998-2000, 2007, 2014-2015. It is postulated that if a company acquires
early or before a formal wave is defined, there is a good opportunity for a
company to make a value enhancing acquisition, whereas once the wave has
started, transactions become more difficult (fewer counter parties exist due to
consolidation, premiums paid to sellers to transact going up, speculation pricing
hampering deals, etc.) 33.5% of the transactions in the dataset occurred during
the windows defined as merger waves.
Experienced M&A Team: This is a dummy variable set equal to 1 if the acquirer
had completed more than 1 previous M&A transaction in the previous 5 years.
The variable is set to 0 otherwise. Consistent with (Franks, et al., 1991),
(Haleblian and Finkelstein, 1999) and (Hayward, 2002) in most instances one
would think that the more experience a company has the better it should be at the
given task of acquiring a company. However, this is not necessarily the case.
Some research has suggested that no two M&A transactions are really every alike
and that to meaningfully move up the learning curve requires multiple (perhaps
dozens) iterations to make progress and gain proficiency. Serial acquirers (Cisco
and Bank One for example) who have completed hundreds of transactions might
be able to benefit from their experience in a tangible way, however, the expected
73
impact of experience for less experienced acquirers is a bit less clear. There is
also the suggestion by some that having conducted a few transactions could be
even worse than none at all as the team is more susceptible to become
overconfident. This is despite the fact that a few transactions provide little
practical and transferable knowledge and as a result the team is more likely to
misstep. For the transactions in this study 38.3% of the transactions were
completed by firms that would be descried as experienced.
Company Pressured to Transact: This is an interactive dummy variable that is set
equal to 1 if the company segment is both currently in a merger wave and the
acquiring company has not completed its own acquisition over the previous 5
years. Consistent with (McNamara, 2008) and (Carow, 2009) when companies
are in waves they feel the market pressure that they need to either acquire
someone or run the risk of they themselves being acquired (which they usually do
not want). As a result, companies are on the margin more likely to do a poor deal
if they feel any significant pressure to transact. Only 10.7% of the transactions in
the dataset met these criteria.
First Deal for the Team: This is a dummy variable that is set to equal to 1 if the
transaction being completed is the first one for the company in the data set (and
going back an additional 10 years). The variable is set equal to 0 otherwise.
Consistent with (Franks, et al., 1991), (Haleblian and Finkelstein, 1999) and
(Hayward, 2002) similar to the experienced team variable, this variable captures
experience as well as potential other deal specific motivations of management
teams wanting to transact. In some instances if a company wants to transact too
strongly they may on the margin decide to do a transaction that might not be in its
best interest. Similarly, if a company has never completed a transaction it has
little experience to rely on. As both of these factors can be problematic, it is
assumed that results may suffer for transactions that are the first for a given

74
acquirer. In this transaction dataset 40.1% of the transactions were the first deal
for the team.
Critical Deal for the Acquirer: This is a dummy variable set equal to 1 if the
enterprise value of the acquired entity represents at least 20% of the enterprise
value of the acquiring firm. Consistent with (Moeller, et al., 2004) and
(Finkelstein and Haleblian, 2002) this variable helps control for the size of the
transactions and the expected impact it could have on the acquiring company. For
example, a minuscule transaction completed by a massive acquirer would only
expect to have a negligible effect on the acquiring company regardless of whether
it was done well or not. The size component also captures some of the
importance that the company may place on the transaction. Arguably the larger
the deal the more importance that the acquirer will place on it and assign
resources appropriately. In this transaction dataset, 42.7% of the transactions
were coded as critical to the acquirers.
Multi-State Transaction: This is a dummy variable that is set to equal 1 if the
business being acquired has operations in multiple states. The variable is set to
equal 0 otherwise. Multi-State deals require approvals, regulatory conditions and
often concessions over many states. Consistent with (Capron and Anand, 2007),
(Anand, et al., 2005) and (Capron et al., 1998, 2001) the more states a transaction
crosses over the more complex and potentially costly the deal is to consummate.
On the other hand a multi-state transaction also may provide additional market
opportunities for the acquirer as it opens additional markets for the company. So
the net effect on overall performance could be a net positive. Nevertheless, multi-
state transactions are much harder to arrange, execute and integrate from an S&I,
T&E and R&I perspective. In this transaction dataset 47.2% of the transactions
cut over multiple states.

75
Overlapping States: This is a dummy variable that is set to equal 1 if the
business being acquired has operations in the same jurisdiction as the acquirer.
The variable is set to equal 0 otherwise. Consistent with (Capron and Anand,
2007), (Anand, et al., 2005) and (Capron et al., 1998, 2001) overlapping state
deals require approvals, regulatory conditions and often concessions over many
states but if they are states where the acquirer already operates and has expertise
and perhaps good relationships (overlap) this could be a net positive. The more
states a transaction crosses over the more complex and potentially costly to
consummate but to the extent there is overlap from the acquirer they may be able
to benefit from skills and resources already put in place. In this transaction
dataset 57.0% of the transactions involved overlapping states form an acquirer‟s
perspective.
Multi Business Segment: This is classified as a dummy variable and set equal to 1
if the acquisition target is involved in multi energy segment operations, otherwise
the variable is set equal to 0. Consistent with (Agrawal and Jaffe, 1992), (Berger
and Ofek, 1995) and (Lubatkin, 1987) the literature provides a mix basis for how
this variable should behave. In some instances markets appreciate a pure play
investment thesis and in other instances it prefers some diversification.
Regardless of the market receptiveness issues, targets that are multi segment are
more difficult to transact from an ABDC perspective. S&I is a challenge as the
business is more complicated to evaluate, T&E tends to become more drawn out
and costly to reflect the complexity of the business and R&I initiatives tend to be
much more costly to complete and potentially riskier. In this transaction dataset
24.6% of the evaluated deals were multi business segment acquisitions.

76
A summarized description of the independent variables are provided in the Table
4 below. Additionally, summarized descriptive statistics are provided in Tables 5 and Tables 6.
Table 5 provides descriptive statistics for all of the transactions in addition to the Leader and
Laggard and All Other groupings. Similarly, Table 6 provides descriptive statistics for the
independent variables broken out by industry grouping: Resources, Utilities, Midstream and
Transportation and Electric.

77
Table 4: Independent Variable Descriptions

78
Table 5: Summary Statistics by Performance Grouping
Table 6: Summary Statistics by Industry Segment
Min Max Mean STD Min Max Mean STD Min Max Mean STD Min Max Mean STD
Like Buying Like Businesses 0 1 0.605 0.490 0 1 0.654 0.479 0 1 0.506 0.503 0 1 0.633 0.483
Lag from Critical Reg Date 0.1 234.7 107.035 65.575 6 234.7 117.620 70.352 0.2 232.2 107.827 69.715 0.1 230.7 101.553 60.587
Approval Cycle 30 909 140.365 148.114 38 546 120.259 123.428 30 683 130.391 149.912 30 909 155.136 157.005
Stock Deal 0 1 0.184 0.388 0 1 0.247 0.434 0 1 0.161 0.370 0 1 0.166 0.373
Announced During a Recession 0 1 0.080 0.272 0 1 0.062 0.242 0 1 0.092 0.291 0 1 0.083 0.276
Closed During a Recession 0 1 0.083 0.276 0 1 0.062 0.242 0 1 0.046 0.211 0 1 0.112 0.317
Announced During a Merger Wave 0 1 0.335 0.473 0 1 0.444 0.500 0 1 0.322 0.470 0 1 0.290 0.455
Experienced M&A Team 0 1 0.383 0.487 0 1 0.432 0.498 0 1 0.253 0.437 0 1 0.426 0.496
Company Pressured to Transact 0 1 0.107 0.309 0 1 0.099 0.300 0 1 0.138 0.347 0 1 0.095 0.294
First Deal For Team 0 1 0.401 0.491 0 1 0.358 0.482 0 1 0.517 0.503 0 1 0.361 0.482
Critical Deal for Acquirer 0 1 0.427 0.495 0 1 0.506 0.503 0 1 0.425 0.497 0 1 0.391 0.489
Multi State Transaction 0 1 0.472 0.500 0 1 0.543 0.501 0 1 0.483 0.503 0 1 0.432 0.497
Overlapping States 0 1 0.570 0.496 0 1 0.605 0.492 0 1 0.494 0.503 0 1 0.592 0.493
Multi Business Segment Transaction 0 1 0.246 0.431 0 1 0.185 0.391 0 1 0.184 0.390 0 1 0.308 0.463
All
n=337
Leaders
n=81
Laggards
n=87
All Others
n=169
Min Max Mean STD Min Max Mean STD Min Max Mean STD Min Max Mean STD
Like Buying Like Businesses 0 1 0.255 0.441 0 1 0.303 0.462 0 1 0.762 0.427 0 1 0.845 0.364
Lag from Critical Reg Date 4.5 119.8 67.106 30.177 0.2 122.4 55.497 29.289 45 234.7 168.207 49.802 0.1 121.4 65.428 27.149
Approval Cycle 30 456 85.851 108.150 46 683 215.553 154.337 36 244 63.811 48.720 42 909 250.155 186.941
Stock Deal 0 1 0.064 0.247 0 1 0.158 0.367 0 1 0.203 0.404 0 1 0.254 0.438
Announced During a Recession 0 1 0.149 0.360 0 1 0.118 0.325 0 1 0.049 0.217 0 1 0.056 0.232
Closed During a Recession 0 1 0.043 0.204 0 1 0.132 0.340 0 1 0.056 0.231 0 1 0.113 0.318
Announced During a Merger Wave 0 0 0.000 0.000 0 1 0.276 0.450 0 1 0.497 0.502 0 1 0.296 0.460
Experienced M&A Team 0 1 0.298 0.462 0 1 0.276 0.450 0 1 0.497 0.502 0 1 0.324 0.471
Company Pressured to Transact 0 0 0.000 0.000 0 1 0.092 0.291 0 1 0.119 0.325 0 1 0.169 0.377
First Deal For Team 0 1 0.447 0.503 0 1 0.434 0.499 0 1 0.329 0.471 0 1 0.479 0.503
Critical Deal for Acquirer 0 1 0.340 0.479 0 1 0.447 0.501 0 1 0.448 0.499 0 1 0.423 0.497
Multi State Transaction 0 1 0.404 0.496 0 1 0.368 0.486 0 1 0.580 0.495 0 1 0.409 0.495
Overlapping States 0 1 0.745 0.441 0 1 0.500 0.503 0 1 0.580 0.495 0 1 0.507 0.504
Multi Business Segment Transaction 0 1 0.340 0.479 0 1 0.290 0.457 0 1 0.112 0.316 0 1 0.409 0.495
Electric
n=71
Utilities
n=76
Midstream and Transportation
n=143
Resource Based
n=47
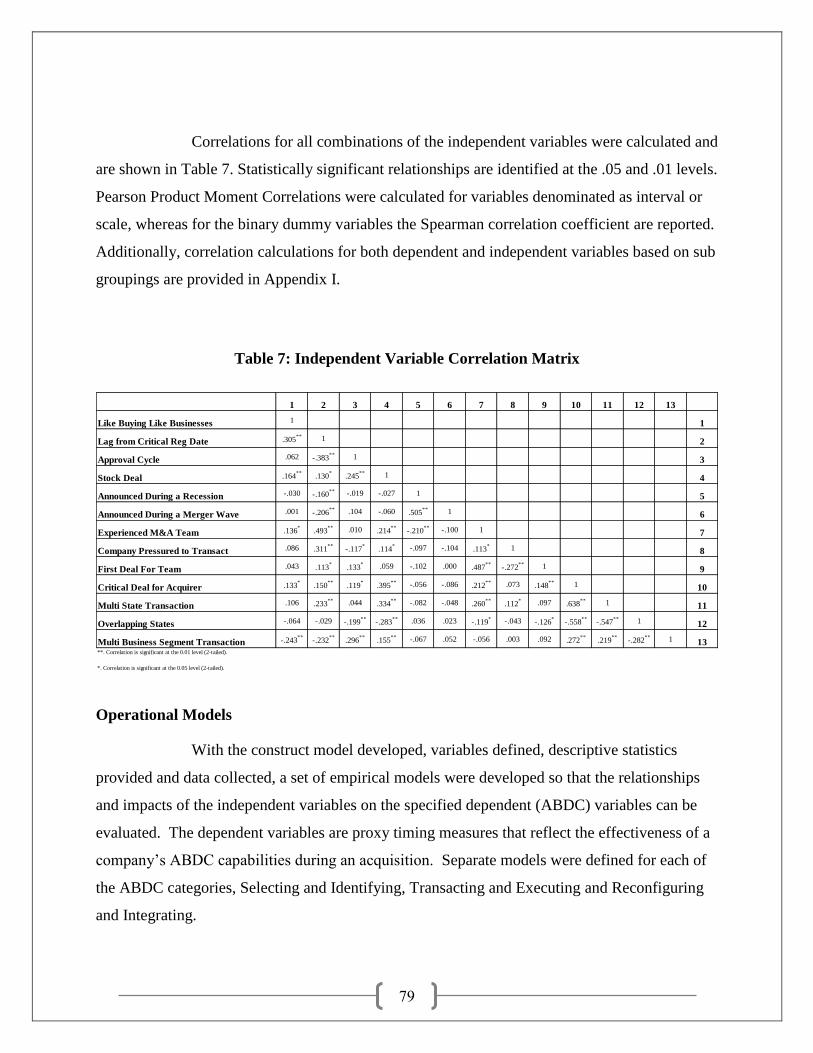
79
Correlations for all combinations of the independent variables were calculated and
are shown in Table 7. Statistically significant relationships are identified at the .05 and .01 levels.
Pearson Product Moment Correlations were calculated for variables denominated as interval or
scale, whereas for the binary dummy variables the Spearman correlation coefficient are reported.
Additionally, correlation calculations for both dependent and independent variables based on sub
groupings are provided in Appendix I.
Table 7: Independent Variable Correlation Matrix
Operational Models
With the construct model developed, variables defined, descriptive statistics
provided and data collected, a set of empirical models were developed so that the relationships
and impacts of the independent variables on the specified dependent (ABDC) variables can be
evaluated. The dependent variables are proxy timing measures that reflect the effectiveness of a
company‟s ABDC capabilities during an acquisition. Separate models were defined for each of
the ABDC categories, Selecting and Identifying, Transacting and Executing and Reconfiguring
and Integrating.
1 2 3 4 5 6 7 8 9 10 11 12 13
Like Buying Like Businesses 1 1
Lag from Critical Reg Date .305** 1 2
Approval Cycle .062 -.383** 1 3
Stock Deal .164**
.130*
.245** 1 4
Announced During a Recession -.030 -.160** -.019 -.027 1 5
Announced During a Merger Wave .001 -.206** .104 -.060 .505
** 1 6
Experienced M&A Team .136*
.493** .010 .214
**-.210
** -.100 1 7
Company Pressured to Transact .086 .311**
-.117*
.114* -.097 -.104 .113
* 1 8
First Deal For Team .043 .113*
.133* .059 -.102 .000 .487
**-.272
** 1 9
Critical Deal for Acquirer .133*
.150**
.119*
.395** -.056 -.086 .212
** .073 .148** 1 10
Multi State Transaction .106 .233** .044 .334
** -.082 -.048 .260**
.112* .097 .638
** 1 11
Overlapping States -.064 -.029 -.199**
-.283** .036 .023 -.119
* -.043 -.126*
-.558**
-.547** 1 12
Multi Business Segment Transaction -.243**
-.232**
.296**
.155** -.067 .052 -.056 .003 .092 .272
**.219
**-.282
** 1 13**. Correlation is significant at the 0.01 level (2-tailed).
*. Correlation is significant at the 0.05 level (2-tailed).

80
Selecting and Identifying
2 models were developed to test for relationships and impacts of the independent
variables on the ABDC category of Selecting and Identifying. A semi-strong model (Model 1)
with a specification of S&I as the abnormal returns obtained over a -3, +3 day time horizon from
the announcement date. And a relatively weak model (Model 2) with a specification of the
dependent variable S&I as the simple returns obtained over a -3, +3 day time horizon from the
announcement date.
Figure 5: Model 1: Selecting and Identifying Abnormal Returns
SI_CAR_AN_3DAY = ( ) ( ) ( )
( ) ( ) ( ) ( )
( ) ( ) ( ) ( )
( )
Figure 6: Model 2: Selecting and Identifying Simple Returns
SI_SIM_AN_3DAY = ( ) ( ) ( )
( ) ( ) ( ) ( )
( ) ( ) ( ) ( )
( )

81
Transacting and Executing
2 models were developed to test for the relationships and impacts of the
independent variables on the ABDC category of Transacting and Executing. A semi-strong
model (Model 3) with a specification of T&E as the abnormal returns obtained over a -30, +30
day time horizon from the transaction close date. And a relatively weak model (Model 4) with a
specification of the dependent variable T&E as the simple returns obtained over a -30, +30 day
time horizon from the transaction close date.
Figure 7: Model 3: Transacting and Executing Abnormal Returns
TE_CAR_Clsd_30DAY = ( ) ( ) ( )
( ) ( ) ( ) ( )
( ) ( ) ( ) ( )
( )
Figure 8: Model 4: Transacting and Executing Simple Returns
TE_SIM_Clsd_30DAY = ( ) ( ) ( )
( ) ( ) ( ) ( )
( ) ( ) ( ) ( )
( )

82
Reconfiguring and Integrating
3 models are developed to test for the relationships and impacts of the
independent variables on the ABDC category of Reconfiguring and Integrating. 2 semi-strong
models (Model 5) with a specification of R&I as the buy and hold abnormal returns obtained
over a 0, +360 day time horizon from the transaction close date. (Model 6) with a specification
of R&I as the cumulative abnormal returns obtained over a 0, +360 day time horizon from the
transaction close date and a relatively weak model (Model 7) with a specification of the
dependent variable R&I as the simple returns obtained over a 0, +360 day time horizon from the
transaction close date.
Figure 9: Model 5: Reconfiguring and Integrating Buy and Hold Returns
RI_BHAR_Clsd_360DAY= ( ) ( ) ( )
( ) ( ) ( ) ( )
( ) ( ) ( ) ( )
( )
Figure 10: Model 6: Reconfiguring and Integrating Abnormal Returns
RI_CAR_Clsd_360DAY= ( ) ( ) ( )
( ) ( ) ( ) ( )
( ) ( ) ( ) ( )
( )
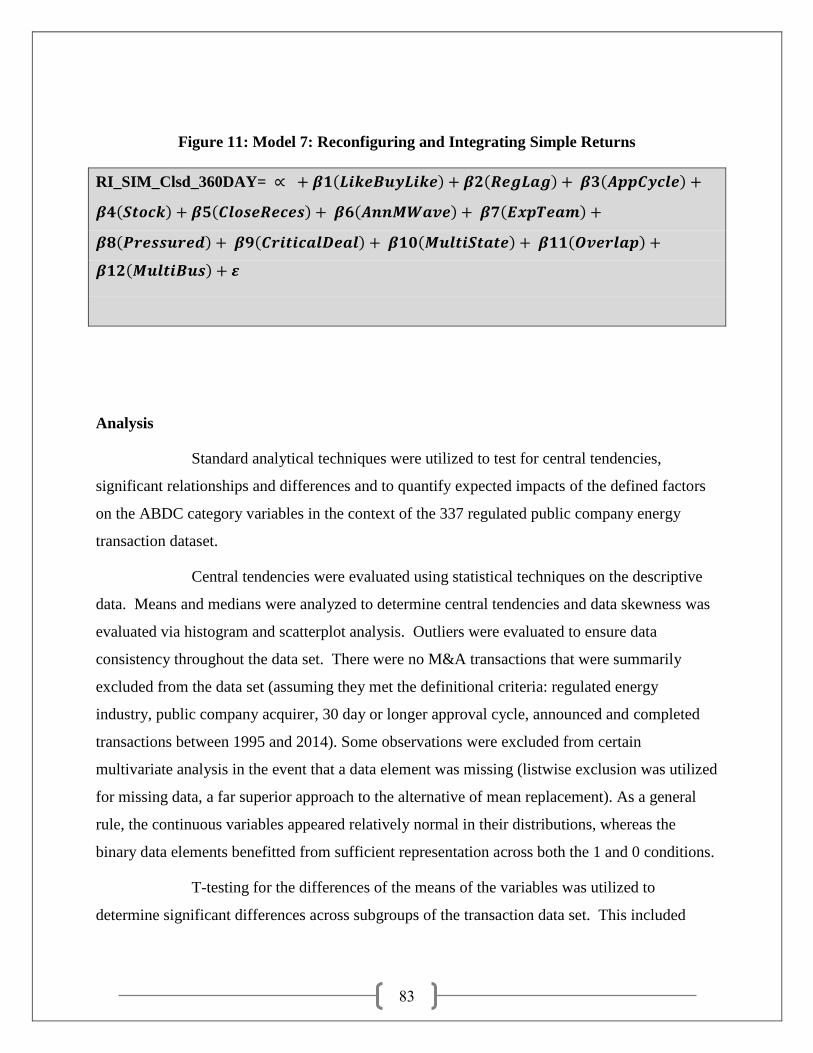
83
Figure 11: Model 7: Reconfiguring and Integrating Simple Returns
RI_SIM_Clsd_360DAY= ( ) ( ) ( )
( ) ( ) ( ) ( )
( ) ( ) ( ) ( )
( )
Analysis
Standard analytical techniques were utilized to test for central tendencies,
significant relationships and differences and to quantify expected impacts of the defined factors
on the ABDC category variables in the context of the 337 regulated public company energy
transaction dataset.
Central tendencies were evaluated using statistical techniques on the descriptive
data. Means and medians were analyzed to determine central tendencies and data skewness was
evaluated via histogram and scatterplot analysis. Outliers were evaluated to ensure data
consistency throughout the data set. There were no M&A transactions that were summarily
excluded from the data set (assuming they met the definitional criteria: regulated energy
industry, public company acquirer, 30 day or longer approval cycle, announced and completed
transactions between 1995 and 2014). Some observations were excluded from certain
multivariate analysis in the event that a data element was missing (listwise exclusion was utilized
for missing data, a far superior approach to the alternative of mean replacement). As a general
rule, the continuous variables appeared relatively normal in their distributions, whereas the
binary data elements benefitted from sufficient representation across both the 1 and 0 conditions.
T-testing for the differences of the means of the variables was utilized to
determine significant differences across subgroups of the transaction data set. This included

84
analysis comparing Leaders versus Laggards, across industry segment (Resources, Utility,
Midstream &Transportation and Electric Power) and analysis of the factors differentiating Top
Performers (for each ABDC category) with Poor Performers (for each ABDC category).
Significance was evaluated at the .10, .05 and .01 levels. Results are provided in the Results
section below.
Correlation analysis was used to evaluate the strength and the direction of the
linear relationships between the variables. Pearson Moment Correlation Coefficients (r) were
calculated for the continuous variables in the study, whereas Spearman (rho) was calculated for
the binary dummy variables. Significance at the .10, .05 and .01 levels is presented in the
various tables to illustrate levels of significance. For detailed analysis, independent and
dependent variable correlation coefficients are presented and the data set is divided into various
subsets (industry segment, Leaders and Laggards and Top and Poor Performers). As mentioned
above the data was reviewed for outliers. The data was also analyzed for linearity which is an
assumption for meaningful correlation analysis. Results are provided in the results section below
and in Appendix I.
The seven specified models (Models 1 through Models 7) were run through
ordinary least squares (OLS) multivariate regression to determine the variation in the dependent
variables that are explained by the predictor variables and to also evaluate what factors have a
statistically significant relationship and its impact on the dependent variables. Results were
evaluated across industry groups and comparisons across Leaders and Laggards. After careful
review of the data and preliminary results it was determined best to disaggregate the data set and
perform much of the analysis by industry segment (Resources, Utility, Midstream &
Transportation and Electric Power). Additionally, results for both the data sub sets (by
grouping) and aggregated data set are provided in the Results and Appendix I sections below.
The Models overall adequacy was evaluated utilizing the F statistic and its
associated p factor. R square and adjusted R square metrics were reviewed to determine how
much of the variation in the dependent variable was explained by the predictor variables. Each
model was also evaluated for power and the implied factor effects of its results. The residuals of

85
the models were evaluated to ensure for normality and to also evaluate for heteroscedasticity.
Similarly, Variable Inflation Factors (VIFs) were analyzed to check for any problematic levels of
multicollinearity of the independent variables. Additionally, individual independent variable
analysis was conducted for significance and impact by evaluating beta coefficients, t-scores and
p-values. The results are provided in the Results section of this paper and in Appendix II.
As one of the main thrusts of the study is an evaluation of performance
differences and impacts of key factors at the relative extremes (extreme high return and extreme
low return) of the observed performance results, the approaches defined above (central tendency
analysis, correlation and OLS regression) needed to be augmented with techniques better
equipped to deal with the properties of the tail portions of the dataset. Quantile regression
analysis as described by (among others) Hao and Naiman (Hao and Naiman, 2007) and Koenker
(Koenker and Basset, 1978, Koenker and Bilas, 2001, and Koenker and Hallock, 2000, 2001)
appears to be a very suitable approach.
As such, the seven specified models were also run through quantile regression
analysis to determine the impact of the individual predictor variables at various levels (quantiles)
of the dependent variables. Statistical significance and overall factor impact of the predictor
variables were evaluated at the each specified quantiles (.10, .25, .50, .75, .90) of the dependent
variable. Results were evaluated across industry groups and across the data set as a whole.
Additionally, individual independent variable analysis was conducted for significance and
impact by evaluating beta coefficients, t-scores and p-values. The results are provided in the
Results section of this paper and in Appendix III.
The results were then compared to determine common themes across the data set
and to help provide insight into the topic of where value is created and lost across the ABDC
categories and whether certain factors are significantly contributing to the value enhancement (or
destruction) during each ABDC phase of a regulated energy acquisition. This analysis provides
the necessary insight to properly address the research question:
“What Acquisition Based Dynamic Capabilities (ABDC) are the most
critical in enhancing value for energy companies engaged in M&A”.

86
Following the Results section below is a Discussion of the results. Some of the
questions that are evaluated in the Discussion section include:
In which ABDC category is the most value enhancement occurring?
In which ABDC category is the most value destruction occurring?
Are there significant differences among the Leaders and Laggards in creating
value across the three ABDC categories?
What are the deal characteristics of firms that are the Top acquirers and how do
those attributes impact value creation across the deal lifecycle?
What are the deal characteristics of firms that are the Poor acquirers and how do
those attributes impact value destruction across the deal lifecycle?

87
CHAPTER V - RESULTS
The results below provide some insights on the topic of value creation and ABDC capabilities in
the context of regulated energy M&A transactions. This section provides summarized results
and empirical findings for each ABDC category.
Summarized Results
Past research has provided mixed results with respect to whether value is created
or destroyed from being an M&A acquirer. Many of the differences can be traced to either
different measurement approaches or timing differences of the measurement window. The
results below are consistent with previous analyses in that at times value is created by some and
at other times value is destroyed. This statement by itself is neither controversial nor overly
enlightening but it does suggest the need for a deeper review of the issue of timing and
measurement as it relates to each ABDC capability and its relative impact on value creation.
Overall, companies on average do see some small value enhancement from
announcement returns as a result of their performance in Selecting and Identifying. These results
suggest on average about 0-1% value enhancement for the acquirer when a transaction is
announced. Of the 337 transactions studied, 184 (56.4%) had positive announcement returns
when measured on a 3 day abnormal basis. On average Utility and Midstream and
Transportation transactions had better announcement returns than Resource and Electric
company transactions, whereas, the better acquirers gain averaged 2.2%, the poorer acquirers
experienced value destruction of -1.5% during S&I.
Furthermore, companies on average experience additional value enhancement at
the closing of their transactions (measured on a 30 day post-close timing window) during the
Transacting and Executing phase of the deal. These results suggest on average about 0.3% value
enhancement for the acquirer after the closing of the transaction. Of the 337 transactions

88
studied, 176 (52.2%) had positive post-closing short-term returns as measured on a 30 day
abnormal basis. On average Resources and Utility transactions had better short-term post-close
transaction results than Midstream and Transportation and Electric company transactions. The
spreads between the Top acquirers and Poor acquirers also widened. The gains of the better
acquirers averaged 5.1% short-term post-close, whereas the poorer acquirers experienced value
destruction of -3.6%.
Figure 12: Returns By Transaction Stage – All Transactions

89
Despite the value enhancement experienced by a majority of firms between deal
announcement and short-term post-close, a large majority of firms give back those gains (and
often times much more value) over the first year post-close during Reconfiguring and
Integrating. The median value loss over the first 360 days post-close for the 337 studied
transactions is -7.4% as only 99 of the 337 (29.4%) deals had positive returns during the
Reconfiguring and Integrating phase of the transaction.
Results on average were poor across all of the industry segments ranging from a
high of -4.9% from the Utility deals to a low of -9.8% for the Midstream and Transportation
transactions. Each industry group experienced value destruction in approximately 65-70% of the
transactions in their energy segment during R&I. Even companies that are considered as being
strong at R&I activities averaged a mere 3.3% gain, whereas the companies who exhibited poor
R&I performance had value loss of over 20% during the first 360 days.
The trends experienced by the broader group are also experienced by the Leaders
and Laggards. On average Leaders and Laggards both experience value enhancement at
announcement and shortly after close but both also lose a fair share of value after a years‟ time
from closing their transactions. Leaders tend to be good acquirers and tend to break about even
throughout a deal lifecycle.
Interestingly, Laggards also come close to breaking out even on average but this
is perhaps a result of starting from a valuation level that had potentially more market upside
(trading at lower multiples than their peers) and perhaps the market approving of the company
and management change of direction that an M&A transactions provides. Interquartile
companies tend to break even at announcement, and start eroding value at close and by end of
the first year many have lost 6-10% as a result of their transaction. Table 8 below provides
summarized results for each ABDC category broken out by sub grouping.

90
Table 8: Return Results by ABDC Category
All Leaders Laggards Resources Utility Midstream Electric
Total Number of Deals 337 81 87 47 76 143 71
Top Quartile Returns 2.2% 2.5% 3.3% 1.7% 1.7% 2.5% 1.3%
Median Returns 0.3% 0.6% 0.7% -0.4% 0.5% 0.7% -0.2%
Mean Returns 0.5% 0.9% 1.6% 0.5% -0.1% 0.9% 0.3%
Bottom Quartile Returns -1.5% -1.3% -1.1% -2.2% -1.6% -1.0% -2.1%
# of Deals with Positive Returns 184 47 54 22 43 87 32
% of Deals with Positive Returns 54.6% 58.0% 62.1% 46.8% 56.6% 60.8% 45.1%
All Leaders Laggards Resources Utility Midstream Electric
Total Number of Deals 337 81 87 47 76 143 71
Top Quartile Returns 5.1% 5.1% 7.7% 6.0% 4.2% 5.2% 4.8%
Median Returns 0.3% 1.9% 0.9% 2.1% 0.8% 0.3% -0.6%
Mean Returns 0.3% 1.8% 1.4% -1.2% 0.6% 1.3% -1.0%
Bottom Quartile Returns -3.6% -2.2% -3.7% -3.2% -3.8% -3.1% -3.8%
# of Deals with Positive Returns 176 52 48 29 42 74 31
% of Deals with Positive Returns 52.2% 64.2% 55.2% 61.7% 55.3% 51.7% 43.7%
All Leaders Laggards Resources Utility Midstream Electric
Total Number of Deals 337 81 87 47 76 143 71
Top Quartile Returns 3.3% 2.5% 5.6% 13.8% 5.4% 0.2% 3.8%
Median Returns -7.4% -4.6% -4.9% -7.0% -4.9% -9.8% -6.0%
Mean Returns -9.2% -6.7% -8.5% -7.8% -3.3% -12.4% -10.1%
Bottom Quartile Returns -26.0% -15.9% -18.7% -18.6% -16.1% -31.1% -28.6%
# of Deals with Positive Returns 99 25 26 16 26 36 21
% of Deals with Positive Returns 29.4% 30.9% 29.9% 34.0% 34.2% 25.2% 29.6%
Measures of S&I Returns (-3,+3 Announcement CAR)
Measures of T&E Returns (-30,+30 Closed CAR)
Measures of R&I Returns (0,+360 BHAR)

91
Differences are apparent across the industry and Leader and Laggard groups in
how they approach acquisitions. These differences contribute to some of the variation that
occurs across the modeled results and the observed differences in performance across the ABDC
categories.
Table 9 below highlights the differences between the M&A approach of the
Leaders and Laggards groups‟ vis-à-vis their industry peers. Utilizing t-statistics and difference
of the means testing significant (.10 level or better) differences are noted in the table where the
null hypotheses that the means are equivalent can be rejected.

92
Table 9: Factor Differences among Leaders and Laggards
Mean STD Mean STD Mean STD
Like Buying Like Businesses 0.605 0.490 0.654 0.479 0.506 0.503 0.410Cannot Reject
Null Hypothesis0.098
Reject Null
Hypothesis0.050
Reject Null
Hypothesis
Lag from Critical Reg Date 107.035 65.575 117.620 70.352 107.827 69.715 0.218Cannot Reject
Null Hypothesis0.924
Cannot Reject
Null Hypothesis0.365
Cannot Reject
Null Hypothesis
Approval Cycle 140.365 148.114 120.259 123.428 130.391 149.912 0.206Cannot Reject
Null Hypothesis0.579
Cannot Reject
Null Hypothesis0.632
Cannot Reject
Null Hypothesis
Stock Deal 0.184 0.388 0.247 0.434 0.161 0.370 0.232Cannot Reject
Null Hypothesis0.607
Cannot Reject
Null Hypothesis0.168
Cannot Reject
Null Hypothesis
Announced During a Recession 0.080 0.272 0.062 0.242 0.092 0.291 0.549Cannot Reject
Null Hypothesis0.730
Cannot Reject
Null Hypothesis0.462
Cannot Reject
Null Hypothesis
Closed During a Recession 0.083 0.276 0.062 0.242 0.046 0.211 0.488Cannot Reject
Null Hypothesis0.172
Cannot Reject
Null Hypothesis0.655
Cannot Reject
Null Hypothesis
Announced During a Wave 0.335 0.473 0.444 0.500 0.322 0.470 0.075Reject Null
Hypothesis0.811
Cannot Reject
Null Hypothesis0.102
Cannot Reject
Null Hypothesis
Experienced M&A Team 0.383 0.487 0.432 0.498 0.253 0.437 0.422Cannot Reject
Null Hypothesis0.016
Reject Null
Hypothesis0.014
Reject Null
Hypothesis
Company Pressured to Transact 0.107 0.309 0.099 0.300 0.138 0.347 0.830Cannot Reject
Null Hypothesis0.446
Cannot Reject
Null Hypothesis0.434
Cannot Reject
Null Hypothesis
First Deal For Team 0.401 0.491 0.358 0.482 0.517 0.503 0.477Cannot Reject
Null Hypothesis0.053
Reject Null
Hypothesis0.036
Reject Null
Hypothesis
Critical Deal for Acquirer 0.427 0.495 0.506 0.503 0.425 0.497 0.204Cannot Reject
Null Hypothesis0.973
Cannot Reject
Null Hypothesis0.295
Cannot Reject
Null Hypothesis
Multi State Transaction 0.472 0.500 0.543 0.501 0.483 0.503 0.249Cannot Reject
Null Hypothesis0.855
Cannot Reject
Null Hypothesis0.436
Cannot Reject
Null Hypothesis
Overlapping States 0.570 0.496 0.605 0.492 0.494 0.503 0.564Cannot Reject
Null Hypothesis0.211
Cannot Reject
Null Hypothesis0.150
Cannot Reject
Null Hypothesis
Multi Business Segment 0.246 0.431 0.185 0.391 0.184 0.390 0.216Cannot Reject
Null Hypothesis0.193
Cannot Reject
Null Hypothesis0.983
Cannot Reject
Null Hypothesis
All vs. Leaders All vs. Laggards Leader vs Laggard
All
n=337
Leaders
n=81
Laggards
n=87
Comparisons of Means, p values noted
(null hypothesis is that means are =)

93
A significant difference is present in how Leaders and Laggards approach
acquisitions of similar business. Laggards will pursue opportunities involving businesses that
are dissimilar to themselves at a significantly lower rate than both the Leaders and companies as
a whole. Laggards will also tend to have significantly less M&A transaction experience in their
management teams than Leaders and fellow peer companies. Additionally, Laggards in this
study group are statistically more likely to be a first time acquirer than both Leaders and their
industry peers in general. Table 9 also highlights that Leaders tend to acquire during merger
waves at a statistically higher rate than their peer companies.
Table 10 highlights the differences between the M&A approach of the four
industry segments vis-à-vis their industry peers. Utilizing t-statistics and difference of the means
testing for significant (.10 level or better) differences are noted in the table where the null
hypotheses can be rejected that the means are equivalent across the various transaction factors.
A significant difference is present in how companies approach acquisitions of
similar business. Utility companies tend to pursue opportunities involving businesses that are
dissimilar to themselves at a significantly lower rate than their industry peers, whereas the
Midstream and Transportation companies and Electric companies pursue similarly focused
business at a significantly higher rate than their industry peers.
An interesting difference also exists in how quickly industry participants respond
to a regulatory shock that opens up M&A opportunities. The Utilities and Electric companies are
the quickest to act as they on average respond to an industry shock significantly quicker than
their industry peers. The opposite is the case of Transportation and Midstream companies who
tended to responds to an industry shock at a statistically slower rate than their peers.
Whereas on average 33% of the transactions occurred during a merger wave,
nearly half of the 143 Midstream and Transportation transactions occurred during a wave which
is a significantly higher rate than their industry peers. Differences are also present across
management team M&A experiences. On average Transportation and Midstream firm
management teams are significantly more experienced than their industry peers whereas the
opposite is true for Utility firm management teams which are significantly less experienced.

94
This is partly the result of the fact that the Midstream and Transportation companies are far more
likely to transact than the Utility companies.
Differences also exist across transaction complexity measures. Midstream and
Transportation acquisitions were multi-state deals more frequently than their industry peers and
they also tended to avoid multi business segment transactions. Electric companies completed
multi business segment transactions 41% of the time which was significantly higher than their
industry peers.

95
Table 10: Factor Differences among Industry Groups
Mean STD Mean STD Mean STD Mean STD Mean STD
Like Buying Like Businesses 0.605 0.490 0.654 0.479 0.303 0.462 0.762 0.427 0.845 0.364
Lag from Critical Reg Date 107.035 65.575 117.620 70.352 55.497 29.289 168.207 49.802 65.428 27.149
Approval Cycle 140.365 148.114 120.259 123.428 215.553 154.337 63.811 48.720 250.155 186.941
Stock Deal 0.184 0.388 0.247 0.434 0.158 0.367 0.203 0.404 0.254 0.438
Announced During a Recession 0.080 0.272 0.062 0.242 0.118 0.325 0.049 0.217 0.056 0.232
Closed During a Recession 0.083 0.276 0.062 0.242 0.132 0.340 0.056 0.231 0.113 0.318
Announced During a Wave 0.335 0.473 0.444 0.500 0.276 0.450 0.497 0.502 0.296 0.460
Experienced M&A Team 0.383 0.487 0.432 0.498 0.276 0.450 0.497 0.502 0.324 0.471
Company Pressured to Transact 0.107 0.309 0.099 0.300 0.092 0.291 0.119 0.325 0.169 0.377
First Deal For Team 0.401 0.491 0.358 0.482 0.434 0.499 0.329 0.471 0.479 0.503
Critical Deal for Acquirer 0.427 0.495 0.506 0.503 0.447 0.501 0.448 0.499 0.423 0.497
Multi State Transaction 0.472 0.500 0.543 0.501 0.368 0.486 0.580 0.495 0.409 0.495
Overlapping States 0.570 0.496 0.605 0.492 0.500 0.503 0.580 0.495 0.507 0.504
Multi Business Segment 0.246 0.431 0.185 0.391 0.290 0.457 0.112 0.316 0.409 0.495
Electric
n=71
All
n=337
Resource
n=47
Utility
n=76
Transport
n=143

96
Like Buying Like Businesses 0.512Cannot Reject
Null Hypothesis0.000
Reject Null
Hypothesis0.000
Reject Null
Hypothesis0.000
Reject Null
Hypothesis
Lag from Critical Reg Date 0.330Cannot Reject
Null Hypothesis0.000
Reject Null
Hypothesis0.000
Reject Null
Hypothesis0.000
Reject Null
Hypothesis
Approval Cycle 0.308Cannot Reject
Null Hypothesis0.000
Reject Null
Hypothesis0.000
Reject Null
Hypothesis0.000
Reject Null
Hypothesis
Stock Deal 0.346Cannot Reject
Null Hypothesis0.629
Cannot Reject
Null Hypothesis0.632
Cannot Reject
Null Hypothesis0.224
Cannot Reject
Null Hypothesis
Announced During a Recession 0.631Cannot Reject
Null Hypothesis0.224
Cannot Reject
Null Hypothesis0.220
Cannot Reject
Null Hypothesis0.433
Cannot Reject
Null Hypothesis
Closed During a Recession 0.577Cannot Reject
Null Hypothesis0.125
Cannot Reject
Null Hypothesis0.309
Cannot Reject
Null Hypothesis0.477
Cannot Reject
Null Hypothesis
Announced During a Wave 0.158Cannot Reject
Null Hypothesis0.348
Cannot Reject
Null Hypothesis0.001
Reject Null
Hypothesis0.510
Cannot Reject
Null Hypothesis
Experienced M&A Team 0.524Cannot Reject
Null Hypothesis0.091
Reject Null
Hypothesis0.019
Reject Null
Hypothesis0.339
Cannot Reject
Null Hypothesis
Company Pressured to Transact 0.865Cannot Reject
Null Hypothesis0.701
Cannot Reject
Null Hypothesis0.700
Cannot Reject
Null Hypothesis0.207
Cannot Reject
Null Hypothesis
First Deal For Team 0.571Cannot Reject
Null Hypothesis0.585
Cannot Reject
Null Hypothesis0.133
Cannot Reject
Null Hypothesis0.233
Cannot Reject
Null Hypothesis
Critical Deal for Acquirer 0.313Cannot Reject
Null Hypothesis0.752
Cannot Reject
Null Hypothesis0.684
Cannot Reject
Null Hypothesis0.941
Cannot Reject
Null Hypothesis
Multi State Transaction 0.360Cannot Reject
Null Hypothesis0.104
Cannot Reject
Null Hypothesis0.027
Reject Null
Hypothesis0.327
Cannot Reject
Null Hypothesis
Overlapping States 0.646Cannot Reject
Null Hypothesis0.265
Cannot Reject
Null Hypothesis0.829
Cannot Reject
Null Hypothesis0.340
Cannot Reject
Null Hypothesis
Multi Business Segment 0.322Cannot Reject
Null Hypothesis0.393
Cannot Reject
Null Hypothesis0.000
Reject Null
Hypothesis0.012
Reject Null
Hypothesis
All vs. Resources All vs.Utility All vs. Transportation All vs. Electric
Comparisons of Means, p values noted
(null hypothesis is that means are =)

97
Selecting and Identifying
Selecting and Identifying capability includes the ability to assess a firm‟s existing
resource base relative to desired new resources and capabilities, to assess the degree of market
failure with respect to resources that are beyond the firm‟s existing resource base and to assess
the number of points of contact that inter-organizational creation or new resources would require.
It also includes the capability to be able to carry out effective due diligence of potential targets in
order to determine the value of the target to the acquirer, to negotiate appropriate terms with the
target‟s owner, and to walk away from a target if it lacks needed resources or its owners demand
a price that exceeds the value to the acquirer. Firms that can efficiently perform these tasks and
have resources with well-developed capabilities can be positioned to create substantial
competitive advantage.
As a proxy to measure the effectiveness of a firm‟s S&I capabilities, short-term
value measurements are most appropriate. Additionally, the market‟s response to the
effectiveness of these capabilities is best evidenced by how it responds when it is informed of
what the acquirer intends to do. The announcement of the intentions and the market‟s response
to how well the company has identified and selected a target becomes apparent at the
announcement date of the transaction. Utilizing value measures straddling the announcement
date of the transaction is an appropriate gauge of the market‟s judgment of a company‟s S&I
capabilities. Furthermore, as the market tends to be somewhat efficient, the window of time
necessary to measure its response should be relatively short.
Table 11 provides factor differences among Top S&I Performers (those with top
quartile performance in S&I) and Poor S&I Performers (those with bottom quartile performance
in S&I). Significant results are noted (.10 level or better) where means are statistically different.
Some interesting results are noteworthy. Top Performers tend to have statistically shorter deal
approval cycles and less experienced M&A teams than their peers. Whereas Poor Performers
tended to have statistically longer approval cycles and more complex transactions including
significantly more multi-state transactions, with fewer states overlapping existing business as
well as more multi business transactions than their industry peers or Top Performers.

98
Table 11: Factor Differences among Top and Poor Performers – S&I
Mean STD Mean STD Mean STD
Like Buying Like Businesses 0.605 0.490 0.655 0.478 0.663 0.476 0.403Cannot Reject
Null Hypothesis0.330
Cannot Reject
Null Hypothesis0.916
Cannot Reject
Null Hypothesis
Lag from Critical Reg Date 107.035 65.575 114.330 70.936 99.795 65.537 0.397Cannot Reject
Null Hypothesis0.370
Cannot Reject
Null Hypothesis0.173
Cannot Reject
Null Hypothesis
Approval Cycle 140.365 148.114 109.238 123.307 160.892 160.338 0.049Reject Null
Hypothesis0.291
Cannot Reject
Null Hypothesis0.021
Reject Null
Hypothesis
Stock Deal 0.184 0.388 0.167 0.375 0.229 0.423 0.710Cannot Reject
Null Hypothesis0.381
Cannot Reject
Null Hypothesis0.319
Cannot Reject
Null Hypothesis
Announced During a Recession 0.080 0.272 0.071 0.259 0.133 0.341 0.787Cannot Reject
Null Hypothesis0.195
Cannot Reject
Null Hypothesis0.196
Cannot Reject
Null Hypothesis
Closed During a Recession 0.083 0.276 0.048 0.214 0.169 0.377 0.206Cannot Reject
Null Hypothesis0.053
Reject Null
Hypothesis0.011
Reject Null
Hypothesis
Announced During a Wave 0.335 0.473 0.357 0.482 0.325 0.471 0.712Cannot Reject
Null Hypothesis0.863
Cannot Reject
Null Hypothesis0.669
Cannot Reject
Null Hypothesis
Experienced M&A Team 0.383 0.487 0.286 0.454 0.337 0.476 0.087Reject Null
Hypothesis0.439
Cannot Reject
Null Hypothesis0.478
Cannot Reject
Null Hypothesis
Company Pressured to Transact 0.107 0.309 0.119 0.326 0.133 0.341 0.759Cannot Reject
Null Hypothesis0.533
Cannot Reject
Null Hypothesis0.796
Cannot Reject
Null Hypothesis
First Deal For Team 0.401 0.491 0.488 0.503 0.398 0.492 0.156Cannot Reject
Null Hypothesis0.961
Cannot Reject
Null Hypothesis0.244
Cannot Reject
Null Hypothesis
Critical Deal for Acquirer 0.427 0.495 0.464 0.502 0.530 0.502 0.548Cannot Reject
Null Hypothesis0.096
Reject Null
Hypothesis0.401
Cannot Reject
Null Hypothesis
Multi State Transaction 0.472 0.500 0.452 0.501 0.602 0.492 0.753Cannot Reject
Null Hypothesis0.032
Reject Null
Hypothesis0.053
Reject Null
Hypothesis
Overlapping States 0.570 0.496 0.524 0.502 0.458 0.501 0.457Cannot Reject
Null Hypothesis0.069
Reject Null
Hypothesis0.400
Cannot Reject
Null Hypothesis
Multi Business Segment 0.246 0.431 0.179 0.385 0.301 0.462 0.164Cannot Reject
Null Hypothesis0.328
Cannot Reject
Null Hypothesis0.065
Reject Null
Hypothesis
All vs. Top Perfomers All vs. Poor Performers Top vs. Poor Performers
All Top
Performers
n=81
Poor
Performers
Comparisons of Means - p values noted
(null hypothesis is that means are =)

99
Two specifications of the S&I variable, one a weak form and one a semi-strong form is provided
with results provided by industry segment. Model 1 is a semi-strong specification of
SI_CAR_AN_3DAY (Abnormal returns on a -3, +3 day event window, anchored off of the
announcement date) Table 12 provides the OLS regression results for Model 1. Results for each
energy industry segment are provided in the table.
Resource: 42.8% of the variation in the dependent variable (the proxy measure of
S&I) is explained by the independent variables. The model provides statistically
meaningful results as the F statistic of 4.437 is significant at the .01 level. The
independent variables: Like Buying Like Businesses, Lag From Critical Reg Date,
Stock Deal and Critical Deal for Acquirer are all significant at the .05 level or
better. Multicollinearity does not appear to negatively influence the regression
results. Of the 10 predictor variables, 7 have Variable Inflation Factors (VIFs)
below 2.2. Of the three that do not, Critical Deal (3.9), Multi State (4.4) and
Overlapping States (3.0) are all below the theoretical threshold of 5.0.
Utility: 22.4% of the variation in the dependent variable (the proxy measure of
S&I) is explained by the independent variables. The model provides statistically
meaningful results as the F statistic of 1.513 is significant at the .1 level. The
independent variables: Like Buying Like Businesses is significant at the .1 level
while the independent variable Multi-State Transaction is significant at the .01
level. Multicollinearity does not appear to negatively influence the regression
results. Of the 12 predictor variables all have Variable Inflation Factors (VIFs)
below 2.0.
Midstream and Transportation: 4.7% of the variation in the dependent variable
(the proxy measure of S&I) is explained by the independent variables. The model

100
provides insignificant results as the F statistic of 0.534 is statistically
insignificant.
Electric Power: 15.5% of the variation in the dependent variable (the proxy
measure of S&I) is explained by the independent variables. The model provides
insignificant results as the F statistic of 0.885 is statistically insignificant.

101
Table 12: Model 1 – S&I Abnormal 3 Day (-3, +3) Returns
B t (sig) B t (sig) B t (sig) B t (sig)
(Constant) 0.009 (0.314) 0.059 (2.381) *** 0.4 (1.614) 0.013 (0.362)
Like Buying Like Businesses 0.072 (3.841) *** -0.026 (-1.718) * -0.001 (-0.113) -0.011 (-0.487)
Lag from Critical Reg Date 0.001 (-2.278) ** 0.001 (-1.579) -0.001 (-0.263) 0.001 (0.709)
Approval Cycle -0.001 (-0.460) 0.001 (0.292) -0.001 (-0.687) -0.001 (-2.234) **
Stock Deal -0.141 (-4.994) *** -0.019 (-0.916) 0.022 (1.595) -0.006 (-0.296)
Announced During a Recession -0.061 (-0.903) -0.031 (-1.395) -0.017 (-0.810) -0.021 (-0.660)
Announced During a Merger Wave 0.007 (0.360) -0.006 (-0.342) -0.018 (-0.844)
Experienced M&A Team -0.001 (-0.430) 0.014 (0.857) -0.008 (-0.795) -0.006 (-0.385)
Company Pressured to Transact -0.013 (-0.475) -0.004 (-0.258) 0.024 (0.881)
Critical Deal for Acquirer 0.051 (2.211) ** -0.006 (-0.388) -0.006 (-0.417) 0.019 (0.837)
Multi State Transaction -0.033 (-1.417) -0.044 (-2.449) *** -0.011 (-0.742) 0.013 (0.580)
Overlapping States 0.021 (0.967) -0.024 (-1.477) -0.009 (-0.818) 0.012 (0.542)
Multi Business Segment Transaction 0.01 (0.586) -0.001 (-0.012) -0.002 (-0.115) -0.001 (-0.021)
Number of Observations (n)
R-Square
F *** *
Group 1:
Resource Based
Group 2:
Utility
Group 3:
Midstream and
Transportation
Group 4:
Electric Power
46 75 142 70
t statistics in parenthesis, *Indicates significance at .1, **Indicates significance at .05, ***Indicates significance at .01
0.428 0.224 0.047 0.155
4.437 1.513 0.534 0.885

102
Table 13 provides the Quantile regression results for Model 1. Model 1 is a semi-strong form
SI_CAR_AN_3DAY (Abnormal returns on a -3, +3 day event window anchored off of the
announcement date). Results for each energy industry segment are provided in the table.
Resource: 42.8% of the variation in the dependent variable (the proxy measure of
S&I) is explained by the independent variables in the OLS regression results.
Furthermore, the model provides statistically meaningful results as the F statistic
of 4.437 is significant at the .01 level. Results across the quantiles also suggest
statistically significant relationships among the predictor variables and short term
returns evaluated at various quantiles. Of interest is the negative relationship to
announcement returns for transactions funded by stock where announcement
returns are a negative 7 to 16% for Resource based transactions funded primarily
with stock. Furthermore, transactions involving Like Businesses experienced a 2-
10% increase in short term returns across the quantiles. Additionally, the
predictor variables; Lag from Critical Reg Date and Critical Deal for Acquirer
were both statistically significant in the OLS regression but have generally
insignificant results in the quantile regression analysis of S&I returns for
transactions involving Resource companies.
Utility: 22.4% of the variation in the dependent variable (the proxy measure of
S&I) is explained by the independent variables in the OLS regression results. The
OLS results provide statistically meaningful results as the F statistic of 1.513 is
significant at the .1 level. Results across the quantiles also suggest statistically
significant relationships among the predictor variables and short term returns
evaluated at various quantiles. Of interest is the significant relationship to
announcement returns for transactions that were announced during a recession.
Short term announcement returns are significantly worse off for the lower
quantile acquirers than for the higher quantile performers when their transactions

103
were consummated during a recession. Additionally, the predictor variables; Like
Buying Like Businesses and Multi-State Transaction were both statistically
significant in the OLS regression results but had generally insignificant results in
the quantile regression analysis of S&I returns for transactions involving Utility
companies.
Midstream and Transportation: 4.7% of the variation in the dependent variable
(the proxy measure of S&I) is explained by the independent variables in the OLS
regression results. The OLS regression model provides insignificant results as the
F statistic of 0.534 is statistically insignificant. Furthermore, the quantile
regression results are also inconclusive.
Electric Power: 15.5% of the variation in the dependent variable (the proxy
measure of S&I) is explained by the independent variables in the OLS regression
results. The OLS regression model provides insignificant results as the F statistic
of 0.885 is statistically insignificant. Furthermore, the quantile regression results
are also inconclusive.

104
Table 13: Model 1 Quantile Regression – S&I Abnormal 3 Day (-3, +3) Returns
Resource Based
B SE t p B SE t p B SE t p B SE t p B SE t p
(Constant) -0.010 0.007 -1.327 0.193 -0.002 0.026 -0.069 0.946 -0.005 0.019 -0.251 0.803 0.031 0.017 1.824 0.076 0.034 0.016 2.097 0.043
Like Buying Like Businesses 0.036 0.007 5.480 0.000 0.023 0.023 0.983 0.332 0.063 0.017 3.770 0.001 0.101 0.015 6.525 0.000 0.096 0.014 6.683 0.000
Lag from Critical Reg Date 0.000 0.000 -4.863 0.000 0.000 0.000 -0.791 0.434 0.000 0.000 -0.878 0.386 0.000 0.000 -2.734 0.010 0.000 0.000 -3.037 0.004
Approval Cycle 0.000 0.000 0.377 0.708 0.000 0.000 -0.138 0.891 0.000 0.000 0.480 0.634 0.000 0.000 -0.359 0.722 0.000 0.000 0.912 0.368
Stock Deal -0.071 0.010 -7.037 0.000 -0.079 0.035 -2.222 0.033 -0.099 0.025 -3.919 0.000 -0.146 0.023 -6.260 0.000 -0.163 0.022 -7.467 0.000
Announced During a Recession 0.000 0.006 0.053 0.958 -0.001 0.023 -0.036 0.971 0.013 0.016 0.816 0.420 0.025 0.015 1.670 0.104 0.024 0.014 1.693 0.099
Experienced M&A Team 0.015 0.005 3.235 0.003 0.003 0.017 0.179 0.859 -0.011 0.012 -0.966 0.340 -0.022 0.011 -1.995 0.054 -0.025 0.010 -2.458 0.019
Critical Deal for Acquirer -0.007 0.008 -0.917 0.365 -0.001 0.029 -0.022 0.982 0.020 0.020 0.996 0.326 0.034 0.019 1.779 0.084 0.060 0.018 3.387 0.002
Multi State Transaction -0.002 0.008 -0.293 0.771 -0.002 0.029 -0.063 0.950 -0.057 0.021 -2.705 0.010 -0.069 0.019 -3.527 0.001 0.013 0.018 0.700 0.488
Overlapping States -0.015 0.008 -1.987 0.055 0.009 0.027 0.313 0.756 0.025 0.020 1.279 0.209 0.015 0.018 0.843 0.405 -0.070 0.017 -4.174 0.000
Multi Business Segment Transaction 0.010 0.006 1.653 0.107 -0.013 0.021 -0.624 0.537 0.023 0.015 1.562 0.127 0.024 0.014 1.766 0.086 0.027 0.013 2.122 0.041
Utility
B SE t p B SE t p B SE t p B SE t p B SE t p
(Constant) 0.013 0.019 0.687 0.495 0.022 0.014 1.635 0.107 0.029 0.013 2.182 0.033 0.018 0.016 1.110 0.271 0.020 0.018 1.103 0.274
Like Buying Like Businesses -0.038 0.009 -4.295 0.000 -0.029 0.007 -4.382 0.000 -0.027 0.006 -4.228 0.000 0.005 0.008 0.655 0.515 -0.003 0.009 -0.353 0.725
Lag from Critical Reg Date 0.000 0.000 1.095 0.277 0.000 0.000 -0.187 0.852 0.000 0.000 -1.413 0.163 0.000 0.000 -0.821 0.415 0.000 0.000 -1.427 0.158
Approval Cycle 0.000 0.000 -0.688 0.494 0.000 0.000 -0.737 0.464 0.000 0.000 -0.648 0.519 0.000 0.000 0.242 0.810 0.000 0.000 0.881 0.382
Stock Deal -0.062 0.012 -5.258 0.000 -0.009 0.009 -1.055 0.295 -0.023 0.009 -2.731 0.008 -0.029 0.010 -2.803 0.007 -0.018 0.012 -1.558 0.124
Announced During a Recession -0.229 0.013 -17.899 0.000 -0.019 0.009 -1.979 0.052 -0.022 0.009 -2.376 0.021 0.058 0.011 5.116 0.000 0.044 0.013 3.535 0.001
Announced During a Merger Wave -0.039 0.012 -3.404 0.001 -0.013 0.009 -1.542 0.128 -0.019 0.008 -2.245 0.028 -0.017 0.010 -1.705 0.093 -0.016 0.011 -1.366 0.177
Experienced M&A Team 0.005 0.009 0.491 0.625 0.004 0.007 0.533 0.596 0.002 0.007 0.265 0.792 -0.009 0.008 -1.129 0.263 -0.009 0.009 -0.961 0.340
Company Pressured to Transact 0.021 0.016 1.317 0.193 0.012 0.012 1.046 0.300 0.026 0.012 2.237 0.029 0.026 0.014 1.820 0.073 0.040 0.016 2.553 0.013
Critical Deal for Acquirer -0.043 0.010 -4.414 0.000 0.003 0.007 0.413 0.681 0.008 0.007 1.151 0.254 0.008 0.009 0.927 0.357 0.017 0.010 1.779 0.080
Multi State Transaction 0.009 0.010 0.887 0.378 -0.044 0.008 -5.840 0.000 -0.018 0.007 -2.370 0.021 -0.006 0.009 -0.704 0.484 -0.024 0.010 -2.354 0.022
Overlapping States -0.020 0.009 -2.171 0.034 -0.020 0.007 -2.870 0.006 -0.014 0.007 -2.055 0.044 -0.006 0.008 -0.721 0.474 -0.012 0.009 -1.299 0.199
Multi Business Segment Transaction 0.001 0.010 0.142 0.888 0.000 0.007 0.050 0.960 -0.013 0.007 -1.844 0.070 0.009 0.008 1.087 0.281 0.022 0.009 2.360 0.021
Quantile:
.10
Quantile:
.25
Quantile:
.50
Quantile:
.75
Quantile:
.90
Quantile:
.10
Quantile:
.25
Quantile:
.50
Quantile:
.75
Quantile:
.90

105
Midstream and Transportation
B SE t p B SE t p B SE t p B SE t p B SE t p
(Constant) -0.052 0.014 -3.595 0.000 0.009 0.021 0.454 0.650 0.022 0.018 1.194 0.235 0.044 0.023 1.932 0.056 0.044 0.023 1.932 0.056
Like Buying Like Businesses 0.023 0.007 3.272 0.001 0.002 0.010 0.212 0.833 0.004 0.009 0.405 0.686 0.000 0.011 0.039 0.969 0.000 0.011 0.039 0.969
Lag from Critical Reg Date 0.000 0.000 1.859 0.065 0.000 0.000 -0.446 0.656 0.000 0.000 -0.329 0.742 0.000 0.000 -0.399 0.690 0.000 0.000 -0.399 0.690
Approval Cycle 0.000 0.000 1.702 0.091 0.000 0.000 0.950 0.344 0.000 0.000 0.516 0.607 0.000 0.000 -0.153 0.878 0.000 0.000 -0.153 0.878
Stock Deal 0.002 0.008 0.293 0.770 0.004 0.012 0.299 0.765 0.008 0.010 0.796 0.427 0.011 0.013 0.851 0.396 0.011 0.013 0.851 0.396
Announced During a Recession -0.122 0.013 -9.727 0.000 -0.057 0.018 -3.175 0.002 -0.027 0.016 -1.719 0.088 0.013 0.020 0.641 0.523 0.013 0.020 0.641 0.523
Announced During a Merger Wave -0.029 0.010 -2.897 0.004 -0.012 0.014 -0.846 0.399 -0.006 0.013 -0.508 0.612 0.005 0.016 0.321 0.749 0.005 0.016 0.321 0.749
Experienced M&A Team -0.004 0.006 -0.692 0.490 -0.009 0.009 -1.031 0.304 -0.007 0.008 -0.939 0.349 -0.014 0.010 -1.388 0.168 -0.014 0.010 -1.388 0.168
Company Pressured to Transact -0.007 0.010 -0.739 0.461 0.013 0.015 0.866 0.388 0.003 0.013 0.207 0.836 -0.006 0.016 -0.363 0.717 -0.006 0.016 -0.363 0.717
Critical Deal for Acquirer -0.010 0.008 -1.271 0.206 -0.004 0.011 -0.365 0.716 -0.003 0.010 -0.297 0.767 0.005 0.012 0.397 0.692 0.005 0.012 0.397 0.692
Multi State Transaction 0.006 0.008 0.793 0.429 0.005 0.011 0.399 0.690 -0.006 0.010 -0.562 0.575 -0.016 0.013 -1.313 0.192 -0.016 0.013 -1.313 0.192
Overlapping States 0.003 0.006 0.470 0.639 -0.012 0.009 -1.310 0.193 0.003 0.008 0.434 0.665 0.005 0.010 0.467 0.641 0.005 0.010 0.467 0.641
Multi Business Segment Transaction -0.027 0.009 -2.897 0.004 -0.011 0.013 -0.816 0.416 -0.010 0.012 -0.809 0.420 -0.002 0.015 -0.156 0.876 -0.002 0.015 -0.156 0.876
Electric Power
B SE t p B SE t p B SE t p B SE t p B SE t p
(Constant) -0.037 0.020 -1.839 0.071 -0.020 0.027 -0.739 0.463 -0.014 0.022 -0.629 0.532 0.020 0.026 0.739 0.463 0.118 0.037 3.216 0.002
Like Buying Like Businesses 0.008 0.012 0.702 0.486 0.009 0.016 0.604 0.548 0.007 0.013 0.560 0.578 -0.023 0.015 -1.491 0.141 0.030 0.021 1.416 0.162
Lag from Critical Reg Date 0.000 0.000 0.022 0.982 0.000 0.000 -0.330 0.742 0.000 0.000 0.228 0.820 0.000 0.000 0.192 0.849 0.000 0.000 1.193 0.238
Approval Cycle 0.000 0.000 -1.902 0.062 0.000 0.000 0.167 0.868 0.000 0.000 0.126 0.900 0.000 0.000 -2.111 0.039 0.000 0.000 -4.109 0.000
Stock Deal 0.005 0.011 0.447 0.656 -0.015 0.014 -1.048 0.299 -0.003 0.012 -0.231 0.818 -0.006 0.014 -0.406 0.686 -0.046 0.020 -2.308 0.025
Announced During a Recession -0.013 0.018 -0.733 0.466 -0.018 0.024 -0.750 0.456 -0.006 0.020 -0.284 0.777 -0.001 0.024 -0.045 0.964 -0.021 0.033 -0.643 0.522
Announced During a Merger Wave -0.034 0.012 -2.841 0.006 -0.004 0.016 -0.221 0.826 0.003 0.013 0.262 0.794 -0.016 0.016 -1.000 0.321 -0.047 0.022 -2.104 0.040
Experienced M&A Team 0.018 0.009 1.919 0.060 0.012 0.012 0.970 0.336 0.007 0.010 0.645 0.521 0.000 0.012 0.036 0.971 -0.016 0.017 -0.933 0.355
Company Pressured to Transact 0.039 0.016 2.515 0.015 -0.011 0.021 -0.540 0.591 0.008 0.017 0.465 0.644 0.015 0.021 0.709 0.481 0.022 0.029 0.771 0.444
Critical Deal for Acquirer 0.002 0.013 0.197 0.845 0.002 0.017 0.142 0.887 0.009 0.014 0.612 0.543 0.016 0.017 0.939 0.351 0.051 0.023 2.195 0.032
Multi State Transaction -0.008 0.013 -0.628 0.533 -0.006 0.017 -0.356 0.723 -0.012 0.014 -0.878 0.384 0.013 0.017 0.766 0.447 0.043 0.023 1.840 0.071
Overlapping States -0.010 0.013 -0.759 0.451 -0.014 0.017 -0.840 0.404 -0.008 0.014 -0.617 0.539 0.006 0.017 0.363 0.718 -0.057 0.023 -2.499 0.015
Multi Business Segment Transaction 0.020 0.011 1.780 0.080 0.017 0.015 1.091 0.280 0.011 0.013 0.849 0.400 0.014 0.015 0.946 0.348 -0.033 0.021 -1.592 0.117
Quantile:
.10
Quantile:
.25
Quantile:
.50
Quantile:
.75
Quantile:
.90
Quantile:
.10
Quantile:
.25
Quantile:
.50
Quantile:
.75
Quantile:
.90
106
Model 2 is a weak form SI_SIM_AN_3DAY (Simple returns on a -3, +3 day event window
anchored off of the announcement date) Table 14 provides the OLS regression results for Model
2. Results for each energy industry segment are provided in the table.
Resource: 57.2% of the variation in the dependent variable (the proxy measure of
S&I) is explained by the independent variables. The model provides statistically
meaningful results as the F statistic of 4.811 is significant at the .01 level. The
independent variables: Like Buying Like Businesses and Stock Deal are both
significant at the .01 level, whereas the variables, Lag From Critical Reg Date and
Critical Deal for Acquirer are statistically significant at the .1 level.
Multicollinearity does not appear to negatively influence the regression results.
Of the 10 predictor variables, 7 have Variable Inflation Factors (VIFs) below 2.2.
Of the three that do not, Critical Deal (3.9), Multi State (4.4) and Overlapping
States (3.0) are all below the theoretical threshold of 5.0.
Utility: 25.8% of the variation in the dependent variable (the proxy measure of
S&I) is explained by the independent variables. The model provides statistically
meaningful results as the F statistic of 1.826 is significant at the .1 level. The
independent variables: Lag from Critical Reg Date, Announced During a
Recession and Multi-State transaction are statistically significant at the .05 level.
Multicollinearity does not appear to negatively influence the regression results.
Of the 12 predictor variables all have Variable Inflation Factors (VIFs) below 2.0.
Midstream and Transportation: 5.6% of the variation in the dependent variable
(the proxy measure of S&I) is explained by the independent variables. The model
provides statistically insignificant results as the F statistic of 0.644 is statistically
insignificant.

107
Electric Power: 16.5% of the variation in the dependent variable (the proxy
measure of S&I) is explained by the independent variables. The model provides
statistically insignificant results as the F statistic of 0.952 is statistically
insignificant.
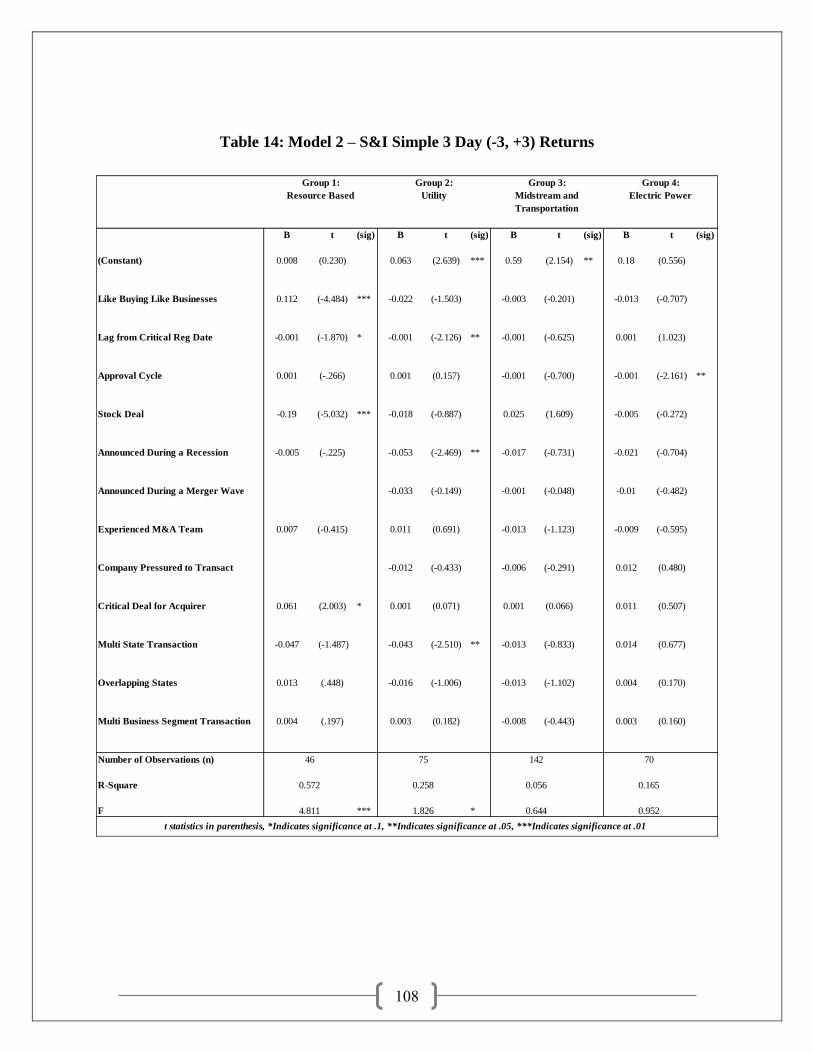
108
Table 14: Model 2 – S&I Simple 3 Day (-3, +3) Returns
B t (sig) B t (sig) B t (sig) B t (sig)
(Constant) 0.008 (0.230) 0.063 (2.639) *** 0.59 (2.154) ** 0.18 (0.556)
Like Buying Like Businesses 0.112 (-4.484) *** -0.022 (-1.503) -0.003 (-0.201) -0.013 (-0.707)
Lag from Critical Reg Date -0.001 (-1.870) * -0.001 (-2.126) ** -0.001 (-0.625) 0.001 (1.023)
Approval Cycle 0.001 (-.266) 0.001 (0.157) -0.001 (-0.700) -0.001 (-2.161) **
Stock Deal -0.19 (-5.032) *** -0.018 (-0.887) 0.025 (1.609) -0.005 (-0.272)
Announced During a Recession -0.005 (-.225) -0.053 (-2.469) ** -0.017 (-0.731) -0.021 (-0.704)
Announced During a Merger Wave -0.033 (-0.149) -0.001 (-0.048) -0.01 (-0.482)
Experienced M&A Team 0.007 (-0.415) 0.011 (0.691) -0.013 (-1.123) -0.009 (-0.595)
Company Pressured to Transact -0.012 (-0.433) -0.006 (-0.291) 0.012 (0.480)
Critical Deal for Acquirer 0.061 (2.003) * 0.001 (0.071) 0.001 (0.066) 0.011 (0.507)
Multi State Transaction -0.047 (-1.487) -0.043 (-2.510) ** -0.013 (-0.833) 0.014 (0.677)
Overlapping States 0.013 (.448) -0.016 (-1.006) -0.013 (-1.102) 0.004 (0.170)
Multi Business Segment Transaction 0.004 (.197) 0.003 (0.182) -0.008 (-0.443) 0.003 (0.160)
Number of Observations (n)
R-Square
F *** *
Group 2:
Utility
Group 1:
Resource Based
t statistics in parenthesis, *Indicates significance at .1, **Indicates significance at .05, ***Indicates significance at .01
46
0.572
4.811
75 70
0.165
0.952
Group 4:
Electric Power
Group 3:
Midstream and
Transportation
0.258
1.826
142
0.056
0.644

109
Model 2 is a weak form SI_SIM_AN_3DAY (Simple returns on a -3, +3 day event window
anchored off of the announcement date) Table 15 provides the Quantile regression results for
Model 2. Results for each energy industry segment are provided in the table.
Resource: 57.2% of the variation in the dependent variable (the proxy measure of
S&I) is explained by the independent variables in the OLS regression results. The
OLS model provides statistically meaningful results as the F statistic of 4.811 is
significant at the .01 level. Results across the quantiles also suggest statistically
significant relationships among the predictor variables and short term returns
evaluated at various quantiles. Of interest is the result for the variable Like
Buying Like which suggests a range of 7 to 14% difference in announcement
returns across the quantile range when Resource companies acquire a similar type
of business. Furthermore, quantile results for transactions funded with stock
suggest a 15 to 22% reduction in announcement returns across the quantiles when
Resource companies use stock for their M&A deal. These effects are assuming
all other variables are kept constant. Additionally, the predictor variable Critical
deal for Acquirer was statistically significant in the OLS regression results but
had generally insignificant results in the quantile regression analysis of S&I
returns for transactions involving Resource companies.
Utility: 25.8% of the variation in the dependent variable (the proxy measure of
S&I) is explained by the independent variables in the OLS regression results. The
OLS model provides statistically meaningful results as the F statistic of 1.826 is
significant at the .1 level. Results across the quantiles also suggest statistically
significant relationships among the predictor variables and short term returns
evaluated at various quantiles. Of interest is the result for the variable Multi State
Transaction which suggests a value reduction of 3 to 4% between the quantiles
when Utility acquirers attempt to conduct a transaction with business operations

110
in multiple states. This effect is assuming all other variables are kept constant.
Additionally, the predictor variables; Lag from Critical Reg Date and Announced
During a Recession, were both statistically significant in the OLS regression
results but had generally insignificant results in the quantile regression analysis of
S&I returns for transactions involving Utility companies.
Midstream and Transportation: 5.6% of the variation in the dependent variable
(the proxy measure of S&I) is explained by the independent variables in the OLS
regression results. However, the OLS regression model provides insignificant
results as the F statistic of 0.644 is statistically insignificant. Furthermore, the
quantile regression results are also inconclusive.
Electric Power: 16.5% of the variation in the dependent variable (the proxy
measure of S&I) is explained by the independent variables in the OLS regression
results. The model provides insignificant results as the F statistic of 0.952 is
statistically insignificant. Furthermore, the quantile regression results are also
inconclusive.

111
Table 15: Model 2 Quantile Regression – S&I Simple 3 Day (-3, +3) Returns
Resource Based
B SE t p B SE t p B SE t p B SE t p B SE t p
(Constant) -0.050 0.032 -1.559 0.128 -0.013 0.049 -0.272 0.787 0.007 0.029 0.241 0.811 0.038 0.018 2.149 0.038 0.048 0.015 3.097 0.004
Like Buying Like Businesses 0.071 0.029 2.456 0.019 0.083 0.044 1.858 0.071 0.135 0.026 5.146 0.000 0.119 0.016 7.463 0.000 0.126 0.014 9.097 0.000
Lag from Critical Reg Date 0.000 0.000 -1.033 0.308 0.000 0.000 -0.674 0.504 0.000 0.000 -1.224 0.229 -0.001 0.000 -3.260 0.002 0.000 0.000 -3.139 0.003
Approval Cycle 0.000 0.000 0.920 0.364 0.000 0.000 0.783 0.439 0.000 0.000 -0.445 0.659 0.000 0.000 -0.836 0.408 0.000 0.000 0.168 0.867
Stock Deal -0.148 0.044 -3.380 0.002 -0.185 0.067 -2.757 0.009 -0.205 0.040 -5.160 0.000 -0.191 0.024 -7.890 0.000 -0.227 0.021 -10.885 0.000
Announced During a Recession -0.004 0.028 -0.160 0.874 0.001 0.043 0.030 0.976 0.016 0.025 0.614 0.543 0.023 0.015 1.487 0.146 0.024 0.013 1.815 0.078
Experienced M&A Team 0.038 0.020 1.870 0.070 0.001 0.032 0.035 0.973 -0.015 0.019 -0.799 0.429 -0.022 0.011 -1.897 0.066 -0.015 0.010 -1.525 0.136
Critical Deal for Acquirer 0.084 0.035 2.373 0.023 0.072 0.054 1.313 0.197 0.043 0.032 1.346 0.187 0.031 0.020 1.578 0.123 0.026 0.017 1.530 0.135
Multi State Transaction 0.000 0.036 -0.001 1.000 -0.055 0.056 -0.984 0.332 -0.078 0.033 -2.366 0.023 -0.034 0.020 -1.696 0.098 0.007 0.017 0.383 0.704
Overlapping States -0.053 0.034 -1.580 0.123 -0.019 0.052 -0.369 0.715 0.041 0.031 1.343 0.188 -0.008 0.019 -0.407 0.687 -0.038 0.016 -2.356 0.024
Multi Business Segment Transaction -0.036 0.026 -1.389 0.173 -0.011 0.040 -0.287 0.776 0.011 0.023 0.490 0.627 0.024 0.014 1.691 0.099 0.001 0.012 0.112 0.911
Utility
B SE t p B SE t p B SE t p B SE t p B SE t p
(Constant) 0.040 0.022 1.787 0.079 0.019 0.032 0.588 0.558 0.031 0.025 1.244 0.218 0.039 0.022 1.776 0.081 0.047 0.015 3.156 0.002
Like Buying Like Businesses -0.033 0.011 -3.076 0.003 -0.025 0.015 -1.631 0.108 -0.031 0.012 -2.646 0.010 0.008 0.010 0.745 0.459 0.001 0.007 0.207 0.837
Lag from Critical Reg Date 0.000 0.000 -1.166 0.248 0.000 0.000 -0.964 0.339 0.000 0.000 -1.537 0.129 0.000 0.000 -1.288 0.203 0.000 0.000 -2.902 0.005
Approval Cycle 0.000 0.000 -1.008 0.317 0.000 0.000 -0.100 0.921 0.000 0.000 0.062 0.951 0.000 0.000 -0.723 0.473 0.000 0.000 0.024 0.981
Stock Deal -0.036 0.014 -2.524 0.014 -0.031 0.021 -1.502 0.138 -0.005 0.016 -0.296 0.768 -0.010 0.014 -0.731 0.467 0.006 0.010 0.613 0.542
Announced During a Recession -0.208 0.015 -13.490 0.000 -0.016 0.022 -0.711 0.480 -0.008 0.017 -0.473 0.638 -0.009 0.015 -0.622 0.536 0.014 0.010 1.352 0.181
Announced During a Merger Wave -0.020 0.014 -1.407 0.164 -0.016 0.020 -0.786 0.435 -0.008 0.015 -0.498 0.620 0.007 0.014 0.511 0.611 0.018 0.009 1.985 0.052
Experienced M&A Team 0.008 0.011 0.670 0.505 0.017 0.016 1.006 0.318 0.000 0.013 -0.024 0.981 -0.005 0.011 -0.491 0.625 -0.026 0.008 -3.395 0.001
Company Pressured to Transact 0.006 0.019 0.309 0.759 0.014 0.028 0.512 0.610 0.020 0.021 0.916 0.363 0.002 0.019 0.085 0.933 -0.002 0.013 -0.144 0.886
Critical Deal for Acquirer -0.019 0.012 -1.632 0.108 0.010 0.017 0.613 0.542 0.016 0.013 1.252 0.215 0.017 0.011 1.501 0.138 0.025 0.008 3.233 0.002
Multi State Transaction -0.030 0.012 -2.409 0.019 -0.041 0.018 -2.286 0.026 -0.038 0.014 -2.772 0.007 -0.025 0.012 -2.097 0.040 -0.029 0.008 -3.560 0.001
Overlapping States -0.023 0.011 -2.043 0.045 -0.011 0.016 -0.676 0.501 -0.013 0.012 -1.055 0.296 -0.010 0.011 -0.967 0.337 0.001 0.007 0.124 0.902
Multi Business Segment Transaction -0.003 0.012 -0.259 0.797 -0.010 0.017 -0.585 0.560 -0.005 0.013 -0.392 0.696 0.011 0.011 1.018 0.313 0.029 0.008 3.829 0.000
Quantile:
.75
Quantile:
.10
Quantile:
.25
Quantile:
.50
Quantile:
.75
Quantile:
.90
Quantile:
.10
Quantile:
.25
Quantile:
.50
Quantile:
.90

112
Midstream and Transportation
B SE t p B SE t p B SE t p B SE t p B SE t p
(Constant) -0.056 0.032 -1.732 0.086 0.034 0.018 1.903 0.059 0.033 0.024 1.379 0.170 0.079 0.037 2.122 0.036 0.133 0.033 4.106 0.000
Like Buying Like Businesses 0.018 0.016 1.166 0.246 0.010 0.009 1.168 0.245 0.009 0.012 0.756 0.451 -0.004 0.018 -0.215 0.830 -0.025 0.016 -1.589 0.115
Lag from Critical Reg Date 0.000 0.000 1.468 0.145 0.000 0.000 -2.203 0.029 0.000 0.000 -0.644 0.521 0.000 0.000 -0.911 0.364 0.000 0.000 -1.367 0.174
Approval Cycle 0.000 0.000 -0.554 0.580 0.000 0.000 0.235 0.815 0.000 0.000 0.126 0.900 0.000 0.000 -0.612 0.542 0.000 0.000 -1.972 0.051
Stock Deal 0.015 0.018 0.803 0.423 0.013 0.010 1.275 0.204 0.013 0.014 0.927 0.356 0.021 0.021 0.988 0.325 0.045 0.019 2.427 0.017
Announced During a Recession -0.133 0.028 -4.743 0.000 -0.100 0.015 -6.467 0.000 -0.019 0.021 -0.932 0.353 0.021 0.033 0.660 0.511 0.194 0.028 6.855 0.000
Announced During a Merger Wave -0.037 0.022 -1.681 0.095 0.007 0.012 0.596 0.553 -0.005 0.016 -0.328 0.743 0.017 0.026 0.680 0.498 0.035 0.022 1.541 0.126
Experienced M&A Team -0.023 0.014 -1.681 0.095 -0.005 0.008 -0.622 0.535 -0.011 0.010 -1.100 0.273 -0.016 0.016 -1.020 0.310 -0.023 0.014 -1.671 0.097
Company Pressured to Transact -0.025 0.023 -1.096 0.275 0.009 0.012 0.754 0.452 -0.002 0.017 -0.145 0.885 0.002 0.026 0.058 0.954 -0.025 0.023 -1.085 0.280
Critical Deal for Acquirer -0.012 0.017 -0.701 0.485 0.017 0.010 1.732 0.086 0.009 0.013 0.733 0.465 0.022 0.020 1.106 0.271 0.008 0.018 0.472 0.637
Multi State Transaction -0.005 0.018 -0.299 0.765 -0.014 0.010 -1.410 0.161 -0.013 0.013 -0.979 0.329 -0.014 0.020 -0.671 0.504 -0.019 0.018 -1.083 0.281
Overlapping States 0.005 0.014 0.331 0.741 0.004 0.008 0.458 0.648 0.008 0.010 0.744 0.458 -0.007 0.017 -0.436 0.664 0.004 0.014 0.284 0.777
Multi Business Segment Transaction -0.005 0.021 -0.217 0.829 -0.036 0.011 -3.137 0.002 -0.018 0.015 -1.171 0.244 0.003 0.024 0.117 0.907 0.033 0.021 1.580 0.116
Electric Power
B SE t p B SE t p B SE t p B SE t p B SE t p
(Constant) 0.025 0.013 1.950 0.056 -0.018 0.018 -0.994 0.325 0.007 0.013 0.558 0.579 0.023 0.024 0.956 0.343 -0.014 0.025 -0.550 0.585
Like Buying Like Businesses 0.004 0.007 0.528 0.599 0.017 0.010 1.652 0.104 0.000 0.007 -0.034 0.973 -0.020 0.014 -1.434 0.157 0.006 0.014 0.390 0.698
Lag from Critical Reg Date 0.000 0.000 0.191 0.849 0.000 0.000 0.609 0.545 0.000 0.000 0.955 0.344 0.000 0.000 0.929 0.357 0.001 0.000 3.682 0.001
Approval Cycle 0.000 0.000 -6.705 0.000 0.000 0.000 0.104 0.917 0.000 0.000 -1.810 0.076 0.000 0.000 -2.263 0.027 0.000 0.000 -2.056 0.044
Stock Deal -0.003 0.007 -0.429 0.669 0.002 0.010 0.239 0.812 0.004 0.007 0.594 0.555 -0.008 0.013 -0.618 0.539 -0.035 0.013 -2.620 0.011
Announced During a Recession -0.060 0.012 -5.131 0.000 -0.009 0.016 -0.534 0.595 -0.008 0.011 -0.742 0.461 -0.003 0.022 -0.145 0.885 0.028 0.023 1.259 0.213
Announced During a Merger Wave 0.001 0.008 0.184 0.854 -0.018 0.011 -1.709 0.093 0.006 0.008 0.813 0.420 -0.011 0.014 -0.775 0.442 -0.023 0.015 -1.570 0.122
Experienced M&A Team -0.014 0.006 -2.335 0.023 0.005 0.008 0.585 0.561 -0.002 0.006 -0.288 0.774 -0.002 0.011 -0.185 0.854 0.004 0.011 0.331 0.742
Company Pressured to Transact -0.016 0.010 -1.616 0.112 0.001 0.014 0.042 0.967 -0.025 0.010 -2.552 0.013 0.010 0.019 0.518 0.606 0.029 0.019 1.521 0.134
Critical Deal for Acquirer -0.026 0.008 -3.188 0.002 -0.014 0.011 -1.228 0.224 -0.001 0.008 -0.106 0.916 0.007 0.015 0.477 0.635 0.023 0.016 1.450 0.152
Multi State Transaction 0.011 0.008 1.329 0.189 0.018 0.011 1.634 0.108 0.009 0.008 1.132 0.262 0.001 0.015 0.077 0.939 0.035 0.016 2.220 0.030
Overlapping States -0.014 0.008 -1.774 0.081 -0.020 0.011 -1.763 0.083 -0.011 0.008 -1.358 0.180 0.013 0.015 0.851 0.398 -0.006 0.015 -0.377 0.708
Multi Business Segment Transaction -0.010 0.007 -1.312 0.195 0.012 0.010 1.133 0.262 -0.003 0.007 -0.423 0.674 0.004 0.014 0.308 0.759 0.033 0.014 2.350 0.022
Quantile:
.10
Quantile:
.25
Quantile:
.50
Quantile:
.75
Quantile:
.90
Quantile:
.10
Quantile:
.25
Quantile:
.50
Quantile:
.75
Quantile:
.90

113
Transacting and Executing
Transacting and Executing capability is the capacity to manage and execute
efficiently the transaction closing process, including meeting all conditions precedent in the
acquisition which may involve arranging financing, obtaining approvals and consents,
(regulatory, shareholder, other) and consummating all other deal closing mechanics. Firms that
can manage efficiently these processes are positioned to take advantage of the opportunity that
was created in Selecting and Identifying and can create substantial competitive advantage.
As a proxy to measure the effectiveness of a firm‟s T&E capabilities, short-term
value measurements are most appropriate but anchored around the closing date of the
transaction. Additionally, the market‟s response to the effectiveness of these capabilities is best
evidenced by how it responds when it is informed of how the acquirer expects to close the
transaction and its strategy for satisfying any commitments it made during the announcement
phase of the transaction in its short-term execution plan. Utilizing value measures straddling the
closing date of the transaction is an appropriate gauge of the market‟s judgment of a company‟s
T&E capabilities.
Furthermore, as the market tends to be somewhat efficient, the window of time
necessary to measure its response is relatively short. However, the company will spend some
fair amounts of time completing the tasks necessary to effectuate the transaction and get through
its first accounting cycle. Even though this time period can linger for months as companies work
through final regulatory approvals and meeting conditions necessary to close the transaction, the
completion of and communication of outcomes for many of these tasks occur in the last month
pre-closing of a transaction. Similarly the one month post-closing of the transaction and the
completion of the companies first accounting cycle often is the first indication to the markets of
how well much of the T&E tasks were conducted.
Table 16 provides factor differences among Top T&E Performers (those with top
quartile performance in T&E) and Poor T&E Performers (those with bottom quartile
performance in T&E). Significant results are noted (.10 level or better) where means are
statistically different. Some interesting results are noteworthy when comparing the Top versus

114
the Poor performers. Top Performers tend to have statistically shorter deal approval cycles, are
less likely to do a deal during a recession, are more likely to transact during a merger wave and
also attempt a multi-state transaction than the Poor performing acquirers.
Table 16: Factor Differences among Top and Poor Performers – T&E
Mean STD Mean STD Mean STD
Like Buying Like Businesses 0.605 0.490 0.560 0.499 0.560 0.499 0.457Cannot Reject
Null Hypothesis0.444
Cannot Reject
Null Hypothesis1.000
Cannot Reject
Null Hypothesis
Lag from Critical Reg Date 107.035 65.575 113.187 68.132 96.808 60.566 0.462Cannot Reject
Null Hypothesis0.168
Cannot Reject
Null Hypothesis0.101
Cannot Reject
Null Hypothesis
Approval Cycle 140.365 148.114 118.643 130.855 167.619 168.886 0.191Cannot Reject
Null Hypothesis0.169
Cannot Reject
Null Hypothesis0.035
Reject Null
Hypothesis
Stock Deal 0.184 0.388 0.143 0.352 0.179 0.385 0.355Cannot Reject
Null Hypothesis0.907
Cannot Reject
Null Hypothesis0.530
Cannot Reject
Null Hypothesis
Announced During a Recession 0.080 0.272 0.060 0.238 0.155 0.364 0.497Cannot Reject
Null Hypothesis0.073
Reject Null
Hypothesis0.043
Reject Null
Hypothesis
Closed During a Recession 0.083 0.276 0.095 0.295 0.167 0.375 0.738Cannot Reject
Null Hypothesis0.051
Reject Null
Hypothesis0.168
Cannot Reject
Null Hypothesis
Announced During a Wave 0.335 0.473 0.393 0.491 0.238 0.428 0.340Cannot Reject
Null Hypothesis0.065
Reject Null
Hypothesis0.030
Reject Null
Hypothesis
Experienced M&A Team 0.383 0.487 0.274 0.449 0.393 0.491 0.054Reject Null
Hypothesis0.864
Cannot Reject
Null Hypothesis0.101
Cannot Reject
Null Hypothesis
Company Pressured to Transact 0.107 0.309 0.155 0.364 0.107 0.311 0.273Cannot Reject
Null Hypothesis0.994
Cannot Reject
Null Hypothesis0.363
Cannot Reject
Null Hypothesis
First Deal For Team 0.401 0.491 0.464 0.502 0.369 0.485 0.303Cannot Reject
Null Hypothesis0.589
Cannot Reject
Null Hypothesis0.211
Cannot Reject
Null Hypothesis
Critical Deal for Acquirer 0.427 0.495 0.512 0.503 0.405 0.494 0.173Cannot Reject
Null Hypothesis0.705
Cannot Reject
Null Hypothesis0.164
Cannot Reject
Null Hypothesis
Multi State Transaction 0.472 0.500 0.595 0.494 0.369 0.485 0.044Reject Null
Hypothesis0.080
Reject Null
Hypothesis0.003
Reject Null
Hypothesis
Overlapping States 0.570 0.496 0.548 0.501 0.607 0.491 0.721Cannot Reject
Null Hypothesis0.528
Cannot Reject
Null Hypothesis0.437
Cannot Reject
Null Hypothesis
Multi Business Segment 0.246 0.431 0.214 0.413 0.298 0.460 0.535Cannot Reject
Null Hypothesis0.348
Cannot Reject
Null Hypothesis0.216
Cannot Reject
Null Hypothesis
All Top
Performers
n=81
Comparisons of Means - p values noted
(null hypothesis is that means are =)
All vs. Top Perfomers All vs. Poor Performers Top vs. Poor Performers
Poor
Performers

115
Two specifications of the T&E variable, one a weak form and one a semi-strong form is
provided with results provided by industry segment. Model 3 is a semi-strong specification of
TE_CAR_Clsd_30DAY (Abnormal returns on a -30, +30 event window anchored off of the
closing date) Table 17 provides the OLS regression results for Model 3. Results for each energy
industry segment are provided in the table.
Resource: 3.8% of the variation in the dependent variable (the proxy measure of
T&E) is explained by the independent variables. The model provides statistically
insignificant results as the F statistic of 0.144 is statistically insignificant.
Utility: 22.1% of the variation in the dependent variable (the proxy measure of
T&E) is explained by the independent variables. The model provides statistically
insignificant results as the F statistic of 1.468 is statistically insignificant.
Midstream and Transportation: 15.7% of the variation in the dependent variable
(the proxy measure of T&E) is explained by the independent variables. The
model provides statistically meaningful results as the F statistic of 2.023 is
statistically significant at the. 05 level. Additionally, the independent variables:
Like Buying Like Business, Closed During a Recession, Experienced M&A Team
and Multi Business Segment Transaction are all statistically significant at the .05
level or better. The Approval Cycle independent variable is also significant at the
.1 level. Multicollinearity does not appear to negatively influence the regression
results. Of the 12 predictor variables, 10 have Variable Inflation Factors (VIFs)
below 2.2. Of the two that do not, Lag from Critical Reg Date (3.9) and
Announced During a Merger Wave (3.6) are both below the theoretical threshold
of 5.0.

116
Electric Power: 14.7% of the variation in the dependent variable (the proxy
measure of T&E) is explained by the independent variables. The model provides
statistically insignificant results as the F statistic of 0.831 is statistically
insignificant.

117
Table 17: Model 3 - T&E Abnormal 30 Day (-30, +30) Returns
B t (sig) B t (sig) B t (sig) B t (sig)
(Constant) 0.001 (0.003) 0.005 (0.117) -0.04 (-0.583) -0.058 (-0.772)
Like Buying Like Businesses 0.011 (0.126) 0.015 (0.641) -0.079 (-2.370) ** 0.049 (1.052)
Lag from Critical Reg Date 0.001 (0.524) 0.001 (1.314) 0.001 (1.631) 0.001 (0.011)
Approval Cycle 0.001 (0.183) -0.001 (-1.222) 0.001 (1.956) * -0.001 (-2.537) **
Stock Deal -0.011 (-0.987) -0.017 (-0.555) -0.009 (-0.220) -0.02 (-0.474)
Closed During a Recession -0.014 (-0.100) -0.075 (-2.375) ** -0.109 (-1.977) ** -0.001 (-0.020)
Announced During a Merger Wave 0.031 (0.996) -0.061 (-1.331) 0.006 (0.125)
Experienced M&A Team 0.018 (0.292) -0.019 (-0.790) -0.063 (-2.175) ** 0.01 (0.288)
Company Pressured to Transact -0.036 (-0.862) -0.04 (-0.843) -0.009 (-0.143)
Critical Deal for Acquirer -0.046 (-0.438) -0.019 (-0.752) 0.003 (0.761) 0.084 (1.691) *
Multi State Transaction 0.022 (0.224) 0.063 (2.403) ** 0.027 (0.725) 0.024 (0.481)
Overlapping States -0.064 (-0.636) -0.019 (-0.792) 0.03 (1.008) 0.043 (0.873)
Multi Business Segment Transaction -0.006 (-0.084) -0.02 (-0.806) -0.136 (-3.089) *** 0.026 (0.570)
Number of Observations (n)
R-Square
F **
Group 1:
Resource Based
Group 2:
Utility
Group 3:
Midstream and
Transportation
Group 4:
Electric Power
46 74 142 70
t statistics in parenthesis, *Indicates significance at .1, **Indicates significance at .05, ***Indicates significance at .01
0.038 0.221 0.157 0.147
0.144 1.468 2.023 0.831

118
Model 3 is a semi-strong specification of TE_CAR_Clsd_30DAY (Abnormal returns on a -30,
+30 event window anchored off of the closing date) Table 18 provides the Quantile regression
results for Model 3. Results for each energy industry segment are provided in the table.
Resource: 3.8% of the variation in the dependent variable (the proxy measure of
T&E) is explained by the independent variables in the OLS regression results.
The model provides insignificant results as the F statistic of 0.144 is statistically
insignificant. Furthermore, the quantile regression results are also inconclusive.
Utility: 22.1% of the variation in the dependent variable (the proxy measure of
T&E) is explained by the independent variables in the OLS regression results.
The model provides insignificant results as the F statistic of 1.468 is statistically
insignificant. Furthermore, the quantile regression results are also inconclusive.
Midstream and Transportation: 15.7% of the variation in the dependent variable
(the proxy measure of T&E) is explained by the independent variables in the OLS
regression results. The model provides statistically meaningful results as the F
statistic of 2.023 is statistically significant at the 05 level. Results across the
quantiles also suggest statistically significant relationships among the predictor
variables and returns evaluated at various quantiles. Of interest is the result for
the variable Multi Business Segment Transaction which suggests a value
reduction of 5 to 10% between the quantiles when Midstream acquirers attempt to
conduct a transaction with business operations covering multiple business
segments. This effect is assuming all other variables are kept constant.
Additionally, the predictor variables; Like Buying Like Businesses, Approval
Cycle, Closed During a Recession and Experienced M&A Team were all
statistically significant in the OLS regression results but had generally

119
insignificant results in the quantile regression analysis of T&E returns for
transactions involving Midstream companies.
Electric Power: 14.7% of the variation in the dependent variable (the proxy
measure of T&E) is explained by the independent variables in the OLS regression
results. The model provides insignificant results as the F statistic of 0.831 is
statistically insignificant. Furthermore, the quantile regression results are also
inconclusive.

120
Table 18: Model 3 Quantile Regression – T&E Abnormal 30 Day (-30, +30) Returns
Resource Based
B SE t p B SE t p B SE t p B SE t p B SE t p
(Constant) -0.142 0.033 -4.330 0.000 -0.154 0.066 -2.327 0.026 -0.015 0.084 -0.183 0.856 -0.004 0.077 -0.048 0.962 0.003 0.039 0.087 0.931
Like Buying Like Businesses -0.002 0.022 -0.087 0.931 -0.021 0.045 -0.466 0.644 -0.052 0.057 -0.926 0.361 -0.041 0.052 -0.782 0.439 -0.061 0.026 -2.292 0.028
Lag from Critical Reg Date 0.002 0.000 7.958 0.000 0.001 0.000 2.636 0.012 0.000 0.001 0.294 0.770 0.000 0.001 0.141 0.889 0.000 0.000 -0.562 0.578
Approval Cycle 0.000 0.000 1.229 0.227 0.000 0.000 1.663 0.105 0.000 0.000 0.732 0.469 0.000 0.000 -0.347 0.731 0.000 0.000 -0.685 0.497
Stock Deal -0.016 0.033 -0.485 0.631 -0.019 0.068 -0.282 0.780 -0.009 0.086 -0.109 0.914 -0.037 0.079 -0.469 0.642 -0.023 0.040 -0.579 0.566
Closed During a Recession -0.091 0.035 -2.611 0.013 -0.002 0.071 -0.034 0.973 0.022 0.090 0.247 0.806 0.086 0.083 1.034 0.308 0.113 0.042 2.696 0.011
Experienced M&A Team -0.021 0.016 -1.309 0.199 0.008 0.032 0.263 0.794 0.006 0.041 0.140 0.889 -0.012 0.037 -0.327 0.745 -0.018 0.019 -0.946 0.351
Critical Deal for Acquirer -0.162 0.027 -6.060 0.000 -0.102 0.054 -1.876 0.069 0.006 0.069 0.090 0.929 0.059 0.063 0.927 0.360 0.081 0.032 2.526 0.016
Multi State Transaction 0.115 0.025 4.529 0.000 0.021 0.051 0.409 0.685 0.047 0.065 0.718 0.477 0.046 0.060 0.760 0.452 0.046 0.030 1.502 0.142
Overlapping States 0.105 0.026 4.050 0.000 0.138 0.052 2.623 0.013 -0.014 0.067 -0.205 0.839 -0.092 0.061 -1.501 0.142 -0.123 0.031 -3.952 0.000
Multi Business Segment Transaction -0.010 0.019 -0.508 0.615 -0.019 0.039 -0.488 0.629 -0.043 0.049 -0.862 0.394 -0.034 0.045 -0.758 0.453 -0.031 0.023 -1.344 0.187
Utility
B SE t p B SE t p B SE t p B SE t p B SE t p
(Constant) -0.066 0.029 -2.310 0.024 -0.040 0.037 -1.068 0.290 -0.008 0.036 -0.220 0.827 0.052 0.053 0.972 0.335 0.090 0.052 1.734 0.088
Like Buying Like Businesses 0.057 0.013 4.221 0.000 0.045 0.018 2.534 0.014 0.019 0.017 1.098 0.276 0.009 0.025 0.356 0.723 -0.052 0.025 -2.126 0.037
Lag from Critical Reg Date 0.000 0.000 2.081 0.042 0.000 0.000 0.985 0.329 0.000 0.000 1.272 0.208 0.001 0.000 1.535 0.130 0.001 0.000 1.589 0.117
Approval Cycle 0.000 0.000 -0.095 0.924 0.000 0.000 -0.922 0.360 0.000 0.000 -1.251 0.216 0.000 0.000 -2.289 0.025 0.000 0.000 -1.907 0.061
Stock Deal -0.042 0.018 -2.277 0.026 -0.048 0.024 -2.002 0.050 -0.020 0.023 -0.846 0.401 -0.014 0.034 -0.424 0.673 -0.017 0.033 -0.512 0.611
Closed During a Recession -0.059 0.019 -3.185 0.002 -0.069 0.024 -2.851 0.006 -0.102 0.024 -4.271 0.000 -0.022 0.035 -0.630 0.531 0.032 0.034 0.934 0.354
Announced During a Merger Wave -0.093 0.018 -5.149 0.000 -0.080 0.024 -3.407 0.001 -0.013 0.023 -0.547 0.586 -0.010 0.034 -0.303 0.763 -0.037 0.033 -1.121 0.267
Experienced M&A Team -0.022 0.014 -1.516 0.135 -0.034 0.019 -1.809 0.075 -0.041 0.018 -2.257 0.028 -0.011 0.027 -0.425 0.672 -0.006 0.026 -0.214 0.831
Company Pressured to Transact 0.031 0.025 1.271 0.209 0.049 0.032 1.530 0.131 0.025 0.031 0.787 0.434 0.021 0.046 0.469 0.641 0.065 0.045 1.451 0.152
Critical Deal for Acquirer 0.032 0.015 2.084 0.041 0.010 0.020 0.512 0.610 -0.006 0.019 -0.307 0.760 -0.046 0.028 -1.619 0.111 -0.036 0.028 -1.298 0.199
Multi State Transaction 0.055 0.015 3.556 0.001 0.058 0.020 2.882 0.005 0.057 0.020 2.892 0.005 0.048 0.029 1.655 0.103 0.101 0.028 3.571 0.001
Overlapping States -0.018 0.014 -1.254 0.215 -0.009 0.018 -0.518 0.606 -0.006 0.018 -0.336 0.738 -0.022 0.026 -0.833 0.408 -0.033 0.026 -1.280 0.205
Multi Business Segment Transaction -0.023 0.015 -1.565 0.123 -0.005 0.019 -0.262 0.794 -0.008 0.019 -0.424 0.673 0.006 0.027 0.236 0.815 -0.039 0.027 -1.485 0.143
Quantile:
.10
Quantile:
.25
Quantile:
.50
Quantile:
.75
Quantile:
.90
Quantile:
.10
Quantile:
.25
Quantile:
.50
Quantile:
.75
Quantile:
.90

121
Midstream and Transportation
B SE t p B SE t p B SE t p B SE t p B SE t p
(Constant) -0.002 0.029 -0.061 0.951 -0.064 0.029 -2.252 0.026 -0.023 0.054 -0.435 0.664 0.029 0.039 0.750 0.455 0.018 0.029 0.623 0.534
Like Buying Like Businesses -0.003 0.014 -0.220 0.826 0.009 0.014 0.678 0.499 0.011 0.026 0.405 0.686 0.009 0.019 0.468 0.641 0.029 0.014 2.030 0.044
Lag from Critical Reg Date 0.000 0.000 -2.010 0.047 0.000 0.000 1.403 0.163 0.000 0.000 0.444 0.658 0.000 0.000 0.489 0.626 0.000 0.000 1.073 0.285
Approval Cycle 0.000 0.000 0.701 0.484 0.000 0.000 0.146 0.884 0.000 0.000 0.211 0.833 0.000 0.000 2.569 0.011 0.001 0.000 7.579 0.000
Stock Deal -0.135 0.017 -8.124 0.000 0.006 0.016 0.367 0.715 -0.003 0.031 -0.108 0.914 -0.022 0.022 -0.988 0.325 -0.065 0.017 -3.840 0.000
Closed During a Recession -0.341 0.023 -14.610 0.000 -0.128 0.023 -5.563 0.000 0.027 0.043 0.623 0.535 0.004 0.031 0.137 0.892 -0.020 0.024 -0.835 0.405
Announced During a Merger Wave 0.024 0.019 1.218 0.225 -0.008 0.019 -0.412 0.681 -0.008 0.036 -0.224 0.823 -0.001 0.026 -0.051 0.960 0.004 0.020 0.189 0.850
Experienced M&A Team -0.012 0.012 -0.979 0.329 -0.025 0.012 -2.063 0.041 -0.024 0.023 -1.034 0.303 -0.025 0.017 -1.537 0.127 -0.030 0.013 -2.377 0.019
Company Pressured to Transact -0.053 0.020 -2.606 0.010 -0.005 0.020 -0.247 0.806 0.011 0.038 0.304 0.761 0.028 0.027 1.041 0.300 0.019 0.021 0.899 0.370
Critical Deal for Acquirer -0.014 0.016 -0.880 0.380 -0.003 0.015 -0.215 0.830 -0.006 0.029 -0.225 0.822 0.004 0.021 0.193 0.847 0.037 0.016 2.369 0.019
Multi State Transaction 0.048 0.016 3.001 0.003 0.030 0.016 1.895 0.060 0.041 0.029 1.383 0.169 0.002 0.021 0.089 0.929 -0.017 0.016 -1.072 0.286
Overlapping States -0.018 0.013 -1.447 0.150 -0.020 0.013 -1.588 0.115 -0.012 0.024 -0.510 0.611 -0.014 0.017 -0.825 0.411 0.020 0.013 1.567 0.120
Multi Business Segment Transaction -0.080 0.019 -4.294 0.000 -0.059 0.018 -3.186 0.002 -0.045 0.035 -1.296 0.197 -0.063 0.025 -2.500 0.014 -0.104 0.019 -5.456 0.000
Electric Power
B SE t p B SE t p B SE t p B SE t p B SE t p
(Constant) 0.051 0.054 0.952 0.345 0.013 0.060 0.211 0.834 -0.011 0.079 -0.136 0.892 0.014 0.058 0.239 0.812 0.014 0.058 0.239 0.812
Like Buying Like Businesses -0.153 0.030 -5.018 0.000 -0.064 0.034 -1.884 0.065 -0.052 0.045 -1.155 0.253 0.013 0.033 0.412 0.682 0.013 0.033 0.412 0.682
Lag from Critical Reg Date -0.001 0.000 -2.019 0.048 0.000 0.000 -0.413 0.681 0.000 0.001 0.419 0.677 0.000 0.000 0.662 0.511 0.000 0.000 0.662 0.511
Approval Cycle 0.000 0.000 -6.745 0.000 0.000 0.000 -1.523 0.133 0.000 0.000 -0.642 0.523 0.000 0.000 -0.500 0.619 0.000 0.000 -0.500 0.619
Stock Deal 0.059 0.028 2.138 0.037 0.022 0.031 0.710 0.480 -0.050 0.041 -1.234 0.222 -0.039 0.030 -1.306 0.197 -0.039 0.030 -1.306 0.197
Closed During a Recession -0.074 0.038 -1.958 0.055 -0.056 0.043 -1.305 0.197 0.023 0.056 0.411 0.683 0.061 0.041 1.483 0.144 0.061 0.041 1.483 0.144
Announced During a Merger Wave 0.021 0.032 0.650 0.518 -0.016 0.036 -0.452 0.653 -0.002 0.048 -0.052 0.959 0.020 0.035 0.574 0.569 0.020 0.035 0.574 0.569
Experienced M&A Team -0.011 0.024 -0.442 0.660 -0.010 0.027 -0.359 0.721 0.004 0.035 0.114 0.910 -0.003 0.026 -0.107 0.915 -0.003 0.026 -0.107 0.915
Company Pressured to Transact -0.055 0.040 -1.375 0.174 0.020 0.045 0.440 0.662 -0.011 0.059 -0.193 0.848 -0.047 0.043 -1.078 0.286 -0.047 0.043 -1.078 0.286
Critical Deal for Acquirer 0.059 0.033 1.806 0.076 0.015 0.037 0.409 0.684 0.086 0.048 1.795 0.078 0.092 0.035 2.614 0.011 0.092 0.035 2.614 0.011
Multi State Transaction -0.017 0.032 -0.511 0.611 -0.007 0.036 -0.196 0.845 0.003 0.048 0.062 0.951 -0.008 0.035 -0.216 0.830 -0.008 0.035 -0.216 0.830
Overlapping States 0.007 0.032 0.207 0.837 -0.013 0.036 -0.371 0.712 -0.040 0.047 -0.854 0.397 -0.062 0.035 -1.798 0.077 -0.062 0.035 -1.798 0.077
Multi Business Segment Transaction 0.021 0.030 0.690 0.493 0.004 0.034 0.115 0.909 0.015 0.045 0.341 0.734 0.024 0.033 0.740 0.462 0.024 0.033 0.740 0.462
Quantile:
.10
Quantile:
.25
Quantile:
.50
Quantile:
.75
Quantile:
.90
Quantile:
.10
Quantile:
.25
Quantile:
.50
Quantile:
.75
Quantile:
.90

122
Model 4 is a weak form TE_SIM_Clsd_30DAY (Simple returns on a -30, +30 day event
window anchored off of the closing date) Table 19 provides the OLS regression results for
Model 4. Results for each energy industry segment are provided in the table.
Resource: 4.6% of the variation in the dependent variable (the proxy measure of
T&E) is explained by the independent variables. The model provides statistically
insignificant results as the F statistic of 0.173 is statistically insignificant.
Utility: 32.4% of the variation in the dependent variable (the proxy measure of
T&E) is explained by the independent variables. The model provides statistically
meaningful results as the F statistic of 2.477 is significant at the .05 level. The
independent variables: Closed During a Recession, Company Pressured to
Transact and Multi-State Transaction are statistically significant at the .05 level.
Additionally, the Multi Business Segment Transaction variable is significant at
the .1 level. Multicollinearity does not appear to negatively influence the
regression results. Of the 12 predictor variables, all 12 have Variable Inflation
Factors (VIFs) below 2.1.
Midstream and Transportation: 18.0% of the variation in the dependent variable
(the proxy measure of T&E) is explained by the independent variables. The
model provides statistically meaningful results as the F statistic of 2.371 is
significant at the .05 level. The independent variables: Like Buying Like
Businesses, Closed During a Recession, Experienced M&A Team and Multi
Business Segment Transaction are statistically significant at the .05 level or
better. Additionally, the Announced During a Merger Wave and Approval Cycle
variables are significant at the .1 level. Multicollinearity does not appear to
negatively influence the regression results. Of the 12 predictor variables, 10 have
Variable Inflation Factors (VIFs) below 2.2. Of the two that do not, Lag from

123
Critical Reg Date (3.9) and Announced During a Merger Wave (3.6) are both
below the theoretical threshold of 5.0.
Electric Power: 19.1% of the variation in the dependent variable (the proxy
measure of T&E) is explained by the independent variables. The model provides
statistically insignificant results as the F statistic of 1.137 is statistically
insignificant.
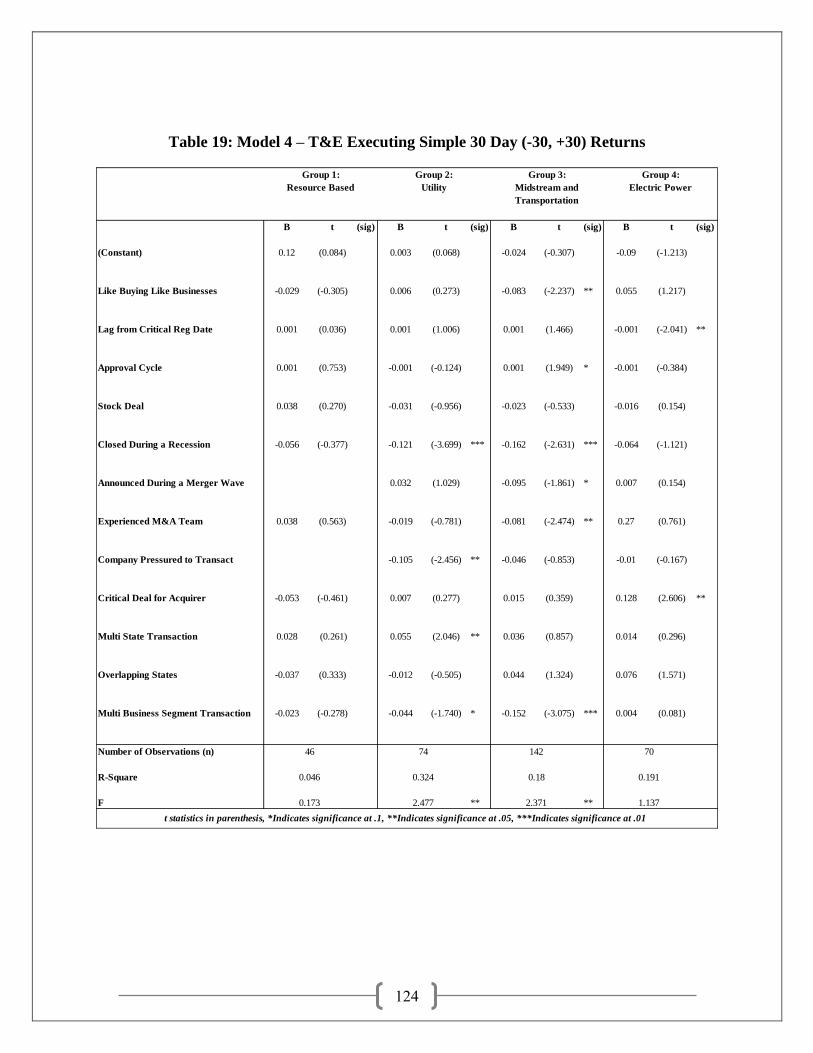
124
Table 19: Model 4 – T&E Executing Simple 30 Day (-30, +30) Returns
B t (sig) B t (sig) B t (sig) B t (sig)
(Constant) 0.12 (0.084) 0.003 (0.068) -0.024 (-0.307) -0.09 (-1.213)
Like Buying Like Businesses -0.029 (-0.305) 0.006 (0.273) -0.083 (-2.237) ** 0.055 (1.217)
Lag from Critical Reg Date 0.001 (0.036) 0.001 (1.006) 0.001 (1.466) -0.001 (-2.041) **
Approval Cycle 0.001 (0.753) -0.001 (-0.124) 0.001 (1.949) * -0.001 (-0.384)
Stock Deal 0.038 (0.270) -0.031 (-0.956) -0.023 (-0.533) -0.016 (0.154)
Closed During a Recession -0.056 (-0.377) -0.121 (-3.699) *** -0.162 (-2.631) *** -0.064 (-1.121)
Announced During a Merger Wave 0.032 (1.029) -0.095 (-1.861) * 0.007 (0.154)
Experienced M&A Team 0.038 (0.563) -0.019 (-0.781) -0.081 (-2.474) ** 0.27 (0.761)
Company Pressured to Transact -0.105 (-2.456) ** -0.046 (-0.853) -0.01 (-0.167)
Critical Deal for Acquirer -0.053 (-0.461) 0.007 (0.277) 0.015 (0.359) 0.128 (2.606) **
Multi State Transaction 0.028 (0.261) 0.055 (2.046) ** 0.036 (0.857) 0.014 (0.296)
Overlapping States -0.037 (0.333) -0.012 (-0.505) 0.044 (1.324) 0.076 (1.571)
Multi Business Segment Transaction -0.023 (-0.278) -0.044 (-1.740) * -0.152 (-3.075) *** 0.004 (0.081)
Number of Observations (n)
R-Square
F ** **
Group 1:
Resource Based
Group 2:
Utility
Group 3:
Midstream and
Transportation
Group 4:
Electric Power
46 74 142 70
t statistics in parenthesis, *Indicates significance at .1, **Indicates significance at .05, ***Indicates significance at .01
0.046 0.324 0.18 0.191
0.173 2.477 2.371 1.137
125
Model 4 is a weak form TE_SIM_Clsd_30DAY (Simple returns on a -30, +30 day event
window anchored off of the closing date) Table 20 provides the Quantile regression results for
Model 4. Results for each energy industry segment are provided in the table.
Resource: 4.6% of the variation in the dependent variable (the proxy measure of
T&E) is explained by the independent variables in the OLS regression results.
The model provides insignificant results as the F statistic of 0.173 is statistically
insignificant. Furthermore, the quantile regression results are also inconclusive.
Utility: 32.4% of the variation in the dependent variable (the proxy measure of
T&E) is explained by the independent variables in the OLS regression results.
The model provides statistically meaningful results as the F statistic of 2.477 is
significant at the .05 level. Results across the quantiles also suggest statistically
significant relationships among the predictor variables and returns evaluated at
various quantiles. Of interest is the result for the variable Company Pressured to
Transact which suggests a value enhancement of 7 to 17% between the quantiles
when Utility acquirers transact as a result of market pressure. Perhaps the market
is rewarding a company by its willingness to do what the market was hoping.
Furthermore, the quantile results suggest that transactions that were closed during
a recession experienced a loss of value between 6 and 16% percent within 30 days
of closing. Whereas the market rewarded the multi-state acquirers with
enhancements in value of between 3 to 12% based off of the quantile regression
results and holding all other factors constant. Additionally, the predictor variable
Multi Business Segment Transaction was also statistically significant in the OLS
regression results but had generally insignificant results in the quantile regression
analysis of T&E returns for transactions involving Utility companies.
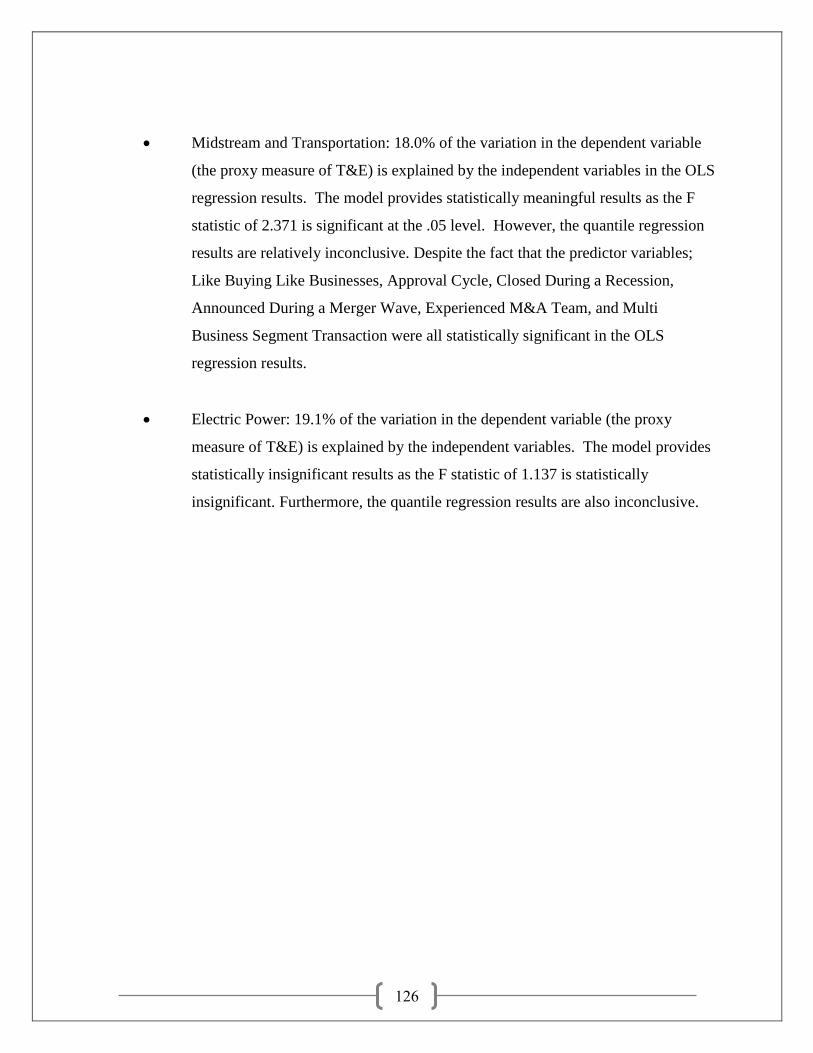
126
Midstream and Transportation: 18.0% of the variation in the dependent variable
(the proxy measure of T&E) is explained by the independent variables in the OLS
regression results. The model provides statistically meaningful results as the F
statistic of 2.371 is significant at the .05 level. However, the quantile regression
results are relatively inconclusive. Despite the fact that the predictor variables;
Like Buying Like Businesses, Approval Cycle, Closed During a Recession,
Announced During a Merger Wave, Experienced M&A Team, and Multi
Business Segment Transaction were all statistically significant in the OLS
regression results.
Electric Power: 19.1% of the variation in the dependent variable (the proxy
measure of T&E) is explained by the independent variables. The model provides
statistically insignificant results as the F statistic of 1.137 is statistically
insignificant. Furthermore, the quantile regression results are also inconclusive.

127
Table 20: Model 4 Quantile Regression – T&E Simple 30 Day (-30, +30) Returns
Resource Based
B SE t p B SE t p B SE t p B SE t p B SE t p
(Constant) -0.071 0.066 -1.079 0.288 -0.071 0.066 -1.079 0.288 -0.031 0.150 -0.204 0.839 0.016 0.049 0.319 0.751 0.001 0.061 0.017 0.986
Like Buying Like Businesses -0.127 0.044 -2.860 0.007 -0.127 0.044 -2.860 0.007 -0.123 0.101 -1.221 0.230 -0.078 0.033 -2.397 0.022 -0.103 0.041 -2.507 0.017
Lag from Critical Reg Date -0.001 0.000 -1.204 0.237 -0.001 0.000 -1.204 0.237 0.000 0.001 0.268 0.790 0.000 0.000 -0.680 0.501 -0.001 0.000 -3.268 0.002
Approval Cycle 0.000 0.000 0.511 0.613 0.000 0.000 0.511 0.613 0.000 0.000 1.151 0.257 0.000 0.000 0.967 0.340 0.000 0.000 1.675 0.103
Stock Deal 0.113 0.067 1.675 0.103 0.113 0.067 1.675 0.103 0.132 0.153 0.864 0.393 0.029 0.050 0.576 0.568 -0.010 0.062 -0.156 0.877
Closed During a Recession 0.053 0.070 0.757 0.454 0.053 0.070 0.757 0.454 0.061 0.160 0.380 0.706 0.117 0.052 2.251 0.031 0.240 0.065 3.700 0.001
Experienced M&A Team 0.027 0.032 0.853 0.399 0.027 0.032 0.853 0.399 -0.009 0.072 -0.128 0.899 -0.031 0.023 -1.341 0.188 0.019 0.029 0.657 0.515
Critical Deal for Acquirer -0.027 0.054 -0.498 0.622 -0.027 0.054 -0.498 0.622 -0.043 0.123 -0.350 0.728 0.051 0.040 1.269 0.212 0.070 0.050 1.399 0.170
Multi State Transaction -0.089 0.051 -1.746 0.089 -0.089 0.051 -1.746 0.089 0.022 0.116 0.187 0.853 0.100 0.038 2.650 0.012 0.068 0.047 1.437 0.159
Overlapping States 0.162 0.052 3.115 0.004 0.162 0.052 3.115 0.004 -0.006 0.119 -0.055 0.957 -0.155 0.038 -4.042 0.000 -0.170 0.048 -3.532 0.001
Multi Business Segment Transaction -0.073 0.039 -1.896 0.066 -0.073 0.039 -1.896 0.066 -0.077 0.088 -0.882 0.384 -0.079 0.028 -2.787 0.008 -0.026 0.036 -0.743 0.462
Utility
B SE t p B SE t p B SE t p B SE t p B SE t p
(Constant) -0.097 0.031 -3.103 0.003 -0.088 0.032 -2.755 0.008 -0.032 0.046 -0.689 0.493 -0.011 0.039 -0.272 0.786 -0.065 0.049 -1.327 0.189
Like Buying Like Businesses 0.044 0.015 2.980 0.004 0.029 0.015 1.912 0.061 -0.012 0.022 -0.539 0.592 0.000 0.018 0.027 0.978 -0.012 0.023 -0.543 0.589
Lag from Critical Reg Date 0.000 0.000 -1.451 0.152 0.001 0.000 2.019 0.048 0.000 0.000 -0.262 0.794 0.000 0.000 0.632 0.530 0.001 0.000 3.343 0.001
Approval Cycle 0.000 0.000 3.826 0.000 0.000 0.000 -0.080 0.936 0.000 0.000 0.144 0.886 0.000 0.000 -0.388 0.699 0.000 0.000 -1.062 0.292
Stock Deal -0.056 0.020 -2.826 0.006 -0.026 0.020 -1.251 0.216 -0.009 0.029 -0.303 0.763 -0.028 0.025 -1.134 0.261 -0.040 0.031 -1.268 0.209
Closed During a Recession -0.119 0.020 -5.859 0.000 -0.127 0.021 -6.073 0.000 -0.154 0.030 -5.103 0.000 -0.019 0.025 -0.750 0.456 -0.059 0.032 -1.838 0.071
Announced During a Merger Wave -0.097 0.020 -4.931 0.000 -0.043 0.020 -2.107 0.039 -0.013 0.029 -0.432 0.667 -0.016 0.025 -0.641 0.524 -0.029 0.031 -0.928 0.357
Experienced M&A Team 0.005 0.016 0.309 0.758 -0.028 0.016 -1.731 0.088 -0.025 0.023 -1.071 0.289 0.015 0.019 0.755 0.453 -0.009 0.024 -0.367 0.715
Company Pressured to Transact 0.082 0.027 3.073 0.003 0.066 0.028 2.377 0.021 0.076 0.040 1.929 0.058 0.096 0.033 2.877 0.006 0.170 0.042 4.039 0.000
Critical Deal for Acquirer 0.047 0.016 2.848 0.006 0.004 0.017 0.245 0.807 0.005 0.024 0.200 0.842 -0.014 0.021 -0.702 0.485 -0.038 0.026 -1.486 0.142
Multi State Transaction 0.013 0.017 0.772 0.443 0.032 0.017 1.842 0.070 0.047 0.025 1.896 0.063 0.045 0.021 2.137 0.037 0.127 0.026 4.779 0.000
Overlapping States -0.003 0.015 -0.187 0.852 0.005 0.016 0.342 0.733 -0.016 0.023 -0.715 0.477 -0.034 0.019 -1.784 0.079 -0.019 0.024 -0.789 0.433
Multi Business Segment Transaction -0.064 0.016 -4.041 0.000 -0.027 0.016 -1.645 0.105 -0.023 0.023 -0.983 0.329 -0.047 0.020 -2.408 0.019 -0.069 0.025 -2.783 0.007
Quantile:
.10
Quantile:
.25
Quantile:
.50
Quantile:
.75
Quantile:
.90
Quantile:
.10
Quantile:
.25
Quantile:
.50
Quantile:
.75
Quantile:
.90
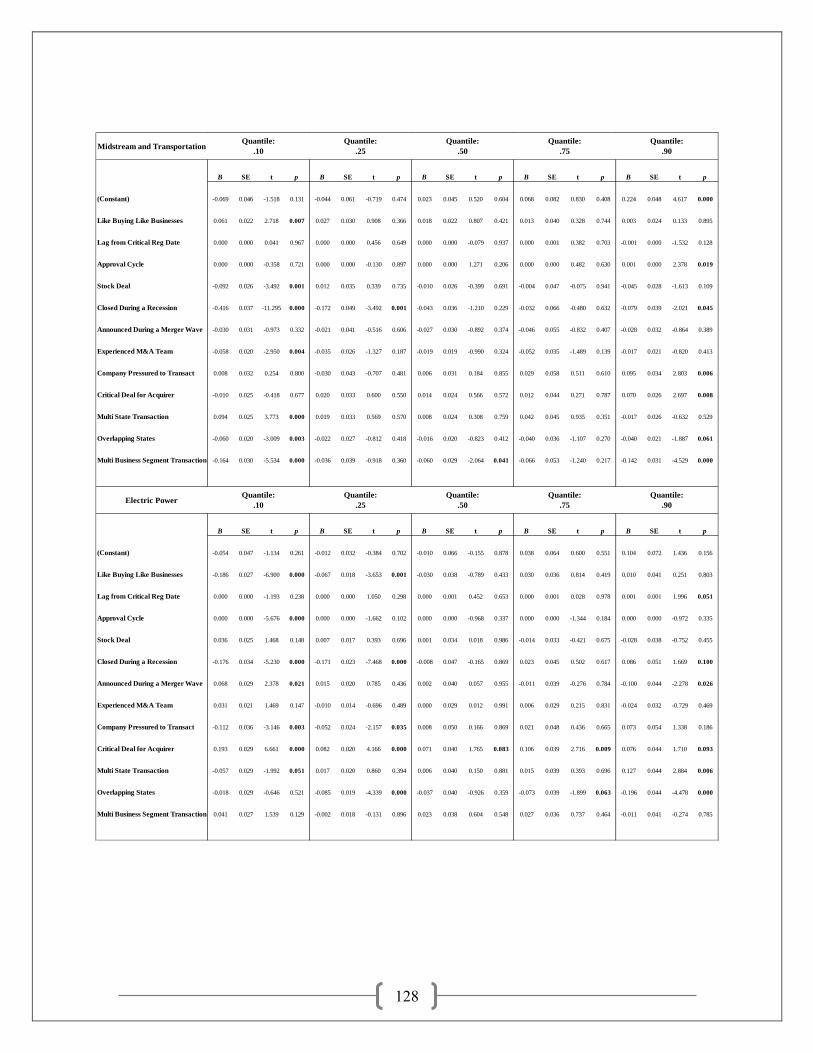
128
Midstream and Transportation
B SE t p B SE t p B SE t p B SE t p B SE t p
(Constant) -0.069 0.046 -1.518 0.131 -0.044 0.061 -0.719 0.474 0.023 0.045 0.520 0.604 0.068 0.082 0.830 0.408 0.224 0.048 4.617 0.000
Like Buying Like Businesses 0.061 0.022 2.718 0.007 0.027 0.030 0.908 0.366 0.018 0.022 0.807 0.421 0.013 0.040 0.328 0.744 0.003 0.024 0.133 0.895
Lag from Critical Reg Date 0.000 0.000 0.041 0.967 0.000 0.000 0.456 0.649 0.000 0.000 -0.079 0.937 0.000 0.001 0.382 0.703 -0.001 0.000 -1.532 0.128
Approval Cycle 0.000 0.000 -0.358 0.721 0.000 0.000 -0.130 0.897 0.000 0.000 1.271 0.206 0.000 0.000 0.482 0.630 0.001 0.000 2.378 0.019
Stock Deal -0.092 0.026 -3.492 0.001 0.012 0.035 0.339 0.735 -0.010 0.026 -0.399 0.691 -0.004 0.047 -0.075 0.941 -0.045 0.028 -1.613 0.109
Closed During a Recession -0.416 0.037 -11.295 0.000 -0.172 0.049 -3.492 0.001 -0.043 0.036 -1.210 0.229 -0.032 0.066 -0.480 0.632 -0.079 0.039 -2.021 0.045
Announced During a Merger Wave -0.030 0.031 -0.973 0.332 -0.021 0.041 -0.516 0.606 -0.027 0.030 -0.892 0.374 -0.046 0.055 -0.832 0.407 -0.028 0.032 -0.864 0.389
Experienced M&A Team -0.058 0.020 -2.950 0.004 -0.035 0.026 -1.327 0.187 -0.019 0.019 -0.990 0.324 -0.052 0.035 -1.489 0.139 -0.017 0.021 -0.820 0.413
Company Pressured to Transact 0.008 0.032 0.254 0.800 -0.030 0.043 -0.707 0.481 0.006 0.031 0.184 0.855 0.029 0.058 0.511 0.610 0.095 0.034 2.803 0.006
Critical Deal for Acquirer -0.010 0.025 -0.418 0.677 0.020 0.033 0.600 0.550 0.014 0.024 0.566 0.572 0.012 0.044 0.271 0.787 0.070 0.026 2.697 0.008
Multi State Transaction 0.094 0.025 3.773 0.000 0.019 0.033 0.569 0.570 0.008 0.024 0.308 0.759 0.042 0.045 0.935 0.351 -0.017 0.026 -0.632 0.529
Overlapping States -0.060 0.020 -3.009 0.003 -0.022 0.027 -0.812 0.418 -0.016 0.020 -0.823 0.412 -0.040 0.036 -1.107 0.270 -0.040 0.021 -1.887 0.061
Multi Business Segment Transaction -0.164 0.030 -5.534 0.000 -0.036 0.039 -0.918 0.360 -0.060 0.029 -2.064 0.041 -0.066 0.053 -1.240 0.217 -0.142 0.031 -4.529 0.000
Electric Power
B SE t p B SE t p B SE t p B SE t p B SE t p
(Constant) -0.054 0.047 -1.134 0.261 -0.012 0.032 -0.384 0.702 -0.010 0.066 -0.155 0.878 0.038 0.064 0.600 0.551 0.104 0.072 1.436 0.156
Like Buying Like Businesses -0.186 0.027 -6.900 0.000 -0.067 0.018 -3.653 0.001 -0.030 0.038 -0.789 0.433 0.030 0.036 0.814 0.419 0.010 0.041 0.251 0.803
Lag from Critical Reg Date 0.000 0.000 -1.193 0.238 0.000 0.000 1.050 0.298 0.000 0.001 0.452 0.653 0.000 0.001 0.028 0.978 0.001 0.001 1.996 0.051
Approval Cycle 0.000 0.000 -5.676 0.000 0.000 0.000 -1.662 0.102 0.000 0.000 -0.968 0.337 0.000 0.000 -1.344 0.184 0.000 0.000 -0.972 0.335
Stock Deal 0.036 0.025 1.468 0.148 0.007 0.017 0.393 0.696 0.001 0.034 0.018 0.986 -0.014 0.033 -0.421 0.675 -0.028 0.038 -0.752 0.455
Closed During a Recession -0.176 0.034 -5.230 0.000 -0.171 0.023 -7.468 0.000 -0.008 0.047 -0.165 0.869 0.023 0.045 0.502 0.617 0.086 0.051 1.669 0.100
Announced During a Merger Wave 0.068 0.029 2.378 0.021 0.015 0.020 0.785 0.436 0.002 0.040 0.057 0.955 -0.011 0.039 -0.276 0.784 -0.100 0.044 -2.278 0.026
Experienced M&A Team 0.031 0.021 1.469 0.147 -0.010 0.014 -0.696 0.489 0.000 0.029 0.012 0.991 0.006 0.029 0.215 0.831 -0.024 0.032 -0.729 0.469
Company Pressured to Transact -0.112 0.036 -3.146 0.003 -0.052 0.024 -2.157 0.035 0.008 0.050 0.166 0.869 0.021 0.048 0.436 0.665 0.073 0.054 1.338 0.186
Critical Deal for Acquirer 0.193 0.029 6.661 0.000 0.082 0.020 4.166 0.000 0.071 0.040 1.765 0.083 0.106 0.039 2.716 0.009 0.076 0.044 1.710 0.093
Multi State Transaction -0.057 0.029 -1.992 0.051 0.017 0.020 0.860 0.394 0.006 0.040 0.150 0.881 0.015 0.039 0.393 0.696 0.127 0.044 2.884 0.006
Overlapping States -0.018 0.029 -0.646 0.521 -0.085 0.019 -4.339 0.000 -0.037 0.040 -0.926 0.359 -0.073 0.039 -1.899 0.063 -0.196 0.044 -4.478 0.000
Multi Business Segment Transaction 0.041 0.027 1.539 0.129 -0.002 0.018 -0.131 0.896 0.023 0.038 0.604 0.548 0.027 0.036 0.737 0.464 -0.011 0.041 -0.274 0.785
Quantile:
.10
Quantile:
.25
Quantile:
.50
Quantile:
.75
Quantile:
.90
Quantile:
.10
Quantile:
.25
Quantile:
.50
Quantile:
.75
Quantile:
.90

129
Reconfiguring and Integrating
Reconfiguring and Integrating capability is the capacity to reshape resources
within the target and acquiring firms. This involves the capacity to combine resources from the
target and acquirer in order to create new resources, whether at the target or within the acquirer‟s
original business units or in some new organizational unit. This capability also requires the
capacity to selectively divest unneeded resources from the target as well as old resource for the
acquirer that have become obsolete as a result of the reconfiguration process.
As a proxy to measure the effectiveness of a firm‟s R&I capabilities, long-term
value measurements are most appropriate. Additionally, the market‟s response to the
effectiveness of these capabilities is best evidenced by how it responds when it has an
opportunity to observe how the company performs (operationally and financially) over multiple
reporting cycles. Utilizing value measures up to a year post-closing date of the transaction is an
appropriate gauge of the market‟s judgment of a company‟s R&I capabilities.
Table 21 provides factor differences among Top R&I Performers (those with top
quartile performance in R&I) and Poor R&I Performers (those with bottom quartile performance
in R&I). Significant results are noted (.10 level or better) where means are statistically different.
Some interesting results are noteworthy when comparing the Top versus the Poor Performers.
Top Performers tend to have statistically shorter deal approval cycles, are more likely to transact
during a merger wave and are less likely to attempt a multi business segment transaction than
their Poor Performing peer acquirers.
Three specifications of the R&I variable one weak and two semi-strong are
provided with results provided by industry segment. Model 5 is a semi-strong specification of
RI_BHAR_Clsd_360DAY (BHAR returns on a 0, +360 day event window anchored off of the
closing date). Table 22 provides the OLS regression results for Model 5. Results for each
energy industry segment are provided in the table.
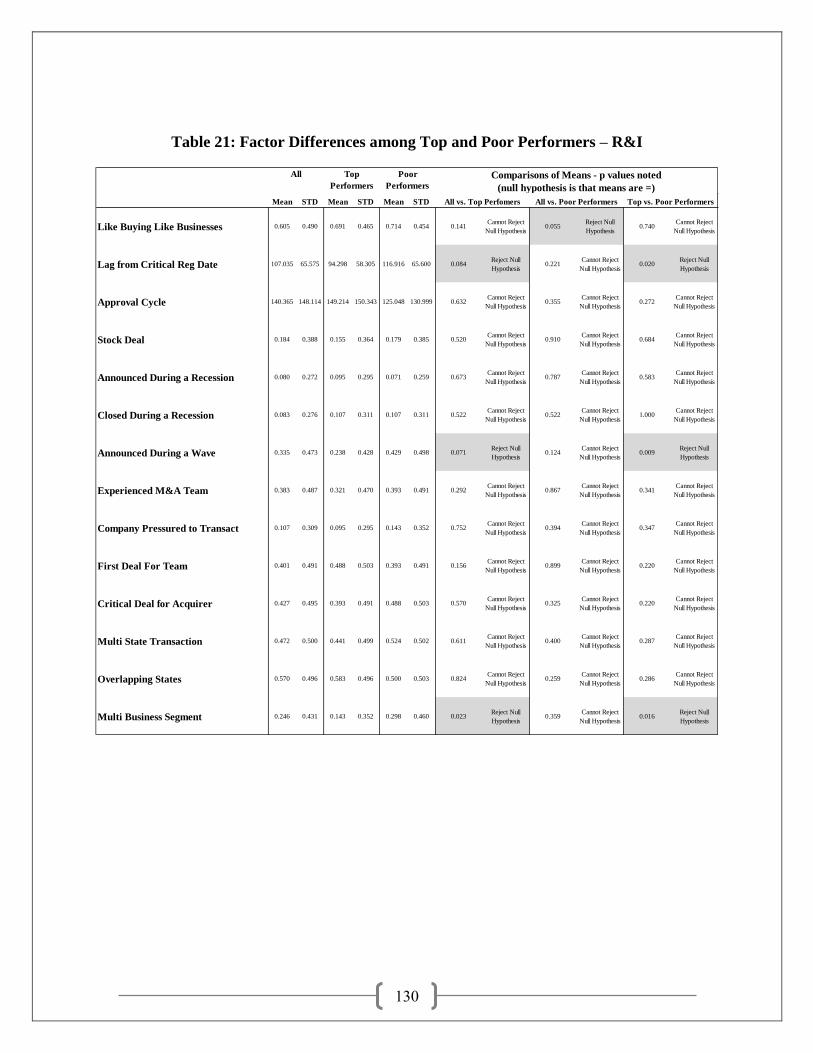
130
Table 21: Factor Differences among Top and Poor Performers – R&I
Mean STD Mean STD Mean STD
Like Buying Like Businesses 0.605 0.490 0.691 0.465 0.714 0.454 0.141Cannot Reject
Null Hypothesis0.055
Reject Null
Hypothesis0.740
Cannot Reject
Null Hypothesis
Lag from Critical Reg Date 107.035 65.575 94.298 58.305 116.916 65.600 0.084Reject Null
Hypothesis0.221
Cannot Reject
Null Hypothesis0.020
Reject Null
Hypothesis
Approval Cycle 140.365 148.114 149.214 150.343 125.048 130.999 0.632Cannot Reject
Null Hypothesis0.355
Cannot Reject
Null Hypothesis0.272
Cannot Reject
Null Hypothesis
Stock Deal 0.184 0.388 0.155 0.364 0.179 0.385 0.520Cannot Reject
Null Hypothesis0.910
Cannot Reject
Null Hypothesis0.684
Cannot Reject
Null Hypothesis
Announced During a Recession 0.080 0.272 0.095 0.295 0.071 0.259 0.673Cannot Reject
Null Hypothesis0.787
Cannot Reject
Null Hypothesis0.583
Cannot Reject
Null Hypothesis
Closed During a Recession 0.083 0.276 0.107 0.311 0.107 0.311 0.522Cannot Reject
Null Hypothesis0.522
Cannot Reject
Null Hypothesis1.000
Cannot Reject
Null Hypothesis
Announced During a Wave 0.335 0.473 0.238 0.428 0.429 0.498 0.071Reject Null
Hypothesis0.124
Cannot Reject
Null Hypothesis0.009
Reject Null
Hypothesis
Experienced M&A Team 0.383 0.487 0.321 0.470 0.393 0.491 0.292Cannot Reject
Null Hypothesis0.867
Cannot Reject
Null Hypothesis0.341
Cannot Reject
Null Hypothesis
Company Pressured to Transact 0.107 0.309 0.095 0.295 0.143 0.352 0.752Cannot Reject
Null Hypothesis0.394
Cannot Reject
Null Hypothesis0.347
Cannot Reject
Null Hypothesis
First Deal For Team 0.401 0.491 0.488 0.503 0.393 0.491 0.156Cannot Reject
Null Hypothesis0.899
Cannot Reject
Null Hypothesis0.220
Cannot Reject
Null Hypothesis
Critical Deal for Acquirer 0.427 0.495 0.393 0.491 0.488 0.503 0.570Cannot Reject
Null Hypothesis0.325
Cannot Reject
Null Hypothesis0.220
Cannot Reject
Null Hypothesis
Multi State Transaction 0.472 0.500 0.441 0.499 0.524 0.502 0.611Cannot Reject
Null Hypothesis0.400
Cannot Reject
Null Hypothesis0.287
Cannot Reject
Null Hypothesis
Overlapping States 0.570 0.496 0.583 0.496 0.500 0.503 0.824Cannot Reject
Null Hypothesis0.259
Cannot Reject
Null Hypothesis0.286
Cannot Reject
Null Hypothesis
Multi Business Segment 0.246 0.431 0.143 0.352 0.298 0.460 0.023Reject Null
Hypothesis0.359
Cannot Reject
Null Hypothesis0.016
Reject Null
Hypothesis
All Top
Performers
n=81
Poor
Performers
Comparisons of Means - p values noted
(null hypothesis is that means are =)
All vs. Top Perfomers All vs. Poor Performers Top vs. Poor Performers

131
Resource: 43.9% of the variation in the dependent variable (the proxy measure of
R&I) is explained by the independent variables. The model provides statistically
meaningful results as the F statistic of 2.822 is significant at the .05 level. The
independent variables: Like Buying Like Businesses and Stock Deal are both
statistically significant at the .01 level. Multicollinearity does not appear to
negatively influence the regression results. Of the 10 predictor variables, 7 have
Variable Inflation Factors (VIFs) below 2.2. Of the three that do not, Critical
Deal (3.8), Multi State (3.7) and Overlapping States (3.0) are all below the
theoretical threshold of 5.0.
Utility: 27.9% of the variation in the dependent variable (the proxy measure of
R&I) is explained by the independent variables. The model provides statistically
meaningful results as the F statistic of 1.998 is significant at the .05 level. The
independent variables: Like Buying Like Businesses and Multi Business Segment
transaction are significant at the .05 level or better. Additionally, the independent
variables of Lag from Critical Reg Date and Announced During a Merger Wave
are significant at the .1 level. Multicollinearity does not appear to negatively
influence the regression results. Of the 12 predictor variables, all 12 have
Variable Inflation Factors (VIFs) below 2.1.
Midstream and Transportation: 22.5% of the variation in the dependent variable
(the proxy measure of R&I) is explained by the independent variables. The model
provides statistically meaningful results as the F statistic of 3.137 is significant at
the .01 level. The independent variables: Like Buying Like Businesses, Lag From
Critical Reg Date, Approval Cycle, Closed During a Recession and Announced
During a Merger Wave and Multi Business Segment Transaction are all
statistically significant at the .05 level or better. Multicollinearity does not appear
to negatively influence the regression results. Of the 12 predictor variables, 10

132
have Variable Inflation Factors (VIFs) below 2.4. Of the two that do not, Lag
from Critical Reg Date (3.9) and Announced During a Merger Wave (3.6) are
both below the theoretical threshold of 5.0.
Electric Power: 17.4% of the variation in the dependent variable (the proxy
measure of S&I) is explained by the independent variables. The model provides
insignificant results as the F statistic of 1.018 is statistically insignificant.

133
Table 22: Model 5 – R&I Buy and Hold 360 Day (0, +360) Returns
B t (sig) B t (sig) B t (sig) B t (sig)
(Constant) -0.126 (-0.509) -0.201 (-1.916) * -0.337 (-2.048) ** -0.044 (-0.278)
Like Buying Like Businesses 0.518 (3.077) *** 0.142 (2.296) ** -0.251 (-3.160) *** -0.008 (-0.083)
Lag from Critical Reg Date 0.001 (0.678) 0.002 (1.820) * 0.003 (2.407) ** 0.001 (0.627)
Approval Cycle -0.001 (-0.458) 0.001 (0.160) 0.002 (2.743) *** 0.001 (1.359)
Stock Deal -0.884 (-3.458) *** 0.114 (1.363) 0.004 (0.471) 0.063 (0.705)
Closed During a Recession -0.165 (-0.618) 0.184 (1.059) -0.282 (-2.157) ** 0.039 (0.324)
Announced During a Merger Wave 0.139 (1.669) * -0.368 (-3.378) *** -0.157 (-1.513)
Experienced M&A Team -0.14 (-0.115) -0.059 (-0.894) -0.075 (-1.081) 0.117 (1.537)
Company Pressured to Transact -0.088 (-0.781) -0.024 (-0.212) 0.227 (1.761) *
Critical Deal for Acquirer -0.183 (-0.893) -0.017 (-0241) -0.006 (-0.069) -0.098 (-0.936)
Multi State Transaction -0.172 (-0.889) 0.069 (0.974) 0.092 (1.041) -0.045 (-0.434)
Overlapping States -0.019 (-0.094) 0.07 (0.107) 0.089 (1.253) -0.164 (-1.591)
Multi Business Segment Transaction 0.188 (1.284) -0.184 (-2.754) *** -0.422 (-4.018) *** -0.223 (-2.293) **
Number of Observations (n)
R-Square
F ** ** ***
Group 1:
Resource Based
Group 2:
Utility
Group 3:
Midstream and
Transportation
Group 4:
Electric Power
46 74 142 70
t statistics in parenthesis, *Indicates significance at .1, **Indicates significance at .05, ***Indicates significance at .01
0.439 0.279 0.225 0.174
2.822 1.998 3.137 1.018

134
Model 5 is a semi-strong specification of RI_BHAR_Clsd_360DAY (BHAR returns on a 0,
+360 day event window anchored off of the closing date). Table 23 provides the quantile
regression results for Model 5. Results for each energy industry segment are provided in the
table.
Resource: 43.9% of the variation in the dependent variable (the proxy measure of
R&I) is explained by the independent variables in the OLS regression results.
The model provides statistically meaningful results as the F statistic of 2.822 is
significant at the .05 level. Results across the quantiles also suggest statistically
significant relationships among the predictor variables and returns evaluated at
various quantiles. Of interest is the result for the variable Like Buying Like
Businesses, where value enhancement is suggested within the first year for
transactions involving similar businesses. Additionally, the predictor variable
Stock Deal was also statistically significant in the OLS regression results but had
generally insignificant results in the quantile regression analysis for R&I returns
for transactions involving Resource companies.
Utility: 27.9% of the variation in the dependent variable (the proxy measure of
R&I) is explained by the independent variables. The model provides statistically
meaningful results as the F statistic of 1.998 is significant at the .05 level.
However, results across the quantiles are somewhat inconclusive, despite the
predictor variables; Like Buying Like Businesses, Lag from Critical Reg Date,
Announced During a Merger Wave and Multi Business Segment Transaction all
being statistically significant in the OLS regression results but had generally
insignificant results in the quantile regression analysis for R&I return of
transactions involving Utility companies.
Midstream and Transportation: 22.5% of the variation in the dependent variable
(the proxy measure of R&I) is explained by the independent variables in the OLS
regression results. The OLS regression model provides statistically meaningful

135
results as the F statistic of 3.137 is significant at the .01 level. Results across the
quantiles also suggest statistically significant relationships among the predictor
variables and returns evaluated at various quantiles. Of interest is the result for
the variable Announced During a Merger Wave which suggests a value decline of
25 to 29% between the quantiles when Midstream acquirers transact during a
merger wave. Similarly, significant value destruction is suggested across the
quantiles when Midstream companies attempt multi business segment
transactions. Additionally, the predictor variables; Like Buying Like Businesses,
Lag from Critical Reg Date, Approval Cycle and Closed During a Recession,
were all statistically significant in the OLS regression results but had general
insignificant outcomes in the quantile regression analysis of R&I returns for
transactions involving Midstream companies.
Electric Power: 17.4% of the variation in the dependent variable (the proxy
measure of S&I) is explained by the independent variables in the OLS regression
results. However, the model provides insignificant results as the F statistic of
1.018 is statistically insignificant. Furthermore, the quantile regression results are
also inconclusive.

136
Table 23: Model 5 Quantile Regression – R&I Buy & Hold 360 Day (0, +360) Returns
Resource Based
B SE t p B SE t p B SE t p B SE t p B SE t p
(Constant) -0.161 0.109 -1.474 0.149 -0.347 0.155 -2.241 0.031 -0.301 0.196 -1.536 0.133 -0.219 0.098 -2.237 0.032 -0.267 0.146 -1.837 0.075
Like Buying Like Businesses 0.403 0.074 5.479 0.000 0.371 0.104 3.562 0.001 0.246 0.132 1.859 0.071 0.151 0.066 2.299 0.027 -0.054 0.098 -0.547 0.588
Lag from Critical Reg Date 0.000 0.001 -0.048 0.962 0.002 0.001 1.933 0.061 0.002 0.001 1.159 0.254 0.000 0.001 0.314 0.756 0.004 0.001 3.746 0.001
Approval Cycle -0.002 0.000 -10.785 0.000 0.000 0.000 0.686 0.497 0.000 0.000 0.145 0.886 0.000 0.000 -0.700 0.488 0.001 0.000 2.893 0.006
Stock Deal -0.959 0.112 -8.585 0.000 -1.140 0.158 -7.202 0.000 -1.147 0.201 -5.718 0.000 0.060 0.100 0.597 0.554 0.133 0.149 0.897 0.376
Closed During a Recession -0.062 0.117 -0.533 0.598 0.006 0.165 0.038 0.970 0.201 0.209 0.961 0.343 0.348 0.104 3.331 0.002 0.397 0.155 2.558 0.015
Experienced M&A Team -0.123 0.053 -2.331 0.025 -0.078 0.074 -1.044 0.303 -0.102 0.094 -1.081 0.287 -0.133 0.047 -2.829 0.008 -0.232 0.070 -3.317 0.002
Critical Deal for Acquirer -0.344 0.089 -3.844 0.000 -0.191 0.127 -1.506 0.141 -0.234 0.161 -1.455 0.154 -0.229 0.080 -2.864 0.007 -0.408 0.119 -3.421 0.002
Multi State Transaction 0.219 0.085 2.578 0.014 -0.001 0.120 -0.007 0.994 -0.014 0.152 -0.091 0.928 0.028 0.076 0.369 0.714 0.262 0.113 2.322 0.026
Overlapping States -0.090 0.086 -1.037 0.307 0.013 0.122 0.104 0.917 0.222 0.155 1.432 0.161 0.138 0.077 1.783 0.083 0.165 0.115 1.435 0.160
Multi Business Segment Transaction 0.220 0.064 3.445 0.001 0.072 0.091 0.799 0.430 -0.081 0.115 -0.704 0.486 -0.090 0.057 -1.566 0.126 -0.410 0.085 -4.814 0.000
Utility
B SE t p B SE t p B SE t p B SE t p B SE t p
(Constant) -0.250 0.110 -2.283 0.026 -0.260 0.097 -2.694 0.009 -0.200 0.108 -1.860 0.068 0.052 0.053 0.972 0.335 0.052 0.053 0.972 0.335
Like Buying Like Businesses -0.051 0.052 -0.987 0.327 -0.003 0.046 -0.056 0.955 0.041 0.051 0.808 0.422 0.009 0.025 0.356 0.723 0.009 0.025 0.356 0.723
Lag from Critical Reg Date 0.002 0.001 1.810 0.075 0.002 0.001 2.632 0.011 0.002 0.001 2.028 0.047 0.001 0.000 1.535 0.130 0.001 0.000 1.535 0.130
Approval Cycle 0.000 0.000 1.304 0.197 0.000 0.000 1.165 0.249 0.000 0.000 0.450 0.655 0.000 0.000 -2.289 0.025 0.000 0.000 -2.289 0.025
Stock Deal 0.287 0.070 4.093 0.000 0.006 0.062 0.089 0.929 0.078 0.069 1.140 0.259 -0.014 0.034 -0.424 0.673 -0.014 0.034 -0.424 0.673
Closed During a Recession -0.003 0.072 -0.036 0.971 0.043 0.063 0.684 0.496 0.029 0.070 0.410 0.683 -0.022 0.035 -0.630 0.531 -0.022 0.035 -0.630 0.531
Announced During a Merger Wave 0.122 0.069 1.757 0.084 -0.037 0.061 -0.612 0.543 -0.181 0.068 -2.655 0.010 -0.010 0.034 -0.303 0.763 -0.010 0.034 -0.303 0.763
Experienced M&A Team 0.104 0.055 1.906 0.061 -0.001 0.048 -0.020 0.984 -0.028 0.054 -0.519 0.606 -0.011 0.027 -0.425 0.672 -0.011 0.027 -0.425 0.672
Company Pressured to Transact -0.286 0.094 -3.031 0.004 0.023 0.083 0.274 0.785 0.179 0.093 1.929 0.058 0.021 0.046 0.469 0.641 0.021 0.046 0.469 0.641
Critical Deal for Acquirer -0.080 0.058 -1.379 0.173 0.006 0.051 0.114 0.909 0.010 0.057 0.173 0.863 -0.046 0.028 -1.619 0.111 -0.046 0.028 -1.619 0.111
Multi State Transaction -0.015 0.059 -0.253 0.801 0.050 0.052 0.956 0.343 0.007 0.058 0.114 0.909 0.048 0.029 1.655 0.103 0.048 0.029 1.655 0.103
Overlapping States 0.082 0.054 1.532 0.131 -0.018 0.047 -0.379 0.706 0.017 0.053 0.314 0.755 -0.022 0.026 -0.833 0.408 -0.022 0.026 -0.833 0.408
Multi Business Segment Transaction -0.165 0.056 -2.950 0.004 -0.192 0.049 -3.913 0.000 -0.083 0.055 -1.506 0.137 0.006 0.027 0.236 0.815 0.006 0.027 0.236 0.815
Quantile:
.10
Quantile:
.25
Quantile:
.50
Quantile:
.75
Quantile:
.90
Quantile:
.10
Quantile:
.25
Quantile:
.50
Quantile:
.75
Quantile:
.90
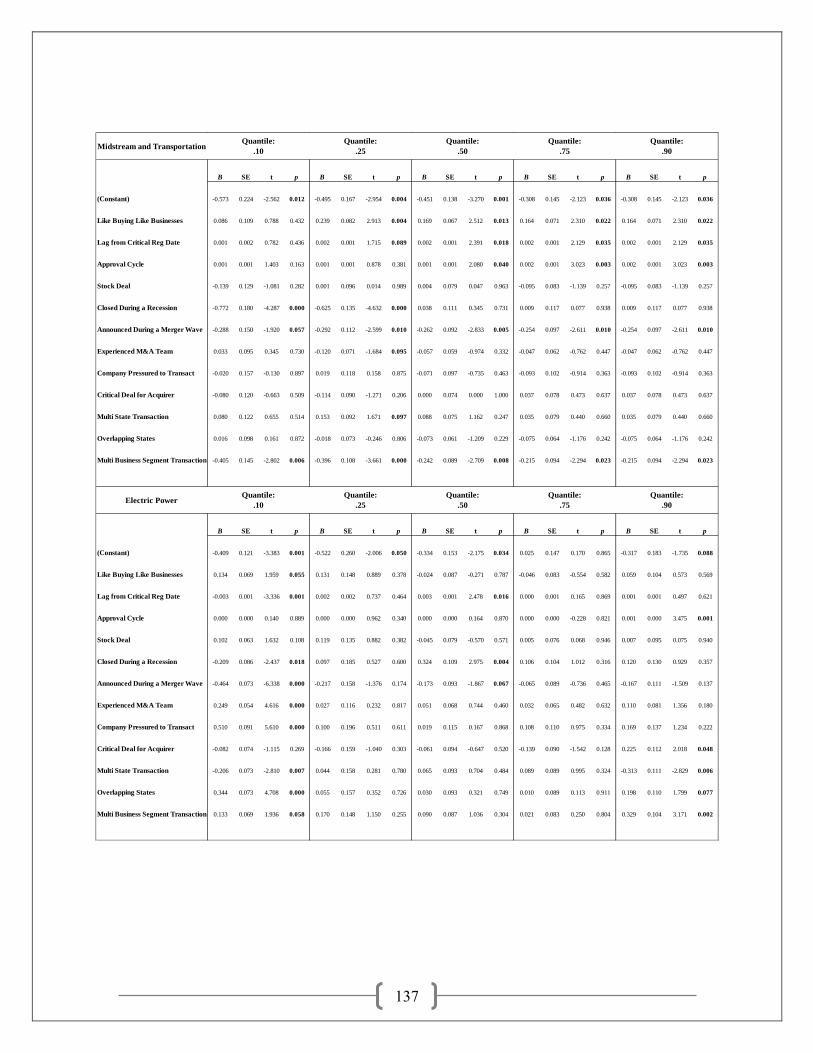
137
Midstream and Transportation
B SE t p B SE t p B SE t p B SE t p B SE t p
(Constant) -0.573 0.224 -2.562 0.012 -0.495 0.167 -2.954 0.004 -0.451 0.138 -3.270 0.001 -0.308 0.145 -2.123 0.036 -0.308 0.145 -2.123 0.036
Like Buying Like Businesses 0.086 0.109 0.788 0.432 0.239 0.082 2.913 0.004 0.169 0.067 2.512 0.013 0.164 0.071 2.310 0.022 0.164 0.071 2.310 0.022
Lag from Critical Reg Date 0.001 0.002 0.782 0.436 0.002 0.001 1.715 0.089 0.002 0.001 2.391 0.018 0.002 0.001 2.129 0.035 0.002 0.001 2.129 0.035
Approval Cycle 0.001 0.001 1.403 0.163 0.001 0.001 0.878 0.381 0.001 0.001 2.080 0.040 0.002 0.001 3.023 0.003 0.002 0.001 3.023 0.003
Stock Deal -0.139 0.129 -1.081 0.282 0.001 0.096 0.014 0.989 0.004 0.079 0.047 0.963 -0.095 0.083 -1.139 0.257 -0.095 0.083 -1.139 0.257
Closed During a Recession -0.772 0.180 -4.287 0.000 -0.625 0.135 -4.632 0.000 0.038 0.111 0.345 0.731 0.009 0.117 0.077 0.938 0.009 0.117 0.077 0.938
Announced During a Merger Wave -0.288 0.150 -1.920 0.057 -0.292 0.112 -2.599 0.010 -0.262 0.092 -2.833 0.005 -0.254 0.097 -2.611 0.010 -0.254 0.097 -2.611 0.010
Experienced M&A Team 0.033 0.095 0.345 0.730 -0.120 0.071 -1.684 0.095 -0.057 0.059 -0.974 0.332 -0.047 0.062 -0.762 0.447 -0.047 0.062 -0.762 0.447
Company Pressured to Transact -0.020 0.157 -0.130 0.897 0.019 0.118 0.158 0.875 -0.071 0.097 -0.735 0.463 -0.093 0.102 -0.914 0.363 -0.093 0.102 -0.914 0.363
Critical Deal for Acquirer -0.080 0.120 -0.663 0.509 -0.114 0.090 -1.271 0.206 0.000 0.074 0.000 1.000 0.037 0.078 0.473 0.637 0.037 0.078 0.473 0.637
Multi State Transaction 0.080 0.122 0.655 0.514 0.153 0.092 1.671 0.097 0.088 0.075 1.162 0.247 0.035 0.079 0.440 0.660 0.035 0.079 0.440 0.660
Overlapping States 0.016 0.098 0.161 0.872 -0.018 0.073 -0.246 0.806 -0.073 0.061 -1.209 0.229 -0.075 0.064 -1.176 0.242 -0.075 0.064 -1.176 0.242
Multi Business Segment Transaction -0.405 0.145 -2.802 0.006 -0.396 0.108 -3.661 0.000 -0.242 0.089 -2.709 0.008 -0.215 0.094 -2.294 0.023 -0.215 0.094 -2.294 0.023
Electric Power
B SE t p B SE t p B SE t p B SE t p B SE t p
(Constant) -0.409 0.121 -3.383 0.001 -0.522 0.260 -2.006 0.050 -0.334 0.153 -2.175 0.034 0.025 0.147 0.170 0.865 -0.317 0.183 -1.735 0.088
Like Buying Like Businesses 0.134 0.069 1.959 0.055 0.131 0.148 0.889 0.378 -0.024 0.087 -0.271 0.787 -0.046 0.083 -0.554 0.582 0.059 0.104 0.573 0.569
Lag from Critical Reg Date -0.003 0.001 -3.336 0.001 0.002 0.002 0.737 0.464 0.003 0.001 2.478 0.016 0.000 0.001 0.165 0.869 0.001 0.001 0.497 0.621
Approval Cycle 0.000 0.000 0.140 0.889 0.000 0.000 0.962 0.340 0.000 0.000 0.164 0.870 0.000 0.000 -0.228 0.821 0.001 0.000 3.475 0.001
Stock Deal 0.102 0.063 1.632 0.108 0.119 0.135 0.882 0.382 -0.045 0.079 -0.570 0.571 0.005 0.076 0.068 0.946 0.007 0.095 0.075 0.940
Closed During a Recession -0.209 0.086 -2.437 0.018 0.097 0.185 0.527 0.600 0.324 0.109 2.975 0.004 0.106 0.104 1.012 0.316 0.120 0.130 0.929 0.357
Announced During a Merger Wave -0.464 0.073 -6.338 0.000 -0.217 0.158 -1.376 0.174 -0.173 0.093 -1.867 0.067 -0.065 0.089 -0.736 0.465 -0.167 0.111 -1.509 0.137
Experienced M&A Team 0.249 0.054 4.616 0.000 0.027 0.116 0.232 0.817 0.051 0.068 0.744 0.460 0.032 0.065 0.482 0.632 0.110 0.081 1.356 0.180
Company Pressured to Transact 0.510 0.091 5.610 0.000 0.100 0.196 0.511 0.611 0.019 0.115 0.167 0.868 0.108 0.110 0.975 0.334 0.169 0.137 1.234 0.222
Critical Deal for Acquirer -0.082 0.074 -1.115 0.269 -0.166 0.159 -1.040 0.303 -0.061 0.094 -0.647 0.520 -0.139 0.090 -1.542 0.128 0.225 0.112 2.018 0.048
Multi State Transaction -0.206 0.073 -2.810 0.007 0.044 0.158 0.281 0.780 0.065 0.093 0.704 0.484 0.089 0.089 0.995 0.324 -0.313 0.111 -2.829 0.006
Overlapping States 0.344 0.073 4.708 0.000 0.055 0.157 0.352 0.726 0.030 0.093 0.321 0.749 0.010 0.089 0.113 0.911 0.198 0.110 1.799 0.077
Multi Business Segment Transaction 0.133 0.069 1.936 0.058 0.170 0.148 1.150 0.255 0.090 0.087 1.036 0.304 0.021 0.083 0.250 0.804 0.329 0.104 3.171 0.002
Quantile:
.10
Quantile:
.25
Quantile:
.50
Quantile:
.75
Quantile:
.90
Quantile:
.10
Quantile:
.25
Quantile:
.50
Quantile:
.75
Quantile:
.90

138
Model 6 is a semi-strong form RI_CAR_Clsd_360DAY (CAR returns on a 0, +360 day event
window anchored off of the closing date) Table 24 provides the OLS regression results for
Model 6. Results for each energy industry segment are provided in the table.
Resource: 41.2% of the variation in the dependent variable (the proxy measure of
R&I) is explained by the independent variables. The model provides statistically
meaningful results as the F statistic of 2.526 is significant at the .05 level. The
independent variables: Like Buying Like Businesses and Stock Deal are both
statistically significant at the .05 level or better. Of the 10 predictor variables, 7
have Variable Inflation Factors (VIFs) below 2.2. Of the three that do not Critical
Deal (3.8), Multi State (3.7) and Overlapping States (3.0) are all below the
theoretical threshold of 5.0.
Utility: 24.5% of the variation in the dependent variable (the proxy measure of
R&I) is explained by the independent variables. The model provides statistically
meaningful results as the F statistic of 1.676 is significant at the .1 level. The
independent variables: Announced During a Merger Wave, Experienced M&A
Team and Multi-State Transaction are all significant at the .05 level while the
independent variable Company Pressured to Transact is significant at the .1 level.
Multicollinearity does not appear to negatively influence the regression results.
Of the 12 predictor variables all 12 have Variable Inflation Factors (VIFs) below
2.0.
Midstream and Transportation: 19.8% of the variation in the dependent variable
(the proxy measure of R&I) is explained by the independent variables. The model
provides statistically significant results as the F statistic of 2.676 is significant at
the .01 level. The independent variables: Like Buying Like Businesses, Approval
Cycle, Announced During a Merger Wave and Multi Business Transaction are all
statistically significant at the .05 level or better. Of the 12 predictor variables, 10
have Variable Inflation Factors (VIFs) below 2.4. Of the two that do not Lag

139
from Critical Reg Date (3.9) and Announced During a Merger Wave (3.6) are
both below the theoretical threshold of 5.0.
Electric Power: 13.8% of the variation in the dependent variable (the proxy
measure of S&I) is explained by the independent variables. The model provides
insignificant results as the F statistic of 0.774 is statistically insignificant.
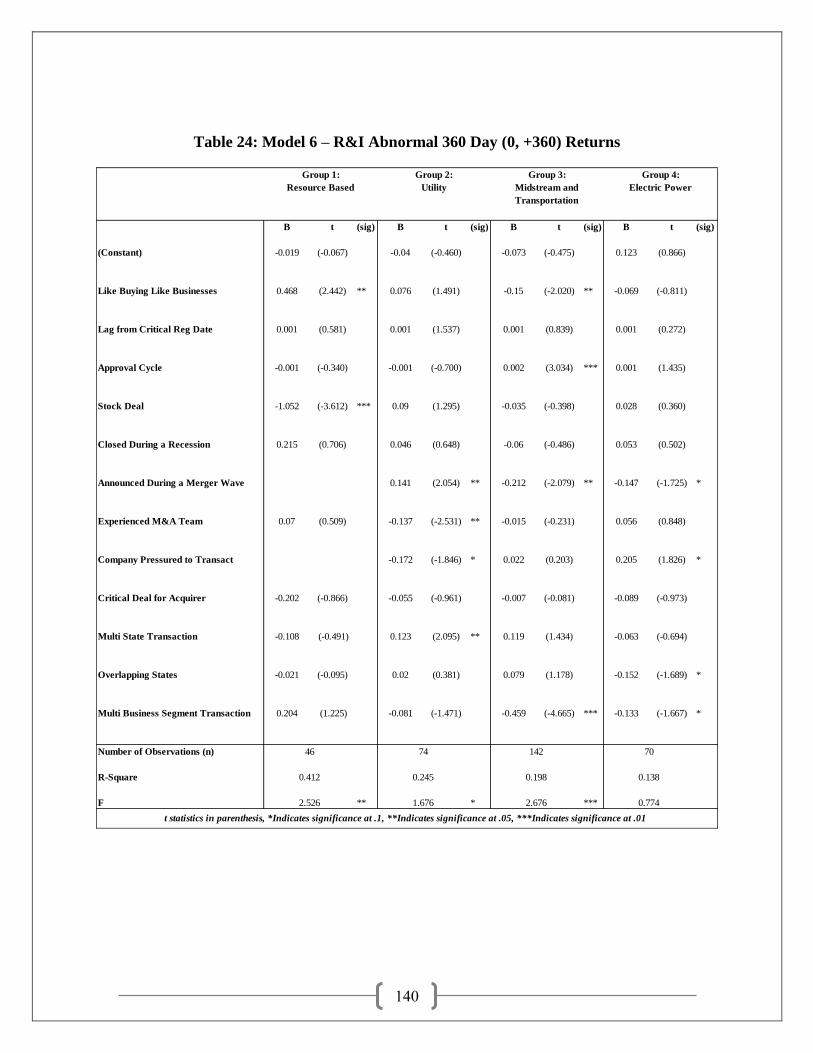
140
Table 24: Model 6 – R&I Abnormal 360 Day (0, +360) Returns
B t (sig) B t (sig) B t (sig) B t (sig)
(Constant) -0.019 (-0.067) -0.04 (-0.460) -0.073 (-0.475) 0.123 (0.866)
Like Buying Like Businesses 0.468 (2.442) ** 0.076 (1.491) -0.15 (-2.020) ** -0.069 (-0.811)
Lag from Critical Reg Date 0.001 (0.581) 0.001 (1.537) 0.001 (0.839) 0.001 (0.272)
Approval Cycle -0.001 (-0.340) -0.001 (-0.700) 0.002 (3.034) *** 0.001 (1.435)
Stock Deal -1.052 (-3.612) *** 0.09 (1.295) -0.035 (-0.398) 0.028 (0.360)
Closed During a Recession 0.215 (0.706) 0.046 (0.648) -0.06 (-0.486) 0.053 (0.502)
Announced During a Merger Wave 0.141 (2.054) ** -0.212 (-2.079) ** -0.147 (-1.725) *
Experienced M&A Team 0.07 (0.509) -0.137 (-2.531) ** -0.015 (-0.231) 0.056 (0.848)
Company Pressured to Transact -0.172 (-1.846) * 0.022 (0.203) 0.205 (1.826) *
Critical Deal for Acquirer -0.202 (-0.866) -0.055 (-0.961) -0.007 (-0.081) -0.089 (-0.973)
Multi State Transaction -0.108 (-0.491) 0.123 (2.095) ** 0.119 (1.434) -0.063 (-0.694)
Overlapping States -0.021 (-0.095) 0.02 (0.381) 0.079 (1.178) -0.152 (-1.689) *
Multi Business Segment Transaction 0.204 (1.225) -0.081 (-1.471) -0.459 (-4.665) *** -0.133 (-1.667) *
Number of Observations (n)
R-Square
F ** * ***
Group 1:
Resource Based
Group 2:
Utility
Group 3:
Midstream and
Transportation
Group 4:
Electric Power
46 74 142 70
t statistics in parenthesis, *Indicates significance at .1, **Indicates significance at .05, ***Indicates significance at .01
0.412 0.245 0.198 0.138
2.526 1.676 2.676 0.774

141
Model 6 is a semi-strong form RI_CAR_Clsd_360DAY (CAR returns on a 0, +360 day event
window anchored off of the closing date) Table 25 provides the Quantile regression results for
Model 6. Results for each energy industry segment are provided in the table.
Resource: 41.2% of the variation in the dependent variable (the proxy measure of
R&I) is explained by the independent variables in the OLS regression results.
The model provides statistically meaningful results as the F statistic of 2.526 is
significant at the .05 level. However, results across the quantiles are somewhat
inconclusive, despite the fact that the predictor variables; Like Buying Like
Businesses and Stock Deal, were both statistically significant in the OLS
regression results but had generally insignificant outcomes in the quantile
regression analysis of R&I returns for transactions involving Resource companies.
Utility: 24.5% of the variation in the dependent variable (the proxy measure of
R&I) is explained by the independent variables in the OLS regression results.
The model provides statistically meaningful results as the F statistic of 1.676 is
significant at the .1 level. However, results across the quantiles are somewhat
inconclusive, despite the fact that the predictor variables; Announced During a
Merger Wave, Company Pressured to Transact, Experienced M&A Team and
Multi-State Transaction, were all statistically significant in the OLS regression
results but had generally insignificant outcomes in the quantile regression analysis
of R&I returns for transactions involving Utility companies.
Midstream and Transportation: 19.8% of the variation in the dependent variable
(the proxy measure of R&I) is explained by the independent variables in the OLS
regression results. The model provides statistically significant results as the F
statistic of 2.676 is significant at the .01 level. Results across the quantiles also
suggest statistically significant relationships among the predictor variables and

142
returns evaluated at various quantiles. Of interest is the result for the variable
Multi Business Segment Transaction which suggests value destruction of 22 to
52% for Midstream transactions that involve multi business segments (holding all
other factors equal). Additionally, the predictor variables; Like Buying Like
Businesses, Approval Cycle and Announced During a Merger Wave were all
statistically significant in the OLS regression results but had general insignificant
outcomes in the quantile regression analysis of R&I returns for transactions
involving Midstream companies.
Electric Power: 13.8% of the variation in the dependent variable (the proxy
measure of S&I) is explained by the independent variables in the OLS regression
results. The model provides insignificant results as the F statistic of 0.774 is
statistically insignificant. Furthermore, the quantile regression results are also
inconclusive.
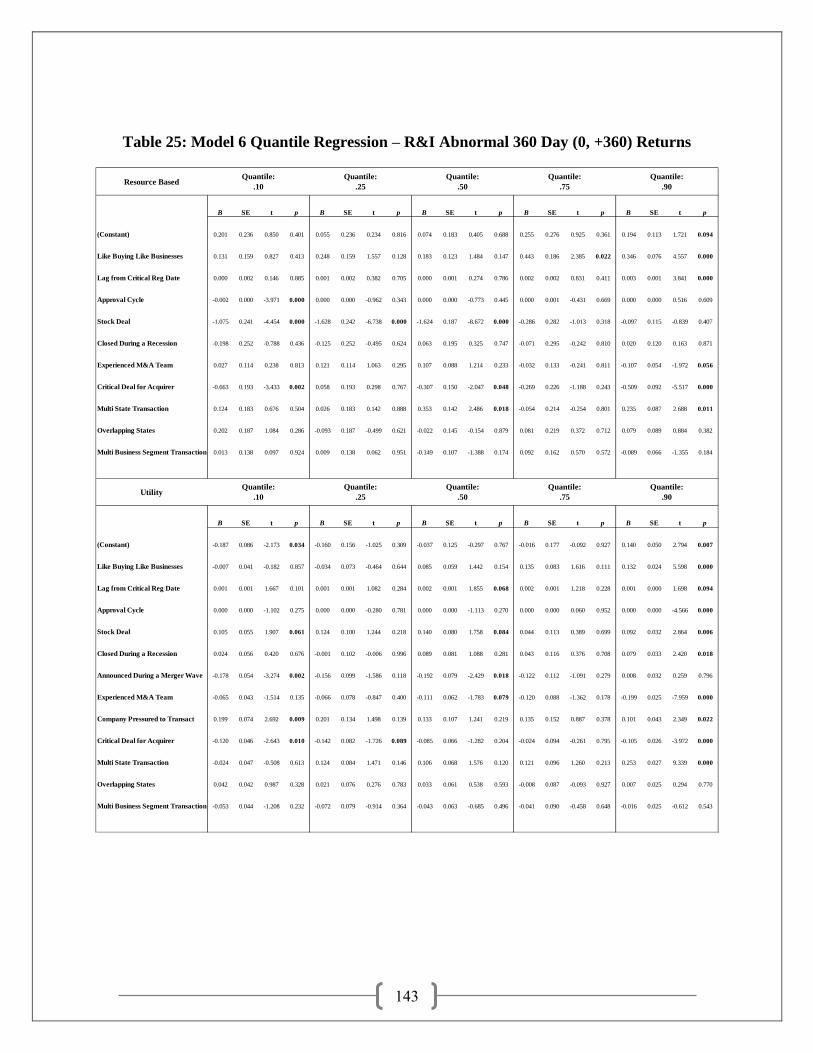
143
Table 25: Model 6 Quantile Regression – R&I Abnormal 360 Day (0, +360) Returns
Resource Based
B SE t p B SE t p B SE t p B SE t p B SE t p
(Constant) 0.201 0.236 0.850 0.401 0.055 0.236 0.234 0.816 0.074 0.183 0.405 0.688 0.255 0.276 0.925 0.361 0.194 0.113 1.721 0.094
Like Buying Like Businesses 0.131 0.159 0.827 0.413 0.248 0.159 1.557 0.128 0.183 0.123 1.484 0.147 0.443 0.186 2.385 0.022 0.346 0.076 4.557 0.000
Lag from Critical Reg Date 0.000 0.002 0.146 0.885 0.001 0.002 0.382 0.705 0.000 0.001 0.274 0.786 0.002 0.002 0.831 0.411 0.003 0.001 3.841 0.000
Approval Cycle -0.002 0.000 -3.971 0.000 0.000 0.000 -0.962 0.343 0.000 0.000 -0.773 0.445 0.000 0.001 -0.431 0.669 0.000 0.000 0.516 0.609
Stock Deal -1.075 0.241 -4.454 0.000 -1.628 0.242 -6.738 0.000 -1.624 0.187 -8.672 0.000 -0.286 0.282 -1.013 0.318 -0.097 0.115 -0.839 0.407
Closed During a Recession -0.198 0.252 -0.788 0.436 -0.125 0.252 -0.495 0.624 0.063 0.195 0.325 0.747 -0.071 0.295 -0.242 0.810 0.020 0.120 0.163 0.871
Experienced M&A Team 0.027 0.114 0.238 0.813 0.121 0.114 1.063 0.295 0.107 0.088 1.214 0.233 -0.032 0.133 -0.241 0.811 -0.107 0.054 -1.972 0.056
Critical Deal for Acquirer -0.663 0.193 -3.433 0.002 0.058 0.193 0.298 0.767 -0.307 0.150 -2.047 0.048 -0.269 0.226 -1.188 0.243 -0.509 0.092 -5.517 0.000
Multi State Transaction 0.124 0.183 0.676 0.504 0.026 0.183 0.142 0.888 0.353 0.142 2.486 0.018 -0.054 0.214 -0.254 0.801 0.235 0.087 2.688 0.011
Overlapping States 0.202 0.187 1.084 0.286 -0.093 0.187 -0.499 0.621 -0.022 0.145 -0.154 0.879 0.081 0.219 0.372 0.712 0.079 0.089 0.884 0.382
Multi Business Segment Transaction 0.013 0.138 0.097 0.924 0.009 0.138 0.062 0.951 -0.149 0.107 -1.388 0.174 0.092 0.162 0.570 0.572 -0.089 0.066 -1.355 0.184
Utility
B SE t p B SE t p B SE t p B SE t p B SE t p
(Constant) -0.187 0.086 -2.173 0.034 -0.160 0.156 -1.025 0.309 -0.037 0.125 -0.297 0.767 -0.016 0.177 -0.092 0.927 0.140 0.050 2.794 0.007
Like Buying Like Businesses -0.007 0.041 -0.182 0.857 -0.034 0.073 -0.464 0.644 0.085 0.059 1.442 0.154 0.135 0.083 1.616 0.111 0.132 0.024 5.598 0.000
Lag from Critical Reg Date 0.001 0.001 1.667 0.101 0.001 0.001 1.082 0.284 0.002 0.001 1.855 0.068 0.002 0.001 1.218 0.228 0.001 0.000 1.698 0.094
Approval Cycle 0.000 0.000 -1.102 0.275 0.000 0.000 -0.280 0.781 0.000 0.000 -1.113 0.270 0.000 0.000 0.060 0.952 0.000 0.000 -4.566 0.000
Stock Deal 0.105 0.055 1.907 0.061 0.124 0.100 1.244 0.218 0.140 0.080 1.758 0.084 0.044 0.113 0.389 0.699 0.092 0.032 2.864 0.006
Closed During a Recession 0.024 0.056 0.420 0.676 -0.001 0.102 -0.006 0.996 0.089 0.081 1.088 0.281 0.043 0.116 0.376 0.708 0.079 0.033 2.420 0.018
Announced During a Merger Wave -0.178 0.054 -3.274 0.002 -0.156 0.099 -1.586 0.118 -0.192 0.079 -2.429 0.018 -0.122 0.112 -1.091 0.279 0.008 0.032 0.259 0.796
Experienced M&A Team -0.065 0.043 -1.514 0.135 -0.066 0.078 -0.847 0.400 -0.111 0.062 -1.783 0.079 -0.120 0.088 -1.362 0.178 -0.199 0.025 -7.959 0.000
Company Pressured to Transact 0.199 0.074 2.692 0.009 0.201 0.134 1.498 0.139 0.133 0.107 1.241 0.219 0.135 0.152 0.887 0.378 0.101 0.043 2.349 0.022
Critical Deal for Acquirer -0.120 0.046 -2.643 0.010 -0.142 0.082 -1.726 0.089 -0.085 0.066 -1.282 0.204 -0.024 0.094 -0.261 0.795 -0.105 0.026 -3.972 0.000
Multi State Transaction -0.024 0.047 -0.508 0.613 0.124 0.084 1.471 0.146 0.106 0.068 1.576 0.120 0.121 0.096 1.260 0.213 0.253 0.027 9.339 0.000
Overlapping States 0.042 0.042 0.987 0.328 0.021 0.076 0.276 0.783 0.033 0.061 0.538 0.593 -0.008 0.087 -0.093 0.927 0.007 0.025 0.294 0.770
Multi Business Segment Transaction -0.053 0.044 -1.208 0.232 -0.072 0.079 -0.914 0.364 -0.043 0.063 -0.685 0.496 -0.041 0.090 -0.458 0.648 -0.016 0.025 -0.612 0.543
Quantile:
.10
Quantile:
.25
Quantile:
.50
Quantile:
.75
Quantile:
.90
Quantile:
.10
Quantile:
.25
Quantile:
.50
Quantile:
.75
Quantile:
.90

144
Midstream and Transportation
B SE t p B SE t p B SE t p B SE t p B SE t p
(Constant) -0.290 0.171 -1.703 0.091 -0.108 0.143 -0.756 0.451 0.044 0.078 0.570 0.570 0.230 0.166 1.393 0.166 0.211 0.250 0.844 0.400
Like Buying Like Businesses 0.102 0.083 1.227 0.222 0.081 0.070 1.152 0.251 0.064 0.038 1.697 0.092 -0.022 0.081 -0.266 0.791 0.105 0.122 0.857 0.393
Lag from Critical Reg Date 0.000 0.001 0.125 0.901 0.000 0.001 -0.334 0.739 -0.001 0.001 -1.242 0.217 -0.001 0.001 -0.584 0.560 0.000 0.002 0.001 1.000
Approval Cycle 0.001 0.001 1.778 0.078 0.001 0.001 1.344 0.181 0.000 0.000 1.225 0.223 0.001 0.001 1.009 0.315 0.002 0.001 1.744 0.083
Stock Deal 0.041 0.098 0.419 0.676 -0.017 0.082 -0.209 0.835 -0.032 0.045 -0.725 0.470 -0.117 0.095 -1.224 0.223 -0.137 0.144 -0.950 0.344
Closed During a Recession -0.388 0.137 -2.825 0.005 0.003 0.115 0.027 0.979 0.042 0.063 0.678 0.499 0.149 0.133 1.114 0.268 0.200 0.202 0.993 0.323
Announced During a Merger Wave -0.096 0.114 -0.838 0.403 -0.022 0.096 -0.232 0.817 -0.033 0.052 -0.635 0.526 -0.087 0.111 -0.785 0.434 -0.197 0.168 -1.176 0.242
Experienced M&A Team -0.041 0.073 -0.557 0.579 -0.005 0.061 -0.079 0.937 0.054 0.033 1.621 0.107 0.014 0.071 0.198 0.843 0.099 0.107 0.925 0.357
Company Pressured to Transact 0.003 0.120 0.027 0.979 0.007 0.101 0.073 0.942 0.051 0.054 0.932 0.353 0.063 0.116 0.539 0.591 0.042 0.176 0.240 0.811
Critical Deal for Acquirer -0.003 0.092 -0.027 0.978 -0.069 0.077 -0.900 0.370 -0.024 0.042 -0.581 0.562 0.019 0.089 0.210 0.834 0.054 0.134 0.399 0.691
Multi State Transaction 0.042 0.093 0.453 0.651 0.147 0.078 1.876 0.063 0.131 0.042 3.091 0.002 0.128 0.090 1.413 0.160 0.216 0.137 1.582 0.116
Overlapping States 0.038 0.075 0.511 0.610 -0.016 0.063 -0.259 0.796 -0.042 0.034 -1.247 0.215 -0.083 0.073 -1.139 0.257 -0.127 0.110 -1.156 0.250
Multi Business Segment Transaction -0.394 0.110 -3.568 0.001 -0.292 0.093 -3.154 0.002 -0.226 0.050 -4.510 0.000 -0.258 0.107 -2.410 0.017 -0.521 0.162 -3.224 0.002
Electric Power
B SE t p B SE t p B SE t p B SE t p B SE t p
(Constant) -0.197 0.100 -1.966 0.054 -0.315 0.132 -2.384 0.020 -0.186 0.107 -1.731 0.089 -0.024 0.203 -0.118 0.906 0.106 0.132 0.805 0.424
Like Buying Like Businesses 0.227 0.057 3.997 0.000 0.126 0.075 1.679 0.099 0.019 0.061 0.320 0.750 -0.061 0.115 -0.532 0.597 -0.136 0.075 -1.818 0.074
Lag from Critical Reg Date -0.002 0.001 -2.012 0.049 0.001 0.001 1.187 0.240 0.002 0.001 1.839 0.071 -0.001 0.002 -0.920 0.361 -0.002 0.001 -1.539 0.129
Approval Cycle 0.000 0.000 -1.161 0.250 0.000 0.000 1.214 0.230 0.000 0.000 0.827 0.412 0.000 0.000 1.100 0.276 0.000 0.000 1.942 0.057
Stock Deal 0.139 0.052 2.690 0.009 0.009 0.068 0.133 0.895 0.001 0.056 0.023 0.982 0.053 0.105 0.505 0.615 0.048 0.069 0.704 0.484
Closed During a Recession -0.136 0.071 -1.919 0.060 0.092 0.094 0.982 0.330 0.203 0.076 2.672 0.010 0.059 0.144 0.412 0.682 -0.047 0.094 -0.498 0.620
Announced During a Merger Wave -0.446 0.061 -7.373 0.000 -0.291 0.080 -3.638 0.001 -0.034 0.065 -0.523 0.603 -0.012 0.123 -0.094 0.926 -0.077 0.080 -0.958 0.342
Experienced M&A Team 0.071 0.045 1.585 0.119 0.047 0.059 0.801 0.426 0.003 0.048 0.071 0.944 0.078 0.090 0.863 0.392 0.109 0.059 1.847 0.070
Company Pressured to Transact 0.617 0.075 8.213 0.000 0.281 0.099 2.835 0.006 0.008 0.081 0.102 0.919 0.185 0.153 1.211 0.231 0.276 0.099 2.775 0.007
Critical Deal for Acquirer -0.105 0.061 -1.718 0.091 -0.136 0.081 -1.683 0.098 -0.090 0.066 -1.366 0.177 -0.036 0.124 -0.290 0.773 -0.068 0.081 -0.837 0.406
Multi State Transaction -0.157 0.061 -2.583 0.012 -0.040 0.080 -0.502 0.617 -0.028 0.065 -0.423 0.674 -0.032 0.123 -0.263 0.793 -0.140 0.080 -1.747 0.086
Overlapping States 0.219 0.060 3.625 0.001 0.086 0.080 1.084 0.283 0.121 0.065 1.877 0.066 0.128 0.123 1.044 0.301 0.198 0.080 2.482 0.016
Multi Business Segment Transaction -0.028 0.057 -0.502 0.618 0.091 0.075 1.212 0.231 0.022 0.061 0.362 0.719 0.190 0.115 1.645 0.105 0.168 0.075 2.244 0.029
Quantile:
.10
Quantile:
.25
Quantile:
.50
Quantile:
.75
Quantile:
.90
Quantile:
.10
Quantile:
.25
Quantile:
.50
Quantile:
.75
Quantile:
.90

145
Model 7 is weak form RI_SIM_Clsd_360DAY (Simple returns on a 0, +360 day event window
anchored off of the closing date) Table 26 provides the OLS regression results for Model 7.
Results for each energy industry segment are provided in the table.
Resource: 44.9% of the variation in the dependent variable (the proxy measure of
R&I) is explained by the independent variables. The model provides statistically
meaningful results as the F statistic of 2.609 is significant at the .05 level. The
independent variables: Like Buying Like Businesses and Stock Deal are both
statistically significant at the .05 level or better. Of the 10 predictor variables, 7
have Variable Inflation Factors (VIFs) below 2.4. Of the three that do not,
Critical Deal (4.1), Multi State (4.6) and Overlapping States (3.1) are all below
the theoretical threshold of 5.0.
Utility: 22.3% of the variation in the dependent variable (the proxy measure of
R&I) is explained by the independent variables. The model provides insignificant
results as the F statistic of 1.389 is statistically insignificant.
Midstream and Transportation: 18.9% of the variation in the dependent variable
(the proxy measure of R&I) is explained by the independent variables. The model
provides statistically significant results as the F statistic of 2.156 is statistically
significant at the .05 level. The independent variables: Like Buying Like
Businesses, Approval Cycle, Announced During a Merger Wave and Multi
Business Segment Transaction are all statistically significant at the .05 level or
better. Multicollinearity does not appear to negatively influence the regression
results. Of the 12 predictor variables, 10 have Variable Inflation Factors (VIFs)
below 2.4. Of the two that do not, Lag from Critical Reg Date (3.8) and
Announced During a Wave (3.1) are both below the theoretical threshold of 5.0.

146
Electric Power: 37.2% of the variation in the dependent variable (the proxy
measure of R&I) is explained by the independent variables. The model provides
statistically significant results as the F statistic of 2.668 is statistically significant
at the .01 level. The independent variables: Announced During a Merger Wave,
Company Pressured to Transact and Multi Business Segment Transaction are all
statistically significant at the .05 level or better. Additionally, the independent
variable Approval Cycle is significant at the .1 level. Multicollinearity does not
appear to negatively influence the regression results. Of the 12 predictor
variables all 12 have Variable Inflation Factors (VIFs) below 2.6.

147
Table 26: Model 7 – R&I Simple 360 Day (0, +360) Returns
B t (sig) B t (sig) B t (sig) B t (sig)
(Constant) 0.258 (0.826) 0.076 (0.787) 0.087 (0.414) 0.278 (1.848) *
Like Buying Like Businesses 0.564 (2.626) ** 0.079 (1.360) -0.254 (-2.417) ** -0.093 (-1.016)
Lag from Critical Reg Date -0.002 (-0.746) 0.001 (0.297) 0.002 (1.122) -0.001 (-0.072)
Approval Cycle 0.001 (0.150) -0.001 (-0.407) 0.002 (2.103) ** 0.001 (1.708) *
Stock Deal -1.08 (-3.471) *** 0.029 (0.381) 0.038 (0.308) -0.057 (-0.716)
Closed During a Recession -0.197 (-0.626) -0.22 (-2.810) ** -0.232 (-1.491) -0.166 (-1.531)
Announced During a Merger Wave 0.095 (1.249) -0.301 (-2.294) ** -0.401 (-3.847) ***
Experienced M&A Team 0.043 (0.285) -0.079 (-1.266) -0.036 (-0.407) 0.063 (0.905)
Company Pressured to Transact -0.068 (-0.659) 0.019 (0.126) 0.398 (3.105) ***
Critical Deal for Acquirer -0.175 (-0.182) -0.024 (-0.383) -0.046 (-0.397) 0.012 (0.132)
Multi State Transaction -0.255 (-0.958) 0.096 (1.474) 0.059 (0.520) -0.083 (-0.897)
Overlapping States -0.054 (-0.222) 0.018 (0.302) 0.012 (0.128) -0.12 (-1.289)
Multi Business Segment Transaction 0.269 (1.528) -0.031 (-0.499) 0.545 (-4.144) *** -0.198 (-2.254) **
Number of Observations (n)
R-Square
F ** ** ***
Group 1:
Resource Based
Group 2:
Utility
Group 3:
Midstream and
Transportation
Group 4:
Electric Power
42 70 123 66
t statistics in parenthesis, *Indicates significance at .1, **Indicates significance at .05, ***Indicates significance at .01
0.449 0.223 0.189 0.372
2.609 1.389 2.156 2.668

148
Model 7 is weak form RI_SIM_Clsd_360DAY (Simple returns on a 0, +360 day event window
anchored off of the closing date) Table 27 provides the Quantile regression results for Model 7.
Results for each energy industry segment are provided in the table.
Resource: 44.9% of the variation in the dependent variable (the proxy measure of
R&I) is explained by the independent variables in the OLS regression results.
The model provides statistically meaningful results as the F statistic of 2.609 is
significant at the .05 level. Results across the quantiles also suggest statistically
significant relationships among the predictor variables and returns evaluated at
various quantiles. Of interest is the result for the variable Like Buying Like
Business which suggests considerable value enhancement at the lower quartiles
for Resource acquirers buying similar types of companies but value destruction
for Resource companies in the highest quantiles for companies pursuing the same
strategies. Additionally, the predictor variable Stock Deal was statistically
significant in the OLS regression results but had generally insignificant results in
the quantile regression analysis of R&I returns for transactions involving
Resource companies.
Utility: 22.3% of the variation in the dependent variable (the proxy measure of
R&I) is explained by the independent variables. The model provides insignificant
results as the F statistic of 1.389 is statistically insignificant. Furthermore, the
quantile regression results are inconclusive.
Midstream and Transportation: 18.9% of the variation in the dependent variable
(the proxy measure of R&I) is explained by the independent variables in the OLS
regression results. The model provides statistically significant results as the F
statistic of 2.156 is statistically significant at the .05 level. Results across the
quantiles also suggest statistically significant relationships among the predictor

149
variables and returns evaluated at various quantiles. Of interest is the result for
the variable Multi Business Segment Transaction which suggests value
destruction of 33 to 58% for Midstream transactions that involve multi business
segments (holding all other factors equal) by end of the first year. Additionally,
the predictor variables; Like Buying Like Businesses, Announced During a
Merger Wave and Approval Cycle were statistically significant in the OLS
regression results but had mixed results in the quantile regression analysis of R&I
returns for transactions involving Midstream companies.
Electric Power: 37.2% of the variation in the dependent variable (the proxy
measure of R&I) is explained by the independent variables in the OLS regression
results. The model provides statistically significant results as the F statistic of
2.668 is statistically significant at the .01 level. Results across the quantiles also
suggest statistically significant relationships among the predictor variables and
returns evaluated at various quantiles. Of interest is the result for the variable
Company Pressured to Transact which suggests considerable value enhancement
when Electric acquirers transact as a result of market pressure. Whereas, the
quantile results suggest significant value destruction for Electric companies
acquiring during a merger wave. Additionally, the predictor variables; Approval
Cycle and Multi Business Segment Transaction were both statistically significant
in the OLS regression results but had general insignificant outcomes in the
quantile regression analysis of R&I returns for transactions involving Electric
Power companies.

150
Table 27: Model 7 Quantile Regression – Simple 360 Day (0, +360) Returns
Resource Based
B SE t p B SE t p B SE t p B SE t p B SE t p
(Constant) 0.135 0.273 0.494 0.624 -0.132 0.281 -0.469 0.642 0.078 0.247 0.316 0.754 -0.004 0.077 -0.048 0.962 0.003 0.039 0.087 0.931
Like Buying Like Businesses 0.471 0.200 2.352 0.025 0.353 0.206 1.711 0.097 0.476 0.182 2.620 0.013 -0.041 0.052 -0.782 0.439 -0.061 0.026 -2.292 0.028
Lag from Critical Reg Date -0.007 0.002 -3.108 0.004 -0.002 0.002 -0.965 0.342 -0.002 0.002 -0.906 0.372 0.000 0.001 0.141 0.889 0.000 0.000 -0.562 0.578
Approval Cycle 0.002 0.001 3.036 0.005 0.000 0.001 0.245 0.808 0.000 0.000 -0.805 0.427 0.000 0.000 -0.347 0.731 0.000 0.000 -0.685 0.497
Stock Deal -0.664 0.290 -2.292 0.029 -1.269 0.299 -4.250 0.000 -1.729 0.263 -6.583 0.000 -0.037 0.079 -0.469 0.642 -0.023 0.040 -0.579 0.566
Closed During a Recession -0.154 0.294 -0.526 0.603 0.168 0.302 0.554 0.584 0.285 0.266 1.070 0.293 0.086 0.083 1.034 0.308 0.113 0.042 2.696 0.011
Experienced M&A Team -0.001 0.140 -0.004 0.997 0.149 0.144 1.032 0.310 0.057 0.127 0.448 0.657 -0.012 0.037 -0.327 0.745 -0.018 0.019 -0.946 0.351
Critical Deal for Acquirer -0.620 0.239 -2.591 0.014 -0.530 0.246 -2.150 0.039 -0.310 0.217 -1.431 0.162 0.059 0.063 0.927 0.360 0.081 0.032 2.526 0.016
Multi State Transaction -0.227 0.248 -0.917 0.366 0.305 0.256 1.193 0.242 0.139 0.225 0.617 0.542 0.046 0.060 0.760 0.452 0.046 0.030 1.502 0.142
Overlapping States 0.184 0.227 0.808 0.425 -0.154 0.234 -0.656 0.516 -0.045 0.206 -0.220 0.827 -0.092 0.061 -1.501 0.142 -0.123 0.031 -3.952 0.000
Multi Business Segment Transaction 0.570 0.164 3.467 0.002 0.280 0.169 1.653 0.108 0.013 0.149 0.088 0.930 -0.034 0.045 -0.758 0.453 -0.031 0.023 -1.344 0.187
Utility
B SE t p B SE t p B SE t p B SE t p B SE t p
(Constant) -0.105 0.091 -1.154 0.253 0.049 0.148 0.332 0.741 0.081 0.085 0.943 0.349 0.246 0.107 2.308 0.025 0.346 0.086 4.018 0.000
Like Buying Like Businesses 0.154 0.044 3.539 0.001 0.105 0.070 1.495 0.140 -0.024 0.041 -0.599 0.552 -0.048 0.051 -0.939 0.352 0.026 0.041 0.620 0.537
Lag from Critical Reg Date -0.001 0.001 -0.971 0.336 0.000 0.001 0.073 0.942 0.001 0.001 1.361 0.179 0.001 0.001 1.167 0.248 -0.001 0.001 -1.123 0.266
Approval Cycle 0.000 0.000 1.795 0.078 0.000 0.000 0.038 0.969 0.000 0.000 -1.500 0.139 0.000 0.000 -0.538 0.593 0.000 0.000 -1.732 0.089
Stock Deal -0.111 0.057 -1.941 0.057 -0.035 0.092 -0.382 0.704 0.046 0.053 0.853 0.397 0.075 0.067 1.121 0.267 0.157 0.054 2.920 0.005
Closed During a Recession -0.176 0.059 -3.004 0.004 -0.145 0.095 -1.531 0.131 -0.122 0.055 -2.230 0.030 -0.124 0.068 -1.804 0.076 -0.268 0.055 -4.850 0.000
Announced During a Merger Wave -0.311 0.057 -5.481 0.000 -0.159 0.092 -1.731 0.089 -0.074 0.053 -1.401 0.167 0.019 0.066 0.280 0.780 0.060 0.054 1.118 0.268
Experienced M&A Team -0.148 0.047 -3.161 0.002 0.004 0.075 0.054 0.957 -0.057 0.044 -1.310 0.195 -0.004 0.055 -0.065 0.949 -0.117 0.044 -2.660 0.010
Company Pressured to Transact 0.231 0.077 2.999 0.004 0.048 0.125 0.381 0.704 0.096 0.072 1.330 0.189 -0.142 0.090 -1.570 0.122 -0.024 0.073 -0.326 0.745
Critical Deal for Acquirer -0.044 0.048 -0.926 0.358 -0.031 0.077 -0.399 0.692 0.002 0.045 0.048 0.962 -0.007 0.056 -0.125 0.901 -0.127 0.045 -2.816 0.007
Multi State Transaction 0.158 0.049 3.249 0.002 -0.004 0.079 -0.048 0.962 0.049 0.045 1.084 0.283 0.112 0.057 1.975 0.053 0.182 0.046 3.979 0.000
Overlapping States -0.006 0.044 -0.142 0.888 0.030 0.072 0.418 0.677 0.016 0.041 0.396 0.693 0.040 0.052 0.780 0.438 0.074 0.042 1.765 0.083
Multi Business Segment Transaction -0.112 0.046 -2.422 0.019 -0.040 0.075 -0.532 0.597 -0.051 0.043 -1.190 0.239 0.028 0.054 0.524 0.603 0.064 0.043 1.479 0.145
Quantile:
.10
Quantile:
.25
Quantile:
.50
Quantile:
.75
Quantile:
.90
Quantile:
.10
Quantile:
.25
Quantile:
.50
Quantile:
.75
Quantile:
.90

151
Midstream and Transportation
B SE t p B SE t p B SE t p B SE t p B SE t p
(Constant) -0.070 0.309 -0.225 0.822 -0.117 0.172 -0.679 0.498 -0.132 0.184 -0.716 0.475 0.001 0.166 0.004 0.997 0.013 0.160 0.082 0.935
Like Buying Like Businesses 0.143 0.151 0.950 0.344 0.085 0.084 1.010 0.315 0.064 0.090 0.715 0.476 0.268 0.081 3.302 0.001 0.427 0.078 5.466 0.000
Lag from Critical Reg Date -0.004 0.002 -1.692 0.093 -0.001 0.001 -0.494 0.622 0.002 0.001 1.497 0.137 0.002 0.001 1.301 0.196 0.003 0.001 2.264 0.026
Approval Cycle 0.003 0.001 2.045 0.043 0.002 0.001 2.409 0.018 0.002 0.001 1.987 0.049 0.001 0.001 1.432 0.155 0.001 0.001 1.135 0.259
Stock Deal -0.370 0.175 -2.115 0.037 -0.044 0.097 -0.450 0.654 0.004 0.104 0.042 0.966 -0.016 0.094 -0.173 0.863 0.008 0.091 0.092 0.927
Closed During a Recession -0.477 0.223 -2.134 0.035 -0.414 0.124 -3.332 0.001 -0.156 0.133 -1.171 0.244 0.005 0.120 0.039 0.969 0.283 0.116 2.449 0.016
Announced During a Merger Wave 0.167 0.188 0.886 0.377 -0.095 0.105 -0.911 0.364 -0.315 0.112 -2.810 0.006 -0.182 0.101 -1.794 0.076 -0.274 0.097 -2.815 0.006
Experienced M&A Team 0.139 0.128 1.092 0.277 0.023 0.071 0.323 0.748 -0.085 0.076 -1.119 0.266 -0.039 0.069 -0.570 0.570 0.039 0.066 0.588 0.558
Company Pressured to Transact 0.231 0.216 1.068 0.288 0.103 0.120 0.858 0.393 0.070 0.129 0.542 0.589 0.068 0.116 0.584 0.560 0.091 0.112 0.814 0.418
Critical Deal for Acquirer 0.000 0.165 0.000 1.000 -0.058 0.092 -0.633 0.528 -0.125 0.098 -1.278 0.204 -0.055 0.089 -0.616 0.539 -0.069 0.085 -0.811 0.419
Multi State Transaction -0.057 0.163 -0.352 0.726 0.120 0.091 1.320 0.190 0.161 0.097 1.655 0.101 0.104 0.088 1.185 0.239 0.125 0.084 1.476 0.143
Overlapping States 0.163 0.133 1.233 0.220 0.121 0.074 1.637 0.104 -0.002 0.079 -0.024 0.981 -0.011 0.071 -0.151 0.880 -0.134 0.069 -1.955 0.053
Multi Business Segment Transaction -0.325 0.188 -1.724 0.088 -0.339 0.105 -3.234 0.002 -0.422 0.112 -3.757 0.000 -0.330 0.101 -3.252 0.002 -0.580 0.097 -5.955 0.000
Electric Power
B SE t p B SE t p B SE t p B SE t p B SE t p
(Constant) -0.303 0.176 -1.726 0.090 -0.116 0.271 -0.428 0.670 -0.166 0.153 -1.090 0.281 -0.166 0.153 -1.090 0.281 0.177 0.161 1.101 0.276
Like Buying Like Businesses 0.346 0.104 3.317 0.002 0.144 0.161 0.894 0.375 0.080 0.091 0.876 0.385 0.080 0.091 0.876 0.385 0.024 0.096 0.255 0.799
Lag from Critical Reg Date 0.000 0.002 -0.120 0.905 -0.001 0.002 -0.234 0.816 0.000 0.001 0.273 0.786 0.000 0.001 0.273 0.786 0.000 0.001 -0.011 0.991
Approval Cycle 0.001 0.000 2.251 0.029 0.000 0.000 0.887 0.379 0.000 0.000 1.087 0.282 0.000 0.000 1.087 0.282 0.000 0.000 0.588 0.559
Stock Deal 0.042 0.091 0.458 0.649 -0.039 0.140 -0.274 0.785 -0.005 0.079 -0.066 0.948 -0.005 0.079 -0.066 0.948 -0.042 0.084 -0.497 0.621
Closed During a Recession -0.235 0.123 -1.900 0.063 -0.157 0.190 -0.823 0.414 -0.042 0.107 -0.395 0.694 -0.042 0.107 -0.395 0.694 -0.131 0.113 -1.160 0.251
Announced During a Merger Wave -0.715 0.119 -6.031 0.000 -0.697 0.183 -3.812 0.000 -0.307 0.103 -2.982 0.004 -0.307 0.103 -2.982 0.004 -0.379 0.109 -3.486 0.001
Experienced M&A Team -0.023 0.079 -0.294 0.770 0.031 0.123 0.252 0.802 0.079 0.069 1.138 0.260 0.079 0.069 1.138 0.260 0.020 0.073 0.276 0.783
Company Pressured to Transact 0.624 0.146 4.282 0.000 0.745 0.225 3.316 0.002 0.275 0.127 2.170 0.034 0.275 0.127 2.170 0.034 0.667 0.134 4.988 0.000
Critical Deal for Acquirer -0.074 0.107 -0.692 0.492 -0.052 0.165 -0.315 0.754 0.037 0.093 0.396 0.693 0.037 0.093 0.396 0.693 0.011 0.098 0.117 0.907
Multi State Transaction -0.186 0.106 -1.763 0.084 -0.172 0.163 -1.057 0.295 -0.070 0.092 -0.766 0.447 -0.070 0.092 -0.766 0.447 0.068 0.097 0.703 0.485
Overlapping States 0.106 0.105 1.008 0.318 0.111 0.163 0.684 0.497 0.145 0.092 1.575 0.121 0.145 0.092 1.575 0.121 -0.033 0.097 -0.346 0.731
Multi Business Segment Transaction 0.103 0.100 1.029 0.308 0.109 0.154 0.709 0.482 0.204 0.087 2.345 0.023 0.204 0.087 2.345 0.023 0.248 0.092 2.704 0.009
Quantile:
.10
Quantile:
.25
Quantile:
.50
Quantile:
.75
Quantile:
.90
Quantile:
.10
Quantile:
.25
Quantile:
.50
Quantile:
.75
Quantile:
.90

152
CHAPTER VI - DISCUSSION
When viewed in totality these results are consistent with previous research
regarding the relatively poor performance of acquisition returns for the acquirer. However, the
results do suggest that some of the previous differences can be traced to varied approaches and
specifications of the measurement variable and different definitions of the event window.
Oftentimes, varying outcomes can be obtained by simply altering the snapshot in time that a
researcher utilizes to determine if value is being created or destroyed. Generally speaking these
results suggest, that a majority of regulated energy firms see small but positive short-term
announcement returns and additional small but positive short-term post-close returns. However,
longer term post-close returns are both negative and of the magnitude that they erode any small
previous gain (for a majority of the acquirers) thus shifting overall transaction returns negative
by the one year post-close date. So “yes” acquiring firms on average do tend to create value
during M&A and “yes” acquiring firms on average do tend to destroy value during M&A.
However, what does appear to be an even more interesting research theme are the
significant differences of results observed between Top Performers and Poor Performers and
particularly those differences across the individual ABDC categories. There appears to be
significant differences in how these two groups approach M&A and a very significant difference
in market returns as a result. This Discussion section aims to provide some insights into this
phenomenon.
Key Findings from the Evaluation of Regulated Energy M&A
Analyzing some of the specifics of the results, overall, companies on average do
see some small value enhancement from announcement returns as a result of their differences in
approach to Selecting and Identifying acquisition targets. These results suggest on average about
0-1% value enhancement for the acquirer when a transaction is announced. Of the 337
transactions studied, 184 (56.4%) had positive announcement returns when measured on a 3 day

153
abnormal basis. These subtle differences are overshadowed by the differences between Top and
Poor performers where the better acquirer‟s average a gain of 2.2%, while the poorer acquirers
experienced value erosion of -1.5%.
Furthermore, companies on average experience additional value enhancement at
the closing of their transactions (measured on a 30 day pre to post-close event window) during
the phase of Transacting and Executing. These results suggest on average a 0.3% additional
value enhancement for the acquirer after the closing of the transaction. Of the 337 transactions
studied, 176 (52.2%) had positive post-closing short-term returns as measured on a 30 day
abnormal basis. Once again, the spreads between Top Performers and Poor Performers were
significant (which is only partly explained by the lengthening of the event window). The Top
Performers gain averaged 5.1% over the short-term post-close period, whereas the Poor
Performers experienced value destruction of -3.6% over the same period. This widening gap
should be of interest to both academics as well as practitioners.
The growing performance gap between the Top and Poor Performers and its
impact on relative value is even more dramatic during the R&I phase. On average, by the time at
which acquirers are about to enter the R&I phase of a transaction, they on average have
experienced a 1-2% value enhancement as a result of a positive announcement return (S&I) and
a small positive closing return (T&E). Nevertheless, despite the value enhancement experienced
by a majority of firms between deal announcement and short-term post-close, a large majority of
firms lose those gains (and oftentimes additional value) over the first year post-close during the
Reconfiguring and Integrating phases of their transactions. The median value loss over the first
360 days post-close for the 337 studied regulated energy transactions is -7.4% as only 99 of the
337 (29.4%) deals had positive returns during the R&I phase of the transaction. Companies that
are considered strong at R&I averaged a positive 3.3% gain, whereas the bottom quartile R&I
performers experienced significant one year abnormal return losses of over 20%.
The magnitude of differences in R&I outcomes between Top and Poor Performers
is so dramatic that it should be the central focus point of any recommendation for a potential

154
change in practitioner behavior resulting from the efforts of this study. A detailed discussion of
each ABDC category outcome is provided below.
Creating Value through Acquisition Based Dynamic Capabilities
To properly address the research question “What Acquisition Based Dynamic
Capabilities (ABDC) are the most critical in enhancing value for energy companies engaged
in M&A” requires the analysis to be taken down to the individual ABDC component level.
Furthermore, to provide insights into what factors impact performance at the individual ABDC
category level it is informative to evaluate differences across Top Performers and Poor
Performers.
Figure 13 below illustrates the differences among the characteristics of Top and
Poor Performers for each ABDC category. The differences were obtained from a review of the
differences of the means analysis between Top and Poor Performers discussed above of the
entire 337 company dataset. The differences of the means are helpful in determining where we
see differences in the factor characteristics. Whereas, the OLS and quantile regression results are
informative in illustrating the magnitude of the impacts of these factors and help provides why
some of these characteristics matter more than others when evaluating differences across the
return outcomes.
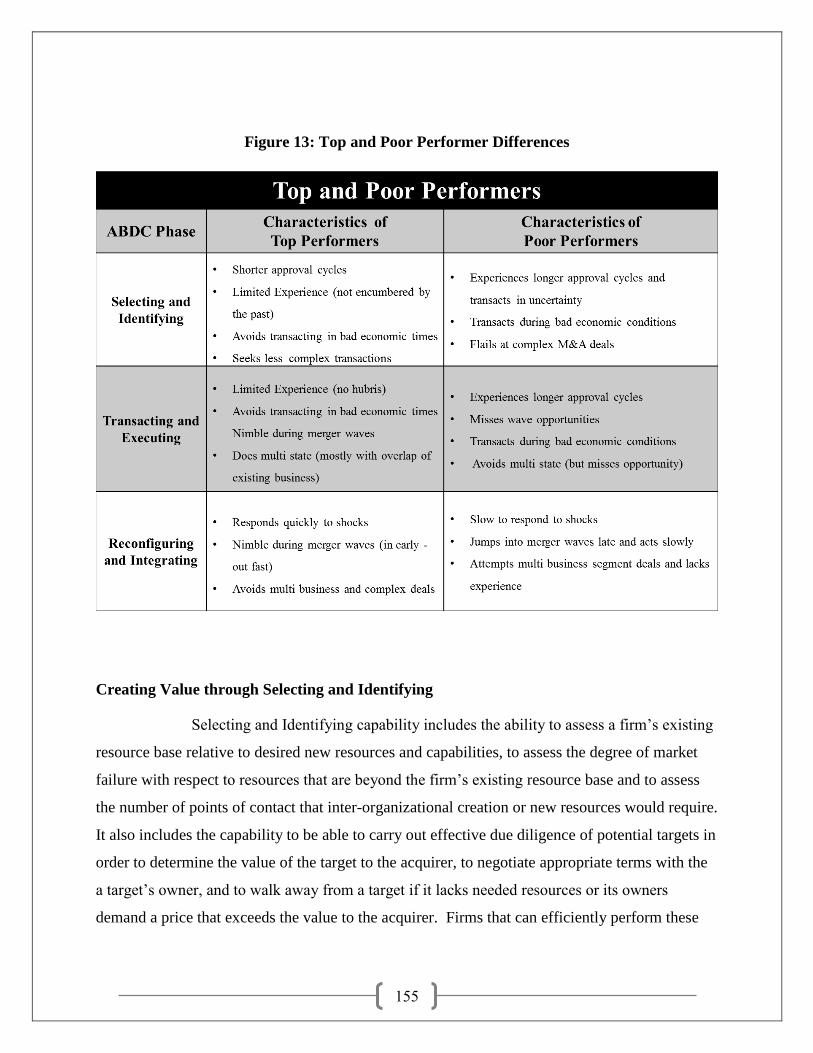
155
Figure 13: Top and Poor Performer Differences
Creating Value through Selecting and Identifying
Selecting and Identifying capability includes the ability to assess a firm‟s existing
resource base relative to desired new resources and capabilities, to assess the degree of market
failure with respect to resources that are beyond the firm‟s existing resource base and to assess
the number of points of contact that inter-organizational creation or new resources would require.
It also includes the capability to be able to carry out effective due diligence of potential targets in
order to determine the value of the target to the acquirer, to negotiate appropriate terms with the
a target‟s owner, and to walk away from a target if it lacks needed resources or its owners
demand a price that exceeds the value to the acquirer. Firms that can efficiently perform these

156
tasks and have resources with well-developed capabilities can be positioned to create substantial
competitive advantage.
The results suggest that for the firms who outperform at S&I (top quartile
performance) significant value creation can be realized. Top quartile firms realize a 2.2%
announcement return which is significantly superior to typical results. There are certain
characteristics that differentiate the firms who have superior S&I results. Top S&I performers
tend to benefit from shorter regulatory approval cycles. Shorter regulatory approval cycles can
be the result of managing the regulatory approval process with high levels of efficiency or
perhaps transacting in jurisdictions where regulatory approvals tend to be obtained in a shorter
timeline. Shorter approval cycles can also be obtained by “settling” filings with stakeholders
which short circuit the otherwise lengthy and potentially litigious approval process. Markets
respond well to shorter cycles, they tend to dislike timing uncertainty and deals that are delayed
or tend to linger.
Top S&I performers also have less experienced (from an M&A transaction
perspective) management teams. They have completed a statistically significant fewer amount
of transactions than the peer group as a whole. Although somewhat surprising this fact is not
unheard of as a research stream exists that investigates the negative impacts of management
experience on M&A returns. The logic suggests that few transactions are ever exactly alike and
that few companies ever conduct enough to make a material move along the learning curve and
as a result management teams with a few transactions under their belts are perhaps no better off
to manage a M&A process than the teams with less or even no experiences. Also suggested is
the fact that teams with a few transactions can get a false sense of comfort and become
lackadaisical in the process. Nevertheless, this outcome is somewhat counterintuitive.
Additionally, the resources that are brought to mind during the S&I phase of a
transaction include not only the company‟s internal resources (and their collective experience
and capabilities) but also the cumulative resources (experiences and capabilities) of all their
transaction advisors which usually includes law firms, investment bankers, and consulting
professionals. Perhaps company experience in this context is somewhat overrated as it may then

157
cause a situation where the acquirer relies less on the true experts (outside legal, investment
banking and consulting advisors) and as a result, are on the margin worse off skillset perspective
for the combined team. Additionally, an alternative explanation to why conducting multiple
transactions would not be providing positive abnormal returns to the acquirer would be that
companies receive their largest market value uplift from their first deal and then experience
diminishing marginal market receptiveness (in terms of value uplift) to future transactions. So
this effect could be capturing the effects of market receptiveness of a company performing
multiple transactions as opposed to market reactions to a management team‟s experience in
performing M&A. Also worth noting is that this factor tends not to be a statistically significant
determinant of most measures of S&I returns. So despite there being a significant difference in
the amount of experience between Top and Poor Performers, the true impact on S&I returns is
somewhat unclear.
The results suggest that for the firms who underperform at S&I (bottom quartile
performance) significant value destruction can be realized. Bottom quartile firms realize a -1.5%
announcement return which is significantly inferior to typical results. There are certain
characteristics that differentiate the firms who have inferior S&I results. Poor S&I performers
tend to attempt more complex transactions and the added complexity, added time and increased
risk is noticed by the market and as a result a negative market response is common.
Poor S&I performers attempt more multi-state transactions than their better
performing peers. Multi-state transactions add complexity, time and considerable transaction
cost to an acquirer, these all contribute to a somewhat negative market reaction and resulting
negative announcement return. These same transactions have statistically significant longer
approval cycles (on average 47% longer than Top Performing companies). Furthermore, the
multi-state transactions also require substantially more effort and required expertise when
transacting. As an example, each state has its own regulatory environment including unique
rules of procedure. Similarly, every state has its own unique set of stakeholders who tend to
intervene in most regulated transactions. To make matters worse, these same companies tend to
pursue acquisition targets in states where the acquirer does not currently operate (low multi-state
overlap). So in many respects each jurisdiction becomes a new territory for them. State energy
158
regulation varies considerably. The differences from one state to another can be as stark as
setting up new operations in a foreign country for a manufacturing firm.
To make matters even worse, Poor S&I performers also tend to select acquisition
targets that are statistically more diverse from an operations perspective than their peers. They
tend to broaden out their portfolio with investments in business operations that they do not
currently perform. Although these transactions are still defined as regulated energy company
transactions there is material differences in business operations when for example, a gas utility
purchases an electric power generator, or when an oil pipeline company buys an electric
transmission company, etc. Completing diversifying transactions effectively requires substantial
internal capabilities and a heavy reliance on outside expertise. As a result, markets tend to view
these types of transactions less favorably. For Poor Performers this added complexity, risk and
effort associated with their higher rate of multi-state transactions with little state overlap, multi
segment business deals with longer approval cycles, etc. are all net negatives from a market
investor perspective and the announcement return is indicative of the market‟s response and
skepticism that the company has the required capabilities and resources to make these issues non
factors. Although the OLS and quantile regression results are somewhat inconclusive as to the
magnitude, where these complexity factors are significant they tend to have a negative impact on
S&I returns and help explain some of the performance differences observed between Top and
Poor Performers.
Creating Value through Transacting and Executing
Transacting and Executing capability is the capacity to manage and execute
efficiently the transaction closing process, including meeting all conditions precedent in the
acquisition which may involve arranging financing, obtaining approvals and consents,
(regulatory, shareholder, other) and consummating all other deal closing mechanics. Firms that
can efficiently manage these processes are well positioned to take advantage of the opportunity
that was created in Selecting and Identifying and can create substantial competitive advantage.

159
The results suggest that for the firms who outperform at T&E (top quartile
performance) significant value creation can be realized. Top quartile firms realize a 5.1% short-
term post-close return which is significantly superior to typical results. There are certain
characteristics that differentiate the firms who have superior T&E results. Top T&E performers
tend to benefit from shorter approval cycles, are less likely to do a deal during a recession, are
more likely to transact in a merger wave, and are more likely to attempt a multi-state transaction
(but having a relatively high level of state overlap with existing operations).
It is during the T&E cycle where the benefit of an accelerated deal approval
cycle is realized for Top Performers. Often regulatory approval is the final condition precedent
necessary to close a transaction. Once the final approval is received most transactions close
within a few working days (or as governed by the transaction‟s purchase and sale agreements).
Shorter approval cycles are also suggestive of settlement type arrangements that tend to be
viewed favorably by the acquirer‟s investors (otherwise the acquirer would not have settled).
Regulatory resources that perform well tend to enhance the possibility of settlement, which can
shorten approval cycles and can potentially be value accretive. Similarly, shorter deal cycles
tend to improve an acquirer‟s transaction cost of capital as debt commitments can be released
and any market uncertainty being created as a result of a potential equity issuance can be
resolved. As a result, markets tend to reward the Top Performers for their ability to get
transactions closed quickly.
Top T&E Performers are also less likely to do a deal during a recession. The
market conditions of when a deal is announced and closed will have a major impact on the return
profile of an acquisition soon after closing. Deals become more difficult (and often more
expensive) in down markets as the cost of capital tends to increase (both debt and potentially
equity). Furthermore, to the extent the deal was negotiated with the purchase and sale agreement
signed (often months previously) the price is often fixed and the acquirers only recourse to not
closing is often a cost prohibitive breakup fee. As a result, markets tend to frown upon
transactions conducted during down economic cycles and periods of economic uncertainty.
Companies who are good at T&E know this and are less likely to conduct a deal during

160
recessions. For example, only 6.0% of the Top Performer deals were announced during a
recession, whereas 15.5% of the Poor Performers announced a deal during a recession.
Top T&E Performers also tend to transact during merger waves. For companies
with less developed T&E skills this could be problematic. Most Top T&E performers benefit
from their execution capabilities and ability to close quickly via shorter approval and transaction
cycles and thus execute before the negative aspects of a merger wave take place (increased
relative prices and decreasing amounts of options).
Companies that are strong performers at T&E tend to also consummate multi-
state transactions. For some with less developed skills and resources, this can be problematic.
What differentiates the Top Performers here is that the entities that attempt multi-jurisdictional
transactions also tended to already be multi-jurisdictional companies and their existing footprint
of operations have overlap with that of the target companies. Markets also tend to be fickle. For
some the market will discount firms who attempt to transact a complicated transaction, while at
other times the complicated transaction is where the most opportunity may reside and the market
may reward an acquirer for that aggressiveness. Additionally, T&E in this study‟s context
measures only deals that were eventually closed. As such, some of the market risks of closing a
multi-state complex deal by definition would have already been resolved. Top Performers
engaged in multi-state transactions 59.5% of the time, whereas for the Poor Performers this rate
is only 36.9%. The fact is that for the companies that excel at T&E, the market appears to see
the upside potential of a multi-state complicated transaction and as a result top T&E performers
garner above normal returns.
However, it is a much different story for the Poor T&E performers. The results
suggest that for the firms who underperform at T&E (bottom quartile performance) significant
value destruction can be realized. Bottom quartile firms realize a -3.6% post-close T&E return
which is significantly below typical results. There are certain characteristics that differentiate the
firms who have inferior T&E results. As suggested above, Poor T&E performers tend to have
longer deal approval cycles, are more likely to do a deal during a recession, are less likely to
transact during a merger wave and less likely to attempt a multi-state transaction.

161
It is during the T&E stage where the length of the approval cycle is crystalized
and the market gets transparency as to what final approval conditions were established. In deals
with very litigious and relatively long approval cycles, the end results is often an economic deal
that is viewed as very suboptimal from the acquirer‟s perspective. Additionally, in long
processes that are multi-jurisdictional each governing body takes its turn extracting value (in
terms of economic incentives, rate reductions and other financial and regulatory matters)
throughout the process that can at times makes the transaction for the acquirer uneconomic.
Additionally, not helping the Poor T&E performers is their tendency to transact
during poor economic times. As stated above, transacting during poor economic times can be
problematic particularly if the transaction value is locked in, the capital in the transaction
becomes more expensive (as markets erode) and the regulators keep asking for additional
economic concessions. Collectively, Poor T&E companies have the combination of negative
factors going against them including: poor execution, tendencies for slow performance and bad
market timing. None of these are reviewed favorably by investors. Although the OLS and
quantile regression results are somewhat inconclusive as to the magnitude of these impacts,
where these factors are significant they tend to support the hypothesis that differences in the
occurrences of the factor variables is helpful in understanding the performance differences
between Top and Poor Performers.
Creating Value through Reconfiguring and Integrating
Reconfiguring and Integrating capability is the capacity to reshape resources
within the target and acquiring firms. This involves the capacity to combine resources from the
target and acquirer in order to create new resources, whether at the target or within the acquirer‟s
original business units or in some new organizational unit. This capability also requires the
capacity to selectively divest unneeded resources from the target as well as old resources from
the acquirer that have become obsolete as a result of the Reconfiguring and Integrating process.

162
The results suggest that for the firms who outperform at R&I (top quartile
performance) significant value creation can be realized. Top quartile firms realize a 3.3%
abnormal return after the first year post-closing which is significantly superior to typical results
which for this phase tends to be negative. There are certain characteristics that differentiate the
firms who have superior R&I results. Top R&I performers tend to benefit by focusing their
attention on acquiring less diverse businesses. Top R&I performers transact a significantly
smaller amount of multi business segment businesses. They tend to acquire business that closely
resembles their own in terms of scope of operations. From a resource and capability perspective
it is much easier to reconfigure and integrate a business that resembles the acquirer than one that
is materially different. The combination of like businesses also provides for opportunities to
benefit from a capability perspective as there are opportunities for the sharing of best practices
and resource harmonization as the businesses are somewhat similar. These types of integration
projects tend to be easier, take less time to complete, spend fewer dollars on external experts and
disrupt ongoing operations far less.
It is a far less optimistic outlook for the Poor Performers. The results suggest that
for the firms who underperform at R&I (bottom quartile performance) significant value
destruction can be expected. Bottom quartile firms realize over a 20% negative abnormal return
one year after transaction closing. This level of value erosion also tends to eclipse any marginal
(calculated to be on average between 0 to 2%) value uplift the company may have received
during the S&I or T&E phases. Poor R&I performers struggle by attempting more diverse
transactions and the added complexity, added time and cost, disruption to operations and
increased risk is noticed by the market and as a result a negative market response is almost
certain.
Poor R&I performers tend to be integrating acquired companies that are
significantly more dissimilar from an operations perspective than they are and are attempting to
Reconfigure and Integrate lines of business that are outside their core capabilities. Perhaps, these
transactions were an attempt to broaden out and diversify their portfolios with investments in
business operations that they did not currently perform. Although these transactions are still
defined as regulated energy company transactions there is material differences in business
163
operations and Poor Performers tend to underestimate the effort involved in effectively
integrating these dissimilar business. Furthermore, completing diversifying transactions
effectively requires substantial internal capabilities and a heavy reliance on outside expertise. As
a result, markets tend to view these types of transactions far less favorably. This added
complexity, risk and effort is a large net negative from a market investor perspective and the one
year return is indicative of this response and the market‟s skepticism that the company has the
required capabilities and resources to reconfigure and to integrate seamlessly.
These results are consistent with the findings of a leading practitioner M&A
study. McKinsey & Company every other year conducts one of the largest multi-industry M&A
surveys available to practitioners. Its data covers over 1,500 global companies and thousands of
recently completed transactions. The study also has an approach (albeit a week form method) of
differentiating between Top and Poor Performers (they identify “High” and “Low” as firms who
either far exceeded or underperformed expectations on a “TSR” – total shareholder return – weak
form basis). Furthermore, it breaks down results into four categories “M&A Strategy and Deal
Sourcing” (akin to this study‟s S&I), “Due Diligence and Deal Execution” (akin to this study‟s
early stage T&E), “M&A Operating Model and Organization” (akin to this study‟s late stage
T&E) and “Integration” (akin to this study‟s R&I). Although the McKinsey analysis is not fully
comparable (it is a single snapshot in time, multi-industry, lacks strong form rigor, etc.) its
summary results as to R&I are noteworthy (McKinsey, 2016). McKinsey concluded:
“…high performers stand apart on the strength of their integration
processes. Those that do integration well, in our experience,
deliver as much as 6 to 12 percentage points higher total returns to
shareholders than those that don‟t…Compared with other stages of
M&A, integration is where companies perceive their capacities and
capabilities to be the most deficient. Survey respondents were 12
to 18% less likely to report that their companies had the right
capacities for integration than for any other M&A activity and

164
where 12 to 19% less likely to report that they had the right
capabilities.” (McKinsey, 2016).
When viewed over a deal lifecycle these performance differences between Top
and Poor Performers are significant and compelling. The magnitude of these differences and the
potential to erode value as a result of suboptimal M&A R&I places an enormously high level of
importance on a company‟s ability to manage the R&I phase of a transaction. Even though it is
every acquirer‟s goal to optimally manage each stage of an M&A transaction flawlessly, these
results suggest that even the most savvy of acquirers with expert teams that conduct S&I and
T&E seamlessly, could still be in a net negative position in the event that the business is not well
positioned to manage the R&I phase of the transaction.
Furthermore, as a result of the differences in return performance between Top and
Poor Performers being relatively modest in S&I and only slightly greater in T&E, a company‟s
primary focus even before pursuing a M&A transaction should be determining its capability and
commitment to properly resource the R&I stage of the transaction in the event it is successful in
winning and eventually closing the deal. The magnitude of differences between Top and Poor
R&I performance will overwhelm the return impact of both good or even bad performance
during the previous stages of an M&A deal and will singularly determine whether a transaction
is either successful or a failure form a market returns and shareholder value perspective.
One helpful fact about this issue that should be viewed as encouraging to the
practitioner is that potential acquirers can decide what transactions they wish to pursue and
whether to participate in the game at all. Potential acquirers may find it difficult to move
immediately from a situation where they go from Poor Performer to Top Performer overnight,
but they do have it in their authority to choose if and when to consider transacting and have the
ability to simply opt out (by not acquiring) of the M&A game entirely. This is a decision all
potential acquirers should only make after a comprehensive and honest assessment of their own
resources and capabilities. Furthermore, when determining what activities are most critical in
resource deployment, potential acquirers need to err on the side of caution and appropriately

165
resource R&I and even pass on potential transactions where R&I could become overly
challenging.
If after this assessment of the company‟s internal capabilities, a holistic review of
the M&A opportunities in the marketplace and the understanding that for most it‟s a losers game;
if a company still desires to attempt to transact, perhaps the best advice for them might be
“Buyer Beware”.

166
CHAPTER VII - CONTRIBUTIONS
Contributions are provided to both theory and practice as a result of the findings of this research.
The theoretical contribution of this Dissertation is twofold. Firstly, the study provides a much
needed quantification of ABDC theory and, secondly, the ABDC theoretical model is adapted to
better reflect the M&A transaction process. Whereas the Dissertation‟s practical contributions
can be grouped into three categories. Firstly, is the measurement of M&A performance across
critical steps of a deal transaction. Secondly, is the identification of what factors contribute to
M&A return performance differences across transactions. Lastly, the reiteration of the
importance of the capabilities involved in Reconfiguring and Integrating to overall M&A deal
transaction success and the large gap between Top and Poor Performers..
Contribution to Theory
One sharp criticism often lobbed at the advocates of Dynamic Capabilities is the
apparent lack of empirical support for its theoretical arguments (Kamasak, 2013). The Capron
and Anand framework (“Selection”, “Identification” and “Reconfiguration”) for ABDC is a vast
enhancement over the generalized treatment of the concept of resource acquisition through M&A
found within the Dynamic Capabilities literature pioneered by Teece and his three factor model
of “Sensing”, “Seizing” and “Reconfiguring” see (Teece, 1997, 2003 and 2007). Additionally,
Capron and Anand also quantified their model in an attempt to operationalize ABDC, thus
making a positive step forward in the strategic management literature by advancing the
discussion forward from the purely theoretical.
However, a material gap requiring a more comprehensive operationalization of
the framework remained. This Dissertation is an attempt at addressing that perceived gap with a
goal of moving one step closer to a point where researchers can adequately operationalize the
theoretical DC and ABDC concepts. The quantification required a stylized approach involving

167
long dated transactions with transparent critical milestone dates and analysis based off of reliable
and widely accepted measures of performance. This Dissertation‟s research design attempted to
utilize an industry setting and M&A transaction definition that enabled the operationalization of
the adapted ABDC theory in hopes of bridging one of the gaps that remained in the literature.
An additional theoretical enhancement is the definitional adaptation of the basic
Capron and Anand framework (Helfat 2009). The enhancement is accomplished via a few slight
definitional modifications. Whereas Capron and Anand divided the ABDC capabilities into
“Selection”, “Identification” and “Reconfiguration” a more practical approach would be to
define the groupings as “Selecting and Identifying”, “Transacting and Executing” and
“Reconfiguring and Integrating”. Capron and Anand were correct to identify the importance of
Selection and Identification. However, in practice these are activities that are occurring
simultaneously and in many ways are interwoven with each other and belong in one grouping
and should not be separated. Additionally, these activities are almost always performed by the
same individuals (resources) in an acquiring firm. To have them as two of the three identified
ABDC groupings distorts the manner in which these activities are performed as well as how
resources performing these activities are deployed.
An additional enhancement to the Capron and Anand framework is the
identification of the unique category of “Transacting and Executing”. In the original framework
these critical capabilities (and resources) appear to be embedded in the “Identification” category.
Grouping these critical capabilities into the “Identification” category distorts what
“Identification” is intended to capture. Additionally, it also muddies the waters as to what
capabilities that are really being identified in addition to the resources that are being deployed to
perform these activities. Similar to the redefining of “Selection and Identification” the creation
of the “Transacting and Executing” grouping is an enhancement to the original Capron and
Anand framework.
The final Capron and Anand grouping, “Reconfiguration” or “Reconfiguring and
Integrating” in this author’s enhancement is virtually identical. The only practical difference is a
slight modification to the grouping name to reflect the concept of “integration” which is a term
168
of art for M&A practitioners. Otherwise the capabilities and resources necessary to be deployed
to be successful are the same for “Reconfiguration” and “Reconfiguring and Integrating”.
These modifications to the ABDC framework of Capron and Anand provides a practical
enhancement to the theory and has the added benefit of closer resembling the process and
necessary capabilities and resource requirements of successful practitioners.
Contribution to Practice
Additionally, the study is a contribution to practice. The impetus to conducting
this work was a sincere desire to understand why acquirers continue to destroy value in their
acquisition activities. The first element that needed to be addressed was a more practical
measurement approach. The question of whether acquirers tended to always destroy value was
not so easily answered when viewing a transaction over various time horizons. As an example
consistent with previous scholarship, acquirers actually do see some (albeit small) value
enhancement at deal announcement with about half seeing an additional small incremental value
enhancement at dealing closing. Many times these gains were eventually offset by longer term
trends of value destruction which was commonplace within the first year of closing a transaction.
Thus raising the question of whether acquirers create or destroy value is not so easily answered.
This study provides a better measurement rubric to level set practitioners what to expect during
the various stages of an M&A transaction from an expected return outcomes perspective.
Another contribution to practice is the identification of what business factors
impact returns over the course of an M&A transaction in the regulated energy industry. Factor
differences attributed to shock waves, bandwagoning effects, management traits and deal
complexity were all found to have statistically significant impacts to value creation under
different deal scenarios. Additionally, the ABDC capabilities were highlighted to illustrate
which ABDC capabilities are the most important factor impacting returns and acquisition

169
success. Even though much of this was consistent with previous research, the findings did
provide a quantification for energy industry practitioners that was not otherwise available.
Arguably the most important practitioner focused contribution is in the
highlighting of the importance of Reconfiguring and Integrating. Even though practitioners
should understand the importance of R&I in a deal context, it is most likely not appreciated to
the extent that these results would suggest. On average, losses of value during the R&I phase of
a deal will eclipse any gains received immediately after announcement or soon after closing,
resulting in shareholders of companies who have recently completed an acquisition being worse
off at the 1 year anniversary of the closing of the transaction. This research identified factors
that impacted R&I performance and should be illustrative to companies interested in utilizing the
ABDC framework to create value in an M&A context. Furthermore, the specific examples of
what Top performers do in R&I versus Poor Performers provides practitioners a reasonable list
of Do‟s and Don‟ts along with the quantification of how destructive it can be for those who
underperform during the R&I phase.
By knowing what stages of the transaction are most important from a value
creating perspective, companies can determine what skills are most critical and resource their
firms appropriately.
It was an objective of this Dissertation to provide a meaningful contribution to
both practice and theory. Considering the contributions defined above, the Project appears to
have met those objectives.

170
CHAPTER VIII - CONCLUSION
In conclusion, this Dissertation has practical and theoretical contributions but it also has its
limitations. Some of the limitations are discussed below. Additionally, with the combination of
the above mentioned contributions that this research provides and its limitations listed below,
recommendations for additional streams of future research are also provided.
Limitations
As a result of the research question and general thrust of the project, certain
assumptions and design decisions needed to be made. These led to a handful of limitations to the
research that the reader should be aware. Some (but surely not all) of these limitations are
discussed below.
The regression results in some instances (Resource industry group) lack analytical
power. The decision was made to disaggregate the dataset (337 transactions) in total to 4
industry segment groups. This decision was based on the fact that each sub segment had its own
industry dynamics (industry drivers, wave dynamics and shock events that were different for
each sub segment) and as a result the analysis with all transactions lumped together for certain
techniques was providing unnecessary noise, resulting in relatively poor results. Thus, the
decision was made for certain analytical procedures to disaggregate the dataset. As a result of
separating the analysis into sub segments, degrees of freedom were reduced (sample sized
reduced) which had the result in certain instances of reducing the power of those analytical
procedures. Alternatively, the approach could have been to architect multivariate models with
multiple interactive variables (with four times the number of variables that had sub segment
specific tendencies resulting in dozens of combinations of new variables) to isolate and control
the cross industry effects. For the sake of parsimony the decision was made that it was best to
just disaggregate and run the analytics as separate industry segments and then be mindful of the

171
limitations in the subsequent analysis. Aggregated results are provided in the Appendix for
additional review and analysis.
Continuing with study‟s limitations, the study relies heavily on the measurement
of semi-strong measures (CARs and BHARs returns). For reasons discussed above these
measures for some purposes are superior to weak form measures of return that are also included
in the analysis. However, CARs and BHARs are not perfect either. They both rely on
methodological assumptions and are highly sensitive to what indices (or representative company)
that is being selected to benchmark these abnormal forms of return. BHARs and CARs are
always going to be sensitive to the benchmark company and indices that are selected and as a
results have a risk of providing less than reliable results. See Barber and Lyon, (Barber and
Lyon, 1997) for a rich discussion on the benefits and limitations of using various measures of
returns.
Another limitation of the study is in the design of the Transacting and Executing
(T&E) variable. Unlike for short range announcement returns (the proxy variables for S&I) and
long-term post-close variables (the proxy variable for R&I) which both benefit from a rich
literature of how to calculate and model, the T&E variables are more of a creation of the author.
Discussed previously, the -30, +30 post-closing timing interval should be a fine specification for
the T&E impacts, however, this is a previously untested assumption. One of the reasons why
this issue has not surfaced in the literature is perhaps the fact that most prior work done in
acquirers M&A performance has not dealt with differences across closing dates and
announcement dates. Additionally, little work has been done around impacts of lags between
these critical dates so the period between deal announcement and up to and immediately
following deal closing (where critical T&E functions are being performed) few researchers have
made any effort to isolate and quantify this critical component in their studies. This author feels
strongly that a -30, +30 post-close window is the most appropriate method to measure T&E
effectiveness based off of the activities being performed and equally important is the markets
understanding (through disclosure events required as part of the transaction) of what activities
are being performed during that window. Based on one‟s sharing of that belief will dictate how
big of a limitation this is or not.

172
An additional limitation is the assumption of the effectiveness of proxy measures
for the ABDC categories. Each ABDC category is quantified as a specific return period over a
deal lifecycle. The specified deal windows (S&I -3, +3, T&E -30, +30 and R&I 0, +360) are
argued to be proxy measurements for the effectiveness of the company at performing activities
within that time window. Although this not entirely a wild assumption and a similar theoretical
leap is often made in empirical work where you are attempting to measure an abstract construct,
nonetheless it is a limitation and worth noting.
A final limitation worth noting involves the issue of generalizability. This study
evaluates 337 acquisitions involving public energy companies between 1995 and 2014. An
added condition is also provided that these transactions have at least a 30 day lag between the
dates when they are announced and the dates when the transaction closes. Even within the data
set of regulated energy companies, material industry segment differences were apparent. The
differences were material enough to justify splitting the data set into industry segments to better
analyze the data and provided for meaningful results for certain analytical techniques. The
generalizability of results taken from a dataset that is somewhat nuanced is a valid concern.
However, domains where these results would appear to be best applied would most likely be
industries with high levels of regulation (telecom, banking, insurance) and industries where there
is much state by state variation in terms of rules, regulations or standards of operations in
addition to industries where transaction deal lifecycles tend to be lengthy with a relatively long
lag between deal announcement and transaction closing. To the extent that the industry being
evaluated had similar complexity and regulatory dynamics these results should be quite
applicable.
Future Research
In addition to providing some rather interesting findings and basis for the
discussion above, this Dissertation provides a solid empirical analysis of the ABDC capabilities

173
as evidenced in a public company, regulated energy acquisition setting. The project does point
directly towards some areas worth future research.
Firstly, the methodology and adapted ABDC framework designed here should be
applied to another industry setting. Whereas the results provided in this Dissertation are specific
to the regulated energy industry, additional industries should be identified to apply the research
design here to validate the findings. As stated above, the banking, insurance or telecom industry
could be likely candidates although they may not benefit from the deal volume necessary to
provide an adequate sampling for rigorous empirics. Alternatively, identifying any M&A
transaction with a material lag between announcement and closing could be a viable approach if
attempting to look at a cross industry project.
Secondly, as a result of the magnitude of the value destruction occurring during
the first 360 days post-close, a richer analysis purely on the R&I elements of a deal transaction is
justified. Although these findings of large scale value erosion (after short-term gains at
announcement and closing) are not surprising, the magnitude of the reduction is something of
concern to practitioners. Additionally, the issue of whether this value erosion is really only a one
year issue (as companies cycle through one time financial charges including deal and integration
expenses in hopes of positive future returns) or perhaps are these problems symptomatic of
continued losses for multiple years post-close.
Thirdly, this field of research would benefit from some specific case study
research focused on specific performance attributes of ABDC capabilities of companies who are
deemed to be good. This analysis has identified the companies that perform well at S&I, T&E
and R&I and what are some of the factors that drive performance difference. But what is less
clear is what specifically the better acquirers are doing in each of the ABDC categories
purposefully to be performing well. A case study approach working with a few Top Performing
acquirers would be the most appropriate manner to address this opportunity.

174
Summary
M&A research has consistently shown that value is destroyed for a majority of
acquirers. Despite initial small positive gains at deal announcement, within a year of closing the
transaction a majority of acquirers experience overall negative returns. Nevertheless, the
constant pressures to grow leave company leaders few other viable options than pursuing M&A.
This ever present cycle of value destruction is of interest to both scholars and practitioners. Of
interest is what can be done differently by the acquirer to prevent the inevitable value erosion
from occurring.
To investigate this question, the author developed an adapted version of the
Acquisition Based Dynamic Capabilities (ABDC) framework, a theoretical extension of
Dynamic Capability theory (itself an extension of “The Resource Based View of the Firm”). The
framework was helpful in identifying what corporate capabilities contribute to value creation
when viewed through the lens of M&A. The adapted ABDC framework provided a means to
quantify the differing impacts to value creation among the M&A capabilities of “Selecting and
Identifying”, “Transacting and Executing” and “Reconfiguring and Integrating” throughout the
M&A deal lifecycle.
The empirical study utilized 337 regulated energy public company transactions
closed between 1995 and 2014. This industry is appropriate to study the application of this
theory as it benefits from long dated deal timelines and specific milestone announcement events
(deal announcement, regulatory approval, financial closing, etc.) providing clear points of
delineation for measurement purposes. Performance was measured using weak and semi-strong
specifications with a “golden set” of measures identified. Additionally, the impacts from shock
waves, bandwagon effects, management traits, financial factors, deal complexity and other
relevant factors were all evaluated to test for their each ABDC capability across the analyzed
transactions.
Consistent with prior research, the results found that despite many acquirers
receiving some positive value accretion from announcement and short-term post-closing returns,
results suggest larger one year post-close reductions in value eclipsed previous gains for most

175
acquirers. The results validate the importance of the Reconfiguring and Integrating phase of an
acquisition. Additionally, the stark differences between Top and Poor performers during the
R&I phase was identified. Comparisons to Top and Poor Performers provide a clear set of
recommendations for future energy industry acquirers and a list of Dos and Don’ts on how best
to navigate the Reconfiguring and Integrating phase of a transaction was provided.
This research provides a meaningful contribution to both M&A researchers (by
providing a needed empirical study and operationalization of the theoretical ABDC framework)
in addition to M&A practitioners (by providing a better understanding of what capabilities
impact value creation through a regulated energy M&A transaction).

176
APPENDIX I: SUPPORTING CORRELATION STATISTICS
Table 28: Correlation Matrix – All
Table 29: Correlation Matrix – Leaders
1 2 3 4 5 6 7 8 9 10 11 12 13
Like Buying Like Businesses 1 1
Lag from Critical Reg Date .305** 1 2
Approval Cycle .062 -.383** 1 3
Stock Deal .164**
.130*
.245** 1 4
Announced During a Recession -.030 -.160** -.019 -.027 1 5
Announced During a Merger Wave .001 -.206** .104 -.060 .505
** 1 6
Experienced M&A Team .136*
.493** .010 .214
**-.210
** -.100 1 7
Company Pressured to Transact .086 .311**
-.117*
.114* -.097 -.104 .113
* 1 8
First Deal For Team .043 .113*
.133* .059 -.102 .000 .487
**-.272
** 1 9
Critical Deal for Acquirer .133*
.150**
.119*
.395** -.056 -.086 .212
** .073 .148** 1 10
Multi State Transaction .106 .233** .044 .334
** -.082 -.048 .260**
.112* .097 .638
** 1 11
Overlapping States -.064 -.029 -.199**
-.283** .036 .023 -.119
* -.043 -.126*
-.558**
-.547** 1 12
Multi Business Segment Transaction -.243**
-.232**
.296**
.155** -.067 .052 -.056 .003 .092 .272
**.219
**-.282
** 1 13**. Correlation is significant at the 0.01 level (2-tailed).
*. Correlation is significant at the 0.05 level (2-tailed).
1 2 3 4 5 6 7 8 9 10 11 12 13
Like Buying Like Businesses 1 1
Lag from Critical Reg Date .476** 1 2
Approval Cycle -.041 -.490** 1 3
Stock Deal .175 .176 .342** 1 4
Announced During a Recession -.137 -.107 -.007 .091 1 5
Announced During a Merger Wave .079 -.165 .094 -.147 .361** 1 6
Experienced M&A Team .023 .280* .148 .122 -.229
* -.126 1 7
Company Pressured to Transact .110 .476** -.163 .310
** -.120 -.224*
.273* 1 8
First Deal For Team -.020 -.148 .205 -.190 -.085 -.085 .370**
-.289** 1 9
Critical Deal for Acquirer .113 .076 .360**
.337** .048 -.054 .237
* .164 .079 1 10
Multi State Transaction .219*
.230* .212 .410
** .029 -.074 .172 .250* -.112 .681
** 1 11
Overlapping States -.216 -.048 -.317**
-.357** -.003 .102 -.040 -.213 .014 -.596
**-.640
** 1 12
Multi Business Segment Transaction -.322**
-.408**
.541** .096 .010 .010 -.043 -.095 -.051 .280
* .118 -.200 1 13**. Correlation is significant at the 0.01 level (2-tailed).
*. Correlation is significant at the 0.05 level (2-tailed).

177
Table 30: Correlation Matrix – Laggards
Table 31: Correlation Matrix – Industry Group 1
1 2 3 4 5 6 7 8 9 10 11 12 13
Like Buying Like Businesses 1 1
Lag from Critical Reg Date .302** 1 2
Approval Cycle .081 -.269* 1 3
Stock Deal .308**
.234* .126 1 4
Announced During a Recession .155 -.210 .166 -.031 1 5
Announced During a Merger Wave -.003 -.135 .061 -.096 .310** 1 6
Experienced M&A Team .140 .742** -.111 .100 -.219
* -.151 1 7
Company Pressured to Transact .099 .102 .103 .177 -.094 -.001 -.061 1 8
First Deal For Team -.005 .435** -.037 .006 -.127 -.088 .581
**-.233
* 1 9
Critical Deal for Acquirer .153 .149 -.133 .446** .048 -.078 .054 -.126 .060 1 10
Multi State Transaction .127 .063 -.064 .328** -.069 -.102 .024 -.086 .014 .797
** 1 11
Overlapping States .012 -.129 .078 -.183 .083 .003 -.189 .112 -.262*
-.571**
-.633** 1 12
Multi Business Segment Transaction -.243* -.073 .195 .115 -.151 -.104 -.009 .202 .068 .132 .135 -.173 1 13
**. Correlation is significant at the 0.01 level (2-tailed).
*. Correlation is significant at the 0.05 level (2-tailed).
1 2 3 4 5 6 7 8 9 10 11 12 13
Like Buying Like Businesses 1 1
Lag from Critical Reg Date -.237 1 2
Approval Cycle .276 -.068 1 3
Stock Deal .446** -.062 -.008 1 4
Announced During a Recession .166 -.243 .173 .135 1 5
Announced During a Merger Wave -.123 -.259 -.094 -.055 .504** 1 6
Experienced M&A Team .c
.c
.c
.c
.c
.c
.c
7
Company Pressured to Transact -.275 .272 -.074 .020 -.142 .093 .c 1 8
First Deal For Team .c
.c
.c
.c
.c
.c
.c
.c
.c
9
Critical Deal for Acquirer .197 .019 -.068 .363* -.048 -.151 .
c -.075 .c 1 10
Multi State Transaction .214 -.007 .038 .140 -.223 -.174 .c -.157 .
c.781
** 1 11
Overlapping States .119 -.040 .058 -.047 .108 .123 .c -.045 .
c-.712
**-.711
** 1 12
Multi Business Segment Transaction -.421** .215 -.232 -.188 -.048 -.151 .
c .023 .c
.337*
.415**
-.506** 1 13
c. Cannot be computed because at least one of the variables is constant.
**. Correlation is significant at the 0.01 level (2-tailed).
*. Correlation is significant at the 0.05 level (2-tailed).

178
Table 32: Correlation Matrix – Industry Group 2
Table 33: Correlation Matrix – Industry Group 3
1 2 3 4 5 6 7 8 9 10 11 12 13
Like Buying Like Businesses 1
Lag from Critical Reg Date .056 1
Approval Cycle .123 .008 1
Stock Deal .029 -.072 .189 1
Announced During a Recession -.064 -.194 .016 -.047 1
Announced During a Merger Wave -.002 -.218 -.002 -.062 .460** 1
Experienced M&A Team -.151 -.207 .141 .378**
-.226*
-.241* 1
Company Pressured to Transact .169 .232* .066 .136 -.226
* -.153 .013 1
First Deal For Team -.111 -.095 .059 .112 -.117 -.124 .515** -.197 1
Critical Deal for Acquirer .041 -.066 -.113 .264* -.002 -.194 .095 .095 .171 1
Multi State Transaction -.088 -.256* -.066 .268
* .142 .025 .077 .138 .134 .520** 1
Overlapping States -.086 .119 -.130 -.217 .041 .078 -.029 -.088 -.137 -.476**
-.436** 1
Multi Business Segment Transaction -.231* .005 .072 .201 -.144 -.077 .254
* .125 .098 .301**
.294**
-.290* 1
*. Correlation is significant at the 0.05 level (2-tailed).
**. Correlation is significant at the 0.01 level (2-tailed).
1 2 3 4 5 6 7 8 9 10 11 12 13
Like Buying Like Businesses 1 1
Lag from Critical Reg Date .321** 1 2
Approval Cycle -.097 .066 1 3
Stock Deal .159 .332**
.505** 1 4
Announced During a Recession .127 -.074 -.113 -.034 1 5
Announced During a Merger Wave -.007 -.216** .072 -.123 .650
** 1 6
Experienced M&A Team .160 .805** .106 .230
**-.225
**-.242
** 1 7
Company Pressured to Transact .095 .297** -.012 .160 .034 -.120 .161 1 8
First Deal For Team .002 .278** .106 .030 -.083 -.089 .370
**-.365
** 1 9
Critical Deal for Acquirer .238**
.433**
.187*
.385** -.074 -.158 .344
**.175
* .147 1 10
Multi State Transaction .158 .342**
.230**
.394** -.070 -.101 .362
** .164 .006 .680** 1 11
Overlapping States -.142 -.187*
-.193*
-.276** -.070 .084 -.176
* -.063 -.126 -.517**
-.522** 1 12
Multi Business Segment Transaction -.375** -.147 .220
** .097 -.081 .010 -.175* .002 .075 .037 .077 -.013 1 13
**. Correlation is significant at the 0.01 level (2-tailed).
*. Correlation is significant at the 0.05 level (2-tailed).

179
Table 34: Correlation Matrix – Industry Group 4
1 2 3 4 5 6 7 8 9 10 11 12 13
Like Buying Like Businesses 1 1
Lag from Critical Reg Date -.145 1 2
Approval Cycle .252* -.223 1 3
Stock Deal -.019 -.054 .354** 1 4
Announced During a Recession -.064 -.233 -.216 -.002 1 5
Announced During a Merger Wave .153 -.380** .122 -.003 .492
** 1 6
Experienced M&A Team -.149 .110 .112 -.023 -.158 .257* 1 7
Company Pressured to Transact -.119 .148 -.143 .012 -.039 -.056 -.119 1 8
First Deal For Team -.015 .020 .216 -.004 -.110 .196 .696**
-.312** 1 9
Critical Deal for Acquirer -.028 -.111 .464**
.550** -.085 .146 .070 -.105 .147 1 10
Multi State Transaction -.119 -.028 .415**
.372** -.203 .066 .152 -.024 .237
*.623
** 1 11
Overlapping States .123 .013 -.329**
-.397** .119 -.094 -.040 .020 -.082 -.639
**-.728
** 1 12
Multi Business Segment Transaction .039 -.029 .511**
.372** -.079 .248
* .089 .098 .160 .623**
.475**
-.556** 1 13
*. Correlation is significant at the 0.05 level (2-tailed).
**. Correlation is significant at the 0.01 level (2-tailed).

180
Table 35: Dependent Variable Correlation Matrix – All Transactions
N-337
Like Buying
Like
Businesses
Lag from
Critical Reg
Date
Approval
CycleStock Deal
Announced
During a
Recession
Closed During
a Recession
Announced
During a
Wave
Experienced
M&A Team
Company
Pressured to
Transact
First Deal For
Team
Critical Deal
for Acquirer
Multi State
Transaction
Overlapping
States
Multi
Business
Segment
SimRet_An_1day 0.009 0.084 -0.098 0.014 -0.076 -0.065 0.008 -0.038 -0.028 0.038 -0.021 -0.003 0.025 -0.058
SimRet_An_3day 0.044 0.020 -0.086 -0.036 -0.093 -0.072 -0.003 -0.064 0.002 0.066 -0.040 -0.055 -0.007 -0.075
SimRet_An_5day 0.042 -0.005 -0.074 -0.041 -0.074 -.119* 0.007 -0.043 -0.031 0.028 -0.028 -0.044 -0.011 -0.061
SimRet_An_10day -0.028 -0.016 -0.035 0.043 -0.079 -.110* -0.066 -0.089 -0.039 0.059 -0.105 -0.094 0.061 -0.039
SimRet_An_30day 0.028 -0.024 -0.044 -0.017 -0.079 -0.051 -0.060 -0.084 -0.022 0.038 -0.044 -0.064 0.077 0.007
SimRet_An_180day 0.017 -.120* 0.062 -0.091 -0.058 -0.096 -.140
* -0.081 -0.041 0.076 -0.106 -.144** 0.086 -0.083
SimRet_An_270day 0.036 -0.043 0.075 0.001 -.122*
-.139* -0.093 -0.035 -0.039 0.068 -0.038 -0.078 0.043 -0.085
SimRet_An_360day -0.016 -0.070 0.062 -0.025 -0.070 -.129*
-.124* -0.087 -0.096 0.053 -0.086 -.113
* 0.092 -.123*
CAR_An_1day -0.006 0.099 -0.092 0.025 -0.065 -0.075 0.009 -0.024 -0.034 0.032 -0.030 -0.001 0.037 -0.066
CAR_An_3day -0.003 0.013 -0.099 -0.049 -0.084 -0.080 -0.016 -0.051 -0.006 0.048 -0.075 -0.082 0.021 -0.060
CAR_An_5day 0.003 0.001 -0.106 -0.051 -0.056 -.124* 0.004 -0.007 -0.035 -0.006 -0.066 -0.080 0.006 -0.068
CAR_An_10day -0.080 -0.010 -0.050 0.030 -0.089 -.108* -0.073 -0.060 -0.059 0.044 -.124
*-.112
* 0.087 -0.041
CAR_An_30day 0.027 0.002 -0.054 -0.036 -0.087 -0.076 -0.035 -0.065 -0.032 0.026 -0.079 -0.098 0.104 -0.034
CAR_An_180day 0.015 -0.072 0.031 -0.100 -0.061 -0.055 -0.101 -0.088 -0.045 0.068 -.151**
-.148**
.121* -0.104
CAR_An_270day 0.018 -0.020 0.055 -0.008 -0.078 -0.061 -0.082 -0.061 -0.046 0.072 -0.082 -0.075 0.078 -.111*
CAR_An_360day -0.045 -0.048 0.039 -0.035 0.023 -0.011 -.119* -0.093 -0.092 0.032 -.124
* -0.101 .115*
-.129*
BHAR_An_1day 0.008 0.085 -0.077 0.033 -0.042 -0.054 0.008 -0.071 -0.010 0.096 -0.033 -0.031 0.029 -0.065
BHAR_An_3day 0.017 -0.026 -0.053 -0.053 -0.032 -0.043 -0.067 -0.096 -0.007 0.104 -0.095 -0.094 0.041 -0.034
BHAR_An_5day 0.006 -0.033 -0.053 -0.057 -0.008 -0.084 -0.051 -0.051 -0.035 0.047 -0.079 -0.087 0.012 -0.046
BHAR_An_10day -0.089 -0.057 -0.038 0.016 -0.051 -0.050 -.120* -0.088 -0.063 0.056 -.154
**-.124
* 0.099 -0.022
BHAR_An_30day -0.003 -0.054 -0.055 -0.024 -0.009 -0.001 -0.058 -0.091 -0.049 0.010 -.108*
-.121*
.130* -0.013
BHAR_An_180day -0.008 -.142** 0.057 -0.092 -0.064 -0.044 -.149
**-.116
* -0.054 0.099 -.167**
-.165**
.137* -0.083
BHAR_An_270day -0.005 -0.084 0.091 -0.009 -0.080 -0.061 -.138* -0.094 -0.046 0.101 -0.095 -.108
* 0.090 -0.100
BHAR_An_360day -0.071 -0.095 0.076 -0.010 -0.015 -0.042 -.168** -0.104 -0.076 0.060 -.123
*-.124
*.119
* -0.103
SimRet_Clsd_1day 0.077 0.082 0.000 0.053 -0.002 -0.058 0.069 0.058 0.021 -0.027 0.082 0.086 -0.039 -0.013
SimRet_Clsd_3day 0.055 0.082 -0.026 0.004 -.159**
-.177** 0.062 0.023 0.031 -0.030 0.071 0.073 -0.035 -0.017
SimRet_Clsd_5day 0.060 0.075 -0.023 -0.009 -.196**
-.203** 0.061 0.005 0.028 -0.024 0.004 0.058 0.017 -0.055
SimRet_Clsd_10day 0.020 0.048 -0.063 -0.041 -.111*
-.168** 0.006 0.057 -0.042 -0.062 0.011 0.027 0.004 -0.063
SimRet_Clsd_30day -0.026 0.048 -0.046 -0.001 -0.101 -.174** -0.027 -0.031 -0.057 0.040 0.035 0.023 0.038 -0.100
SimRet_Clsd_180day -0.006 -0.033 0.043 0.001 -0.088 -.210** -0.102 0.009 -0.053 0.097 -0.052 -0.013 -0.023 -.127
*
SimRet_Clsd_270day 0.015 -0.051 0.028 -0.043 -0.079 -.222**
-.129* 0.000 -0.072 0.066 -0.061 -0.054 0.034 -.152
**
SimRet_Clsd_360day -0.052 -0.045 0.019 -0.051 0.027 -.162** -0.100 -0.049 -0.040 0.077 -0.105 -0.052 0.054 -.125
*
CAR_Clsd_1day 0.090 0.079 0.000 0.038 0.029 -0.010 0.076 0.037 0.024 -0.015 0.076 0.068 -0.050 -0.006
CAR_Clsd_3day 0.034 0.069 -0.047 0.007 -0.033 -0.021 0.088 0.041 0.046 -0.040 0.083 0.093 -0.078 0.003
CAR_Clsd_5day 0.042 0.067 -0.057 0.011 -0.051 -0.036 0.076 0.015 0.057 -0.026 -0.004 0.045 -0.011 -0.034
CAR_Clsd_10day 0.024 0.073 -.107* -0.032 -0.069 -0.065 0.071 0.066 -0.009 -0.063 0.021 0.054 -0.022 -0.025
CAR_Clsd_30day -0.030 0.080 -0.078 0.015 -.118*
-.107* 0.040 -0.025 -0.012 0.056 0.049 0.066 -0.013 -0.063
CAR_Clsd_180day 0.001 0.013 0.039 0.035 -0.054 -0.022 -0.015 0.016 -0.015 0.083 -0.054 0.027 -0.023 -.119*
CAR_Clsd_270day 0.011 0.010 0.027 0.000 -0.025 -0.024 -0.052 0.007 -0.056 0.033 -0.048 0.012 0.035 -.131*
CAR_Clsd_360day -0.055 -0.017 0.013 -0.030 0.071 0.028 -0.047 -0.042 -0.038 0.046 -0.101 -0.011 0.061 -.124*
BHAR_Clsd_1day 0.064 .118* -0.001 0.066 0.018 -0.027 .118
* 0.067 0.038 -0.048 0.085 0.104 -0.097 -0.003
BHAR_Clsd_3day 0.005 0.055 -0.046 0.028 -0.073 -0.044 0.106 0.030 0.070 -0.028 0.025 0.046 -0.047 -0.026
BHAR_Clsd_5day 0.018 0.051 -0.058 0.017 -0.084 -0.037 0.088 0.025 0.073 -0.040 -0.034 0.016 -0.003 -0.048
BHAR_Clsd_10day 0.003 0.069 -.129* 0.012 -0.069 -0.064 0.104 0.088 0.003 -0.102 0.032 0.061 -0.001 -0.023
BHAR_Clsd_30day -0.025 0.018 -0.061 0.013 -.152**
-.124* 0.037 -0.008 -0.031 0.045 0.055 0.049 0.002 -0.076
BHAR_Clsd_180day 0.023 -0.015 0.069 0.033 -0.106 -0.076 -0.055 0.018 -0.015 0.091 -0.053 -0.003 -0.002 -.132*
BHAR_Clsd_270day 0.024 -0.027 0.088 0.021 -0.067 -.117* -0.092 0.006 -0.057 0.046 -0.061 -0.040 0.062 -.134
*
BHAR_Clsd_360day -0.040 -0.067 0.087 0.018 0.003 -0.048 -0.084 -0.052 -0.035 0.078 -0.103 -0.064 0.069 -.133*
**. Correlation is significant at the 0.01 level (2-tailed).
*. Correlation is significant at the 0.05 level (2-tailed).
Correlation Matrix - All Transactions

181
Table 36: Dependent Variable Correlation Matrix – Leaders
N=87
Like Buying
Like
Businesses
Lag from
Critical Reg
Date
Approval
CycleStock Deal
Announced
During a
Recession
Closed During
a Recession
Announced
During a
Wave
Experienced
M&A Team
Company
Pressured to
Transact
First Deal For
Team
Critical Deal
for Acquirer
Multi State
Transaction
Overlapping
States
Multi
Business
Segment
SimRet_An_1day -0.020 0.091 -0.022 0.019 -0.147 -0.055 0.027 -0.142 0.039 0.114 -0.077 -0.047 0.059 -0.020
SimRet_An_3day 0.070 0.003 -0.009 -0.145 -0.091 0.104 0.048 -0.123 0.068 0.042 -0.138 -0.120 -0.028 -0.051
SimRet_An_5day 0.023 -0.080 0.018 -0.185 -0.029 -0.032 0.042 -0.161 -0.009 0.020 -0.124 -0.092 -0.026 -0.032
SimRet_An_10day -0.098 0.053 -0.010 0.053 -0.176 -0.099 -0.006 -.215* -0.031 0.095 -0.155 -0.107 0.069 -0.042
SimRet_An_30day 0.000 0.035 -0.057 -0.025 -.266* -0.030 0.009 -.227
* 0.043 0.158 -0.091 -0.030 0.019 -0.026
SimRet_An_180day -0.116 -.211* 0.047 -0.154 -0.029 -0.030 -0.191 -0.202 -0.044 0.186 -.235
*-.228
* 0.166 -0.072
SimRet_An_270day -0.069 -0.066 0.060 0.041 -0.061 -0.074 -0.143 -0.107 -0.044 0.174 -0.140 -0.150 0.124 -0.062
SimRet_An_360day -0.139 -0.087 0.058 -0.012 -0.028 -0.065 -0.201 -0.155 -0.157 0.155 -0.195 -0.188 0.174 -0.132
CAR_An_1day -0.016 0.104 -0.028 0.040 -0.124 -0.022 0.031 -0.108 0.044 0.117 -0.075 -0.054 0.034 -0.020
CAR_An_3day 0.052 0.028 -0.016 -0.103 -0.142 0.074 0.086 -0.087 0.114 0.043 -0.099 -0.105 -0.100 0.013
CAR_An_5day 0.011 -0.035 0.005 -0.145 -0.056 -0.057 0.099 -0.137 0.078 0.041 -0.079 -0.072 -0.152 0.036
CAR_An_10day -0.138 0.079 -0.042 0.096 -0.209 -0.092 0.007 -0.193 -0.007 0.110 -0.101 -0.086 -0.021 0.008
CAR_An_30day 0.061 0.106 -0.078 0.056 -.311** -0.056 0.101 -0.195 0.044 0.088 -0.058 -0.047 -0.043 -0.054
CAR_An_180day -0.083 -0.155 0.012 -0.119 -0.084 -0.013 -0.172 -0.193 -0.073 0.165 -0.191 -0.193 0.131 -0.071
CAR_An_270day -0.061 -0.050 0.041 0.033 -0.083 -0.080 -0.137 -0.136 -0.059 0.179 -0.113 -0.136 0.100 -0.063
CAR_An_360day -0.129 -0.077 0.056 -0.017 -0.021 -0.055 -0.190 -0.158 -0.154 0.139 -0.174 -0.168 0.155 -0.119
BHAR_An_1day -0.024 0.107 0.008 0.049 -0.095 -0.024 0.040 -0.132 0.056 0.149 -0.096 -0.102 0.066 -0.014
BHAR_An_3day 0.030 -0.005 0.037 -0.064 -0.096 0.070 0.073 -0.079 0.118 0.085 -0.130 -0.159 -0.060 0.048
BHAR_An_5day 0.011 -0.060 0.070 -0.062 -0.059 -0.050 0.061 -0.113 0.039 0.051 -0.086 -0.096 -0.120 0.102
BHAR_An_10day -0.144 0.040 -0.004 0.111 -.214* -0.045 -0.011 -0.197 -0.022 0.115 -0.124 -0.119 0.001 0.015
BHAR_An_30day 0.026 0.051 -0.010 0.064 -.269* 0.048 0.073 -0.196 0.007 0.082 -0.093 -0.117 0.022 -0.045
BHAR_An_180day -0.116 -0.169 0.080 -0.094 -0.148 -0.038 -0.179 -0.197 -0.086 0.201 -.214* -0.203 0.146 -0.084
BHAR_An_270day -0.104 -0.078 0.107 0.047 -0.124 -0.048 -0.154 -0.171 -0.067 .221* -0.140 -0.159 0.110 -0.073
BHAR_An_360day -0.164 -0.099 0.111 0.039 -0.061 -0.052 -0.202 -0.170 -0.154 0.161 -0.171 -0.175 0.155 -0.087
SimRet_Clsd_1day 0.148 0.089 0.061 0.087 0.065 0.019 0.106 0.039 0.022 -0.030 0.135 0.109 -0.060 0.011
SimRet_Clsd_3day 0.120 0.087 0.069 0.046 -0.102 -0.090 0.154 -0.008 0.047 -0.047 0.116 0.120 -0.058 0.012
SimRet_Clsd_5day 0.092 0.121 0.085 0.058 -0.116 -0.077 0.117 0.040 0.015 -0.064 0.052 0.070 -0.004 -0.038
SimRet_Clsd_10day -0.003 0.049 0.021 -0.051 0.020 -0.073 0.051 0.103 -0.056 -0.129 0.071 0.062 0.005 -0.034
SimRet_Clsd_30day -0.096 0.012 0.032 0.033 0.043 -0.115 -0.089 -0.090 -0.088 0.055 0.020 -0.036 0.118 -0.085
SimRet_Clsd_180day -0.086 -0.153 0.146 0.010 -0.018 -0.069 -0.166 -0.094 -0.034 0.181 -0.119 -0.067 0.012 -0.005
SimRet_Clsd_270day -0.021 -0.167 0.164 -0.026 -0.028 -0.129 -0.197 -0.074 -0.103 0.149 -0.112 -0.072 0.053 -0.083
SimRet_Clsd_360day -0.146 -0.135 0.112 -0.130 0.097 -0.113 -0.185 -0.142 -0.098 0.217 -0.184 -0.123 0.129 -0.048
CAR_Clsd_1day 0.142 0.107 0.025 0.044 0.096 0.045 0.113 0.056 0.021 -0.052 0.118 0.104 -0.074 0.024
CAR_Clsd_3day 0.073 0.057 0.005 -0.004 -0.024 0.032 0.106 0.029 0.032 -0.065 0.100 0.095 -0.116 0.045
CAR_Clsd_5day 0.062 0.118 -0.001 0.020 -0.048 0.069 0.078 0.080 0.005 -0.096 0.019 0.017 -0.054 -0.001
CAR_Clsd_10day 0.003 0.047 -0.057 -0.078 0.005 -0.041 0.058 0.108 -0.034 -0.131 0.062 0.043 -0.025 0.013
CAR_Clsd_30day -0.093 0.044 -0.028 0.039 0.006 -0.084 -0.072 -0.096 -0.057 0.074 0.026 -0.035 0.079 -0.038
CAR_Clsd_180day -0.054 -0.100 0.139 0.006 0.011 0.017 -0.124 -0.102 0.014 0.201 -0.110 -0.062 0.000 -0.014
CAR_Clsd_270day -0.011 -0.114 0.149 -0.043 0.012 -0.039 -0.176 -0.112 -0.080 0.178 -0.117 -0.081 0.071 -0.103
CAR_Clsd_360day -0.122 -0.095 0.093 -0.133 0.131 -0.027 -0.149 -0.160 -0.071 0.211 -0.172 -0.100 0.142 -0.044
BHAR_Clsd_1day 0.139 0.123 0.031 0.039 0.045 0.039 0.165 0.067 0.051 -0.069 0.081 0.110 -0.104 0.028
BHAR_Clsd_3day 0.138 0.129 0.019 0.025 -0.158 -0.042 0.196 0.093 0.110 -0.037 0.043 0.091 -0.121 0.004
BHAR_Clsd_5day 0.114 0.191 0.003 0.061 -0.108 0.064 0.168 0.148 0.026 -0.106 -0.016 0.015 -0.073 -0.045
BHAR_Clsd_10day 0.031 0.090 -0.047 -0.026 -0.056 -0.097 0.106 0.161 -0.047 -0.159 0.040 0.007 0.005 -0.004
BHAR_Clsd_30day -0.074 0.027 -0.018 0.019 -0.063 -0.134 -0.086 -0.123 -0.080 0.112 0.020 -0.031 0.079 -0.066
BHAR_Clsd_180day -0.060 -0.107 0.201 0.030 -0.023 -0.038 -0.118 -0.123 0.001 .215* -0.120 -0.060 0.007 -0.032
BHAR_Clsd_270day -0.021 -0.121 0.199 -0.020 0.026 -0.098 -0.186 -0.148 -0.093 0.193 -0.154 -0.126 0.092 -0.123
BHAR_Clsd_360day -0.146 -0.098 0.126 -0.056 0.100 -0.072 -0.156 -0.181 -0.052 .235* -0.176 -0.118 0.153 -0.039
**. Correlation is significant at the 0.01 level (2-tailed).
*. Correlation is significant at the 0.05 level (2-tailed).
Correlation Matrix - Leaders

182
Table 37: Dependent Variable Correlation Matrix – Laggards
N=81
Like Buying
Like
Businesses
Lag from
Critical Reg
Date
Approval
CycleStock Deal
Announced
During a
Recession
Closed During
a Recession
Announced
During a
Wave
Experienced
M&A Team
Company
Pressured to
Transact
First Deal For
Team
Critical Deal
for Acquirer
Multi State
Transaction
Overlapping
States
Multi
Business
Segment
SimRet_An_1day 0.086 0.139 -0.160 0.097 -0.035 0.067 0.109 0.004 0.075 -0.143 0.027 -0.047 -0.006 -0.137
SimRet_An_3day 0.144 0.183 -0.209 0.102 -0.129 -0.012 0.048 -0.019 0.034 0.001 -0.036 -0.073 0.038 -.291**
SimRet_An_5day 0.157 0.136 -.232* 0.041 -0.056 0.026 0.080 0.022 0.059 -0.059 -0.070 -0.107 0.087 -.263*
SimRet_An_10day 0.044 0.022 -0.169 0.087 0.004 -0.074 0.029 -0.041 0.046 0.027 -0.111 -0.169 0.067 -0.141
SimRet_An_30day .222* 0.009 -0.110 -0.049 0.215 0.060 0.064 -0.082 0.116 -0.003 -0.058 -.283* 0.209 -0.060
SimRet_An_180day .239* 0.038 -0.122 -0.177 0.157 0.044 -0.063 -0.104 -0.008 0.105 -0.166 -0.219 0.153 -.324**
SimRet_An_270day 0.209 0.031 -0.137 -0.152 0.104 0.027 -0.160 -0.096 -0.076 0.111 -0.137 -0.169 0.106 -.294**
SimRet_An_360day 0.139 -0.042 -0.184 -.247* 0.095 -0.032 -0.204 -0.151 -0.003 0.171 -0.144 -0.122 0.100 -.271*
CAR_An_1day 0.018 0.154 -0.188 0.131 0.023 0.050 0.138 0.021 0.051 -0.166 0.020 -0.046 0.066 -0.147
CAR_An_3day 0.078 0.187 -.295** 0.060 -0.112 -0.055 0.046 0.052 -0.011 -0.010 -0.118 -0.128 0.148 -.302**
CAR_An_5day 0.088 0.142 -.269* 0.004 -0.061 0.019 0.103 0.104 0.022 -0.092 -0.138 -0.168 0.182 -.273*
CAR_An_10day 0.027 0.053 -.230* 0.024 -0.085 -0.066 0.108 0.059 0.009 -0.092 -.226* -.266* .234* -0.131
CAR_An_30day 0.174 0.073 -0.108 -0.074 0.007 -0.065 0.177 0.053 0.120 -0.117 -0.129 -.317** .267* -0.110
CAR_An_180day 0.186 0.122 -0.129 -0.163 -0.033 0.075 0.135 0.002 0.072 -0.004 -.316** -.295** .244* -.383**
CAR_An_270day 0.150 0.082 -0.121 -0.088 -0.042 0.138 -0.036 -0.011 0.000 0.035 -.260* -.231* 0.173 -.398**
CAR_An_360day 0.086 -0.017 -0.086 -0.137 -0.021 0.174 -0.088 -0.051 0.067 0.035 -.252* -0.157 0.184 -.323**
BHAR_An_1day 0.059 0.140 -0.159 0.100 0.020 -0.004 0.055 -0.023 0.011 -0.056 0.058 -0.017 -0.014 -0.116
BHAR_An_3day 0.113 0.124 -0.169 0.007 0.019 -0.001 -0.090 -0.036 -0.038 0.072 0.008 -0.029 -0.001 -0.187
BHAR_An_5day 0.158 0.127 -0.196 -0.110 0.043 0.043 -0.042 0.014 0.009 0.049 -0.031 -0.068 0.028 -.243*
BHAR_An_10day -0.012 -0.026 -.227* -0.122 0.132 0.151 -0.123 -0.033 -0.037 -0.014 -0.176 -0.187 0.183 -0.110
BHAR_An_30day 0.097 -0.012 -0.122 -0.131 0.210 0.093 0.018 0.025 0.010 -0.164 -0.162 -.281* .230* -0.104
BHAR_An_180day 0.185 -0.002 -0.090 -0.198 0.069 0.187 -0.048 -0.092 0.043 0.106 -.364** -.299** .219* -.398**
BHAR_An_270day 0.137 -0.035 -0.044 -0.103 0.055 0.161 -0.112 -0.092 0.062 0.156 -.279* -0.217 0.147 -.448**
BHAR_An_360day 0.043 -0.090 -0.037 -0.106 0.071 0.207 -0.170 -0.092 0.107 0.144 -.282* -0.212 0.190 -.384**
SimRet_Clsd_1day 0.014 0.110 0.001 0.143 -0.067 -0.118 -0.098 0.170 -0.093 -0.001 0.090 0.056 -0.066 -0.009
SimRet_Clsd_3day 0.069 0.060 -0.081 -0.035 -0.030 -0.196 -0.175 -0.035 -0.070 0.118 0.098 0.158 -0.077 0.020
SimRet_Clsd_5day 0.031 -0.045 0.002 -0.053 -.227* -.356** -0.121 -0.090 0.105 .224* 0.113 0.100 -0.053 0.097
SimRet_Clsd_10day 0.111 0.094 -0.166 0.015 -0.200 -.260* -0.069 0.016 -0.066 0.102 0.053 0.027 -0.018 -0.133
SimRet_Clsd_30day 0.185 0.065 -0.028 -0.001 -0.089 -0.021 -0.107 0.010 0.049 0.188 -0.023 -0.001 -0.041 -.291**
SimRet_Clsd_180day 0.093 0.058 -0.083 -0.089 0.028 -0.158 -0.189 0.045 -0.008 0.174 -0.199 -0.030 -0.039 -.341**
SimRet_Clsd_270day 0.138 0.026 -0.097 -0.111 0.085 -0.114 -0.224 -0.080 0.054 0.222 -0.188 -0.038 -0.066 -.318**
SimRet_Clsd_360day 0.037 0.080 -0.146 0.005 0.125 -0.232 -0.157 -0.057 0.039 0.138 -0.104 0.083 -0.080 -0.201
CAR_Clsd_1day -0.009 0.059 0.134 0.204 0.007 -0.042 -0.060 0.135 -0.054 -0.018 0.116 0.004 -0.068 0.065
CAR_Clsd_3day -0.148 -0.134 0.127 0.068 0.202 0.091 -0.118 -0.104 0.033 0.018 0.004 0.100 -0.052 0.039
CAR_Clsd_5day -0.171 -0.169 0.103 0.037 0.074 -0.097 -0.105 -0.138 0.173 0.167 -0.014 0.075 0.001 0.072
CAR_Clsd_10day -0.054 0.054 -0.183 0.029 -0.065 -0.205 -0.039 0.020 -0.126 0.069 -0.074 -0.047 -0.009 -0.155
CAR_Clsd_30day 0.042 0.119 -0.109 -0.016 -0.144 0.030 0.008 0.079 -0.017 0.102 -0.085 -0.038 -0.042 -.287**
CAR_Clsd_180day 0.063 0.139 -0.061 0.033 -0.019 -0.019 -0.080 0.111 -0.058 0.043 -0.213 -0.045 -0.023 -.365**
CAR_Clsd_270day 0.121 0.109 -0.010 0.066 -0.026 0.046 -0.113 0.038 -0.092 0.009 -0.155 -0.022 -0.051 -.260*
CAR_Clsd_360day -0.044 0.058 -0.167 -0.002 -0.015 -0.069 -.223* 0.030 -0.141 0.005 -0.145 0.012 0.004 -.228*
BHAR_Clsd_1day -0.048 0.150 -0.012 .303** 0.010 -0.099 0.024 .335** -.231* -.225* 0.039 0.066 -0.071 -0.052
BHAR_Clsd_3day -.222* -0.095 -0.053 -0.090 0.187 0.016 -0.126 -0.020 0.044 0.019 -0.103 -0.062 0.050 -0.025
BHAR_Clsd_5day -.304** -.231* 0.010 -0.066 0.023 -0.119 -0.116 -0.044 0.194 0.164 -0.112 -0.117 0.107 -0.029
BHAR_Clsd_10day -0.176 0.089 -.268* -0.003 0.014 -.227* -0.003 0.127 -0.071 -0.077 -0.136 -0.107 0.108 -0.176
BHAR_Clsd_30day -0.066 0.019 -0.110 -0.069 -0.076 -0.006 -0.006 0.130 -0.088 0.023 -0.105 -0.072 0.000 -.303**
BHAR_Clsd_180day 0.089 0.164 -0.090 0.049 -0.018 -0.083 -0.095 0.112 -0.029 0.060 -.226* -0.073 0.019 -.439**
BHAR_Clsd_270day 0.098 0.098 0.018 0.123 -0.024 -0.037 -0.121 0.054 -0.072 0.046 -0.148 -0.070 0.008 -.300**
BHAR_Clsd_360day -0.043 0.039 -0.122 0.015 0.023 -0.039 -.253* 0.010 -0.121 0.083 -0.161 -0.055 0.080 -.334**
** Correlation is significant at the 0.01 level (2-tailed).
* Correlation is significant at the 0.05 level (2-tailed).
Correlation Matrix - Laggards

183
APPENDIX II: INDUSTRY AND SEGMENT REGRESSION RESULTS
Selecting and Identifying
Table 38: Selecting and Identifying Abnormal 3 Day (-3, +3) Returns
B t (sig) B t (sig) B t (sig) B t (sig) B t (sig)
(Constant) 0.009 (0.314) 0.059 (2.381) *** 0.4 (1.614) 0.013 (0.362) 0.027 (2.490) **
Like Buying Like Businesses 0.072 (3.841) *** -0.026 (-1.718) * -0.001 (-0.113) -0.011 (-0.487) 0.011 (0.225)
Lag from Critical Reg Date 0.001 (-2.278) ** 0.001 (-1.579) -0.001 (-0.263) 0.001 (0.709) -0.001 (-0.140)
Approval Cycle -0.001 (-0.460) 0.001 (0.292) -0.001 (-0.687) -0.001 (-2.234) ** -0.001 (-1.711) *
Stock Deal -0.141 (-4.994) *** -0.019 (-0.916) 0.022 (1.595) -0.006 (-0.296) 0.002 (0.206)
Announced During a Recession -0.061 (-0.903) -0.031 (-1.395) -0.017 (-0.810) -0.021 (-0.660) -0.021 (-1.830) *
Announced During a Merger Wave 0.007 (0.360) -0.006 (-0.342) -0.018 (-0.844) -0.001 (-0.009)
Experienced M&A Team -0.001 (-0.430) 0.014 (0.857) -0.008 (-0.795) -0.006 (-0.385) -0.007 (-1.068)
Company Pressured to Transact -0.013 (-0.475) -0.004 (-0.258) 0.024 (0.881) -0.002 (-0.161)
Critical Deal for Acquirer 0.051 (2.211) ** -0.006 (-0.388) -0.006 (-0.417) 0.019 (0.837) -0.005 (-0.624)
Multi State Transaction -0.033 (-1.417) -0.044 (-2.449) *** -0.011 (-0.742) 0.013 (0.580) -0.009 (-1.127)
Overlapping States 0.021 (0.967) -0.024 (-1.477) -0.009 (-0.818) 0.012 (0.542) -0.009 (-1.121)
Multi Business Segment Transaction 0.01 (0.586) -0.001 (-0.012) -0.002 (-0.115) -0.001 (-0.021) -0.003 (-0.357)
Number of Observations (n)
R-Square
F *** *
ALL:
336
0.033
0.926
t statistics in parenthesis, *Indicates significance at .1, **Indicates significance at .05, ***Indicates significance at .01
0.428 0.224 0.047 0.155
4.437 1.513 0.534 0.885
Group 1:
Resource Based
Group 2:
Utility
Group 3:
Midstream and
Transportation
Group 4:
Electric Power
46 75 142 70

184
Table 39: Selecting and Identifying Simple 3 Day (-3, +3) Returns
B t (sig) B t (sig) B t (sig) B t (sig) B t (sig)
(Constant) 0.008 (0.230) 0.063 (2.639) *** 0.59 (2.154) ** 0.18 (0.556) 0.03 (2.538) **
Like Buying Like Businesses 0.112 (-4.484) *** -0.022 (-1.503) -0.003 (-0.201) -0.013 (-0.707) 0.006 (0.900)
Lag from Critical Reg Date -0.001 (-1.870) * -0.001 (-2.126) ** -0.001 (-0.625) 0.001 (1.023) -0.001 (-0.306)
Approval Cycle 0.001 (-.266) 0.001 (0.157) -0.001 (-0.700) -0.001 (-2.161) ** -0.001 (-1.622)
Stock Deal -0.19 (-5.032) *** -0.018 (-0.887) 0.025 (1.609) -0.005 (-0.272) 0.001 (0.097)
Announced During a Recession -0.005 (-.225) -0.053 (-2.469) ** -0.017 (-0.731) -0.021 (-0.704) -0.024 (-2.012) **
Announced During a Merger Wave -0.033 (-0.149) -0.001 (-0.048) -0.01 (-0.482) 0.001 (0.104)
Experienced M&A Team 0.007 (-0.415) 0.011 (0.691) -0.013 (-1.123) -0.009 (-0.595) -0.01 (-1.367)
Company Pressured to Transact -0.012 (-0.433) -0.006 (-0.291) 0.012 (0.480) -0.004 (-0.280)
Critical Deal for Acquirer 0.061 (2.003) * 0.001 (0.071) 0.001 (0.066) 0.011 (0.507) -0.002 (-0.259)
Multi State Transaction -0.047 (-1.487) -0.043 (-2.510) ** -0.013 (-0.833) 0.014 (0.677) -0.009 (-1.057)
Overlapping States 0.013 (.448) -0.016 (-1.006) -0.013 (-1.102) 0.004 (0.170) -0.011 (-1.328)
Multi Business Segment Transaction 0.004 (.197) 0.003 (0.182) -0.008 (-0.443) 0.003 (0.160) -0.006 (-0.694)
Number of Observations (n)
R-Square
F *** *
ALL:
336
0.036
1.017
t statistics in parenthesis, *Indicates significance at .1, **Indicates significance at .05, ***Indicates significance at .01
0.572 0.258 0.056 0.165
4.811 1.826 0.644 0.952
Group 1:
Resource Based
Group 2:
Utility
Group 3:
Midstream and
Transportation
Group 4:
Electric Power
46 75 142 70

185
Transacting and Executing
Table 40: Transacting and Executing Abnormal 30 Day (-30, +30) Returns
B t (sig) B t (sig) B t (sig) B t (sig) B t (sig)
(Constant) 0.001 (0.003) 0.005 (0.117) -0.04 (-0.583) -0.058 (-0.772) 0.01 (0.383)
Like Buying Like Businesses 0.011 (0.126) 0.015 (0.641) -0.079 (-2.370) ** 0.049 (1.052) -0.018 (-1.069)
Lag from Critical Reg Date 0.001 (0.524) 0.001 (1.314) 0.001 (1.631) 0.001 (0.011) 0.001 (0.640)
Approval Cycle 0.001 (0.183) -0.001 (-1.222) 0.001 (1.956) * -0.001 (-2.537) ** -0.001 (-0.521)
Stock Deal -0.011 (-0.987) -0.017 (-0.555) -0.009 (-0.220) -0.02 (-0.474) 0.003 (0.141)
Closed During a Recession -0.014 (-0.100) -0.075 (-2.375) ** -0.109 (-1.977) ** -0.001 (-0.020) -0.043 (-1.579)
Announced During a Merger Wave 0.031 (0.996) -0.061 (-1.331) 0.006 (0.125) 0.004 (0.209)
Experienced M&A Team 0.018 (0.292) -0.019 (-0.790) -0.063 (-2.175) ** 0.01 (0.288) -0.022 (-1.160)
Company Pressured to Transact -0.036 (-0.862) -0.04 (-0.843) -0.009 (-0.143) -0.018 (-0.608)
Critical Deal for Acquirer -0.046 (-0.438) -0.019 (-0.752) 0.003 (0.761) 0.084 (1.691) * 0.011 (0.467)
Multi State Transaction 0.022 (0.224) 0.063 (2.403) ** 0.027 (0.725) 0.024 (0.481) 0.016 (0.769)
Overlapping States -0.064 (-0.636) -0.019 (-0.792) 0.03 (1.008) 0.043 (0.873) 0.002 (0.128)
Multi Business Segment Transaction -0.006 (-0.084) -0.02 (-0.806) -0.136 (-3.089) *** 0.026 (0.570) -0.021 (-1.068)
Number of Observations (n)
R-Square
F **
ALL:
335
0.031
0.871
t statistics in parenthesis, *Indicates significance at .1, **Indicates significance at .05, ***Indicates significance at .01
0.038 0.221 0.157 0.147
0.144 1.468 2.023 0.831
Group 1:
Resource Based
Group 2:
Utility
Group 3:
Midstream and
Transportation
Group 4:
Electric Power
46 74 142 70
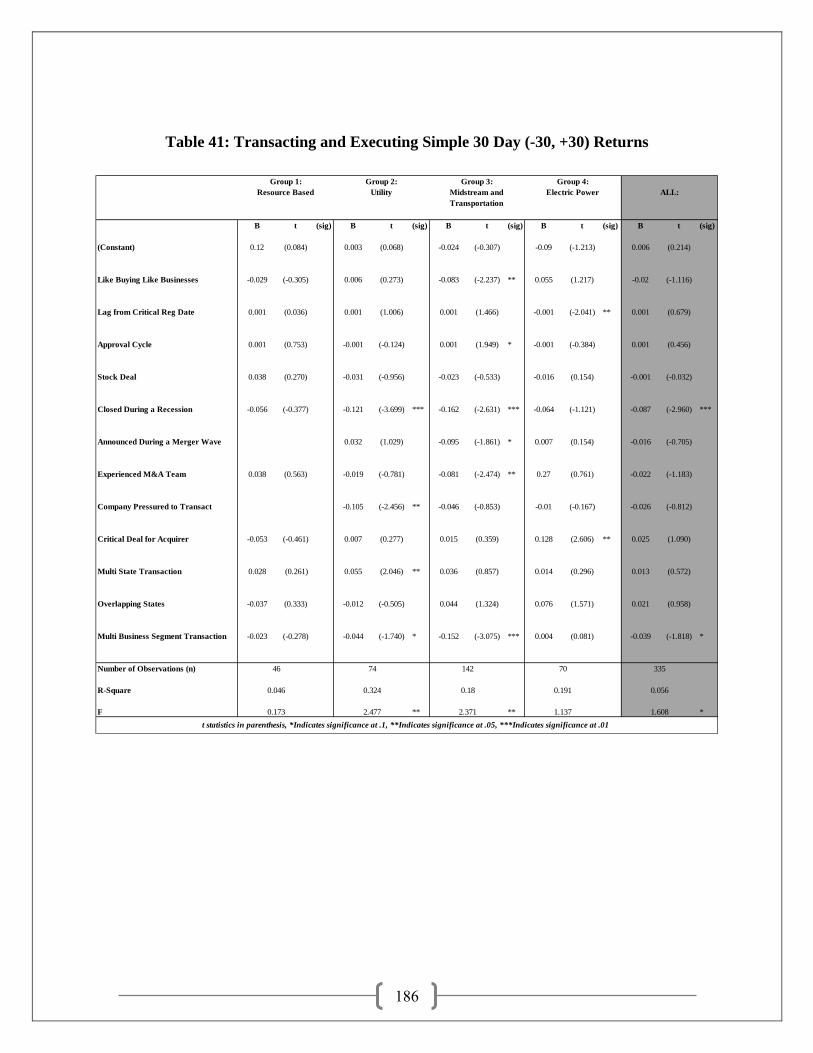
186
Table 41: Transacting and Executing Simple 30 Day (-30, +30) Returns
B t (sig) B t (sig) B t (sig) B t (sig) B t (sig)
(Constant) 0.12 (0.084) 0.003 (0.068) -0.024 (-0.307) -0.09 (-1.213) 0.006 (0.214)
Like Buying Like Businesses -0.029 (-0.305) 0.006 (0.273) -0.083 (-2.237) ** 0.055 (1.217) -0.02 (-1.116)
Lag from Critical Reg Date 0.001 (0.036) 0.001 (1.006) 0.001 (1.466) -0.001 (-2.041) ** 0.001 (0.679)
Approval Cycle 0.001 (0.753) -0.001 (-0.124) 0.001 (1.949) * -0.001 (-0.384) 0.001 (0.456)
Stock Deal 0.038 (0.270) -0.031 (-0.956) -0.023 (-0.533) -0.016 (0.154) -0.001 (-0.032)
Closed During a Recession -0.056 (-0.377) -0.121 (-3.699) *** -0.162 (-2.631) *** -0.064 (-1.121) -0.087 (-2.960) ***
Announced During a Merger Wave 0.032 (1.029) -0.095 (-1.861) * 0.007 (0.154) -0.016 (-0.705)
Experienced M&A Team 0.038 (0.563) -0.019 (-0.781) -0.081 (-2.474) ** 0.27 (0.761) -0.022 (-1.183)
Company Pressured to Transact -0.105 (-2.456) ** -0.046 (-0.853) -0.01 (-0.167) -0.026 (-0.812)
Critical Deal for Acquirer -0.053 (-0.461) 0.007 (0.277) 0.015 (0.359) 0.128 (2.606) ** 0.025 (1.090)
Multi State Transaction 0.028 (0.261) 0.055 (2.046) ** 0.036 (0.857) 0.014 (0.296) 0.013 (0.572)
Overlapping States -0.037 (0.333) -0.012 (-0.505) 0.044 (1.324) 0.076 (1.571) 0.021 (0.958)
Multi Business Segment Transaction -0.023 (-0.278) -0.044 (-1.740) * -0.152 (-3.075) *** 0.004 (0.081) -0.039 (-1.818) *
Number of Observations (n)
R-Square
F ** ** *
ALL:
335
0.056
1.608
t statistics in parenthesis, *Indicates significance at .1, **Indicates significance at .05, ***Indicates significance at .01
0.046 0.324 0.18 0.191
0.173 2.477 2.371 1.137
Group 1:
Resource Based
Group 2:
Utility
Group 3:
Midstream and
Transportation
Group 4:
Electric Power
46 74 142 70

187
Reconfiguring and Integrating
Table 42: Reconfiguring and Integrating Abnormal 360 Day (0, +360) Returns
B t (sig) B t (sig) B t (sig) B t (sig) B t (sig)
(Constant) -0.019 (-0.067) -0.04 (-0.460) -0.073 (-0.475) 0.123 (0.866) 0.053 (0.846)
Like Buying Like Businesses 0.468 (2.442) ** 0.076 (1.491) -0.15 (-2.020) ** -0.069 (-0.811) -0.063 (-1.623)
Lag from Critical Reg Date 0.001 (0.581) 0.001 (1.537) 0.001 (0.839) 0.001 (0.272) 0.001 (0.551)
Approval Cycle -0.001 (-0.340) -0.001 (-0.700) 0.002 (3.034) *** 0.001 (1.435) 0.001 (1.299)
Stock Deal -1.052 (-3.612) *** 0.09 (1.295) -0.035 (-0.398) 0.028 (0.360) 0.011 (0.227)
Closed During a Recession 0.215 (0.706) 0.046 (0.648) -0.06 (-0.486) 0.053 (0.502) 0.025 (0.396)
Announced During a Merger Wave 0.141 (2.054) ** -0.212 (-2.079) ** -0.147 (-1.725) * -0.041 (-0.831)
Experienced M&A Team 0.07 (0.509) -0.137 (-2.531) ** -0.015 (-0.231) 0.056 (0.848) -0.022 (-0.564)
Company Pressured to Transact -0.172 (-1.846) * 0.022 (0.203) 0.205 (1.826) * -0.007 (-0.101)
Critical Deal for Acquirer -0.202 (-0.866) -0.055 (-0.961) -0.007 (-0.081) -0.089 (-0.973) -0.071 (-1.452)
Multi State Transaction -0.108 (-0.491) 0.123 (2.095) ** 0.119 (1.434) -0.063 (-0.694) 0.077 (1.618)
Overlapping States -0.021 (-0.095) 0.02 (0.381) 0.079 (1.178) -0.152 (-1.689) * 0.171 (0.381)
Multi Business Segment Transaction 0.204 (1.225) -0.081 (-1.471) -0.459 (-4.665) *** -0.133 (-1.667) * -0.114 (-2.492) **
Number of Observations (n)
R-Square
F ** * ***
ALL:
335
0.042
1.186
t statistics in parenthesis, *Indicates significance at .1, **Indicates significance at .05, ***Indicates significance at .01
0.412 0.245 0.198 0.138
2.526 1.676 2.676 0.774
Group 1:
Resource Based
Group 2:
Utility
Group 3:
Midstream and
Transportation
Group 4:
Electric Power
46 74 142 70

188
Table 43: Reconfiguring and Integrating Buy and Hold 360 Day (0, +360) Returns
B t (sig) B t (sig) B t (sig) B t (sig) B t (sig)
(Constant) -0.126 (-0.509) -0.201 (-1.916) * -0.337 (-2.048) ** -0.044 (-0.278) -0.052 (-0.790)
Like Buying Like Businesses 0.518 (3.077) *** 0.142 (2.296) ** -0.251 (-3.160) *** -0.008 (-0.083) -0.058 (-1.425)
Lag from Critical Reg Date 0.001 (0.678) 0.002 (1.820) * 0.003 (2.407) ** 0.001 (0.627) 0.001 (0.152)
Approval Cycle -0.001 (-0.458) 0.001 (0.160) 0.002 (2.743) *** 0.001 (1.359) 0.001 (2.290) **
Stock Deal -0.884 (-3.458) *** 0.114 (1.363) 0.004 (0.471) 0.063 (0.705) 0.059 (1.125)
Closed During a Recession -0.165 (-0.618) 0.184 (1.059) -0.282 (-2.157) ** 0.039 (0.324) -0.079 (-1.194)
Announced During a Merger Wave 0.139 (1.669) * -0.368 (-3.378) *** -0.157 (-1.513) -0.076 (-1.462)
Experienced M&A Team -0.14 (-0.115) -0.059 (-0.894) -0.075 (-1.081) 0.117 (1.537) -0.018 (-0.426)
Company Pressured to Transact -0.088 (-0.781) -0.024 (-0.212) 0.227 (1.761) * 0.019 (0.269)
Critical Deal for Acquirer -0.183 (-0.893) -0.017 (-0241) -0.006 (-0.069) -0.098 (-0.936) -0.058 (-1.130)
Multi State Transaction -0.172 (-0.889) 0.069 (0.974) 0.092 (1.041) -0.045 (-0.434) 0.035 (0.696)
Overlapping States -0.019 (-0.094) 0.07 (0.107) 0.089 (1.253) -0.164 (-1.591) 0.021 (0.446)
Multi Business Segment Transaction 0.188 (1.284) -0.184 (-2.754) *** -0.422 (-4.018) *** -0.223 (-2.293) ** -0.145 (-3.014) ***
Number of Observations (n)
R-Square
F ** ** *** **
ALL:
335
0.063
1.813
t statistics in parenthesis, *Indicates significance at .1, **Indicates significance at .05, ***Indicates significance at .01
0.439 0.279 0.225 0.174
2.822 1.998 3.137 1.018
Group 1:
Resource Based
Group 2:
Utility
Group 3:
Midstream and
Transportation
Group 4:
Electric Power
46 74 142 70

189
Table 44: Reconfiguring and Integrating Simple 360 Day (0, +360) Returns
B t (sig) B t (sig) B t (sig) B t (sig) B t (sig)
(Constant) 0.258 (0.826) 0.076 (0.787) 0.087 (0.414) 0.278 (1.848) * 0.176 (2.326) **
Like Buying Like Businesses 0.564 (2.626) ** 0.079 (1.360) -0.254 (-2.417) ** -0.093 (-1.016) -0.059 (-1.249)
Lag from Critical Reg Date -0.002 (-0.746) 0.001 (0.297) 0.002 (1.122) -0.001 (-0.072) 0.001 (0.186)
Approval Cycle 0.001 (0.150) -0.001 (-0.407) 0.002 (2.103) ** 0.001 (1.708) * 0.001 (1.500)
Stock Deal -1.08 (-3.471) *** 0.029 (0.381) 0.038 (0.308) -0.057 (-0.716) -0.007 (-0.114)
Closed During a Recession -0.197 (-0.626) -0.22 (-2.810) ** -0.232 (-1.491) -0.166 (-1.531) -0.228 (-3.165)
Announced During a Merger Wave 0.095 (1.249) -0.301 (-2.294) ** -0.401 (-3.847) *** -0.101 (-1.690) *
Experienced M&A Team 0.043 (0.285) -0.079 (-1.266) -0.036 (-0.407) 0.063 (0.905) -0.024 (-0.518)
Company Pressured to Transact -0.068 (-0.659) 0.019 (0.126) 0.398 (3.105) *** 0.035 (0.406)
Critical Deal for Acquirer -0.175 (-0.182) -0.024 (-0.383) -0.046 (-0.397) 0.012 (0.132) -0.072 (-1.235)
Multi State Transaction -0.255 (-0.958) 0.096 (1.474) 0.059 (0.520) -0.083 (-0.897) 0.046 (0.808)
Overlapping States -0.054 (-0.222) 0.018 (0.302) 0.012 (0.128) -0.12 (-1.289) -0.001 (-0.017)
Multi Business Segment Transaction 0.269 (1.528) -0.031 (-0.499) 0.545 (-4.144) *** -0.198 (-2.254) ** -0.127 (-2.339) **
Number of Observations (n)
R-Square
F ** ** *** **
ALL:
304
0.075
1.978
t statistics in parenthesis, *Indicates significance at .1, **Indicates significance at .05, ***Indicates significance at .01
0.449 0.223 0.189 0.372
2.609 1.389 2.156 2.668
Group 1:
Resource Based
Group 2:
Utility
Group 3:
Midstream and
Transportation
Group 4:
Electric Power
42 70 123 66

190
APPENDIX III: INDUSTRY QUANTILE REGRESSION RESULTS
Table 45: Selecting and Identifying Quantile Regression Results
-3, +3 Simple Returns
B SE t p B SE t p B SE t p B SE t p B SE t p
(Constant) -0.018 0.021 -0.840 0.401 -0.014 0.011 -1.246 0.214 0.012 0.009 1.239 0.216 0.038 0.016 2.417 0.016 0.065 0.019 3.446 0.001
Like Buying Like Businesses 0.001 0.011 0.083 0.934 0.001 0.006 0.241 0.810 0.002 0.005 0.323 0.747 -0.007 0.008 -0.845 0.399 -0.010 0.010 -1.038 0.300
Lag from Critical Reg Date 0.000 0.000 0.009 0.993 0.000 0.000 -0.266 0.790 0.000 0.000 -0.409 0.683 0.000 0.000 0.489 0.625 0.000 0.000 0.204 0.838
Approval Cycle 0.000 0.000 0.183 0.855 0.000 0.000 -0.153 0.879 0.000 0.000 -1.637 0.103 0.000 0.000 -1.305 0.193 0.000 0.000 -1.932 0.054
Stock Deal -0.013 0.014 -0.910 0.364 0.005 0.008 0.582 0.561 -0.002 0.006 -0.274 0.784 -0.007 0.011 -0.691 0.490 0.012 0.013 0.916 0.361
Announced During a Recession -0.119 0.018 -6.476 0.000 -0.023 0.010 -2.270 0.024 -0.017 0.008 -2.034 0.043 -0.012 0.014 -0.880 0.380 0.056 0.017 3.375 0.001
Announced During a Merger Wave 0.010 0.014 0.679 0.498 0.000 0.008 0.034 0.973 0.002 0.006 0.352 0.725 0.004 0.011 0.336 0.737 0.007 0.013 0.527 0.599
Experienced M&A Team -0.007 0.011 -0.636 0.525 -0.005 0.006 -0.851 0.395 -0.007 0.005 -1.394 0.164 -0.020 0.009 -2.393 0.017 -0.023 0.010 -2.202 0.028
Company Pressured to Transact -0.020 0.020 -1.008 0.314 -0.004 0.011 -0.391 0.696 -0.009 0.009 -1.026 0.306 -0.019 0.015 -1.256 0.210 -0.005 0.018 -0.292 0.770
Critical Deal for Acquirer -0.016 0.014 -1.159 0.247 0.001 0.008 0.190 0.850 0.005 0.006 0.738 0.461 0.007 0.010 0.635 0.526 0.010 0.013 0.828 0.408
Multi State Transaction -0.017 0.014 -1.271 0.205 -0.011 0.007 -1.454 0.147 -0.009 0.006 -1.543 0.124 -0.011 0.010 -1.051 0.294 0.009 0.012 0.736 0.462
Overlapping States -0.001 0.013 -0.099 0.921 0.000 0.007 0.058 0.953 0.008 0.006 1.382 0.168 0.015 0.010 1.531 0.127 -0.009 0.011 -0.766 0.444
Multi Business Segment Transaction -0.006 0.013 -0.441 0.659 0.009 0.007 1.223 0.222 0.004 0.006 0.642 0.521 0.004 0.010 0.408 0.684 0.006 0.012 0.524 0.601
-3, +3 Abnormal Returns
B SE t p B SE t p B SE t p B SE t p B SE t p
(Constant) -0.035 0.013 -2.669 0.008 -0.016 0.008 -1.926 0.055 -0.016 0.008 -1.926 0.055 0.032 0.009 3.468 0.001 0.059 0.013 4.479 0.000
Like Buying Like Businesses 0.008 0.007 1.078 0.282 0.008 0.004 1.731 0.084 0.008 0.004 1.731 0.084 -0.006 0.005 -1.156 0.249 -0.012 0.007 -1.686 0.093
Lag from Critical Reg Date 0.000 0.000 1.627 0.105 0.000 0.000 1.801 0.073 0.000 0.000 1.801 0.073 0.000 0.000 0.127 0.899 0.000 0.000 0.081 0.935
Approval Cycle 0.000 0.000 -0.092 0.927 0.000 0.000 -0.136 0.892 0.000 0.000 -0.136 0.892 0.000 0.000 -1.754 0.080 0.000 0.000 -2.552 0.011
Stock Deal -0.009 0.009 -1.026 0.305 -0.001 0.006 -0.113 0.910 -0.001 0.006 -0.113 0.910 -0.008 0.006 -1.244 0.215 -0.007 0.009 -0.773 0.440
Announced During a Recession -0.121 0.012 -10.308 0.000 -0.013 0.007 -1.734 0.084 -0.013 0.007 -1.734 0.084 0.002 0.008 0.293 0.770 0.052 0.012 4.436 0.000
Announced During a Merger Wave -0.008 0.009 -0.919 0.359 0.003 0.006 0.600 0.549 0.003 0.006 0.600 0.549 0.007 0.006 1.165 0.245 0.006 0.009 0.623 0.534
Experienced M&A Team 0.006 0.007 0.859 0.391 -0.005 0.004 -1.107 0.269 -0.005 0.004 -1.107 0.269 -0.013 0.005 -2.518 0.012 -0.016 0.007 -2.261 0.024
Company Pressured to Transact 0.009 0.013 0.744 0.457 -0.016 0.008 -2.016 0.045 -0.016 0.008 -2.016 0.045 -0.012 0.009 -1.400 0.163 -0.024 0.013 -1.936 0.054
Critical Deal for Acquirer -0.010 0.009 -1.138 0.256 -0.006 0.005 -1.157 0.248 -0.006 0.005 -1.157 0.248 0.006 0.006 1.022 0.307 0.009 0.009 0.985 0.325
Multi State Transaction -0.007 0.009 -0.777 0.438 -0.011 0.005 -2.061 0.040 -0.011 0.005 -2.061 0.040 -0.008 0.006 -1.398 0.163 -0.013 0.009 -1.523 0.129
Overlapping States -0.008 0.008 -0.939 0.349 0.000 0.005 0.024 0.981 0.000 0.005 0.024 0.981 0.007 0.006 1.232 0.219 0.012 0.008 1.545 0.123
Multi Business Segment Transaction -0.002 0.008 -0.256 0.798 0.003 0.005 0.571 0.568 0.003 0.005 0.571 0.568 0.001 0.006 0.220 0.826 0.004 0.008 0.426 0.671
Quantile:
.10
Quantile:
.25
Quantile:
.50
Quantile:
.75
Quantile:
.90
Quantile:
.10
Quantile:
.25
Quantile:
.50
Quantile:
.75
Quantile:
.90

191
Table 46: Transacting and Executing Quantile Regression Results
-30, +30 Simple Returns
B SE t p B SE t p B SE t p B SE t p B SE t p
(Constant) -0.140 0.043 -3.282 0.001 -0.064 0.028 -2.245 0.025 -0.064 0.028 -2.245 0.025 0.054 0.026 2.104 0.036 0.106 0.033 3.185 0.002
Like Buying Like Businesses 0.020 0.023 0.870 0.385 0.007 0.015 0.454 0.650 0.007 0.015 0.454 0.650 0.007 0.014 0.511 0.610 0.025 0.018 1.414 0.158
Lag from Critical Reg Date 0.000 0.000 -0.804 0.422 0.000 0.000 -0.310 0.757 0.000 0.000 -0.310 0.757 0.000 0.000 -0.516 0.606 0.000 0.000 -0.831 0.406
Approval Cycle 0.000 0.000 1.052 0.294 0.000 0.000 1.463 0.145 0.000 0.000 1.463 0.145 0.000 0.000 -1.023 0.307 0.000 0.000 -2.302 0.022
Stock Deal -0.066 0.029 -2.248 0.025 -0.011 0.019 -0.581 0.562 -0.011 0.019 -0.581 0.562 -0.018 0.017 -1.005 0.316 -0.008 0.023 -0.349 0.728
Closed During a Recession -0.235 0.037 -6.409 0.000 -0.126 0.024 -5.192 0.000 -0.126 0.024 -5.192 0.000 -0.059 0.022 -2.678 0.008 0.042 0.029 1.456 0.146
Announced During a Merger Wave 0.024 0.029 0.815 0.416 0.019 0.019 0.988 0.324 0.019 0.019 0.988 0.324 -0.023 0.017 -1.345 0.180 -0.034 0.023 -1.492 0.137
Experienced M&A Team 0.030 0.023 1.295 0.196 -0.005 0.015 -0.359 0.720 -0.005 0.015 -0.359 0.720 -0.010 0.014 -0.708 0.480 -0.020 0.018 -1.101 0.272
Company Pressured to Transact 0.008 0.040 0.203 0.839 -0.042 0.027 -1.568 0.118 -0.042 0.027 -1.568 0.118 0.038 0.024 1.574 0.116 0.021 0.031 0.679 0.498
Critical Deal for Acquirer 0.003 0.028 0.088 0.930 0.020 0.019 1.044 0.297 0.020 0.019 1.044 0.297 0.033 0.017 1.918 0.056 0.044 0.022 2.002 0.046
Multi State Transaction 0.012 0.028 0.440 0.660 0.001 0.018 0.045 0.964 0.001 0.018 0.045 0.964 0.022 0.017 1.313 0.190 0.013 0.022 0.577 0.564
Overlapping States 0.011 0.026 0.415 0.678 -0.012 0.017 -0.721 0.472 -0.012 0.017 -0.721 0.472 -0.035 0.015 -2.247 0.025 -0.027 0.020 -1.341 0.181
Multi Business Segment Transaction 0.037 0.027 1.378 0.169 0.022 0.018 1.223 0.222 0.022 0.018 1.223 0.222 0.043 0.016 2.697 0.007 0.063 0.021 3.041 0.003
-30, +30 Abnormal Returns
B SE t p B SE t p B SE t p B SE t p B SE t p
(Constant) -0.051 0.029 -1.780 0.076 -0.029 0.019 -1.481 0.140 -0.029 0.019 -1.475 0.141 0.043 0.019 2.253 0.025 0.059 0.026 2.275 0.024
Like Buying Like Businesses -0.020 0.015 -1.279 0.202 -0.002 0.010 -0.196 0.845 0.009 0.010 0.914 0.361 0.005 0.010 0.454 0.650 0.025 0.014 1.814 0.071
Lag from Critical Reg Date 0.000 0.000 -1.631 0.104 0.000 0.000 -1.588 0.113 0.000 0.000 -0.085 0.932 0.000 0.000 -0.085 0.933 0.000 0.000 0.203 0.839
Approval Cycle 0.000 0.000 -0.239 0.811 0.000 0.000 -1.586 0.114 0.000 0.000 0.183 0.855 0.000 0.000 -1.667 0.096 0.000 0.000 -2.171 0.031
Stock Deal -0.036 0.020 -1.804 0.072 0.000 0.013 -0.030 0.976 -0.009 0.013 -0.685 0.494 -0.007 0.013 -0.508 0.612 -0.015 0.018 -0.876 0.382
Closed During a Recession -0.180 0.025 -7.284 0.000 -0.087 0.017 -5.223 0.000 -0.048 0.017 -2.902 0.004 -0.005 0.016 -0.330 0.741 0.120 0.022 5.451 0.000
Announced During a Merger Wave 0.034 0.020 1.732 0.084 0.021 0.013 1.590 0.113 0.010 0.013 0.742 0.459 -0.002 0.013 -0.157 0.875 -0.001 0.017 -0.030 0.976
Experienced M&A Team 0.020 0.016 1.268 0.206 -0.003 0.010 -0.334 0.739 -0.019 0.010 -1.855 0.064 -0.015 0.010 -1.508 0.133 -0.036 0.014 -2.599 0.010
Company Pressured to Transact -0.034 0.027 -1.258 0.209 -0.016 0.018 -0.896 0.371 -0.007 0.018 -0.397 0.692 0.030 0.018 1.691 0.092 0.015 0.024 0.639 0.523
Critical Deal for Acquirer 0.007 0.019 0.349 0.727 -0.001 0.013 -0.045 0.964 -0.003 0.013 -0.195 0.846 0.007 0.013 0.537 0.591 0.044 0.017 2.557 0.011
Multi State Transaction 0.020 0.019 1.072 0.284 0.016 0.013 1.236 0.217 0.042 0.013 3.336 0.001 0.019 0.012 1.522 0.129 0.021 0.017 1.244 0.215
Overlapping States -0.003 0.017 -0.178 0.859 -0.001 0.012 -0.083 0.934 -0.003 0.012 -0.227 0.820 -0.001 0.011 -0.120 0.905 -0.015 0.015 -0.976 0.330
Multi Business Segment Transaction -0.010 0.018 -0.562 0.575 0.015 0.012 1.229 0.220 0.027 0.012 2.221 0.027 0.011 0.012 0.962 0.337 0.038 0.016 2.393 0.017
Quantile:
.10
Quantile:
.25
Quantile:
.50
Quantile:
.75
Quantile:
.90
Quantile:
.10
Quantile:
.25
Quantile:
.50
Quantile:
.75
Quantile:
.90
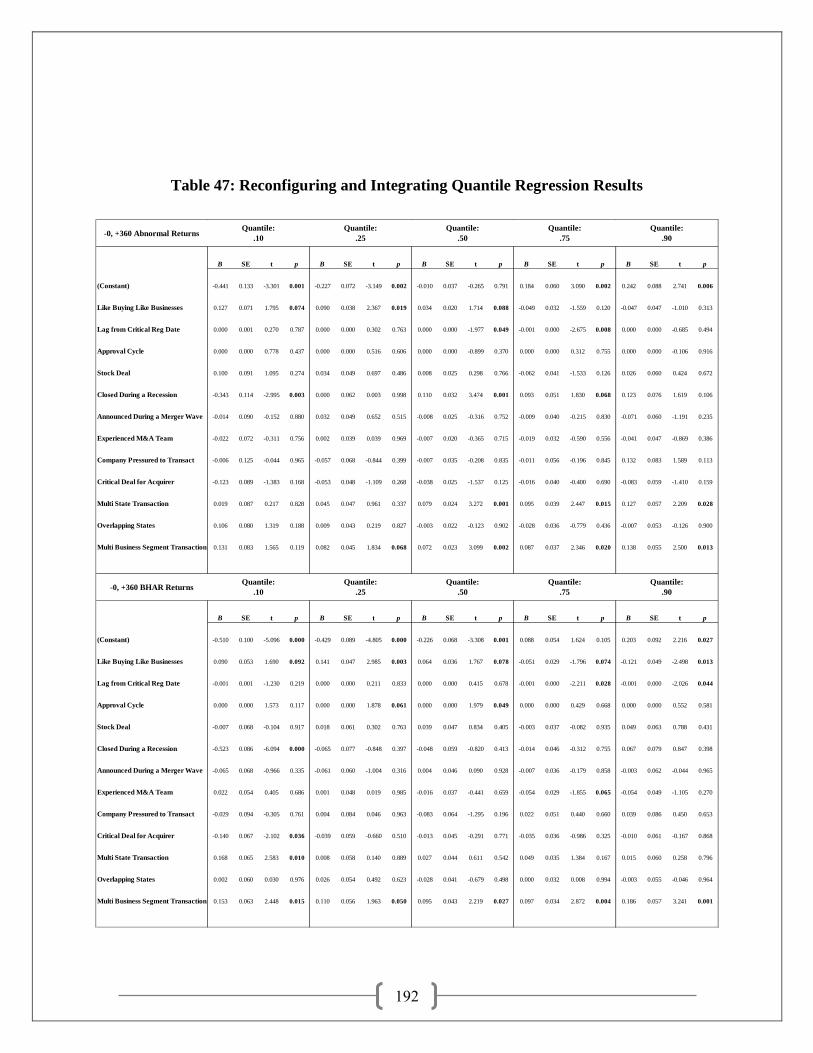
192
Table 47: Reconfiguring and Integrating Quantile Regression Results
-0, +360 Abnormal Returns
B SE t p B SE t p B SE t p B SE t p B SE t p
(Constant) -0.441 0.133 -3.301 0.001 -0.227 0.072 -3.149 0.002 -0.010 0.037 -0.265 0.791 0.184 0.060 3.090 0.002 0.242 0.088 2.741 0.006
Like Buying Like Businesses 0.127 0.071 1.795 0.074 0.090 0.038 2.367 0.019 0.034 0.020 1.714 0.088 -0.049 0.032 -1.559 0.120 -0.047 0.047 -1.010 0.313
Lag from Critical Reg Date 0.000 0.001 0.270 0.787 0.000 0.000 0.302 0.763 0.000 0.000 -1.977 0.049 -0.001 0.000 -2.675 0.008 0.000 0.000 -0.685 0.494
Approval Cycle 0.000 0.000 0.778 0.437 0.000 0.000 0.516 0.606 0.000 0.000 -0.899 0.370 0.000 0.000 0.312 0.755 0.000 0.000 -0.106 0.916
Stock Deal 0.100 0.091 1.095 0.274 0.034 0.049 0.697 0.486 0.008 0.025 0.298 0.766 -0.062 0.041 -1.533 0.126 0.026 0.060 0.424 0.672
Closed During a Recession -0.343 0.114 -2.995 0.003 0.000 0.062 0.003 0.998 0.110 0.032 3.474 0.001 0.093 0.051 1.830 0.068 0.123 0.076 1.619 0.106
Announced During a Merger Wave -0.014 0.090 -0.152 0.880 0.032 0.049 0.652 0.515 -0.008 0.025 -0.316 0.752 -0.009 0.040 -0.215 0.830 -0.071 0.060 -1.191 0.235
Experienced M&A Team -0.022 0.072 -0.311 0.756 0.002 0.039 0.039 0.969 -0.007 0.020 -0.365 0.715 -0.019 0.032 -0.590 0.556 -0.041 0.047 -0.869 0.386
Company Pressured to Transact -0.006 0.125 -0.044 0.965 -0.057 0.068 -0.844 0.399 -0.007 0.035 -0.208 0.835 -0.011 0.056 -0.196 0.845 0.132 0.083 1.589 0.113
Critical Deal for Acquirer -0.123 0.089 -1.383 0.168 -0.053 0.048 -1.109 0.268 -0.038 0.025 -1.537 0.125 -0.016 0.040 -0.400 0.690 -0.083 0.059 -1.410 0.159
Multi State Transaction 0.019 0.087 0.217 0.828 0.045 0.047 0.961 0.337 0.079 0.024 3.272 0.001 0.095 0.039 2.447 0.015 0.127 0.057 2.209 0.028
Overlapping States 0.106 0.080 1.319 0.188 0.009 0.043 0.219 0.827 -0.003 0.022 -0.123 0.902 -0.028 0.036 -0.779 0.436 -0.007 0.053 -0.126 0.900
Multi Business Segment Transaction 0.131 0.083 1.565 0.119 0.082 0.045 1.834 0.068 0.072 0.023 3.099 0.002 0.087 0.037 2.346 0.020 0.138 0.055 2.500 0.013
-0, +360 BHAR Returns
B SE t p B SE t p B SE t p B SE t p B SE t p
(Constant) -0.510 0.100 -5.096 0.000 -0.429 0.089 -4.805 0.000 -0.226 0.068 -3.308 0.001 0.088 0.054 1.624 0.105 0.203 0.092 2.216 0.027
Like Buying Like Businesses 0.090 0.053 1.690 0.092 0.141 0.047 2.985 0.003 0.064 0.036 1.767 0.078 -0.051 0.029 -1.796 0.074 -0.121 0.049 -2.498 0.013
Lag from Critical Reg Date -0.001 0.001 -1.230 0.219 0.000 0.000 0.211 0.833 0.000 0.000 0.415 0.678 -0.001 0.000 -2.211 0.028 -0.001 0.000 -2.026 0.044
Approval Cycle 0.000 0.000 1.573 0.117 0.000 0.000 1.878 0.061 0.000 0.000 1.979 0.049 0.000 0.000 0.429 0.668 0.000 0.000 0.552 0.581
Stock Deal -0.007 0.068 -0.104 0.917 0.018 0.061 0.302 0.763 0.039 0.047 0.834 0.405 -0.003 0.037 -0.082 0.935 0.049 0.063 0.788 0.431
Closed During a Recession -0.523 0.086 -6.094 0.000 -0.065 0.077 -0.848 0.397 -0.048 0.059 -0.820 0.413 -0.014 0.046 -0.312 0.755 0.067 0.079 0.847 0.398
Announced During a Merger Wave -0.065 0.068 -0.966 0.335 -0.061 0.060 -1.004 0.316 0.004 0.046 0.090 0.928 -0.007 0.036 -0.179 0.858 -0.003 0.062 -0.044 0.965
Experienced M&A Team 0.022 0.054 0.405 0.686 0.001 0.048 0.019 0.985 -0.016 0.037 -0.441 0.659 -0.054 0.029 -1.855 0.065 -0.054 0.049 -1.105 0.270
Company Pressured to Transact -0.029 0.094 -0.305 0.761 0.004 0.084 0.046 0.963 -0.083 0.064 -1.295 0.196 0.022 0.051 0.440 0.660 0.039 0.086 0.450 0.653
Critical Deal for Acquirer -0.140 0.067 -2.102 0.036 -0.039 0.059 -0.660 0.510 -0.013 0.045 -0.291 0.771 -0.035 0.036 -0.986 0.325 -0.010 0.061 -0.167 0.868
Multi State Transaction 0.168 0.065 2.583 0.010 0.008 0.058 0.140 0.889 0.027 0.044 0.611 0.542 0.049 0.035 1.384 0.167 0.015 0.060 0.258 0.796
Overlapping States 0.002 0.060 0.030 0.976 0.026 0.054 0.492 0.623 -0.028 0.041 -0.679 0.498 0.000 0.032 0.008 0.994 -0.003 0.055 -0.046 0.964
Multi Business Segment Transaction 0.153 0.063 2.448 0.015 0.110 0.056 1.963 0.050 0.095 0.043 2.219 0.027 0.097 0.034 2.872 0.004 0.186 0.057 3.241 0.001
Quantile:
.10
Quantile:
.25
Quantile:
.50
Quantile:
.75
Quantile:
.90
Quantile:
.10
Quantile:
.25
Quantile:
.50
Quantile:
.75
Quantile:
.90
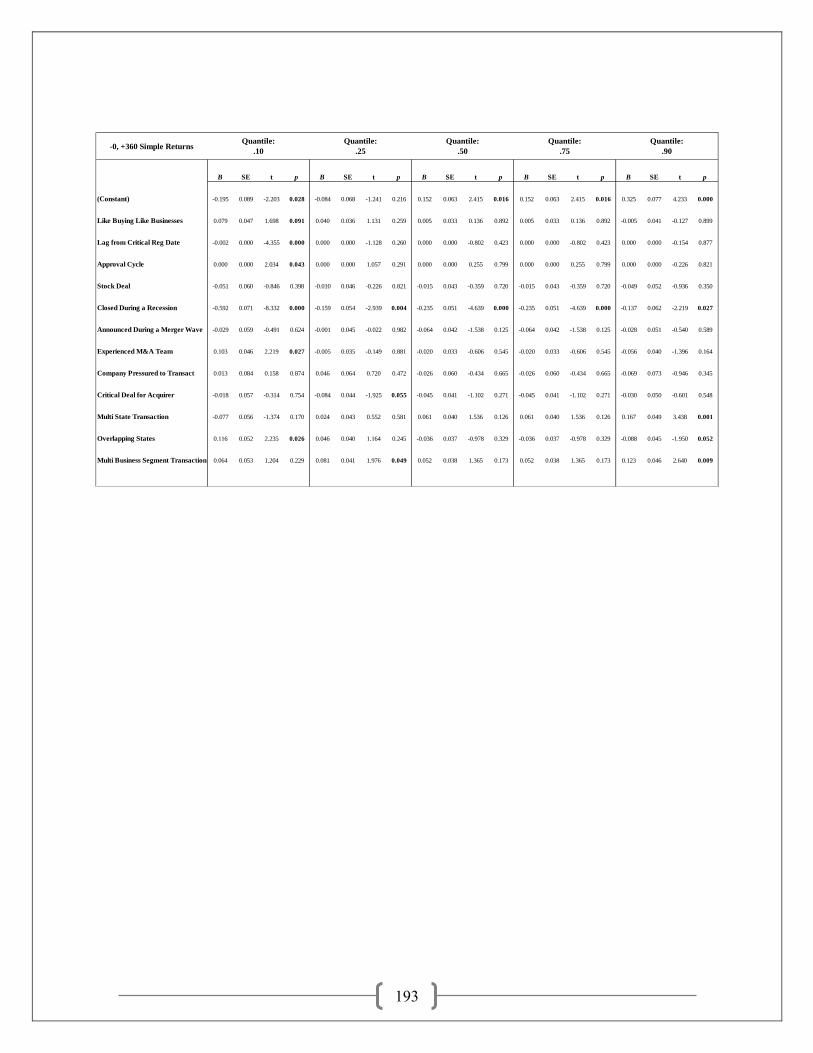
193
-0, +360 Simple Returns
B SE t p B SE t p B SE t p B SE t p B SE t p
(Constant) -0.195 0.089 -2.203 0.028 -0.084 0.068 -1.241 0.216 0.152 0.063 2.415 0.016 0.152 0.063 2.415 0.016 0.325 0.077 4.233 0.000
Like Buying Like Businesses 0.079 0.047 1.698 0.091 0.040 0.036 1.131 0.259 0.005 0.033 0.136 0.892 0.005 0.033 0.136 0.892 -0.005 0.041 -0.127 0.899
Lag from Critical Reg Date -0.002 0.000 -4.355 0.000 0.000 0.000 -1.128 0.260 0.000 0.000 -0.802 0.423 0.000 0.000 -0.802 0.423 0.000 0.000 -0.154 0.877
Approval Cycle 0.000 0.000 2.034 0.043 0.000 0.000 1.057 0.291 0.000 0.000 0.255 0.799 0.000 0.000 0.255 0.799 0.000 0.000 -0.226 0.821
Stock Deal -0.051 0.060 -0.846 0.398 -0.010 0.046 -0.226 0.821 -0.015 0.043 -0.359 0.720 -0.015 0.043 -0.359 0.720 -0.049 0.052 -0.936 0.350
Closed During a Recession -0.592 0.071 -8.332 0.000 -0.159 0.054 -2.939 0.004 -0.235 0.051 -4.639 0.000 -0.235 0.051 -4.639 0.000 -0.137 0.062 -2.219 0.027
Announced During a Merger Wave -0.029 0.059 -0.491 0.624 -0.001 0.045 -0.022 0.982 -0.064 0.042 -1.538 0.125 -0.064 0.042 -1.538 0.125 -0.028 0.051 -0.540 0.589
Experienced M&A Team 0.103 0.046 2.219 0.027 -0.005 0.035 -0.149 0.881 -0.020 0.033 -0.606 0.545 -0.020 0.033 -0.606 0.545 -0.056 0.040 -1.396 0.164
Company Pressured to Transact 0.013 0.084 0.158 0.874 0.046 0.064 0.720 0.472 -0.026 0.060 -0.434 0.665 -0.026 0.060 -0.434 0.665 -0.069 0.073 -0.946 0.345
Critical Deal for Acquirer -0.018 0.057 -0.314 0.754 -0.084 0.044 -1.925 0.055 -0.045 0.041 -1.102 0.271 -0.045 0.041 -1.102 0.271 -0.030 0.050 -0.601 0.548
Multi State Transaction -0.077 0.056 -1.374 0.170 0.024 0.043 0.552 0.581 0.061 0.040 1.536 0.126 0.061 0.040 1.536 0.126 0.167 0.049 3.438 0.001
Overlapping States 0.116 0.052 2.235 0.026 0.046 0.040 1.164 0.245 -0.036 0.037 -0.978 0.329 -0.036 0.037 -0.978 0.329 -0.088 0.045 -1.950 0.052
Multi Business Segment Transaction 0.064 0.053 1.204 0.229 0.081 0.041 1.976 0.049 0.052 0.038 1.365 0.173 0.052 0.038 1.365 0.173 0.123 0.046 2.640 0.009
Quantile:
.10
Quantile:
.25
Quantile:
.50
Quantile:
.75
Quantile:
.90

194
REFERENCES
Agrawal, Anup, Jeffrey F. Jaffe, and Gershon N. Mandelker. "The post-merger performance
of acquiring firms: a re-examination of an anomaly." The Journal of Finance 47.4 (1992): 1605-
1621.
Alchian, Armen A., and Harold Demsetz. "Production, information costs, and economic
organization." The American economic review (1972): 777-795.
Ambrosini, Véronique, and Cliff Bowman. "What are dynamic capabilities and are they a
useful construct in strategic management?." International Journal of Management Reviews 11.1
(2009): 29-49.
Amiryany, Nima, et al. "Acquisition reconfiguration capability." European Journal of
Innovation Management 15.2 (2012): 177-191.
Anand, Jaideep, Laurence Capron, and Will Mitchell. "Using acquisitions to access
multinational diversity: thinking beyond the domestic versus cross-border M&A comparison."
Industrial and Corporate Change 14.2 (2005): 191-224.
Andrade, Gregor, Mark Mitchell, and Erik Stafford. "New evidence and perspectives on
mergers." (2001): 01-070.
Anand, Jaideep. "M&A strategies in mature and declining industries: theoretical perspectives
and implications." Advances in Mergers and Acquisitions 4 (2005): 163-179.
Barber, Brad M., and John D. Lyon. "Detecting long-run abnormal stock returns: The
empirical power and specification of test statistics." Journal of financial economics 43.3 (1997):
341-372.
Barney, Jay. "Firm resources and sustained competitive advantage." Journal of management
17.1 (1991): 99-120.
Barkema, Harry G., and Mario Schijven. "How do firms learn to make acquisitions? A
review of past research and an agenda for the future."Journal of Management 34.3 (2008): 594-
634

195
Becketti, Sean. "Corporate mergers and the business cycle." Economic Review 71.5 (1986):
13-26.
Barney, Jay B. "Resource-based theories of competitive advantage: A ten-year retrospective
on the resource-based view." Journal of management 27.6 (2001): 643-650.
Barney, J. B., and W. S. Hesterley. "VRIO Framework, Strategic Management and
Competitive Advantage." (2010): 68-86.
Bartunek, Kenneth, Kenneth Jessell, and Jeff Madura. "Are acquisitions by utility firms
beneficial?" Applied Economics 25.11 (1993): 1401-1408.
Baumol, William J. "Formal entrepreneurship theory in economics: Existence and bounds."
Journal of business venturing 8.3 (1993): 197-210.
Becher, David A., J. Harold Mulherin, and Ralph A. Walkling. "Sources of gains in corporate
mergers: Refined tests from a neglected industry." Journal of Financial and Quantitative Analysis
47.1 (2012): 57.
Becker-Blease, John R., Lawrence G. Goldberg, and Fred R. Kaen. "Mergers and
acquisitions as a response to the deregulation of the electric power industry: value creation or
value destruction?" Journal of Regulatory Economics 33.1 (2008): 21-53.
Becketti, Sean. "Corporate mergers and the business cycle." Economic Review 71.5 (1986):
13-26.
Beitel, P.D.. Schiereck and M.Wahrenburg. 2002. Explaining the M&A Success in the
European bank market, Working paper, University of Witten, Herdecke, Germany.
Berger, Philip G., and Eli Ofek. "Diversification's effect on firm value."Journal of financial
economics 37.1 (1995): 39-65.
Berry, S. Keith. "Excess returns in electric utility mergers during transition to competition."
Journal of Regulatory Economics 18.2 (2000): 175-188.Capron, Laurence. The long-term
performance of horizontal acquisitions. INSEAD, 1999.
Bruner, Robert F. Applied Mergers and Acquisitions. Vol. 175. John Wiley & Sons, 2011.

196
Bruner, Robert F. Deals from Hell: M&A lessons that rise above the ashes. John Wiley &
Sons, 2009.
Bruner, Robert F. "Does M&A pay? A survey of evidence for the decision-maker." Journal
of Applied Finance 12.1 (2002): 48-68.
Capasso, Arturo, and Olimpia Meglio. "10. Knowledge transfer in mergers and acquisitions:
how frequent acquirers learn to manage the integration process." Strategic Capabilities and
Knowledge Transfer Within and Between Organizations: New Perspectives from Acquisitions,
Networks, Learning and Evolution (2005): 199.
Capron, Laurence, and Anand, Jaideep ."Acquisition Based Dynamic Capabilities”, in Helfat,
Constance E., et al. Dynamic capabilities: Understanding strategic change in organizations.
John Wiley & Sons, 2009.
Capron, Laurence, Will Mitchell, and Anand Swaminathan. "Post-acquisition resource
redeployment and asset divestiture: An evolutionary view." Ann Arbor 1001 (1999): 48109-
1234.
Capron, Laurence, Will Mitchell, and Anand Swaminathan. "Asset divestiture following
horizontal acquisitions: A dynamic view." Strategic Management Journal 22.9 (2001): 817-844.
Capron, Laurence, and Nathalie Pistre. "When do acquirers earn abnormal returns?."
Strategic Management Journal 23.9 (2002): 781-794.
Capron, Laurence, Pierre Dussauge, and Will Mitchell. "Resource redeployment following
horizontal acquisitions in Europe and North America, 1988–1992." Strategic Management
Journal 19.7 (1998): 631-661.
Capron, Laurence, and Nathalie Pistre. "When do acquirers earn abnormal returns?."
Strategic Management Journal 23.9 (2002): 781-794.
Carow, Kenneth, Randall Heron, and Todd Saxton. "Do early birds get the returns? An
empirical investigation of early‐mover advantages in acquisitions." Strategic Management
Journal 25.6 (2004): 563-585.
Chandler, Alfred D. "Strategy and structure." Resources, Firms, and Strategies (1964): 40-
51.

197
Chandler, Alfred Dupont. Strategy and structure: chapters in the history of the industrial
enterprise. Vol. 120. MIT press, 1990
Coase, Ronald H. "The nature of the firm." economica 4.16 (1937): 386-405.
Collis, David J. "Research note: how valuable are organizational capabilities?." Strategic
management journal 15.S1 (1994): 143-152.
Collis, David J., and Cynthia A. Montgomery. "Competing on Resources." Harvard Business
Review 86.7/8 (2008): 140.
Collis, David J. "Research note: how valuable are organizational capabilities?." Strategic
management journal 15.S1 (1994): 143-152.
Cyert, Richard M., and James G. March. "A behavioral theory of the firm." Englewood
Cliffs, NJ 2 (1963).
Demsetz, Harold. "The theory of the firm revisited." Journal of Law, Economics, &
Organization (1988): 141-161.
Dussauge, Pierre, Bernard Garrette, and Will Mitchell. "Learning from competing partners:
Outcomes and durations of scale and link alliances in Europe, North America and Asia."
Strategic management journal 21.2 (2000): 99-126.
Eisenhardt, Kathleen M., and Jeffrey A. Martin. "Dynamic capabilities: What are they."
Strategic management journal 21.1 (2000): 1105-1121.
Fama, Eugene F. "Agency Problems and the Theory of the Firm." The journal of political
economy (1980): 288-307.
Ferris, Stephen P., and Kwangwoo Park. "How different is the long-run performance of
mergers in the telecommunications industry?." Available at SSRN 262388 (2001).
Fiol, C. Marlene, and Edward J. O'Connor. "Waking up! Mindfulness in the face of
bandwagons." Academy of Management Review 28.1 (2003): 54-70.

198
Finkelstein, Sydney, and Jerayr Haleblian. "Understanding acquisition performance: The role
of transfer effects." Organization Science 13.1 (2002): 36-47.
Floreani, Alberto, and Silvia Rigamonti. "Mergers and Shareholders' Wealth in the Insurance
Industry." EFMA 2001 Lugano Meetings. 2001.
Franks, Julian R., Robert S. Harris, and Cohn Mayer. "Means of payment in takeovers:
Results for the United Kingdom and the United States." Corporate takeovers: Causes and
consequences. University of Chicago Press, 1988. 221-264.
Fuller, Kathleen, Jeffry Netter, and Mike Stegemoller. "What do returns to acquiring firms
tell us? Evidence from firms that make many acquisitions. “The Journal of Finance 57.4 (2002):
1763-1793.
Geroski, Paul, and Paul Gregg. "Corporate restructuring in the UK during the
recession." Business Strategy Review 5.2 (1994): 1-19.
Grant, Robert M. "Toward a knowledge‐based theory of the firm." Strategic management
journal 17.S2 (1996): 109-122.
Ghosh, A. 2002. Increasing Market Share: A rationale for Corporate Acquisitions. Baruch
College, Working Paper.
Hagedoorn, John, and Geert Duysters. "External sources of innovative capabilities: the
preferences for strategic alliances or mergers and acquisitions." Journal of management studies
39.2 (2002): 167-188.
Haleblian, Jerayr, et al. "Taking stock of what we know about mergers and acquisitions: A
review and research agenda." Journal of Management 35.3 (2009): 469-502.
Haleblian, Jerayr, and Sydney Finkelstein. "The influence of organizational acquisition
experience on acquisition performance: A behavioral learning perspective." Administrative
Science Quarterly 44.1 (1999): 29-56.
Harford, Jarrad. "What drives merger waves?" Journal of financial economics 77.3 (2005):
529-560.
Hao, Lingxin, and Daniel Q. Naiman. Quantile regression. No. 149. Sage, 2007.

199
Hart, Oliver. "An Economist's Perspective on the Theory of the Firm." Columbia law review
(1989): 1757-1774.
Hayward, Mathew LA, and Donald C. Hambrick. "Explaining the premiums paid for large
acquisitions: Evidence of CEO hubris." Administrative Science Quarterly (1997): 103-127.
Hayward, Mathew LA. "When do firms learn from their acquisition experience? Evidence
from 1990 to 1995." Strategic management journal23.1 (2002): 21-39.
Heimeriks, Koen H., Mario Schijven, and Stephen Gates. "Manifestations of higher-order
routines: The underlying mechanisms of deliberate learning in the context of post-acquisition
integration." Academy of Management Journal55.3 (2012): 703-726.
Helfat, Constance E., and Margaret A. Peteraf. "The dynamic resource‐based view:
Capability lifecycles." Strategic management journal 24.10 (2003): 997-1010.
Helfat, Constance, and Margaret Peteraf. "Understanding dynamic capabilities: progress
along a developmental path." Strategic organization 7.1 (2009): 91.
Helfat, Constance E., et al. Dynamic capabilities: Understanding strategic change in
organizations. John Wiley & Sons, 2009.
Homburg, Christian, and Matthias Bucerius. "Is speed of integration really a success factor of
mergers and acquisitions? An analysis of the role of internal and external relatedness." Strategic
management journal 27.4 (2006): 347-367.
Jensen, Michael C., and William H. Meckling. Theory of the firm: Managerial behavior,
agency costs, and ownership structure. Springer Netherlands, 1979.
Karim, Samina, and Will Mitchell. "Path-dependent and path-breaking change: reconfiguring
business resources following acquisitions in the US medical sector, 1978–1995." (2000).
Keil, Thomas, Tomi Laamanen, and Aino Mäkisalo. "Acquisitions, acquisition programs and
acquisition capabilities." The handbook of mergers and acquisitions 148 (2012).
Koenker, Roger, and Gilbert Bassett Jr. "Regression quantiles."Econometrica: Journal of the
Econometric Society (1978): 33-50.
Koenker, Roger, and Yannis Bilias. "Quantile Regression for Duration Data” Empirical
Economics. March 26:1, pp 1990220.

200
Koenker, Roger, and Kevin Hallock. "Quantile regression: An introduction."Journal of
Economic Perspectives 15.4 (2001): 43-56.
Kohers, Ninon, and Theodor Kohers. "The value creation potential of high-tech
mergers." Financial Analysts Journal 56.3 (2000): 40-51.
Kohers, Ninon, and Theodor Kohers. "Takeovers of technology firms: Expectations vs.
reality." Financial management (2001): 35-54.
Kuipers, David R., Darius P. Miller, and Ajay Patel. "The legal environment and corporate
valuation: Evidence from cross-border takeovers. “International Review of Economics &
Finance 18.4 (2009): 552-567.
Leggio, Karyl B., and Donald Lien. "Mergers in the electric utility industry in a deregulatory
environment." Journal of Regulatory Economics 17.1 (2000): 69-85.
Lubatkin, Michael. "Merger strategies and stockholder value." Strategic management
journal 8.1 (1987): 39-53.
Lubatkin, Michael, Narasimhan Srinivasan, and Hemant Merchant. "Merger strategies and
shareholder value during times of relaxed antitrust enforcement: The case of large mergers
during the 1980s." Journal of Management 23.1 (1997): 59-81.
Mcnamara, Gerry M., Jerayr John Haleblian, and Bernadine Johnson Dykes. "The
performance implications of participating in an acquisition wave: Early mover advantages,
bandwagon effects, and the moderating influence of industry characteristics and acquirer tactics."
Academy of Management Journal 51.1 (2008): 113-130.
McKinsey and Company. 2015 Annual Global Survey of Mergers and Acquisitions”
McKinsey and Conmpany, New York, 2016.
Mintzberg, Henry, and James A. Waters. "Of strategies, deliberate and emergent." Strategic
management journal 6.3 (1985): 257-272.
Mitchell, Will, and J. Myles Shaver. "Who buys what? How integration capability affects
acquisition incidence and target choice." Strategic Organization 1.2 (2003): 171-201.
Moeller, S. F. Schlingemann, and R. Stutz, Do shareholders of acquiring firms gain from
acquisitions? Ohio State university working paper. 2003.

201
Moeller, Sara B., Frederik P. Schlingemann, and René M. Stulz. "Firm size and the gains
from acquisitions." Journal of Financial Economics 73.2 (2004): 201-228.
Mulherin, J. Harold, and Audra L. Boone. "Comparing acquisitions and Divestitures."
Journal of corporate finance 6.2 (2000): 117-139.
Myers, Michael D. Qualitative research in business and management. Sage, 2013.
Nummela, Niina, and Mélanie Hassett. "Opening the black box of acquisition
capabilities." The Routledge Companion to Mergers and Acquisitions (2015): 74.
Óladóttir, Ásta Dís. "Integrative Capacity as a Moving Force in Newly Formed Icelandic
Multinational Enterprises." Review of Market Integration2.1 (2010): 135-172.
Penrose, Edith Tilton. The Theory of the Growth of the Firm. Oxford university press, 1959.
Peteraf, Margaret A. "The cornerstones of competitive advantage: a resource‐based view."
Strategic management journal 14.3 (1993): 179-191.
Petit, B. The long horizon performance of acquiring firms. The French Evidence. Working
Paper, American Graduate School of International management. (2000).
Porter, Michael E. Competitive advantage of nations: creating and sustaining superior
performance. Simon and Schuster, 2011 (1985).
Porter, Michael E. Competitive advantage: Creating and sustaining superior performance.
Simon and Schuster, 2008.(1980).
Prahalad, C. K., and Gary Hamel. "The core competence of the corporation." Boston (Ma)
1990 (1990): 235-256.
Priem, Richard L., and John E. Butler. "Is the resource-based “view” a useful perspective for
strategic management research?." Academy of management review 26.1 (2001): 22-40.
Ricardo, David. On the Principles of Political Economy and Taxation: London. 1817.
Rumelt, Richard P. "Towards a strategic theory of the firm." Competitive strategic
management 26 (1984): 556-570.
202
Rumelt, Richard P., Dan Schendel, and David J. Teece. "Strategic management and
economics." Strategic management journal 12.S2 (1991): 5-29.
Stigler, G. "The Economics of Information"(1961)." J. Pol. Econ. 69: 213.
Teece, David J. "Economies of scope and the scope of the enterprise." Journal of economic
behavior & organization 1.3 (1980): 223-247.
Teece, David J. "Towards an economic theory of the multiproduct firm." Journal of
Economic Behavior & Organization 3.1 (1982): 39-63.
Teece, D., and G. Pisano. "The Dynamic Capabilities of Firms: An Introduction."
INTERNATIONAL LIBRARY OF CRITICAL WRITINGS IN ECONOMICS 163 (2003): 223-242.
Teece, David J., Gary Pisano, and Amy Shuen. "Dynamic capabilities and strategic
management." (1997): 509-33.
Teece, David J. "Explicating dynamic capabilities: the nature and microfoundations of
(sustainable) enterprise performance." Strategic management journal 28.13 (2007): 1319-1350.
Teece, David J. Dynamic capabilities and strategic management: organizing for innovation
and growth. Oxford University Press, 2009.
Vermeulen, Freek, and Harry Barkema. "Learning through acquisitions." Academy of
Management journal 44.3 (2001): 457-476.
Vester, John. "Lessons learned about integrating acquisitions." Research Technology
Management 45.3 (2002): 33.
Walker, M. Mark. "Corporate takeovers, strategic objectives, and acquiring-firm shareholder
wealth." Financial management (2000): 53-66.
Wang, Catherine L., and Pervaiz K. Ahmed. "Dynamic capabilities: A review and research
agenda." International journal of management reviews 9.1 (2007): 31-51.
Wernerfelt, Birger. "A resource‐based view of the firm." Strategic management journal 5.2
(1984): 171-180.
Williamson, Oliver E. The economic institutions of capitalism. Simon and Schuster, 1985.

203
Williamson, Oliver E. "Markets and hierarchies." New York (1975): 26-30.
Winter, Sidney G. "Understanding dynamic capabilities." Strategic management journal
24.10 (2003): 991-995.
Yagil, Joseph. "Mergers and macro-economic factors." Review of financial economics 5.2
(1996): 181-190.
Yin, Robert K. Case study research: Design and methods. Sage publications, 2013.
Zahra, Shaker A., and Gerard George. "The net-enabled business innovation cycle and the
evolution of dynamic capabilities." Information Systems Research 13.2 (2002): 147-150.
Zahra, Shaker A., Harry J. Sapienza, and Per Davidson. "Entrepreneurship and dynamic
capabilities: a review, model and research agenda*." Journal of Management studies 43.4
(2006): 917-955.
Zollo, Maurizio, and Sidney G. Winter. "Deliberate learning and the evolution of dynamic
capabilities." Organization science 13.3 (2002): 339-351.
Zollo, Maurizio, and Harbir Singh. "Deliberate learning in corporate acquisitions: post‐
acquisition strategies and integration capability in US bank mergers." Strategic Management
Journal 25.13 (2004): 1233-1256.

204
ABOUT THE AUTHOR
Rich Berard is senior vice president of Hunt Consolidated, Inc. In this capacity, he heads the
Office of Program Management, which is responsible for the project management, oversight and
coordination for many of the growth, investment and business building programs of the
company. Prior to this assignment, Berard led groups within the Hunt organization in the areas of
strategic management reporting, corporate finance, financial administration and strategic
planning.
Prior to joining the Hunt companies in 2002, Berard was employed by Arthur Andersen,
LLP, and managed multiple projects from Andersen's Global Energy practice in Houston, Texas.
While at Andersen, he consulted to global energy clients in the areas of business transformation
and reengineering, M&A integration, strategic cost management and organizational optimization
and design. In his consulting career, Berard has consulted to dozens of clients in the energy
sector including oil and gas, power and utility companies.
Before joining Arthur Andersen's consulting practice, he spent three years as an energy
economist employed by an international government. Berard serves on the board of directors of
Power Capital Partners, a power generating investment company in New York and the
Association of Internal Management Consultants (AIMC). He is the author of articles in industry
journals and books and has served as a speaker and presenter at energy-related industry events.
Berard received a Bachelor of business administration degree from the University of Miami
and a Master of Science degree in economics with honors from Bentley University. He is also a
graduate of the University of Chicago's Graduate School of Business' advanced management
program. Berard will receive his Doctorate in Business from Georgia State University on May 1,
2016 with honors and membership in Golden Key International. .
Berard resides in Murphy, TX with his wife of 21 years (Ann) and two sons, Jake (18 years
old) and Jamison (9 years old).


![The Dynamic Capabilities of Firms.ppt [Read-Only]secure.com.sg/courses/ICI/Grab/Student_Presentations/A01_G05.pdf · Capabilities Dynamic Capabilities ... customers), unique (so that](https://img.pdfslide.us/doc/110x75/5b82eebd7f8b9adc698bfe46/the-dynamic-capabilities-of-firmsppt-read-only-capabilities-dynamic-capabilities.jpg)