Embed Size (px)
Citation preview
Southern Illinois University CarbondaleOpenSIUC
Research Papers Graduate School
2013
Creating Sustainable Urban Land Use Patterns: AComparison of Portland, Oregon and St. Louis,MissouriWilliam T. SutphinSouthern Illinois University Carbondale, [email protected]
Follow this and additional works at: http://opensiuc.lib.siu.edu/gs_rp
This Article is brought to you for free and open access by the Graduate School at OpenSIUC. It has been accepted for inclusion in Research Papers byan authorized administrator of OpenSIUC. For more information, please contact [email protected].
Recommended CitationSutphin, William T., "Creating Sustainable Urban Land Use Patterns: A Comparison of Portland, Oregon and St. Louis, Missouri"(2013). Research Papers. Paper 363.http://opensiuc.lib.siu.edu/gs_rp/363

CREATING SUSTAINBLE URBAN LAND USE PATTERNS: A COMPARISON OF PORTLAND, OREGON AND ST. LOUIS, MISSOURI.
By
William Sutphin
Geography and Environmental Resources, Political Science and International Relations
B.S., Southern Illinois University, 2011
A Research Paper Submitted in Partial Fulfillment of the Requirements for the
Master of Science Degree
Department of Geography In the Graduate School
Southern Illinois University Carbondale May 2013
RESEARCH PAPER APPROVAL
CREATING SUSTAINABLE URBAN LAND USE PATTERNS: A COMPARISON OF PORTLAND, OREGON AND ST. LOUIS, MISSOURI
By
William Sutphin
A Research Paper Submitted in Partial
Fulfillment of the Requirements
for the Degree of
Masters of Science
in the field of Geography
Approved by:
Leslie Duram Chair
Julie Weinert
Kofi Akamani
Graduate School Southern Illinois University Carbondale
April 11, 2013
i
TABLE OF CONTENTS
CHAPTER PAGE
CHAPTER 1
Introduction .........................................................................................................................1
Goals Of The Paper ..............................................................................................................2
Metropolitan Urban Sprawl .................................................................................................3
Definitions ...........................................................................................................................5
Low-Density Development ..................................................................................................6
Inner City .............................................................................................................................9
Transportation ...................................................................................................................11
Sustainable Land Use ........................................................................................................14
CHAPTER 2 – Portland Policies
Introduction: Portland ........................................................................................................18
Portland Policies ................................................................................................................22
2040 Growth Concept and Development Planning ...........................................................22
Metro ..................................................................................................................................26
Urban Growth Boundary ...................................................................................................27
Transportation ..................................................................................................................31
Effects of Policies ..............................................................................................................33
CHAPTER 3 – St. Louis Policies
Introduction to St. Louis ....................................................................................................36
St. Louis Policies ..............................................................................................................38
Urban Redevelopment ........................................................................................................38

ii
Transportation ...................................................................................................................39
Effects of Policies ..............................................................................................................40
CHAPTER 4 – Comparison and Conclusion
Comparison of Portland and St. Louis ...............................................................................47
Comparison of Policies ......................................................................................................49
Conclusion .........................................................................................................................54
REFERENCES .............................................................................................................................57

iii
LIST OF TABLES
TABLE PAGE
Table 4.1 Comparison of Portland and St. Louis ...........................................................................48
iv
LIST OF FIGURES
FIGURE PAGE
Figure 1.1 Median Population Growth By Decade ..........................................................................4
Figure 2.1 Population Trend of Portland and Portland Metropolitan Area ...................................19
Figure 2.2 Urban Growth Boundary of Portland ...........................................................................30
Figure 3.1 Population Trends of St. Louis City and Greater St. Louis 1900-2010 .......................37
Figure 3.2 Government Fragmentation of Greater St. Louis Area ................................................44
Figure 4.1 Population Trends of Case Studies ...............................................................................49
! ! 1
! ! 1!
CHAPTER 1: INTRODUCTION
The area needed to sustain an urban region does not lie within the jurisdictional
boundaries of the urban area, but can be at least 100-300 times larger than the urban area
in question (Rees 1992; Rees and Wackernagel 1994; Rees and Wackernagel 1996;
Kenworthy 2006). The natural resources used to sustain urban areas come from either the
surrounding hinterlands or are transported in from around the world. It is this land that is
mostly considered to be part of urban sprawl, which is the phenomenon of unequal
expansion of urban areas compared to population growth, which results in lower densities
and larger urban land areas. This land outside of the jurisdictional boundaries is mostly
low-density development that focuses on the automobile as the main source of
transportation. The growth of urban areas in the manner of low-density development
allows for excessive resource use, larger amounts of land use, and inner city decline all of
which are incompatible with an urban area developing sustainably.
Arguably the most important aspect of any theory for sustainable urban
development is that they promote urban compactness. Sustainable cities could be much
more economically efficient and more benign environmentally, when concentrated
human activities occur in confined spaces, which reduces the human footprint (Owen
2009). Environmental and economical benefits are not the only benefits that could come
about from more compact urban areas. Possible social equity effects of compactness
include: better access to facilities, better job accessibility, better public transportation,
greater opportunities for walking and cycling, reduced domestic living space, reduced
crime, lower levels of social segregation, possible reduction in livability in compact cities
(Burton 2000). The effects of a sustainably designed urban area could have the impact to
! ! 2
! ! 2!
change how humans interact with the environment and with each other. Urbanized areas
cover approximately 3% of Earth’s surface, yet they have extraordinarily large ecological
“footprints” and complex, powerful, and often-indirect effects on ecosystems (Alberti et
al 2003). With the rise of population and the increasing use of urban areas it will be a
more balanced approach to critically assess the positive and negative effects of urban
sprawl.
By understanding how our urban areas can contribute to sustainable development
or respond to historical challenges, we can have more informed policies that have
positive effects on the future of our environmental, economic, and social structures. It is
therefore imperative that urban sprawl is understood and methods to mitigate the effects
of sprawl are implemented.
Goals Of The Paper
The purpose of this research paper is to compare and analyze land use policies
addressing the issue of urban sprawl in the urban metropolitan areas of Portland, Oregon
and St. Louis, Missouri. Portland and St. Louis were examined due to the similarities in
geography, and differences in land use policies. Both metropolitan areas have similar
populations and both metropolitan areas lay within two separate states. The two goals of
this research paper were accomplished by taking an extensive look at the literature and
previous studies done on urban sprawl and urban sustainable development. The 1st goal
was to identify what policies contribute to the regulation of land use in the metropolitan
areas of Portland, Oregon and St. Louis, Missouri. The 2nd goal was to compare the
individual policies and practices limiting urban sprawl of each metropolitan area.
! ! 3
! ! 3!
According to the urban sprawl literature, limiting the growth of urban sprawl contributes
to the sustainability of an urban area. Looking at the differences in policies will give a
better understanding of why urban areas have been able to enact policies to effectively
curb urban sprawl and why other areas have failed.
The first section describes previous literature on the effects of urban sprawl on
metropolitan areas in the United States. The second section presents a case study of the
policies of the Portland Metropolitan Area located in the states of Oregon and
Washington. The third section analyzes the second case study of the St. Louis
Metropolitan Area located in Missouri and Illinois. The fourth section is a comparison of
policies and the effects of policies on the urban areas as well as some concluding
remarks.
Metropolitan Urban Sprawl
Since the founding of the United States the percentage of the population that
resides in urban areas has grown. “Various circumstances and driving forces have
interacted over 225 years to reach a point where 80 percent of the Nation’s population
now lives in metropolitan areas that occupy less than 20 percent of the land area” (Auch
et al 2004, 2). It was not until 1920 that it was known that more people live in urban areas
than in rural areas within the United States (Auch et al 2004). With the growing number
of people residing in urban areas there is a trend of people moving out of the urban areas
and into the suburbs. This trend is seen in Figure 1.1, which shows the population growth
by decade between cities and suburbs. With larger suburban growth comes larger land
requirements because “advances in technology that have allowed for the deconcentration

! ! 4
! ! 4!
of population have also increased the size of geographic areas that are linked through
social and economic integration, thus leading to sprawl” (Porter and Howell 2009, 610).
There are five areas of urban land use that this section will discuss which are; 1. Discuss
the definitions needed for an understanding of urban studies. 2. Discuss low-density
development concerning leapfrog development and the consequences of widespread
development. 3. Discuss the importance of the inner city or central city and the effects of
low-density development on these areas. 4. Discuss the impacts of transportation on
urban growth. 5. Discuss sustainable land uses and how they can be implemented into
existing urban areas.
Figure 1.1 Median Population Growth By Decade (Source: Rappaport 2005)

! ! 5
! ! 5!
Definitions
In urban studies literature there are many definitions of what constitutes an urban
area (Rappaport 2005; Wolman et al 2005; England 2010; Australia 2011; Federal
Register 2011; Eurostat 2012). Since the case studies in this research paper are both
within the United States, the definitions used to establish Metropolitan Areas comes from
the United States Census Bureau as defined by the revisions made to the 2010 census.
The Census Bureau definition of a Metropolitan Statistical Area (MSA) is a Core Based
Statistical Area associated with at least one urbanized area that has a population of at
least 50,000. The MSA comprises the Central County or counties containing the core,
plus adjacent outlying counties having a high degree of social and economic integration
with the Central County or counties as measured through commuting (Census Bureau
2010). These adjacent counties need to have a population of at least 2,500 people per
square mile to be considered a part of the urban area. The reason for this is because any
lower population density and the urban services such as water supply and wastewater
treatment become uneconomical to the urban area (Bruegmann 2005). Plus at such low-
density numbers, urban areas start to resemble rural areas.
The process of an area’s population and infrastructure growing to accommodate
for a population of more than 2,500 people per square mile is known as urbanization.
Suburbanization is when an urban area is depopulating and the migrating population
moves to the outer boundaries of the metropolitan area reducing urban densities. The
United States Census Bureau defines a rural area as an area with 100 people per square
mile or less (Federal Register 2011). Areas that are considered to be suburban have
populations between 100 people per square mile and 2,500 people per square mile. Urban
! ! 6
! ! 6!
sprawl generally takes place in suburban areas where land use policies are not regulated.
According to the literature, urban sprawl is considered to be low density, automobile
dependent development outside of city limits (Bruegmann 2005; Cutsinger et al 2005;
Jaret et al 2006; Sultana and Weber 2007; Behan et al 2008; Owen 2009).
Urban studies literature provides a variety of definitions for sustainable
development (World Commission 1987; Satterthwaite 1997; Burton 2000). The
traditional definition for sustainable development is provided by the United Nations as
“development that meets the needs of the present without compromising the ability of
future generations to meet their own needs” (World Commission 1987, 8). Therefore the
definition for sustainable urban development is the growth of an urban area with a
population of at least 50,000 people combined with a high interaction among the
surrounding areas with a population of 2,500 people or more, that meets the needs of the
present without compromising the ability of future generations to meet their own needs.
Low-Density Development
It had been known that suburbanization was taking place prior to the 1920’s
however the national statistics did not categorize suburbanization until the 1950’s when it
stated to become more noticeable due to the increasing percentage of urban population
residing in suburban areas (Rappaport 2005; Jaret et al 2006). Between 1950 and 1990,
U.S. metropolitan areas grew in terms of land size by 100% (Alberti et al 2003). In the
United States, 48% of metropolitan area residents lived in the central cities in 1950 when
compared with 31% in 1990, which is a 17% decline (Baum-Snow 2007). This means
that central cities were emptying out, however the percentage of population as stated
! ! 7
! ! 7!
earlier has continued to increase since the beginning of the United States. Urban areas
have been host to substantial suburbanization over the past 40 years.
In order to facilitate the return of veterans from World War II the federal
government created two new agencies, which helped the returning veterans readjust to
non-military life. The Federal Housing Administration and the Veterans Administration
advocated for legislation to make the transition for returning veterans easier. Two pieces
of legislation advocated by these new agencies were the GI Bill and mortgage-interest tax
deductions, which allowed veterans to afford higher education and obtain places to live
most of which were situated in suburban neighborhoods due to declining urban areas
(Auch et al 2004; Rappaport 2005). The actions of the federal government along with the
high level of affluence after World War II and the increased use of automobiles, allowed
for a large portion of the United States urban population to live in single-family houses in
the suburbs of urban areas (Bruegmann 2005). This explains the decline of the percent of
urban dwellers living in the central cities.
Typical attributes of urban sprawl are low-density development, clusters of
population and economic activities within the suburbs or fringe areas, and leapfrog
development (Carrion-Flores and Irwin 2004; Fallah et. al 2011). Leapfrog development
occurs when communities develop away from neighboring communities due to
restrictions in zoning codes, natural land features, local taxes, and negative externalities
associated with existing urban development (Wilson and Song 2011). Low-density and
leapfrog development promotes an over reliance on automobiles, which causes traffic
congestion due to an over abundance of personal transportation on the roadways.
! ! 8
! ! 8!
Urban sprawl due to lack of planning, over abundance of automobiles, automobile
infrastructure, and the allure of suburban life has facilitated numerous social,
environmental, and health problems. Urbanized areas account for 80% of carbon
emissions, 60% of residential water use, and close to 80% of the wood used for industrial
purposes (Wu 2010). Urban areas consume vast amounts of land (for housing, food
production, public services, etc.), water, habitat, oil/petroleum, metal, concrete, and
energy (Dekay and O’Brien 2001; Wheeler, 2009; Wu 2010). Urban ecological footprints
can be exponentially larger than the area inhabited (Rees 1992). Water consumption is
used for drinking supply, sanitation, and for aesthetic purposes, which puts pressure on
watersheds and aquifers. Habitat destruction comes in the form of urban expansion and
the conversion of land uses from natural habitat to agricultural. While some of these
issues are inherent with urbanized living, urban sprawl enhances these issues.
The low-density and leapfrog development also encourages a lack of centralized
planning leading to wasteful expenditures on infrastructure (Fallah et al 2011). Land use
is inefficient when it comes to building construction (Jacobs 1961). The reason is because
buildings are planned for single purposes, not to interact with the urban area, limiting the
use of the building and allowing for urban sprawl to take effect. Large-lot zoning has also
been found to increase the sprawling nature of urban areas (Carrion-Flores and Irwin
2004). When apiece of land is developed and has a minimum lot size of an acre there will
be less housing and more open space in between each house, in an area is zoned for
minimum lot size of a 1/8th of an acre there is more room for housing allowing for a
smaller urban area. One study showed that the per capita cost of most services declines
with density and rises with the spatial extent of urbanized land area (Carruthers and
! ! 9
! ! 9!
Ulfarsson 2003). Areas that are more concentrated have more efficient utility services;
also areas that exist on the outskirts of an urban area have less efficient services. It is
when suburban areas are not planned that they can become a part of urban sprawl.
In a twisted turn of events, even what could be considered the one technology that
has most facilitated the rise of the suburb has itself been cast aside. “Most families no
longer park their cars in their garages, which they had converted into storage spaces for
bikes, toys, outdoor furniture, athletic equipment, and other possessions they hardly ever
use…even in a culture heavily shaped by cars, cars themselves come second to stuff”
(Owen 2009, 196). Even garages have become a wasted investment considering that
many are transformed into glorified storage closets.
Inner City
One indicator of an urban area’s health, before the use of automobiles, was the
central core of the urban area. If the urban center was alive and profitable it was a good
indication that the entire urban area was alive and profitable. The reason was because of
the high integration of the core to the rest of the urban area. Most people traveled into
these areas for work and leisure because that was where everything was concentrated.
Large scale and rapid industrialization after the Civil War allowed for urban areas to start
expanding due to increasing populations (Census 1975; Yeoh and Stansel 2013). People
were drawn to the urban areas because of employment opportunities created by this
industrialization. This caused densities to rise higher providing a large workforce in a
small area.
High densities caused many problems in the central core of urban areas. People
saw urban areas as a place where strikers, beggars, and criminals disturbed the public

! ! 10
! ! 10!
order, and outdoor privies, polluted waterways, ill health, and overcrowding was allowed
to prosper (Power 2001; Sloane 2006). However between the 1950’s and 1990’s there
was a shift that occurred in the reasons why people migrated from urban areas into
suburban areas. “People in early urban areas originally left due to overcrowding, disease,
and destitution, currently people often leave cities because they have become too
depleted” (Power 2001, 731). Through the continual migration of high and middle
income people into the suburbs urban services have become depleted.
One of the consequences of urban sprawl has been the decline of the urban core.
“Without a strong and inclusive central heart, a city tends to become a collection of
interests isolated from one another. It falters at producing something greater, socially,
culturally and economically, than the sum of its separated parts” (Jacobs 1961, 215). The
isolation of housing and employment, the isolation of communities, and the isolation of
people from each other cause serious harm to urban areas. Examples of inner city decline
and the effects on surrounding areas can be found in cities such as Detroit and Atlanta.
There are three land use policies that have facilitated the decline of the inner city;
dispersal, hidden subsidies to Greenfield development, and oversupply of building land
(Power 2001). Of the three policies stated two (dispersal and oversupply of building land)
are direct consequences of urban sprawl. When metropolitan areas disperse, people from
the inner city are drawn out to the suburbs. High crime and more spacious living space
two reasons why people migrate from urban areas. The decline of services because of the
lack of people has facilitated even more abandonment of the inner cities. When
developing in an urban area brownfield development or redevelopment is more common
than Greenfield development due to the unavailability of Greenfield land in urban areas.

! ! 11
! ! 11!
The cost of renovating or deconstruction and construction of new buildings can be high in
urban areas especially when compared to the low cost of developing Greenfield land in
the suburbs. The low cost of Greenfield land stems from subsidies given by local
communities to attract development in order to help the growth of the community. The
low cost of Greenfield land added to the availability of such land is what drives urban
sprawl. Current land-use patterns work against small businesses and favor strip
development and big box retail in suburban areas, taking away from retail stores in urban
areas (Power 2001; Wheeler 2009). This also amplifies the decline of inner cities.
Transportation
A large amount of literature has been dedicated to the effects of transportation on
urban growth (Anas et al 1998; Bertaud 2001; Lund 2003; Rappaport 2005; Kenworthy
2006; Baum-Snow 2007; Sultana 2007; Behan 2008; Owen 2009; Skidmore 2011).
Transportation in urbanized areas before the automobile was reduced to walking or horse
and carriage. Effects of limited mobility greatly reduced the size of urban areas due to the
need for everyone to live close to the central core of the city (Anas et al 1998). People
who could afford to travel by horse and carriage could be located farther from the central
core of the urban area but even horses had their limits to how fast someone could travel
into the central city. The result was compact urban areas with large population densities.
As people wanted better access to work and leisure transportation modes were
developed to accommodate for such needs. The pinnacle of inter-city transportation
before the automobile was the streetcar (Skidmore 2011). The streetcar facilitated quicker
access to the city. The quicker travel times allowed people to live farther from their

! ! 12
! ! 12!
employment and the problems associated with the high-density development that was
associated with central urban areas around the early 1900’s. Urban areas grew along the
routes of the streetcar causing urban areas to expand in land size, allowing for population
densities to start declining. The success of the streetcar was short; as the automobile
began to become profitable it took over the role of streetcars in urban areas.
“What happened to this thriving electric railway transportation? These systems likely were doomed from the beginning by government policy favoring highways, trucks, and cares; by the attractiveness to companies of systems that did not depend on fixed guide ways; by the lower costs to companies that could use public streets and highways rather than having to maintain rails and roadbeds; and above all, ultimately, by America’s passion for the automobile (subsidized, to be sure, by parking spaces, toll-free roads, favorable laws, a huge infrastructure, and the like” (Skidmore 2011, 168). Intra-urban transportation was also constrained. Before the use of railroads and
later highways transportation between cities was reduced to waterways limiting both
direction of travel and destinations to travel to (Skidmore 2011). Early urban areas in the
United States were located on waterways due to the use of boats and barges for heavy
transportation. Because of the limits of intra-city transportation most urban areas were
predominantly self-sufficient. Railroads, which soon became endorsed by the Federal
Government through the Pacific Railroad Act of 1862, had the advantage of allowing for
large scale transportation over land, was much more comfortable, and was much quicker
than waterways (Skidmore 2011). The increasing use of railroad transportation allowed
people to move farther from the urban area, which caused urban areas to expand along
those railroads.
After World War II the Federal Government started to endorse the automobile
instead of the railway, which came in part due to the experience of the autobahn in
! ! 13
! ! 13!
Germany during World War II (Baum-Snow 2007). As stated previously the automobile
was a large contributor to the decline of the streetcar, however with the backing of the
federal government for highways the automobile started to take on the role of the
railroads in cross-country transportation. The effects of roadway construction followed
the pattern of railroads and streetcar lines in terms of the effect on urban growth. Urban
areas continued to expand along roadways as they were built linking pre-existing,
outlying communities together with the central city (Auch et al. 2004). The development
of air transportation took up the slack from the dying railroad industry for inter-urban
travel (Auch et al 2004; Skidmore 2011).
Transportation has an impact on urban spatial structures, however urban spatial
structures have an impact on labor and consumer markets; therefor transportation has an
indirect effect on labor and consumer markets (Bertaud, 2001; Horner 2007; Sultana
2007). The importance of this is heightened with the fact that most transportation is for
leisure activities not for employment (Bertaud 2001). By sponsoring mass transportation
in an urban area, the planners are allowing for people to choose which mode they would
like to utilize (Anas et al 1998; Kenworthy 2006; Owen 2009). “In France and elsewhere
in Europe, one may board a comfortable train, and step off if some four hundred miles
away in only a little more than two and a half hours. In parts of Asia, including China,
magnetic trains make a journey of the same length in less than two hours. It is true that
America has Amtrak, but it faces constant struggles to preserve railroad passenger travel
against entrenched opposition” (Skidmore 2011, 172). By maintaining a transportation
infrastructure that is planned for efficiency and sustainability urban areas can plan for
sustainable urban development.
! ! 14
! ! 14!
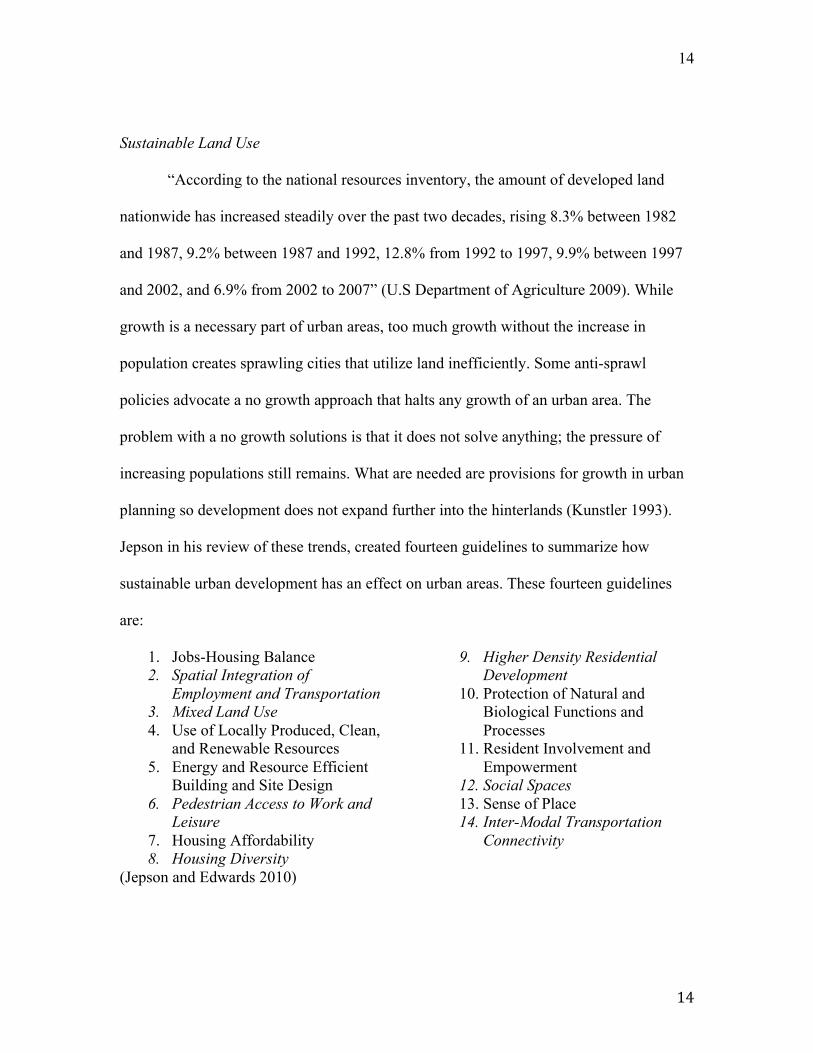
Sustainable Land Use
“According to the national resources inventory, the amount of developed land
nationwide has increased steadily over the past two decades, rising 8.3% between 1982
and 1987, 9.2% between 1987 and 1992, 12.8% from 1992 to 1997, 9.9% between 1997
and 2002, and 6.9% from 2002 to 2007” (U.S Department of Agriculture 2009). While
growth is a necessary part of urban areas, too much growth without the increase in
population creates sprawling cities that utilize land inefficiently. Some anti-sprawl
policies advocate a no growth approach that halts any growth of an urban area. The
problem with a no growth solutions is that it does not solve anything; the pressure of
increasing populations still remains. What are needed are provisions for growth in urban
planning so development does not expand further into the hinterlands (Kunstler 1993).
Jepson in his review of these trends, created fourteen guidelines to summarize how
sustainable urban development has an effect on urban areas. These fourteen guidelines
are:
1. Jobs-Housing Balance 2. Spatial Integration of
Employment and Transportation 3. Mixed Land Use 4. Use of Locally Produced, Clean,
and Renewable Resources 5. Energy and Resource Efficient
Building and Site Design 6. Pedestrian Access to Work and
Leisure 7. Housing Affordability 8. Housing Diversity
9. Higher Density Residential Development
10. Protection of Natural and Biological Functions and Processes
11. Resident Involvement and Empowerment
12. Social Spaces 13. Sense of Place 14. Inter-Modal Transportation
Connectivity
(Jepson and Edwards 2010)
! ! 15
! ! !
Of these guidelines those italicized have a direct effect on sustainable urban land
use. According to sustainable development theories, urban compaction and more
mixtures of land use within urban areas would allow for a more balanced job to housing
ratio (EPA 2006). Coupled with spatial integration of employment and transportation as
well as integration between employment and housing would reduce the need for personal
transportation. The reduction of personal transportation would contribute to the limitation
of urban growth.
Commutes are longer in sprawling automobile dominated urban areas (Kenworthy
2006; Sultana 2007). It has also been shown that the longest travel times occur between
development types (Sultana 2007). By reducing low-density development, travel times
would be reduced and mass transportation would be more economical. The reduction of
such development would also reduce the need to travel across development types
decreasing the longest travel times. Decreasing sprawl would mean more modes of
transportation become available to urban areas allowing people of all income levels to
access the city. Also it would mean less need for personal transportation such as
automobiles. Mass transportation modes such as trolleys, buses, and streetcars become
more accessible with higher densities. The increase in mass transportation could only
happen in more compact areas because making public transit widely used at the
metropolitan scale would require large investments to the transit system at low-density
levels (Wheeler 2009).
According to Jane Jacobs there are four indispensable conditions to generate diversity
in an urban area.
“1. The district, and indeed as many of its internal parts as possible, must serve more than one primary function; preferably more than two. These must insure the presence

! ! 16
! ! !
of people who go outdoors on different schedules and are in the place for different purposes, but who are able to use many facilities in common. 2. Most blocks must be short; that is, streets and opportunities to turn corners must be frequent. 3. The district must mingle buildings that vary in age and condition, including a good proportion of old ones so that they vary in the economic yield they must produce. This mingling must be fairly close-grained. 4. There must be a sufficiently dense concentration of people, for whatever purposes they may be there. This includes dense concentration in the case of people who are there because of residence.” (Jacobs 1961, 196-197)
Ways to encourage pedestrian access to work and leisure would be to limit the use
of private transportation via automobile. Policies that increase parking fees and/or
introduces driving tax for access to the urban area would have the effect of limiting
automobile transportation. The harder it is to find parking spaces, due to limits of the
number of spaces, effects personal automobile use and encourages walking and bicycling.
Allowing people and bicycles to walk in the streets would create more room for people
and give better access to more areas. Not to mention sidewalks open up for other uses
such as café’s and meeting spots all, which encourage pedestrian access. “No one way is
a good way to house a city neighborhood; no mere two or three ways are good. The more
variations there can be, the better. As soon as the range and number of variations in
buildings decline, the diversity of population and enterprises is too apt to stay static or
decline, instead of increasing” (Jacobs 1961, 279).
City life, because of high densities, is optimal for contact between people due to
social spaces; the suburbs strive to eliminate such human contact and social spaces
(Kunstler 1993). To encourage social spaces an urban area needs to be designed for such
spaces. A great example is the boulevard, “it defines space in a way that allows for
multiple functions: motoring, strolling, shopping, business, apartment living, repose”
(Kunstler 1993, 125). What planners and developers seem to fail to understand is that
! ! 17
! ! !
people attract people, even the high-income people pay large rents to live in areas with a
vibrant sidewalk life (Jacobs 1961). Therefore it is important to plan for social spaces by
zoning for sidewalk life, encouraging garages to be placed in the back, encourage large
front porches so people can interact with other people outside.

! ! 18
! ! !
CHAPTER 2: PORTLAND POLICIES
Introduction: Portland
The city of Portland, Oregon is located in the Northwestern part of Oregon while
the metropolitan area is considered to be in both the states of Oregon and Washington
(Census 2010). As of the most recent census it was ranked 21st is terms of size and
population among U.S. metropolitan areas, which is 6,684 square miles and more than
2.2 million people respectively (Census 2010). The metropolitan area comprises of seven
counties, which are;
1. Clackamas County, Oregon 2. Columbia County, Oregon 3. Multnomah County, Oregon 4. Washington County, Oregon
5. Yamhill County, Oregon 6. Clark County, Washington 7. Skamania County, Washington
(Census 2010)
Portland’s metropolitan area is composed of 41 different cities of various sizes
(Metro 2013). The largest is the city of Portland, which holds 500,000 people (U.S.
Census 2010). First settled in the mid-1800 the city of Portland quickly grew in terms of
size and population. Today it is considered to be the inner city of the metropolitan area
and is also the main economic hub. Located in Multnomah County, Portland is the center
of the Metropolitan area and helps to bridge the metropolitan areas that lay across the
river in the state of Washington. The land total of the city of Portland is 144.92 square
miles, which give the city a density of 4,028 people per square mile. Figure 2.1 gives a
comparison of the population trends of both the City of Portland and the Portland
Metropolitan area according to data given from Metro. The figure shows that even though
the metropolitan area has been increasing its population drastically, the inner city has not

! ! 19
! ! !
declined but has continued to increase its population as well. The data shows that both
populations have been rising and there has been little draw from the inner city in terms of
population allowing for both areas to grow in proportion to each other. However it is also
shown that between 1950 and 1980 there was little increase in population, which allows
the assumption that if the Urban Growth Boundary had not been put into place it is very
likely that the City of Portland could have started to lose its population, as many other
cities in the United States did at that time. The Urban Growth Boundary (UGB) is the
boundary that has been placed to help revert development back into the current cities of
the metropolitan area and reduce the effects of urban sprawl.
Figure 2.1 Population Trend of Portland and Portland Metropolitan Area
(Data Source: Metro 2013)
Vancouver with a population of 165,500 people is the second largest city in the
metropolitan area and the largest in Washington State (U.S. Census 2010). It is one of the
nine regional centers defined by the 2040 Growth Concept plan, which is the regional
! ! 20
! ! !
development plan for metropolitan Portland, and is the regional center for Clark County
(Metro 2013). Vancouver is also one of the oldest areas in the metropolitan area (besides
Portland) being incorporated in 1857. Vancouver began as Fort Vancouver, which was a
base for the Hudson Bay Company in 1825, and was the center for fur trading in the
Pacific Northwest (City of Vancouver 2012). In 1908 the first railroad reached
Vancouver, by World War I the city held the largest spruce lumber mill for airplane
construction (City of Vancouver 2012).
The third largest city in the Portland metropolitan area is Gresham, with a
population of 105,594 people (U.S. Census 2010). Gresham, which was incorporated in
1905, serves as one of the regional centers in Multnomah County (City of Gresham 2012;
Metro 2013). The other city that serves as a regional center for Multnomah County is the
city of Gateway. The next two largest cities are located in Washington County, Oregon.
Hillsboro is the fourth largest city with a population of 92,350 people, and Beaverton
with a population of 90,267 people is the fifth largest city (U.S. Census 2010). Beaverton
and Hillsboro were being incorporated in 1893 and 1876 respectively. Beaverton grew
due to the development of a railroad and transportation industry in 1868, however much
of the current industry comes from high-tech firms, which has given the area’s nickname
of Silicon Forest (City of Beaverton 2012). Hillsboro grew in part because of the Tualatin
River, which allowed for riverboat transportation in the area. This expanded the
agriculture areas that had started to flourish. Today Hillsboro is considered part of Silicon
Forest due to high-tech companies such as Intel and SolarWorld (City of Hillsboro 2012).
Rest of the regional centers indicated by the 2040 Growth Concept are the cities
of Tanasbourne/AmberGlen and Washington Square for Washington County, Oregon
! ! 21
! ! !
City and Clackamas Town Center for Clackamas County. These towns and cities provide
valuable services that connect the local towns to the larger metropolitan area. All of these
cities are important parts of the metropolitan area and contribute both to the sustainability
of the area and the potential for urban sprawl if not managed correctly. The U.S. Census
Bureau adds another two counties to the metropolitan area, which have not yet been
added to the jurisdiction of the Metro area.
World War II brought many industrial jobs into the Portland Area, many of which
continued on in some form after the war effort ended. With the industrial sector came
jobs, many of which were focused on the waterfront due to the concentration of wartime
factories for shipbuilding. With the rise of personal computers the demand rose for
computer components. Places like Silicon Valley (California) began popping up and
prospering. By the 1990’s, Silicon Forest had provided many jobs (42,000) for the cities
of Beaverton, Hillsboro, and Aloha (Abbott 2001; Hume and Hardwick 2005). The
employment brought by Silicon Forest is only about half of the manufacturing jobs in
Portland, the rest belong to the aluminum, steel, and transportation equipment industries
which employ 45,000 people (Abbott 2001). The growth of the high-tech industry in
Portland can be attributed to two things, the initial low land cost and the proximity to
Silicon Valley via air transport (Pack 2002). Another part of the economic variance is the
brewery industry. Portland is host to a large selection of microbreweries, along with timid
climate and beautiful scenery, which creates a large tourism draw to the area.
Portland, which is a predominantly Caucasian community (76.1% as of 2010), has
a large amount of influence from different regions of the world. Before World War II
there was a large population of Jewish people along with ethnic backgrounds from
! ! 22
! ! !
Poland, Romania, Russia, Prussia, Germany, Ireland, China, Italy, and Japan (Cline 1987;
Eisenburg 2000). After World War II and especially after the Civil Rights movement,
more immigrants began settling in the United States. Many of these people came to
Portland beginning to transform various areas into ethnic communities. Vietnamese,
Cambodian, Laotian and Korean people were drawn to the communities of Beaverton,
Hillsboro, and Aloha due to the Silicon Forest industries there. Poorer immigrants from
countries such as Eritrea, Somalia, Liberia, and Democratic Republic of the Congo,
Ethiopia, and Sierra Leone settled more into the inner-city areas of the City of Portland,
Gresham, and Vancouver (Hume and Hardwick 2005). Currently the minority groups of
Portland are composed of 6.3% black people, 7.1 % Asian, 1.0% Native American, and
9.4% Hispanic (Census 2010).
Because of unique land use policies as well as ability to encourage sustainable
urban development the Portland Metropolitan Area is currently a leading area in the field
of sustainable urban development within the United States. With a regional growth plan
as a key development tool, and policies such as the UGB, Portland metropolitan area is
provided many examples of how an urban area can grow in a sustainable fashion and
continue to flourish economically. Concerning the attention of urban areas within the
United States, Portland is considered as one of the most sustainable urban areas (Gillham
2002; Portney 2003; Wheeler 2004; Kenworthy 2006; Judd and Swanstrom 2012).
Portland Policies
2040 Growth Concept and Development Planning
! ! 23
! ! !
A major contribution to the development process in Portland has been the regional
growth plan called 2040 Growth Concept, which was written in the 1990’s with the
participation of thousands of different actors. The growth plan was created to ensure that
the growth of the metropolitan area does not happen haphazardly but in a coordinated and
planned fashion over the next fifty years. The regional plan advocates several
fundamental values, which are:
1. Encourage a Strong Local Economy
2. Encourage the Efficient Use of Land
3. Protect and Restore the Natural Environment
4. Maintain Separation Between the Metro Urban Growth Boundary and Neighboring Cities
5. Provide a Balanced Transportation System
6. Enable Communities Inside the Metro Urban Growth Boundary to Preserve Their Physical Sense of Place
7. Ensure Diverse Housing Options for All Residents
8. Create a Vibrant Place to Live and Work
(Metro 2011)
The plan divides up the metropolitan cities into several distinct groups. The first is the
Central City, which is the city of Portland. Described by the plan as “the hub of business
and cultural activity in the region. It has the most intensive form of development for both
housing and employment, with high-rise development common in the central business
district. Downtown Portland will continue to serve as the finance and commerce,
government, retail, tourism, arts and entertainment center for the region” (Metro 2013).
The second tier of cities is designated as Regional Centers. The regional centers are areas
of commerce and government services as well as the center of transit and highway
improvements, characterized by two to four story compact employment there are nine
regional centers. Those nine centers are:
! ! 24
! ! !
1. Gateway 2. Downtown Hillsboro 3. Tanasbourne/AmberGlen 4. Downtown Beaverton 5. Washington Square
6. Oregon City 7. Clackamas Town Center 8. Downtown Gresham 9. Downtown Vancouver
(Metro 2013) The final tier of cities is labeled as Town Centers. These areas provide localized
services within a small radius (2-3 miles); because of this localized provision of services
there is a stronger sense of community identity. These areas are also well serviced by the
metropolitan transit system to reduce the use of private automobiles within the
metropolitan area (Metro 2013). Cities that are include as town centers are; Lake
Oswego, Tualatin, West Linn, Forest Grove and Milwaukie and large neighborhood
centers such as Hillsdale, St. Johns, Cedar Mill and Aloha.
The 2040 Growth Concept plan sets goals and limits for the entire metropolitan
area, of which cities are forced to change their comprehensive growth plans to fit into this
regional plan. Metro authority is granted by the State of Oregon and the volunteer
willingness of the cities in Washington State allowing for regional planning for
sustainable urban development across the metropolitan area. The 2040 Growth Concept
plan is unique in that it coordinates growth between two different states and requires that
cities and villages conform to the standards set within the document. Because of this, the
entire metropolitan area can be managed instead of different communities planning
development with no coordination. Instead of the chaotic mess that many metropolitan
areas face with differing land use policies, the one regional government system of
Portland coordinates the growth plans of each city to coincide with the regional growth
plan.
! ! 25
! ! !
The 2040 Growth Concept plan has allowed for a coordinated effort in terms of
regional development for Portland, however this is not the first plan to be developed.
Development planning in the Portland metropolitan area has had a long history with plans
for development dating back to the 1912’s for the City of Portland (McVoy 1945). On the
other hand, the metropolitan area of Portland has been refining regional plans for more
than 40 years (Wheeler 2004). The most recent plans being the 2040 Growth Concept
plan for the metropolitan region. The interesting part of how Portland includes
environmental protection into the development process is through the use of
environmental overlays during zoning and land use planning. When planning for
development environmentally sensitive areas are determined and included in the planning
process to reduce the risk of development to environmentally sensitive areas such as
wetlands. If development is continued in these environmental zones and transition areas
around these environmental zones such areas are afforded special protection based on
zoning codes (Portney 2003).
The history of considering environmental impacts has been a strong presence in
Portland planning since the mid 1970’s. Portland has vetoed several highway projects
including a proposed Mount Hood Freeway as well as tearing up the six-lane Harbor
Drive expressway to help rebuild the waterfront park in conjunction with the Portland
Brownfields Initiative (Gillham 2002). Finally in 1991, the area adopted a Transportation
Planning Rule (part of Statewide Legislation) that required local governments to amend
land-use codes to encourage high density, mixed-use development around mass
transportation lines (Gillham 2002).

! ! 26
! ! !
Metro
The regional planning government for the Portland Metropolitan Area, which
oversees the 2040 Growth Concept plan, is called Metro. Considered the best-known
example of U.S. metropolitan regional planning governments, the strength of the
government lays with the directly elected Metro Council and the myriad of successful
initiatives that it currently maintains (Wheeler 2009). Metro began due to the Oregon
state legislation that required metropolitan areas to manage the land use of such regions
during the 1960s and 1970s (Bruegmann 2005). At the time of its inception Metro was
the only directly elected regional government in the United States, and it included three
counties (Clackamas, Multnomah, and Washington) and twenty-four municipalities
(Gillham 2002). “Started as an advisory council of governments, but in 1979, the year
that it adopted the growth boundary, it became a regional governmental body with elected
councilors” (Bruegmann 2005, 205). Because of the statutes provided by the State of
Oregon, Metro has authority over land use planning under its jurisdiction, which is
uncommon in the United States (Wheeler 2009).
The responsibilities of the Metro are numerous. Metro oversees the
implementation and maintenance of the UGB as well as the 2040 Growth Concept plan
that regulates the land use, transportation, and various other regional concerns such as
downtown revitalization and green space preservation (Wheeler 2009). Other Metro
successes includes; the siting, construction, and operation of the Oregon Convention
Center, maintenance of the Washington Park Zoo, maintenance and operation of the St.
Johns Landfill as well as the opening and operation of the Clackamas County Transfer

! ! 27
! ! !
Station, and the planning, construction, and operation of the Gilliam County Landfill site
(Abbott and Abbott 2010).
The support of the State of Oregon for Metro has encouraged the growth of the
government even though it lacks the authority to zone and impose subdivision
regulations. Metro can require local governments to revise their plans and regulations if
they do not coincide with the regional goals set forth in the 2040 Growth Concept (Song
and Knaap 2004). Metro has a large presence in the Portland metropolitan area due to the
accomplishments of the regional government. Without Metro there would be no managed
UGB, no regional transportation plan, and no regional growth plan. Metro has helped to
greatly increase the use of sustainable development in the Portland Metropolitan Area.
Urban Growth Boundary
The UGB was created from the 1973 Land Conservation and Development Act
passed by the State of Oregon underneath the governance of Thomas McCall
(Bruegmann 2005). The Land Conservation and Development Act stated “Uncoordinated
use of lands within this state threaten the orderly development, the environment of this
state and the health, safety, order, convenience, prosperity and welfare of the people of
this state” (Senate Bill 100 1973). Section 2 of the bill explains what is required of cities
and counties in the state of Oregon.
1. “Must be adopted by the appropriate governing body at the local and state levels; 2. Are expressions of public policy in the form of policy statements, generalized
maps and standards and guidelines; 3. Shall be the basis for more specific rules, regulations and ordinances which
implement the policies expressed through the comprehensive plans; 4. Shall be prepared to assure that all pubic actions are consistent and coordinated
with the policies expressed through the comprehensive plans; and
! ! 28
! ! !
5. Shall be regularly reviewed and, if necessary, revised to keep them consistent with the changing needs and desires of the public they are designed to serve.”
(Senate Bill 100 1973)
Seeing the need for urban areas to grow the bill was not designed to stop urban
growth but to maintain that excessive urban sprawl did not take place, which is why the
bill forced each area to maintain comprehensive plans for land management establishing
a twenty-year supply of land for growth (Metro 2013). While the bill did not specifically
imply that Metro was to maintain the UGB, it was the only agency suited for the task.
The Metro government approved the UGB in 1979 in accordance to the Land
Conservation and Development Act (Wheeler 2009). After the boundary was established
Clackamas, Multnomah, and Washington counties adopted the comprehensive plans to
match that of the UGB (Bruegmann 2005). The UGB was originally established far away
from the central city, however this allowed suburban sprawl to take place inside the
boundary prompting Metro and local governments to create urban design regulations to
correct the problem (Wheeler 2009).
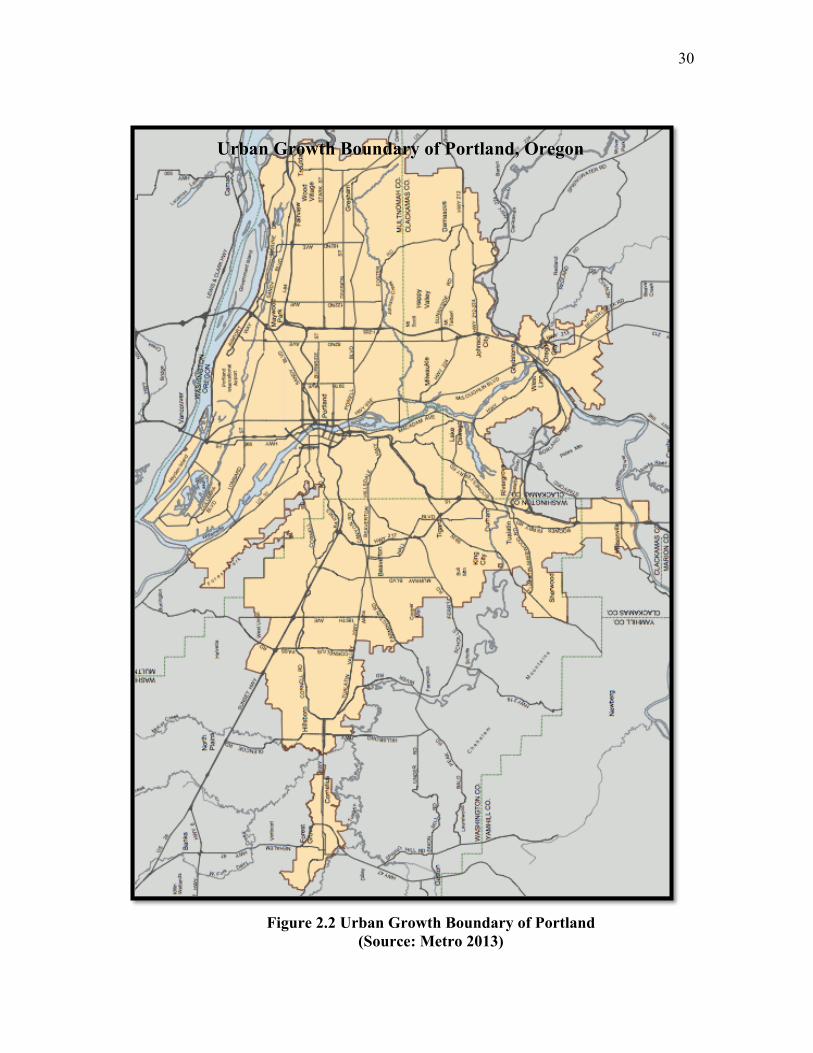
The current urban growth boundary (Figure 2.2) extends through three counties
and includes more than 20 cities (Metro 2013). The Census gives the population density
of the Portland Metropolitan area as 333 people per square mile (Census 2010). The
problem is that this is not the density of the urban growth boundary, because the United
States Census Bureau considers the Metropolitan Area to consist of six counties (much of
which is unincorporated with the actual Metropolitan area. When considering the extent
of the UGB, the population of the area that Metro has jurisdiction over is the land that
needs to be examined. The land administered by Metro is 545.21 square miles and
contains a population of 2,105,200. The new density is then 3,861 people per square mile,
! ! 29
! ! !
which is much higher than the total given by the census bureau (Metro 2013).
Throughout the 30 years of the UGB there has been additions to the boundary as was
planned through the comprehensive plan. The growth of the population of the
metropolitan area inside the UGB has grown from 1,029,400 in 1979 to 1,667,500 in
2010, which is an increase of 638,100 people or 61% (U.S. Census 2010; Metro 2013).
The increase of land inside the UGB has only been 12% over the past 30 years.
The key to success for the UGB has been the State of Oregon’s willingness to
allow the Metro government to dictate land use in this fashion to the local municipal
governments (Judd and Swanstrom 2012). Despite some over allotments in the beginning
of the UGB, densities have started to rise since the 1990’s (Bruegmann 2005). This is an
indication that the UGB has started to take effect, and help to redirect land development
inside the UGB instead of allowing urban sprawl. The effect of the UGB for the Portland
Metropolitan Area has had immense effect on curbing urban sprawl, by encouraging
development inside the boundary instead of outside of it. Without this boundary, Portland
could be more sprawled out resembling metropolitan areas such as Chicago and Los
Angeles.
! ! 30
! ! !
Figure 2.2 Urban Growth Boundary of Portland (Source: Metro 2013)
Urban Growth Boundary of Portland, Oregon
! ! 31
! ! !
Transportation
Advances in transportation have had profound impacts upon the Portland
metropolitan area, as it has with all urban areas. The difference that has set Portland apart
from most other urban areas in terms of transportation is the fact that Portland has been
planning for urban transportation for decades. The most significant transit that Portland
has been planning is the mass transportation system which includes buses, and the MAX
light rail system (Kenworthy 2006). While planning for mass transportation Portland has
simultaneously been putting restrictions on automobile travel and associated amenities to
restrict the use of such transportation.
Planning for the MAX regional light rail system began in the 1970s during the
examination and implementation of the UGB and Metro (Wheeler 2004). Using federal
funds the fifteen-mile light rail system was built during the 1980s and fifteen years after
opening the rail system and bus lines carried nearly 1/3 of all commuters to downtown
(Gillam 2002). However Portland was not just designing a rail system, but was also
designing communities that would grow around this rail system. “Portland, for example,
has designated nodes of density along stations of its new MAX light rail system, and
intensified corridors of development along heavily used Tri-Met bus lines. These transit
lines radiate out from downtown Portland, creating a traditional star-shaped pattern”
(Wheeler 2009, 141).
Neighborhoods have even been designed to be interactive with the mass
transportation of Portland. Places like Orenco Station, which is a 190-acre town off of the
Westside MAX line, designed to be transit friendly (Metro 2013). The small town was
! ! 32
! ! !
built to be compact, mixed in its land use, and to be transit oriented (Gillham 2002).
Orenco is a livable neighborhood that allows residents to walk to and around the town
center because it is within a five-minute walk from most of the housing. All aspects of
the community are located close to the town center to allow people access to the mass
transportation options to travel around the Metro area. Orenco Station was built using
Smart Growth features, and the area includes; efficient use of land, varied housing
options (live/work units), light-rail station adjacent to development, close to employment
opportunities, community parks and open spaces, and neighborhood shops and services.
Orenco Station is built to be sustainable but the big draw for developers is that the sale of
housing has commanded as much as 25% premium over other suburban homes around
the area despite the fact that the other homes are larger in both square footage and in
yards (NRDC 2013).
Portland has also taken initiative to help persuade commuters to use personal
transportation less and make automobiles safer for pedestrians. One policy that Portland
has used to reduce the amount of personal automobile use in the downtown area is to
implement a cap on downtown parking spaces (Gillham 2002). By limiting the number of
parking spaces, Portland limits the number of cars that can travel into the city. By making
it hard for people to park, Portland has been encouraging the use of its mass
transportation systems. There are many methods to calm traffic (implementing circles,
humps, and bulbouts are most common) however the most common in Portland is the use
of traffic circles to slow down traffic and help make drivers more cautious (Wheeler
2004). The planting of trees along streets, addition of mid-block chokers, and the

! ! 33
! ! !
narrowing of streets also help to reduce vehicle speeds in urban and suburban areas
(Wheeler 2009).
Effects of Policies
The Portland metropolitan area has had a stringent set of land use policies since
the 1970’s. These policies have helped to shape the current metropolitan area as well as
the cities within. Policies such as the transportation policies have seen positive changes
with little controversy. Other policies such as the UGB has shown positive benefits but
with much controversy surrounding it. If these policies are to be replicated in other
metropolitan areas there needs to be evidence suggesting the benefits of sustainable land
use policies.
The effects of the regional planning and transportation policies have shown mixed
results in terms of low-density development at the regional scale. Despite the urban
growth boundary being in effect evidence of urban sprawl has still been witnessed in the
Portland metropolitan area (Song and Knaap 2004). Population densities are still low for
an urban area and there is still low density development occurring within the UGB. The
reason is because the initial boundary for the UGB was set at too large of a land area
(Bruegmann 2005). By setting the UGB too large development had to catch up with the
boundary before the boarder could have any effect on the densities within. This growth
did not catch up to the boundary until the mid 1990’s. Since then there have been
improvements in the population densities. Another fear with the UGB was that it would
have negative effects on housing prices within the boundary. This has proven to be false,
the UGB has had little effect on the personal housing prices (Jun 2006). The effects of the

! ! 34
! ! !
UGB while delayed seem to have begun to act in a positive manner on the land use of the
Portland Metropolitan Area.
The effects of the land use policies enforced by Metro have had positive effects
on the inner-city health of the metropolitan region. Infill and redevelopment have become
standard practices for the inner city. Projects such as the renovated waterfront, as well as
the numerous buildings that have been restored for use, has helped to draw people into
the city of Portland. Unlike most inner cities, the city of Portland has not seen a decline in
population, but has in fact seen a steady increase in population figures as was shown in
Figure 2.1. Despite the positive effects of Portland’s land use policies there have also
been failures. One example is the failure in some areas to reduce the poverty rates. There
area still areas with significant poverty in the well-connected and accessible central city
(Miles and Song, 2009).
The policies on transportation have also had many effects on the Portland
metropolitan area. First, the transportation system has opened up much of the city to
people who wish to use mass transportation, allowing for a reduction of automobile use
for long trips into the city, which reduces the reliance of automobiles. With growing
ridership on MAX regional light rail system the workforce increased by 67 percent in the
downtown area and has added half a million square feet of retail space between 1972 and
2002 (Gillham 2002). Second the mass transportation of Portland has allowed for more
internally connected and pedestrian friendly neighborhoods (Song and Knaap, 2004;
Miles and Song, 2009). With more connectivity and pedestrian friendly neighborhoods
more of the metropolitan area is opened up for multiple transportation options allowing
for better access for more people.
! ! 35
! ! !
In terms of the guidelines proposed by Jepson and Edwards 2010 and Jacobs
1961, Portland has done much in terms of implementing sustainable urban development
principles. Portland’s ability to implement regional growth plans has been strongly
influenced by state legislation and the willingness of individual cities and counties to
succeed development powers to the regional government. This in turn has allowed for the
implementation of land use policies that favor high-density compact development over
low-density sprawling development. The ideas and policies used by the Portland
metropolitan region could be adopted in other areas to fit the needs of metropolitan areas
that have urban sprawl issues.
! ! 36
! ! !
CHAPTER 3: ST. LOUIS POLICIES
Introduction: St. Louis
The City of St. Louis is located in the middle of the State of Missouri along the
Mississippi River. The St. Louis metropolitan area (Greater St. Louis) is located in the
States of Missouri and Illinois. Greater St. Louis with a population of 2.8 million people
is the 18th largest metropolitan area in the United States (Census 2010). With a land area
of 8,458 square miles the density of the metropolitan area is 340 people per square mile.
The metropolitan area contains eight counties in Illinois and nine counties in Missouri,
which are:
1. Bond County, Illinois 2. Calhoun County, Illinois 3. Clinton County, Illinois 4. Madison County, Illinois 5. Macoupin County, Illinois 6. Monroe County, Illinois 7. Jersey County, Illinois 8. St. Clair County, Illinois 9. Franklin County, Missouri
10. Jefferson County, Missouri 11. Lincoln County, Missouri 12. St. Charles County, Missouri 13. St. Louis City County, Missouri 14. St. Louis County, Missouri 15. St. Francois County, Missouri 16. Warren County, Missouri 17. Washington County, Missouri
The St. Louis area was originally controlled by the Mississippian Indian Nation, it
later fell to European rule. The late 1690s saw the establishment of local areas such as
Cahokia and Kaskaskia in Illinois, but it was not until 1764 that the city of St. Louis was
founded. In 1803, St. Louis became part of the United States through the Louisiana
Purchase conducted by Thomas Jefferson. By the turn of the 20th century it was one of
the largest urban areas in the United States.
! ! 37
! ! !
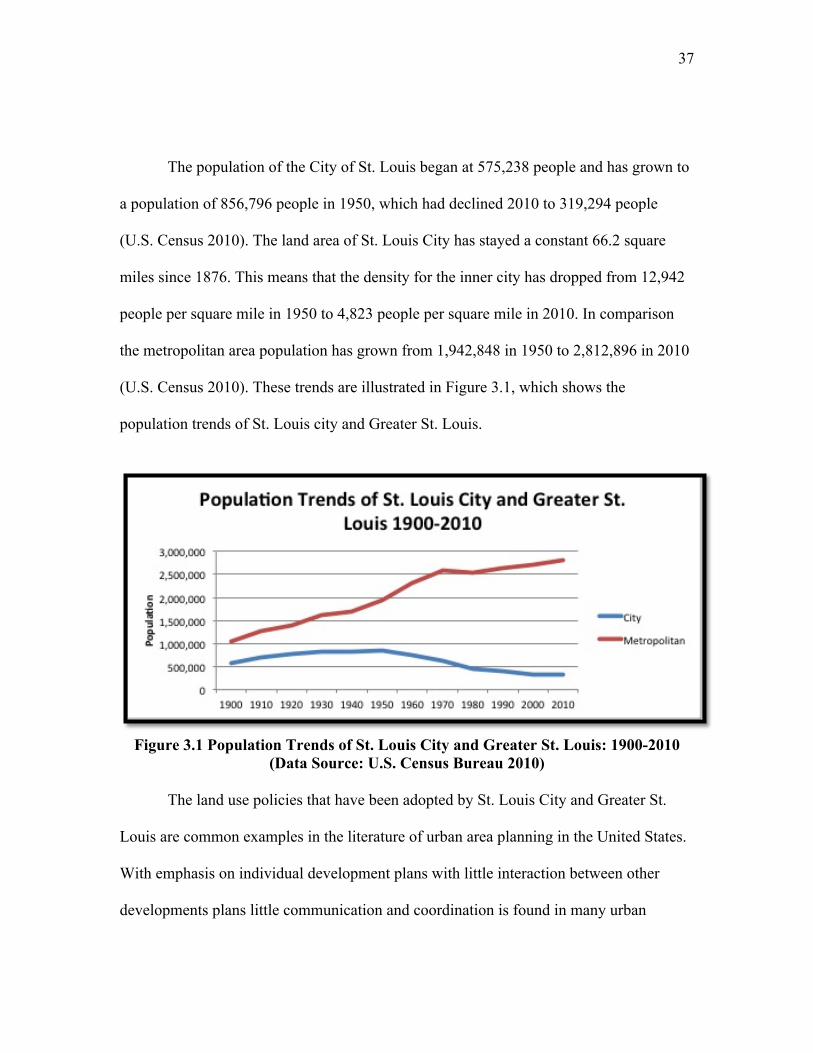
The population of the City of St. Louis began at 575,238 people and has grown to
a population of 856,796 people in 1950, which had declined 2010 to 319,294 people
(U.S. Census 2010). The land area of St. Louis City has stayed a constant 66.2 square
miles since 1876. This means that the density for the inner city has dropped from 12,942
people per square mile in 1950 to 4,823 people per square mile in 2010. In comparison
the metropolitan area population has grown from 1,942,848 in 1950 to 2,812,896 in 2010
(U.S. Census 2010). These trends are illustrated in Figure 3.1, which shows the
population trends of St. Louis city and Greater St. Louis.
Figure 3.1 Population Trends of St. Louis City and Greater St. Louis: 1900-2010
(Data Source: U.S. Census Bureau 2010)
The land use policies that have been adopted by St. Louis City and Greater St.
Louis are common examples in the literature of urban area planning in the United States.
With emphasis on individual development plans with little interaction between other
developments plans little communication and coordination is found in many urban
! ! 38
! ! !
metropolitan areas in the United States. The policies of this area have been replicated
throughout many urban areas allowing for low-density development to occur.
St. Louis Policies
Urban Redevelopment
The City of St. Louis has had a unique problem that few urban areas have to deal
with. In 1876, St. Louis City faced the problem of urban expansion into rural areas,
which limited the commercial business activity and tax base of the city (Phares 2007). To
deal with the problem the City of St. Louis, which was located in St. Louis County,
decided to limit its boarders to protect the tax base and commercial business economy.
Through the ratification of a new constitutional convention the City of St. Louis
successfully separated from the St. Louis County, becoming its own county (Cropf and
Swanstrom 2005). In doing so the City of St. Louis expanded from eighteen to sixty one
square miles (deemed adequate to support future growth), however the constitution did
not provide for any adjustment of the boarders. After realizing the mistake, the City of St.
Louis tried to ratify amendments to the constitution (1926: Consolidation of the City and
Country under City Government, 1959: Creation of the Metropolitan St. Louis District,
1962: The Borough Plan, 1990 Board of Electors Plan), however for the past 137 years
the amendments have all failed. “The inability to annex has been a major cause of the
city’s population decline” (Cropf and Swanstrom 2005, 11).
Many of the problems that have plagued the City of St. Louis did not start until
the 1950s when the city population was at its largest. Around this time the density of the
inner city was high above 12,000 people per square mile. The reasons for decline
included income growth, postwar housing and mortgage policies, deteriorating conditions
! ! 39
! ! !
in the city, and the rise of the automobile in American culture (Blair 2007). About this
time St. Louis was gaining national publicity for its receipt in the first federal funding for
massive urban renewal programs (Judd and Swanstrom 2012, 182). Most of which went
to the failed Pruitt-Igoe housing complex. In the 1970s, as de-industrialization peaked, St.
Louis lost 27 percent of its population (U.S. Census 2010). “However, by the 1980s it
became evident that downtown was losing much of its overall economic vitality. Plans to
reverse this trend were developed but languished for almost a decade” (Cloar 2004, 22).
Despite the application of those plans, St. Louis City still lost 12 percent of its population
between 1990 and 2000 (Gillham 2002).
Transportation
On an average day the population of Greater St. Louis make more than ten million
trips of which 88 percent utilizes the automobile as the transport of choice (Blair 2007).
The Greater St. Louis highway system allows the population to move freely with little
travel time due to the large amount of roadways (East-West Gateway 2011). The results
of such travel has helped to increase the metropolitan area sprawl and facilitated the
current population densities and land use in the regional area. The population of the
metropolitan area saw the largest increases during the time of heightened highways
(1950-1970) as well as the inner-city seeing the quickest decrease in population (see
Figure 3.1). A large part of this is due to the increase of funding for highways after World
War II. Much of the planning for Greater St. Louis has been based on automobile usage
resulting in the limited functionality and the limited desirability to utilize the mass
transportation system managed by the Bi-State Development Agency.
! ! 40
! ! !
The mass transportation system extends through large portions of the Greater St.
Louis area and incorporates the region in both Illinois and Missouri. The amount of mass
transportation is astonishing given that it was created through the acquisition of fifteen
privately owned transit firms in 1963 and then updated and expanded several years later
(Blair 2007). Despite the amount of money and effort gone into developing the mass
transportation system the East-West Gateway organization has suggested the “region’s
transit system may not provide sufficient frequency and coverage for those households
without cars” (East West Gateway 2011, 78).
Effects of Policies
Unfortunately in terms of sustainable urban development St. Louis and the
Greater St. Louis Area has had more failures than successes in their attempts to develop
sustainably and reduce urban sprawl. Whether it is through the mass transportation
systems which despite major expenditures have seen diminishing usage, or housing and
urban renewal projects such as the massive failure of Pruitt Igoe, St. Louis cannot seem
to develop sustainably (Gillham 2002; Judd and Swanstrom 2012). Part of the reason is
due to the past failures and limitations on the inner city. Other reasons include the
fragmentation of government in the Greater St. Louis area that causes competition instead
of cooperation between municipalities. The final reason is the failure of the people of
Greater St. Louis to realize the impacts that they have on their region and the
environment. Without motivation to reduce sprawl and create better neighborhoods the
population of Greater St. Louis and the City of St. Louis will fail to implement projects
! ! 41
! ! !
that could benefit them by increasing desirability to live there, increasing economic
performance, and increasing the environmental quality.
Current land use trends have led to St. Louis becoming one of the most
decentralized cities, which has experienced widespread abandonment of the central city
for the more sprawled out suburbs (Bruegmann 2005). This has led to the below average
metro area density and the higher than average population living in rural areas (East-West
Gateway 2011). Continuing problems encountered by St. Louis include:
• Wide disparities in the number and extent of public services provided • Substantial variation in tax base to finance essential services • Some essential area-wide services are inadequate • Some communities have failed to recognize their responsibility to the entire urban
area. • Competition among municipalities to increase their potential tax resources
impedes planning for the entire area. • Growth will occur in unincorporated St. Louis County and ad hoc annexations
and incorporations will not provide an adequate solution. • St. Louis County will have to provide an increasing amount of municipal services
to unincorporated county residents due to urban sprawl (Phares 2007)
A review conducted by the St. Louis Council of Governments recently stated
“The St. Louis region continues to rank near the bottom among its peer regions in percent
of population living in the urban core” (East-West Gateway 2011, 20).
The Greater St. Louis area is ranked as one of the top three U.S. metropolitan
areas for overall number of units of government including city, municipal, state, regional,
and special districts, generally ranked behind Pittsburg, Pennsylvania (Krumenacher
2008; East West Gateway 2011). The U.S. Census Bureau gives the total number of
governmental organizations in the Greater St. Louis area as 1,044 units. Figure 3.2 shows
the breakdown of those governmental units in the Greater St. Louis Area. The
! ! 42
! ! !
government units can be broken down into Cities, Townships, Counties, Villages, and
Special Districts. “Less than half of local government units in the St. Louis region are
general-purpose governments, such as counties, municipalities, and townships” (East
West Gateway 2011, 82), the rest are special districts.
Fragmentation of local governments is necessary to some degree, to unburden city
and municipal governments, however when there is an excess of local governments then
confusion becomes a problem. Confusion on who has jurisdiction has created many
issues in the metropolitan area. This allows for wide disparities of public services that are
provided as well as the adequacy of those services in some areas (Phares 2007). In terms
of metropolitan areas, fragmentation without a central leadership organization generally
means that little occurs when it comes to regional issues. An example is the coordination
of urban planning over the entire metropolitan area of Greater St. Louis. There is no
oversight to this area, which allowed for the large amount of urban sprawl that has taken
place. Competition amongst municipalities, cities, and special districts to increase their
tax base has the negative effect of impeding planning for the entire area (Phares 2007).
The large amount of special districts has also allowed for some environmental issues to
be overlooked such as lead, and asbestos in certain areas (Berg 2010; East-West Gateway
2011).
There is even fragmentation in regional oversight. Governments that maintain
data and encourage regional coordination include the East-West Gateway/Council of
Governments, the St. Louis Regional Chamber, Bi-State Development Agency (Metro
Transit), as well as the Missouri and Illinois state governments. Some of these
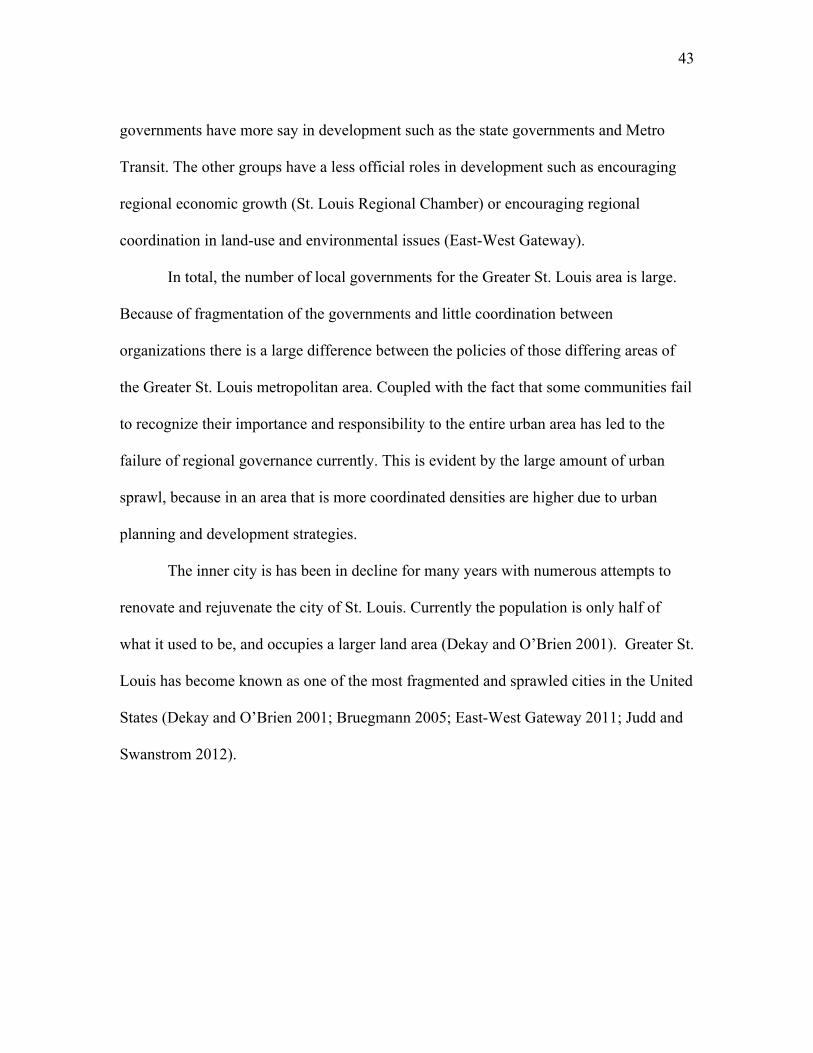
! ! 43
! ! !
governments have more say in development such as the state governments and Metro
Transit. The other groups have a less official roles in development such as encouraging
regional economic growth (St. Louis Regional Chamber) or encouraging regional
coordination in land-use and environmental issues (East-West Gateway).
In total, the number of local governments for the Greater St. Louis area is large.
Because of fragmentation of the governments and little coordination between
organizations there is a large difference between the policies of those differing areas of
the Greater St. Louis metropolitan area. Coupled with the fact that some communities fail
to recognize their importance and responsibility to the entire urban area has led to the
failure of regional governance currently. This is evident by the large amount of urban
sprawl, because in an area that is more coordinated densities are higher due to urban
planning and development strategies.
The inner city is has been in decline for many years with numerous attempts to
renovate and rejuvenate the city of St. Louis. Currently the population is only half of
what it used to be, and occupies a larger land area (Dekay and O’Brien 2001). Greater St.
Louis has become known as one of the most fragmented and sprawled cities in the United
States (Dekay and O’Brien 2001; Bruegmann 2005; East-West Gateway 2011; Judd and
Swanstrom 2012).
! ! 44
! ! !
Figure 3.2 Government Fragmentation of Greater St. Louis Area (Data Source: Census 2010)
Despite the decline in the inner city there have been large improvements to
rehabilitate the city. In St. Louis many developers have taken to urban infill and
rehabilitation of old buildings to revitalize the downtown area. Examples of revitalization
projects include; Washington Avenue Streetscape, Renaissance Grand Hotel,
Merchandise Mart Apartments, The Old Post Office, The Kiel Opera House, and the
Westin Hotel (Cloar 2004). Another success has been the passing of the ordinance in
2010, granting development rights for a 1,500-acre regeneration project in North St.
Louis and approving a tax increment financing (TIF) for a community project that will
create a neighborhood that is connected to the light rail system (Berg 2010). This
community will include a trolley loop through the site to connect people to the light rail
transit system to ensure that the homes are within a fifteen-minute walk to mass transit.
Also the community is planned to have at least 15% of the residents be able to walk to
work.
! ! 45
! ! !
While the current situations of both the downtown and the metropolitan region
look grim, there are projects that are starting to help rehabilitate the area. With help from
the Downtown Development Plan in 1999, the inner city has seen over 2.1 billion dollars
in investments to the city (Cloar 2004). With development projects like the one passed in
2010 and the rehabilitation of historic buildings have begun to make the inner city more
inviting, which is necessary if St. Louis is to start attracting people again to the city.
Indications are that the City of St. Louis has begun to revitalize itself with a clear plan of
the future (Cloar 2004). With aspects such as an Eco-village and public transportation, St.
Louis is working towards developing sustainably but there are many aspects of this urban
area that hinder such development.
There are few projects that have indicated any commitment to reducing sprawl
and the region’s impact on the environment. It is possible for Greater St. Louis to
incorporate sustainable urban development techniques despite the lack of cohesion
between governments (Krummenacher 2008). There are three steps needed to achieve
such development. The first is a good knowledge base of the local policy. By
understanding what policies are passed and how it will become easier to predict which
policies will pass and how those policies are worded to gain the support of lawmakers
and the public. The second is the building of relationships. Relationships in the form of
homeowners and city managers can help developers understand what is needed and how
to approach the public. The third is that public leadership and resources matter. Having a
stake and being a part of the community is important but what are needed as well is the
leadership capabilities to persuade the public that these goals are important for the future
of the city and their communities. Also by bringing in resources into these communities

! ! 46
! ! !
is shows an effort to be invested in the community to make it a better place to live.
However the efforts made to plan and enact initiatives for sustainable land use the gains
made have been off-set by the absence of regional level actors to implement these plans
across the metropolitan area.
! ! 47
! ! !
CHAPTER 4: COMPARISON AND CONCLUSION
The Portland Metropolitan Area and the Greater St. Louis area have long histories
of working with urban development and planning. In the case of Portland this planning
has been to restrict the use of development planning tools that allow for low-density
urban development. With restrictions on land use, transportation construction, and the
concern for environmental issues Portland has created a planning and development
toolkit that works to reduce low-density, automobile centered urban areas. St. Louis
however has worked towards similar goals but have not had the support that has been
witnessed in Portland. Their policies are not coordinated regionally. Greater St. Louis’s
transportation plans allow for a continued automobile centered urban area, which has the
effect of expanding the land used and drawing population from the inner city into the
suburbs.
Comparison of Portland and St. Louis
Both Portland Metro and Greater St. Louis are metropolitan areas that have more
than 2 million people. Both metropolitan areas cross multiple boundaries; and both
consist of multiple counties, which lay in two different states. Portland lays in both
Oregon State and Washington State and consists of seven different counties, whereas St.
Louis is in both the States of Missouri and Illinois and consists of seventeen counties.
Both are ranked fairly close in the U.S. Census Bureau’s rankings of Metropolitan Areas
(Portland is 21, St. Louis is 17). The most important aspect is that both areas have had
attempts at controlling urban sprawl. Some attempts have succeeded and some have
failed. Table 4.1 compares information about Portland and St. Louis metropolitan areas.

! ! 48
! ! !
Table 4.1 Comparison of Portland and St. Louis
City Portland St. Louis Population 2,226,009 2,812,896 Land Area (sq. mi) 6,684 8,846 Population Density 333 318
Inner City Population 583,776 319,294 Inner City Land Area (sq. mi) 145.4 66.2 Inner City Population Density 4,015 4,823
Growth of Population City 2000-2010 10% -8% Growth of Population Metro 2000-2010 13% 4% Is There A Comprehensive Land Use Plan Including Environmental Issues? Yes No Is There A Metropolitan Regional Government? Yes No Is Zoning Used to Delineate Environmentally Sensitive Growth Areas? Yes No
Portland’s urban development strategies have been successful in limiting its urban
sprawl whereas St. Louis has been unsuccessful in curbing urban sprawl. In 1980 when
the urban growth boundary in Portland began to take effect the increase in the inner city
population as well as the increase in the metropolitan population is pronounced in the
graph. Also notice how this is not seen in the trends for St. Louis. In fact the opposite is
noticeable. The reason is because urban sprawl was managed in Portland, by redirecting
attempted urban growth back into the city. There was no such mechanism for St. Louis
and the inner city declined drastically because of urban sprawl.
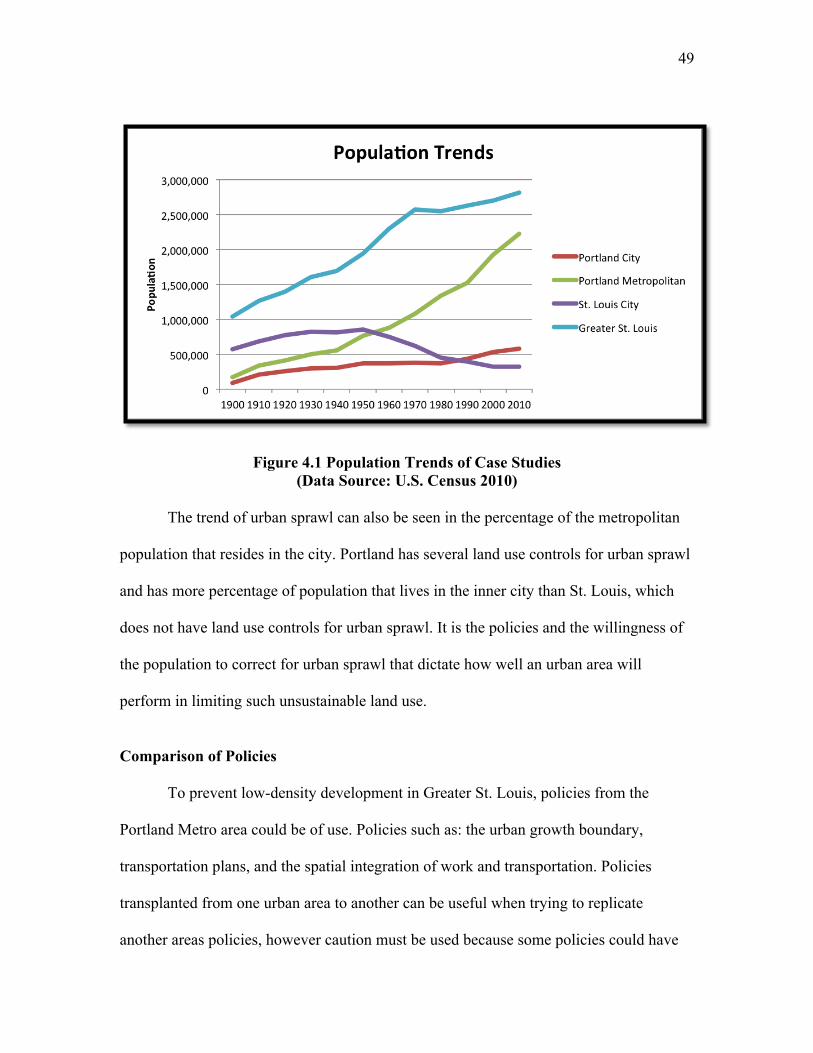
! ! 49
! ! !
Figure 4.1 Population Trends of Case Studies (Data Source: U.S. Census 2010)
The trend of urban sprawl can also be seen in the percentage of the metropolitan
population that resides in the city. Portland has several land use controls for urban sprawl
and has more percentage of population that lives in the inner city than St. Louis, which
does not have land use controls for urban sprawl. It is the policies and the willingness of
the population to correct for urban sprawl that dictate how well an urban area will
perform in limiting such unsustainable land use.
Comparison of Policies
To prevent low-density development in Greater St. Louis, policies from the
Portland Metro area could be of use. Policies such as: the urban growth boundary,
transportation plans, and the spatial integration of work and transportation. Policies
transplanted from one urban area to another can be useful when trying to replicate
another areas policies, however caution must be used because some policies could have

! ! 50
! ! !
negative repercussions if used improperly. An example could be of urban growth
boundaries. If used without careful consideration and monitoring the policy can have
negative social, economic, and environmental implications.
An important aspect to preventing low-density development is to have a firm and
executable plan for the urban metropolitan area. Portland’s regional 2040 plan allows for
the establishment of goals and ways to monitor the progress. “In establishing the goals of
a proposed intervention, one must move beyond the rhetoric of ‘‘fighting sprawl’’ to
targeting the specific dimension(s) of land use that are putatively generating the
undesirable outcomes. Moreover, one must consider whether the policy instrument being
considered will avoid altering another dimension of land use besides those being targeted,
thereby skirting potentially harmful, unintended consequences” (Cutsinger et al. 2005,
p.257-258). By linking such plans to actual policies and monitoring the results has the
effect of providing the intended consequences, and if there happens to be unintended
consequences they are more easily reversible because the problems are generally caught
early on in the development process. St. Louis fails in this respect because there are little
metropolitan wide development plans and those that have been developed are generally
not enforced. In the end having a good plan is the best way to monitor and implement
sustainable urban development in the Greater St. Louis area.
Through the use of a regional plan such as Portland’s 2040 Growth Plan, Greater
St. Louis can plan and implement for more regional policies. Such policies should
include an urban growth boundary modified to work for St. Louis, a transportation plan
that allows for the integration of activities within the metropolitan area as well as
allowing for multiple transit types that reduce the use of the personal automobile. To

! ! 51
! ! !
implement such a plan the Greater St. Louis area would need a regional government with
the ability to implement changes or ask for the implementation of changes to
development plans. By having a regional government to oversee and enforce a
metropolitan area growth plan each city inside the metropolitan area would be able to
create how they develop but would have to conform to some regional standards to allow
for more condensed and sustainable growth.
The inner cities of each metropolitan area show the importance of each area
within the metropolitan regions. The city of Portland is the heart of the Portland
metropolitan area, and is planned so according to the 2040 Growth Concept. In Portland
Metro the city of Portland connects all of the smaller cities through integrated mass
transportation and limitations on private automobile use. This allows for the population
outside of the city of Portland to be a part of the inner city. The large connection has
helped to maintain a steady increase in population and in the provision of services for the
metropolitan area.
The city of St. Louis is considered to be the inner city for Greater St. Louis.
However in terms of services the inner city has little to do with the metropolitan area.
The city of St. Louis has been removed from the metropolitan area for more than one
hundred years as stated earlier. Because of such policy the inner city has had little
influence in the maintenance of a strong metropolitan region, which has led to the low-
density development and governmental fragmentation. Even though the City of St. Louis
has implemented sustainable land use measures without the support of the metropolitan
area the policies have a diminished effect due to the loss of population and resources.
! ! 52
! ! !
Methods and policies that help maintain a large degree of spatial integration of
employment and transportation would bring benefit to Greater St. Louis. To discourage
automobile use or to reflect the true costs of its use, policies that promote taxation for
automobile owners/users would provide funds for an urban area and reduce the impacts
of personalized automobiles (Owen 2009). Another method would be to limit parking
spaces so that urban drivers are more reluctant to drive, schemes that make parking easier
encourages people to drive (Owen 2009). A third policy would be to give incentives to
employers that encourage or require mass transportation options for their employees such
as bicycle options, carpooling, bus pass discounts, etc. The easier mass transportation is
to use the more it encourages ridership among the population. In the end a large force in
the development of urban areas is how the workforce travel to their places of
employment. Using design strategies to intermix residential and job locations would have
the positive effect of reducing local trip lengths (Horner 2007). Until businesses begin to
encourage their employees to live closer to work and travel in more sustainable ways
urban areas will continue to remain large and sprawled out. The policies of Portland to
incorporate transportation concerns into the development strategy has helped to improve
the accessibility of the city to more transportation options allowing for people to reduce
their car use.
The numerous policies that affect how an urban area grows all need to be
maintained to prevent unsustainable use of land and resources. It is through negligence or
an unwillingness to consider such actions that allow for sprawling urban areas. It has
been shown that enabling land use policies such as urban growth boundaries and building
caps are a positive influence on economic performance and housing prices (Cervero

! ! 53
! ! !
2001; Jun 2006). Even if an urban growth boundary is undesirable for a metropolitan area
there are other ways that land use can be limited to reduce sprawl. Smart growth zoning
ordinances that have been seen in Portland promote small lot sizes, close proximity of
buildings to roads, limits public parking spaces, and promote walkable neighborhoods
will help to revitalize urban areas and limit the spread of urban sprawl. The use of these
zoning ordinances in the larger metropolitan area of St. Louis could have a large impact
in utilizing sustainable land uses. However there needs to be an atmosphere in the Greater
St. Louis area that allows for and encourages such sustainable land use codes.
First, charging the full cost of development on Greenfield sites (to reflect the
environmental costs, loss of diversity to existing urban areas, and the true cost of building
materials) development on brownfield sites or in vacant urban lots would become more
profitable (Power 2001). By infilling urban areas with new buildings it helps to create
diversity in buildings and in the age of buildings, which helps to create interest in the
urban area and provides for richness in the urban experience. Mingling the age of
buildings is important because in older buildings the rent is usually cheaper allowing for
new businesses to begin. Once those businesses become profitable they move on to
larger, newer buildings, and the cycle starts over. “If a city area has only new buildings,
the enterprises that can exist there are automatically limited to those that can support the
high costs of new construction” (Jacobs 1961, 244).
“Land use planning and control occurs at the local level, but many of the negative
outcomes attributed to sprawl transcend jurisdictional boundaries” (Wilson and Song
2011, 6). A factor that helps to limit the negative outcomes of sprawl is the
implementation of development plans, especially those that are regional in scale, is to
! ! 54
! ! !
have a strong, regional, governance that can implement such plans (Rappaport 2005).
Portland’s Metro has the authority to enforce municipalities to create their comprehensive
plans in conjunction with the regional growth concept. The Metro maintains that the
municipalities, townships, and cities are on the same page when it comes to sustainable
urban development. This is a factor that is sorely missed in Greater St. Louis. The
fractured nature of the governance system in Greater St. Louis severely hampers any
attempt to create an actionable regional plan that can be enforced. “Changing land use is
not easy in areas used to sprawl development, especially without strong regional
governance to regulate land use” (Wheeler 2009, 865). In the end it is a variety of
policies and cooperation that will bring about sustainable urban development for an urban
area as well as a determined population educated about the positive effects of such
growth.
Conclusion
The effective efforts needed to deal with urban sprawl depend on the
understanding of the nature and extent of such land use (Wolman at al. 2005). It has been
shown that urban sprawl has had a long history in the United States. Through the
introduction of new transportation technologies such as the steamboat, railroad, and the
automobile, through the introduction of zoning ordinances, and the effects of the national
economy, urban areas have changed and grown. The population worldwide has been
increasing, as well as the proportion of population that resides in urban areas. All of these
aspects have had effects on urban growth and in many cases has facilitated the
unsustainable growth of urban areas. But by understanding why such growth has
! ! 55
! ! !
occurred and because of which policies, urban Americans can prevent urban sprawl from
affecting their cities.
The conclusions drawn from this paper is that the Greater St. Louis area could
draw inspiration from the policies of the Portland metropolitan area. Through Portland’s
ability to adopt and implement regional plans, as well as the support given to these
regional plans from State legislation and the willing implementation from cities and
counties, has allowed for a successful regional growth plan. However the implementation
of policies from Portland Metro to Greater St. Louis would be difficult currently. In spite
of efforts at the local level, constraints from outdated legislation as well as the fractured
nature of governance of the Greater St. Louis area would not be a welcoming
environment for sustainable land use policies. Therefore to implement such policies
Greater St. Louis would need to have a larger cooperation on the regional level.
It has been shown that Portland has become a beacon for sustainable land use
development, however even this urban area is far from perfect. Concepts such as urban
growth boundaries, comprehensive plans and metropolitan governments have been highly
debated subjects in the literature of urban sprawl. Despite setbacks the policies of
Portland have helped to transform the urban area and prevent large-scale urban sprawl to
take effect. The negative effects of improper urban development policies have also been
showcased through an examination of Greater St. Louis. The effect of limiting choices,
through city/county legislation has had a large impact on their inner city. The
mismanagement and fracture of the larger area governments has caused hardship in
controlling for urban sprawl for Greater St. Louis. Finally the impacts of transportation
have been highlighted by both case studies. The effectiveness of how highways can
! ! 56
! ! !
create urban problems and the way that many problems can be fixed when a mixture of
transportation options is given.
In conclusion, the path to sustainable urban development depends greatly on the
urban area in question. Some policies will work well for certain cities and some will fail
in other cities. What is most needed though are strong comprehensive plans, governments
willing to enforce such plans, and the population educated in the ways to effect positive
change into their communities. The lessons that have been learned from these case
studies could be transferred to other urban areas but caution should be used so that
negative consequences of improper development policies are reduced. In a world with
growing populations and a rise in the percentage of urbanites, urban areas are becoming
the largest battleground for sustainable development. If cities can become sustainable
then there is hope that the people of the world can live in harmony with our planet and
maintain a level of comfort.
! ! 57
! ! !
REFERENCES
Abbott, Carl; Margery Post Abbott. “A History of Metro, May 1991” (2010) Accessed
October 1, 2012 www.oregonmetro.gov Abbott, Carl. Greater Portland: Urban Life and Landscape in the Pacific Northwest.
Philadelphia: University of Pennsylvania Press, 2001. Alberti, Marina; John Marzluff, Eric Shulenberger, Gordon Bradley, Clare Ryan, Craig
Zumbrunnen. “Integrating Humans into Ecology: Opportunities and Challenges for Studying Urban Ecosystems” BioScience 53, no. 12 (2003): 1169-1179
Anas, Alex; Richard Arnott; Kenneth Small.; “Urban Spatial Structure” Journal of Economic
Literature Vol. 36 (1998) p. 1426-1464. Auch, Roger; Janis Taylor, William Acevedo. Urban Growth in American Cities: Glimpses
of U.S. Urbanization. Denver Co. 2004 Baum-Snow, Nathaniel. “Did Highways Cause Suburbanization?” The Quarterly Journal of
Economics (May 2007): 775-805 Behan, Kevin; Hanna Maoh; Pavlos Kanaroglou. “Smart Growth Strategies, Transportation
and Urban Sprawl: Simulated Futures for Hamilton, Ontario” The Canadian Geographer 52(3) 2008: 291-308
Berg, Rebecca. “Sustainability and Urban Redevelopment: The St. Louis Case” Journal of
Environmental Health 72, no.9 (2010): 28-33 Bertaud, Alain. “Metropolis: A Measure of the Spatial Organization of 7 Large Cities”
(2001): 1-22. Blair, Jerry. “Pursuing an Elusive End: Highway and Transit Planning in St. Louis” St. Louis
Plans: The Ideal and the Real St. Louis ed. Mark Tranel. (2007): 327-372 Bruegmann, Robert. Sprawl: A Compact History The University of Chicago Press, Chicago.
2005. Bureau of Statistics (Australia). “Glossary of Statistical Geography Terminology” (2011)
Accessed March 8, 2013 http://www.abs.gov.au/ausstats/[email protected]/mf/1217.0.55.001 Burton, Elizabeth. “The Compact City: Just or Just Compact? A Preliminary Analysis”
Urban Studies 37 no.11 (2000): 1969-2001
! ! 58
! ! !
Carrion-Flores, Carmen; Elena G. Irwin. “Determinants of Residential Land-Use Conversion and Sprawl at the Rural-Urban Fringe” American Journal of Agricultural Economics 86(4) 2004: pg. 889-904
Carruthers John I., Úlfarsson, Gudmundur F. “Does ‘smart growth’ matter to public finance?” Urban Studies 45 (2008): 1791–1823
Cervero, Robert. “Efficient Urbanisation: Economic Performance and the Shape of the Metropolis” Urban Studies 38 no.10 (2001): 1651-1671
City of Beaverton, “Community Profile”. www.beavertonoregon.gov/index.aspx?nid=195.
Date Accessed: 4/2/2012 City of Gresham, “Demographics”. http://greshamoregon.gov/demographics/. Date
Accessed: 4/2/2012 City of Hillsboro, “About Hillsboro, Oregon”. www.ci.hillsboro.or.us/About/Default.aspx.
Date Accessed: 4/2/2012 City of Vancouver, “Facts and Figures”.
www.cityofvancouver.us/all_about_vancouver.asp?menuid=104668&submenuID=11154. Date Accessed: 4/2/2012
Cline, Scott. 1987. “The Jews of Portland, Oregon: A Statistical Dimension, 1860-1880”.
Oregon Historical Quarterly 88.1 p.4-25. Cloar, James. “Downtown St. Louis Reborn” Economic Development Journal (2004): 21-26 Cropf, Robert; Todd Swanstrom. “Déjà vu All over Again: Charter Reform Fails in St.
Louis” National Civic Review (2005): 10-19 Cutsinger, Jackie; George Galster; Harold Wolman; Royce Hanson; Douglas Towns.
“Verifying The Multi-dimensional Nature of Metropolitan Land Use: Advancing the Understanding and Measurement of Sprawl” Journal of Urban Affairs 27 no.3 (2005): 235-259.
Dekay, Mark; Micheal O’Brien. “Gray City, Green City: New thinking and new settlement
patterns can bring about urban sustainability” Forum for Applied Research and Public Policy 16 no. 2 (2001): 19-27
East-West Gateway. “Where We Stand: The Strategic Assessment of the St. Louis Region”
(2011) Accessed: March 8, 2013 http://www.ewgateway.org
! ! 59
! ! !
Eisenberg, Ellen. 2000. “Transplanted to the Rose City: The Creation of East European Jewish Community in Portland, Oregon”. Journal of American Ethnic History 19.3 p.82-97
European Commission (Eurostat). “Urban-rural typology” (2012) Accessed March 8, 2013
http://epp.eurostat.ec.europa.eu/statistics_explained/index.php/Urban-rural_typology Fallah, Belal N.; Mark D. Partridge; M. Rose Olfert. “Urban Sprawl and Productivity:
Evidence from US Metropolitan Areas” Papers in Regional Science 90 no. 3 (2011):451-473
Gillham, Oliver. The Limitless City: A Primer on the Urban Sprawl Debate. Island Press
(2002) Horner, Mark W. “A Multi-scale Analysis of Urban Form and Commuting Change in a Small
Metropolitan Area (1990-2000)” Annals of Regional Science 41 (2007): 315-332 Hume, Susan E. and Susan W. Hardwick. “African, Russian, and Ukrainian Refugee
Resettlement in Portland, Oregon” Geographical Review 95 no.2 (2005) 189-209. Jacobs, Jane. The Death and Life of Great American Cities. 1961. Random House Publishing.
New York. Jaret, Charles; Robert M. Adelman; Lesley Williams Reid. “Suburban Sprawl, Racial
Segregation, and Spatial Mismatch in Metropolitan America” Sociation Today 4 no. 2 (2006)
Jepson, Edward J. Jr.: Mary M. Edwards. “How Possible is Sustainable Urban Development?
An Analysis of Planners’ Perceptions about New Urbanism, Smart Growth and the Ecological City” Planning Practice & Research 25 no. 4. (2010): 417-437
Judd, Dennis; Todd Swanstrom. City Politics Pearson Education, Inc. (2012). Jun, Myung-Jin. “The Effects of Portland’s Urban Growth Boundary on Housing Prices”
Journal of the American Planning Association 72 no. 2 (2006): 239-243. Kenworthy, Jeffery R. “The Eco-City: Ten Key Transport and Planning Dimensions for
Sustainable City Development” Environment and Urbanization 18 no. 1 (2006): 67- 84
Krummenacher, Scott; Todd Swanstrom; Mark Tranel. “Regional System of Greenways: If
You Can Make it in St. Louis You Can Make It Anywhere” National Civic Review (2008):23-30
! ! 60
! ! !
Kunstler, James Howard. The Geography of Nowhere: The Rise and Decline of America’s Man-Made Landscape. Simon & Schuster New York, New York. 1993
Lund, Hollie. “Testing the Claims of New Urbanism: Local Access, Pedestrian Travel, and
Neighboring Behaviors” Journal of American Planning Association 69, no. 4 (2003): 414-429
McVoy, Arthur. “A History of City Planning in Portland, Oregon” Oregon Historical
Quarterly 46 no.1 (1945) p.3-21 Metro. Welcome to Metro (2013) Accessed March 8, 2013 http://www.oregonmetro.gov Miles, Rebecca; Yan Song. “Good Neighborhoods in Portland, Oregon: Focus on Both
Social and Physical Environments” Journal of Urban Affairs 31, no.4 (2009): 491-509
Natural Resources Defense Council. NRDC: Solving Sprawl – Hillsboro, Oregon Accessed
March 10, 2013 http://www.nrdc.org/cities/smartgrowth/solve/orenco.asp Office for National Statistics (England). “Rural Definition and Local Authority
Classification” (2010) Accessed March 8, 2013 http://archive.defra.gov.uk/evidence/statistics/rural/rural-definition.htm#class
Owen, David. Green Metropolis: Why Living Smaller, Living Closer, and Driving Less Are
the Keys to Sustainability. Riverhead Books, New York. 2009. Pack, Janet; Growth and Convergence In Metropolitan America The Brookings Institution
(2002). Phares, Don. “Planning for Regional Governance in the St. Louis Area: The Context, the
Plans, the Outcomes” St. Louis Plans: The Ideal and the Real St. Louis ed. Mark Tranel. (2007): 55-82
Porter, Jeremy R.; Frank M. Howell. “On the ‘Urbanness’ of Metropolitan Areas: Testing the
Homogeneity Assumption, 1970-2000” Population Research and Policy Review 28 (2009): 589-613.
Portney, Kent. Taking Sustainable Cities Seriously: Economic Development, the
Environment, and Quality of Life in American Cities. MIT Press, Cambridge MA. 2003
Power, Anne. “Social Exclusion and Urban Sprawl: Is the Rescue of Cities Possible?”
Regional Studies 35 no. 8 (2001): 731-742.
! ! 61
! ! !
Rappaport, Jordan. “The Shared Fortunes of Cities and Suburbs” Economic Review www.kansascityfed.org. (2005):33-60
Rees, William E. “Ecological Footprints and Appropriated Carrying Capacity: What Urban
Economics Leaves Out” Environment and Urbanization 4 no. 2 (1992): 121- 138
Rees, William; Mathis Wackernagel Ecological Footprints and appropriated carrying capacity: measuring the natural capital requirements of the human economy. In: In- vesting in Natural Capital: The Ecological Economics Approach to Sustainability. Island Press, Washington. (1994)
Rees, William; Mathis Wackernagel. “Urban Ecological Footprints: Why Cities Cannot Be Sustainable-and Why They Are A Key To Sustainability” Environmental Impact Assessment Review 16 (1996): 223-248.
Satterthwaite, David. “Sustainable Cities or Cities that contribute to Sustainable
Development?” Urban Studies 34. No. 10 (1997): 1667-1691 Senate Bill 100. (1973) Accessed March 8, 2013 http://www.oregonmetro.gov Skidmore, Max J. “Restless Americans: The Significance of Movement in American History
(With a Nod to F. J. Turner)” Journal of American Culture 34 no. 2 (2011): 161-174 Sloane, David Charles. “From Congestion to Sprawl” Journal of the American Planning
Association 72. No. 1 (2006): 10-18 Song, Yan; Gerrit-Jan Knaap. “Measuring Urban Form: Is Portland Winning the War on
Sprawl?” Journal of the American Planning Association 70, no. 2 (2004): 210-225 Sultana, Selima; Joe Weber. “Journey-to-work Patterns in the Age of Sprawl: Evidence from
Two Midsize Southern Metropolitan Areas” The Professional Geographer 59 no. 2 (2007): 193-208
TriMet. TriMet (2013) Accessed March 8, 2013 http://trimet.org U.S. Census Bureau. “2010 Census” (2010) Accessed March 8, 2013 http://www.census.gov U.S. Census Bureau. Historical Statistics of the United States, Colonial Times to 1970 pt. 1
Bicentennial ed. U.S. Government Printing Office, Washington D.C. 1975 U.S. Department of Agriculture. Summary Report: 2007 National Resource Inventory.
Natural Resources Conservation Service. Washington, D.C. 2009. U.S. Environmental Protection Agency. This Is Smart Growth (2006)

! ! 62
! ! !
Wheeler, Stephen. “Regions, Megaregions, and Sustainability” Regional Studies 43, no. 6
(2009): 863-876. Wilson, Bev; Yan Song. “Do Large Residential Subdivisions Induce Further Development?:
A Spatially Explicit Hazard Analysis of Land Use Change in Charlotte” American Planning Association 77 no. 1 (2011): 5-22
Wolman, Harold; George Galster; Royce Hanson; Michael Ratcliffe; Kimberly Furdell;
Andrea Sarzynski. “The Fundamental Challenge in Measuring Sprawl: Which Land Should Be Considered?” The Professional Geographer 57 no. 1 (2005): 94-105
World Commission on Environment and Development. Our Common Future. Oxford
University Press, 1987 Wu, Jianguo. “Urban Sustainability: an inevitable goal of landscape research” Landscape
Ecology 25 (2010): p. 1-4 Yeoh, Melissa; Dean Stansel. “Is Public Expenditure Productive? Evidence From The
Manufacturing Sector In U.S. Cities, 1880-1920” Cato Journal 33, no. 1 (2013): 1-28
! ! 63
! ! !
VITA
Graduate School Southern Illinois University
William T Sutphin [email protected] Southern Illinois University Carbondale Bachelor of Science, Geography and Political Science, May 2011 Research Paper Title: Creating Sustainable Urban Land Use Patterns: A Comparison of Portland, Oregon and St. Louis, Missouri Major Professor: Leslie Duram