Embed Size (px)
Citation preview
Creating Shared Value
2013
Nestlé Indonesia
Ensuring water sustainability
Nutrition
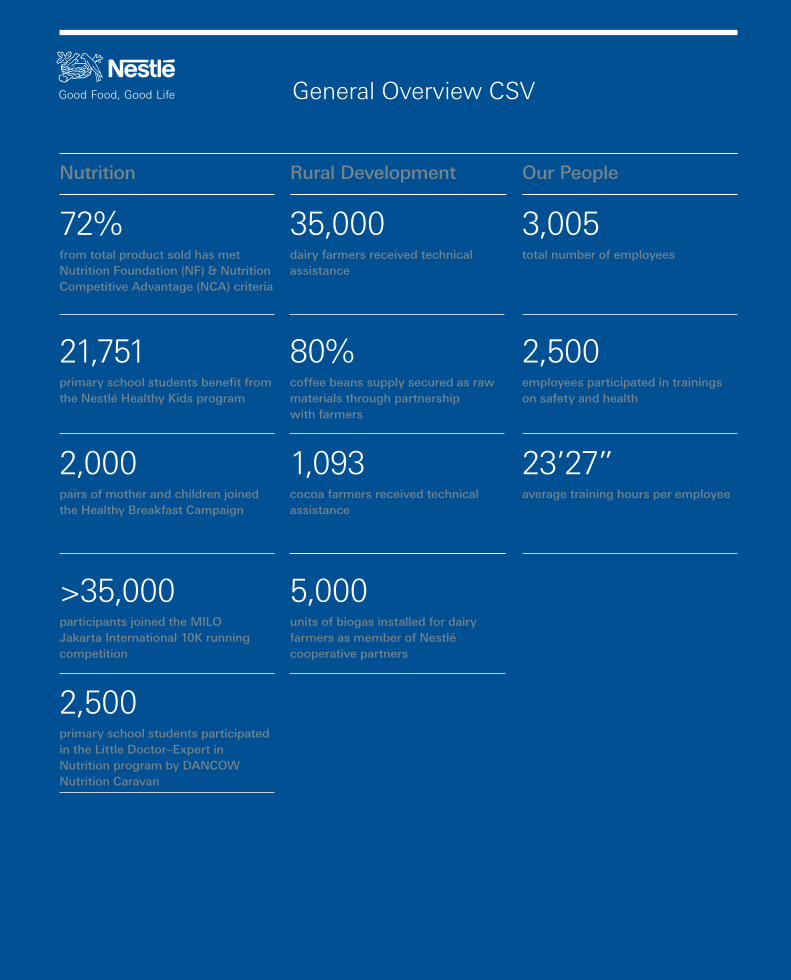
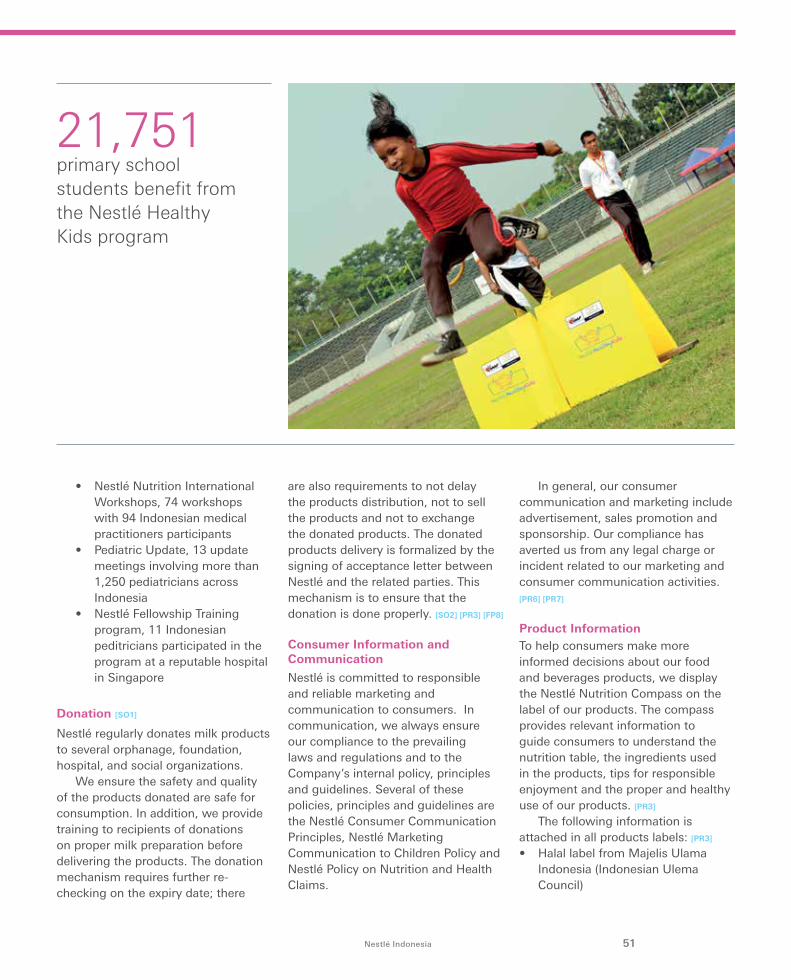
21,751 primary school students benefit from the Nestlé Healthy Kids program
2,500 employees participated in trainings on safety and health
80% coffee beans supply secured as raw materials through partnership with farmers
72% from total product sold has met Nutrition Foundation (NF) & Nutrition Competitive Advantage (NCA) criteria
3,005 total number of employees
2,000 pairs of mother and children joined the Healthy Breakfast Campaign
5,000 units of biogas installed for dairy farmers as member of Nestlé cooperative partners
>35,000 participants joined the MILO Jakarta International 10K running competition
2,500 primary school students participated in the Little Doctor–Expert in Nutrition program by DANCOW Nutrition Caravan
Rural Development Our People
1,093 cocoa farmers received technical assistance
23’27” average training hours per employee
General Overview CSV
35,000
dairy farmers received technical assistance
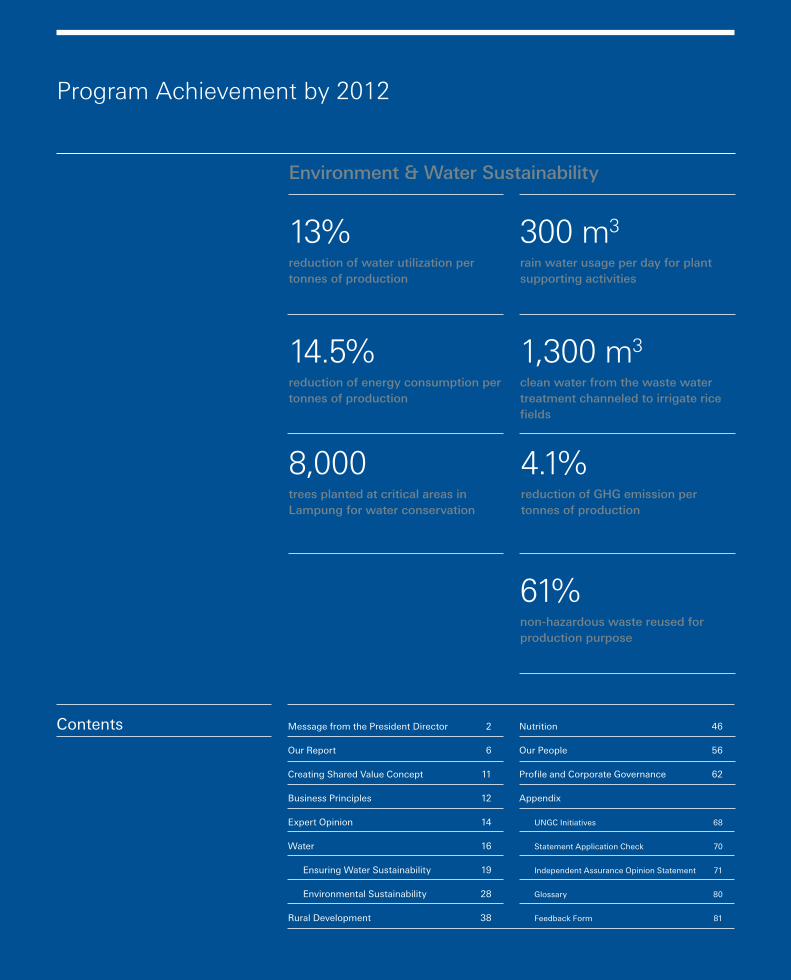
300 m3
rain water usage per day for plant supporting activities
14.5%reduction of energy consumption per tonnes of production
Message from the President Director 2
Our Report 6
Creating Shared Value Concept 11
Business Principles 12
Expert Opinion 14
Water 16
Ensuring Water Sustainability 19
Environmental Sustainability 28
Rural Development 38
Nutrition 46
Our People 56
Profile and Corporate Governance 62
Appendix
UNGC Initiatives 68
Statement Application Check 70
Independent Assurance Opinion Statement 71
Glossary 80
Feedback Form 81
13%reduction of water utilization per tonnes of production
8,000trees planted at critical areas in Lampung for water conservation
61%non-hazardous waste reused for production purpose
1,300 m3
clean water from the waste water treatment channeled to irrigate rice fields
4.1%reduction of GHG emission per tonnes of production
Environment & Water Sustainability
Contents
Program Achievement by 2012
EC1
EC1
FP4
PR5
SO1
SO1
EN6
FP1
FP1
EN8
EN8
EN1
EN5
EN3
EN3
EN4
EN4
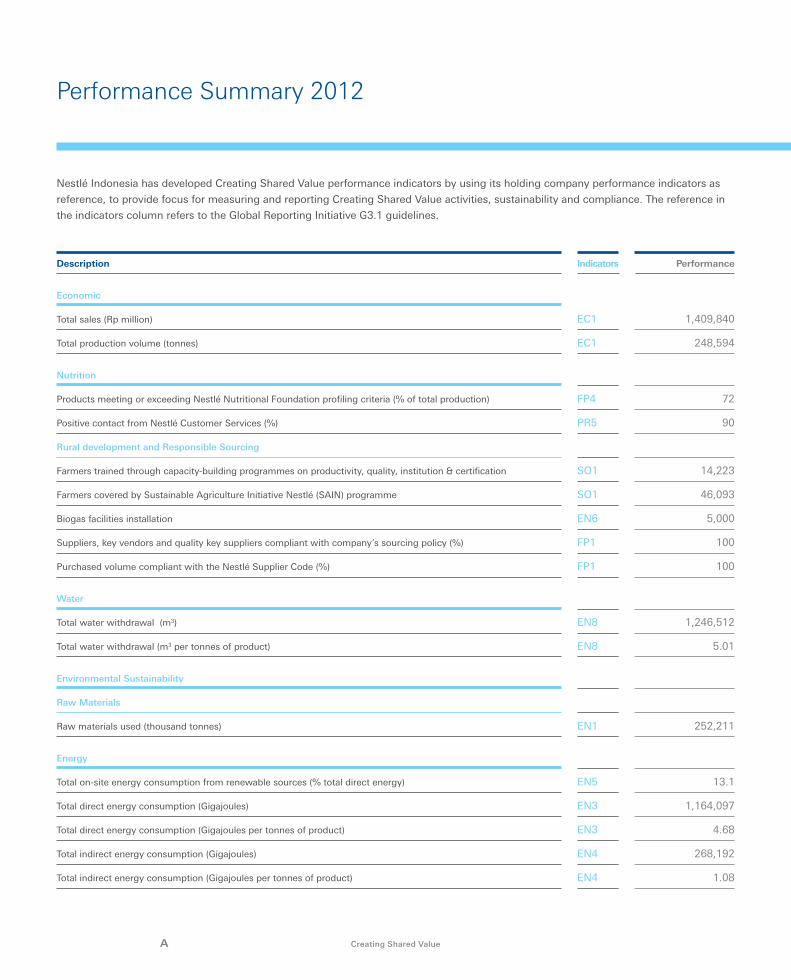
1,409,840
248,594
72
90
14,223
46,093
5,000
100
100
1,246,512
5.01
252,211
13.1
1,164,097
4.68
268,192
1.08
Economic
Total sales (Rp million)
Total production volume (tonnes)
Nutrition
Products meeting or exceeding Nestlé Nutritional Foundation profiling criteria (% of total production)
Positive contact from Nestlé Customer Services (%)
Rural development and Responsible Sourcing
Farmers trained through capacity-building programmes on productivity, quality, institution & certification
Farmers covered by Sustainable Agriculture Initiative Nestlé (SAIN) programme
Biogas facilities installation
Suppliers, key vendors and quality key suppliers compliant with company’s sourcing policy (%)
Purchased volume compliant with the Nestlé Supplier Code (%)
Water
Total water withdrawal (m3)
Total water withdrawal (m3 per tonnes of product)
Environmental Sustainability
Raw Materials
Raw materials used (thousand tonnes)
Energy
Total on-site energy consumption from renewable sources (% total direct energy)
Total direct energy consumption (Gigajoules)
Total direct energy consumption (Gigajoules per tonnes of product)
Total indirect energy consumption (Gigajoules)
Total indirect energy consumption (Gigajoules per tonnes of product)
Description Performance Indicators
Nestlé Indonesia has developed Creating Shared Value performance indicators by using its holding company performance indicators as
reference, to provide focus for measuring and reporting Creating Shared Value activities, sustainability and compliance. The reference in
the indicators column refers to the Global Reporting Initiative G3.1 guidelines.
Performance Summary 2012
A Creating Shared Value
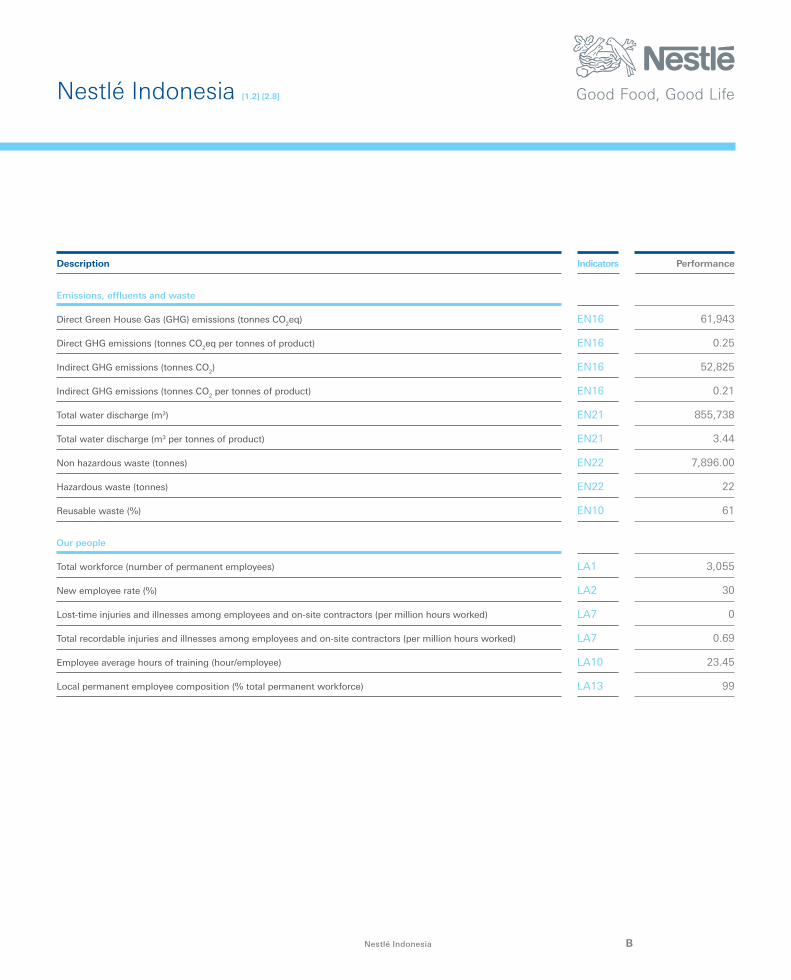
Description Performance Indicators
Emissions, effluents and waste
Direct Green House Gas (GHG) emissions (tonnes CO2eq)
Direct GHG emissions (tonnes CO2eq per tonnes of product)
Indirect GHG emissions (tonnes CO2)
Indirect GHG emissions (tonnes CO2 per tonnes of product)
Total water discharge (m3)
Total water discharge (m3 per tonnes of product)
Non hazardous waste (tonnes)
Hazardous waste (tonnes)
Reusable waste (%)
Our people
Total workforce (number of permanent employees)
New employee rate (%)
Lost-time injuries and illnesses among employees and on-site contractors (per million hours worked)
Total recordable injuries and illnesses among employees and on-site contractors (per million hours worked)
Employee average hours of training (hour/employee)
Local permanent employee composition (% total permanent workforce)
EN16
EN16
EN16
EN16
EN21
EN21
EN22
EN22
EN10
LA1
LA2
LA7
LA7
LA10
LA13
61,943
0.25
52,825
0.21
855,738
3.44
7,896.00
22
61
3,055
30
0
0.69
23.45
99
Nestlé Indonesia [1.2] [2.8]
BNestlé Indonesia
Message from the President Director [1.1] [1.2]
2 Creating Shared Value
At Nestlé, we always believe that in order to prosper we need the communities we serve and in which we operate to prosper as well. Over the long term, healthy populations, healthy economies and healthy business performance are mutually reinforcing.1
We do business responsibly in compliance with national laws, international standards and the Nestlé Corporate Business Principles, and in ways that ensure environmental sustainability for future generations. Our commitments to compliance and sustainability are based on common sense values, and form the foundations upon which we build our actions in Creating Shared Value. As a corporate member of the United Nation Global Compact, we reiterate our support for the ten principles of UN Global Compact.
Creating Shared Value (CSV)We at Nestlé believe that we can create value for our shareholders and society by doing business in ways that specifically help address global and local issues in the area of nutrition, water and rural development. This is what we mean by Creating Shared Value (CSV). We identify opportunities to link our core business activities along our value chain to actions that help to address social issues.
With CSV, we continuously and
consistently make efforts that all of our activities contribute to the society through value chain impacts, context for growth, value for Nestlé and the society.
The focus of this report is on water, but it also covers our commitments to compliance, progress on our other CSV priority areas as well as environmental sustainability.
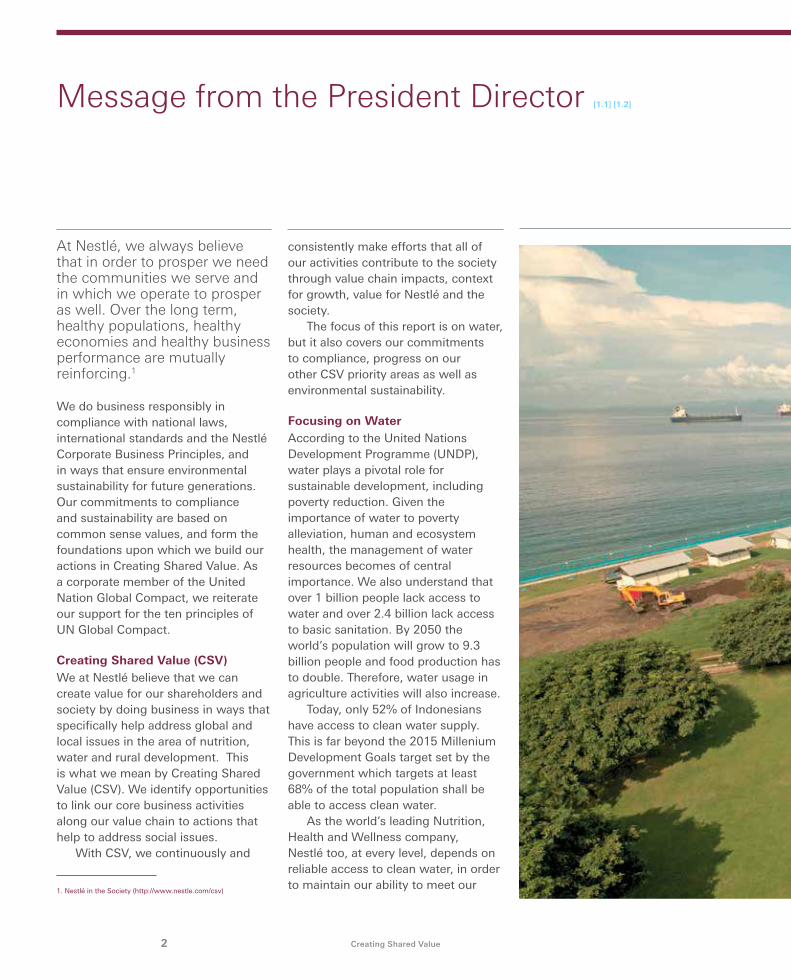
Focusing on Water According to the United Nations Development Programme (UNDP), water plays a pivotal role for sustainable development, including poverty reduction. Given the importance of water to poverty alleviation, human and ecosystem health, the management of water resources becomes of central importance. We also understand that over 1 billion people lack access to water and over 2.4 billion lack access to basic sanitation. By 2050 the world’s population will grow to 9.3 billion people and food production has to double. Therefore, water usage in agriculture activities will also increase.
Today, only 52% of Indonesians have access to clean water supply. This is far beyond the 2015 Millenium Development Goals target set by the government which targets at least 68% of the total population shall be able to access clean water.
As the world’s leading Nutrition, Health and Wellness company, Nestlé too, at every level, depends on reliable access to clean water, in order to maintain our ability to meet our
1. Nestlé in the Society (http://www.nestle.com/csv)
3Nestlé Indonesia
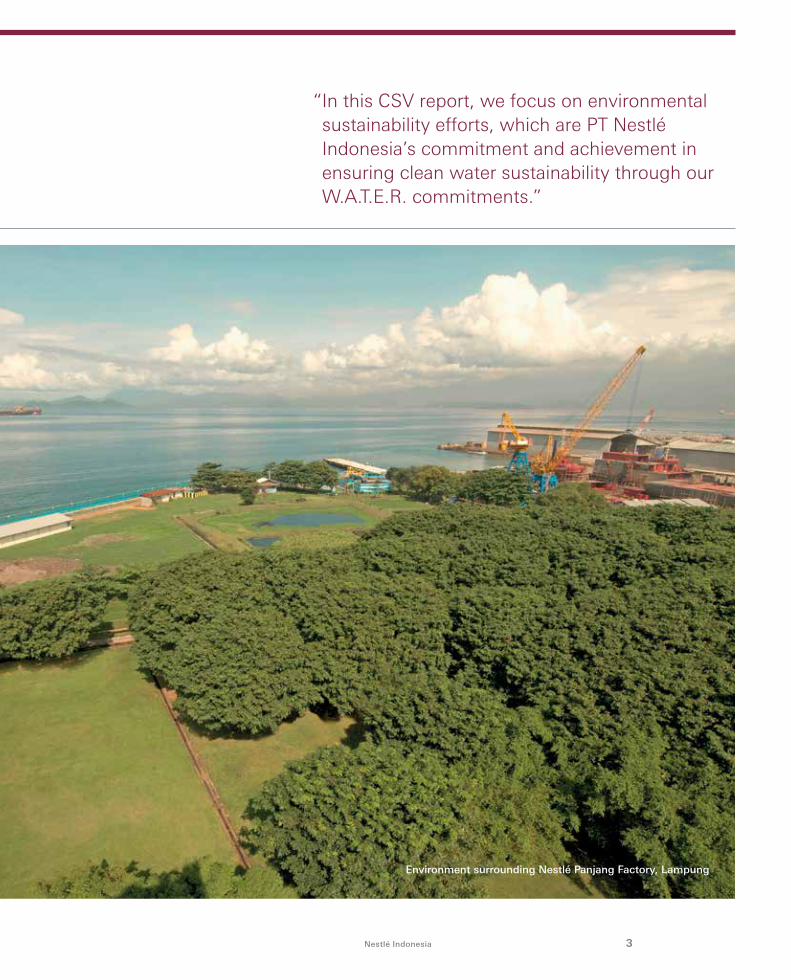
“ In this CSV report, we focus on environmental sustainability efforts, which are PT Nestlé Indonesia’s commitment and achievement in ensuring clean water sustainability through our W.A.T.E.R. commitments.”
Environment surrounding Nestlé Panjang Factory, Lampung
Message from the President Director
4 Creating Shared Value
consumers’ needs. We, therefore, care deeply about water sustainability and remain committed to act, and we urge all parties to together preserve and conserve clean water availability.
In this CSV report, we focus on environmental sustainability efforts, which are PT Nestlé Indonesia’s commitment and achievement in ensuring clean water sustainability through our W.A.T.E.R. commitments. Therefore, the majority of this report will highlight the environmental conservation activities particularly in ensuring water sustainability. In order to make this report more
comprehensive and be able to provide material information, we also include our other efforts supporting the economic, social and environmental sustainability.
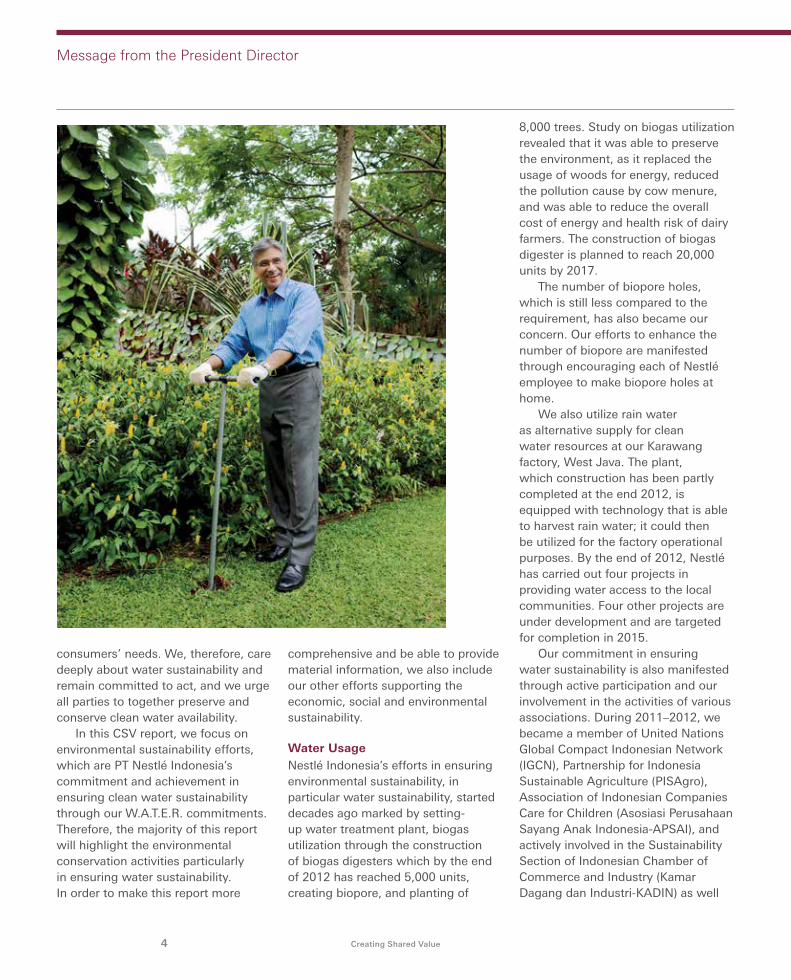
Water UsageNestlé Indonesia’s efforts in ensuring environmental sustainability, in particular water sustainability, started decades ago marked by setting-up water treatment plant, biogas utilization through the construction of biogas digesters which by the end of 2012 has reached 5,000 units, creating biopore, and planting of
8,000 trees. Study on biogas utilization revealed that it was able to preserve the environment, as it replaced the usage of woods for energy, reduced the pollution cause by cow menure, and was able to reduce the overall cost of energy and health risk of dairy farmers. The construction of biogas digester is planned to reach 20,000 units by 2017.
The number of biopore holes, which is still less compared to the requirement, has also became our concern. Our efforts to enhance the number of biopore are manifested through encouraging each of Nestlé employee to make biopore holes at home.
We also utilize rain water as alternative supply for clean water resources at our Karawang factory, West Java. The plant, which construction has been partly completed at the end 2012, is equipped with technology that is able to harvest rain water; it could then be utilized for the factory operational purposes. By the end of 2012, Nestlé has carried out four projects in providing water access to the local communities. Four other projects are under development and are targeted for completion in 2015.
Our commitment in ensuring water sustainability is also manifested through active participation and our involvement in the activities of various associations. During 2011–2012, we became a member of United Nations Global Compact Indonesian Network (IGCN), Partnership for Indonesia Sustainable Agriculture (PISAgro), Association of Indonesian Companies Care for Children (Asosiasi Perusahaan Sayang Anak Indonesia-APSAI), and actively involved in the Sustainability Section of Indonesian Chamber of Commerce and Industry (Kamar Dagang dan Industri-KADIN) as well
5Nestlé Indonesia
as the UNGC–CEO Water Mandate Management. We continue our efforts and improve our collaboration with various parties to ensure environmental sustainability including management of water resources.
Nutrition, Rural Development and More
Nestlé Indonesia’s mission is to nurture a healthier life for Indonesians, therefore for us there is no higher priority than to enhance the quality of life of our consumers by providing tastier and healthier food and beverages choices. As the world’s leading food and beverages company, we have a unique opportunity to help address the current nutrition challenges facing consumers, from over nutrition to under nutrition including micronutrient deficiencies that will cause heavy health cost burden to consumers, society and the government.
Our commitment in ensuring the sustainability of raw materials production and also producing quality products for our consumers is one of the focus of our CSV activities, which at the end will enhance our collaboration with our partners, agricultural raw materials suppliers, and improve their livelihoods and rural economic as well as support the government in ensuring food security.
We are of the opinion that the efforts to ensure water sustainability, to address nutrition challenges and to ensure the sustainability of agricultural raw materials production need a concerted action from all stakeholders. Nestlé in this respect is willing to be actively involved and to lead the concerted efforts as we have the determination to do so.
The importance of physical activities as part of healthy life style has encouraged us to undertake
various programs and activities such as Nestlé Healthy Kids, DANCOW Nutrition Caravan, MILO Badminton School Competition and MILO Jakarta International 10K run. We will continue these activities and for the Nestlé Healthy Kids program, we plan to reach 100 elementary schools in Indonesia by 2015.
We understand the importance of communication supported by good technology to disseminate information to our stakeholders, and also to get input to improve our performance. Therefore, with communication strategy for dialogue with transparency, we continue to make efforts in improving the effectiveness of our communication.
Sharing Your ViewsOur report communicates progress and challenges facing us in 2011–2012. We hope you find our Creating Shared Value report informative and useful.
We would appreciate your input and views to enable us to improve our performance.
Arshad ChaudhryPresident Director
“ With Creating Shared Value, we continuously and consistently make efforts to contribute to the society through value chain impacts, context for growth and value for Nestlé and the society.”
6 Creating Shared Value
About the Report
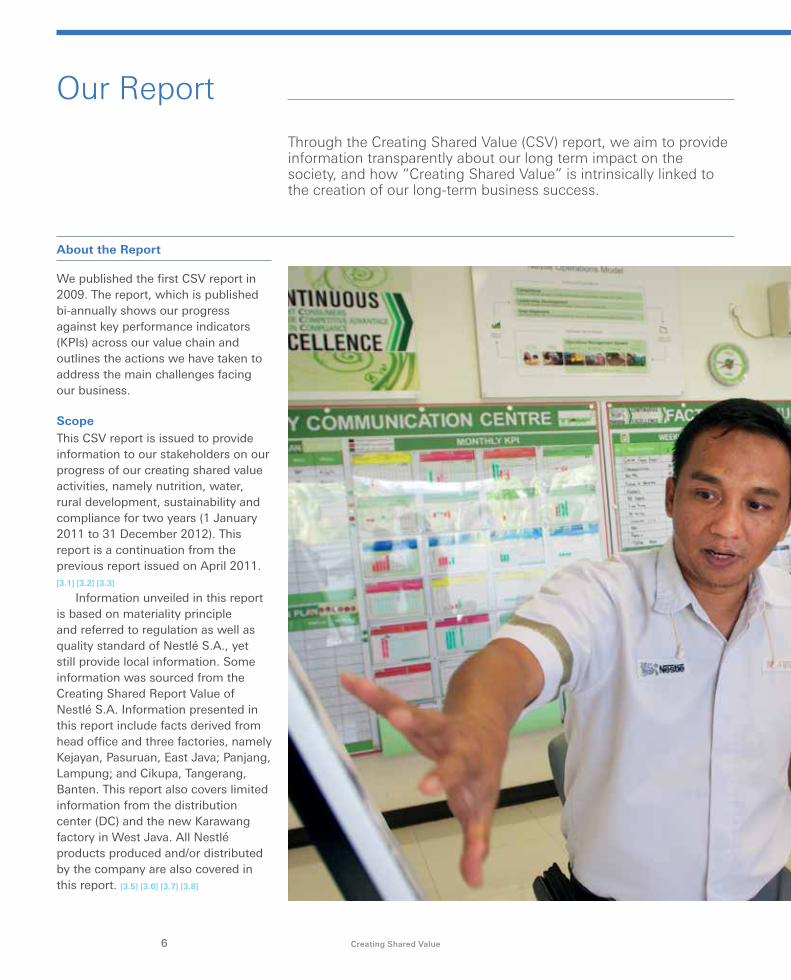
We published the first CSV report in 2009. The report, which is published bi-annually shows our progress against key performance indicators (KPIs) across our value chain and outlines the actions we have taken to address the main challenges facing our business.
ScopeThis CSV report is issued to provide information to our stakeholders on our progress of our creating shared value activities, namely nutrition, water, rural development, sustainability and compliance for two years (1 January 2011 to 31 December 2012). This report is a continuation from the previous report issued on April 2011. [3.1] [3.2] [3.3]
Information unveiled in this report is based on materiality principle and referred to regulation as well as quality standard of Nestlé S.A., yet still provide local information. Some information was sourced from the Creating Shared Report Value of Nestlé S.A. Information presented in this report include facts derived from head office and three factories, namely Kejayan, Pasuruan, East Java; Panjang, Lampung; and Cikupa, Tangerang, Banten. This report also covers limited information from the distribution center (DC) and the new Karawang factory in West Java. All Nestlé products produced and/or distributed by the company are also covered in this report. [3.5] [3.6] [3.7] [3.8]
Our Report
Through the Creating Shared Value (CSV) report, we aim to provide information transparently about our long term impact on the society, and how “Creating Shared Value” is intrinsically linked to the creation of our long-term business success.
7Nestlé Indonesia
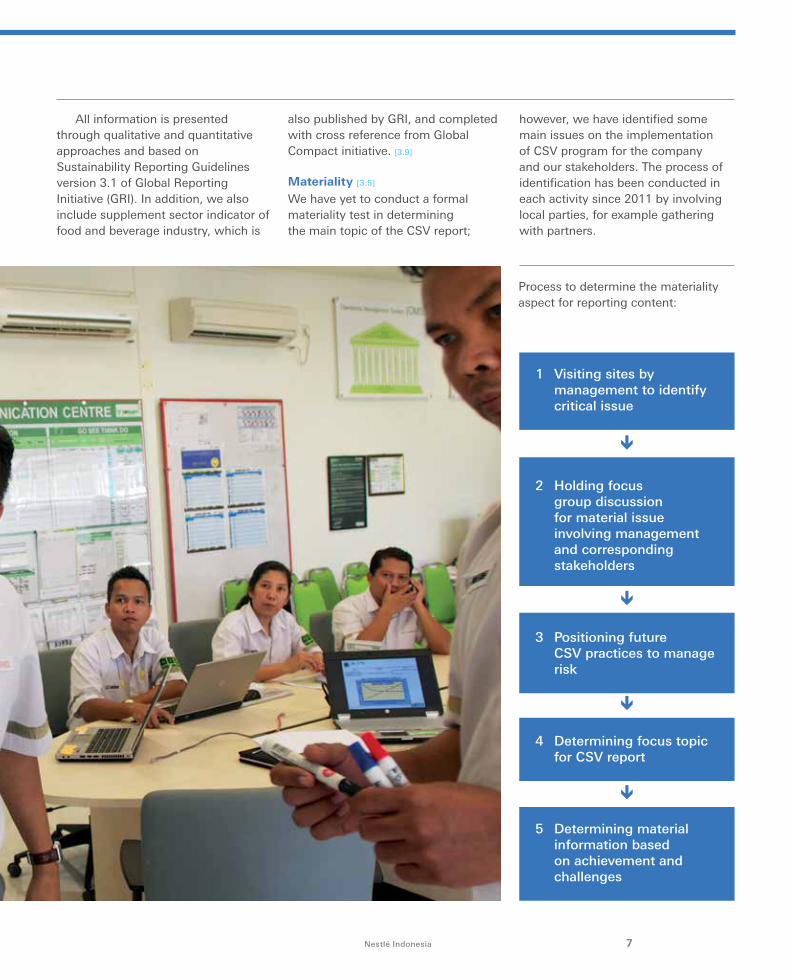
1 Visiting sites by management to identify critical issue
2 Holding focus group discussion for material issue involving management and corresponding stakeholders
3 Positioning future CSV practices to manage risk
4 Determining focus topic for CSV report
5 Determining material information based on achievement and challenges
ê
ê
ê
ê
All information is presented through qualitative and quantitative approaches and based on Sustainability Reporting Guidelines version 3.1 of Global Reporting Initiative (GRI). In addition, we also include supplement sector indicator of food and beverage industry, which is
also published by GRI, and completed with cross reference from Global Compact initiative. [3.9]
Materiality [3.5]
We have yet to conduct a formal materiality test in determining the main topic of the CSV report;
however, we have identified some main issues on the implementation of CSV program for the company and our stakeholders. The process of identification has been conducted in each activity since 2011 by involving local parties, for example gathering with partners.
Process to determine the materiality aspect for reporting content:
Our Report
8 Creating Shared Value
The implementation mechanism for focus group discussions involved workforce and local partners, business partners, communities and media, civil society and the internal team responsible for managing business risk management. From the discussion we concluded that ‘water’ has become the most pressing environmental issue representing a serious long-term risk for our business and society.
Water CrisisAlthough we have enough fresh water across the world, a growing, more prosperous and increasingly urban population, combined with the impact of climate change, is making water scarcity a serious reality in many parts of the world. By 2030, demand for water is forecasted to be 50% higher than today, and withdrawals could exceed natural renewal by over 60%, resulting in water scarcity for the population in developing countries like Indonesia (source: 2030 Water Resources Group).
With more than two thirds of all water being withdrawn by agriculture, food security is also at stake if we are not able to solve the water crisis. Increasing supply and improving efficiency of water usage will only take us so far. Meeting the rest of the challenge will require policy makers, civil society, agriculture and industry to work together to significantly improve the way we value, use and manage this precious resource.Main topics presented in this report are: ì
• Water sustainability. Our commitment to responsible water management is translated through three approaches: First, we continuously monitor the status of each of the water source we use for the company’s operation. Second, we carry out risk assessments and put measures in place to safeguard water resource against any potential risks. Third, we optimize the usage of water during production on a continuous basis. Furthermore, we provide access to water to the surrounding communities, including our raw materials suppliers, and carry out efforts in environmental preservation to ensure water sustainability.
• Rural development and sustainable agriculture. One of the focus of creating shared value activities is rural development through the empowerment of our agricultural raw material suppliers; increasing the productivity and quality of their produce through sustainable agricultural practice that preserve the environment. We have been providing technical assistance on sustainable agriculture practice and financial assistance, so that our agricultural raw materials suppliers are able to improve
their livelihood and increase economic activities in the rural areas. We at the same time get quality agricultural raw materials in line with responsible sourcing guideline for agricultural raw materials.
• Nutrition, Health and Wellness. Nutrition is fundamental to human life. All human achievement–social, economic and cultural–is directly influenced by access to food and water. Today, some parts of the society face serious malnutrition issues, while some others deal with the issues of over nutrition. These two nutrition issues caused burden to the society, government and the future generation. Therefore, on the nutrition focus of creating shared value activities, our approaches are to create awareness about good nutrition and healthy lifestyle, to produce nutritious food and beverages products to fulfill the society’s need for nutritious food and beverages products, and to ensure that our marketing behavior and advertisement are in compliance with the prevailing laws and regulations and the company’s policy on marketing and advertisement.
9Nestlé Indonesia
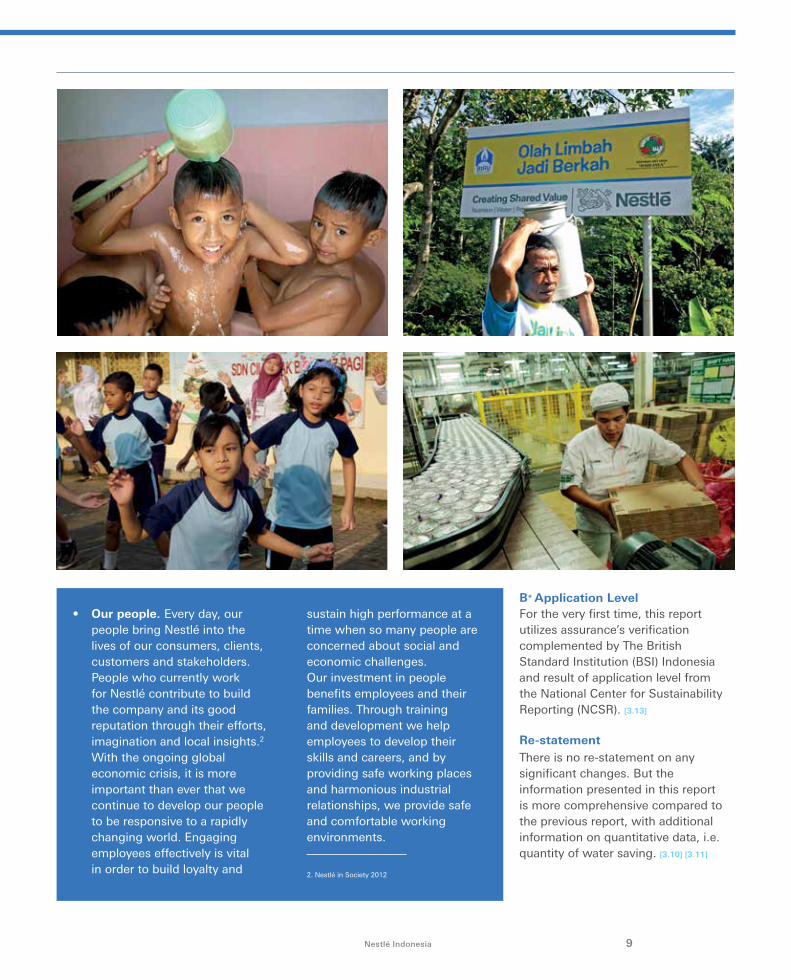
• Our people. Every day, our people bring Nestlé into the lives of our consumers, clients, customers and stakeholders. People who currently work for Nestlé contribute to build the company and its good reputation through their efforts, imagination and local insights.2
With the ongoing global economic crisis, it is more important than ever that we continue to develop our people to be responsive to a rapidly changing world. Engaging employees effectively is vital in order to build loyalty and
sustain high performance at a time when so many people are concerned about social and economic challenges.Our investment in people benefits employees and their families. Through training and development we help employees to develop their skills and careers, and by providing safe working places and harmonious industrial relationships, we provide safe and comfortable working environments.
B+ Application Level For the very first time, this report utilizes assurance’s verification complemented by The British Standard Institution (BSI) Indonesia and result of application level from the National Center for Sustainability Reporting (NCSR). [3.13]
Re-statementThere is no re-statement on any significant changes. But the information presented in this report is more comprehensive compared to the previous report, with additional information on quantitative data, i.e. quantity of water saving. [3.10] [3.11]
2. Nestlé in Society 2012
10 Creating Shared Value
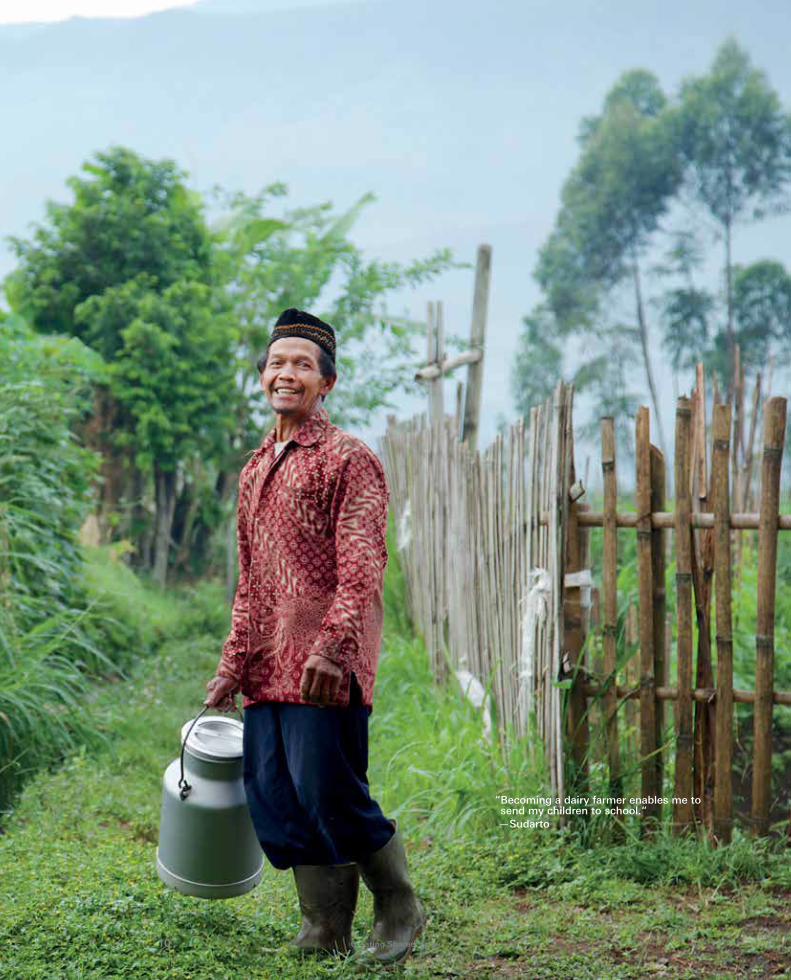
“ Becoming a dairy farmer enables me to send my children to school.“—Sudarto
11Nestlé Indonesia
CSV
Sustainability
Compliance
Nutrition, Water, Rural Development
Protect the Future
Laws, business principles, codes of conduct
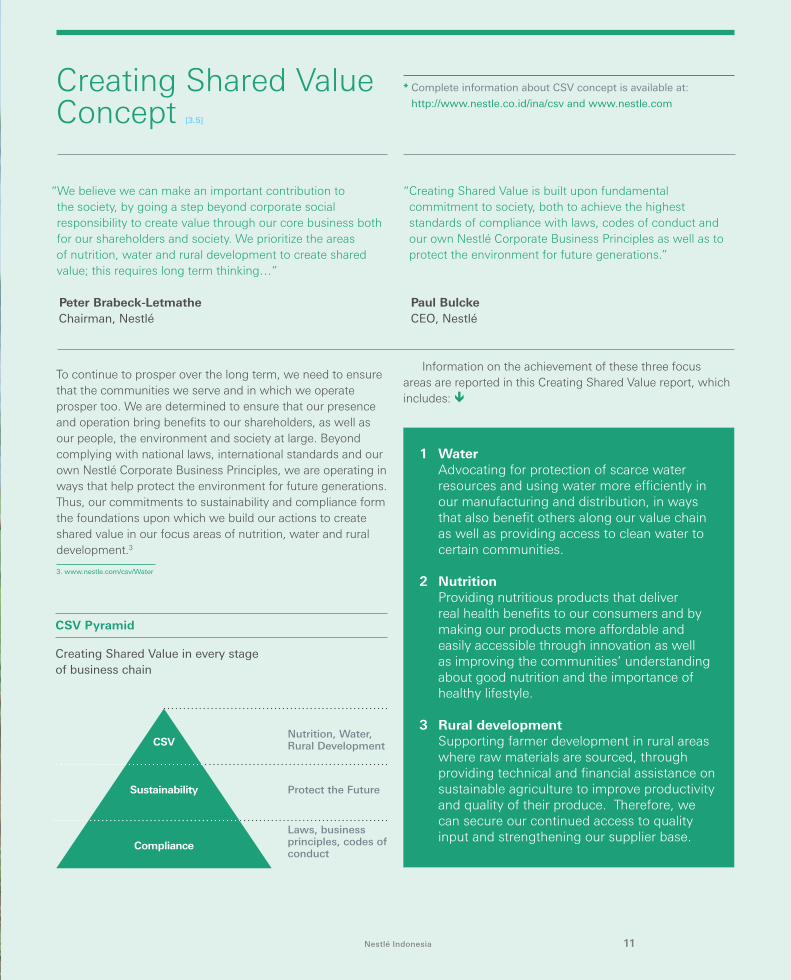
Creating Shared Value Concept [3.5]
To continue to prosper over the long term, we need to ensure that the communities we serve and in which we operate prosper too. We are determined to ensure that our presence and operation bring benefits to our shareholders, as well as our people, the environment and society at large. Beyond complying with national laws, international standards and our own Nestlé Corporate Business Principles, we are operating in ways that help protect the environment for future generations. Thus, our commitments to sustainability and compliance form the foundations upon which we build our actions to create shared value in our focus areas of nutrition, water and rural development.3
* Complete information about CSV concept is available at:
http://www.nestle.co.id/ina/csv and www.nestle.com
“We believe we can make an important contribution to the society, by going a step beyond corporate social responsibility to create value through our core business both for our shareholders and society. We prioritize the areas of nutrition, water and rural development to create shared value; this requires long term thinking…”
Peter Brabeck-LetmatheChairman, Nestlé
“ Creating Shared Value is built upon fundamental commitment to society, both to achieve the highest standards of compliance with laws, codes of conduct and our own Nestlé Corporate Business Principles as well as to protect the environment for future generations.”
Paul BulckeCEO, Nestlé
Creating Shared Value in every stage of business chain
CSV Pyramid
1 Water Advocating for protection of scarce water resources and using water more efficiently in our manufacturing and distribution, in ways that also benefit others along our value chain as well as providing access to clean water to certain communities.
2 NutritionProviding nutritious products that deliver real health benefits to our consumers and by making our products more affordable and easily accessible through innovation as well as improving the communities’ understanding about good nutrition and the importance of healthy lifestyle.
3 Rural developmentSupporting farmer development in rural areas where raw materials are sourced, through providing technical and financial assistance on sustainable agriculture to improve productivity and quality of their produce. Therefore, we can secure our continued access to quality input and strengthening our supplier base.
Information on the achievement of these three focus areas are reported in this Creating Shared Value report, which includes: ê
3. www.nestle.com/csv/Water
12 Creating Shared Value
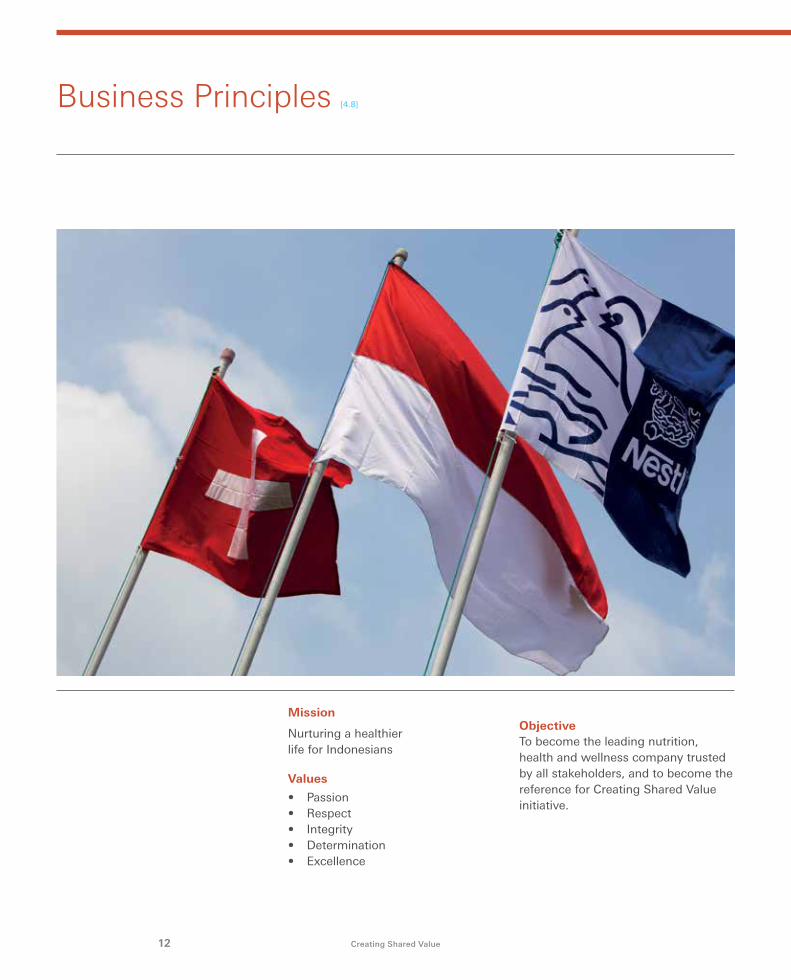
Mission
Nurturing a healthier life for Indonesians
Values
• Passion • Respect• Integrity• Determination• Excellence
ObjectiveTo become the leading nutrition, health and wellness company trusted by all stakeholders, and to become the reference for Creating Shared Value initiative.
Business Principles [4.8]
13Nestlé Indonesia
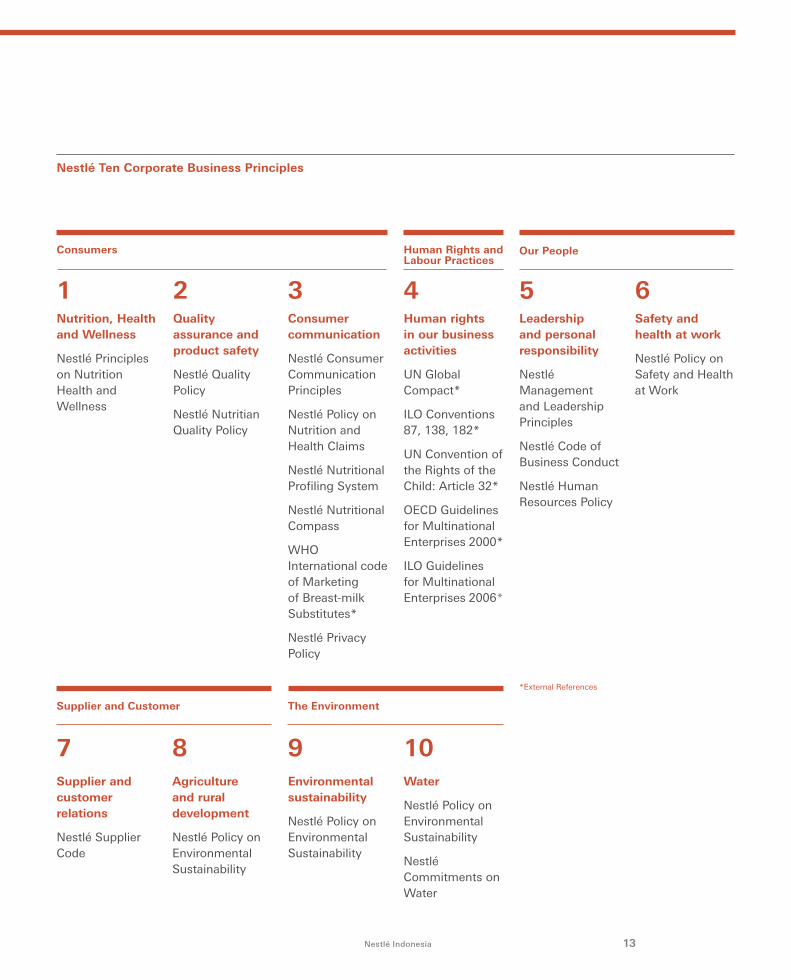
Nestlé Ten Corporate Business Principles
1Nutrition, Health and Wellness
Nestlé Principles on Nutrition Health and Wellness
9Environmental sustainability
Nestlé Policy on Environmental Sustainability
10Water
Nestlé Policy on Environmental Sustainability
Nestlé Commitments on Water
*External References
7Supplier and customer relations
Nestlé Supplier Code
8Agriculture and rural development
Nestlé Policy on Environmental Sustainability
4Human rights in our business activities
UN Global Compact*
ILO Conventions 87, 138, 182*
UN Convention of the Rights of the Child: Article 32*
OECD Guidelines for Multinational Enterprises 2000*
ILO Guidelines for Multinational Enterprises 2006*
5Leadership and personal responsibility
Nestlé Management and Leadership Principles
Nestlé Code of Business Conduct
Nestlé Human Resources Policy
6Safety and health at work
Nestlé Policy on Safety and Health at Work
2Quality assurance and product safety
Nestlé Quality Policy
Nestlé Nutritian Quality Policy
3Consumer communication
Nestlé Consumer Communication Principles
Nestlé Policy on Nutrition and Health Claims
Nestlé Nutritional Profiling System
Nestlé Nutritional Compass
WHO International code of Marketing of Breast-milk Substitutes*
Nestlé Privacy Policy
Human Rights and Labour Practices
Consumers Our People
Supplier and Customer The Environment
14 Creating Shared Value
Environmental issue has been a major concern, not only for environmental activists but also in business and the industry. Various discourses, often reported by the media, also raised question as to how committed are companies in taking concrete actions in preserving environmental sustainability. It becomes apparent that business which solely focuses on economical performance without taking actions on social and environmental sustainability will not be able to survive in the long run.
Nestlé, one of the multinational companies in Indonesia, is consistently creating sustainable value through the Creating Shared Value (CSV) concept. This concept provides a comprehensive approach to the economic, social and enviromental aspects. CSV concept has become a reference for many companies to create shared benefit for both the companies and the societies. Within the CSV context, environmental preservation is one of the crucial
aspects in creating shared benefit simply due to its support to the whole business chain which is inter-related.
This CSV report provides information on the environment, particulary in preserving the clean water supply. The W.A.T.E.R. commitments initiated by Nestlé, is also expected to be a reference for other companies. Access to clean water is part of the human rights, while water supply is very vital for food availability. This is in line with the Global Compact principles in human rights and environmental conservation aspects. IGCN, therefore, warmly welcomes Nestlé’s initiative in unveiling information to show Nestlé’s commitments.
Disclosure of information on water is needed and supported by urgent major interests to conserve the environment. The current reality has become the deciding factor to set how water has become one material issue, for instance:
Expert Opinion
Nestlé Indonesia became Indonesia Global Compact Network (IGCN)’s member since mid 2012. Since then, Nestlé have been actively participating in several IGCN initiatives including the “Save Water” campaign and have been opening opportunity for the public to understand more about their partnership with dairy farmers and the communities.
Y.W. JunardyIGCN President
15Nestlé Indonesia
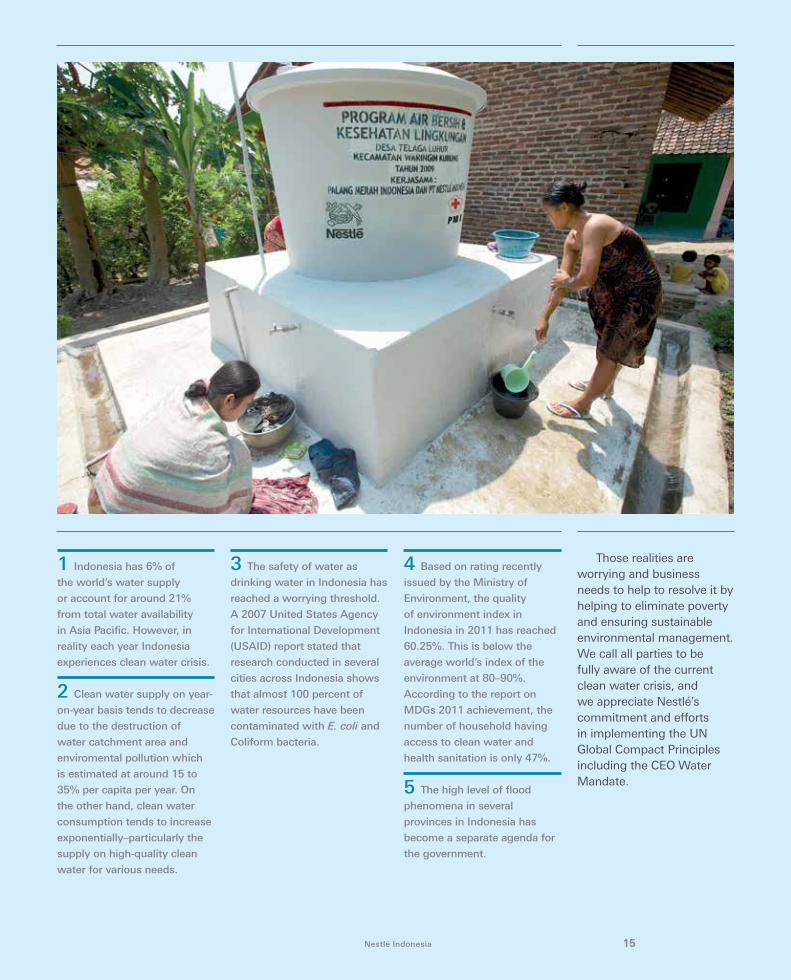
1 Indonesia has 6% of
the world’s water supply
or account for around 21%
from total water availability
in Asia Pacific. However, in
reality each year Indonesia
experiences clean water crisis.
2 Clean water supply on year-
on-year basis tends to decrease
due to the destruction of
water catchment area and
enviromental pollution which
is estimated at around 15 to
35% per capita per year. On
the other hand, clean water
consumption tends to increase
exponentially–particularly the
supply on high-quality clean
water for various needs.
3 The safety of water as
drinking water in Indonesia has
reached a worrying threshold.
A 2007 United States Agency
for International Development
(USAID) report stated that
research conducted in several
cities across Indonesia shows
that almost 100 percent of
water resources have been
contaminated with E. coli and
Coliform bacteria.
4 Based on rating recently
issued by the Ministry of
Environment, the quality
of environment index in
Indonesia in 2011 has reached
60.25%. This is below the
average world’s index of the
environment at 80–90%.
According to the report on
MDGs 2011 achievement, the
number of household having
access to clean water and
health sanitation is only 47%.
5 The high level of flood
phenomena in several
provinces in Indonesia has
become a separate agenda for
the government.
Those realities are worrying and business needs to help to resolve it by helping to eliminate poverty and ensuring sustainable environmental management. We call all parties to be fully aware of the current clean water crisis, and we appreciate Nestlé’s commitment and efforts in implementing the UN Global Compact Principles including the CEO Water Mandate.
Water
18 Creating Shared Value
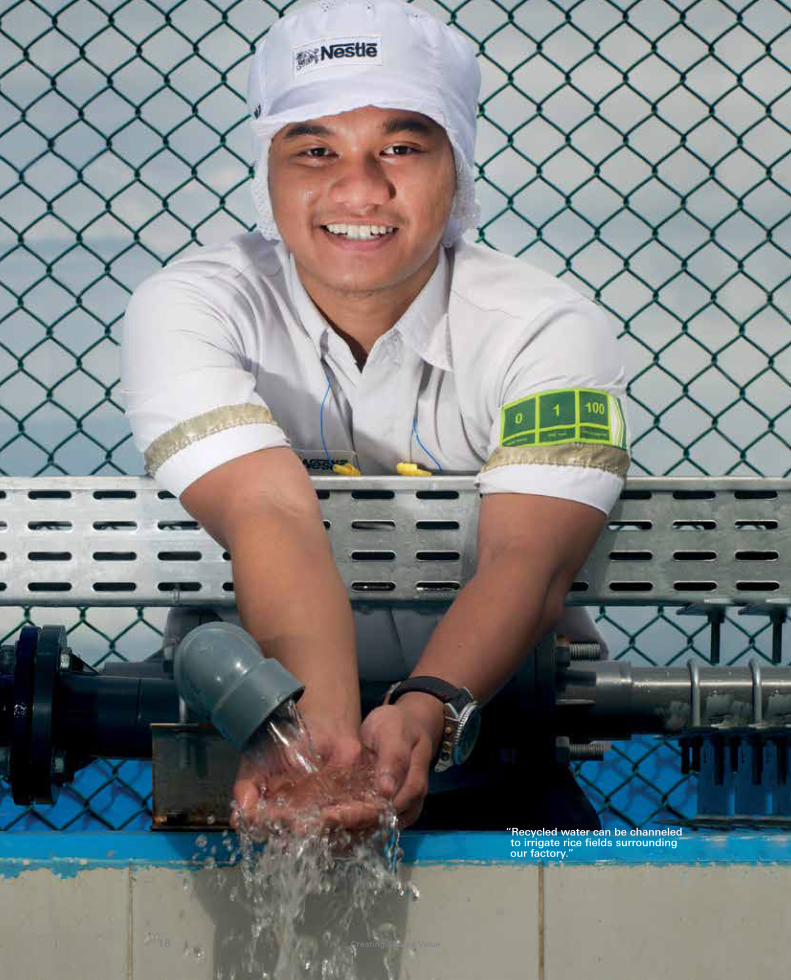
“Recycled water can be channeled to irrigate rice fields surrounding our factory.”
PT Nestlé Indonesia’s sustainability is dependent on environmental sustainability, including the sustainability of water. As a company that processes agricultural raw materials to become food and beverages products, the company’s business sustainability is much dependent on the sustained supply of agricultural raw materials, which required much water supply. Therefore, one of our concerns in environmental conservation is on collective efforts to protect the water supply in nature through conservation of water resources.
All activities conducted by Nestlé, are part of W.A.T.E.R. commitments that has been launched by Nestlé S.A., the holding company:
Water Management in Production Process [EN10]
Water in the production process is particularly required for steam
generation, cooling towers as well as cleaning. We continue to reduce water usage and to re-use recycling water through circulation systems.
To generate steam, water is boiled in a boiler. The resulting steam is then used in the heating process and condensed into water. This water is then returned into steam generator and reused to generate more steam. This way, we have been able to significantly reduce our water usage.
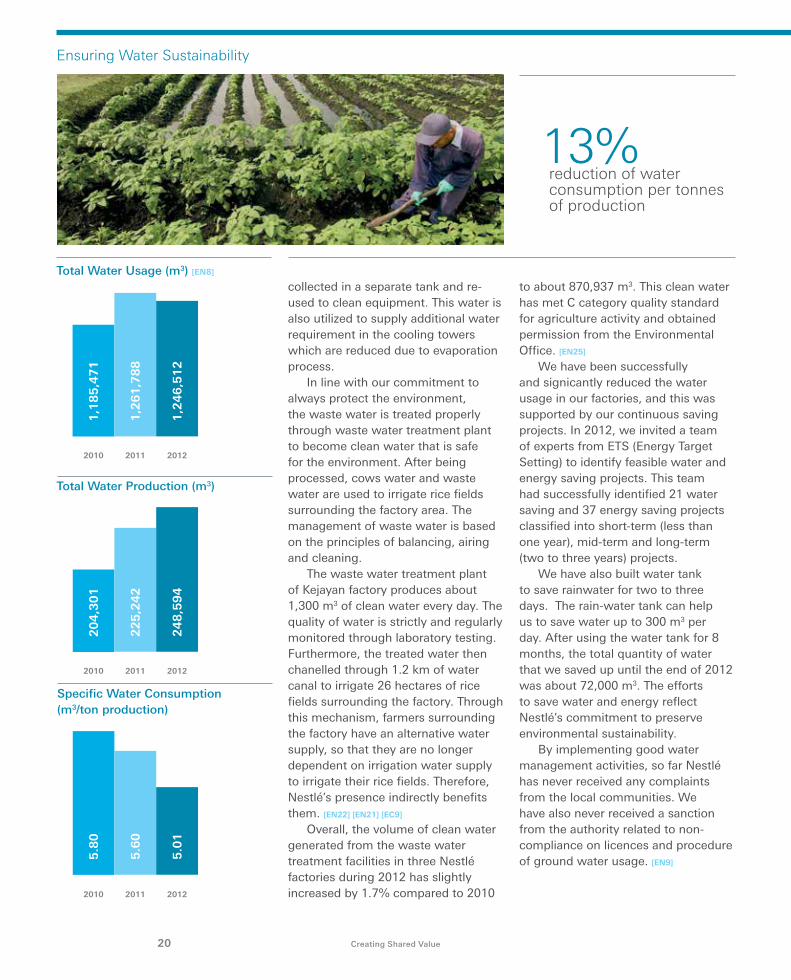
Water usage per tonnes production during 2012 has been significantly reduced around 13% compared to 2010. Particularly for Kejayan factory since 2000 the efficiency level of water usage has reached 47%.
We also re-utilize water from fresh milk evaporation process or cows water. To produce milk powder, fresh milk supplied by dairy farmers, are processed through evaporator to separate water from milk solids. After being condensated, cows water is
* More information is available
at: http://www.nestle.co.id/ina/
csv/airdanlingkunganhidup/
upayaupayaproduksi & http://www.nestle.
co.id/ina/csv/airdanlingkunganhidup/
menggunakansumberdayaalamdengan
bijak
Work to achieve water efficiency across our operationsLeading in water resource management and excelling in the direct reduction of the direct water use in all our facilities.
Advocate for effective water policies and stewardshipPromoting public policies that place value on water at every level.
Treat effectively the water we dischargeSetting strict targets for returning clean water to the environment.
Engage with suppliers, especially those in agricultureHelping to improve their water management with focus on impacts at Water-shed level.
Raise awareness of water access and conservationEngaging employees, communities and consumers in the water imperative.
W.A.T.E.R. commitments
19Nestlé Indonesia
Ensuring Water Sustainability
The world is facing a water crisis–linked to a growing global population, increasing prosperity, urbanization and the impacts of climate change. All stakeholders must work together to solve this water crisis, otherwise food security is at stake. With two thirds of all fresh water used in agriculture and demand for water set to rise by 50% by 2030, water scarcity would be a likely scenario for developing countries like Indonesia.
Total Water Usage (m3) [EN8]
Ensuring Water Sustainability
collected in a separate tank and re-used to clean equipment. This water is also utilized to supply additional water requirement in the cooling towers which are reduced due to evaporation process.
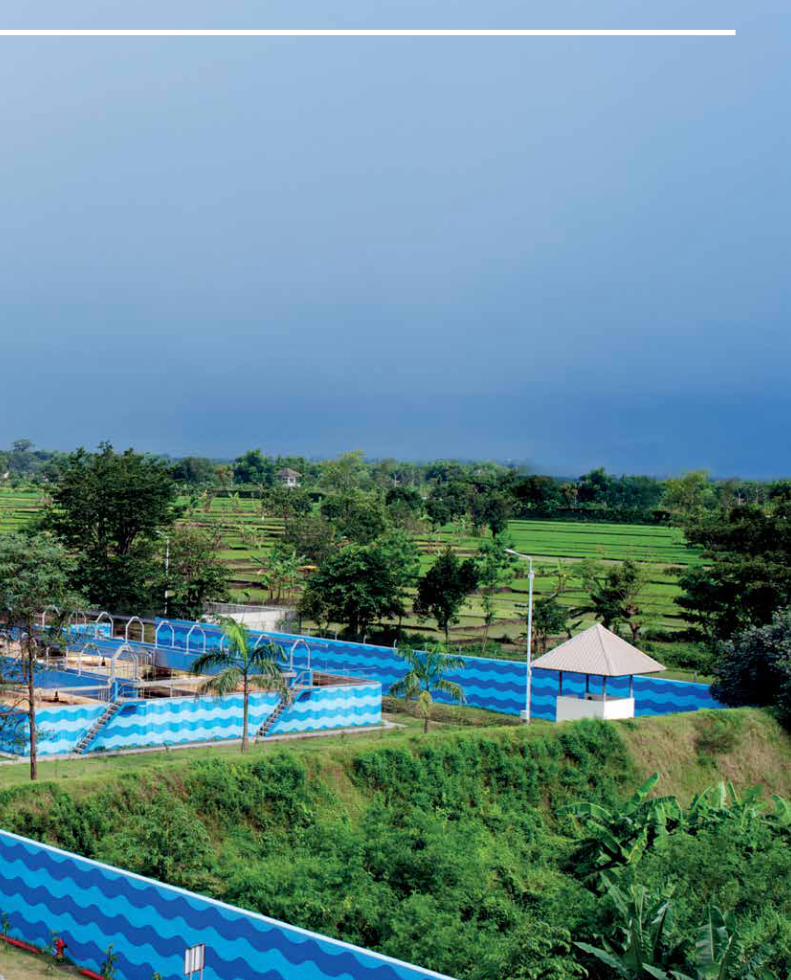
In line with our commitment to always protect the environment, the waste water is treated properly through waste water treatment plant to become clean water that is safe for the environment. After being processed, cows water and waste water are used to irrigate rice fields surrounding the factory area. The management of waste water is based on the principles of balancing, airing and cleaning.
The waste water treatment plant of Kejayan factory produces about 1,300 m3 of clean water every day. The quality of water is strictly and regularly monitored through laboratory testing. Furthermore, the treated water then chanelled through 1.2 km of water canal to irrigate 26 hectares of rice fields surrounding the factory. Through this mechanism, farmers surrounding the factory have an alternative water supply, so that they are no longer dependent on irrigation water supply to irrigate their rice fields. Therefore, Nestlé’s presence indirectly benefits them. [EN22] [EN21] [EC9]
Overall, the volume of clean water generated from the waste water treatment facilities in three Nestlé factories during 2012 has slightly increased by 1.7% compared to 2010
to about 870,937 m3. This clean water has met C category quality standard for agriculture activity and obtained permission from the Environmental Office. [EN25]
We have been successfully and signicantly reduced the water usage in our factories, and this was supported by our continuous saving projects. In 2012, we invited a team of experts from ETS (Energy Target Setting) to identify feasible water and energy saving projects. This team had successfully identified 21 water saving and 37 energy saving projects classified into short-term (less than one year), mid-term and long-term (two to three years) projects.
We have also built water tank to save rainwater for two to three days. The rain-water tank can help us to save water up to 300 m3 per day. After using the water tank for 8 months, the total quantity of water that we saved up until the end of 2012 was about 72,000 m3. The efforts to save water and energy reflect Nestlé’s commitment to preserve environmental sustainability.
By implementing good water management activities, so far Nestlé has never received any complaints from the local communities. We have also never received a sanction from the authority related to non-compliance on licences and procedure of ground water usage. [EN9]
20 Creating Shared Value
13% reduction of water consumption per tonnes of production
Specific Water Consumption (m3/ton production)
Total Water Production (m3)
2010 2011 2012
1,1
85
,47
1
1,2
61
,78
8
1,2
46
,51
2
2010 2011 2012
5.8
0
5.6
0
5.0
1
2010 2011 2012
20
4,3
01
22
5,2
42
24
8,5
94
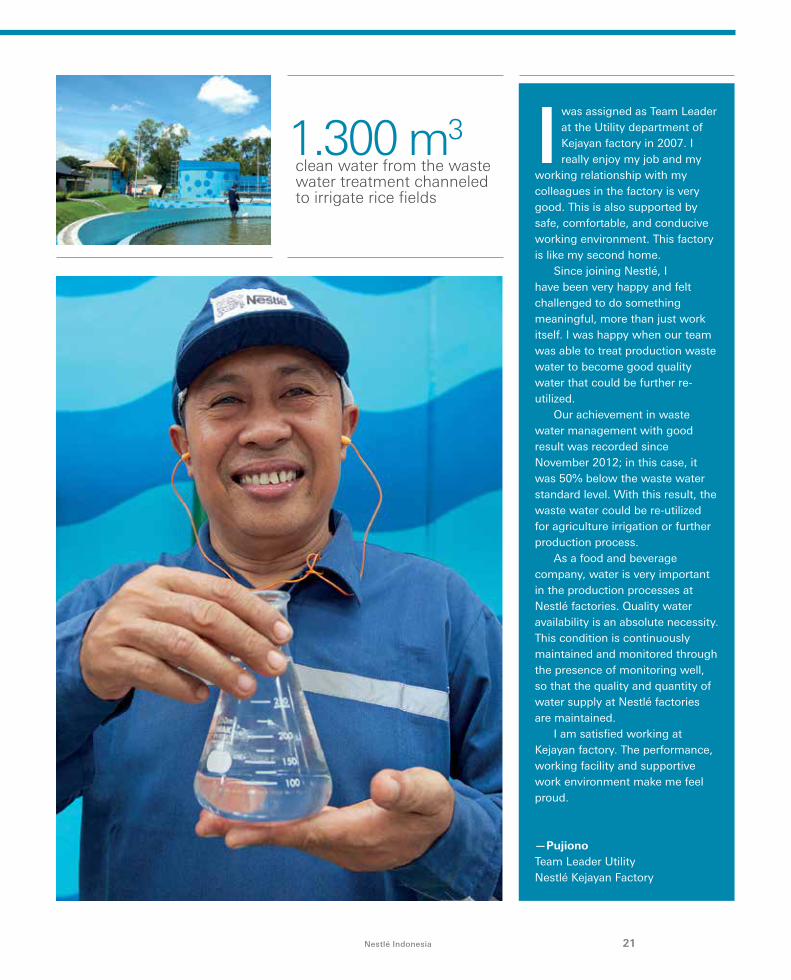
Iwas assigned as Team Leader at the Utility department of Kejayan factory in 2007. I really enjoy my job and my
working relationship with my colleagues in the factory is very good. This is also supported by safe, comfortable, and conducive working environment. This factory is like my second home.
Since joining Nestlé, I have been very happy and felt challenged to do something meaningful, more than just work itself. I was happy when our team was able to treat production waste water to become good quality water that could be further re-utilized.
Our achievement in waste water management with good result was recorded since November 2012; in this case, it was 50% below the waste water standard level. With this result, the waste water could be re-utilized for agriculture irrigation or further production process.
As a food and beverage company, water is very important in the production processes at Nestlé factories. Quality water availability is an absolute necessity. This condition is continuously maintained and monitored through the presence of monitoring well, so that the quality and quantity of water supply at Nestlé factories are maintained.
I am satisfied working at Kejayan factory. The performance, working facility and supportive work environment make me feel proud.
—Pujiono Team Leader UtilityNestlé Kejayan Factory
1.300 m3clean water from the waste water treatment channeled to irrigate rice fields
21Nestlé Indonesia
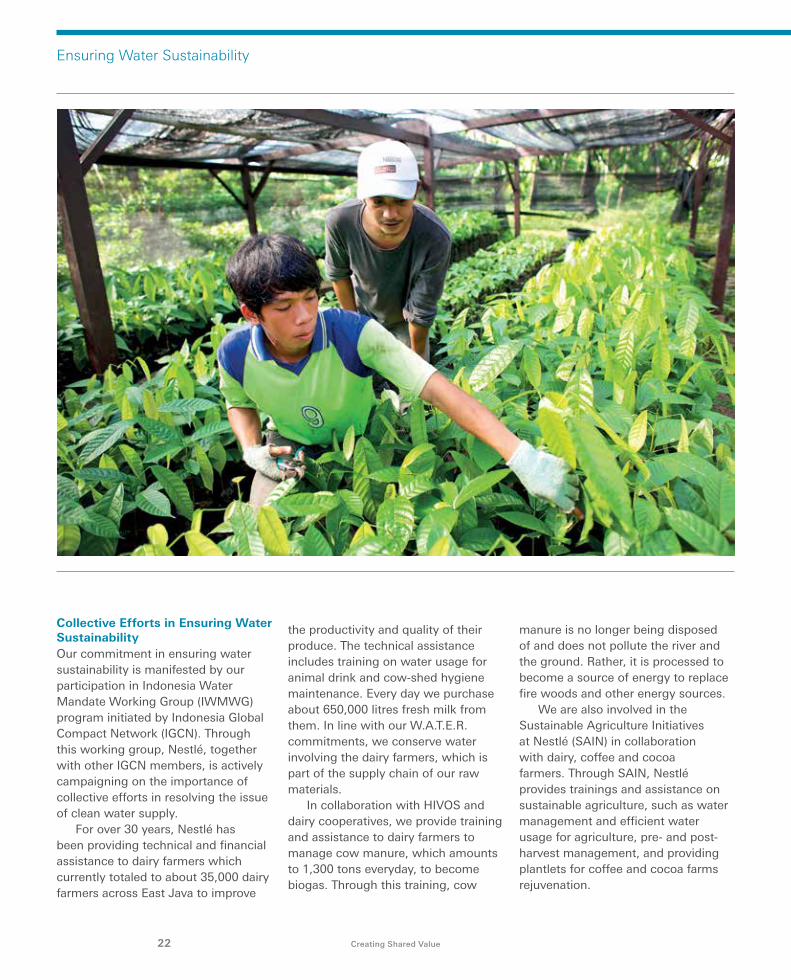
Collective Efforts in Ensuring Water Sustainability Our commitment in ensuring water sustainability is manifested by our participation in Indonesia Water Mandate Working Group (IWMWG) program initiated by Indonesia Global Compact Network (IGCN). Through this working group, Nestlé, together with other IGCN members, is actively campaigning on the importance of collective efforts in resolving the issue of clean water supply.
For over 30 years, Nestlé has been providing technical and financial assistance to dairy farmers which currently totaled to about 35,000 dairy farmers across East Java to improve
the productivity and quality of their produce. The technical assistance includes training on water usage for animal drink and cow-shed hygiene maintenance. Every day we purchase about 650,000 litres fresh milk from them. In line with our W.A.T.E.R. commitments, we conserve water involving the dairy farmers, which is part of the supply chain of our raw materials.
In collaboration with HIVOS and dairy cooperatives, we provide training and assistance to dairy farmers to manage cow manure, which amounts to 1,300 tons everyday, to become biogas. Through this training, cow
manure is no longer being disposed of and does not pollute the river and the ground. Rather, it is processed to become a source of energy to replace fire woods and other energy sources.
We are also involved in the Sustainable Agriculture Initiatives at Nestlé (SAIN) in collaboration with dairy, coffee and cocoa farmers. Through SAIN, Nestlé provides trainings and assistance on sustainable agriculture, such as water management and efficient water usage for agriculture, pre- and post-harvest management, and providing plantlets for coffee and cocoa farms rejuvenation.
Ensuring Water Sustainability
22 Creating Shared Value
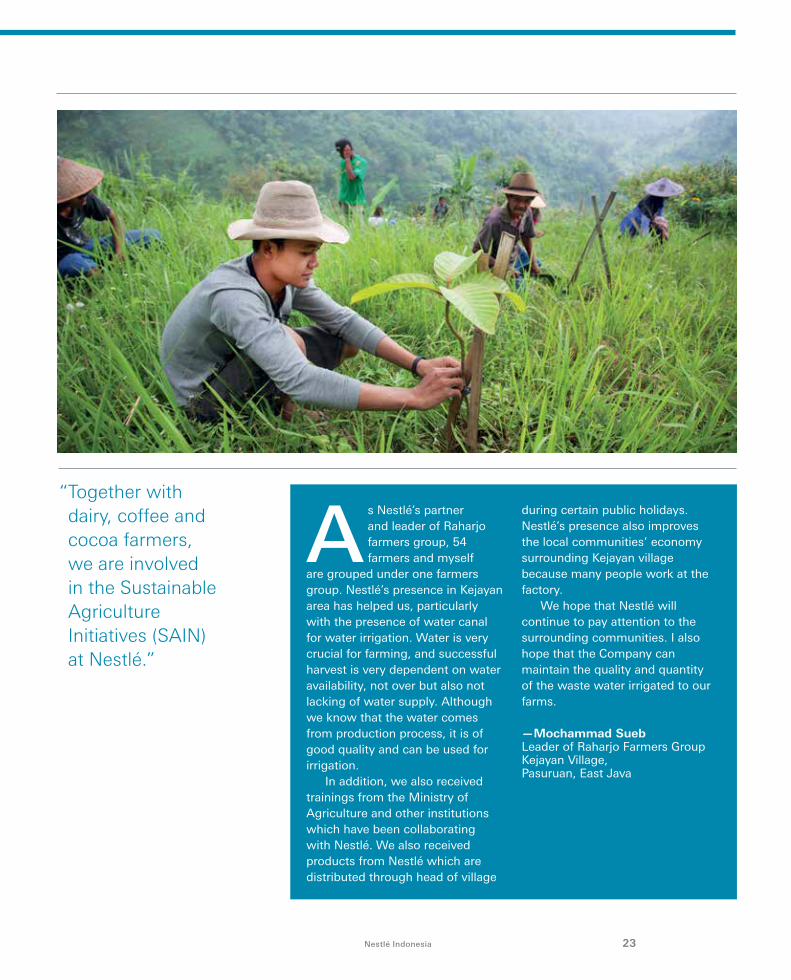
As Nestlé’s partner and leader of Raharjo farmers group, 54 farmers and myself
are grouped under one farmers group. Nestlé’s presence in Kejayan area has helped us, particularly with the presence of water canal for water irrigation. Water is very crucial for farming, and successful harvest is very dependent on water availability, not over but also not lacking of water supply. Although we know that the water comes from production process, it is of good quality and can be used for irrigation.
In addition, we also received trainings from the Ministry of Agriculture and other institutions which have been collaborating with Nestlé. We also received products from Nestlé which are distributed through head of village
during certain public holidays. Nestlé’s presence also improves the local communities’ economy surrounding Kejayan village because many people work at the factory.
We hope that Nestlé will continue to pay attention to the surrounding communities. I also hope that the Company can maintain the quality and quantity of the waste water irrigated to our farms.
—Mochammad SuebLeader of Raharjo Farmers Group Kejayan Village, Pasuruan, East Java
23Nestlé Indonesia
“ Together with dairy, coffee and cocoa farmers, we are involved in the Sustainable Agriculture Initiatives (SAIN) at Nestlé.”
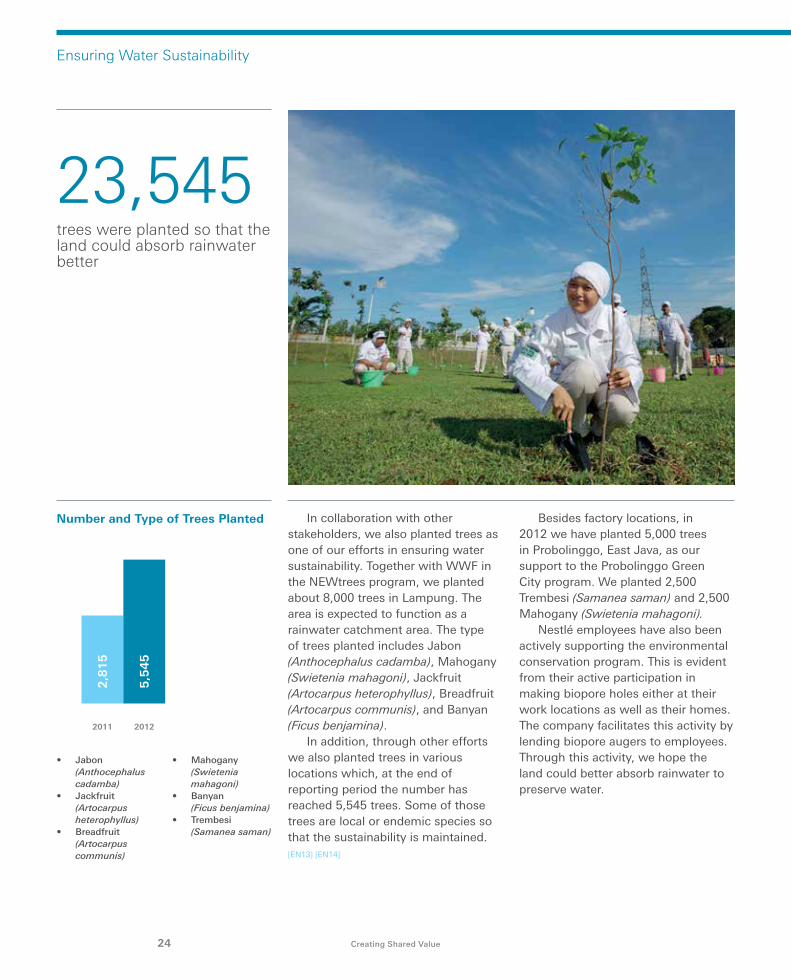
Number and Type of Trees Planted In collaboration with other stakeholders, we also planted trees as one of our efforts in ensuring water sustainability. Together with WWF in the NEWtrees program, we planted about 8,000 trees in Lampung. The area is expected to function as a rainwater catchment area. The type of trees planted includes Jabon (Anthocephalus cadamba), Mahogany (Swietenia mahagoni), Jackfruit (Artocarpus heterophyllus), Breadfruit (Artocarpus communis), and Banyan (Ficus benjamina).
In addition, through other efforts we also planted trees in various locations which, at the end of reporting period the number has reached 5,545 trees. Some of those trees are local or endemic species so that the sustainability is maintained. [EN13] [EN14]
Besides factory locations, in 2012 we have planted 5,000 trees in Probolinggo, East Java, as our support to the Probolinggo Green City program. We planted 2,500 Trembesi (Samanea saman) and 2,500 Mahogany (Swietenia mahagoni).
Nestlé employees have also been actively supporting the environmental conservation program. This is evident from their active participation in making biopore holes either at their work locations as well as their homes. The company facilitates this activity by lending biopore augers to employees. Through this activity, we hope the land could better absorb rainwater to preserve water.
Ensuring Water Sustainability
24 Creating Shared Value
• Jabon (Anthocephalus cadamba)
• Jackfruit (Artocarpus heterophyllus)
• Breadfruit (Artocarpus communis)
• Mahogany (Swietenia mahagoni)
• Banyan (Ficus benjamina)
• Trembesi (Samanea saman)
2011 2012
2,8
15
5,5
45
23,545trees were planted so that the land could absorb rainwater better
25Nestlé Indonesia
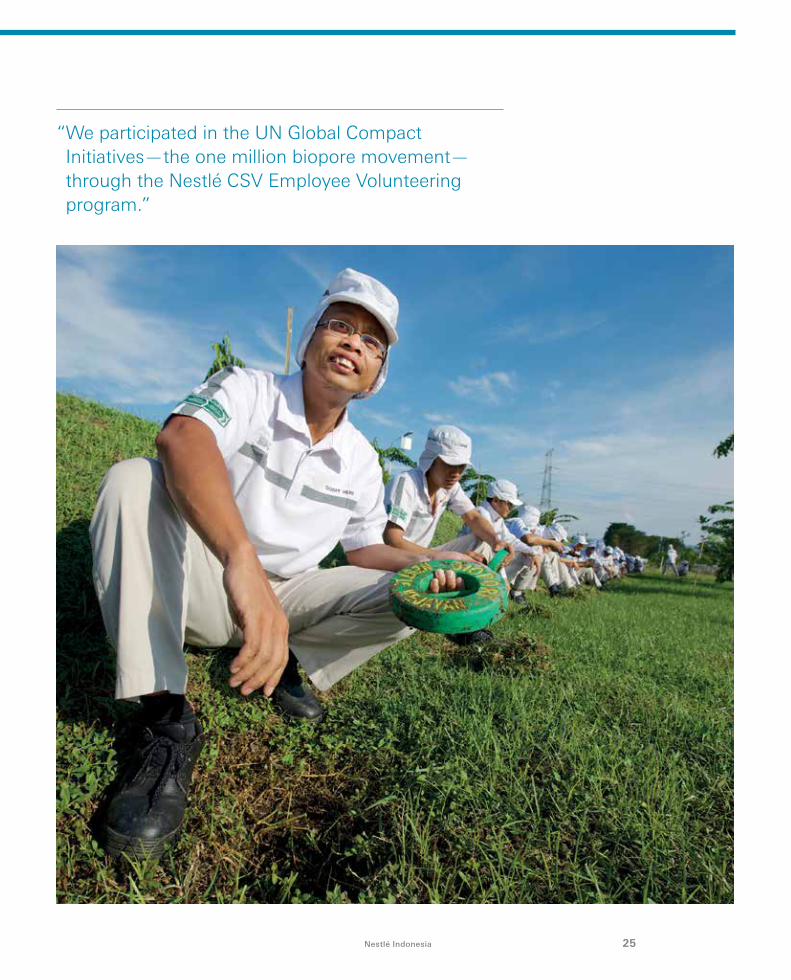
“ We participated in the UN Global Compact Initiatives—the one million biopore movement—through the Nestlé CSV Employee Volunteering program.”
Environmental Sustainability
28 Creating Shared Value
Nestlé’s business is dependent on increasingly constrained natural resources. Therefore, we have to help to protect the environment for current and future generations by improving environmental efficiency in our operations and involving our partners and stakeholders to optimize the environmental performance of our company and products along the value chain.
The Nestlé Policy on Environmental Sustainability covers our whole value chain, from farm to consumers. As part of our Nestlé Environmental Management System, we continuously make efforts to reduce our use of water, non-renewable energy and other natural resources to reduce our greenhouse gas emissions, to eliminate waste and to improve our enviromental performance.
Packaging Waste Management In line with the company’s policy and in adherence to Law No. 18 of 2008 on waste management and Government Regulation No. 81 of 2012 on household waste management, Nestlé has started
to minimize the impact of product packaging waste. In partnership with several consumer goods companies, we have established a long term collaboration to launch a pilot project on packaging waste management in Pejaten, Pasar Minggu, South Jakarta. This pilot project would be then replicated in several other locations across the Greater Jakarta area and other cities. [4.11] [EN27]
Nestlé uses packaging materials which is 100% of recycled paper and 80% of recycled material for shipping case. All suppliers of packaging materials have to attain Certificate of Analysis (CoA) and Certificate of Compliance (CoC). [EN2] [EN27]
Emission Control
Nestlé continuously makes efforts to reduce greenhouse gas emission of production processes. Since 2008, we have been using natural gas as energy source to operate steam turbine and co-generation plant, replacing Heavy Fuel Oil (HFO) and Light Fuel Oil (LFO) usage. This has enabled us to reduce by average 7,016 tonnes of CO2 equivalent emission in 2011. However, since mid 2011 we experienced problem with natural gas supply, so that we have to meet our
energy requirement with electricity from Perusahaan Listrik Negara (PLN-State Owned Electricity company). As a result, our electricity requirement increased by 18% from 2011 to 2012. [EN6] [EN18]
In 2012, CO2 emission was reduced as we had managed to reduce the energy consumption per tonnes product as a result of efficiency efforts and the renewable energy development. Biomass, such as coffee spent ground and palm kernel shell utilization as substitute of fossil fuel, has reduced CO2 emission by 17% in 2012. Overall, emission per tonnes production was reduced by 6.2%.
Nestlé also makes efforts to control emission of NO2, SO2 and other ozone-depleting substances. We have taken several actions, among others, in utilizing amonia for environmental-friendly cooling system, utilizing dry powder and CO2 as well as avoiding halons usage for light fire extinguisher equipment. All emission is monitored and measured to ensure that they are always below the treshold stipulated by the government. [EN29] [EN20]
Environmental Sustainability

29Nestlé Indonesia
CO2 Sources 2010 2011 2012
Total direct and indirect CO2
emissions (incl. non-biomass +
refrigerants)
95,244 108,299 111,567
Total Production (tonnes) 204,301 225,242 248,594
Tonnes CO2/tonnes product 0.47 0.48 0.46
Direct and Indirect Measurement Result of Greenhouse Gas Emission (tonnes CO2eq per tonnes of product ) [EN16] [EN17]4.1%
reduction of GHG emission per tonnes of production
Measurement Result of SO2, NO2 Emission and Other Substances [EN20]
Parameter Standard 2010 2011 2012
NO2 1,000 540.8 488.0 479.8
SO2 800 51.7 46.6 51.5
Particulate 350 15.7 20.9 28.2
The Nescafé Plan program in Lampung that ensures environmental sustainability
Environmental Sustainability
30 Creating Shared Value
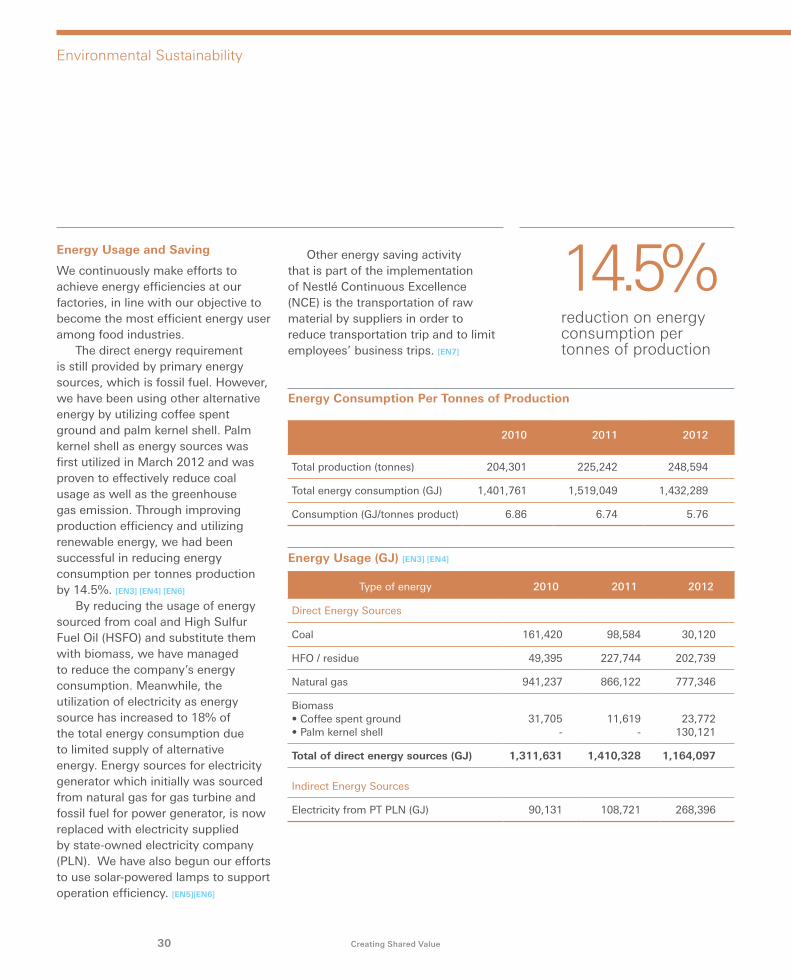
Energy Usage and Saving
We continuously make efforts to achieve energy efficiencies at our factories, in line with our objective to become the most efficient energy user among food industries.
The direct energy requirement is still provided by primary energy sources, which is fossil fuel. However, we have been using other alternative energy by utilizing coffee spent ground and palm kernel shell. Palm kernel shell as energy sources was first utilized in March 2012 and was proven to effectively reduce coal usage as well as the greenhouse gas emission. Through improving production efficiency and utilizing renewable energy, we had been successful in reducing energy consumption per tonnes production by 14.5%. [EN3] [EN4] [EN6]
By reducing the usage of energy sourced from coal and High Sulfur Fuel Oil (HSFO) and substitute them with biomass, we have managed to reduce the company’s energy consumption. Meanwhile, the utilization of electricity as energy source has increased to 18% of the total energy consumption due to limited supply of alternative energy. Energy sources for electricity generator which initially was sourced from natural gas for gas turbine and fossil fuel for power generator, is now replaced with electricity supplied by state-owned electricity company (PLN). We have also begun our efforts to use solar-powered lamps to support operation efficiency. [EN5][EN6]
Energy Usage (GJ) [EN3] [EN4]
Type of energy 2010 2011 2012
Direct Energy Sources
Coal 161,420 98,584 30,120
HFO / residue 49,395 227,744 202,739
Natural gas 941,237 866,122 777,346
Biomass• Coffee spent ground• Palm kernel shell
31,705-
11,619-
23,772130,121
Total of direct energy sources (GJ) 1,311,631 1,410,328 1,164,097
Indirect Energy Sources
Electricity from PT PLN (GJ) 90,131 108,721 268,396
14.5% reduction on energy consumption per tonnes of production
Energy Consumption Per Tonnes of Production
2010 2011 2012
Total production (tonnes) 204,301 225,242 248,594
Total energy consumption (GJ) 1,401,761 1,519,049 1,432,289
Consumption (GJ/tonnes product) 6.86 6.74 5.76
Other energy saving activity that is part of the implementation of Nestlé Continuous Excellence (NCE) is the transportation of raw material by suppliers in order to reduce transportation trip and to limit employees’ business trips. [EN7]
31Nestlé Indonesia
Environmental Sustainability
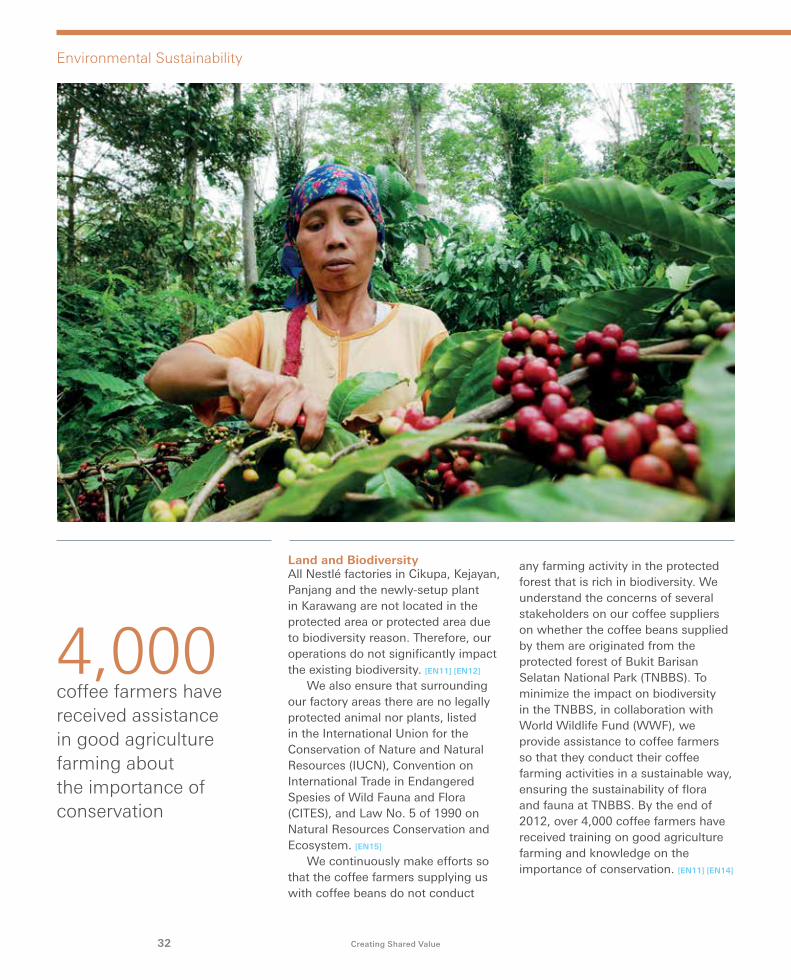
32 Creating Shared Value
Land and Biodiversity All Nestlé factories in Cikupa, Kejayan, Panjang and the newly-setup plant in Karawang are not located in the protected area or protected area due to biodiversity reason. Therefore, our operations do not significantly impact the existing biodiversity. [EN11] [EN12]
We also ensure that surrounding our factory areas there are no legally protected animal nor plants, listed in the International Union for the Conservation of Nature and Natural Resources (IUCN), Convention on International Trade in Endangered Spesies of Wild Fauna and Flora (CITES), and Law No. 5 of 1990 on Natural Resources Conservation and Ecosystem. [EN15]
We continuously make efforts so that the coffee farmers supplying us with coffee beans do not conduct
any farming activity in the protected forest that is rich in biodiversity. We understand the concerns of several stakeholders on our coffee suppliers on whether the coffee beans supplied by them are originated from the protected forest of Bukit Barisan Selatan National Park (TNBBS). To minimize the impact on biodiversity in the TNBBS, in collaboration with World Wildlife Fund (WWF), we provide assistance to coffee farmers so that they conduct their coffee farming activities in a sustainable way, ensuring the sustainability of flora and fauna at TNBBS. By the end of 2012, over 4,000 coffee farmers have received training on good agriculture farming and knowledge on the importance of conservation. [EN11] [EN14]
4,000 coffee farmers have received assistance in good agriculture farming about the importance of conservation
33Nestlé Indonesia
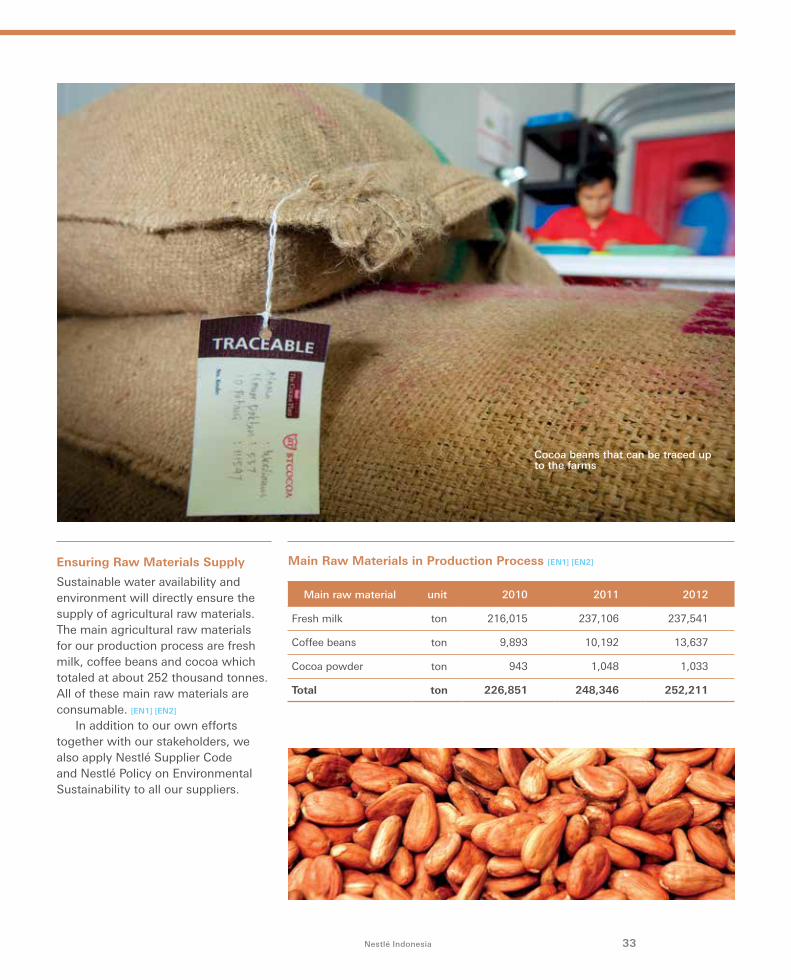
Main raw material unit 2010 2011 2012
Fresh milk ton 216,015 237,106 237,541
Coffee beans ton 9,893 10,192 13,637
Cocoa powder ton 943 1,048 1,033
Total ton 226,851 248,346 252,211
Main Raw Materials in Production Process [EN1] [EN2] Ensuring Raw Materials Supply
Sustainable water availability and environment will directly ensure the supply of agricultural raw materials. The main agricultural raw materials for our production process are fresh milk, coffee beans and cocoa which totaled at about 252 thousand tonnes. All of these main raw materials are consumable. [EN1] [EN2]
In addition to our own efforts together with our stakeholders, we also apply Nestlé Supplier Code and Nestlé Policy on Environmental Sustainability to all our suppliers.
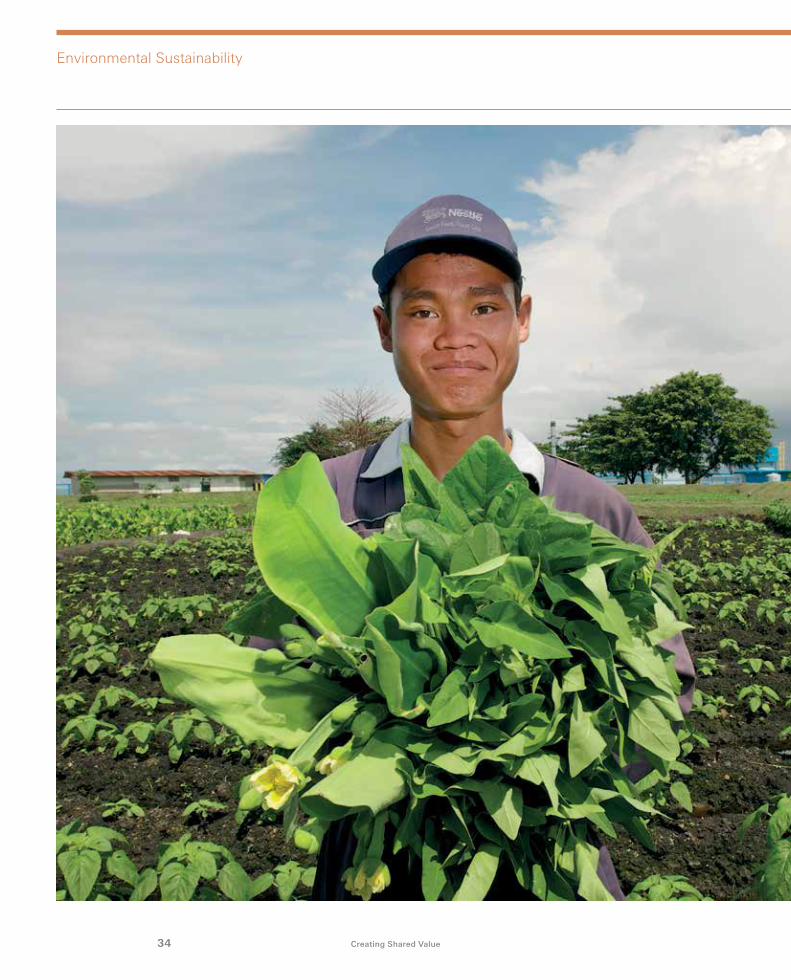
Cocoa beans that can be traced up to the farms
34 Creating Shared Value
Environmental Sustainability
35Nestlé Indonesia
Waste Management
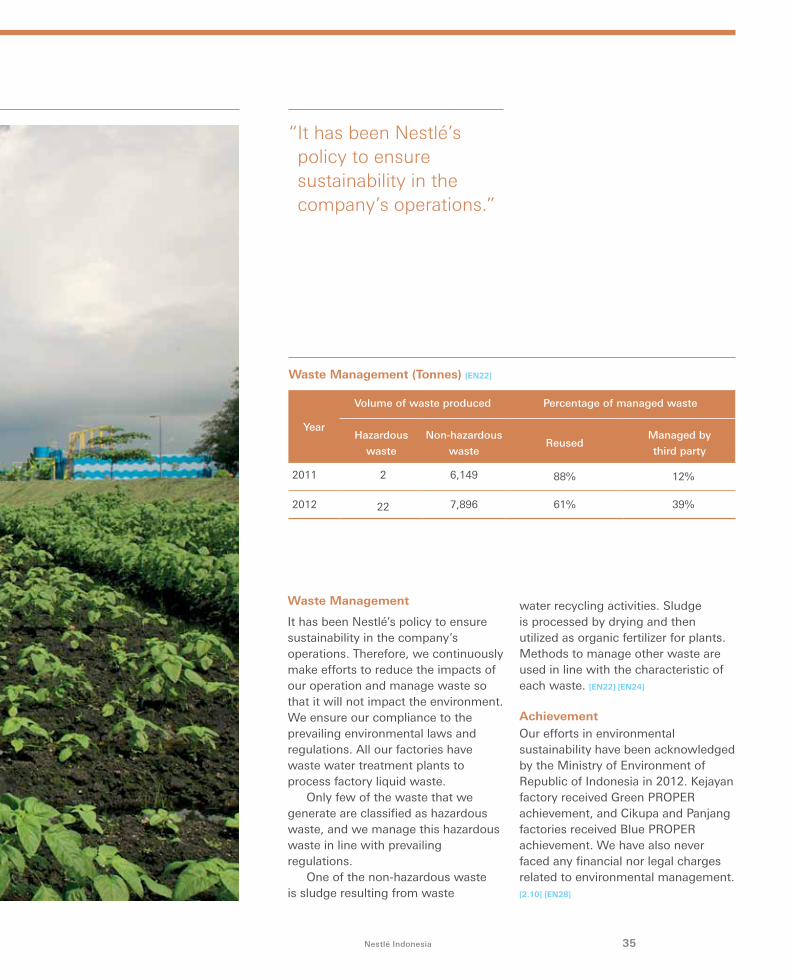
It has been Nestlé’s policy to ensure sustainability in the company’s operations. Therefore, we continuously make efforts to reduce the impacts of our operation and manage waste so that it will not impact the environment. We ensure our compliance to the prevailing environmental laws and regulations. All our factories have waste water treatment plants to process factory liquid waste.
Only few of the waste that we generate are classified as hazardous waste, and we manage this hazardous waste in line with prevailing regulations.
One of the non-hazardous waste is sludge resulting from waste
water recycling activities. Sludge is processed by drying and then utilized as organic fertilizer for plants. Methods to manage other waste are used in line with the characteristic of each waste. [EN22] [EN24]
Achievement Our efforts in environmental sustainability have been acknowledged by the Ministry of Environment of Republic of Indonesia in 2012. Kejayan factory received Green PROPER achievement, and Cikupa and Panjang factories received Blue PROPER achievement. We have also never faced any financial nor legal charges related to environmental management. [2.10] [EN28]
Year
Volume of waste produced Percentage of managed waste
Hazardous
waste
Non-hazardous
wasteReused
Managed by
third party
2011 2 6,149 88% 12%
2012 22 7,896 61% 39%
Waste Management (Tonnes) [EN22]
“ It has been Nestlé’s policy to ensure sustainability in the company’s operations.”
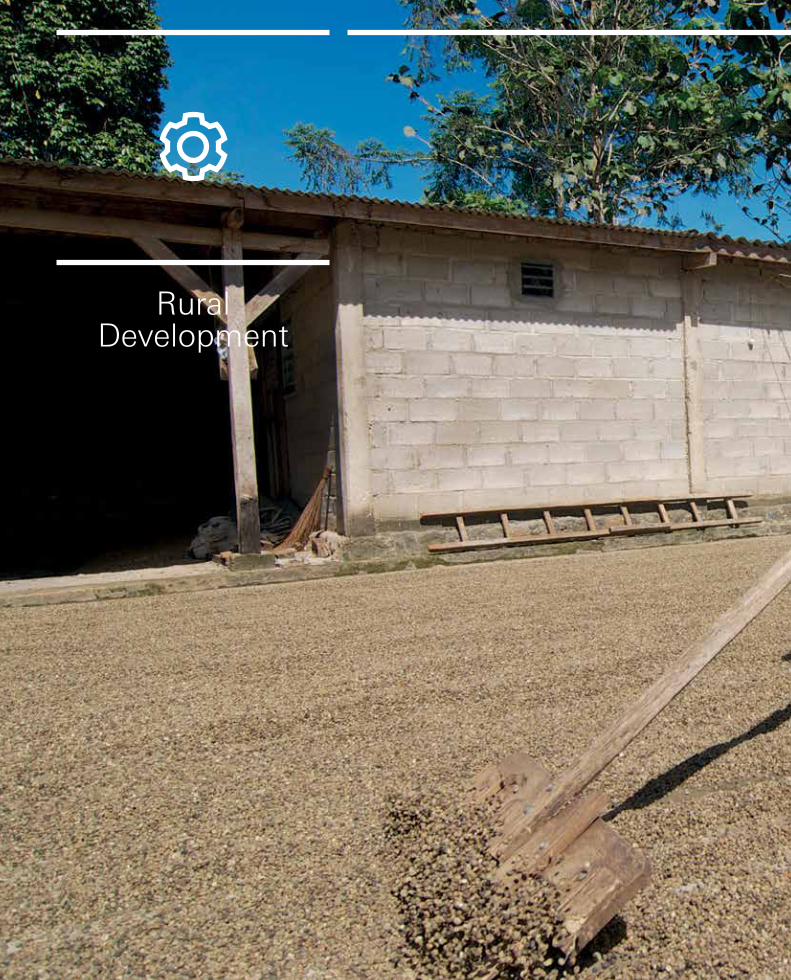
Rural Development
38 Creating Shared Value
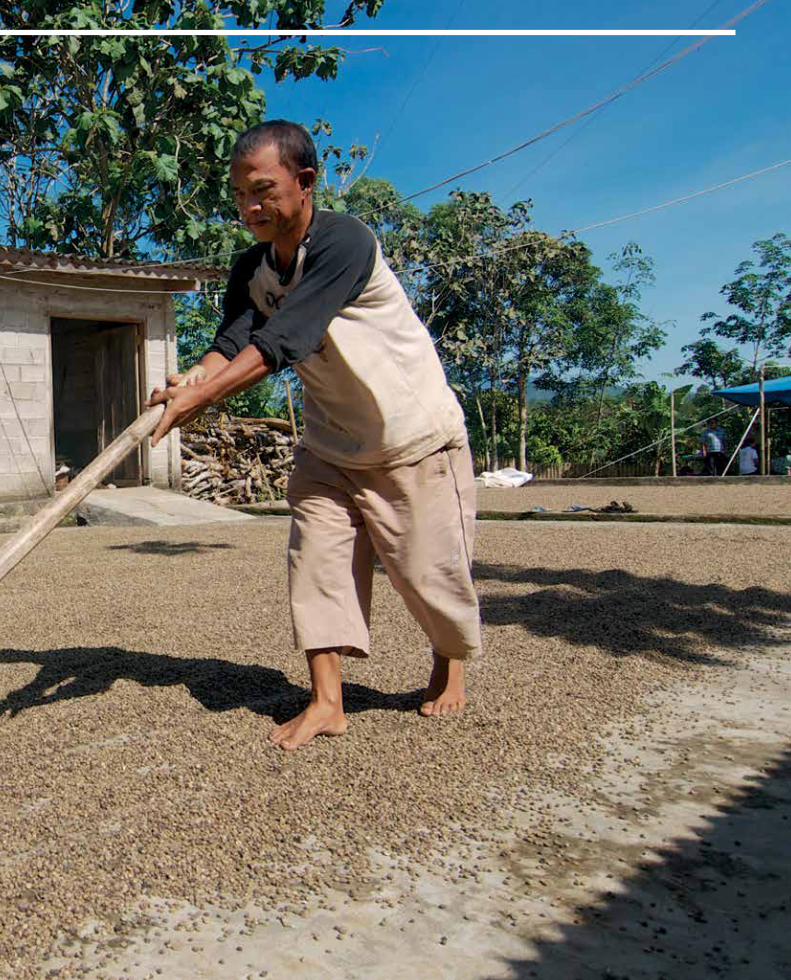
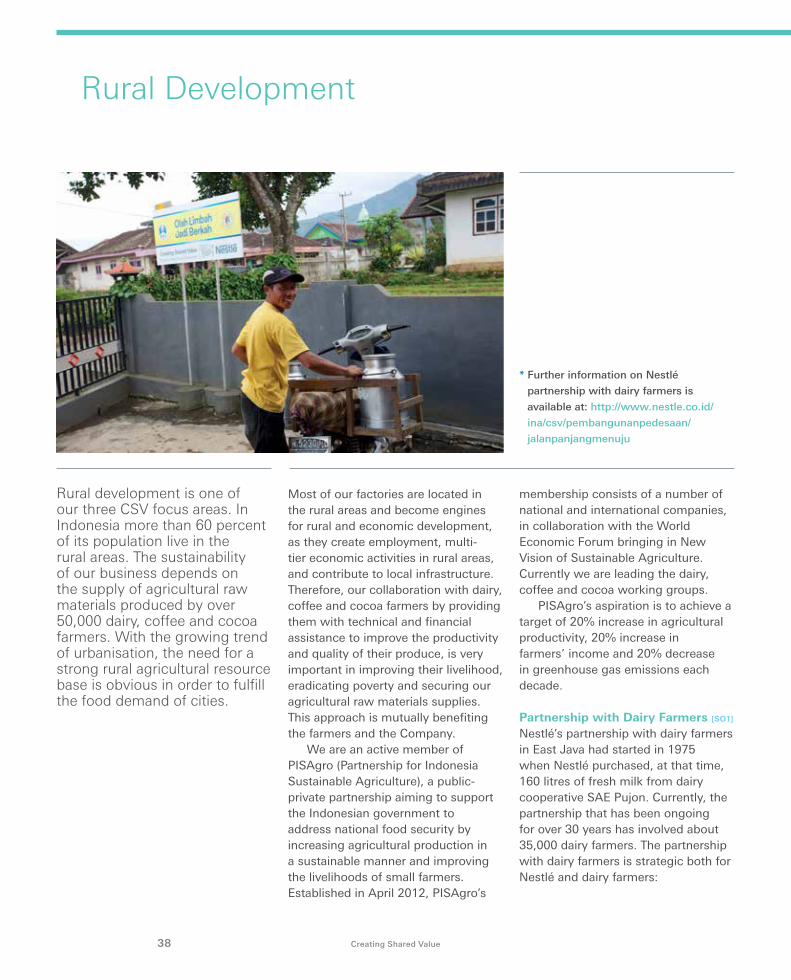
Most of our factories are located in the rural areas and become engines for rural and economic development, as they create employment, multi-tier economic activities in rural areas, and contribute to local infrastructure. Therefore, our collaboration with dairy, coffee and cocoa farmers by providing them with technical and financial assistance to improve the productivity and quality of their produce, is very important in improving their livelihood, eradicating poverty and securing our agricultural raw materials supplies. This approach is mutually benefiting the farmers and the Company.
We are an active member of PISAgro (Partnership for Indonesia Sustainable Agriculture), a public-private partnership aiming to support the Indonesian government to address national food security by increasing agricultural production in a sustainable manner and improving the livelihoods of small farmers. Established in April 2012, PISAgro’s
membership consists of a number of national and international companies, in collaboration with the World Economic Forum bringing in New Vision of Sustainable Agriculture. Currently we are leading the dairy, coffee and cocoa working groups.
PISAgro’s aspiration is to achieve a target of 20% increase in agricultural productivity, 20% increase in farmers’ income and 20% decrease in greenhouse gas emissions each decade.
Partnership with Dairy Farmers [SO1]
Nestlé’s partnership with dairy farmers in East Java had started in 1975 when Nestlé purchased, at that time, 160 litres of fresh milk from dairy cooperative SAE Pujon. Currently, the partnership that has been ongoing for over 30 years has involved about 35,000 dairy farmers. The partnership with dairy farmers is strategic both for Nestlé and dairy farmers: è
Rural Development
* Further information on Nestlé
partnership with dairy farmers is
available at: http://www.nestle.co.id/
ina/csv/pembangunanpedesaan/
jalanpanjangmenuju
Rural development is one of our three CSV focus areas. In Indonesia more than 60 percent of its population live in the rural areas. The sustainability of our business depends on the supply of agricultural raw materials produced by over 50,000 dairy, coffee and cocoa farmers. With the growing trend of urbanisation, the need for a strong rural agricultural resource base is obvious in order to fulfill the food demand of cities.
39Nestlé Indonesia
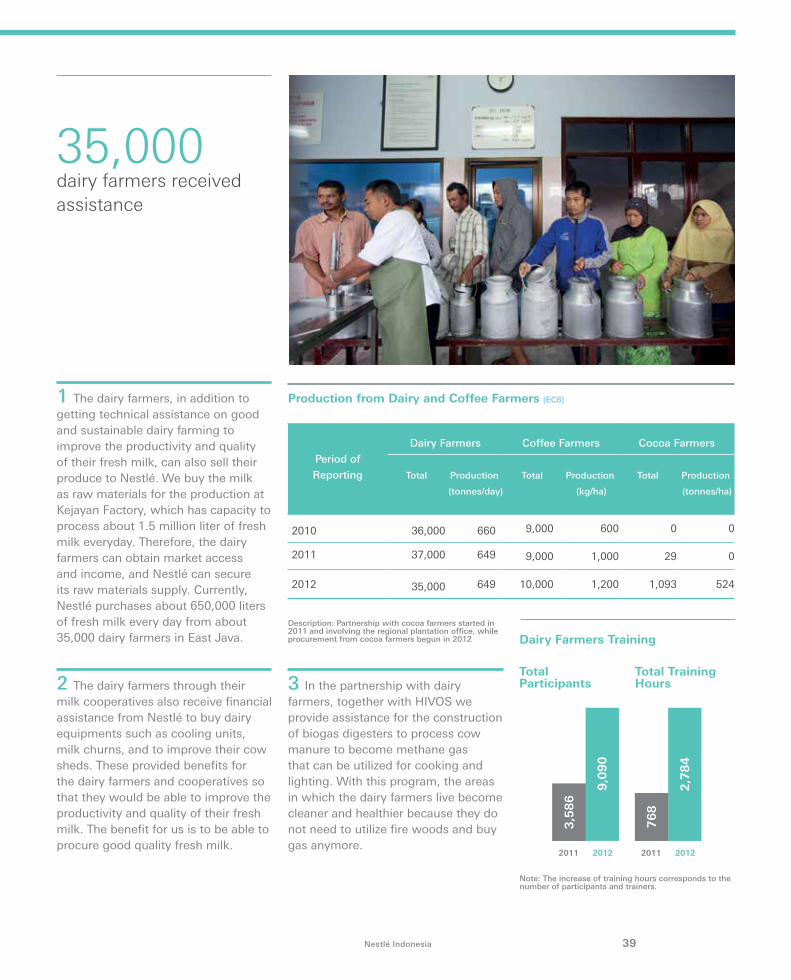
Total Participants
Total Training Hours
2011 20112012 2012
9,0
90
3,5
86
2,7
84
76
8
Note: The increase of training hours corresponds to the number of participants and trainers.
Dairy Farmers Training
1 The dairy farmers, in addition to getting technical assistance on good and sustainable dairy farming to improve the productivity and quality of their fresh milk, can also sell their produce to Nestlé. We buy the milk as raw materials for the production at Kejayan Factory, which has capacity to process about 1.5 million liter of fresh milk everyday. Therefore, the dairy farmers can obtain market access and income, and Nestlé can secure its raw materials supply. Currently, Nestlé purchases about 650,000 liters of fresh milk every day from about 35,000 dairy farmers in East Java.
2 The dairy farmers through their milk cooperatives also receive financial assistance from Nestlé to buy dairy equipments such as cooling units, milk churns, and to improve their cow sheds. These provided benefits for the dairy farmers and cooperatives so that they would be able to improve the productivity and quality of their fresh milk. The benefit for us is to be able to procure good quality fresh milk.
3 In the partnership with dairy farmers, together with HIVOS we provide assistance for the construction of biogas digesters to process cow manure to become methane gas that can be utilized for cooking and lighting. With this program, the areas in which the dairy farmers live become cleaner and healthier because they do not need to utilize fire woods and buy gas anymore.
Period of
Reporting
Dairy Farmers Coffee Farmers Cocoa Farmers
Total Production
(tonnes/day)
Total Production
(kg/ha)
Total Production
(tonnes/ha)
2010 36,000 660 9,000 600 0 0
2011 37,000 649 9,000 1,000 29 0
2012 35,000 649 10,000 1,200 1,093 524
Production from Dairy and Coffee Farmers [EC6]
Description: Partnership with cocoa farmers started in 2011 and involving the regional plantation office, while procurement from cocoa farmers begun in 2012
35,000 dairy farmers received assistance
40 Creating Shared Value
Rural Development
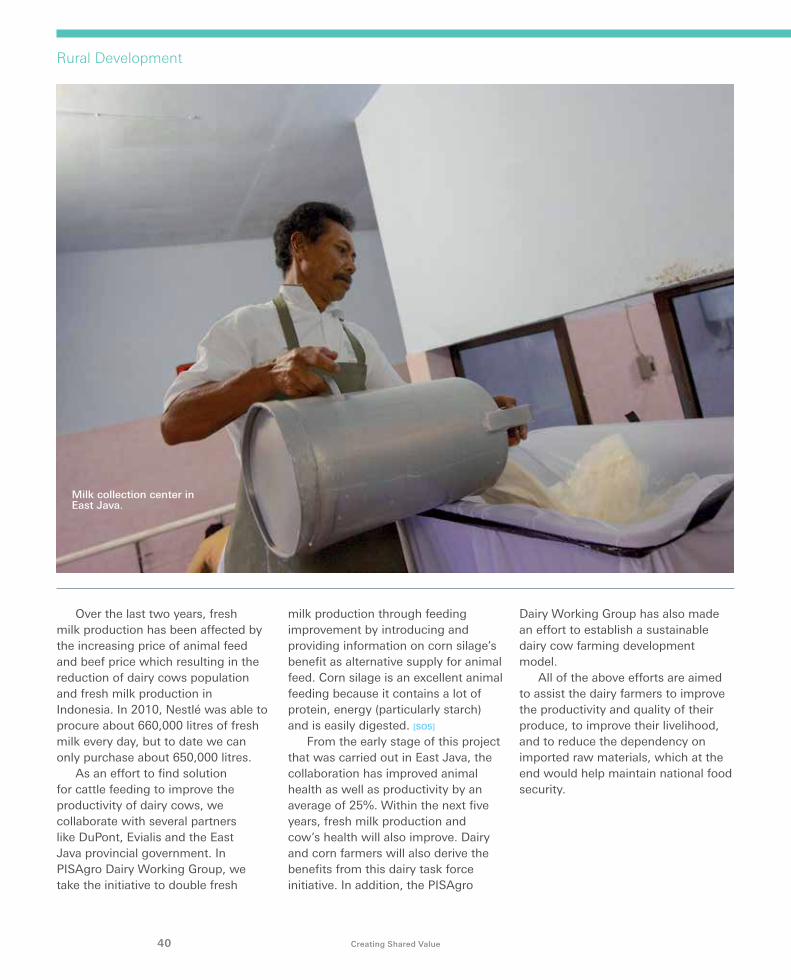
Over the last two years, fresh milk production has been affected by the increasing price of animal feed and beef price which resulting in the reduction of dairy cows population and fresh milk production in Indonesia. In 2010, Nestlé was able to procure about 660,000 litres of fresh milk every day, but to date we can only purchase about 650,000 litres.
As an effort to find solution for cattle feeding to improve the productivity of dairy cows, we collaborate with several partners like DuPont, Evialis and the East Java provincial government. In PISAgro Dairy Working Group, we take the initiative to double fresh
milk production through feeding improvement by introducing and providing information on corn silage’s benefit as alternative supply for animal feed. Corn silage is an excellent animal feeding because it contains a lot of protein, energy (particularly starch) and is easily digested. [SO5]
From the early stage of this project that was carried out in East Java, the collaboration has improved animal health as well as productivity by an average of 25%. Within the next five years, fresh milk production and cow’s health will also improve. Dairy and corn farmers will also derive the benefits from this dairy task force initiative. In addition, the PISAgro
Dairy Working Group has also made an effort to establish a sustainable dairy cow farming development model.
All of the above efforts are aimed to assist the dairy farmers to improve the productivity and quality of their produce, to improve their livelihood, and to reduce the dependency on imported raw materials, which at the end would help maintain national food security.
Milk collection center in East Java.
41Nestlé Indonesia
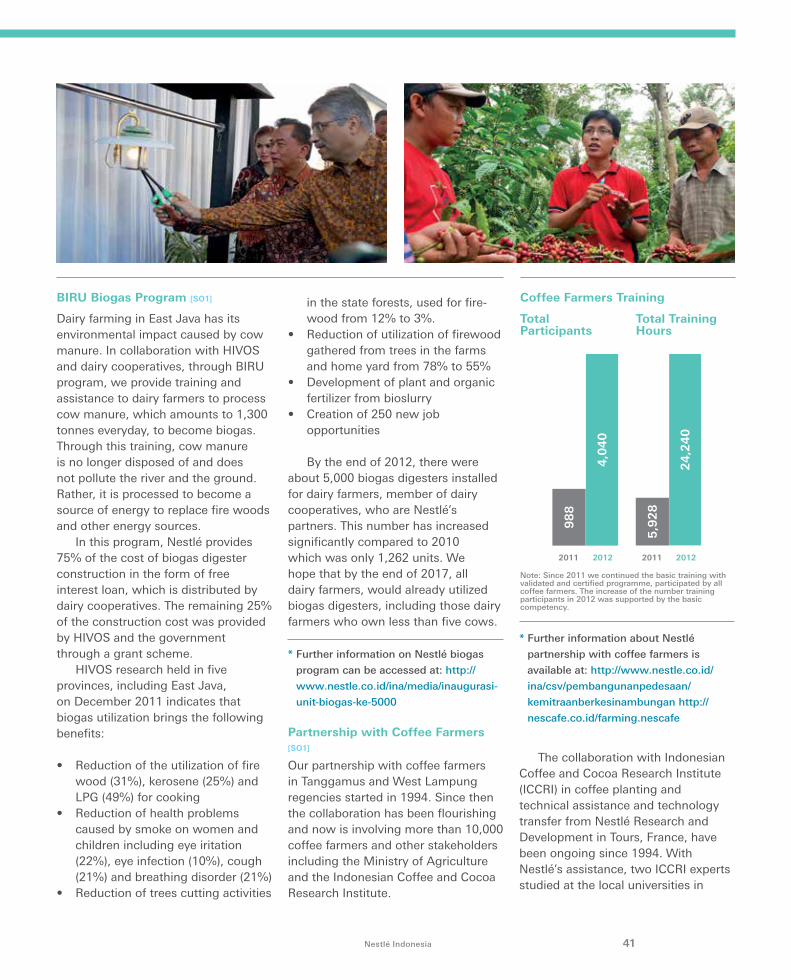
BIRU Biogas Program [SO1]
Dairy farming in East Java has its environmental impact caused by cow manure. In collaboration with HIVOS and dairy cooperatives, through BIRU program, we provide training and assistance to dairy farmers to process cow manure, which amounts to 1,300 tonnes everyday, to become biogas. Through this training, cow manure is no longer disposed of and does not pollute the river and the ground. Rather, it is processed to become a source of energy to replace fire woods and other energy sources.
In this program, Nestlé provides 75% of the cost of biogas digester construction in the form of free interest loan, which is distributed by dairy cooperatives. The remaining 25% of the construction cost was provided by HIVOS and the government through a grant scheme.
HIVOS research held in five provinces, including East Java, on December 2011 indicates that biogas utilization brings the following benefits:
• Reduction of the utilization of fire wood (31%), kerosene (25%) and LPG (49%) for cooking
• Reduction of health problems caused by smoke on women and children including eye iritation (22%), eye infection (10%), cough (21%) and breathing disorder (21%)
• Reduction of trees cutting activities
in the state forests, used for fire-wood from 12% to 3%.
• Reduction of utilization of firewood gathered from trees in the farms and home yard from 78% to 55%
• Development of plant and organic fertilizer from bioslurry
• Creation of 250 new job opportunities
By the end of 2012, there were about 5,000 biogas digesters installed for dairy farmers, member of dairy cooperatives, who are Nestlé’s partners. This number has increased significantly compared to 2010 which was only 1,262 units. We hope that by the end of 2017, all dairy farmers, would already utilized biogas digesters, including those dairy farmers who own less than five cows.
* Further information on Nestlé biogas
program can be accessed at: http://
www.nestle.co.id/ina/media/inaugurasi-
unit-biogas-ke-5000
Partnership with Coffee Farmers [SO1]
Our partnership with coffee farmers in Tanggamus and West Lampung regencies started in 1994. Since then the collaboration has been flourishing and now is involving more than 10,000 coffee farmers and other stakeholders including the Ministry of Agriculture and the Indonesian Coffee and Cocoa Research Institute.
* Further information about Nestlé
partnership with coffee farmers is
available at: http://www.nestle.co.id/
ina/csv/pembangunanpedesaan/
kemitraanberkesinambungan http://
nescafe.co.id/farming.nescafe
24
,24
0
5,9
28
98
8
Total Participants
Total Training Hours
2011 20112012 2012
4,0
40
Note: Since 2011 we continued the basic training with validated and certified programme, participated by all coffee farmers. The increase of the number training participants in 2012 was supported by the basic competency.
Coffee Farmers Training
The collaboration with Indonesian Coffee and Cocoa Research Institute (ICCRI) in coffee planting and technical assistance and technology transfer from Nestlé Research and Development in Tours, France, have been ongoing since 1994. With Nestlé’s assistance, two ICCRI experts studied at the local universities in
42 Creating Shared Value
France and received trainings at the Nestlé Research and Development in Tours.
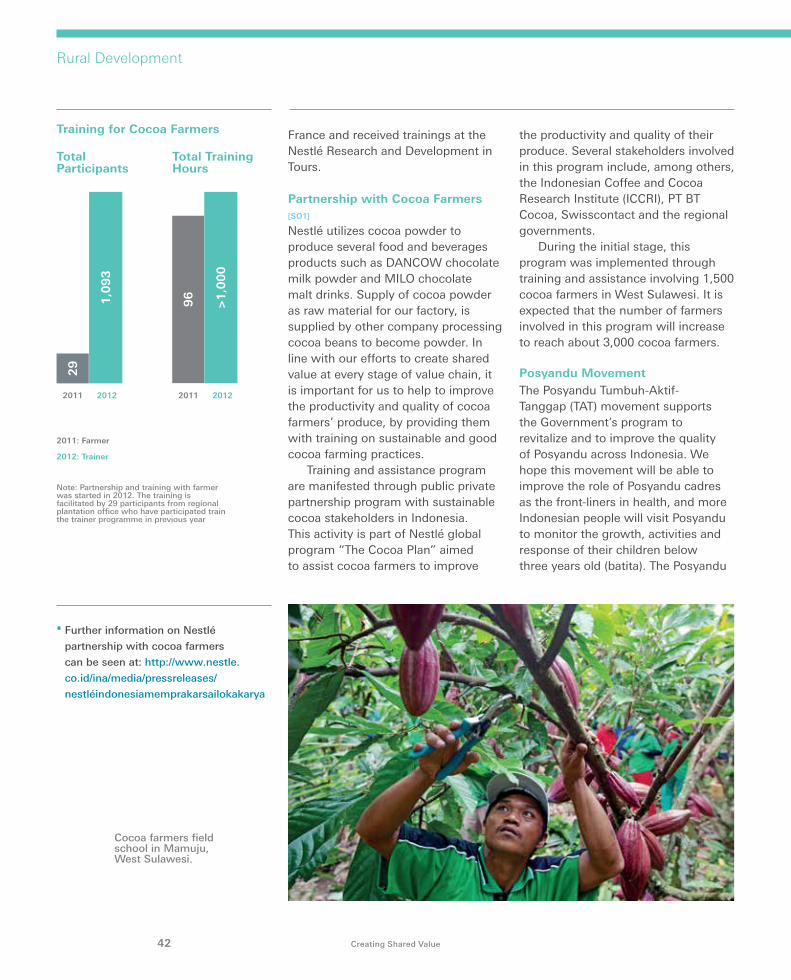
Partnership with Cocoa Farmers [SO1]
Nestlé utilizes cocoa powder to produce several food and beverages products such as DANCOW chocolate milk powder and MILO chocolate malt drinks. Supply of cocoa powder as raw material for our factory, is supplied by other company processing cocoa beans to become powder. In line with our efforts to create shared value at every stage of value chain, it is important for us to help to improve the productivity and quality of cocoa farmers’ produce, by providing them with training on sustainable and good cocoa farming practices.
Training and assistance program are manifested through public private partnership program with sustainable cocoa stakeholders in Indonesia. This activity is part of Nestlé global program “The Cocoa Plan” aimed to assist cocoa farmers to improve
the productivity and quality of their produce. Several stakeholders involved in this program include, among others, the Indonesian Coffee and Cocoa Research Institute (ICCRI), PT BT Cocoa, Swisscontact and the regional governments.
During the initial stage, this program was implemented through training and assistance involving 1,500 cocoa farmers in West Sulawesi. It is expected that the number of farmers involved in this program will increase to reach about 3,000 cocoa farmers.
Posyandu Movement The Posyandu Tumbuh-Aktif-Tanggap (TAT) movement supports the Government’s program to revitalize and to improve the quality of Posyandu across Indonesia. We hope this movement will be able to improve the role of Posyandu cadres as the front-liners in health, and more Indonesian people will visit Posyandu to monitor the growth, activities and response of their children below three years old (batita). The Posyandu
96
>1
,000
1,0
93
* Further information on Nestlé
partnership with cocoa farmers
can be seen at: http://www.nestle.
co.id/ina/media/pressreleases/
nestléindonesiamemprakarsailokakarya
Total Participants
Total Training Hours
2011 20112012 2012
29
Note: Partnership and training with farmer was started in 2012. The training is facilitated by 29 participants from regional plantation office who have participated train the trainer programme in previous year
Training for Cocoa Farmers
2011: Farmer
2012: Trainer
Cocoa farmers field school in Mamuju, West Sulawesi.
Rural Development
43Nestlé Indonesia
Peduli TAT movement is part of Nestlé Indonesia’s commitment in helping to nurture a healthier life for Indonesians. We are optimistic that through this national movement we can improve the knowledge of Posyandu cadres to help nurture healthier Indonesian batita.
The program implementation includes classes for Posyandu cadres, Posyandu contest in 16 provinces as well as awarding the best cadre and best posyandu during the National PKK Gymboree held on October 2012.
* Further information about this program
is available at: http://www.nestle.co.id/
ina/media/gerakanposyandupeduli
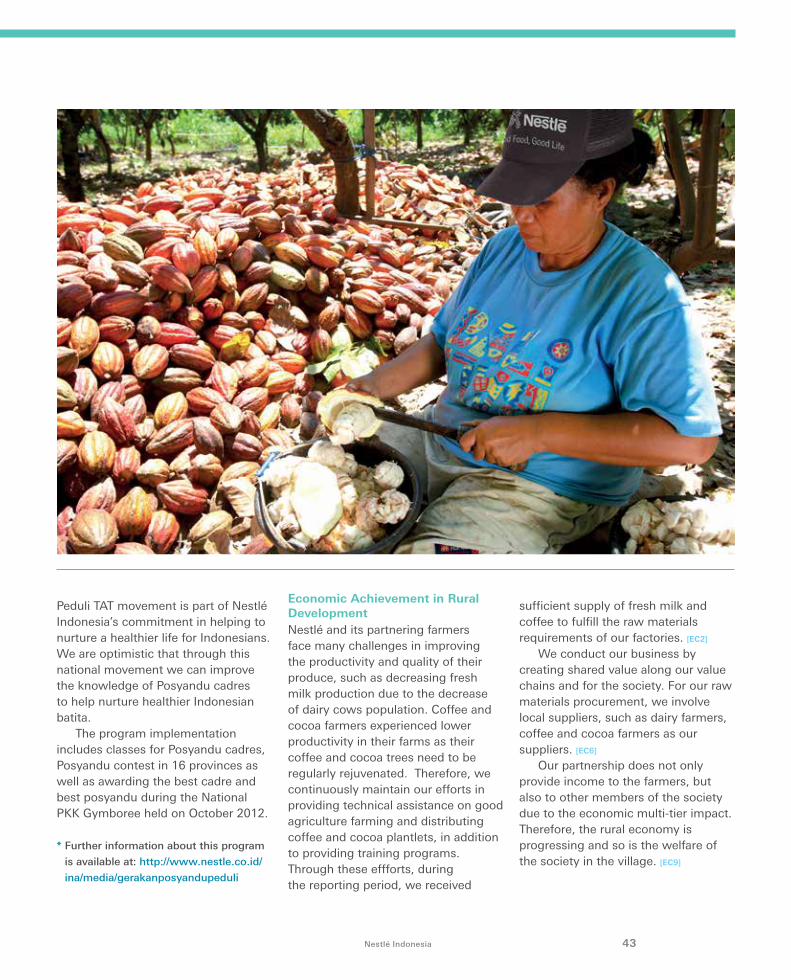
Economic Achievement in Rural DevelopmentNestlé and its partnering farmers face many challenges in improving the productivity and quality of their produce, such as decreasing fresh milk production due to the decrease of dairy cows population. Coffee and cocoa farmers experienced lower productivity in their farms as their coffee and cocoa trees need to be regularly rejuvenated. Therefore, we continuously maintain our efforts in providing technical assistance on good agriculture farming and distributing coffee and cocoa plantlets, in addition to providing training programs. Through these effforts, during the reporting period, we received
sufficient supply of fresh milk and coffee to fulfill the raw materials requirements of our factories. [EC2]
We conduct our business by creating shared value along our value chains and for the society. For our raw materials procurement, we involve local suppliers, such as dairy farmers, coffee and cocoa farmers as our suppliers. [EC6]
Our partnership does not only provide income to the farmers, but also to other members of the society due to the economic multi-tier impact. Therefore, the rural economy is progressing and so is the welfare of the society in the village. [EC9]
Nutrition
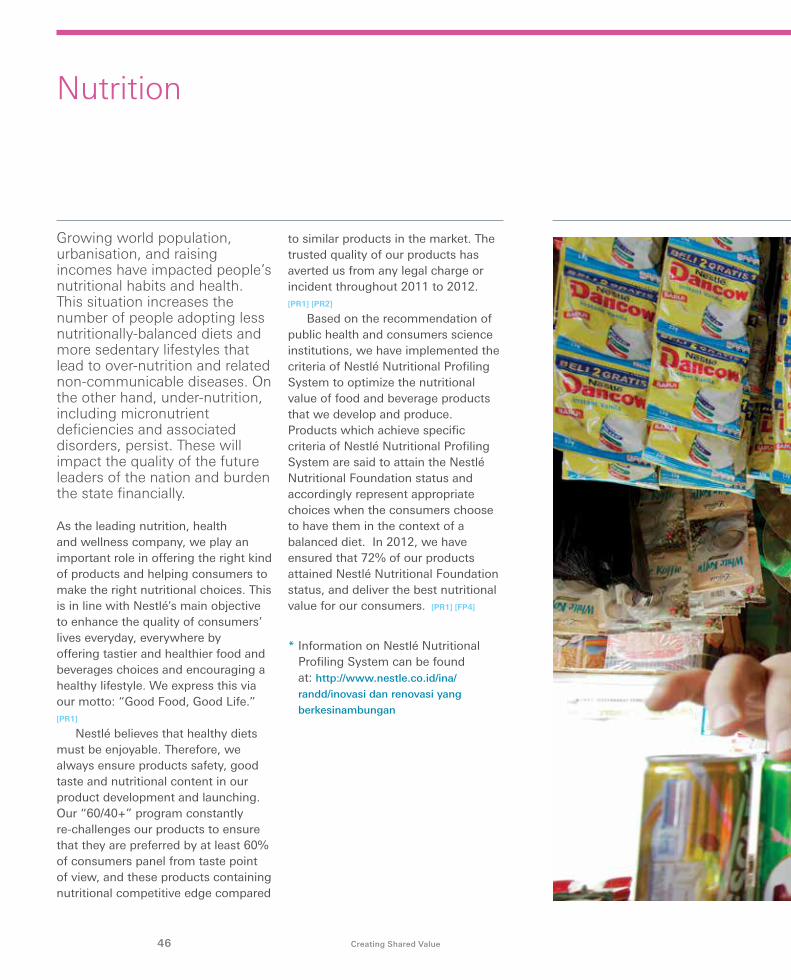
Growing world population, urbanisation, and raising incomes have impacted people’s nutritional habits and health. This situation increases the number of people adopting less nutritionally-balanced diets and more sedentary lifestyles that lead to over-nutrition and related non-communicable diseases. On the other hand, under-nutrition, including micronutrient deficiencies and associated disorders, persist. These will impact the quality of the future leaders of the nation and burden the state financially.
As the leading nutrition, health and wellness company, we play an important role in offering the right kind of products and helping consumers to make the right nutritional choices. This is in line with Nestlé’s main objective to enhance the quality of consumers’ lives everyday, everywhere by offering tastier and healthier food and beverages choices and encouraging a healthy lifestyle. We express this via our motto: “Good Food, Good Life.” [PR1]
Nestlé believes that healthy diets must be enjoyable. Therefore, we always ensure products safety, good taste and nutritional content in our product development and launching. Our “60/40+” program constantly re-challenges our products to ensure that they are preferred by at least 60% of consumers panel from taste point of view, and these products containing nutritional competitive edge compared
to similar products in the market. The trusted quality of our products has averted us from any legal charge or incident throughout 2011 to 2012. [PR1] [PR2]
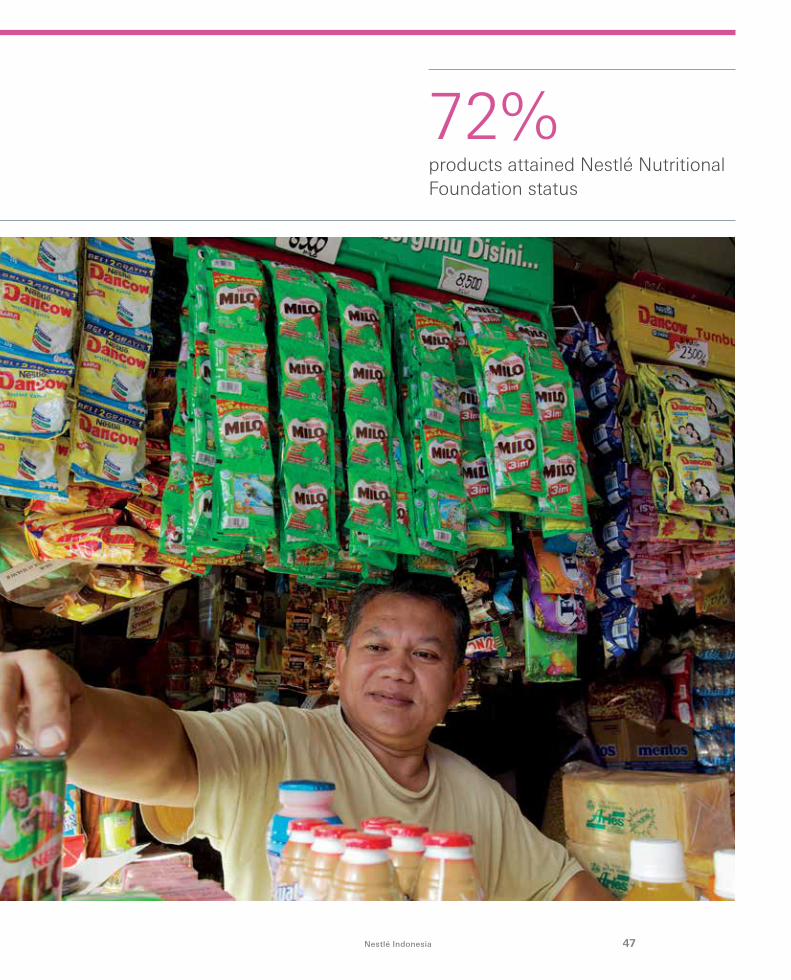
Based on the recommendation of public health and consumers science institutions, we have implemented the criteria of Nestlé Nutritional Profiling System to optimize the nutritional value of food and beverage products that we develop and produce. Products which achieve specific criteria of Nestlé Nutritional Profiling System are said to attain the Nestlé Nutritional Foundation status and accordingly represent appropriate choices when the consumers choose to have them in the context of a balanced diet. In 2012, we have ensured that 72% of our products attained Nestlé Nutritional Foundation status, and deliver the best nutritional value for our consumers. [PR1] [FP4]
* Information on Nestlé Nutritional Profiling System can be found at: http://www.nestle.co.id/ina/
randd/inovasi dan renovasi yang
berkesinambungan
46 Creating Shared Value
Nutrition
47Nestlé Indonesia
72% products attained Nestlé Nutritional Foundation status
48 Creating Shared Value
Nutrition
Nutrition Awareness and Children Health [SO1]
Nestlé communicates with its consumers through various channels as part of the efforts to provide knowledge to the society on the importance of a balanced diet and healthy life style. This is in line with Nestlé Indonesia’s mission to help nurture a healthier life for Indonesians. In conducting consumers communication and marketing, Nestlé always ensures its compliance to the policy, principles and guidelines to secure consumers’ trust on our company and brands.
Several activities that we do are as follows:
• Healthy Breakfast Campaign – Nestlé Breakfast Cereals About 2,000 pairs of mothers and their children joined KOKO Olympiade 2011 on the 24th of July 2011. They joined the mass breakfast event simultaneously conducted in four cities: Bandung, Surabaya, Medan, and Makassar. This activity broke the record of the Indonesian World Records Museum for breakfast with the largest number of participants.
• Nestlé Breakfast Cereal Social GatheringNestlé Breakfast Cereal social gatherings aim to provide consumers with knowledge on the importance of breakfast, type of good breakfast and nutritional contents of various type of breakfast. The 2011 Nestlé Breakfast Cereal social gatherings were held from the month of October to December 2011 and involved the participation of 1,858 mothers from 60 housing compounds across Bandung, Pekanbaru and Banjarmasin. In 2012, similar activities were held from February to July, and joined by 3,000 mothers from 100 housing compounds across Bandung, Yogyakarta, Pekanbaru, Medan, and Balikpapan.
• MILO School CompetitionThanks to the support of the Municipalities Offices of Ministry of Education and Culture and the Indonesian Badminton Association (PBSI), to date more than 28,500 elementary and junior high school students have had the opportunity to participate in MILO School
Competition in 25 cities across 16 provinces throughout Indonesia.
* Further information on MILO School Competition can be found at: https://www2.sahabatnestle.
co.id/milo/aksi-milo.aspx
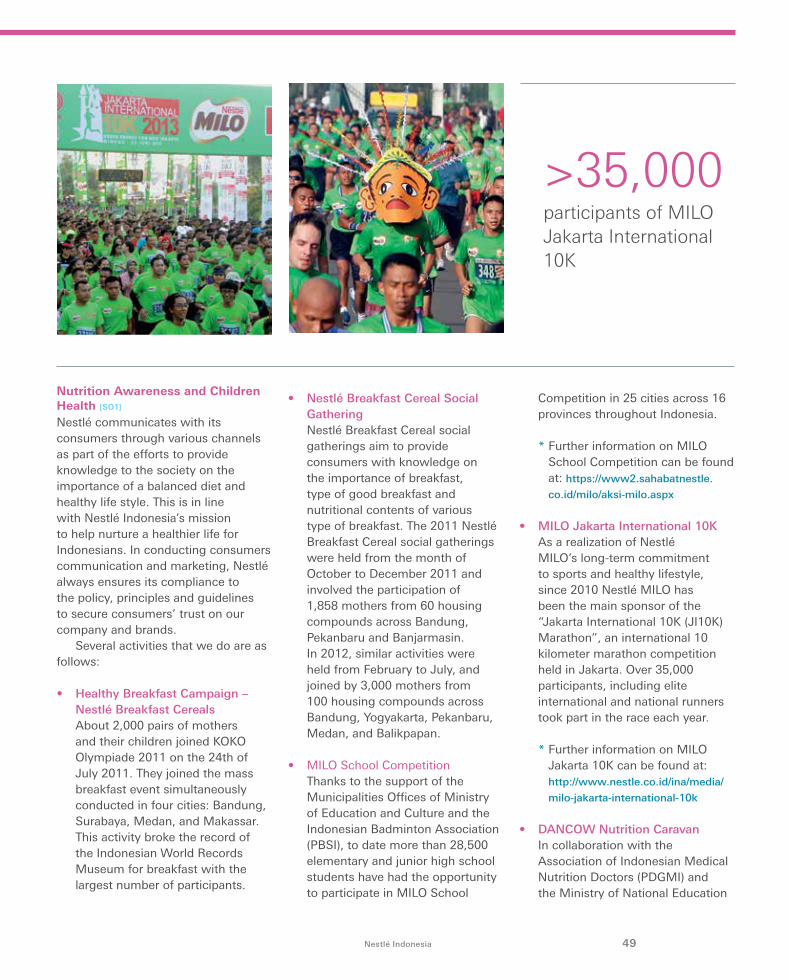
• MILO Jakarta International 10K As a realization of Nestlé MILO’s long-term commitment to sports and healthy lifestyle, since 2010 Nestlé MILO has been the main sponsor of the “Jakarta International 10K (JI10K) Marathon”, an international 10 kilometer marathon competition held in Jakarta. Over 35,000 participants, including elite international and national runners took part in the race each year.
* Further information on MILO Jakarta 10K can be found at: http://www.nestle.co.id/ina/media/
milo-jakarta-international-10k
• DANCOW Nutrition Caravan In collaboration with the Association of Indonesian Medical Nutrition Doctors (PDGMI) and the Ministry of National Education
>35,000 participants of MILO Jakarta International 10K
49Nestlé Indonesia
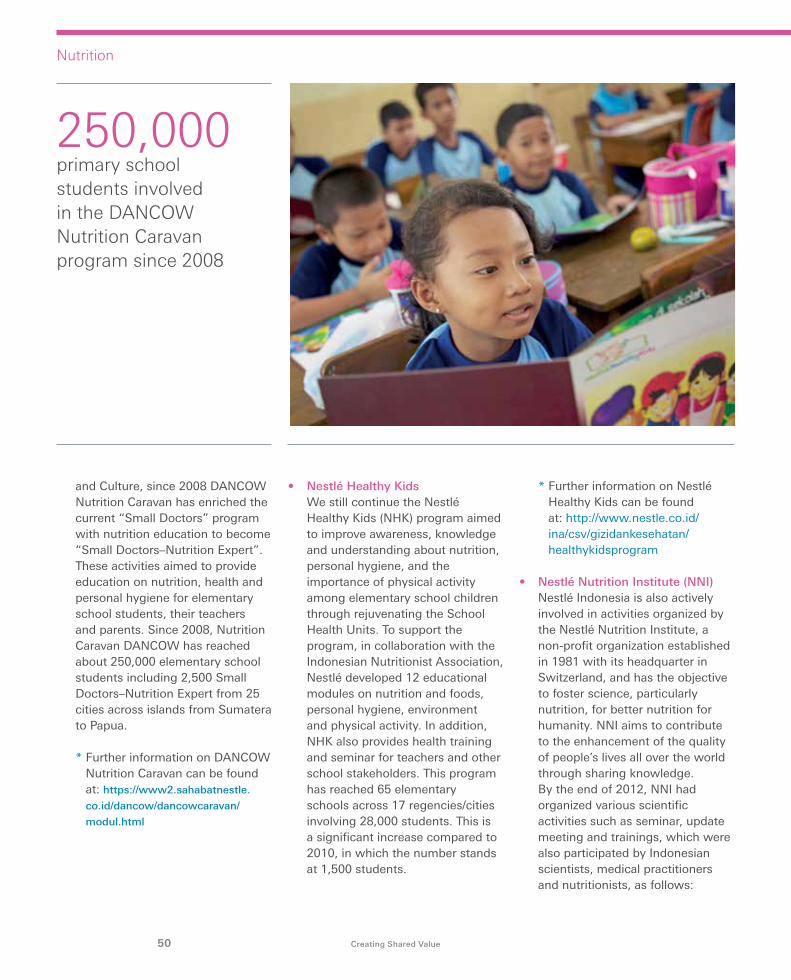
and Culture, since 2008 DANCOW Nutrition Caravan has enriched the current “Small Doctors” program with nutrition education to become “Small Doctors–Nutrition Expert”. These activities aimed to provide education on nutrition, health and personal hygiene for elementary school students, their teachers and parents. Since 2008, Nutrition Caravan DANCOW has reached about 250,000 elementary school students including 2,500 Small Doctors–Nutrition Expert from 25 cities across islands from Sumatera to Papua.
* Further information on DANCOW Nutrition Caravan can be found at: https://www2.sahabatnestle.
co.id/dancow/dancowcaravan/
modul.html
• Nestlé Healthy KidsWe still continue the Nestlé Healthy Kids (NHK) program aimed to improve awareness, knowledge and understanding about nutrition, personal hygiene, and the importance of physical activity among elementary school children through rejuvenating the School Health Units. To support the program, in collaboration with the Indonesian Nutritionist Association, Nestlé developed 12 educational modules on nutrition and foods, personal hygiene, environment and physical activity. In addition, NHK also provides health training and seminar for teachers and other school stakeholders. This program has reached 65 elementary schools across 17 regencies/cities involving 28,000 students. This is a significant increase compared to 2010, in which the number stands at 1,500 students.
* Further information on Nestlé Healthy Kids can be found at: http://www.nestle.co.id/ina/csv/gizidankesehatan/healthykidsprogram
• Nestlé Nutrition Institute (NNI)Nestlé Indonesia is also actively involved in activities organized by the Nestlé Nutrition Institute, a non-profit organization established in 1981 with its headquarter in Switzerland, and has the objective to foster science, particularly nutrition, for better nutrition for humanity. NNI aims to contribute to the enhancement of the quality of people’s lives all over the world through sharing knowledge. By the end of 2012, NNI had organized various scientific activities such as seminar, update meeting and trainings, which were also participated by Indonesian scientists, medical practitioners and nutritionists, as follows:
50 Creating Shared Value
Nutrition
250,000primary school students involved in the DANCOW Nutrition Caravan program since 2008
• Nestlé Nutrition International Workshops, 74 workshops with 94 Indonesian medical practitioners participants
• Pediatric Update, 13 update meetings involving more than 1,250 pediatricians across Indonesia
• Nestlé Fellowship Training program, 11 Indonesian peditricians participated in the program at a reputable hospital in Singapore
Donation [SO1]
Nestlé regularly donates milk products to several orphanage, foundation, hospital, and social organizations.
We ensure the safety and quality of the products donated are safe for consumption. In addition, we provide training to recipients of donations on proper milk preparation before delivering the products. The donation mechanism requires further re-checking on the expiry date; there
are also requirements to not delay the products distribution, not to sell the products and not to exchange the donated products. The donated products delivery is formalized by the signing of acceptance letter between Nestlé and the related parties. This mechanism is to ensure that the donation is done properly. [SO2] [PR3] [FP8]
Consumer Information and Communication
Nestlé is committed to responsible and reliable marketing and communication to consumers. In communication, we always ensure our compliance to the prevailing laws and regulations and to the Company’s internal policy, principles and guidelines. Several of these policies, principles and guidelines are the Nestlé Consumer Communication Principles, Nestlé Marketing Communication to Children Policy and Nestlé Policy on Nutrition and Health Claims.
In general, our consumer communication and marketing include advertisement, sales promotion and sponsorship. Our compliance has averted us from any legal charge or incident related to our marketing and consumer communication activities. [PR6] [PR7]
Product Information To help consumers make more informed decisions about our food and beverages products, we display the Nestlé Nutrition Compass on the label of our products. The compass provides relevant information to guide consumers to understand the nutrition table, the ingredients used in the products, tips for responsible enjoyment and the proper and healthy use of our products. [PR3]
The following information is attached in all products labels: [PR3]
• Halal label from Majelis Ulama Indonesia (Indonesian Ulema Council)
51Nestlé Indonesia
21,751primary school students benefit from the Nestlé Healthy Kids program
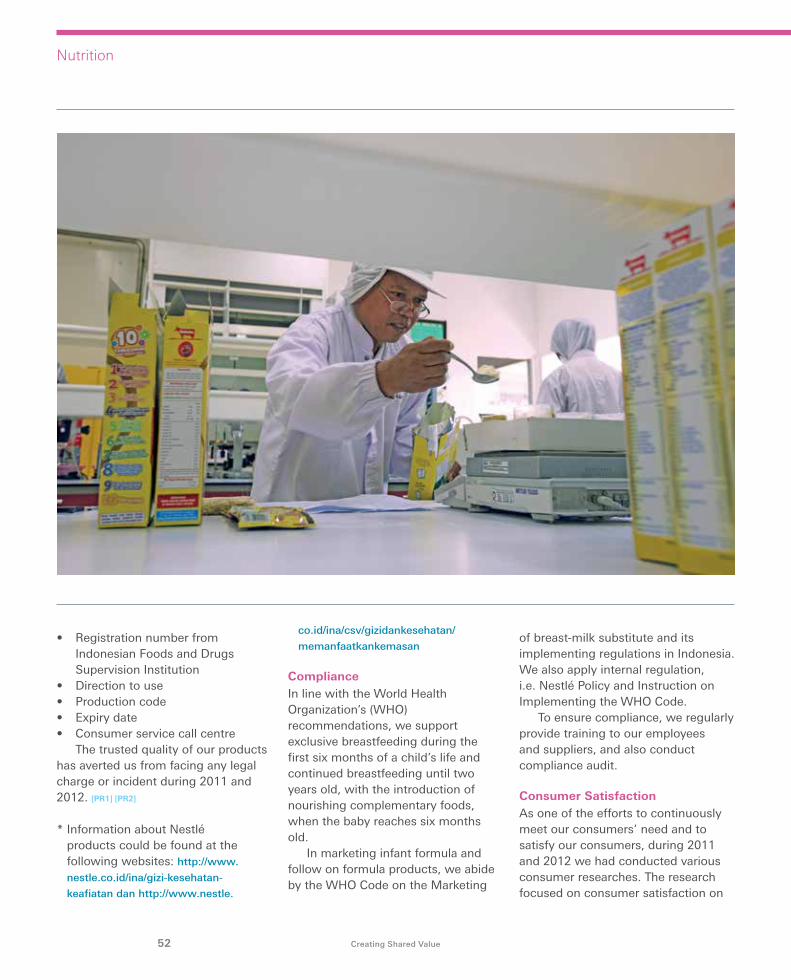
• Registration number from Indonesian Foods and Drugs Supervision Institution
• Direction to use• Production code• Expiry date• Consumer service call centre
The trusted quality of our products has averted us from facing any legal charge or incident during 2011 and 2012. [PR1] [PR2]
* Information about Nestlé products could be found at the following websites: http://www.
nestle.co.id/ina/gizi-kesehatan-
keafiatan dan http://www.nestle.
co.id/ina/csv/gizidankesehatan/
memanfaatkankemasan
Compliance In line with the World Health Organization’s (WHO) recommendations, we support exclusive breastfeeding during the first six months of a child’s life and continued breastfeeding until two years old, with the introduction of nourishing complementary foods, when the baby reaches six months old.
In marketing infant formula and follow on formula products, we abide by the WHO Code on the Marketing
of breast-milk substitute and its implementing regulations in Indonesia. We also apply internal regulation, i.e. Nestlé Policy and Instruction on Implementing the WHO Code.
To ensure compliance, we regularly provide training to our employees and suppliers, and also conduct compliance audit.
Consumer Satisfaction As one of the efforts to continuously meet our consumers’ need and to satisfy our consumers, during 2011 and 2012 we had conducted various consumer researches. The research focused on consumer satisfaction on
52 Creating Shared Value
Nutrition
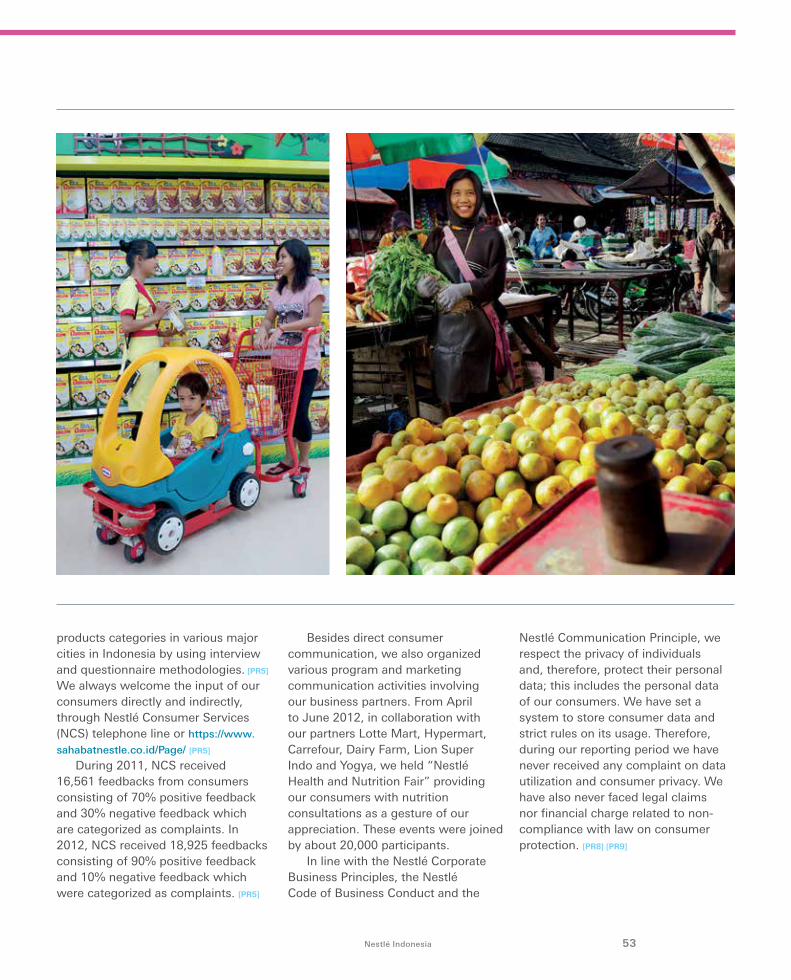
products categories in various major cities in Indonesia by using interview and questionnaire methodologies. [PR5]
We always welcome the input of our consumers directly and indirectly, through Nestlé Consumer Services (NCS) telephone line or https://www.
sahabatnestle.co.id/Page/ [PR5]
During 2011, NCS received 16,561 feedbacks from consumers consisting of 70% positive feedback and 30% negative feedback which are categorized as complaints. In 2012, NCS received 18,925 feedbacks consisting of 90% positive feedback and 10% negative feedback which were categorized as complaints. [PR5]
Besides direct consumer communication, we also organized various program and marketing communication activities involving our business partners. From April to June 2012, in collaboration with our partners Lotte Mart, Hypermart, Carrefour, Dairy Farm, Lion Super Indo and Yogya, we held “Nestlé Health and Nutrition Fair” providing our consumers with nutrition consultations as a gesture of our appreciation. These events were joined by about 20,000 participants.
In line with the Nestlé Corporate Business Principles, the Nestlé Code of Business Conduct and the
Nestlé Communication Principle, we respect the privacy of individuals and, therefore, protect their personal data; this includes the personal data of our consumers. We have set a system to store consumer data and strict rules on its usage. Therefore, during our reporting period we have never received any complaint on data utilization and consumer privacy. We have also never faced legal claims nor financial charge related to non-compliance with law on consumer protection. [PR8] [PR9]
53Nestlé Indonesia
Our People
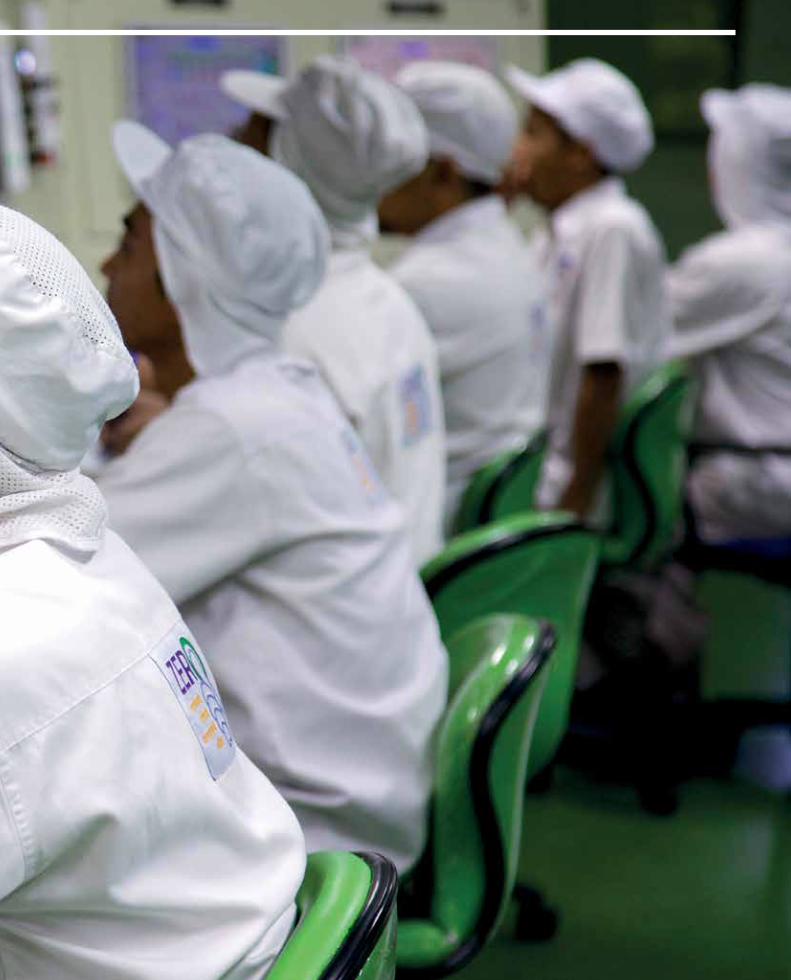
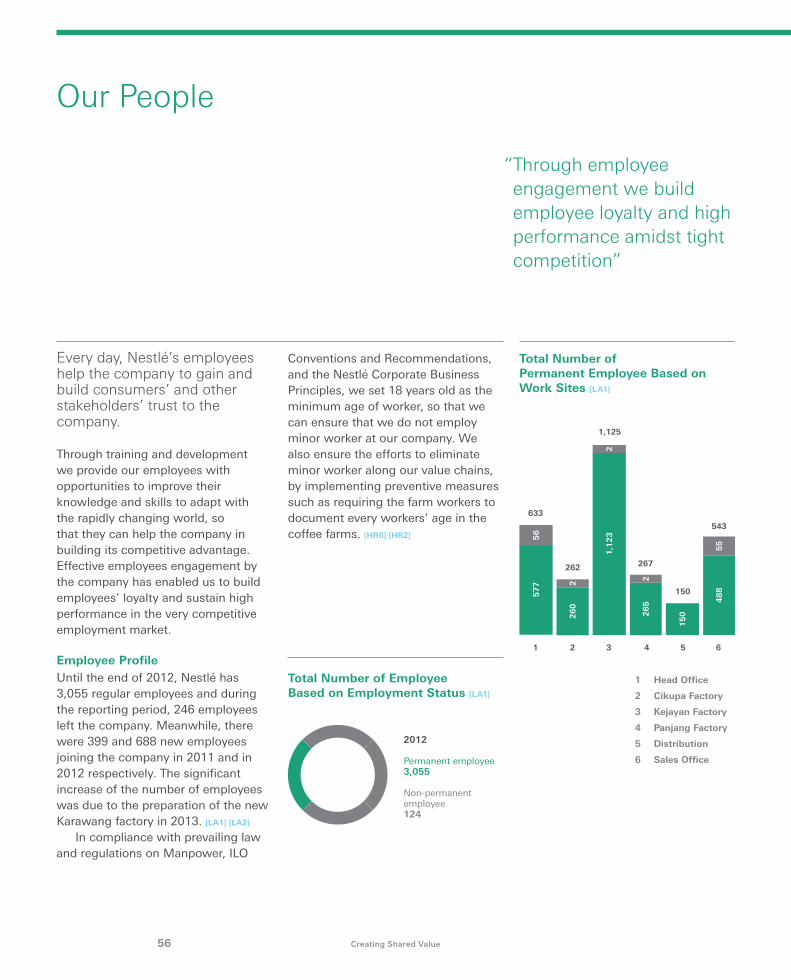
Every day, Nestlé’s employees help the company to gain and build consumers’ and other stakeholders’ trust to the company.
Through training and development we provide our employees with opportunities to improve their knowledge and skills to adapt with the rapidly changing world, so that they can help the company in building its competitive advantage. Effective employees engagement by the company has enabled us to build employees’ loyalty and sustain high performance in the very competitive employment market.
Employee Profile Until the end of 2012, Nestlé has 3,055 regular employees and during the reporting period, 246 employees left the company. Meanwhile, there were 399 and 688 new employees joining the company in 2011 and in 2012 respectively. The significant increase of the number of employees was due to the preparation of the new Karawang factory in 2013. [LA1] [LA2]
In compliance with prevailing law and regulations on Manpower, ILO
Conventions and Recommendations, and the Nestlé Corporate Business Principles, we set 18 years old as the minimum age of worker, so that we can ensure that we do not employ minor worker at our company. We also ensure the efforts to eliminate minor worker along our value chains, by implementing preventive measures such as requiring the farm workers to document every workers’ age in the coffee farms. [HR6] [HR2]
Total Number of Employee Based on Employment Status [LA1]
2012
Permanent employee 3,055
Non-permanent employee 124
1 Head Office
2 Cikupa Factory
3 Kejayan Factory
4 Panjang Factory
5 Distribution
6 Sales Office
Total Number of Permanent Employee Based on Work Sites [LA1]
“ Through employee engagement we build employee loyalty and high performance amidst tight competition”
56 Creating Shared Value
Our People
26
5 48
8
1,1
23
15
0
57
75
6
633
1 2 43 5 6
262
1,125
267
150
543
26
02
2
55
2
57Nestlé Indonesia
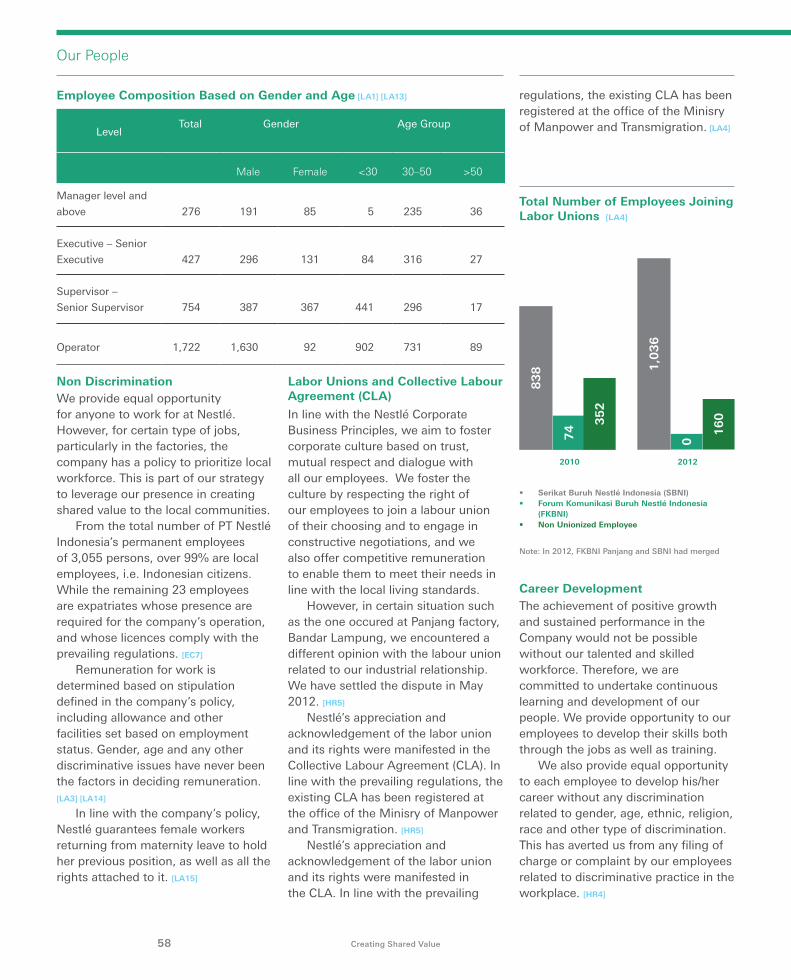
Employee Composition Based on Gender and Age [LA1] [LA13]
Non DiscriminationWe provide equal opportunity for anyone to work for at Nestlé. However, for certain type of jobs, particularly in the factories, the company has a policy to prioritize local workforce. This is part of our strategy to leverage our presence in creating shared value to the local communities.
From the total number of PT Nestlé Indonesia’s permanent employees of 3,055 persons, over 99% are local employees, i.e. Indonesian citizens. While the remaining 23 employees are expatriates whose presence are required for the company’s operation, and whose licences comply with the prevailing regulations. [EC7]
Remuneration for work is determined based on stipulation defined in the company’s policy, including allowance and other facilities set based on employment status. Gender, age and any other discriminative issues have never been the factors in deciding remuneration.[LA3] [LA14]
In line with the company’s policy, Nestlé guarantees female workers returning from maternity leave to hold her previous position, as well as all the rights attached to it. [LA15]
Labor Unions and Collective Labour Agreement (CLA)
In line with the Nestlé Corporate Business Principles, we aim to foster corporate culture based on trust, mutual respect and dialogue with all our employees. We foster the culture by respecting the right of our employees to join a labour union of their choosing and to engage in constructive negotiations, and we also offer competitive remuneration to enable them to meet their needs in line with the local living standards.
However, in certain situation such as the one occured at Panjang factory, Bandar Lampung, we encountered a different opinion with the labour union related to our industrial relationship. We have settled the dispute in May 2012. [HR5]
Nestlé’s appreciation and acknowledgement of the labor union and its rights were manifested in the Collective Labour Agreement (CLA). In line with the prevailing regulations, the existing CLA has been registered at the office of the Minisry of Manpower and Transmigration. [HR5]
Nestlé’s appreciation and acknowledgement of the labor union and its rights were manifested in the CLA. In line with the prevailing
LevelTotal Gender Age Group
Male Female <30 30–50 >50
Manager level and
above 276 191 85 5 235 36
Executive – Senior
Executive 427 296 131 84 316 27
Supervisor –
Senior Supervisor 754 387 367 441 296 17
Operator 1,722 1,630 92 902 731 89
regulations, the existing CLA has been registered at the office of the Minisry of Manpower and Transmigration. [LA4]
Total Number of Employees Joining Labor Unions [LA4]
Career DevelopmentThe achievement of positive growth and sustained performance in the Company would not be possible without our talented and skilled workforce. Therefore, we are committed to undertake continuous learning and development of our people. We provide opportunity to our employees to develop their skills both through the jobs as well as training.
We also provide equal opportunity to each employee to develop his/her career without any discrimination related to gender, age, ethnic, religion, race and other type of discrimination. This has averted us from any filing of charge or complaint by our employees related to discriminative practice in the workplace. [HR4]
58 Creating Shared Value
0
16
0
1,0
36
83
8
2010 2012
74
35
2
Note: In 2012, FKBNI Panjang and SBNI had merged
• Serikat Buruh Nestlé Indonesia (SBNI)• Forum Komunikasi Buruh Nestlé Indonesia
(FKBNI)• Non Unionized Employee
Our People
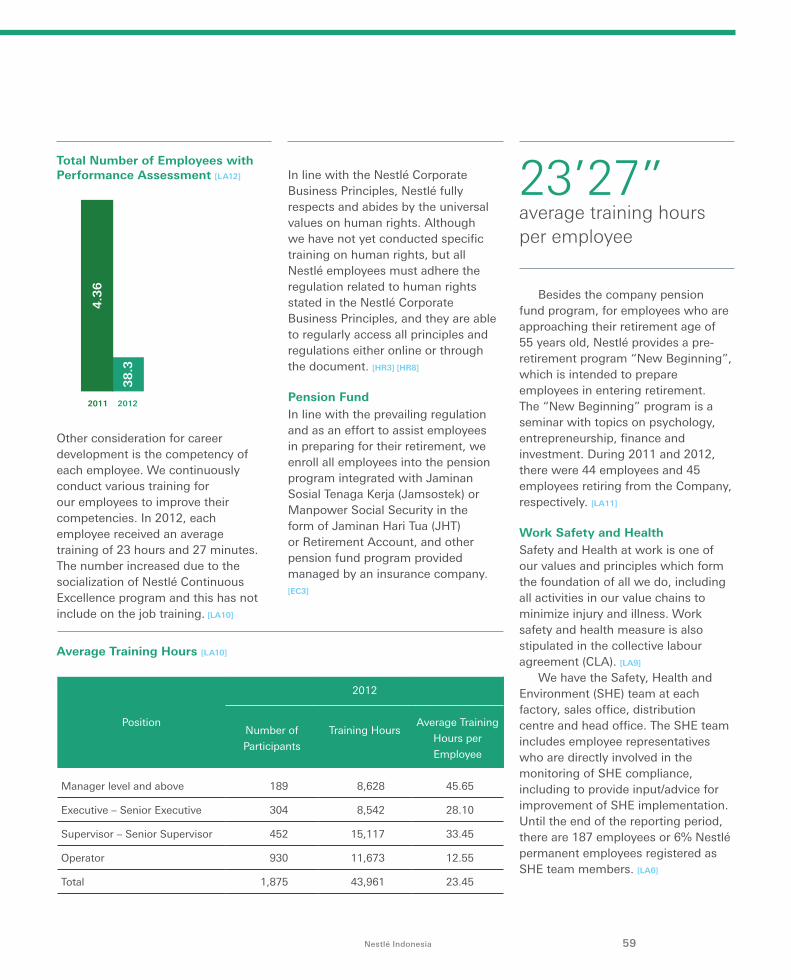
Total Number of Employees with Performance Assessment [LA12]
Other consideration for career development is the competency of each employee. We continuously conduct various training for our employees to improve their competencies. In 2012, each employee received an average training of 23 hours and 27 minutes. The number increased due to the socialization of Nestlé Continuous Excellence program and this has not include on the job training. [LA10]
Position
2012
Number of
Participants
Training HoursAverage Training
Hours per
Employee
Manager level and above 189 8,628 45.65
Executive – Senior Executive 304 8,542 28.10
Supervisor – Senior Supervisor 452 15,117 33.45
Operator 930 11,673 12.55
Total 1,875 43,961 23.45
Average Training Hours [LA10]
In line with the Nestlé Corporate Business Principles, Nestlé fully respects and abides by the universal values on human rights. Although we have not yet conducted specific training on human rights, but all Nestlé employees must adhere the regulation related to human rights stated in the Nestlé Corporate Business Principles, and they are able to regularly access all principles and regulations either online or through the document. [HR3] [HR8]
Pension Fund In line with the prevailing regulation and as an effort to assist employees in preparing for their retirement, we enroll all employees into the pension program integrated with Jaminan Sosial Tenaga Kerja (Jamsostek) or Manpower Social Security in the form of Jaminan Hari Tua (JHT) or Retirement Account, and other pension fund program provided managed by an insurance company. [EC3]
Besides the company pension fund program, for employees who are approaching their retirement age of 55 years old, Nestlé provides a pre-retirement program “New Beginning”, which is intended to prepare employees in entering retirement. The “New Beginning” program is a seminar with topics on psychology, entrepreneurship, finance and investment. During 2011 and 2012, there were 44 employees and 45 employees retiring from the Company, respectively. [LA11]
Work Safety and Health Safety and Health at work is one of our values and principles which form the foundation of all we do, including all activities in our value chains to minimize injury and illness. Work safety and health measure is also stipulated in the collective labour agreement (CLA). [LA9]
We have the Safety, Health and Environment (SHE) team at each factory, sales office, distribution centre and head office. The SHE team includes employee representatives who are directly involved in the monitoring of SHE compliance, including to provide input/advice for improvement of SHE implementation. Until the end of the reporting period, there are 187 employees or 6% Nestlé permanent employees registered as SHE team members. [LA6]
23’27”average training hours per employee
59Nestlé Indonesia
2011 2012
38
.3
4.3
6
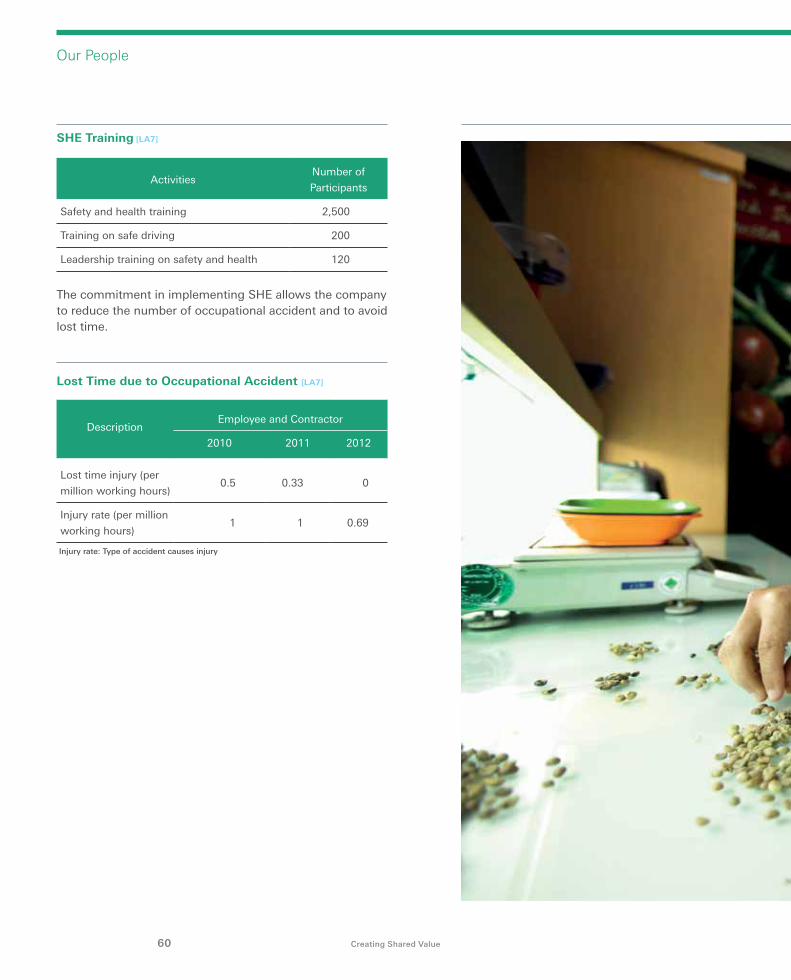
SHE Training [LA7]
ActivitiesNumber of
Participants
Safety and health training 2,500
Training on safe driving 200
Leadership training on safety and health 120
The commitment in implementing SHE allows the company to reduce the number of occupational accident and to avoid lost time.
DescriptionEmployee and Contractor
2010 2011 2012
Lost time injury (per
million working hours)0.5 0.33 0
Injury rate (per million
working hours)1 1 0.69
Injury rate: Type of accident causes injury
Lost Time due to Occupational Accident [LA7]
60 Creating Shared Value
Our People
61Nestlé Indonesia
* Nestlé Profile: http://www.nestle.
co.id/ina/tentangnestle & http://
www.nestle.co.id/ina/tentangnestle/
sejarahnestleindonesia/home
62 Creating Shared Value
PT Nestlé Indonesia (hereinafter referred to as “Nestlé”) is a subsidiary of Nestlé S.A., the world’s leading nutrition, health and wellness company, having its headquarter in Vevey, Switzerland. Nestlé is a private company based in Jakarta, and it does not have any branch nor operation outside Indonesia. [2.4]
[2.5] [2.6]
Until the end of 2012, we have three factories and three distribution centers (DC): [2.3]
1 Factory in Kejayan, Pasuruan regency, East Java
2 Factory in Panjang, Bandar Lampung City, Lampung
3 Factory in Cikupa, Tangerang regency, West Java
4 DC Gempol in Pasuruan regency, East Java
5 DC Cikarang in Bekasi regency, West Java
6 DC Medan, North Sumatera
In 2011 the Company has started the contruction of the fourth factory at Karawang regency, West Java. [2.9]
New Product [FP7]
• Year 2011: DANCOW Calcium Plus and NESFRUTA
• Year 2012: Nestlé CRUNCH, MOM & ME, DANCOW Actigo UHT
Awards and Certifications [2.10]
December 2011The 7th Indonesia Sustainability Reporting Award (ISRA) by the National Centre for Sustainable Reporting (NCSR). • The 1st Runner-up of Best
Sustainability Report Category Group B (Various Industry, Consumer Goods, Property and Real Estate Companies).
• Commendation for First-time Sustainability Reporting
February 2012 The company supported MP3EI (Masterplan for Accelerating and Expanding Indonesia Economic Growth) program and Jakarta Food Security Summit 2012 initiated by the Coordinating Ministry of Economy of Republic of Indonesia• Recently set-up Karawang factory
is in line with MP3EI
May 2012 • The Indonesia Sustainable
Business Awards 2012 held by Kamar Dagang dan Industri (Kadin) or Indonesian Chamber of Commerce and Industry in collaboration with Global Initiatives and Climate Business.
• Industry Champion for Food and Beverage Sector and Best Supply Chain Management awards
Profile and Corporate Governance
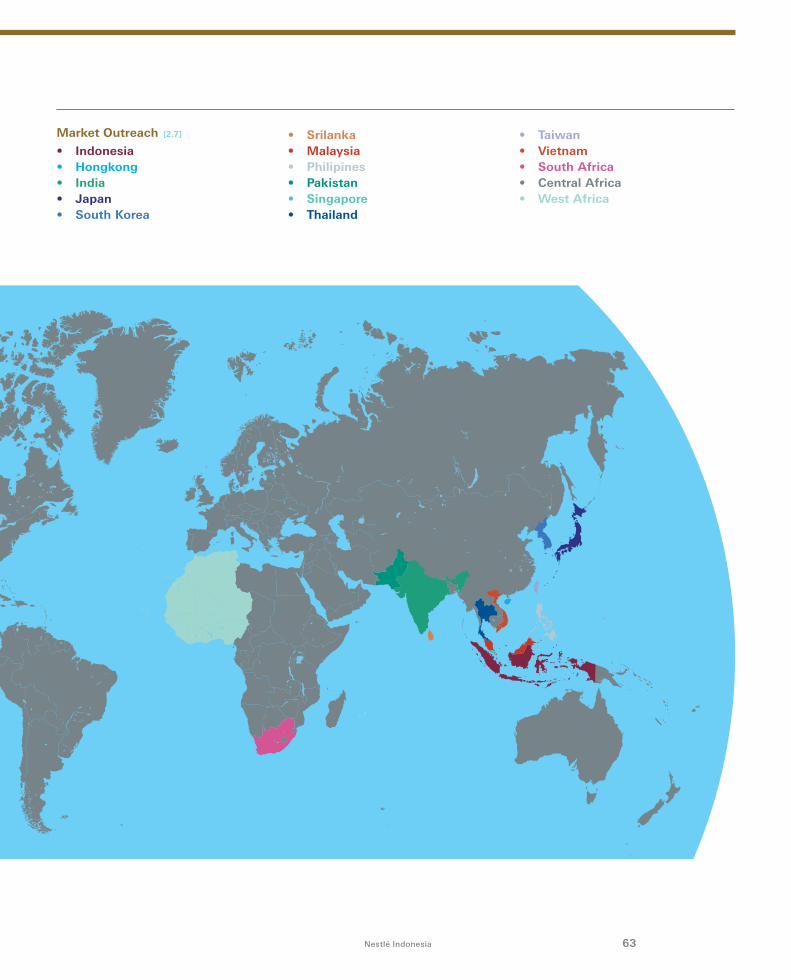
63Nestlé Indonesia
Market Outreach [2.7]
• Indonesia• Hongkong• India• Japan• South Korea
• Srilanka• Malaysia• Philipines• Pakistan• Singapore• Thailand
• Taiwan• Vietnam• South Africa• Central Africa • West Africa
64 Creating Shared Value
Green PROPER“Hijau” or Green rating for 2009–2010 Program Penilaian Peringkat Kinerja Perusahaan (PROPER) or Company Performance Evaluation Report Program by the Indonesian Ministry of Environment awarded for Nestlé factory in Kejayan, Pasuruan, East Java.
Halal Assurance SystemAttained certification on Sistem Jaminan Halal (or Halal Assurance System) Category “A” from Lembaga Pengkajian Pangan, Obat-obatan dan Kosmetika Majelis Ulama Indonesia (LPPOM MUI) or Indonesian Ulema Council’s Food, Medicine and Cosmetics Analysis Institution. [4.12]
ISO Certification: [4.12] [FP5]
• ISO 9001 (Quality Management Systems)
• ISO 14001 (Environment Management Systems)
• OHSAS 18001 (Health, Safety and Environment Management Systems)
• Food Safety System Certification 22000 adhere to ISO 22000 and PAS 220 (Food Security Management Systems)
Governance Structure and Organization
In compliance with Law No. 40 of 2007 on Limited Liability Company, the company organizational structure for governance is the two boards system consisting of the Board of Commissioners and the Board of Directors. There is no member of the Board of Commissioners who serves on the Board of Directors, and vice versa. [4.1] [4.2] [4.3]
The Board of Commissioners does not have any independent Commissioner nor supporting
committee, neither on permanent nor on ad-hoc basis with particular responsibilities. The membership of the Board of Commisioners is stipulated in the articles of incorporation of the company and appointed by the General Meeting of Shareholders. [4.1] [4.7]
The members of the Board of Directors are appointed in line with Law No. 40 year 2007 on Limited Liability Company and the company’s articles of incorporation. In this respect, shareholders of the company will nominate the candidates of the Board of Directors, for the approval and appointment by the General Meeting of Shareholders. The process is organized by the Legal department. The requirement to become a member of the Board of Directors are set out in article 93 of the Law No. 40 year 2007 on Limited Liability Company. [4.7] [HR4]
To identify or to manage the company
reputation and CSV programs appropriately, Nestlé regularly conducts Corporate Equity Monitor (CEM), yearly consumers survey and evaluation of CSV programs. CEM and consumers survey results become the benchmark of our efforts in building corporate reputation and evaluate the programs’ benefits to society. These activities are part of the function, tasks and authority of the Board of Directors. Therefore, the Board of Directors’ performance is not only evaluated merely based on economic performance, but also based on social and environmental performances. [4.9]
[4.10]
On regular basis the Board of Commissioners and the Board of Directors meet with shareholders either in general or extraordinary meeting of shareholders. In these meetings, the shareholders can give recommendation or necessary feedback both to the Board of
Profile and Corporate Governance
Board of Commisioners Board of Directors
Nandu NandkishorePresident Commissioner
Low Kim FuiCommissioner
Jean Daniel LuthiCommissioner
Pierre StreitCommissioner
Frederik Bernard George TumbuanCommissioner
James Daniel TabalujanCommissioner
Ramos SihombingCommissioner
M. Arshad ChaudhryPresident Director
Thomas KellerDirector
Gideon Stefanus DuPlessisDirector
Riauadi Wisman DjajaDirector
Benyamin WijayaDirector
Joselito Junior Aguiling AvancenaDirector
Debora R. TjandrakusumaDirector
65Nestlé Indonesia
Commissioners or the Board of Directors. [4.4]
On regular basis the Board of Commissioners and the Board of Directors meet in the Board of Commissioners meetings. In these meetings, the Board of Commissioners receives an explanation about the condition, situation and operation of the company, and the Board of Commissioners can give their opinion, recommendation and advice to the Board of Directors. [4.4]
Given our way of doing business, which emphasize on creating shared value, the performance of the Board of Directors is not merely appraised by the achievement of financial targets, but also on the overall aspects that include compliance, sustainability and creating shared value. In line with the stipulations of the Law No. 40 year 2007 on Limited Liability Company and the company’s articles of incorporation, the remuneration of all members of the Board of Commissioners and the Board of Directors is decided by the general meeting of shareholders. [4.5]
Conflict of Interest and CorruptionTo avoid conflict of interest, we have Nestlé Corporate Business Principles (NCBP) and Code of Business Conduct (CoBC) that explain how to implement minimum standard of compliance practice in details. Thanks to the compliance by the management and employee of Nestlé, there was no conflict of interest identified during 2011 and 2012. [4.6]
* Further information on NCBP: http://www.nestle.co.id/ina/tentangnestle corporatebusinessprinciple
Through internal control, Nestlé ensures that business processes are
conducted ethically in line with NCBP and CoBC, and we did not identify any indication of corruption practice throughout entire business units. Therefore, the company had not been inflicted with any legal action related to corruption by any parties. [SO2] [SO4]
Each supplier is obliged to adhere to the Nestlé Supplier Code attached to each contract before becoming our supplier. Suppliers for certain raw or packaging materials are required to undergo a responsible sourcing audit which is regularly conducted by a third party. [HR2]
Fair Business Competition [SO3] [SO7]
Nestlé believes in the importance of free competition and all employees must adhere to the anti trust regulations. All of our employees, especially those involved in marketing, sales and purchasing or who are in regular contact with competitors, must ensure that they are familiar with the applicable competition laws, and regular training on anti trust are provided for them. During the reporting period, the company has not been challenged by any legal charge due to unfair business practice
Political Activity [SO6] [SO8]
Election laws in many jurisdictions generally prohibit political contributions by corporations to political parties or candidates. In relation to general election, our policy is to be neutral on any political activity, and Nestlé has adopted a policy to not make any political contributions to political parties or candidates. Risk Management [4.11]
In managing risk and its impact to the company’s operation, Nestlé has its own crisis management procedure and business continuity plans. These
have enabled us to ensure the safety of our people and our assets. During the reporting period, there was no disaster or significant risk occured.
Stakeholders Engagement [4.14] [4.15]
[4.16] [4.17]
We understand the importance of building and maintaining good relationships with all our stakeholders along our value chains and also community leaders, academia, professionals, social institutions, business associations, central and regional governments, media and the society at large. We have conducted a survey to understand how our internal and external stakeholders rate our company reputation. Our internal stakeholders in the survey were our employees, and stakeholders were represented by non-profit organizations. The survey conducted by the Polling Center covers products, work environment, economic performance, and social responsibility. Based on the survey, Nestlé’s internal stakeholders rate Nestlé’s reputation at 8.2 and external stakeholders rate us at 7.3. These figures can be categorized as good with a maximum point of 10.
The company has mapped stakeholders who directly influence and are influenced by Nestlé’s presence. Our stakeholders include shareholder, employees, dairy farmers, coffee and cocoa farmers, cooperatives, distributors, shop owners, consumers, academia, professionals, non-profit organisations, governments, associations and media.
We are also guided by various international conventions which have also become our guidelines in doing business, and the compliance with these is also included in the audit system. [4.12]
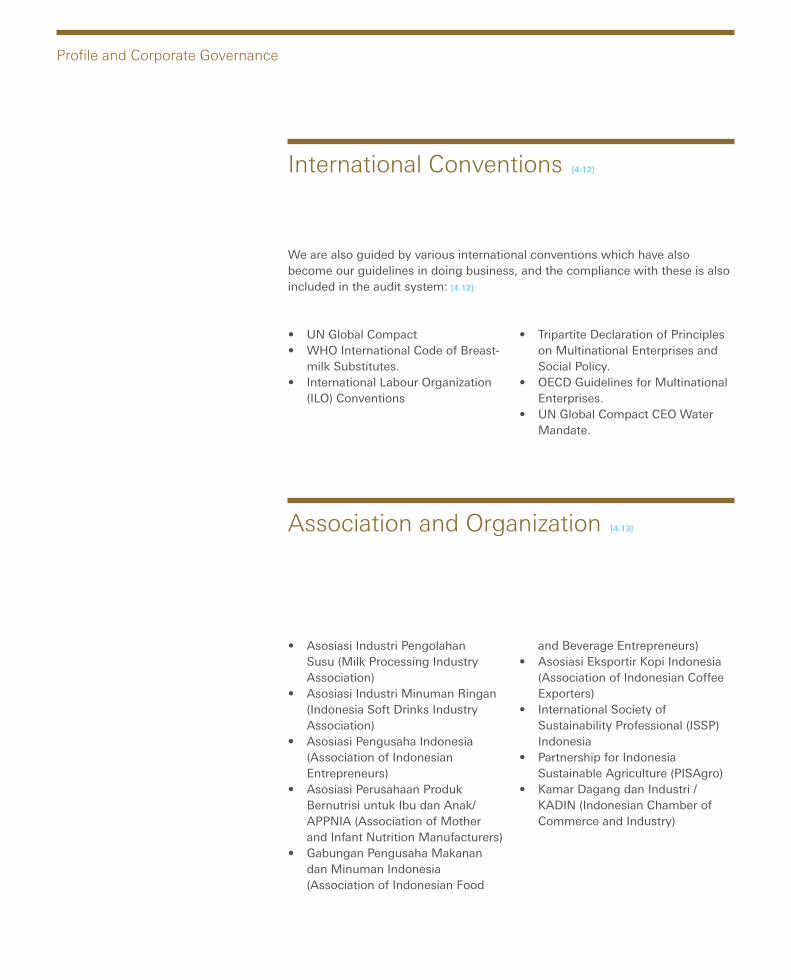
• UN Global Compact• WHO International Code of Breast-
milk Substitutes.• International Labour Organization
(ILO) Conventions
• Asosiasi Industri Pengolahan Susu (Milk Processing Industry Association)
• Asosiasi Industri Minuman Ringan (Indonesia Soft Drinks Industry Association)
• Asosiasi Pengusaha Indonesia (Association of Indonesian Entrepreneurs)
• Asosiasi Perusahaan Produk Bernutrisi untuk Ibu dan Anak/APPNIA (Association of Mother and Infant Nutrition Manufacturers)
• Gabungan Pengusaha Makanan dan Minuman Indonesia (Association of Indonesian Food
and Beverage Entrepreneurs)• Asosiasi Eksportir Kopi Indonesia
(Association of Indonesian Coffee Exporters)
• International Society of Sustainability Professional (ISSP) Indonesia
• Partnership for Indonesia Sustainable Agriculture (PISAgro)
• Kamar Dagang dan Industri /KADIN (Indonesian Chamber of Commerce and Industry)
International Conventions [4.12]
Association and Organization [4.13]
We are also guided by various international conventions which have also become our guidelines in doing business, and the compliance with these is also included in the audit system: [4.12]
• Tripartite Declaration of Principles on Multinational Enterprises and Social Policy.
• OECD Guidelines for Multinational Enterprises.
• UN Global Compact CEO Water Mandate.
Profile and Corporate Governance
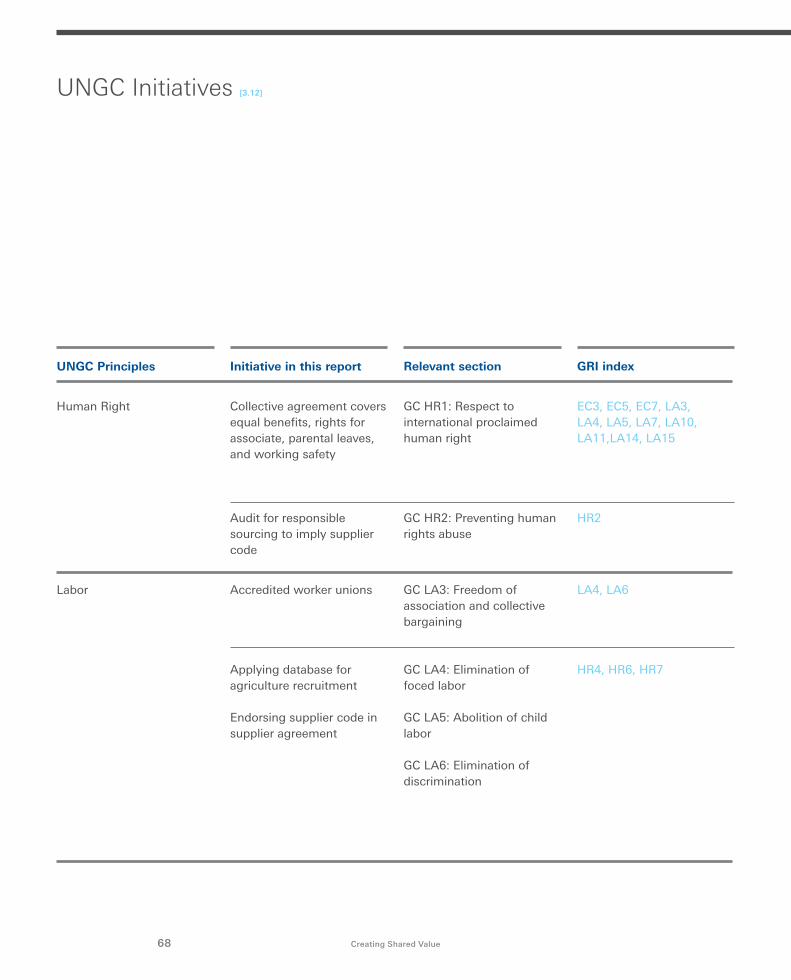
68 Creating Shared Value
UNGC Principles
Human Right
Labor
Initiative in this report
Collective agreement covers equal benefits, rights for associate, parental leaves, and working safety
Audit for responsible sourcing to imply supplier code
Accredited worker unions
Applying database for agriculture recruitment
Endorsing supplier code in supplier agreement
GC HR2: Preventing human rights abuse
GC LA3: Freedom of association and collective bargaining
GC LA4: Elimination of foced labor
GC LA5: Abolition of child labor
GC LA6: Elimination of discrimination
Relevant section
GC HR1: Respect to international proclaimed human right
GRI index
UNGC Initiatives [3.12]
HR2
LA4, LA6
HR4, HR6, HR7
EC3, EC5, EC7, LA3, LA4, LA5, LA7, LA10, LA11,LA14, LA15
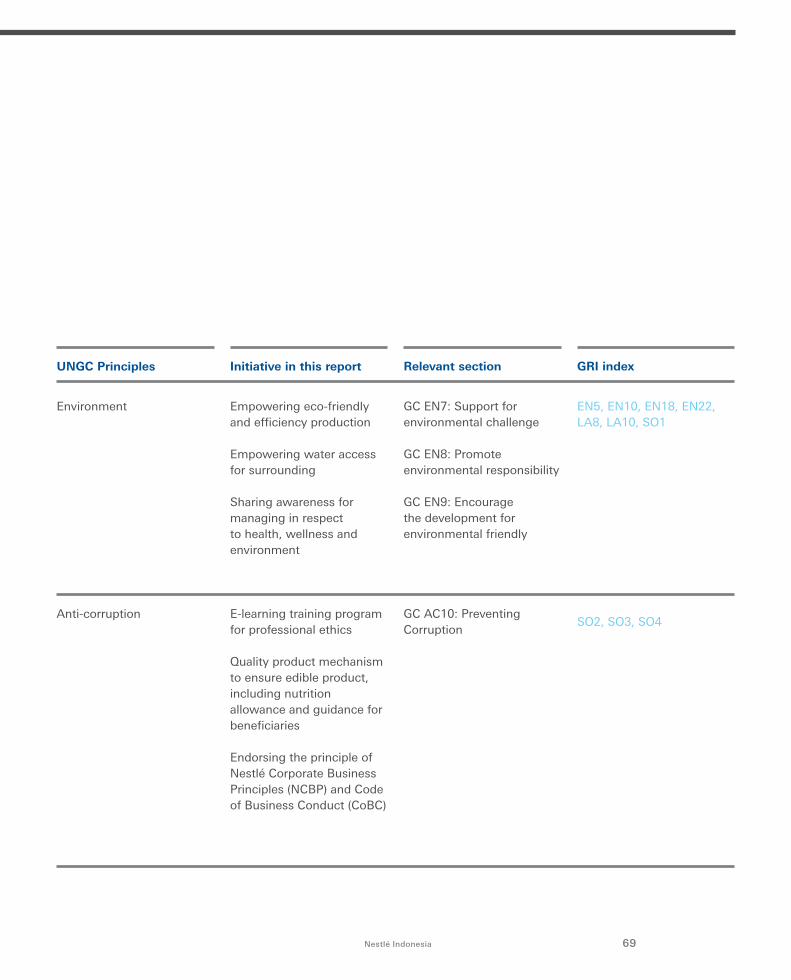
69Nestlé Indonesia
UNGC Principles
Environment
Anti-corruption
Initiative in this report
Empowering eco-friendly and efficiency production
Empowering water access for surrounding
Sharing awareness for managing in respect to health, wellness and environment
E-learning training program for professional ethics
Quality product mechanism to ensure edible product, including nutrition allowance and guidance for beneficiaries
Endorsing the principle of Nestlé Corporate Business Principles (NCBP) and Code of Business Conduct (CoBC)
GC EN7: Support for environmental challenge
GC EN8: Promote environmental responsibility
GC EN9: Encourage the development for environmental friendly
GC AC10: Preventing Corruption
Relevant section GRI index
EN5, EN10, EN18, EN22, LA8, LA10, SO1
SO2, SO3, SO4
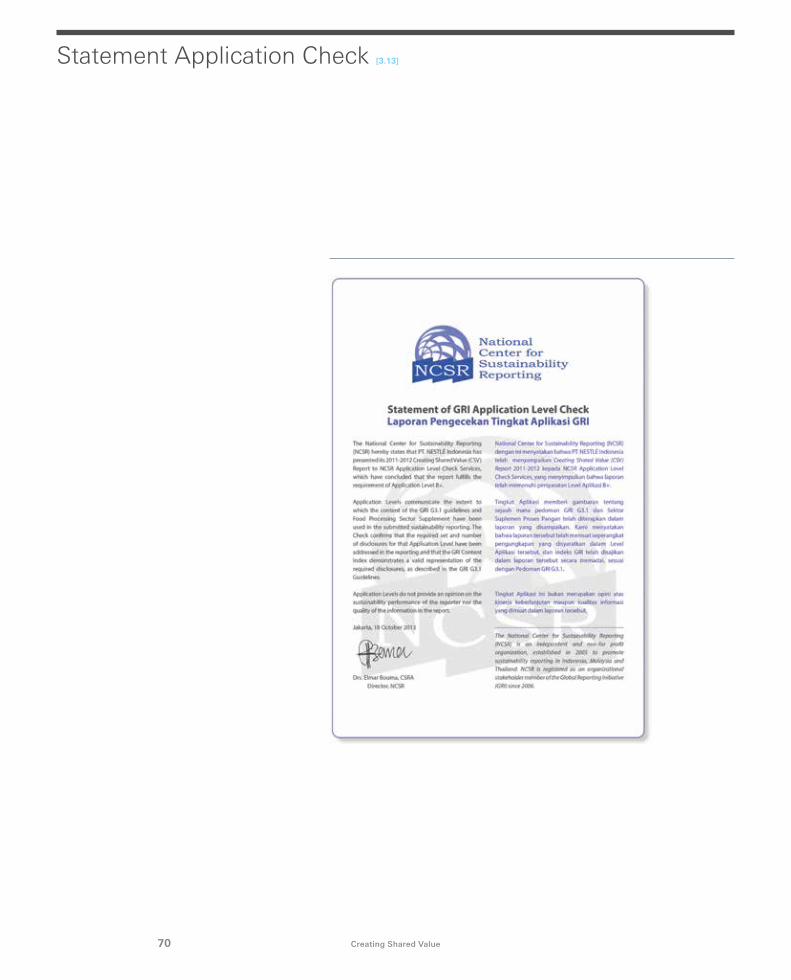
Statement Application Check [3.13]
70 Creating Shared Value
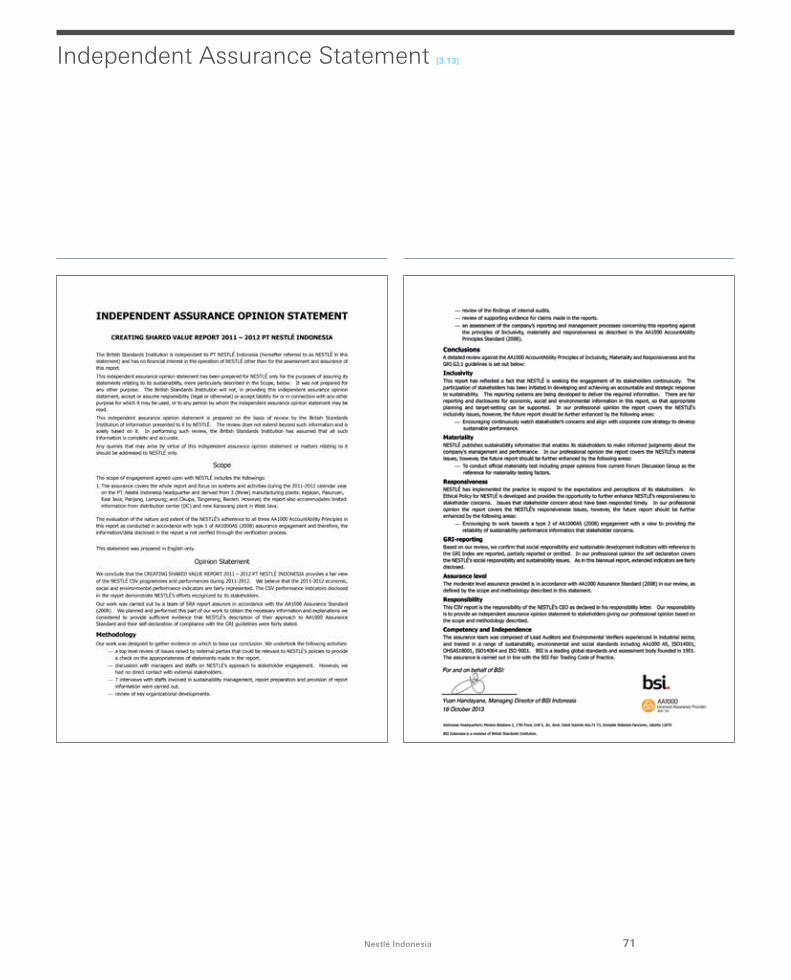
Independent Assurance Statement [3.13]
71Nestlé Indonesia
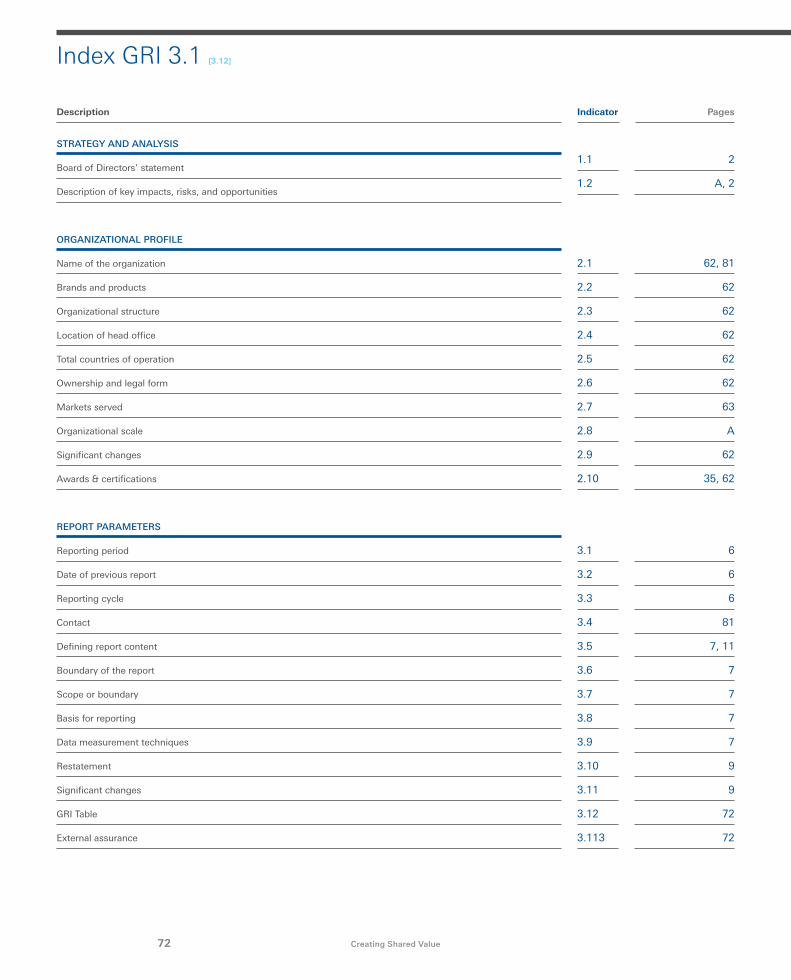
Index GRI 3.1 [3.12]
72 Creating Shared Value
1.1
1.2
2.1
2.2
2.3
2.4
2.5
2.6
2.7
2.8
2.9
2.10
3.1
3.2
3.3
3.4
3.5
3.6
3.7
3.8
3.9
3.10
3.11
3.12
3.113
STRATEGY AND ANALYSIS
Board of Directors’ statement
Description of key impacts, risks, and opportunities
ORGANIZATIONAL PROFILE
Name of the organization
Brands and products
Organizational structure
Location of head office
Total countries of operation
Ownership and legal form
Markets served
Organizational scale
Significant changes
Awards & certifications
REPORT PARAMETERS
Reporting period
Date of previous report
Reporting cycle
Contact
Defining report content
Boundary of the report
Scope or boundary
Basis for reporting
Data measurement techniques
Restatement
Significant changes
GRI Table
External assurance
Description PagesIndicator
2
A, 2
62, 81
62
62
62
62
62
63
A
62
35, 62
6
6
6
81
7, 11
7
7
7
7
9
9
72
72
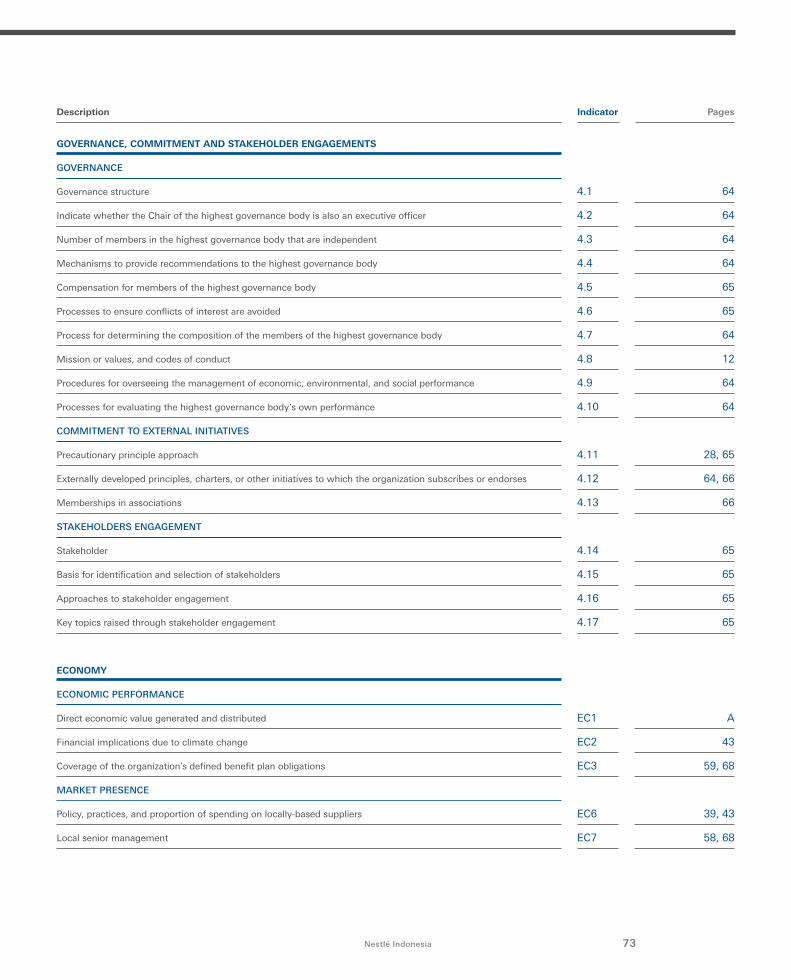
73Nestlé Indonesia
EC6
EC7
4.1
4.2
4.3
4.4
4.5
4.6
4.7
4.8
4.9
4.10
4.11
4.12
4.13
4.14
4.15
4.16
4.17
EC1
EC2
EC3
GOVERNANCE, COMMITMENT AND STAKEHOLDER ENGAGEMENTS
GOVERNANCE
Governance structure
Indicate whether the Chair of the highest governance body is also an executive officer
Number of members in the highest governance body that are independent
Mechanisms to provide recommendations to the highest governance body
Compensation for members of the highest governance body
Processes to ensure conflicts of interest are avoided
Process for determining the composition of the members of the highest governance body
Mission or values, and codes of conduct
Procedures for overseeing the management of economic, environmental, and social performance
Processes for evaluating the highest governance body’s own performance
COMMITMENT TO EXTERNAL INITIATIVES
Precautionary principle approach
Externally developed principles, charters, or other initiatives to which the organization subscribes or endorses
Memberships in associations
STAKEHOLDERS ENGAGEMENT
Stakeholder
Basis for identification and selection of stakeholders
Approaches to stakeholder engagement
Key topics raised through stakeholder engagement
ECONOMY
ECONOMIC PERFORMANCE
Direct economic value generated and distributed
Financial implications due to climate change
Coverage of the organization’s defined benefit plan obligations
MARKET PRESENCE
Policy, practices, and proportion of spending on locally-based suppliers
Local senior management
Description PagesIndicator
64
64
64
64
65
65
64
12
64
64
28, 65
64, 66
66
65
65
65
65
A
43
59, 68
39, 43
58, 68
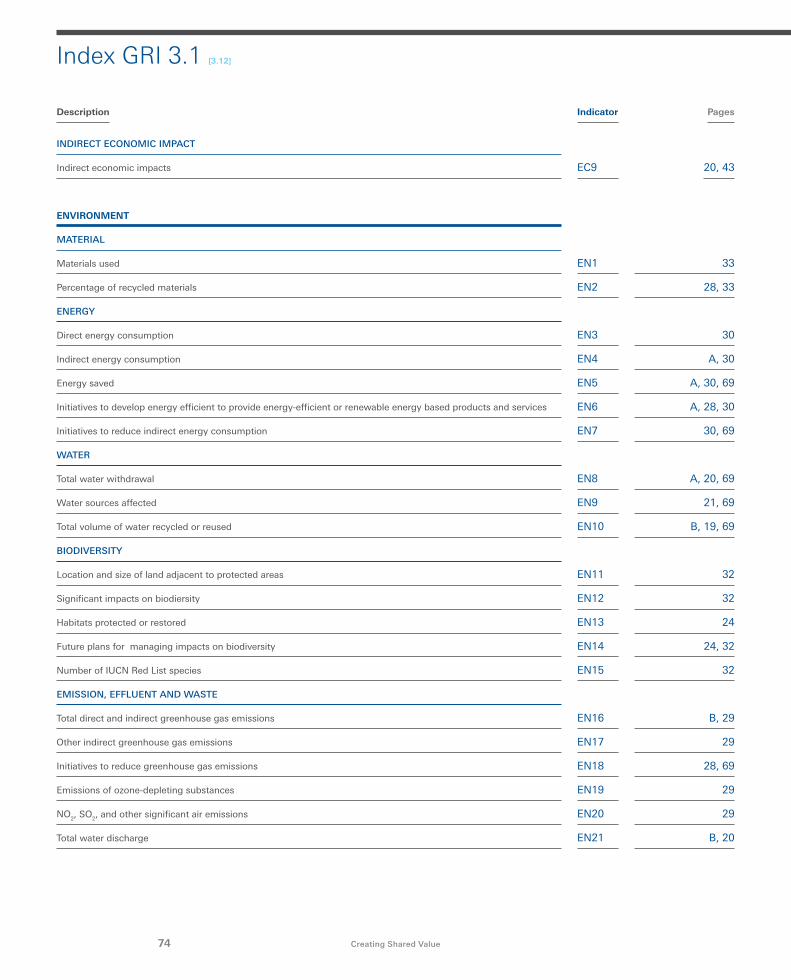
74 Creating Shared Value
INDIRECT ECONOMIC IMPACT
Indirect economic impacts
ENVIRONMENT
MATERIAL
Materials used
Percentage of recycled materials
ENERGY
Direct energy consumption
Indirect energy consumption
Energy saved
Initiatives to develop energy efficient to provide energy-efficient or renewable energy based products and services
Initiatives to reduce indirect energy consumption
WATER
Total water withdrawal
Water sources affected
Total volume of water recycled or reused
BIODIVERSITY
Location and size of land adjacent to protected areas
Significant impacts on biodiersity
Habitats protected or restored
Future plans for managing impacts on biodiversity
Number of IUCN Red List species
EMISSION, EFFLUENT AND WASTE
Total direct and indirect greenhouse gas emissions
Other indirect greenhouse gas emissions
Initiatives to reduce greenhouse gas emissions
Emissions of ozone-depleting substances
NO2, SO2, and other significant air emissions
Total water discharge
EC9
EN1
EN2
EN3
EN4
EN5
EN6
EN7
EN8
EN9
EN10
EN11
EN12
EN13
EN14
EN15
EN16
EN17
EN18
EN19
EN20
EN21
Index GRI 3.1 [3.12]
Description PagesIndicator
33
28, 33
30
A, 30
A, 30, 69
A, 28, 30
30, 69
A, 20, 69
21, 69
B, 19, 69
32
32
24
24, 32
32
B, 29
29
28, 69
29
29
B, 20
20, 43
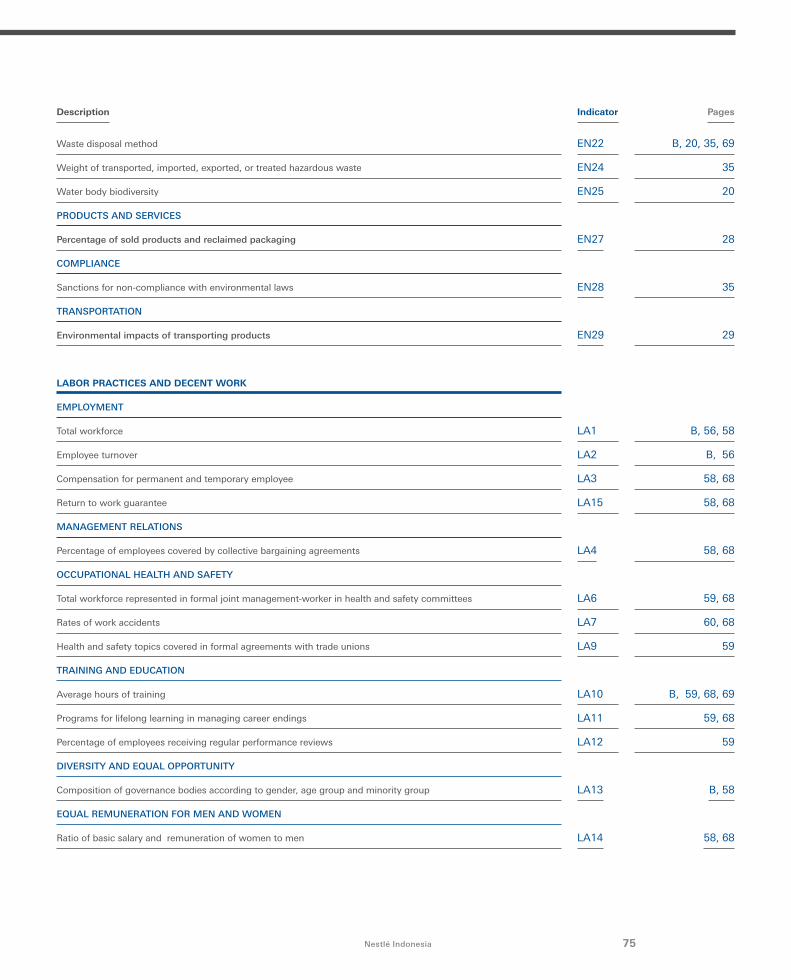
75Nestlé Indonesia
Waste disposal method
Weight of transported, imported, exported, or treated hazardous waste
Water body biodiversity
PRODUCTS AND SERVICES
Percentage of sold products and reclaimed packaging
COMPLIANCE
Sanctions for non-compliance with environmental laws
TRANSPORTATION
Environmental impacts of transporting products
LABOR PRACTICES AND DECENT WORK
EMPLOYMENT
Total workforce
Employee turnover
Compensation for permanent and temporary employee
Return to work guarantee
MANAGEMENT RELATIONS
Percentage of employees covered by collective bargaining agreements
OCCUPATIONAL HEALTH AND SAFETY
Total workforce represented in formal joint management-worker in health and safety committees
Rates of work accidents
Health and safety topics covered in formal agreements with trade unions
TRAINING AND EDUCATION
Average hours of training
Programs for lifelong learning in managing career endings
Percentage of employees receiving regular performance reviews
DIVERSITY AND EQUAL OPPORTUNITY
Composition of governance bodies according to gender, age group and minority group
EQUAL REMUNERATION FOR MEN AND WOMEN
Ratio of basic salary and remuneration of women to men
LA1
LA2
LA3
LA15
LA4
LA6
LA7
LA9
LA10
LA11
LA12
LA13
LA14
EN22
EN24
EN25
EN27
EN28
EN29
Description PagesIndicator
B, 20, 35, 69
35
20
28
B, 56, 58
B, 56
58, 68
58, 68
59, 68
60, 68
59
B, 59, 68, 69
59, 68
59
35
29
B, 58
58, 68
58, 68
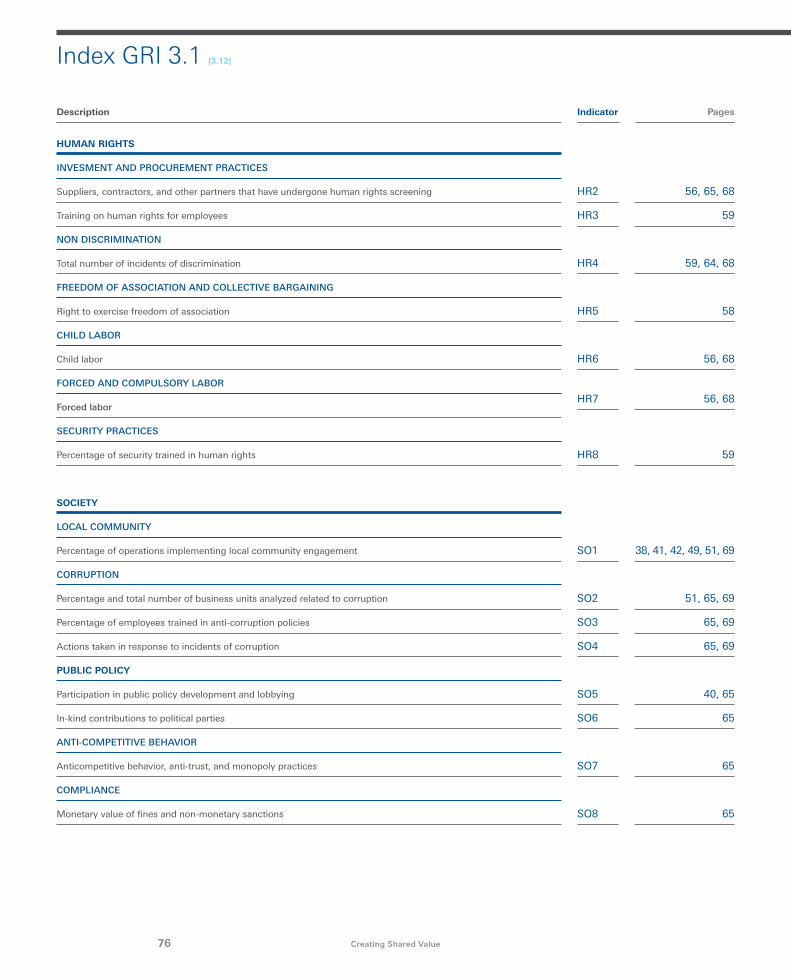
76 Creating Shared Value
HUMAN RIGHTS
INVESMENT AND PROCUREMENT PRACTICES
Suppliers, contractors, and other partners that have undergone human rights screening
Training on human rights for employees
NON DISCRIMINATION
Total number of incidents of discrimination
FREEDOM OF ASSOCIATION AND COLLECTIVE BARGAINING
Right to exercise freedom of association
CHILD LABOR
Child labor
FORCED AND COMPULSORY LABOR
Forced labor
SECURITY PRACTICES
Percentage of security trained in human rights
SOCIETY
LOCAL COMMUNITY
Percentage of operations implementing local community engagement
CORRUPTION
Percentage and total number of business units analyzed related to corruption
Percentage of employees trained in anti-corruption policies
Actions taken in response to incidents of corruption
PUBLIC POLICY
Participation in public policy development and lobbying
In-kind contributions to political parties
ANTI-COMPETITIVE BEHAVIOR
Anticompetitive behavior, anti-trust, and monopoly practices
COMPLIANCE
Monetary value of fines and non-monetary sanctions
HR7
HR8
SO1
HR2
HR3
SO2
SO3
SO4
SO5
SO6
HR4
HR5
HR6
SO7
SO8
Index GRI 3.1 [3.12]
Description PagesIndicator
56, 68
59
59, 64, 68
58
65
65
56, 68
38, 41, 42, 49, 51, 69
51, 65, 69
65, 69
65, 69
40, 65
65
56, 65, 68
59
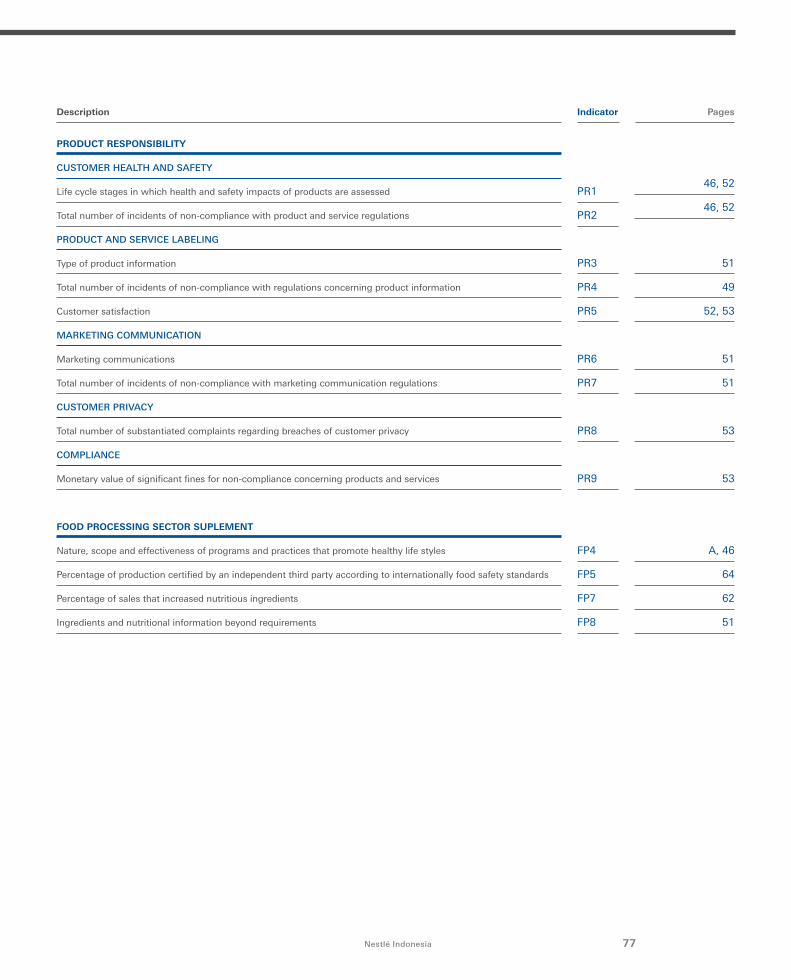
77Nestlé Indonesia
PRODUCT RESPONSIBILITY
CUSTOMER HEALTH AND SAFETY
Life cycle stages in which health and safety impacts of products are assessed
Total number of incidents of non-compliance with product and service regulations
PRODUCT AND SERVICE LABELING
Type of product information
Total number of incidents of non-compliance with regulations concerning product information
Customer satisfaction
MARKETING COMMUNICATION
Marketing communications
Total number of incidents of non-compliance with marketing communication regulations
CUSTOMER PRIVACY
Total number of substantiated complaints regarding breaches of customer privacy
COMPLIANCE
Monetary value of significant fines for non-compliance concerning products and services
FOOD PROCESSING SECTOR SUPLEMENT
Nature, scope and effectiveness of programs and practices that promote healthy life styles
Percentage of production certified by an independent third party according to internationally food safety standards
Percentage of sales that increased nutritious ingredients
Ingredients and nutritional information beyond requirements
PR3
PR4
PR5
PR6
PR7
PR1
PR2
PR8
PR9
FP4
FP5
FP7
FP8
Description PagesIndicator
53
53
A, 46
64
62
51
46, 52
46, 52
51
51
51
49
52, 53
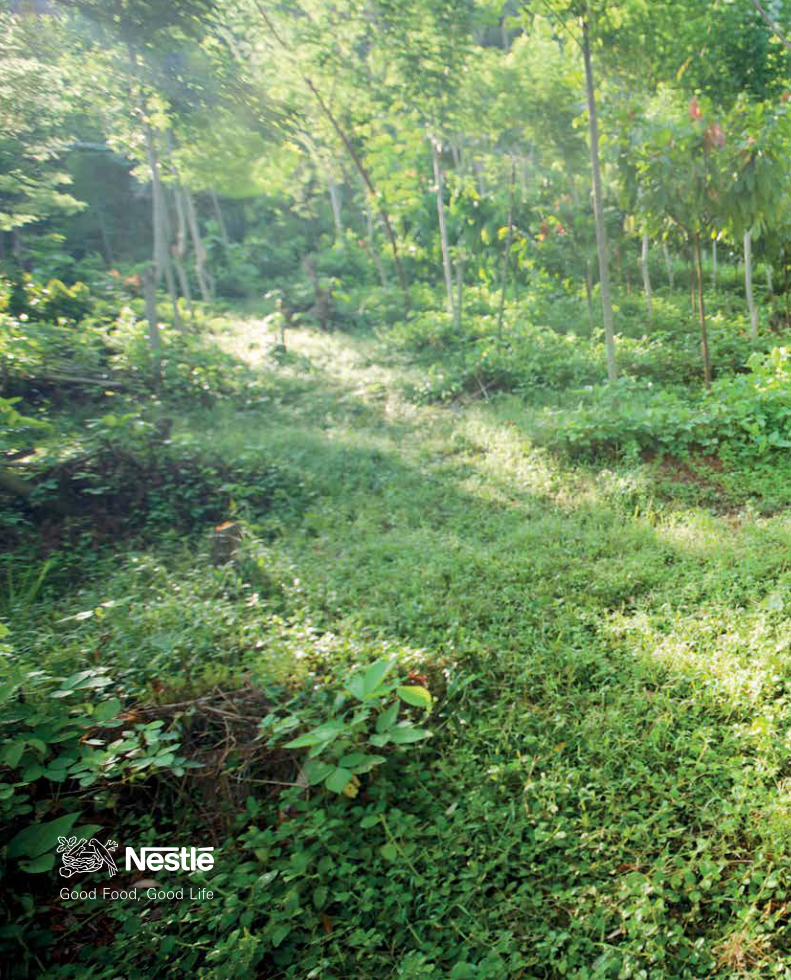
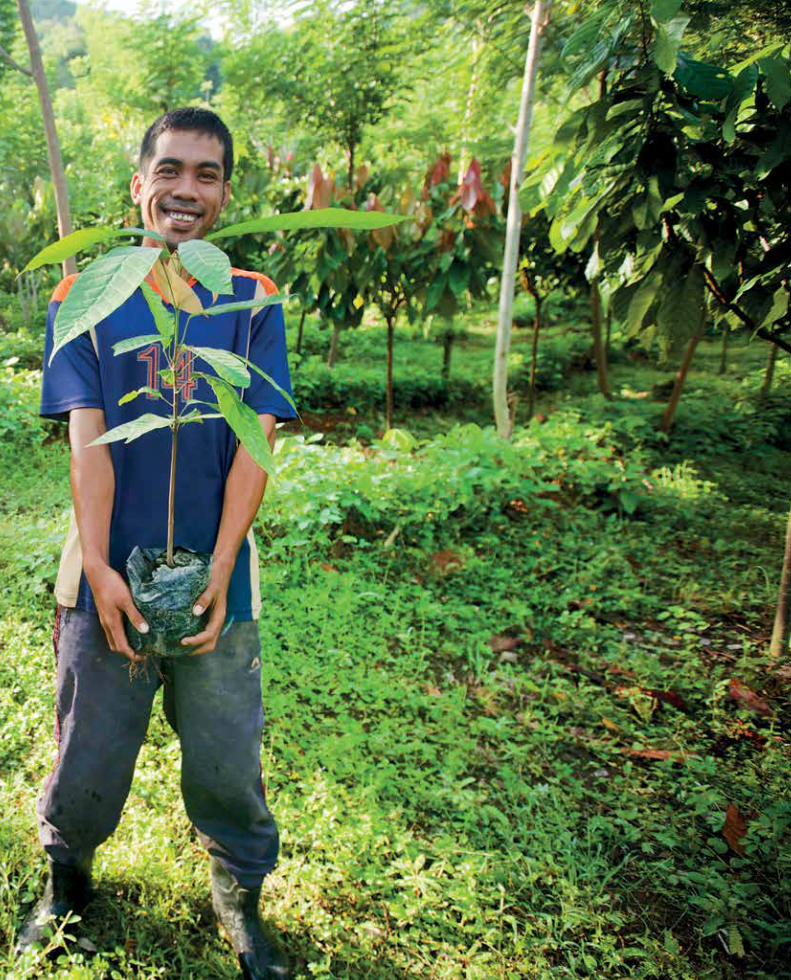
80 Creating Shared Value
A
APPNIA
Asosiasi Perusahaan Produk
Bernutrisi untuk Ibu dan Anak
APSAI
Asosiasi Perusahaan Sayang
Anak Indonesia
B
BATITA
(Anak) Bawah Tiga Tahun
(children under three years old)
BSI
British Standard Institution
C
CEM
Corporate Equity Monitor
CITES
Convention on International
Trade in Endangered Spesies of
Wild Fauna and Flora
CLA
Collective Labour Agreement
COA
Certificate of Analysis
CoBC
Code of Business Conduct
COC
Certificate of Compliance
Co-generation plant
Jointly power supply
CSR
Corporate Social Responsibility
CSV
Creating Shared Value
D
DC
Distribution Center
E
ETS
Energy Target Setting
F
FKBNIP
Forum Keluarga Buruh Nestle
Indonesia Panjang
G
GHG
Green House Gas
GRI
Global Reporting Initiative
H
HFO
Heavy Fuel Oil
HIVOS
Humanist Institute for
Development Cooperation
HSFO
High Sulfur Fuel Oil
I
ICCRI
Indonesian Coffee and Cocoa
Research Institute
IGCN
Indonesia Global Compact
Network
ILO
International Labour
Organization
ISRA
Indonesia Sustainability
Reporting Award
ISSP
International Society of
Sustainability Professional
IUCN
International Union for the
Conservation of Nature and
Natural Resources
IWMWG
Indonesia Water Mandate
Working Group
J
Jamsostek
Jaminan Sosial Tenaga Kerja/
Social security
JHT
Jaminan Hari Tua
JI10K
Jakarta International 10K
K
KADIN
Kamar Dagang dan Industri /
Chambers of commerce and
industry
KPIS
Key Performance Indicators
L
LFO
Light Fuel Oil
LPPOM MUI
Lembaga Pengkajian Pangan,
Obat-obatan dan Kosmetika
Majelis Ulama Indonesia
LSM
Lembaga Swadaya
Masyarakat/Non-governmental
organizations
M
MDGs
Millenium Development Goals
MP3EI
Masterplan Percepatan dan
Perluasan Pembangunan
Ekonomi Indonesia
N
NCA
Nutrition Competitive
Advantage
NCBP
The Nestlé Corporate Business
Principles
NCE
Nestlé Continuous Excellent
NCS
Nestlé Consumer Services
NCSR
National Centre for Sustainable
Reporting
NF
Nutritional Foundation
NHK
Nestlé Healthy Kids
NNI
Nestlé Nutrition Institute
P
PBSI
Indonesian Badminton
Association
PDGMI
Association of Indonesian
Medical Nutrition Doctors
PISAgro
Partnership for Indonesia’s
Sustainable Agriculture
PLN
State owned electricity
company
PROPER
Company Performance
Evaluation Report Program
S
SAIN
Sustainable Agriculture
Initiative Nestlé
SBNI
Serikat Buruh Nestlé Indonesia/
Labour Union of Nestlé
Indonesia
SHE
Safety, Health and Environment
T
TAT
Tumbuh-Aktif-Tanggap
TNBBS
Taman Nasional Bukit Barisan
Selatan
U
UNDP
United Nations Development
Programme
UNGC
United Nations Global Compact
USAID
United States Agency for
International Development
W
WHO
World Health Organization
WWF
World Wildlife Fund
WWTP
Waste Water Treatment Plant
Glossary
81Nestlé Indonesia
Feedback FormWe would appreciate your feedback after reading this CSV report by sending the form through email, fax or mail.
Your Profile
Name (if you wish)
Institution/Company
Phone/Mobile
Stakeholder Group
o Government
o NGO
o Corporate
o Community
oMedia
o Academician
o Others, please state:
Please choose the most
appropriate answer
This report is useful to you:
o Strongly disagree
o Disagree
o Neutral
o Agree
o Strongly Agree
This report describes the
Company’s performance in
sustainability development:
o Strongly disagree
o Disagree
o Neutral
o Agree
o Strongly Agree
This report is easy to
understand:
o Strongly disagree
o Disagree
o Neutral
o Agree
o Strongly Agree
This report is interesting:
o Strongly disagree
o Disagree
o Neutral
o Agree
o Strongly Agree
This report increases your trust
in the Company’s sustainability:
o Strongly disagree
o Disagree
o Neutral
o Agree
o Strongly Agree
Please answer questions
below
Which part of this report is
most useful to you?
Which part of this report is less
useful to you?
Which part of this report is the
most interesting to you?
Which part of this report is less
interesting to you?
Please give us your advice/
suggestions/comments about
this report?
Thank you for your
participation
Kindly send this form to:
PT Nestlé Indonesia
[2.1] [3.4]
Perkantoran Hijau Arkadia
Jl. Let. Jen. TB. Simatupang Kav. 88
Jakarta 12520, Indonesia
Phone
+62 21 7883 6000
Fax
+62 21 7883 6001
www.nestle.co.id
"
© November 2013
Nestlé Indonesia
PT Nestlé Indonesia
Perkantoran Hijau Arkadia
Jl. Let. Jen. TB. Simatupang Kav. 88
Jakarta 12520, Indonesia
Phone
+62 21 7883 6000
Fax
+62 21 7883 6001
Printed in Jakarta, Indonesia
This report is printed on
Finch Fine Bright White, a paper produced from well-
managed forest and other controlled sources certified
by the Forest Stewardship Council (FSC).
www.nestle.co.id