Embed Size (px)
Citation preview
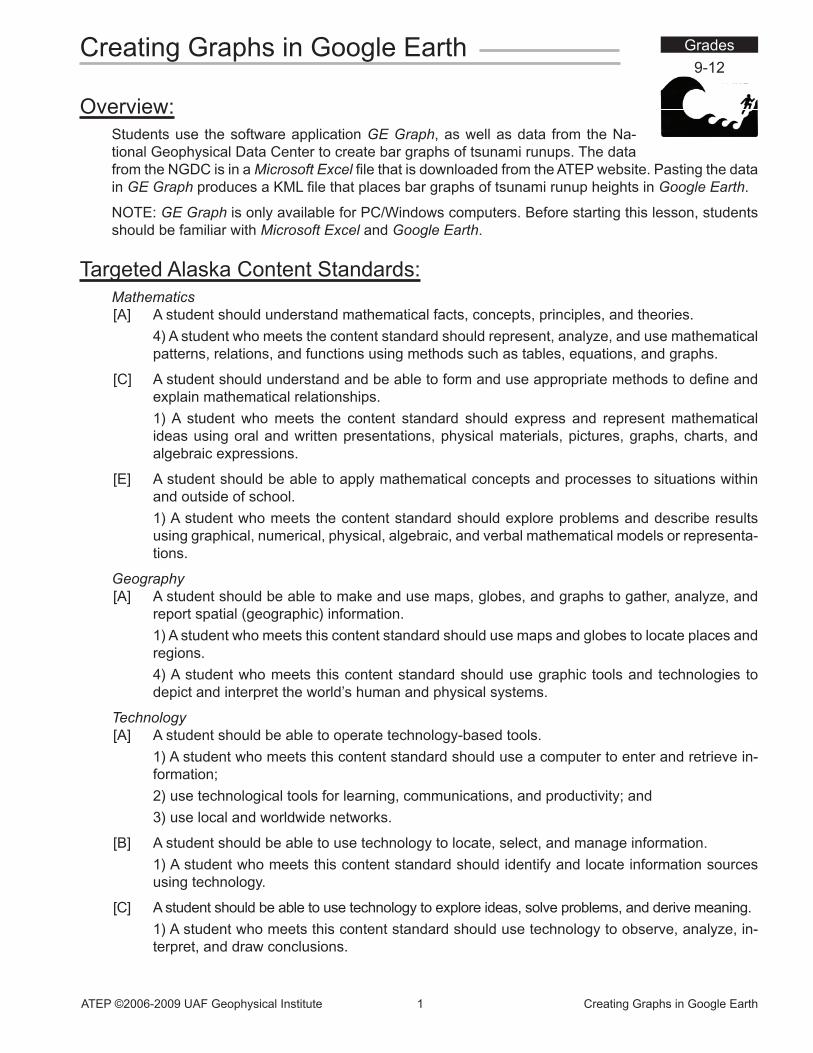
ATEP ©2006-2009 UAF Geophysical Institute 1 Creating Graphs in Google Earth
Overview:Students use the software application GE Graph, as well as data from the Na-tional Geophysical Data Center to create bar graphs of tsunami runups. The data from the NGDC is in a Microsoft Excel file that is downloaded from the ATEP website. Pasting the data in GE Graph produces a KML file that places bar graphs of tsunami runup heights in Google Earth.
NOTE: GE Graph is only available for PC/Windows computers. Before starting this lesson, students should be familiar with Microsoft Excel and Google Earth.
Targeted Alaska Content Standards:Mathematics[A] A student should understand mathematical facts, concepts, principles, and theories.
4) A student who meets the content standard should represent, analyze, and use mathematical patterns, relations, and functions using methods such as tables, equations, and graphs.
[C] A student should understand and be able to form and use appropriate methods to define and explain mathematical relationships.
1) A student who meets the content standard should express and represent mathematical ideas using oral and written presentations, physical materials, pictures, graphs, charts, and algebraic expressions.
[E] A student should be able to apply mathematical concepts and processes to situations within and outside of school.
1) A student who meets the content standard should explore problems and describe results using graphical, numerical, physical, algebraic, and verbal mathematical models or representa-tions.
Geography[A] A student should be able to make and use maps, globes, and graphs to gather, analyze, and
report spatial (geographic) information.
1) A student who meets this content standard should use maps and globes to locate places and regions.
4) A student who meets this content standard should use graphic tools and technologies to depict and interpret the world’s human and physical systems.
Technology[A] A student should be able to operate technology-based tools.
1) A student who meets this content standard should use a computer to enter and retrieve in-formation;
2) use technological tools for learning, communications, and productivity; and
3) use local and worldwide networks.
[B] A student should be able to use technology to locate, select, and manage information.
1) A student who meets this content standard should identify and locate information sources using technology.
[C] A student should be able to use technology to explore ideas, solve problems, and derive meaning.
1) A student who meets this content standard should use technology to observe, analyze, in-terpret, and draw conclusions.
Creating Graphs in Google Earth9-12
Grades
ATEP ©2006-2009 UAF Geophysical Institute 2 Creating Graphs in Google Earth
Objectives:The student will:• download, select, copy, and paste data from a Microsoft Excel file;• use GE Graph to create bar graphs of tsunamis for placement in Google Earth; and• analyze spatial data in Google Earth.
Materials:• Computer with Microsoft Excel, Google Earth, and GE Graph installed• Microsoft Excel spreadsheet “Tsunami Excel for GE Graph.xls” • STUDENT WORKSHEET: “Creating Graphs in Google Earth”
Whole Picture:
The National Geophysical Data Center has a large collection of post-event natural hazard data avail-able at http://www.ngdc.noaa.gov/hazard/tsu_db.shtml. Over 400 tsunami runups for Alaska have been copied from NGDC and placed in a Microsoft Excel file. In order to visualize the location where the tsunamis occurred, and the relative magnitude, the software application GE Graph will be used. GE Graph will create a KML file of the data that can be viewed in Google Earth.
NOTE: KML is an acronym for Keyhole Markup Language. It is the language used with Google Earth.
Activity Preparation:1. If not already installed, download and install the program Google Earth at http://earth.google.com for
each computer. Click on the Download button, the Agree and Download button to start the down-load. Double click on the downloaded file to install it.
2. If not already installed, download and the program GE Graph at http://www.sgrillo.net/googleearth/gegraph.htm for each computer. Click on the Download–Full Install to start to the download. Double click on the downloaded file to install it.
Activity Procedure:1. Ask students what part(s) of Alaska has been hit the most by tsunamis (Aleutians, Southeast, Kodiak,
etc.). Ask students if any communities along the Beaufort Sea or Bering Sea have ever been hit by a tsunami. Next, ask if there are any communities along the Gulf of Alaska that have not been hit.
2. Have students download the Microsoft Excel file “Tsunami Excel for GE Graph” from the Grades 9 –12 section of the ATEP website at http://www.aktsunami.com/lessons/GITExercises.html. After downloading the file, students should open the file in Microsoft Excel and scroll through the Latitude and Longitude column. Ask students again if the coordinate information helps in answering how many tsunamis occurred in the Beaufort, Bering Sea or Gulf of Alaska.
3. Guide students through using GE Graph to map in Google Earth the locations where tsunamis have struck Alaska.
ATEP ©2006-2009 UAF Geophysical Institute 3 Creating Graphs in Google Earth
Answers:1. Answers will vary2. No 3. 12.19 meters4. Lituya Bay, 524.26 meters. 5. Yes6. Along the Aleutians and Southcentral coast.7. Attu, Massacre Bay.8. Around Kodiak and the Gulf of Alaska9. Shoup Bay, 67.1 meters. 10. Yes11. No12. Aleutians 13. Unimak Island, 35.05 meters14. Umnak Island (Pacific Coast), 22.8 meters15. It could be used to graph the magnitude of the earthquake at the epicenter of the quake.16. Answers could vary. It could be used to graph populations of countries, energy use, reported cases
of disease, etc. 17. Answers will vary.18. Crescent City, California. 4.79 meters19. Waimea Bay, Hawaii. 4.9 meters.20. No21. 0.4 meters
ATEP ©2006-2009 UAF Geophysical Institute 4 Creating Graphs in Google Earth
Creating Graphs in Google Earth Student Worksheet (page 1 of 7)
Alaska experiences a large number of earthquakes each year. Some past earth-quakes generated devastating tsunamis. The National Geophysical Data Center (NGDC) has a large collection of post-event tsunami data available on its website. Using data from NGDC, and the program GE Graph, a bar graph of past tsunamis will be created that can be viewed in Google Earth.
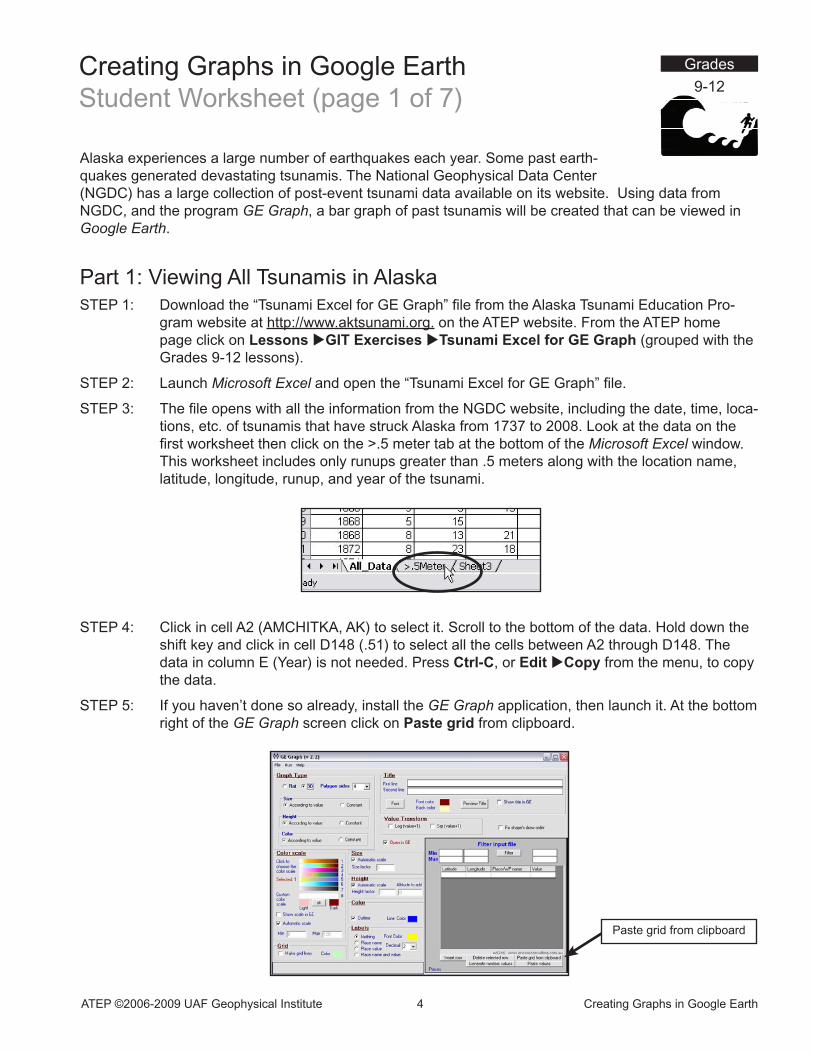
Part 1: Viewing All Tsunamis in AlaskaSTEP 1: Download the “Tsunami Excel for GE Graph” file from the Alaska Tsunami Education Pro-
gram website at http://www.aktsunami.org. on the ATEP website. From the ATEP home page click on Lessons uGIT Exercises uTsunami Excel for GE Graph (grouped with the Grades 9-12 lessons).
STEP 2: Launch Microsoft Excel and open the “Tsunami Excel for GE Graph” file.
STEP 3: The file opens with all the information from the NGDC website, including the date, time, loca-tions, etc. of tsunamis that have struck Alaska from 1737 to 2008. Look at the data on the first worksheet then click on the >.5 meter tab at the bottom of the Microsoft Excel window. This worksheet includes only runups greater than .5 meters along with the location name, latitude, longitude, runup, and year of the tsunami.
STEP 4: Click in cell A2 (AMCHITKA, AK) to select it. Scroll to the bottom of the data. Hold down the shift key and click in cell D148 (.51) to select all the cells between A2 through D148. The data in column E (Year) is not needed. Press Ctrl-C, or Edit uCopy from the menu, to copy the data.
STEP 5: If you haven’t done so already, install the GE Graph application, then launch it. At the bottom right of the GE Graph screen click on Paste grid from clipboard.
9-12
Grades
Paste grid from clipboard
ATEP ©2006-2009 UAF Geophysical Institute 5 Creating Graphs in Google Earth
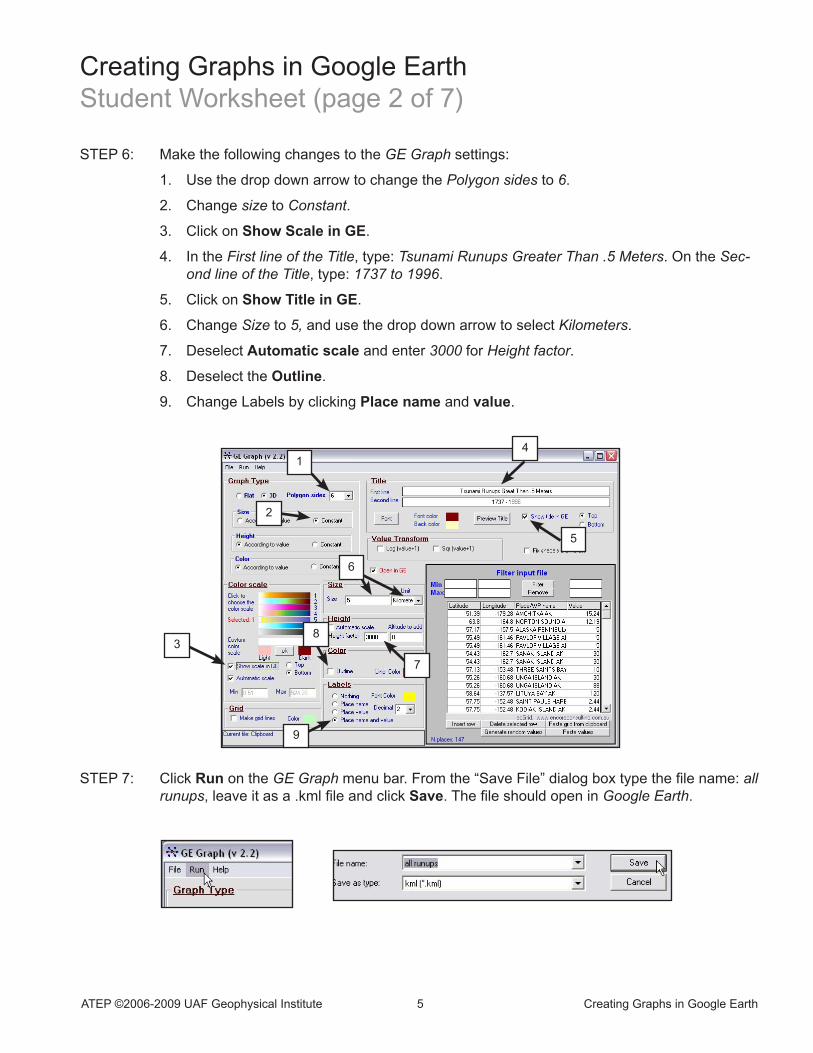
STEP 6: Make the following changes to the GE Graph settings:
1. Use the drop down arrow to change the Polygon sides to 6.
2. Change size to Constant.
3. Click on Show Scale in GE.
4. In the First line of the Title, type: Tsunami Runups Greater Than .5 Meters. On the Sec-ond line of the Title, type: 1737 to 1996.
5. Click on Show Title in GE.
6. Change Size to 5, and use the drop down arrow to select Kilometers.
7. Deselect Automatic scale and enter 3000 for Height factor.
8. Deselect the Outline.
9. Change Labels by clicking Place name and value.
STEP 7: Click Run on the GE Graph menu bar. From the “Save File” dialog box type the file name: all runups, leave it as a .kml file and click Save. The file should open in Google Earth.
Creating Graphs in Google Earth Student Worksheet (page 2 of 7)
1
2
3
4
5
6
7
8
9
ATEP ©2006-2009 UAF Geophysical Institute 6 Creating Graphs in Google Earth
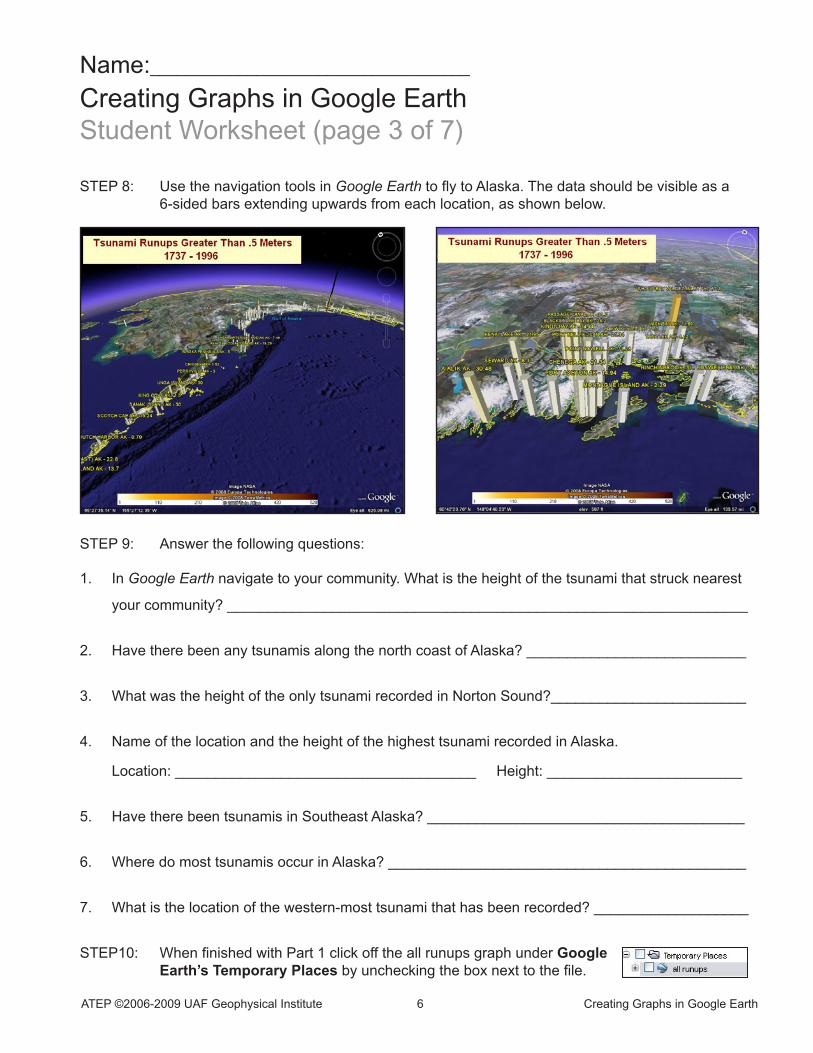
STEP 8: Use the navigation tools in Google Earth to fly to Alaska. The data should be visible as a 6-sided bars extending upwards from each location, as shown below.
STEP 9: Answer the following questions:
1. In Google Earth navigate to your community. What is the height of the tsunami that struck nearest
your community? ________________________________________________________________
2. Have there been any tsunamis along the north coast of Alaska? ___________________________
3. What was the height of the only tsunami recorded in Norton Sound?________________________
4. Name of the location and the height of the highest tsunami recorded in Alaska.
Location: _____________________________________ Height: ________________________
5. Have there been tsunamis in Southeast Alaska? _______________________________________
6. Where do most tsunamis occur in Alaska? ____________________________________________
7. What is the location of the western-most tsunami that has been recorded? ___________________
STEP10: When finished with Part 1 click off the all runups graph under Google Earth’s Temporary Places by unchecking the box next to the file.
Name:____________________________________
Creating Graphs in Google Earth Student Worksheet (page 3 of 7)
ATEP ©2006-2009 UAF Geophysical Institute 7 Creating Graphs in Google Earth
Part 2: Viewing the 1946, 1957 and 1964 TsunamisEarthquakes in 1946, 1957 and 1964 generated large and widespread tsunamis in Alaska. GE Graph will show the Alaska locations hit by each tsunamis and the relative height of the runup for each tsunami.
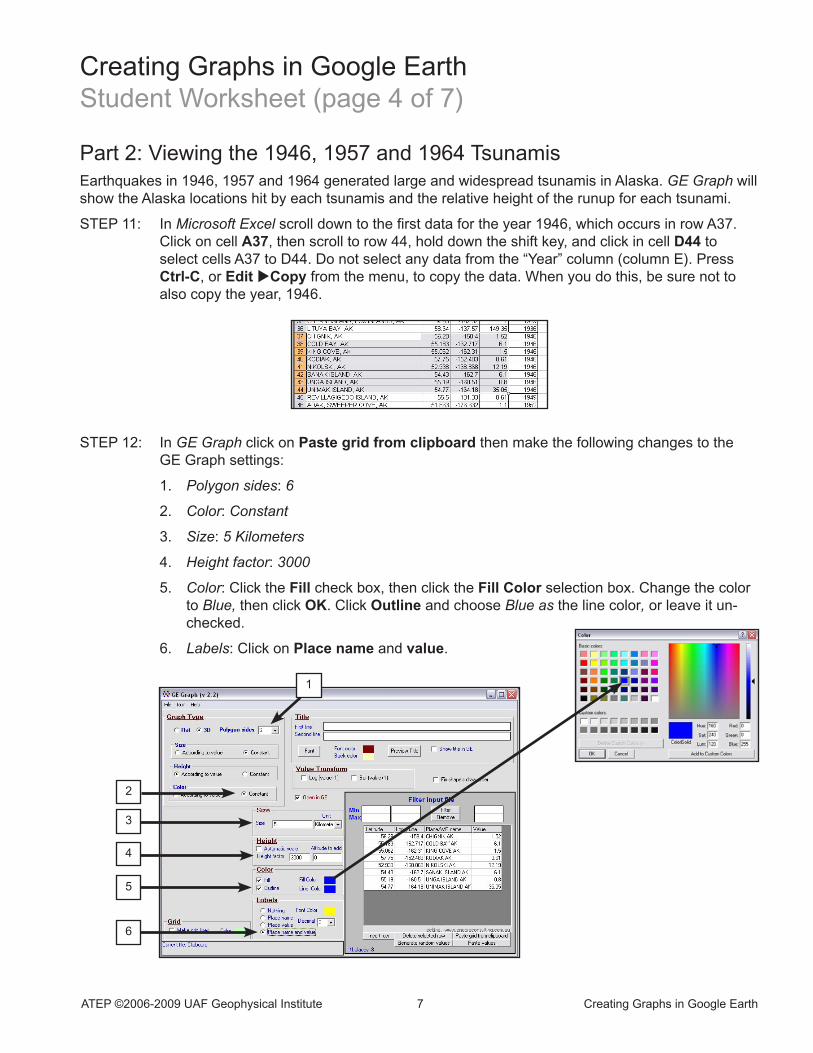
STEP 11: In Microsoft Excel scroll down to the first data for the year 1946, which occurs in row A37. Click on cell A37, then scroll to row 44, hold down the shift key, and click in cell D44 to select cells A37 to D44. Do not select any data from the “Year” column (column E). Press Ctrl-C, or Edit uCopy from the menu, to copy the data. When you do this, be sure not to also copy the year, 1946.
STEP 12: In GE Graph click on Paste grid from clipboard then make the following changes to the GE Graph settings:
1. Polygon sides: 6
2. Color: Constant
3. Size: 5 Kilometers
4. Height factor: 3000
5. Color: Click the Fill check box, then click the Fill Color selection box. Change the color to Blue, then click OK. Click Outline and choose Blue as the line color, or leave it un-checked.
6. Labels: Click on Place name and value.
Creating Graphs in Google Earth Student Worksheet (page 4 of 7)
1
2
3
4
5
6
ATEP ©2006-2009 UAF Geophysical Institute 8 Creating Graphs in Google Earth
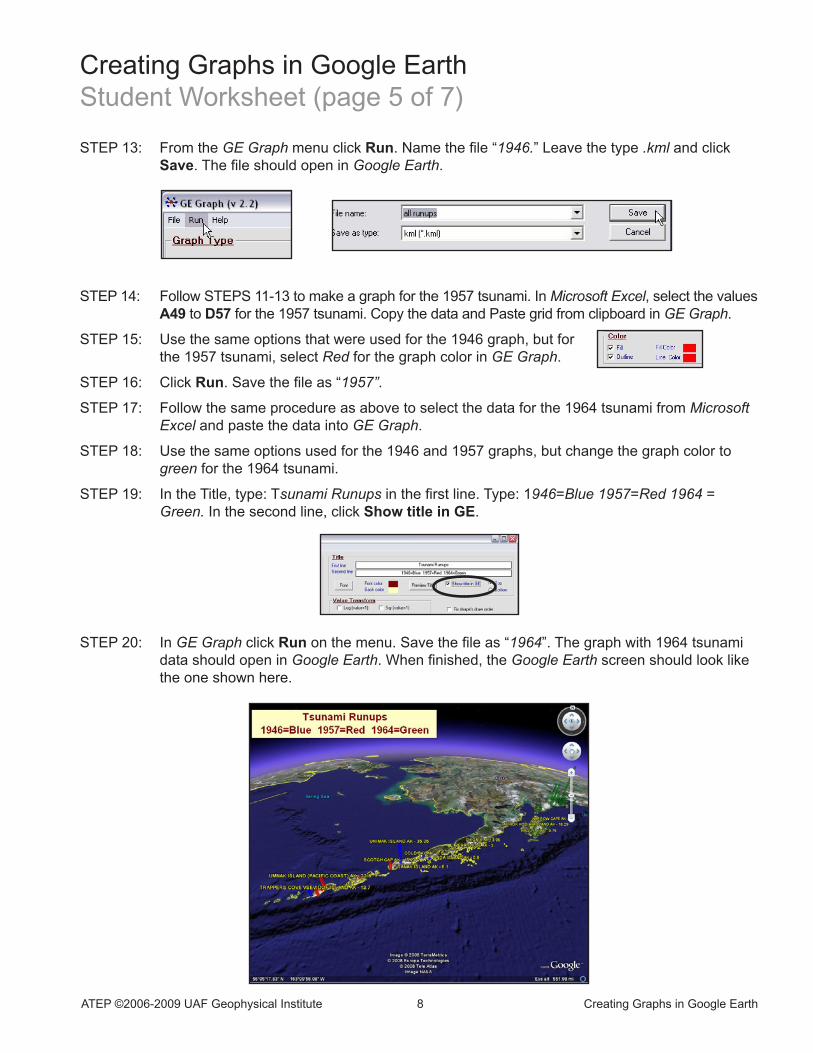
STEP 13: From the GE Graph menu click Run. Name the file “1946.” Leave the type .kml and click Save. The file should open in Google Earth.
STEP 14: Follow STEPS 11-13 to make a graph for the 1957 tsunami. In Microsoft Excel, select the values A49 to D57 for the 1957 tsunami. Copy the data and Paste grid from clipboard in GE Graph.
STEP 15: Use the same options that were used for the 1946 graph, but for the 1957 tsunami, select Red for the graph color in GE Graph.
STEP 16: Click Run. Save the file as “1957”.
STEP 17: Follow the same procedure as above to select the data for the 1964 tsunami from Microsoft Excel and paste the data into GE Graph.
STEP 18: Use the same options used for the 1946 and 1957 graphs, but change the graph color to green for the 1964 tsunami.
STEP 19: In the Title, type: Tsunami Runups in the first line. Type: 1946=Blue 1957=Red 1964 = Green. In the second line, click Show title in GE.
STEP 20: In GE Graph click Run on the menu. Save the file as “1964”. The graph with 1964 tsunami data should open in Google Earth. When finished, the Google Earth screen should look like the one shown here.
Creating Graphs in Google Earth Student Worksheet (page 5 of 7)
ATEP ©2006-2009 UAF Geophysical Institute 9 Creating Graphs in Google Earth
Name:____________________________________
Creating Graphs in Google Earth Student Worksheet (page 6 of 7)
STEP 21: Answer the following questions:
8. In what part of Alaska were the highest runups recorded during the 1964 tsunami?
______________________________________________________________________________
9. During the 1964 tsunami, in what location was the highest runup recorded? What was the height?
Location: ____________________________________ Height: _________________________
10. Did the 1964 tsunami reach Southeast Alaska? ________________________________________
11. Were any runups greater than .5 meters recorded in the western Aleutians from the 1964 tsunami?
______________________________________________________________________________
12. What part of Alaska was hit by the 1946 and 1957 tsunamis? _____________________________
13. What is the location and height of the highest runup in the 1946 tsunami?
Location: ____________________________________ Height: _________________________
14. What is the location and height of the highest runup in the 1957 tsunami?
Location: ____________________________________ Height: _________________________
15. In this lesson, GE Graph is used to compare tsunamis. How could this software be used to display
earthquakes? ___________________________________________________________________
______________________________________________________________________________
______________________________________________________________________________
16. Give two examples of types of data that could be graphed in Google Earth using GE Graph.
_____________________________________ ______________________________________
ATEP ©2006-2009 UAF Geophysical Institute 10 Creating Graphs in Google Earth
Part 3: Viewing Worldwide Data from the 1964 Tsunami
STEP 21. The Microsoft Excel spreadsheet also includes the world wide tsunami runup data for the 1964 tsunami. Consider what options to use in GE Graph for the best way to display the data.
Examine the data around the Pacific rim, including the west coast the U.S., Hawaii and Ja-pan, to see the runups of the tsunami.
STEP 22. Answer the following questions:
17. List the options selected in GE Graph to display the data.
18. Where did the highest runup along west coast of the U.S. occur, and what was the height of runup?
Location: ____________________________________ Height: _________________________
19. In what location did the highest runup in Hawaii occur, and what was the height of the runup?
Location: ____________________________________ Height: _________________________
20. Did any runups of a height greater than 1-meter occur in Japan? __________________________
21. The 1964 tsunami reached Antarctica. What was the height of the runup on the Palmer Peninsula?
________________________________
Name:____________________________________
Creating Graphs in Google Earth Student Worksheet (page 7 of 7)