Embed Size (px)
Citation preview
CREATING BEST-TASTING SOLUTIONS
Full Year Results 2018
Presented by
Paul Selway-Swift
Magomet Malsagov
Rakesh Sinha
18 September 2018
1
DISCLAIMER
• This document, w hich is personal to the recipient and has been issued by PureCircle
Limited (the “Company”), comprises w ritten materials/slides for presentations to be held
in September 2017. This document does not constitute or form part of any offer or
invitation to sell or issue, or any solicitation of any offer to purchase or subscribe for, any
shares in the Company, nor shall any part of it nor the fact of its distribution form part of
or be relied on in connection w ith any contract or investment decision relating thereto,
nor does it constitute a recommendation regarding the securities of the Company.
• This document has not been verif ied, does not purport to contain all information that a
prospective investor may require and is subject to updating, revision and amending. The
information and opinions contained in this document are provided as at the date of this
presentation and are subject to change w ithout notice. In furnishing this document, the
Company does not undertake or agree to any obligation to provide the attendees w ith
access to any additional information or to update this document or to correct any
inaccuracies in, or omissions from, this document that may become apparent.
• No reliance may be placed for any purposes w hatsoever on the information or opinions
contained in this document or on its completeness. No representation or w arranty,
express or implied, is given by or on behalf of the Company its directors, off icers or
employees or any other person as to the accuracy or completeness of the information or
opinions contained in this document and no liability w hatsoever is accepted by the
Company or any of its members, directors, off icers or employees nor any other person
for any loss how soever arising, directly or indirectly, from any use of such information or
opinions or otherw ise arising in connection therew ith.
• This document and its contents are confidential and may not be reproduced,
redistributed or passed on, directly or indirectly, to any other person or published, in
w hole or in part, for any purpose. This presentation is for information purposes only and
is directed only at, in the United Kingdom, qualif ied investors w ho are persons w ho ( i)
have professional experience in matters relating to investments falling w ithin Article
19(1) of the Financial Services and Markets Act 2000 (Financial Promotion) Order 2005
(the “Order"); (ii) are persons falling w ithin Article 49(2)(a) to (d) ("high net w orth
companies, unincorporated associations, etc") of the Order; or (iii) are persons to w hom
it may otherw ise be law fully communicated (all such persons together being referred to
as "Relevant Persons"). By attending the presentation to w hich this document relates or
by accepting this document, you w ill be take to have represented, w arranted and
undertaken that you are a Relevant Person.
• Certain statements, beliefs and opinions in this document, are forw ard-looking, w hich
reflect the Company’s or, as appropriate, the Company’s directors’ current expectations
and projections about future events. By their nature, forw ard-looking statements involve
a number of risks, uncertainties and assumptions that could cause actual results or
events to differ materially from those expressed or implied by the forw ard-looking
statements. These risks, uncertainties and assumptions could adversely affect the
outcome and f inancial effects of the plans and events described herein. Forw ard-looking
statements contained in this document regarding past trends or activities should not be
taken as a representation that such trends or activities w ill continue in the future. The
Company does not undertake any obligation to update or revise any forw ard-looking
statements, w hether as a result of new information, future events or otherw ise. You
should not place undue reliance on forw ard-looking statements, w hich speak only as of
the date of this document.
• By attending the presentation to w hich this document relates or by accepting this
document in any other w ay you agree to be bound by the foregoing provisions.
2
Presented by
Magomet Malsagov, Chief Executive Officer
OVERVIEW
3
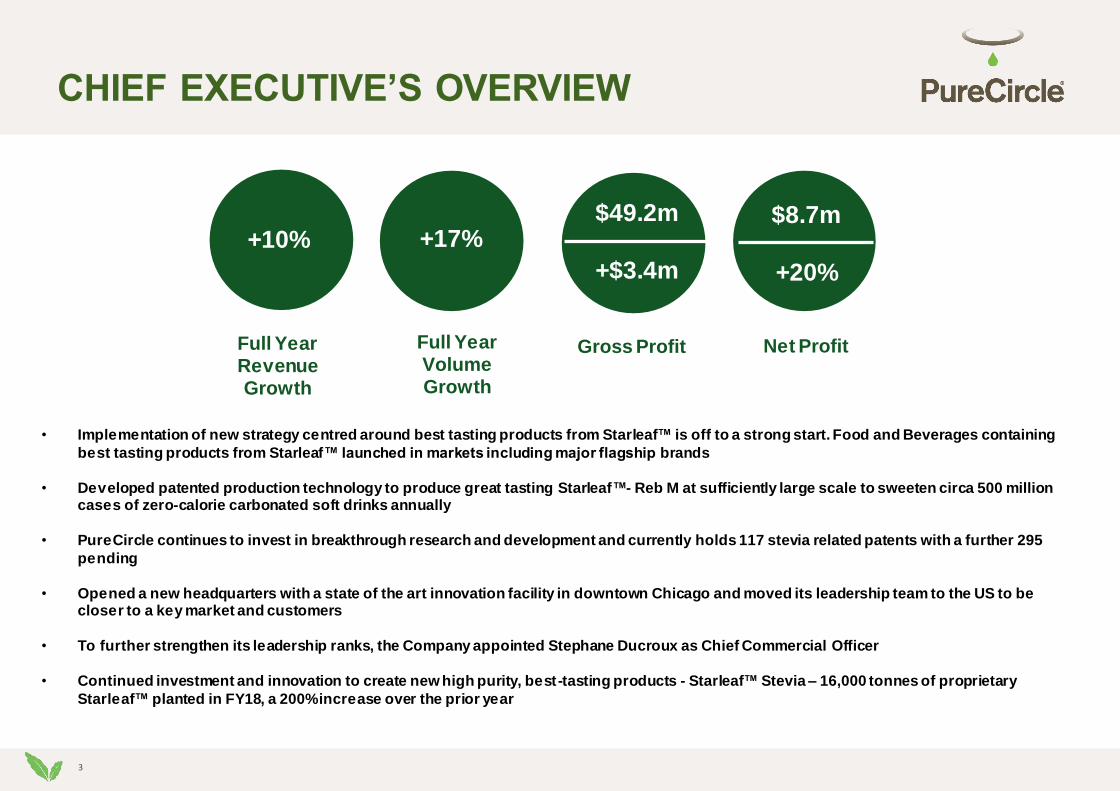
CHIEF EXECUTIVE’S OVERVIEW
• Implementation of new strategy centred around best tasting products from Starleaf™ is off to a strong start. Food and Beverages containing
best tasting products from Starleaf™ launched in markets including major flagship brands
• Developed patented production technology to produce great tasting Starleaf™- Reb M at sufficiently large scale to sweeten circa 500 million cases of zero-calorie carbonated soft drinks annually
• PureCircle continues to invest in breakthrough research and development and currently holds 117 stevia related patents with a further 295
pending
• Opened a new headquarters with a state of the art innovation facility in downtown Chicago and moved its leadership team to the US to be closer to a key market and customers
• To further strengthen its leadership ranks, the Company appointed Stephane Ducroux as Chief Commercial Officer
• Continued investment and innovation to create new high purity, best-tasting products - Starleaf™ Stevia – 16,000 tonnes of proprietary
Starleaf™ planted in FY18, a 200% increase over the prior year
+10%$49.2m
+$3.4m
$8.7m
+20%
Full Year Revenue Growth
Full Year Volume Growth
Gross Profit Net Profit
+17%
4
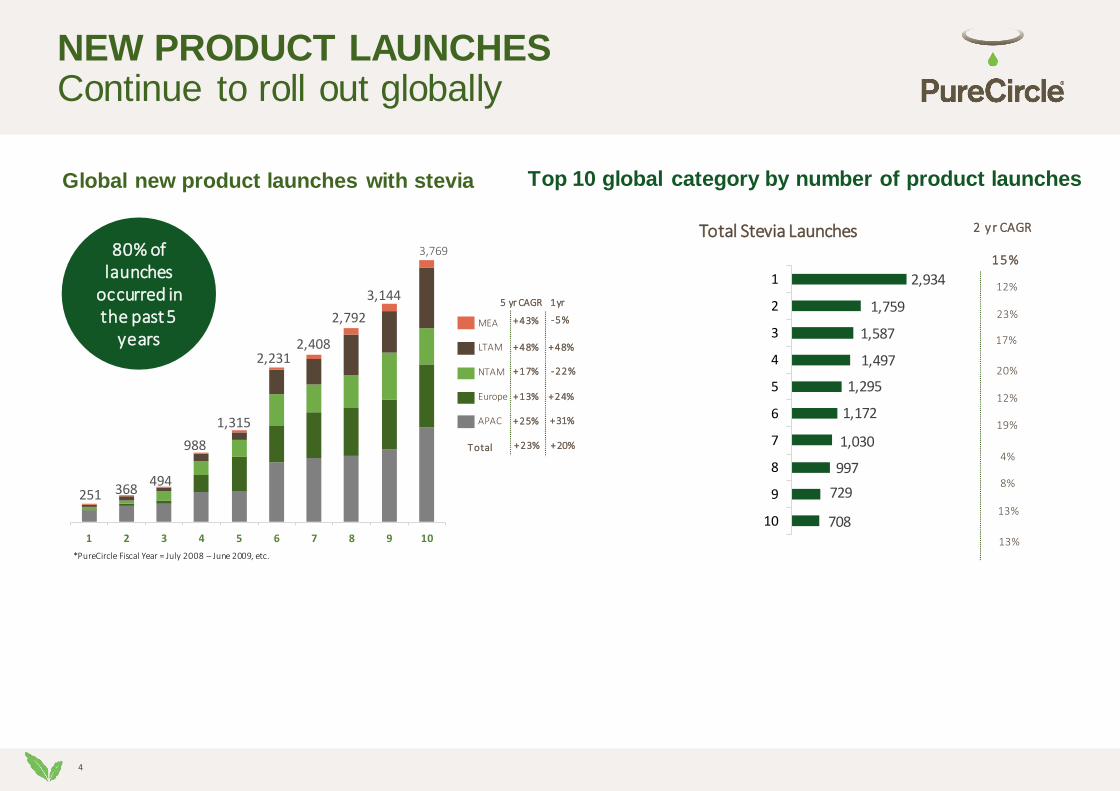
NEW PRODUCT LAUNCHES Continue to roll out globally
2,934
1,759
1,587
1,497
1,295
1,172
1,030
997
729
708
1
2
3
4
5
6
7
8
9
10
Global new product launches with stevia Top 10 global category by number of product launches
80% of launches
occurred in the past 5
years
2 yr CAGR
12%
23%
17%
20%
12%
19%
4%
8%
13%
15%
1 2 3 4 5 6 7 8 9 10
251 368494
988
1,315
2,2312,408
2,792
3,144
MEA +43% -5%
LTAM +48% +48%
NTAM +17% -22%
Europe +13% +24%
APAC +25% +31%
5 yr CAGR 1yr
T otal +23% +20%
13%
Total Stevia Launches 3,769
*PureCircle Fiscal Year = July 2008 – June 2009, etc.

5
OUR GLOBAL FOOTPRINT

6
HOW WE CREATE VALUE
We have successfully
commercialised a
portfolio that includes
natural sweeteners,
flavours and specialty
ingredients based on
high purity stevia.
PureCircle has deep
expertise across the
value chain, from
seedling to sweetener.
Research & Development (R&D)Multi-disciplinary approach spanning plant breeding, agronomy, biotechnology, biochemistry,
food technology and sensory analysis
Commercialisation• Scientific and Regulatory Affairs
• Sales & Marketing
7
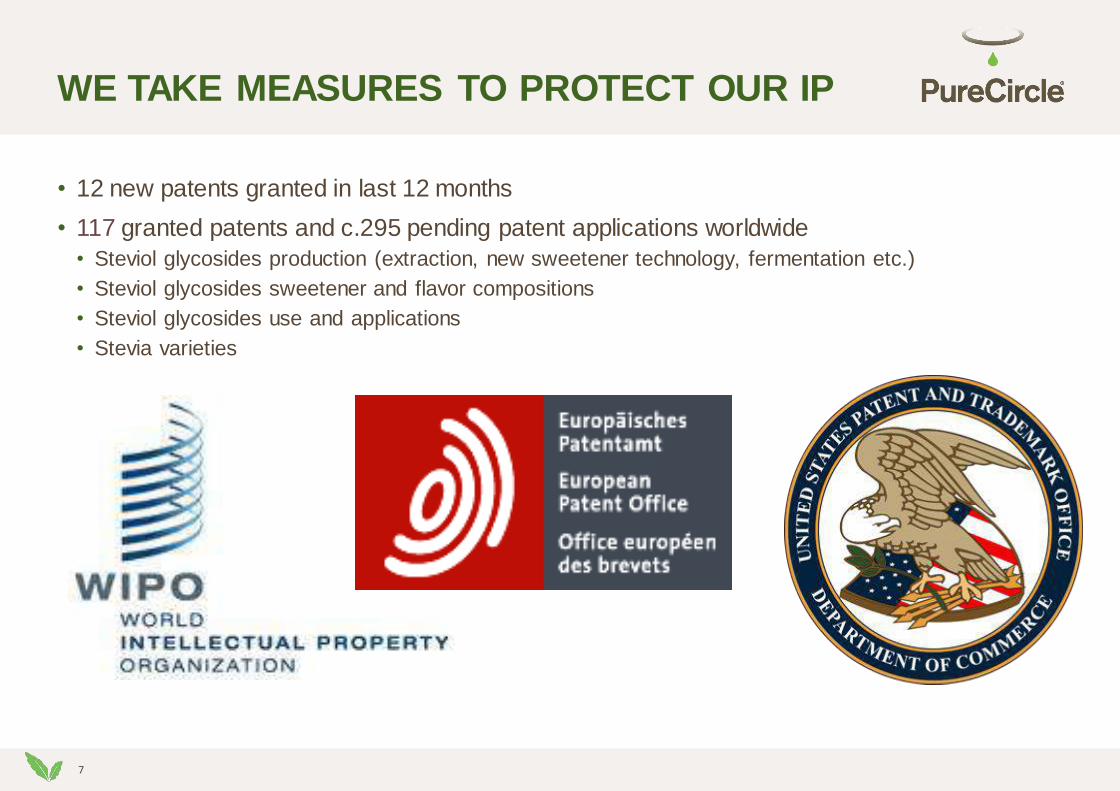
WE TAKE MEASURES TO PROTECT OUR IP
• 12 new patents granted in last 12 months
• 117 granted patents and c.295 pending patent applications worldwide
• Steviol glycosides production (extraction, new sweetener technology, fermentation etc.)
• Steviol glycosides sweetener and flavor compositions
• Steviol glycosides use and applications
• Stevia varieties
8
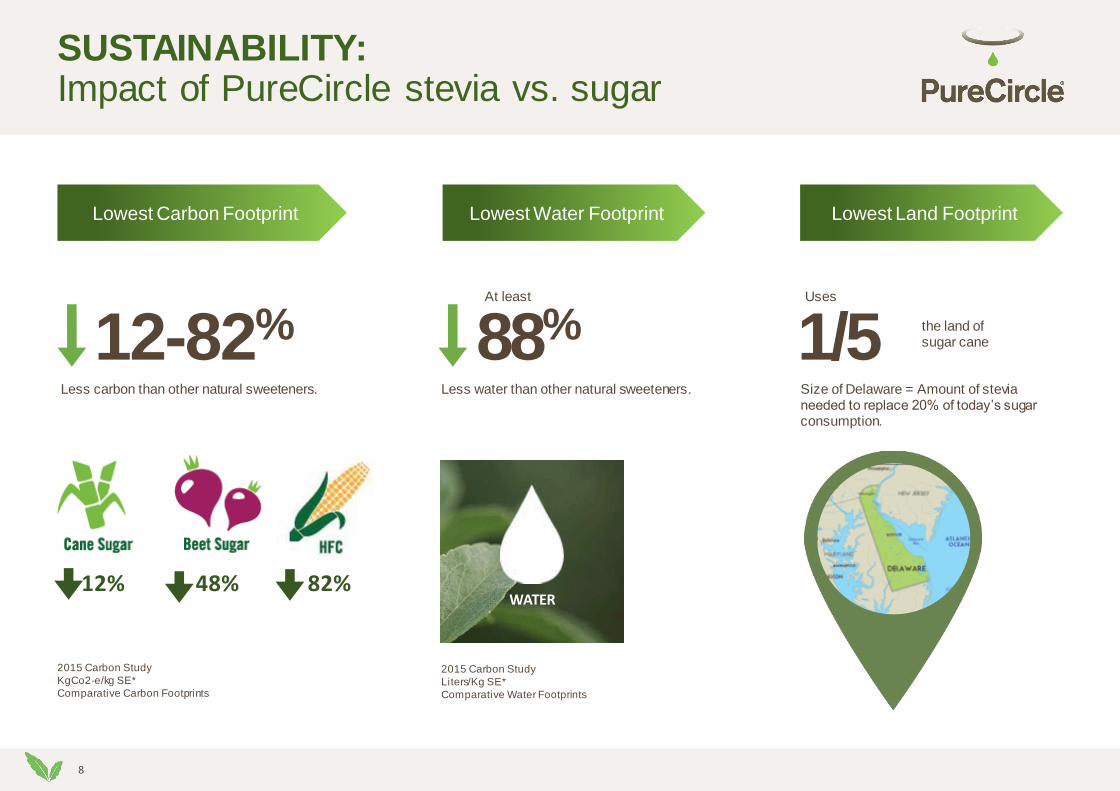
Lowest Carbon Footprint Lowest Water Footprint Lowest Land Footprint
12-82% 88% 1/5Less carbon than other natural sweeteners. Less water than other natural sweeteners. Size of Delaware = Amount of stevia
needed to replace 20% of today’s sugar consumption.
2015 Carbon Study
KgCo2-e/kg SE*
Comparative Carbon Footprints
2015 Carbon Study
Liters/Kg SE*
Comparative Water Footprints
At least Uses
the land of sugar cane
12% 48% 82%WATER
SUSTAINABILITY:Impact of PureCircle stevia vs. sugar
9
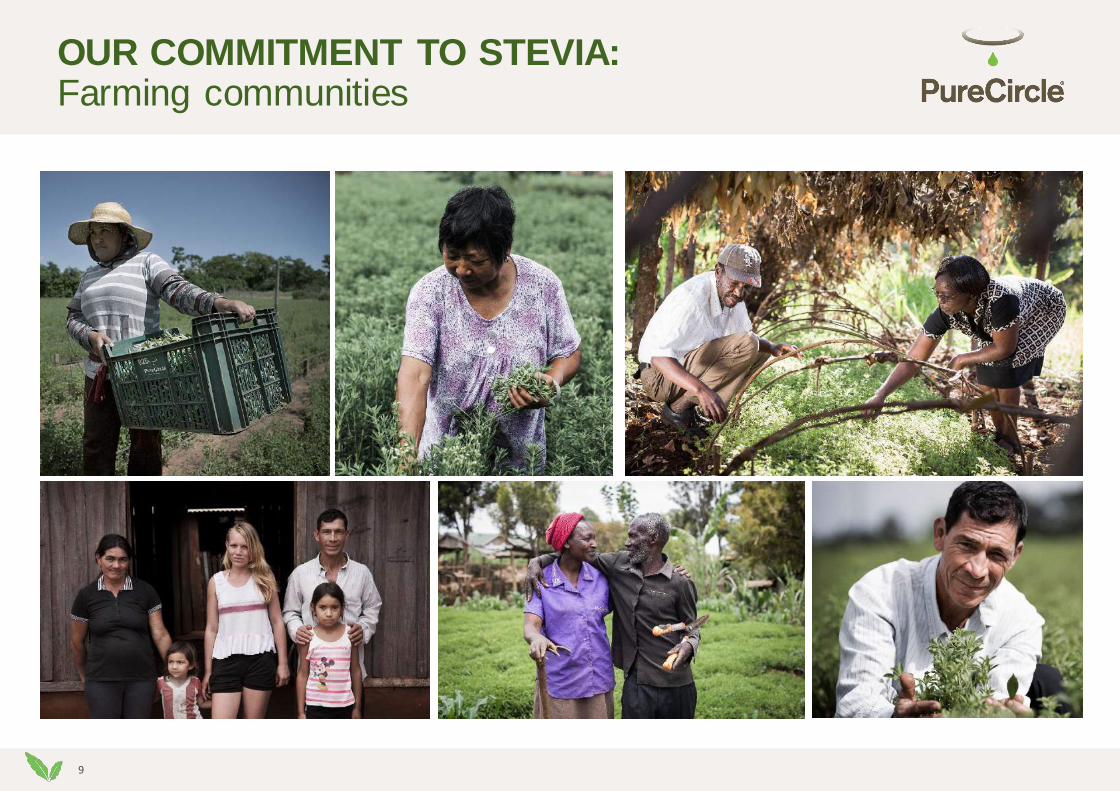
OUR COMMITMENT TO STEVIA: Farming communities
10
FINANCIALREVIEW
Presented by
Rakesh Sinha, Chief Financial Officer
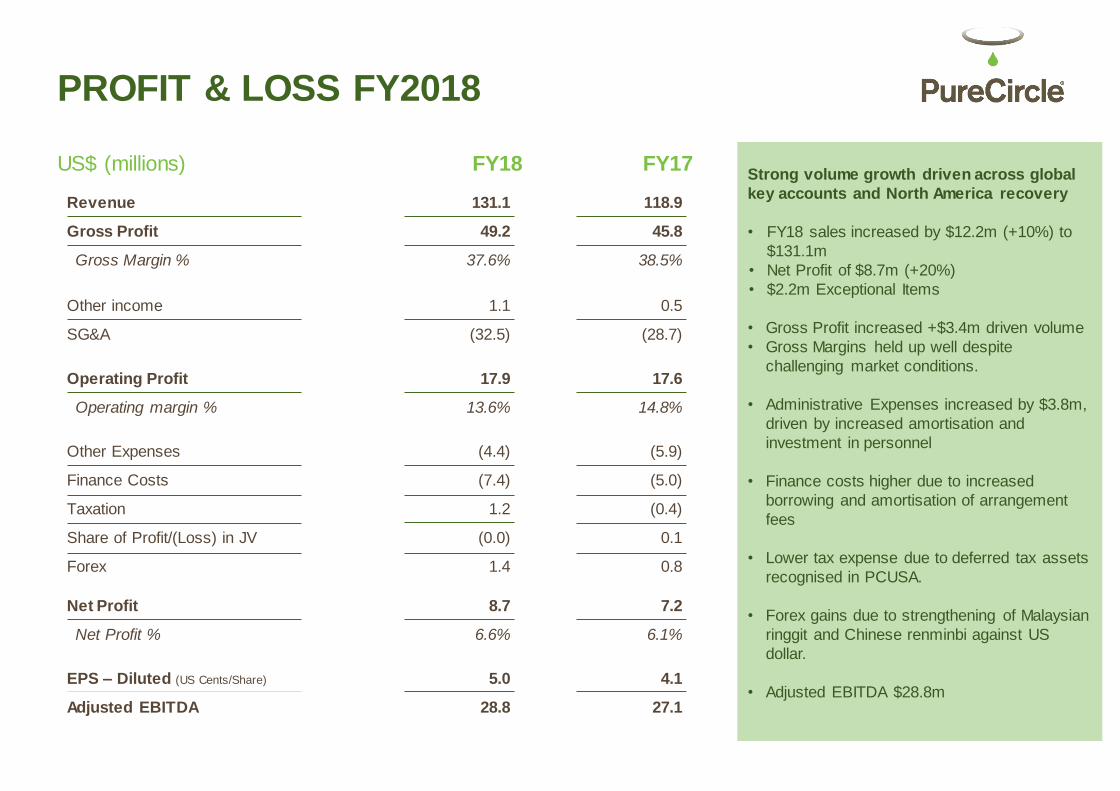
Revenue
Gross Profit
Gross Margin %
US$ (millions)
Other income
SG&A
Operating Profit
Operating margin %
Other Expenses
Finance Costs
Taxation
Share of Profit/(Loss) in JV
Forex
Net Profit
Net Profit %
PROFIT & LOSS FY2018
FY18 FY17
EPS – Diluted (US Cents/Share)
Adjusted EBITDA
118.9
45.8
38.5%
0.5
(28.7)
17.6
14.8%
(5.9)
(5.0)
(0.4)
0.1
0.8
7.2
6.1%
4.1
27.1
131.1
49.2
37.6%
1.1
(32.5)
17.9
13.6%
(4.4)
(7.4)
1.2
(0.0)
1.4
8.7
6.6%
5.0
28.8
Strong volume growth driven across global
key accounts and North America recovery
• FY18 sales increased by $12.2m (+10%) to
$131.1m
• Net Profit of $8.7m (+20%)
• $2.2m Exceptional Items
• Gross Profit increased +$3.4m driven volume
• Gross Margins held up well despite
challenging market conditions.
• Administrative Expenses increased by $3.8m,
driven by increased amortisation and
investment in personnel
• Finance costs higher due to increased
borrowing and amortisation of arrangement
fees
• Lower tax expense due to deferred tax assets
recognised in PCUSA.
• Forex gains due to strengthening of Malaysian
ringgit and Chinese renminbi against US
dollar.
• Adjusted EBITDA $28.8m
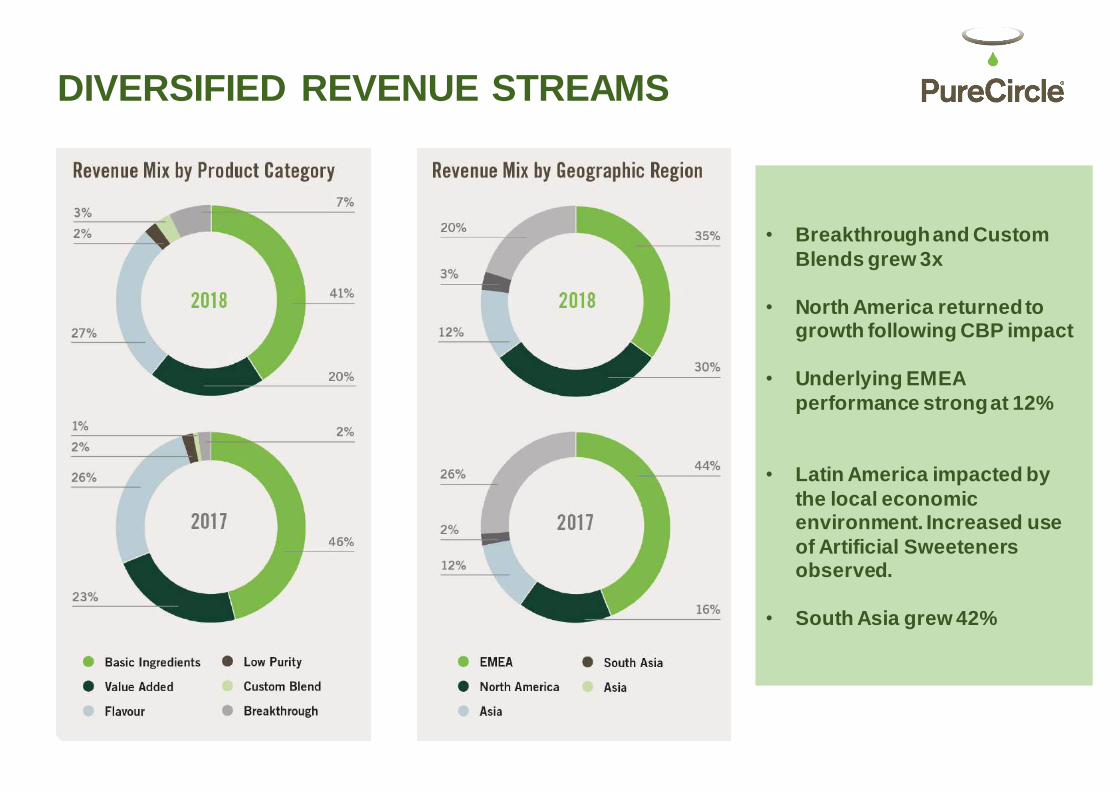
DIVERSIFIED REVENUE STREAMS
• Breakthrough and Custom
Blends grew 3x
• North America returned to growth following CBP impact
• Underlying EMEA
performance strong at 12%
• Latin America impacted by
the local economic environment. Increased use
of Artificial Sweeteners observed.
• South Asia grew 42%
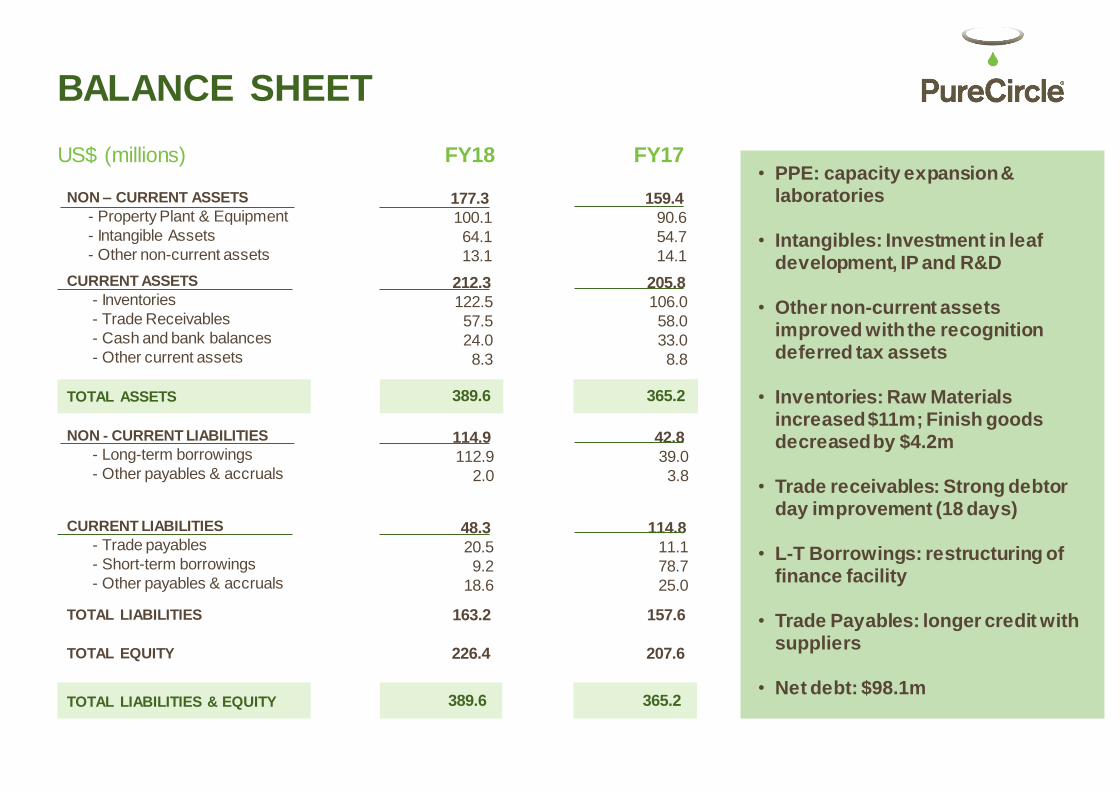
NON – CURRENT ASSETS
- Property Plant & Equipment
- Intangible Assets
- Other non-current assets
TOTAL EQUITY
TOTAL LIABILITIES & EQUITY
BALANCE SHEET
NON - CURRENT LIABILITIES
- Long-term borrowings
- Other payables & accruals
CURRENT ASSETS
- Inventories
- Trade Receivables
- Cash and bank balances
- Other current assets
TOTAL ASSETS
CURRENT LIABILITIES
- Trade payables
- Short-term borrowings
- Other payables & accruals
TOTAL LIABILITIES
177.3
100.1
64.1
13.1
226.4
389.6
212.3
122.5
57.5
24.0
8.3
389.6
114.9
112.9
2.0
48.3
20.5
9.2
18.6
163.2
US$ (millions) FY18 FY17• PPE: capacity expansion &
laboratories
• Intangibles: Investment in leaf development, IP and R&D
• Other non-current assets improved with the recognition deferred tax assets
• Inventories: Raw Materials increased $11m; Finish goods decreased by $4.2m
• Trade receivables: Strong debtor day improvement (18 days)
• L-T Borrowings: restructuring of finance facility
• Trade Payables: longer credit with suppliers
• Net debt: $98.1m
159.4
90.6
54.7
14.1
207.6
365.2
205.8
106.0
58.0
33.0
8.8
365.2
42.8
39.0
3.8
114.8
11.1
78.7
25.0
157.6
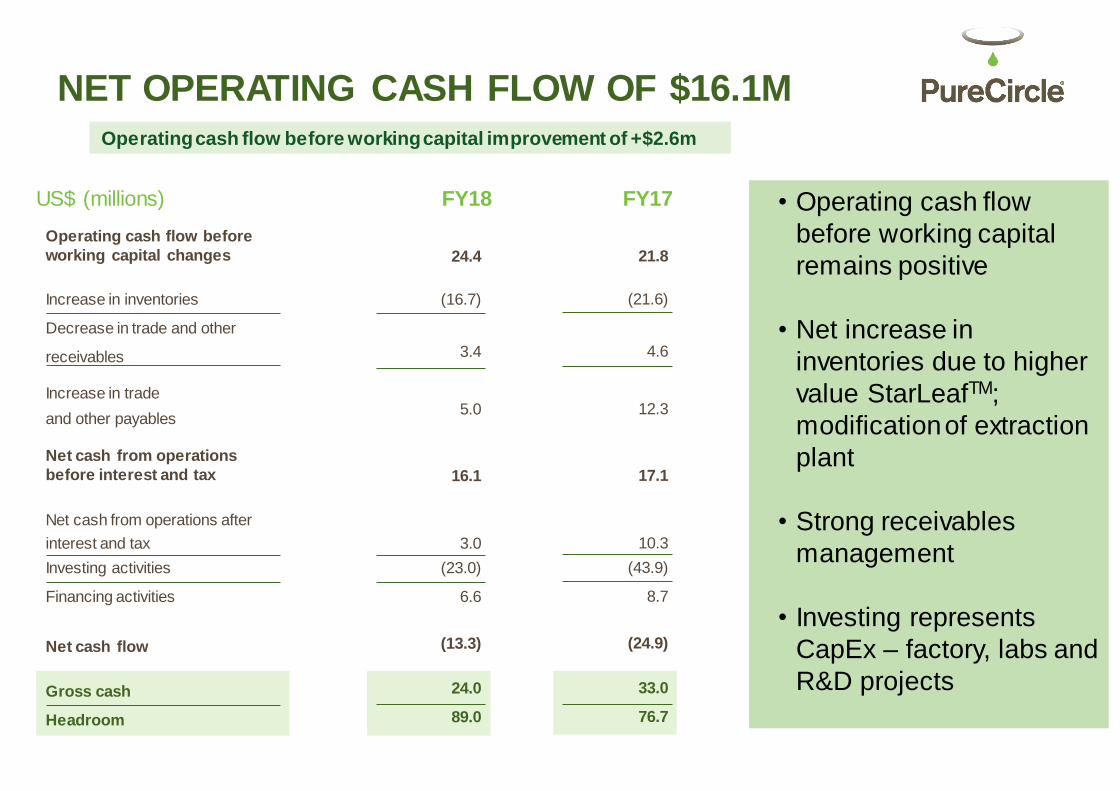
Operating cash flow before
working capital changes
US$ (millions) FY18 FY17
24.4
Increase in inventories
Decrease in trade and other
receivables
Increase in trade
and other payables
(16.7)
3.4
5.0
Net cash from operations
before interest and tax 16.1
Net cash from operations after
interest and tax
Investing activities
Financing activities
3.0
(23.0)
6.6
Net cash flow (13.3)
Gross cash
Headroom
24.0
89.0
Operating cash flow before working capital improvement of +$2.6m
NET OPERATING CASH FLOW OF $16.1M
21.8
(21.6)
4.6
12.3
17.1
10.3
(43.9)
8.7
(24.9)
33.0
76.7
• Operating cash flow
before working capital
remains positive
• Net increase in
inventories due to higher
value StarLeafTM;
modification of extraction
plant
• Strong receivables
management
• Investing represents
CapEx – factory, labs and
R&D projects
1515
Evolution of StrategyStarleafTM Stevia
16
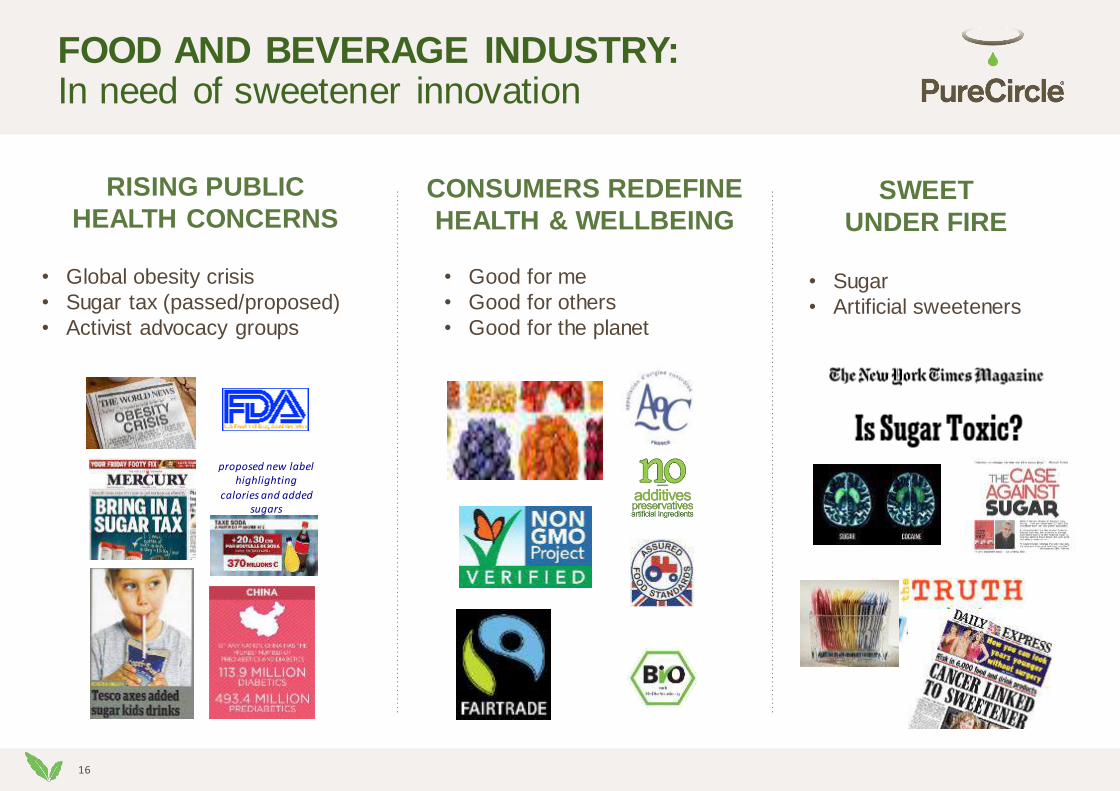
FOOD AND BEVERAGE INDUSTRY: In need of sweetener innovation
• Global obesity crisis
• Sugar tax (passed/proposed)
• Activist advocacy groups
• Good for me
• Good for others
• Good for the planet
proposed new labelhighlighting
calories and added sugars
• Sugar
• Artificial sweeteners
RISING PUBLIC
HEALTH CONCERNSCONSUMERS REDEFINE
HEALTH & WELLBEINGSWEET
UNDER FIRE
17
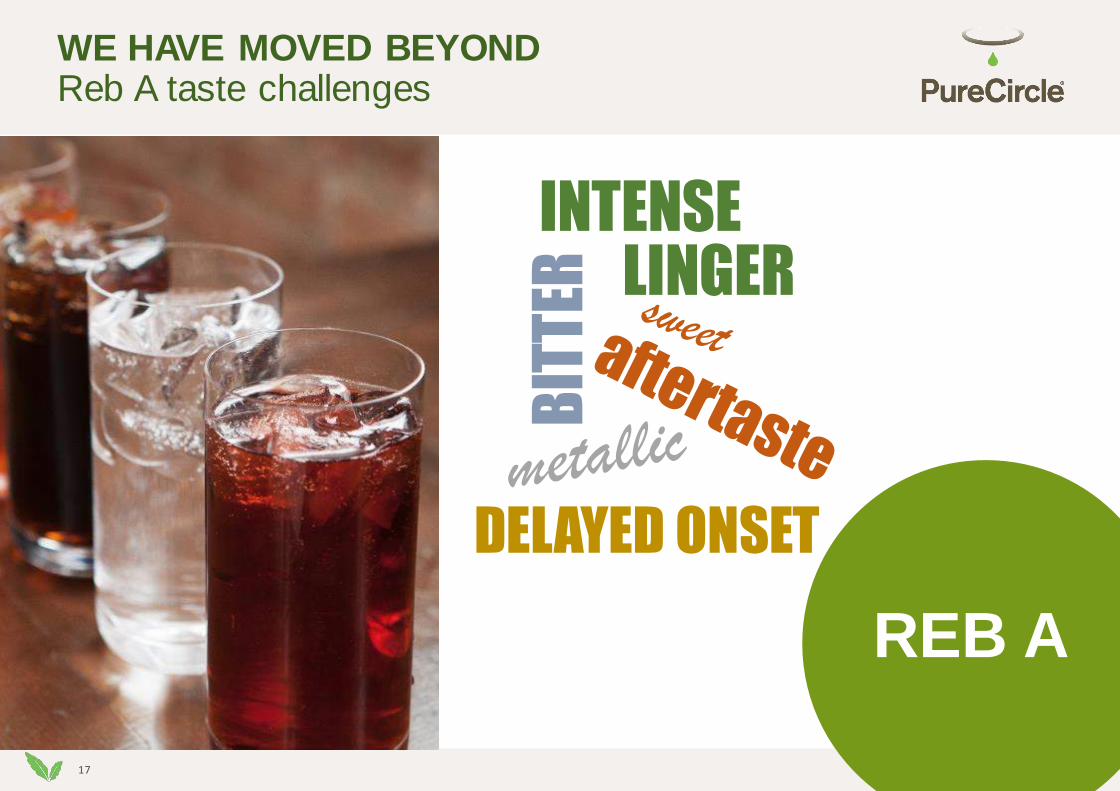
WE HAVE MOVED BEYOND Reb A taste challenges
REB A
DELAYED ONSETB
ITT
ER
INTENSELINGER
1818
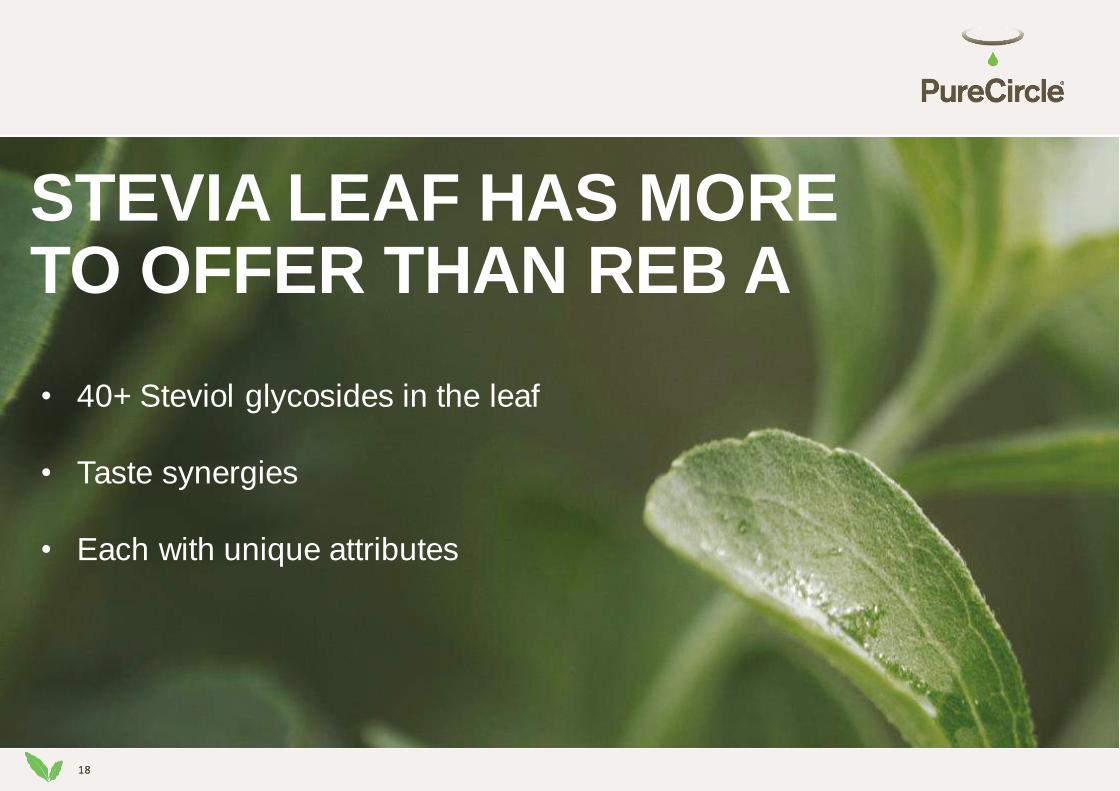
STEVIA LEAF HAS MORE TO OFFER THAN REB A
• 40+ Steviol glycosides in the leaf
• Taste synergies
• Each with unique attributes
19
19
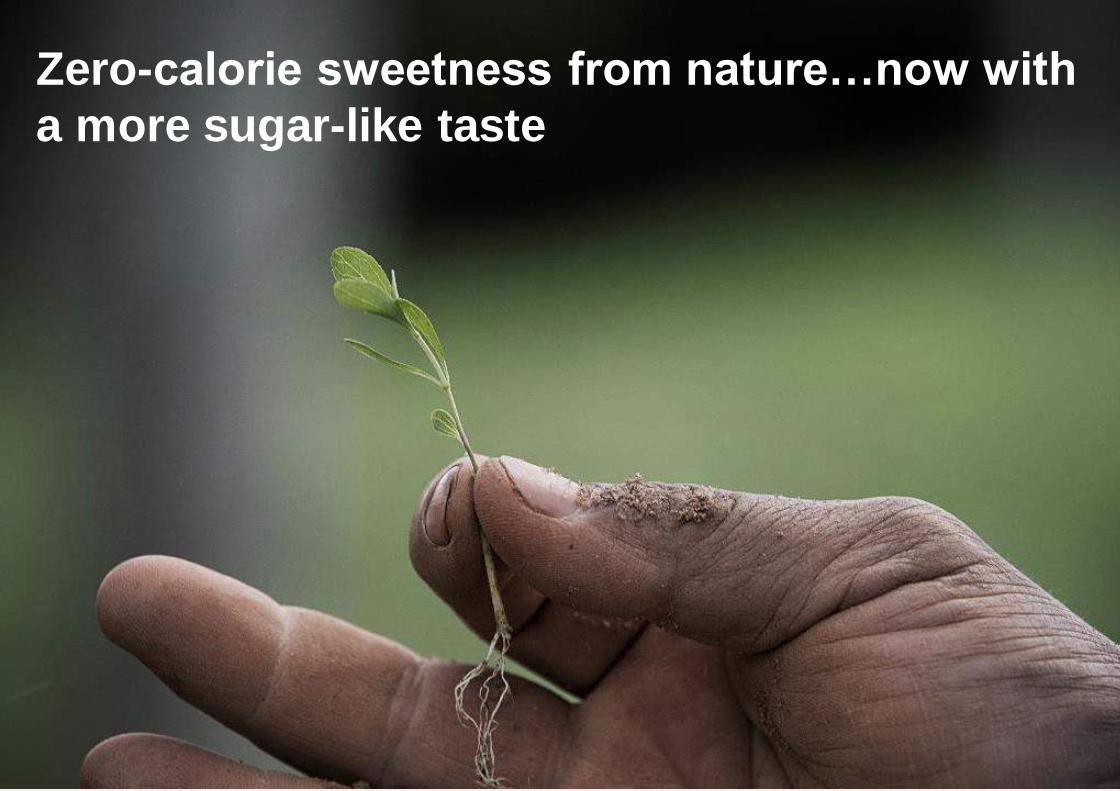
Zero-calorie sweetness from nature…now with
a more sugar-like taste
20
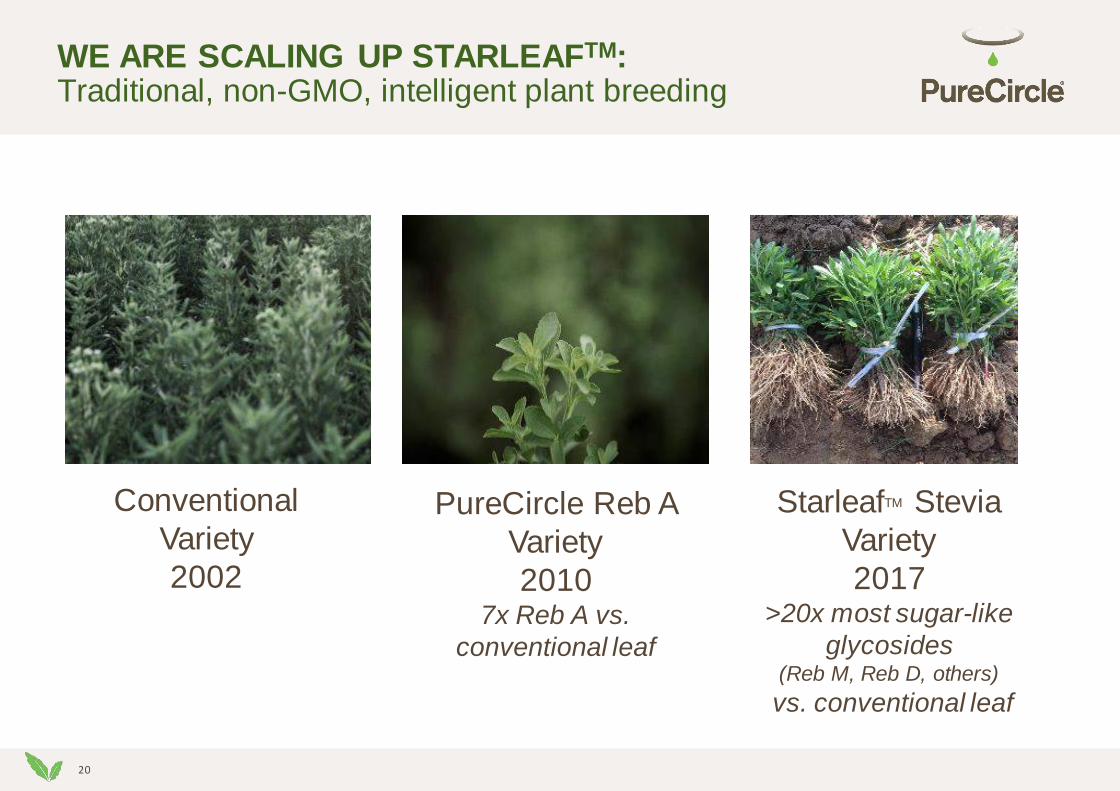
WE ARE SCALING UP STARLEAFTM:Traditional, non-GMO, intelligent plant breeding
Conventional
Variety
2002
StarleafTM Stevia
Variety
2017>20x most sugar-like
glycosides(Reb M, Reb D, others)
vs. conventional leaf
PureCircle Reb A
Variety
20107x Reb A vs.
conventional leaf
21
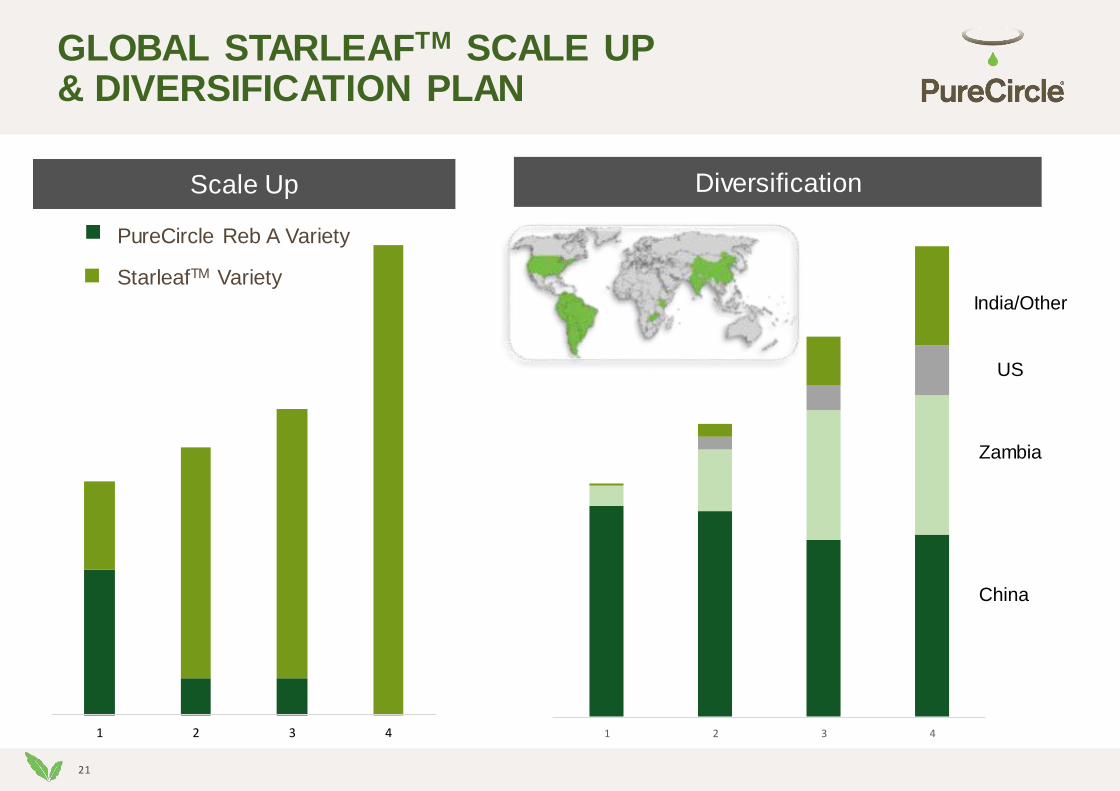
GLOBAL STARLEAFTM SCALE UP & DIVERSIFICATION PLAN
1 2 3 4
DiversificationScale Up
PureCircle Reb A Variety
StarleafTM Variety
China
Zambia
US
India/Other
1 2 3 4
22
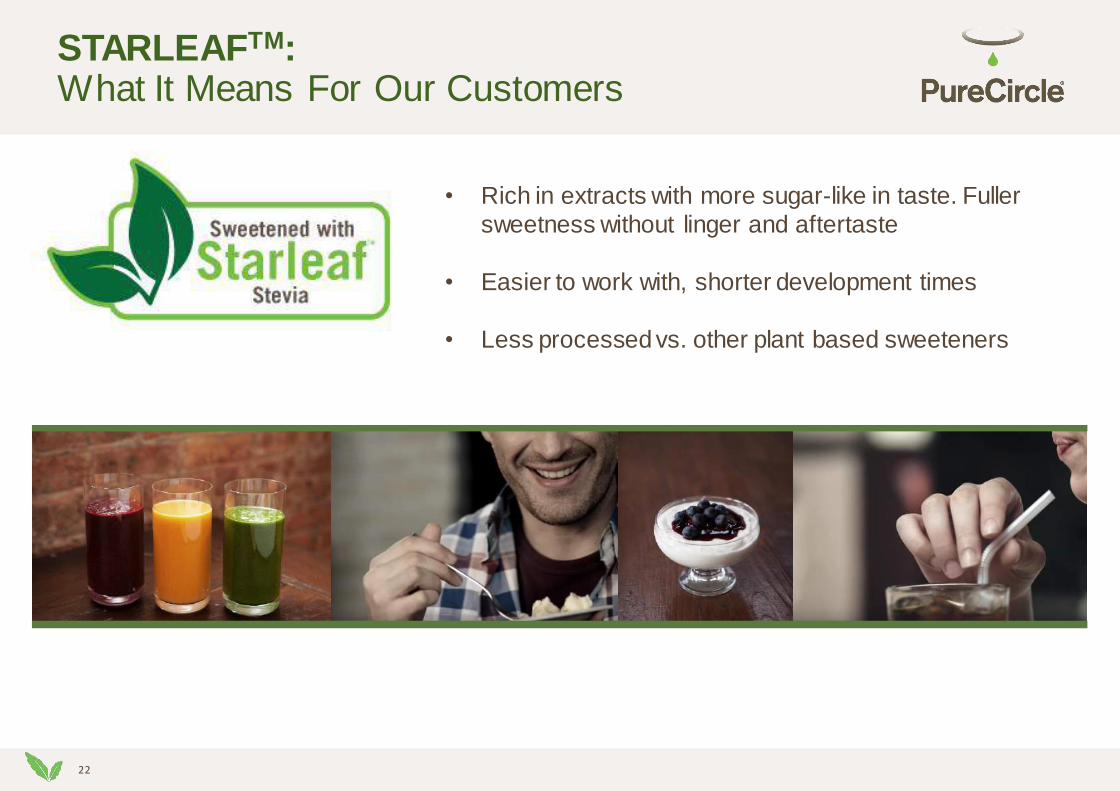
• Rich in extracts with more sugar-like in taste. Fuller
sweetness without linger and aftertaste
• Easier to work with, shorter development times
• Less processed vs. other plant based sweeteners
STARLEAFTM: What It Means For Our Customers
23
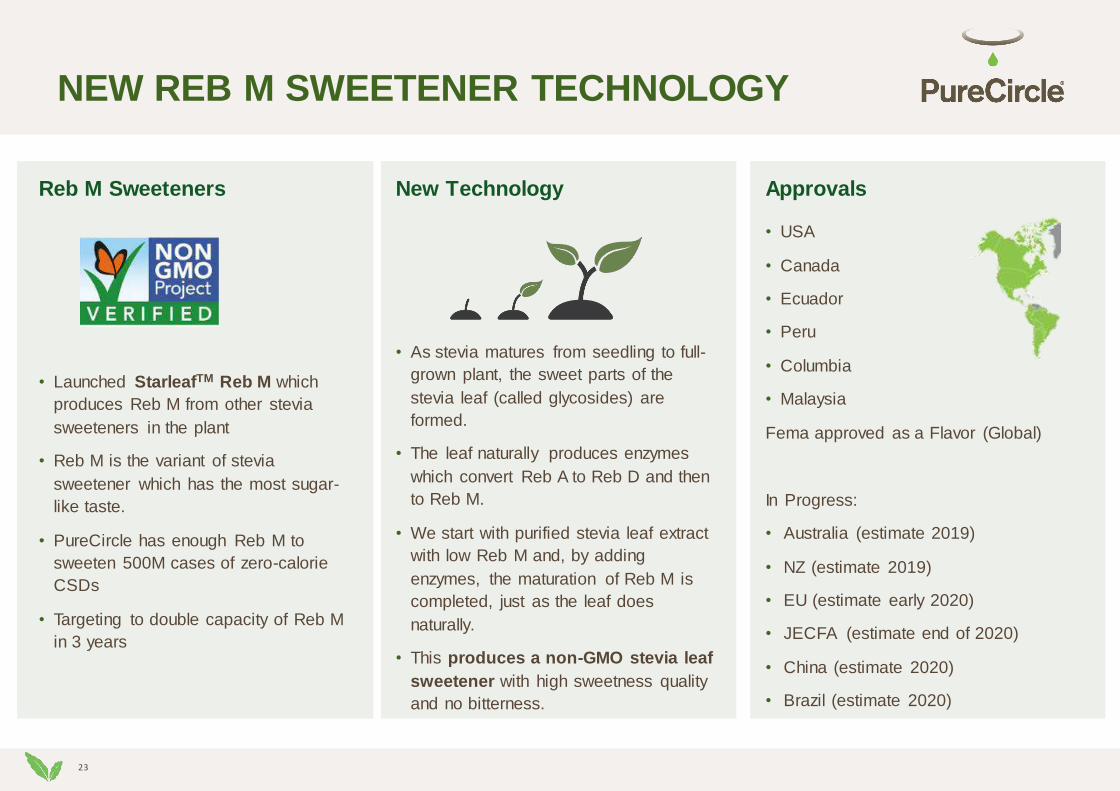
New Technology
• As stevia matures from seedling to full-
grown plant, the sweet parts of the
stevia leaf (called glycosides) are
formed.
• The leaf naturally produces enzymes
which convert Reb A to Reb D and then
to Reb M.
• We start with purified stevia leaf extract
with low Reb M and, by adding
enzymes, the maturation of Reb M is
completed, just as the leaf does
naturally.
• This produces a non-GMO stevia leaf
sweetener with high sweetness quality
and no bitterness.
Approvals
• USA
• Canada
• Ecuador
• Peru
• Columbia
• Malaysia
Fema approved as a Flavor (Global)
In Progress:
• Australia (estimate 2019)
• NZ (estimate 2019)
• EU (estimate early 2020)
• JECFA (estimate end of 2020)
• China (estimate 2020)
• Brazil (estimate 2020)
NEW REB M SWEETENER TECHNOLOGY
FY2018Reb M Sweeteners
• Launched StarleafTM Reb M which
produces Reb M from other stevia
sweeteners in the plant
• Reb M is the variant of stevia
sweetener which has the most sugar-
like taste.
• PureCircle has enough Reb M to
sweeten 500M cases of zero-calorie
CSDs
• Targeting to double capacity of Reb M
in 3 years
24
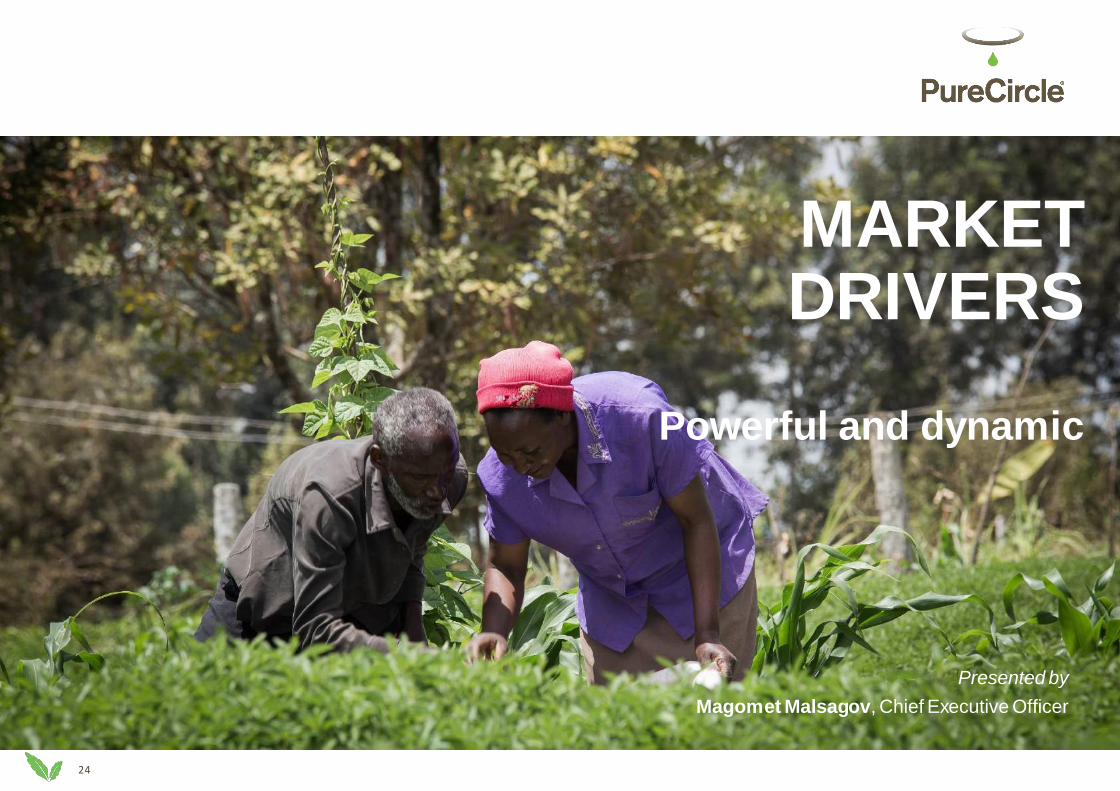
MARKET DRIVERS
Powerful and dynamic
Presented by
Magomet Malsagov, Chief Executive Officer
25
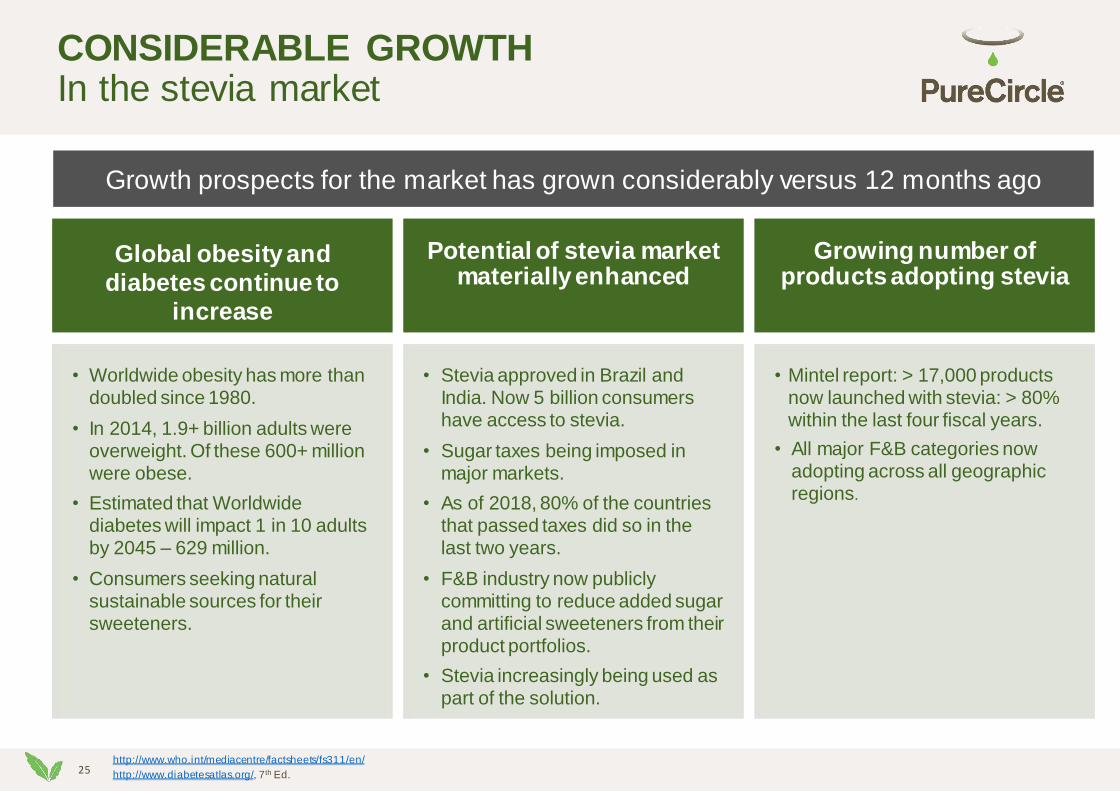
• Worldwide obesity has more than doubled since 1980.
• In 2014, 1.9+ billion adults were overweight. Of these 600+ million were obese.
• Estimated that Worldwide diabetes will impact 1 in 10 adults by 2045 – 629 million.
• Consumers seeking natural sustainable sources for their sweeteners.
http://www.who.int/mediacentre/factsheets/fs311/en/
http://www.diabetesatlas.org/, 7th Ed.
CONSIDERABLE GROWTH In the stevia market
• Stevia approved in Brazil and India. Now 5 billion consumers have access to stevia.
• Sugar taxes being imposed in major markets.
• As of 2018, 80% of the countries that passed taxes did so in the last two years.
• F&B industry now publicly committing to reduce added sugar and artificial sweeteners from their product portfolios.
• Stevia increasingly being used as part of the solution.
• Mintel report: > 17,000 products now launched with stevia: > 80% within the last four fiscal years.
• All major F&B categories now adopting across all geographic regions.
Global obesity and
diabetes continue to
increase
Potential of stevia market materially enhanced
Growing number of products adopting stevia
Growth prospects for the market has grown considerably versus 12 months ago
26
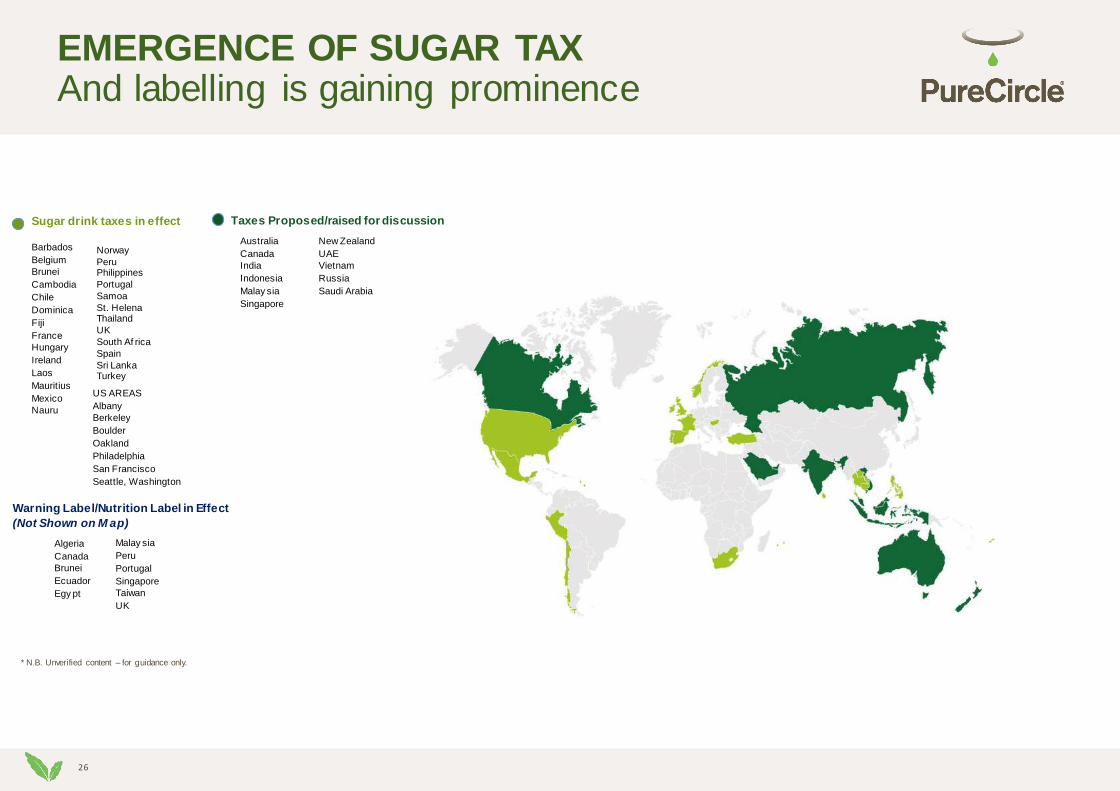
EMERGENCE OF SUGAR TAXAnd labelling is gaining prominence
* N.B. Unverified content – for guidance only.
Sugar drink taxes in effect
Barbados
Belgium
Brunei
Cambodia
Chile
Dominica
Fiji
France
Hungary
Ireland
Laos
Mauritius
Mexico
Nauru
US AREAS
Albany
Berkeley
Boulder
Oakland
Philadelphia
San Francisco
Seattle, Washington
Taxes Proposed/raised for discussion
Australia
Canada
India
Indonesia
Malay sia
Singapore
New Zealand
UAE
Vietnam
Russia
Saudi Arabia
Warning Label/Nutrition Label in Effect
(Not Shown on M ap)
Algeria
Canada
Brunei
Ecuador
Egy pt
Norway
PeruPhilippines
Portugal
Samoa
St. HelenaThailand
UK
South Af rica
Spain
Sri LankaTurkey
Malay sia
Peru
Portugal
Singapore
Taiwan
UK
27
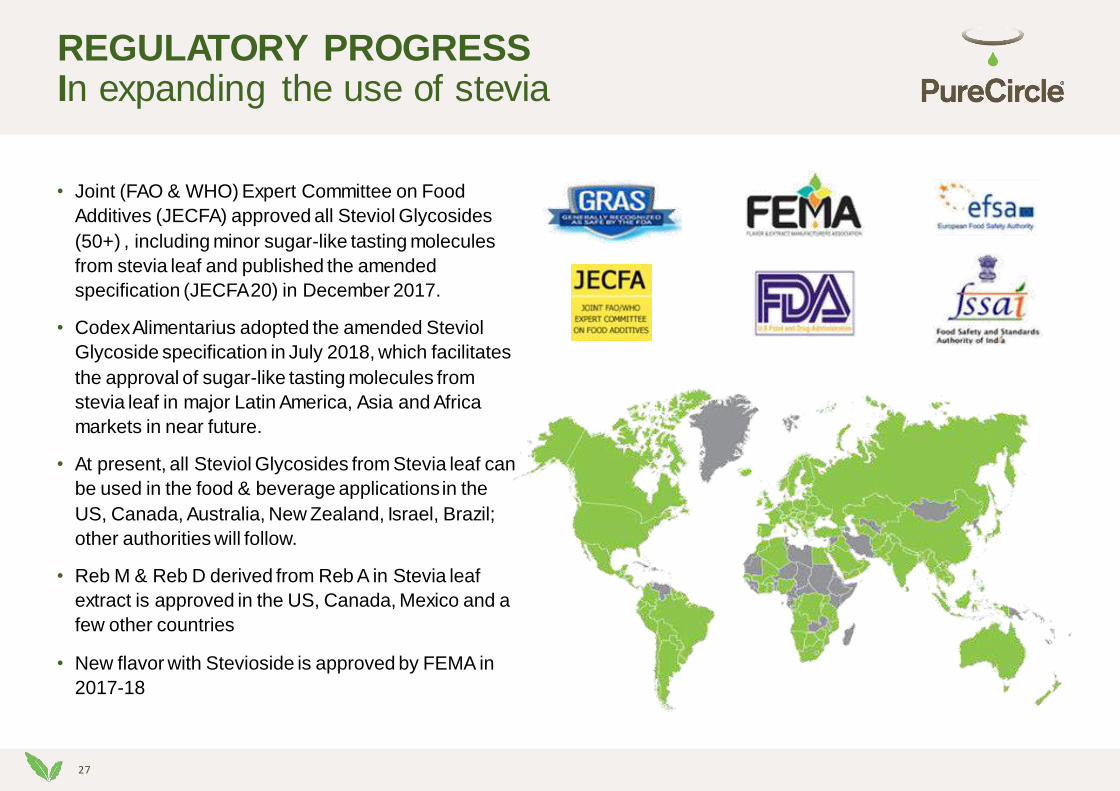
• Joint (FAO & WHO) Expert Committee on Food
Additives (JECFA) approved all Steviol Glycosides
(50+) , including minor sugar-like tasting molecules
from stevia leaf and published the amended
specification (JECFA 20) in December 2017.
• Codex Alimentarius adopted the amended Steviol
Glycoside specification in July 2018, which facilitates
the approval of sugar-like tasting molecules from
stevia leaf in major Latin America, Asia and Africa
markets in near future.
• At present, all Steviol Glycosides from Stevia leaf can
be used in the food & beverage applications in the
US, Canada, Australia, New Zealand, Israel, Brazil;
other authorities will follow.
• Reb M & Reb D derived from Reb A in Stevia leaf
extract is approved in the US, Canada, Mexico and a
few other countries
• New flavor with Stevioside is approved by FEMA in
2017-18
REGULATORY PROGRESS In expanding the use of stevia
28
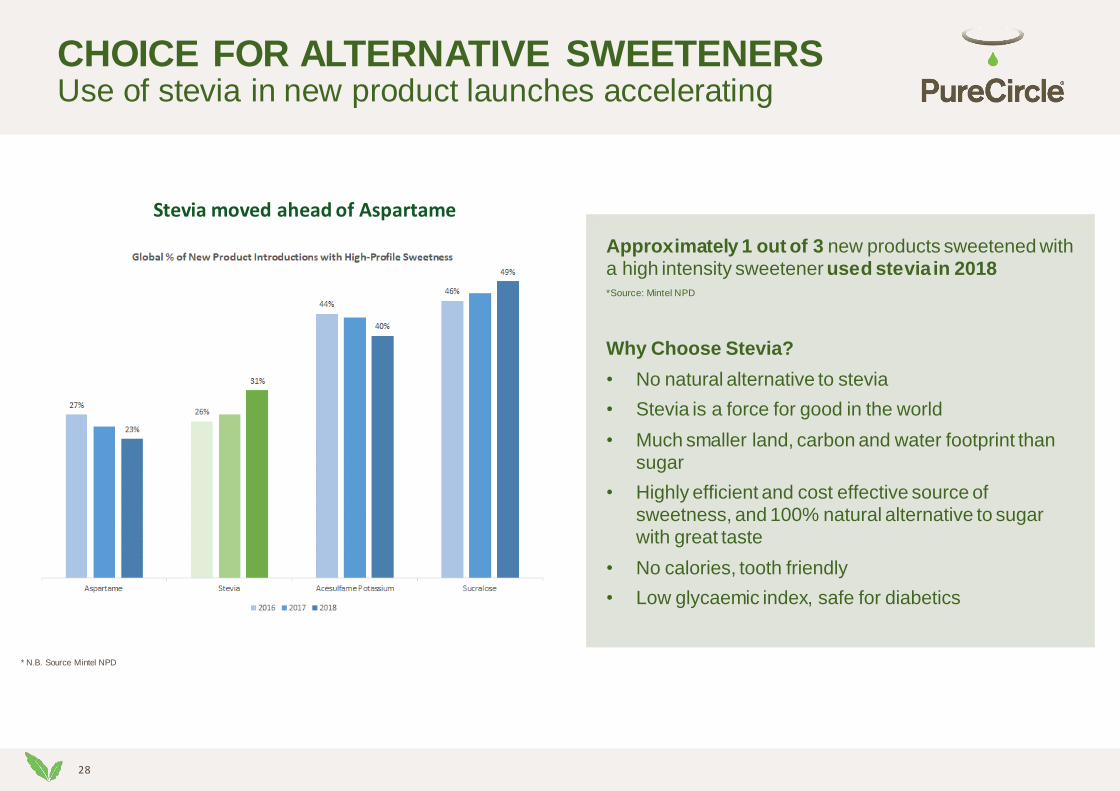
CHOICE FOR ALTERNATIVE SWEETENERSUse of stevia in new product launches accelerating
Approximately 1 out of 3 new products sweetened with a high intensity sweetener used stevia in 2018*Source: Mintel NPD
Why Choose Stevia?
• No natural alternative to stevia
• Stevia is a force for good in the world
• Much smaller land, carbon and water footprint than sugar
• Highly efficient and cost effective source of sweetness, and 100% natural alternative to sugar with great taste
• No calories, tooth friendly
• Low glycaemic index, safe for diabetics
* N.B. Source Mintel NPD
Stevia moved ahead of Aspartame
29
SUMMARY & OUTLOOK
Significant opportunities for growth
30
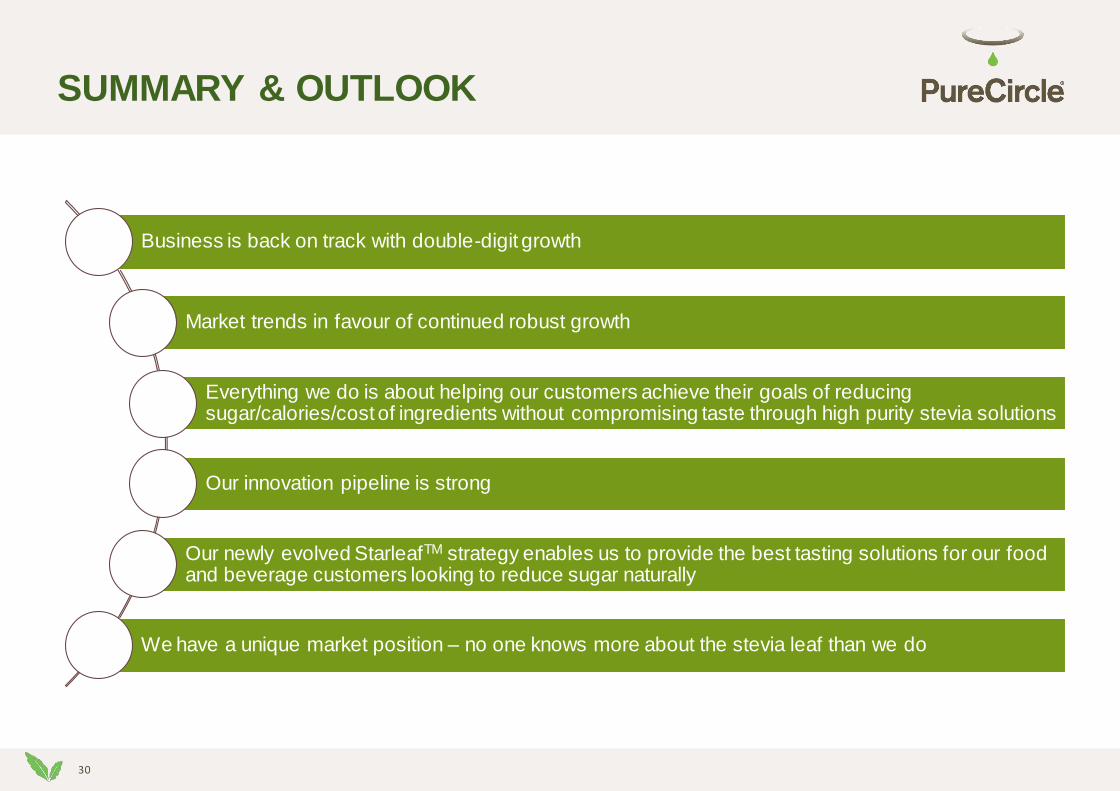
SUMMARY & OUTLOOK
Business is back on track with double-digit growth
Market trends in favour of continued robust growth
Everything we do is about helping our customers achieve their goals of reducing sugar/calories/cost of ingredients without compromising taste through high purity stevia solutions
Our innovation pipeline is strong
Our newly evolved StarleafTM strategy enables us to provide the best tasting solutions for our food and beverage customers looking to reduce sugar naturally
We have a unique market position – no one knows more about the stevia leaf than we do

3131
Q&A