Embed Size (px)
Citation preview
OracleRisk Management CloudCreating Analytics and Reports
Release 13 (update 17D)
Oracle Risk Management CloudCreating Analytics and Reports
Release 13 (update 17D)Part Number E89287-01Copyright © 2011-2017, Oracle and/or its affiliates. All rights reserved.
Author: David Christie
This software and related documentation are provided under a license agreement containing restrictions on use and disclosure and are protected byintellectual property laws. Except as expressly permitted in your license agreement or allowed by law, you may not use, copy, reproduce, translate, broadcast,modify, license, transmit, distribute, exhibit, perform, publish, or display any part, in any form, or by any means. Reverse engineering, disassembly, ordecompilation of this software, unless required by law for interoperability, is prohibited.
The information contained herein is subject to change without notice and is not warranted to be error-free. If you find any errors, please report them tous in writing.
If this is software or related documentation that is delivered to the U.S. Government or anyone licensing it on behalf of the U.S. Government, then thefollowing notice is applicable:
U.S. GOVERNMENT END USERS: Oracle programs, including any operating system, integrated software, any programs installed on the hardware, and/or documentation, delivered to U.S. Government end users are "commercial computer software" pursuant to the applicable Federal Acquisition Regulationand agency-specific supplemental regulations. As such, use, duplication, disclosure, modification, and adaptation of the programs, including any operatingsystem, integrated software, any programs installed on the hardware, and/or documentation, shall be subject to license terms and license restrictionsapplicable to the programs. No other rights are granted to the U.S. Government.
This software or hardware is developed for general use in a variety of information management applications. It is not developed or intended for use inany inherently dangerous applications, including applications that may create a risk of personal injury. If you use this software or hardware in dangerousapplications, then you shall be responsible to take all appropriate fail-safe, backup, redundancy, and other measures to ensure its safe use. OracleCorporation and its affiliates disclaim any liability for any damages caused by use of this software or hardware in dangerous applications.
Oracle and Java are registered trademarks of Oracle and/or its affiliates. Other names may be trademarks of their respective owners.
Intel and Intel Xeon are trademarks or registered trademarks of Intel Corporation. All SPARC trademarks are used under license and are trademarks orregistered trademarks of SPARC International, Inc. AMD, Opteron, the AMD logo, and the AMD Opteron logo are trademarks or registered trademarks ofAdvanced Micro Devices. UNIX is a registered trademark of The Open Group.
This software or hardware and documentation may provide access to or information about content, products, and services from third parties. OracleCorporation and its affiliates are not responsible for and expressly disclaim all warranties of any kind with respect to third-party content, products, andservices unless otherwise set forth in an applicable agreement between you and Oracle. Oracle Corporation and its affiliates will not be responsible for anyloss, costs, or damages incurred due to your access to or use of third-party content, products, or services, except as set forth in an applicable agreementbetween you and Oracle.
The business names used in this documentation are fictitious, and are not intended to identify any real companies currently or previously in existence.
Oracle customers that have purchased support have access to electronic support through My Oracle Support. For information, visit http://www.oracle.com/pls/topic/lookup?ctx=acc&id=info or visit http://www.oracle.com/pls/topic/lookup?ctx=acc&id=trs if you are hearing impaired.

Oracle Risk Management CloudCreating Analytics and Reports
Contents
Preface i
1 Introducing Risk Management Reporting 1Risk Management Analytics and Reports: Overview .................................................................................................. 1
Saving Analytics and Reports: Points to Consider .................................................................................................... 1
Security for Risk Management Analytics: Explained .................................................................................................. 2
Scheduling Analytics and Briefing Books: Procedure ................................................................................................ 2
Scheduling Reports: Procedure ................................................................................................................................ 3
2 Analytics 5Creating and Editing Analytics: Explained ................................................................................................................. 5
Financial Reporting Compliance Subject Areas: Explained ........................................................................................ 5
Analyses .................................................................................................................................................................... 6
Dashboards .............................................................................................................................................................. 8
3 Reports 11Creating and Editing Reports: Explained ................................................................................................................. 11
Creating Reports: Procedure .................................................................................................................................. 12
Data Models ........................................................................................................................................................... 12
Layouts ................................................................................................................................................................... 14

Oracle Risk Management CloudCreating Analytics and Reports
Oracle Risk Management CloudCreating Analytics and Reports
Preface
i
PrefaceThis preface introduces information sources that can help you use the application.
Oracle Applications HelpUse the help icon to access Oracle Applications Help in the application. If you don't see any help icons on your page,
click the Show Help icon in the global header. Not all pages have help icons. You can also access Oracle ApplicationsHelp at https://fusionhelp.oracle.com.
Using Applications Help
Watch: This video tutorial shows you how to find help and use help features.
Additional Resources• Community: Use Oracle Applications Customer Connect to get information from experts at Oracle, the
partner community, and other users.
• Guides and Videos: Go to the Oracle Help Center to find guides and videos.
• Training: Take courses on Oracle Cloud from Oracle University .
Documentation AccessibilityFor information about Oracle's commitment to accessibility, visit the Oracle Accessibility Program website at OracleAccessibility Program .
Access to Oracle SupportOracle customers that have purchased support have access to electronic support through My Oracle Support. Forinformation, visit http://www.oracle.com/pls/topic/lookup?ctx=acc&id=info or visit http://www.oracle.com/pls/topic/lookup?ctx=acc&id=trs if you are hearing impaired.
Comments and SuggestionsPlease give us feedback about Oracle Applications Help and guides! You can send e-mail to:[email protected].

Oracle Risk Management CloudCreating Analytics and Reports
Preface
ii
Oracle Risk Management CloudCreating Analytics and Reports
Chapter 1Introducing Risk Management Reporting
1
1 Introducing Risk Management Reporting
Risk Management Analytics and Reports: OverviewOracle Risk Management Cloud provides predefined subject areas from which you can build analyses, dashboards, andreports. The Oracle Risk Management Cloud: Creating Analytics and Reports Guide documents these subject areas anddiscusses how to develop the reporting instruments they support:
• An analysis is a display of real-time data. It may incorporate a table, chart, or both.
• A dashboard is a set of related analyses.
• Analytics is a generic term that encompasses analyses and dashboards.
• A report is a data snapshot formatted for printing.
Risk Management also provides predefined reports available from a Financial Compliance Reports work area. These aredocumented separately in Oracle Risk Management Cloud: Using Financial Reporting Compliance. They are unrelated to theanalytics and reports you can develop from subject areas.
Saving Analytics and Reports: Points to ConsiderYou save analyses, dashboards, and reports in the business intelligence (BI) catalog, along with other objects, includingprompts and filters. The catalog has a hierarchy of folders, with My Folders and Shared Folders at the top. One importantfolder is Custom, which you can find under Shared Folders. Use it to store your custom analytics and reports.
My FoldersYou're the only one who can access anything that you save in My Folders. You can see your saved items in My Folders onthe Reports and Analytics work area, but not in My Folders in the Reports and Analytics pane on any other work area. Theonly exception is when you create an analysis using the wizard in the Reports and Analytics pane, and save it in My Folders.In this case, the analysis is available in the pane on all work areas.
Shared FoldersIf you have the appropriate roles, you can also save in Shared Folders so that your custom analytics or reports are availableto anyone with the right access. You should save objects under the Custom subfolder, which has subfolders organized byproduct family.
Custom FolderIf you have access to Shared Folders, keep all custom analytics and reports in the Custom folder so that:
• You ensure that customized copies of those objects are not affected during upgrades, which can change predefinedanalytics and reports outside the Custom folder. You might lose customizations saved outside the Custom folderduring upgrades.
• You can easily find customized objects.

Oracle Risk Management CloudCreating Analytics and Reports
Chapter 1Introducing Risk Management Reporting
2
• You can edit objects in the Custom folder without compromising security on the original objects.
When you copy an object into the Custom folder, the copied object inherits the permission settings of the Custom folder. Anadministrator can reset the permissions on the object and the folder that it's in.
Related Topics
• Reports and Analytics Pane: Explained
• Creating and Editing Reports: Explained
• Creating and Editing Analytics: Explained
Security for Risk Management Analytics: ExplainedTo work with Risk Management subject areas, analytics, and reports, you must have a job role that includes a duty role calledFinancial Reporting Compliance Transaction Analysis Duty.
Your data access is determined by data security policies mapped to roles that provide other functional access. For example,suppose you are a controls manager for a New York business unit. You are assigned a job role that grants access to allfunctionality in the Controls work area. It's mapped to a data security policy that provides access only to controls taggedas being appropriate for the New York business unit. This data limitation applies also to your analytics and reports, even if adistinct job role gives you access to the reporting duty role.
For more on configuring functional and data access, see Risk Management Cloud: Securing Oracle Risk Management.
Scheduling Analytics and Briefing Books: ProcedureAnalytics and briefing books can run based on a schedule that you define. You can set up other automated tasks, forexample to deliver results to specific recipients or send notifications. You create what's called an agent to set this all up for ananalysis, dashboard, or briefing book. The agent itself is saved as an object in the business intelligence (BI) catalog.
Creating an Agent
1. Open the Reports and Analytics work area, or the Reports and Analytics pane if available in other work areas.2. Click the Browse Catalog button.3. Click New and select Agent under Actionable Intelligence.4. Ensure that you enter information on the Delivery Content tab to specify the analysis, dashboard, or briefing book to
run.5. Save the agent in My Folders.
Note: To edit an agent, browse the BI catalog to find the agent.
Related Topics
• Reports and Analytics Pane: Explained

Oracle Risk Management CloudCreating Analytics and Reports
Chapter 1Introducing Risk Management Reporting
3
Scheduling Reports: ProcedureReports can run based on a schedule that you define. You can set up other automated tasks, for example to deliver results tospecific recipients or send notifications. You submit a report with the schedule and criteria for other automated tasks defined.
If a report is set up as a scheduled process, you submit the process as you would any scheduled process. You can schedulethem from:
• Any work area where there is a link to the report.
• The Scheduled Processes work area, where you can submit all processes that you have access to.
• The Reports and Analytics work area or pane, if the report is set up for submission from there.
Submitting a Report or Scheduled ProcessFollow these steps:
1. Open the Reports and Analytics work area, or the Reports and Analytics pane if available in other work areas whereyou can find the report.
2. Click the name of your report.3. Click Schedule if the option is there. The report is set up as a scheduled process.
a. Enter any parameters to avoid unnecessarily large results.b. Click Advanced to enter a schedule, deliver results to a specific destination (including e-mail or printer), or
define criteria for sending notifications.4. If you don't see Schedule, then click View.
a. Click the Actions button for the report and select Schedule.b. Enter information similar to step 3.
Related Topics
• Scheduled Processes: Explained
• Reports and Analytics Pane: Explained
• Managing Scheduled Processes That You Submitted: Points to Consider
• Submitting Scheduled Processes and Process Sets: Procedure

Oracle Risk Management CloudCreating Analytics and Reports
Chapter 1Introducing Risk Management Reporting
4
Oracle Risk Management CloudCreating Analytics and Reports
Chapter 2Analytics
5
2 Analytics
Creating and Editing Analytics: ExplainedCreate and edit analytics to provide real-time reporting on your transactional data. You can:
• Create an analysis. You may, for instance, want to track overdue assessments. Your analysis includes assessmentname, state, and due date. It filters records to exclude completed assessments and include those with due datesearlier than the present date. An analysis may present information in a table, graphically, or both.
• Create a dashboard. You may, for example, group the overdue-assessment analysis together with other analysesthat display other information about assessments.
Analytics display data retrieved from subject areas, which are logical groupings of columns that store individual data points.
You may use the BI catalog to create either an analysis or a dashboard. For an analysis, however, you have the option ofusing a wizard available in the Reports and Analytics pane.
Financial Reporting Compliance Subject Areas: ExplainedTo create real-time analyses for Financial Reporting Compliance, familiarize yourself with its subject areas, folders, andattributes.
Subject AreasFinancial Reporting Compliance has two subject areas:
• Risk Management Cloud - Compliance Real Time
• Risk Management Cloud - Assessment Results Real Time
To create an analysis, begin by selecting a subject area containing columns of information to include in the analysis. Forexample, to create an analysis that displays records of overdue assessments, you would select the Risk Management Cloud -Assessment Results Real Time subject area.
The simplest and fastest way to generate an analysis is to use a single subject area. You can use more if one subject areadoes not contain all the dimension attributes and fact metrics you need. An analysis that does so is called a cross-subjectarea query.
FoldersEach subject area may have fact folders and dimension folders. Folders may have subfolders.
• Fact folders contain attributes that can be measured, meaning that they are numeric values.
• Dimension folders may hold attribute columns or hierarchy columns.
◦ An attribute represents a piece of information about an object. Values may be dates, IDs, or text.
Oracle Risk Management CloudCreating Analytics and Reports
Chapter 2Analytics
6
◦ A hierarchy contains values with parent-child relationships. For Risk Management purposes, only aPerspective folder in the Risk Management Cloud - Compliance Real Time subject area provides hierarchycolumns.
LimitationsIn both subject areas, certain dimension and fact folders are intended for reporting on features that are not yet supported. Asyou build analyses and reports, you are expected not to use these folders until their features are supported in a future release.These folders include any concerning:
• Processes
• Surveys
• Risk analysis, evaluation, treatments, or treatment plans
• Issue remediation plans
In the Risk Management Cloud - Assessment Results Real Time subject area:
• An Assessment Results folder contains Assessment Result Details and Control Test Plan Results subfolders. Theseshould not be reported with any fact other than Facts - Assessment Results.
In the Risk Management Cloud - Compliance Real Time subject area:
• Assessment Details should not be reported along with Facts - Issue.
• Facts - Remediation should be reported only along with the following dimensions: Issue Details, Time, and FiscalCalendar.
Analyses
Creating and Editing Analyses Using a Wizard: ProcedureYou can use a wizard that guides you through creating and editing analyses. Even though the wizard doesn't give you allavailable features, you can still use it to make typical changes, for example adding views or filters. For other tasks, such ascreating dashboards or deleting analyses, use the advanced business intelligence features.
Creating an Analysis
1. Open the Reports and Analytics work area, or the Reports and Analytics pane if available in other work areas.2. Click Create and select Analysis.3. Select the subject area that has the columns you want for your analysis.4. Optionally, add more subject areas or remove any that you no longer need.5. Select the columns to include, set options for each column, and click Next.6. Optionally, enter a title to display for the analysis.7. Select the type of table or graph to include, specify the layout of the views, and click Next.
Note: At any point after this step, you can click Finish to go to the last step, to save your analysis.
8. Optionally, set more options for the table or graph, and click Next.

Oracle Risk Management CloudCreating Analytics and Reports
Chapter 2Analytics
7
9. Optionally, add sorts or filters based on any of the columns you included, and click Next.10. If you have a table, optionally define conditional formatting for select columns, for example to display amounts over a
certain threshold in red. Click Next.11. Enter the name of your analysis and select a folder to save it in.12. Click Submit.
Editing an Analysis
1. Open the Reports and Analytics work area, or the Reports and Analytics if available in other work areas where youcan find the analysis.
2. Select your analysis in the pane and click Edit.3. Perform steps 4 through 10 from the preceding Creating an Analysis task, as needed.4. To update an existing analysis, select the same name in the same folder. To save this analysis as a new copy, either
name it with a new name or save it in a new folder.5. Click Submit.
Related Topics
• Reports and Analytics Pane: Explained
• Saving Analytics and Reports: Points to Consider
• Data Structure for Analytics: Explained
Creating and Editing Analyses with Advanced Features: ProcedureEven though you can use a wizard to create or edit analyses, you might have to use advanced features for complicatedanalyses or specific requirements. For example, you can create view selectors so that users can toggle between views withinan analysis, or define criteria for filters using SQL statements.
You can also perform other actions on analyses, for example delete them or copy and paste them within the businessintelligence catalog.
Creating or Editing an Analysis
1. Open the Reports and Analytics work area, or the Reports and Analytics pane if available in other work areas.2. Click the Browse Catalog button.3. Click the New button, select Analysis under Analysis and Interactive Reporting, and select a subject area.
Or, select your analysis in the Folders pane and click Edit.4. Use the tabs as described in this table.
Tab Task
Criteria
Select and define the columns to include. Add filters.
Results
Add views and set options for results.
Prompts Define prompts to filter all views in the analysis.

Oracle Risk Management CloudCreating Analytics and Reports
Chapter 2Analytics
8
Tab Task
Advanced
View or update the XML code and logical SQL statement that the analysis generates. Set options related to query performance.
5. Save your analysis.
Performing Other Actions on an Analysis
1. Open the Reports and Analytics work area, or the Reports and Analytics pane if available in other work areas whereyou can find the analysis.
2. Select your analysis in the pane and click More.3. Click More for your analysis and select the wanted action, for example Delete or Copy.
Related Topics
• Reports and Analytics Pane: Explained
• Data Structure for Analytics: Explained
• Saving Analytics and Reports: Points to Consider
Dashboards
Creating and Editing Dashboards: ProcedureYou can create and edit dashboards to determine their content and layout. In addition to objects in the business intelligence(BI) catalog, such as analyses, reports, and prompts, you can add text, sections, and more to a dashboard.
Creating a Dashboard
1. Open the Reports and Analytics work area, or the Reports and Analytics pane if available in other work areas.2. Click Browse Catalog.3. Click New and select Dashboard under Analysis and Interactive Reporting.4. Enter the dashboard's name and description, and select a folder to save in.5. With the Add content now option selected, click OK.6. Optionally, add more pages, or tabs, within the dashboard.7. Drag and drop items from the Dashboard Objects or Catalog pane to add content to a page.8. Click Save.
Note: The first dashboard page is saved with the page 1 name by default. To rename this page:1. Click the Catalog link.2. In the Folders pane, select your dashboard.3. For page 1, click More and select Rename.4. Enter the new name and click OK.
Oracle Risk Management CloudCreating Analytics and Reports
Chapter 2Analytics
9
Editing a Dashboard
1. Open the Reports and Analytics work area, or the Reports and Analytics pane if available in other work areas whereyou can find the dashboard.
2. Select your dashboard in the pane and click More.3. Click Edit.4. Perform steps 5 and 6 from the preceding Creating Dashboards task, and make other changes as needed, for
example:
◦ Remove content from the dashboard.
◦ Drag and drop within a page to move content around.
◦ Change the layout of a page.
Related Topics
• Saving Analytics and Reports: Points to Consider
• Reports and Analytics Pane: Explained

Oracle Risk Management CloudCreating Analytics and Reports
Chapter 2Analytics
10
Oracle Risk Management CloudCreating Analytics and Reports
Chapter 3Reports
11
3 Reports
Creating and Editing Reports: ExplainedUse reports to generate and print documents for internal operations, external business transactions, or legal requirements. Tomeet specific requirements, you must create or edit reports to capture different data, or present data in another way.
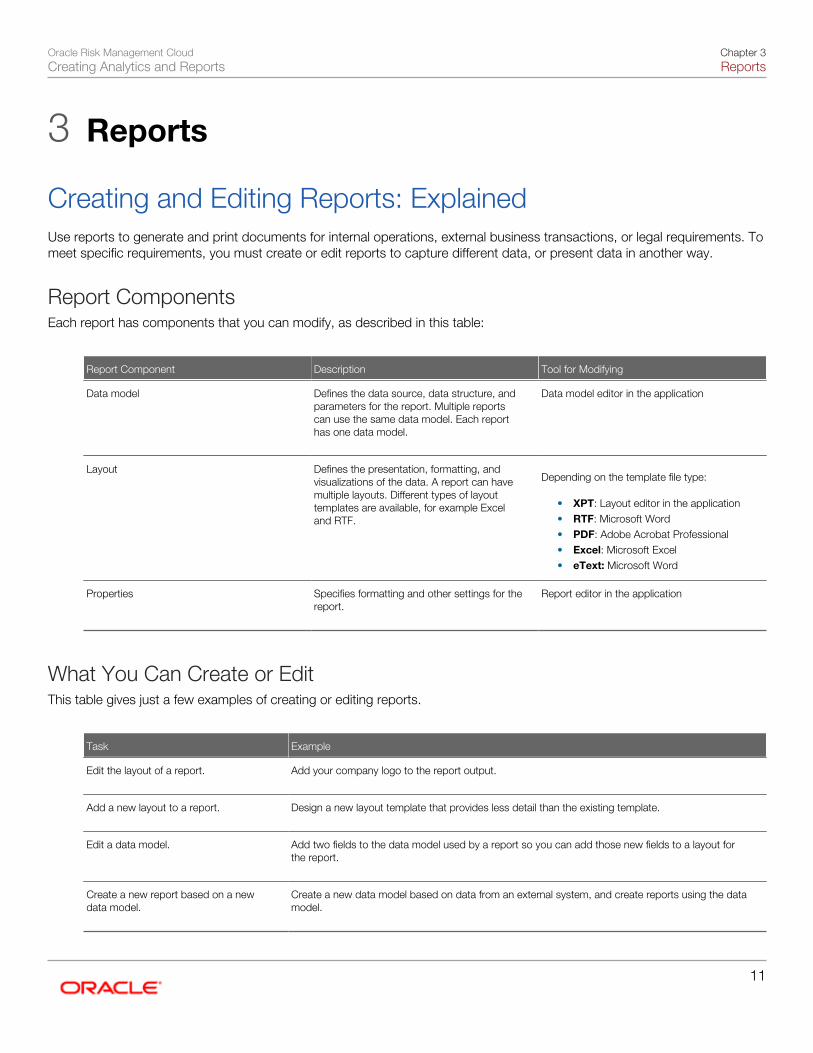
Report ComponentsEach report has components that you can modify, as described in this table:
Report Component Description Tool for Modifying
Data model
Defines the data source, data structure, andparameters for the report. Multiple reportscan use the same data model. Each reporthas one data model.
Data model editor in the application
Layout
Defines the presentation, formatting, andvisualizations of the data. A report can havemultiple layouts. Different types of layouttemplates are available, for example Exceland RTF.
Depending on the template file type:
• XPT: Layout editor in the application• RTF: Microsoft Word• PDF: Adobe Acrobat Professional• Excel: Microsoft Excel• eText: Microsoft Word
Properties
Specifies formatting and other settings for thereport.
Report editor in the application
What You Can Create or EditThis table gives just a few examples of creating or editing reports.
Task Example
Edit the layout of a report.
Add your company logo to the report output.
Add a new layout to a report.
Design a new layout template that provides less detail than the existing template.
Edit a data model.
Add two fields to the data model used by a report so you can add those new fields to a layout forthe report.
Create a new report based on a newdata model.
Create a new data model based on data from an external system, and create reports using the datamodel.
Oracle Risk Management CloudCreating Analytics and Reports
Chapter 3Reports
12
Related Topics
• Creating Reports: Procedure
• Accessing Report Components to Modify: Points to Consider
Creating Reports: ProcedureAs you create a report, you may select either a data model or a subject area as the data source for the report. If you planto use a data model, ensure that one has been created before you begin to develop the report. Risk Management does notprovide predefined data models.
Creating a Report
1. Open the Reports and Analytics work area, or the Reports and Analytics pane in other work areas, if it is availablethere.
2. Click Create and select Report.3. By default, a wizard prompts you to select a data model. Either do so, or click a Use Subject Area button and then
select a subject area.4. To continue using the wizard, accept the default Guide Me option and click Next. (You may instead opt to close the
wizard and use a report editor.)5. Select a report layout and click Next.6. Select columns from your data source. Also decide whether to display or hide a row of total values. Then click Next.7. In a final pane, accept a default View Report option and click Finish. (You may instead choose a Customize Report
Layout option, which opens the Layout Editor so that you can make further modifications.)
Setting Up AccessYou or your administrator can:
• Create a job definition so that users can run your custom report as a scheduled process.
• Set up the report for scheduling in the Reports and Analytics pane.
• Secure general access to your report and its job definition, if any.
Related Topics
• Setting Reports Up to Run as Scheduled Processes: Points to Consider
Data Models
Modifying Data Models: ProcedureA data model defines where data for a report comes from and how that data is retrieved. If a data model can't give you all thedata that you need in your report, then you can either copy and edit an existing data model or create a new one.

Oracle Risk Management CloudCreating Analytics and Reports
Chapter 3Reports
13
Creating a Data Model
1. In the business intelligence (BI) catalog, click the New button and select Data Model under Published Reporting.2. Optionally click the Data Model node in the Data Model pane to set properties for the data model.3. Click the Data Set node in the Data Model pane to create or edit data sets, which determine where and how to
retrieve data.4. Click the New Data Set button and select a data set type. It's best practice to use the BI repository as a data
source, so you should select either:
◦ Oracle BI Analysis: To use columns from a selected analysis.
◦ SQL Query: To use a Query Builder tool to define what to use from the repository. Select Oracle BI EE asthe data source.
5. Optionally, to limit the data included in the report output, click the Parameters node in the Data Model pane todefine variables that users can set when they use the report.
Note: The order of parameters is important if there are job definitions defined for reports that use yourdata model. If you change the order in the data model, you must also update the job definitions.
6. Optionally, define other components of the data model.7. Click Validate to validate your data model. Errors and warnings pertaining to query performance are displayed. In
case of errors in validation, the model is usable in development, but will not be available in production until errors areresolved.
8. Save your data model.
Editing a Data Model
1. To edit a predefined data model:
a. Find the data model in the BI catalog and click Copy.b. Paste within Shared Folders > Custom in a subfolder that has a folder path similar to the folder that stores
the original data model.c. For the data model you pasted, click More, and select Edit.
2. Optionally click the Data Model node in the Data Model pane to set properties for the data model.3. Click the Data Set node in the Data Model pane to create or edit data sets.
Most predefined data models are of type SQL Query, and are set up to get application data from the followingtables:
◦ ApplicationDB_FSCM: Financials, Supply Chain Management, Project Management, Procurement, andIncentive Compensation
◦ ApplicationDB_CRM: Sales
◦ ApplicationDB_HCM: Human Capital Management
4. Perform steps 5 through 8 from the preceding Creating a Data Model task, as needed.
Related Topics• Accessing Report Components to Modify: Points to Consider
• Setting Reports Up to Run as Scheduled Processes: Points to Consider
• Data Structure for Analytics: Explained

Oracle Risk Management CloudCreating Analytics and Reports
Chapter 3Reports
14
Layouts
Creating and Editing Report Layouts: OverviewThe layout determines what and how data is displayed on report output. Each report has at least one layout template. Thistopic describes the following aspects of report templates:
• Layout templates
• Layout template types
• Overall process of managing layouts
• Deleting layout templates
Layout TemplatesTo modify a layout, you edit the layout template, which:
• Defines the presentation components, such as tables and labeled fields.
• Maps columns from the data model to these components so that the data is displayed in the right place.
• Defines font sizes, styles, borders, shading, and other formatting, including images such as a company logo.
Layout Template TypesThere are a few types of template files to support different report layout requirements.
• RTF: Rich text format (RTF) templates created using Microsoft Word.
• XPT: Created using the application's layout editor, these templates are for interactive and more visually appealinglayouts.
• eText: These templates are specifically for Electronic Data Interchange (EDI) and electronic funds transfer (EFT)information.
You can also create and edit other types of templates using Adobe PDF, Microsoft Excel, Adobe Flash, and XSL-FO.
Overall Process to Create or Edit LayoutsEditing or creating report layout, for example using Microsoft Word or the layout editor, involves making the actual changes tothe template file. But that task is just one part of the entire process for modifying layouts.
1. Copy the original report and save the new version in Shared Folders > Custom in the business intelligence (BI)catalog. You create or edit templates for the new copy of the report.
Tip: You can use the Customize option if the original is a predefined report.
2. Review report settings for online viewing.3. Generate sample data for the report.4. Edit or create the layout template file.5. Upload the template file to the report definition. Skip this step if you're using the layout editor.6. Configure the layout settings.
Oracle Risk Management CloudCreating Analytics and Reports
Chapter 3Reports
15
Deleting Layout TemplatesTo remove a layout template for a report:
1. Select your report in the BI catalog and click Edit.2. In the report editor, click View a list.3. Select the layout template and click Delete.
Making Reports Available for Online Viewing: ProcedureSome reports are set up so that you can only view them through another application or submit them as scheduled processes.To view your report online while you're editing it, you must define a few settings. When you're done editing your report, makesure that you reset these settings as needed.
Updating Report Properties
1. Select your report in the business intelligence catalog and click Edit.2. In the report editor, click Properties.3. In the Report Properties dialog box, select Run Report Online and deselect Report is Controlled by External
Application.
Updating Layout Settings
1. Back in the report editor, click View a list.2. Make sure that the View Online check box is selected.
Related Topics
• Accessing Report Components to Modify: Points to Consider
Generating Sample Report Data: ProcedureDepending on the type of report layout changes you're making, sample data can be required or optional. You generatesample data, and then load it for use with your layout so that you can map data fields to layout components. For example, forthe Start Date table column in your layout, you can set it so that the data displayed in that column comes from the Start Datefield in the sample data.
You can generate sample data from the:
• Report data model
• Report viewer
• Scheduler
Generating Sample Data from the Data ModelFollow these steps:
1. Select your data model in the business intelligence (BI) catalog and click Edit. Alternatively:
a. In the catalog, find the report to generate sample data for and click Edit.
Oracle Risk Management CloudCreating Analytics and Reports
Chapter 3Reports
16
b. Click the data model name in the report editor.2. In the data model editor, click View Data.3. Enter values for any required parameters, select the number of rows to return, and click View.4. To save the sample data to the data model, click Save As Sample Data.
If you're designing a .rtf template, click Export to save the file locally.5. Save the data model.
Saving Sample Data from the Report ViewerFor reports that are enabled for online viewing, you can save sample data from the report viewer:
1. Select the report in the BI catalog.2. Click Open to run the report in the report viewer with the default parameters.3. On the Actions menu, click Export, then click Data.4. Save the data file.
Saving Sample Data from the SchedulerFor reports that are enabled for scheduling (not necessarily as a scheduled process), you can save sample data from thescheduler:
1. Select the report in the BI catalog.2. Click Schedule.3. On the General tab, enter values for any report parameters.4. On the Output tab, ensure that Save Data for Republishing is selected.5. Click Submit.6. Open the Report Job History page.7. On the global header, click Open, then click Report Job History.8. Select your report job name in the Job Histories table.9. On the details page, under Output and Delivery, click the XML Data Download icon button.
Related Topics• Accessing Report Components to Modify: Points to Consider
Creating and Editing Report Layout Templates Using the LayoutEditor: ProcedureThe layout editor in the application provides an intuitive, drag-and-drop interface for creating pixel-perfect reports with PDF,RTF, Excel, PowerPoint, and HTML output. The layout template files you create with this tool have an .xpt extension. Thelayout editor tool is the only editing tool that provides dynamic HTML output. Users can interact with this output in a browser,for example by sorting, applying filters, and so on.
PrerequisiteMake sure that sample data is generated from the data model that your report is using.
Using the Layout EditorTo create or edit XPT templates:
1. Select the report in the business intelligence (BI) catalog and click Edit.2. In the report editor, click Edit to update a template.
Oracle Risk Management CloudCreating Analytics and Reports
Chapter 3Reports
17
Or, click Add New Layout and select a template type under the Create Layout section.3. Create or edit the layout.4. Click Save to save the layout to the report definition.
Related Topics• Accessing Report Components to Modify: Points to Consider
Setting Up for RTF and Excel Report Layout Templates: ProcedureYou can use Microsoft Word or Microsoft Excel to create or edit RTF and Excel layout templates, in addition to the layouteditor in the application. If you use Word or Excel directly, you must download and install the appropriate add-in so that theMicrosoft application has the features you need to design report layouts.
Note: If you're designing a new layout for your report, consider using the layout editor instead unless you are anexperienced layout designer.
Installing the Add-In
1. Open the Reports and Analytics work area, or the Reports and Analytics pane if available in other work areas.2. Click the Browse Catalog button.3. Click Home.4. Under the Get Started pane, click Download BI Desktop Tools.5. Select the add-in for the type of template you're working with.
◦ Template Builder for Word: RTF templates
◦ Analyzer for Excel: Excel templates
6. Save and then run the installer.
Related Topics• eText Report Layout Templates: Explained
Creating and Editing RTF Report Layout Templates: ProcedureAn RTF template is a rich text format file that contains the layout instructions to use when generating the report output. UseMicrosoft Word with the Template Builder for Word add-in to design RTF templates.
PrerequisitesInstall the Template Builder for Word add-in, and generate sample data.
Using Template Builder for WordTo modify an RTF template:
1. If you are editing an existing layout:
a. Select your report in the business intelligence catalog and click Edit.
Oracle Risk Management CloudCreating Analytics and Reports
Chapter 3Reports
18
b. In the report editor, click the Edit link of the layout to download the RTF file.If you are creating a new layout, skip this step.
2. Open the downloaded RTF template file in Microsoft Word. Or, if you're creating a new template, just open MicrosoftWord.
3. Load the sample data that you generated.4. Edit or create the layout template.5. Save the file as Rich Text Format (RTF).
Related Topics• Accessing Report Components to Modify: Points to Consider
Uploading the Layout Template File to the Report Definition:ProcedureIf you're creating or editing a report layout using the layout editor, the layout is automatically saved to the report definition, soyou can skip this step. For all other layout types, for example RTF, upload the template file to the report definition after you'redone making layout changes.
Uploading the Template File
1. Select your report in the business intelligence catalog and click Edit.2. In the report editor, click View a list.3. In the table that lists the layouts, click Create.4. Under Upload or Generate Layout, click Upload.5. In the Upload Template File dialog box:
a. Enter a layout name.b. Browse for and select the layout template file that you created or edited.c. Select the template file type.d. Select the locale, which you can't change once the template file is saved to the report definition.e. Click Upload.
6. Save the report definition.
Related Topics• Accessing Report Components to Modify: Points to Consider
• eText Report Layout Templates: Explained
Configuring Layout Settings for Reports: ProcedureAs part of creating or editing layout, you can set report properties related to layout. These settings determine, for example,which layouts users can choose from when viewing or scheduling the report. The settings apply only to your report.
Setting Layout Properties
1. Select your report in the business intelligence catalog and click Edit.
Oracle Risk Management CloudCreating Analytics and Reports
Chapter 3Reports
19
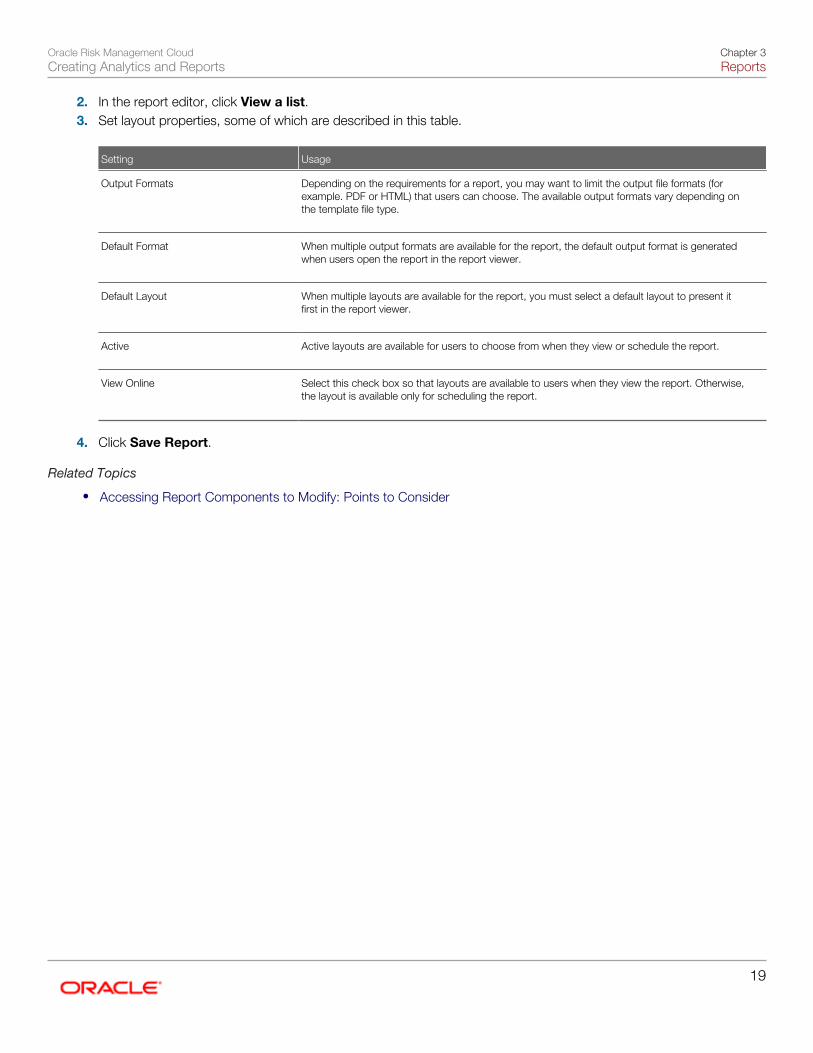
2. In the report editor, click View a list.3. Set layout properties, some of which are described in this table.
Setting Usage
Output Formats
Depending on the requirements for a report, you may want to limit the output file formats (forexample. PDF or HTML) that users can choose. The available output formats vary depending onthe template file type.
Default Format
When multiple output formats are available for the report, the default output format is generatedwhen users open the report in the report viewer.
Default Layout
When multiple layouts are available for the report, you must select a default layout to present itfirst in the report viewer.
Active
Active layouts are available for users to choose from when they view or schedule the report.
View Online
Select this check box so that layouts are available to users when they view the report. Otherwise,the layout is available only for scheduling the report.
4. Click Save Report.
Related Topics
• Accessing Report Components to Modify: Points to Consider

Oracle Risk Management CloudCreating Analytics and Reports
Chapter 3Reports
20
Oracle Risk Management CloudCreating Analytics and Reports
Glossary
21
Glossary
analysis
A selection of data displayed in one or more views, such as a table or chart, to provide answers to business questions.
analytics
Business intelligence objects such as analyses and dashboards that provide meaningful data to help with decision making.
briefing book
A collection of static or updatable analyses or dashboard pages that you can download, print, and share with others.
business intelligence catalog
The repository where all business intelligence objects, including analyses, reports, briefing books, and agents, are stored. Thecatalog contains separate folders for personal, shared, and modified objects.
business intelligence repository
The metadata that determines all of the columns, or pieces of data, that you can include in analytics. You can also use therepository as a source of data for reports.
dashboard
A page that provides quick access to key tasks and summary information for various objects within a functional area ofinterest.
dashboard
A collection of analyses and other content, presented on one or more pages to help users achieve specific business goals.Each page is a separate tab within the dashboard.
data model
The metadata that determines where data for a report comes from and how that data is retrieved.
EDI
Abbreviation for electronic data interchange.
EFT
Acronym for Electronic Funds Transfer. A direct transfer of money from one account to another, such as an electronicpayment of an amount owed a supplier by transferring money from a payer's disbursement bank account into the supplier'sbank account.
Oracle Risk Management CloudCreating Analytics and Reports
Glossary
22
job definition
The metadata that determines what a job does and what options are available to users when they submit the scheduledprocess. A job is the executable for a scheduled process.
prompt
A parameter that you set when you use analytics, limiting the data in the analysis or in all analyses on the dashboard ordashboard page (tab).
report
An output of select data in a predefined format that's optimized for printing.
scheduled process
A program that you run to process data and, in some cases, generate output as a report.
subject area
A set of columns, or pieces of data, related to a specific business object or area.
view
A specific way to present the results of an analysis, for example as a table or graph. Other types of views, such as the titleview, show other components of the analysis.
work area
A set of pages containing the tasks, searches, and other content you need to accomplish a business goal.