Embed Size (px)
Citation preview

Minnesota Population Center Training and Development
Creating an Area-level Extract
Exercise Objective: Use the IPUMS Terra website to obtain a customized dataset that can be used to answer research questions. This exercise uses area-level and raster data to explore temporal and spatial changes in Brazilian population and land cover.

2
IPUMS Terra: Area-level Data Extract Overview
RESEARCH QUESTIONS
Question 1 Examine the interoperable (raster and area-level) datasets for Brazil over three decennial censuses. What trends exist over time in education, employment, agriculture, urbanization, and deforestation?
Question 2 Examine the drivers of natural resource use in Brazil. How does population growth relate to natural resource consumption?
OBJECTIVES
Create an IPUMS Terra account
Create and download a IPUMS Terra area -level data extract
Use IPUMS Terra to generate raster summarizations for geographic areas
TERRAPOP VARIABLES
Area-level variables
Raster variables
POPTOTAL: Total population for tabulated census areas
UNEMP: Percent of population unemployed in each census area
PROF: Percent of workers in professional, technical or managerial occupations in each census area
EDATTAIN: Percent of population with a specific educational attainment in each census area
AGRIC: Percent of employed persons in each census area working in agriculture, fishing, or forestry sectors
URBANIZ: Percent of population living in urban areas
EVRGRNBRDLF: Area of evergreen broadleaf forest
URBAN: Urban area
CROPLAND: Area devoted to crops

3
IPUMS Terra: Area-level Data Extract Overview
Data Type Descriptions
Area-level Area-level data describe geographic units defined by boundaries. Geographic units are grouped in sets, such as the counties of the United States or the states of Brazil. In IPUMS Terra, these sets of units are referred to as geographic levels. The data are structured as tables, with a row for each unit and a column for each variable. For example, you may have a table with a row for each county in the United States and columns containing the number of males and the number of females in each county.
Raster Raster data describe how the value of a variable varies over space. The data are structured as a grid of cells. Each cell is connected to a location, and contains the value of the variable at that location. For example, in a land cover raster, each cell indicates the type of land cover found at that location.

4
Step 1 Sign up
After you have registered with IPUMS Terra, an e-mail will be sent to your account notifying you of approval. Note: Please be sure to check your trash/spam folders
Open the e-mail and click on the confirmation link. You will then be logged into IPUMS Terra
Step 2 Email
Confirmation
and log in
REGISTERING WITH IPUMS TERRA The Minnesota Population Center uses a common user management system for several data projects: IPUMS Terra, IPUMS International, IPUMS USA, IPUMS CPS, IPUMS Higher Ed, IPUMS NAPP, IPUMS NHGIS, IPUMS Health Surveys, and IPUMS Time Use. If you have an existing account with any of these systems, you will use the same account for IPUMS Terra.
Go to https://data.terrapop.org/
If you have an existing MPC account, click Login. After logging in, you will be directed to the registration page for IPUMS Terra.
If you do not have an MPC account, click on Sign up to register for access.
Note: Microdata access is NOT required for this exercise. Access to international microdata requires application and approval by the IPUMS International project.
5
The extract builder website guides researchers through the workflows for building data extracts. Choose the type of data structure you would like to receive as output for further analysis. In this tutorial, we will be working with aggregate or area-level data.
For an area-level extract, you first select area-level variables and datasets, then select
the geographic levels that will form the rows in your extract. Next you select raster
variables that will be summarized over each geographic unit, select time points if nec-
essary, and select the operations used to perform the summarization. Finally you re-
view and submit your extract.
Step 3 Start an
Area-level
Extract
Click on the Start Extract button for Area-level Output
6
Step 4 Examine the
IPUMS Terra
Interface
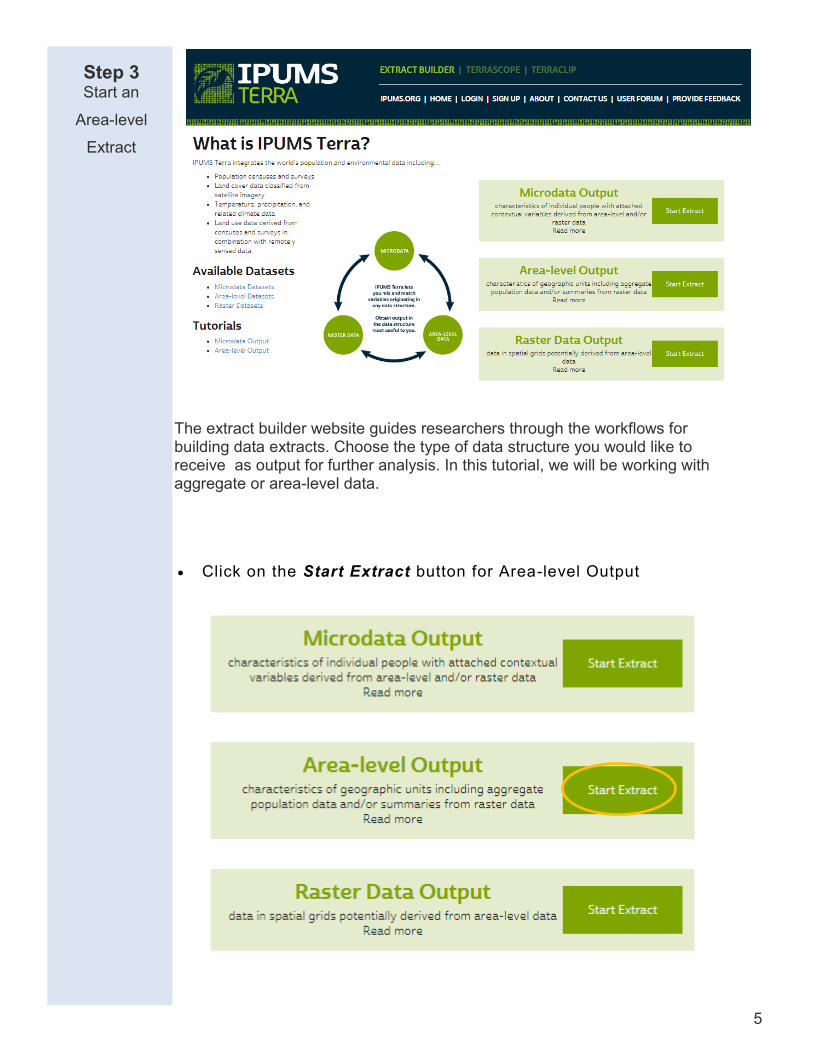
The IPUMS Terra interface for the first step of the workflow consists of the following elements: Navigation Bar: Shows the major steps in the workflow, the sub-steps of the current step, and your progress through the workflow. The navigation bar steps will reflect the workflow you select. The step and sub-step you are currently on are highlighted in green. Data Cart: Provides a summary of the data you have selected to include in your extract. The data cart is updated as you make selections throughout the workflow. Availability Grid: Shows the availability of variables by dataset and enables selection of variables and datasets. Variables Panel: Lists topics for which area-level variables are available. Clicking on a topic will populate the rows of the availability grid with the variables in that topic. Datasets Panel: Lists countries in the IPUMS Terra system, and provides options to filter by time and hide countries without area-level data. Clicking on a continent will list the countries in the continent. Clicking on a country will populate the columns of the availability grid with the datasets available for that country. You may add all countries in a continent to the grid by clicking the “Browse All” line.
Navigation Bar
Variables Datasets
Availability Grid
Data Cart
7
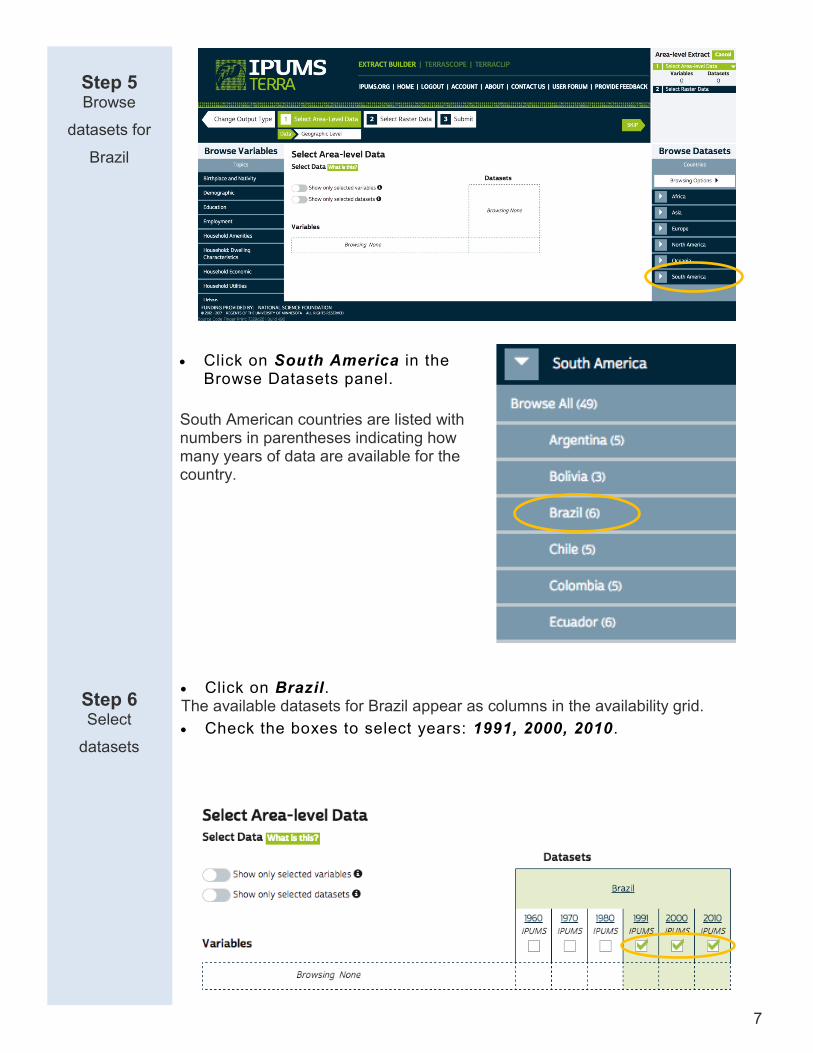
Step 5 Browse
datasets for
Brazil
Click on Brazil. The available datasets for Brazil appear as columns in the availability grid.
Check the boxes to select years: 1991, 2000, 2010.
Click on South America in the Browse Datasets panel.
South American countries are listed with numbers in parentheses indicating how many years of data are available for the country.
Step 6 Select
datasets

8
Step 7 Select Area-
level
variables
To see available variables, choose a topic in the Browse Variables panel.
Choose the variable topic Education. The availability grid will be updated with available education variables.
Choose the variable-group EDATTAIN, by checking the multi-select box.
EDATTAIN is available for Brazil in the years 1991, 2000, and 2010. The variables in the EDATTAIN group will be added to your Data Cart. You can expand the variable group to see the individual variables by clicking the arrow widget Note: EDATTAIN contains 4 variables for different types of education Note: You can hide unselected datasets by clicking the “Show only selected datasets” toggle.

9
Step 8 Add Area-
level
Variables
Continue Adding variables to your extract by selecting the following area- level variables:
Demographic POPTOTAL
Employment UNEMP
Employment PROF
Employment AGRIC
Urban URBANIZ IPUMS Terra also provides metadata about each variable. To access the metadata, you must first expose the individual variables within a variable group.
Once the variable group is open, click on the individual variable name UNEMPLOY to get additional metadata (eg., documentation about the variable, description, availability, and source).
Step 9 View
Variable
Metadata

10
When you have selected both area-level variables and area-level datasets, the NEXT button will become active and turn green, allowing you to move on to the next step.
Note: Verify that your Data Cart has the correct number of variables and datasets.
Step 10 Move to
Geographic
Level
Selection
The Navigation Bar indicates that the next step will be to select geographic levels.
Click NEXT to move to the geographic level selection screen.

11
Step 9 Select a
Harmonized
Geographic
Level
Our research question involves examining how deforestation has changed between 1991 and 2010. In order to study change over time, it is important to use geographic units with boundaries that are consistent over the time frame under study. In IPUMS Terra, such units are referred to as Harmonized. If harmonized units are not used, apparent changes may be due to changing boundaries rather than actual change in deforestation.
For Brazil consistent geographic boundaries are only available over our full study time frame at the First Administrative Level, State.
Change “Administrative Level” to 1st
Administrative Level . The cart will update to show your selections.
Now the Geographic Level table shows that you have harmonized geographic units across the entire time period.
Click NEXT
12
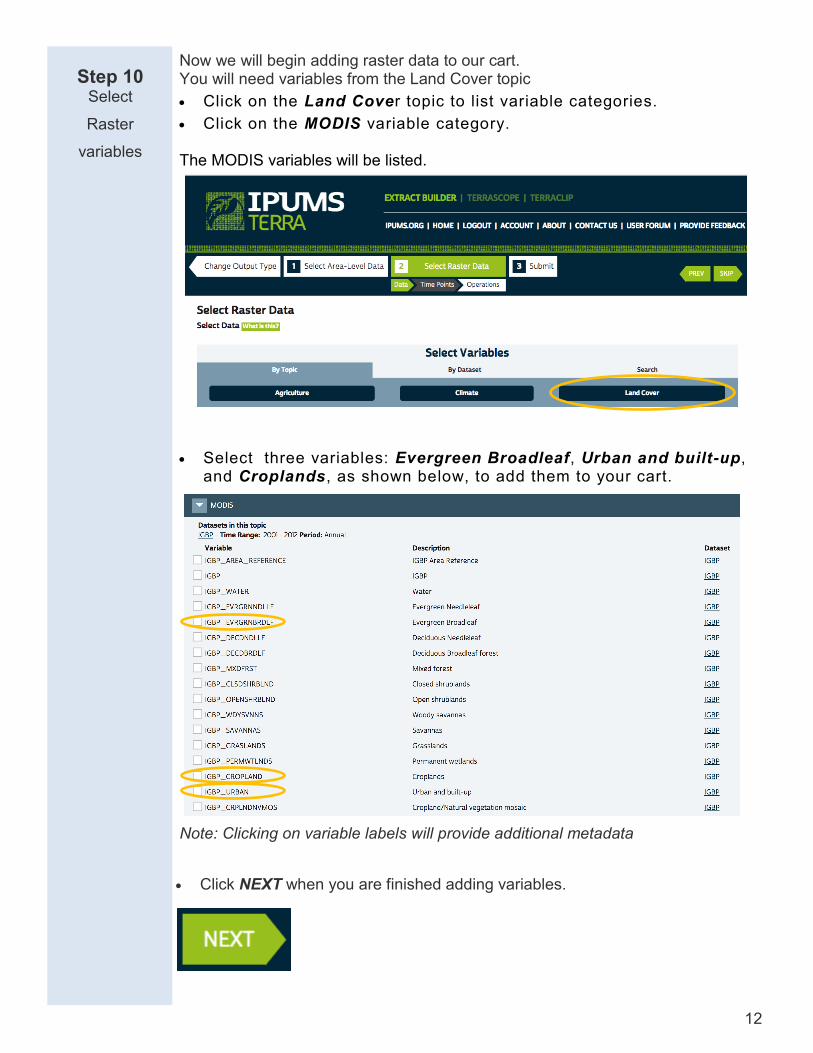
Step 10 Select
Raster
variables
Now we will begin adding raster data to our cart. You will need variables from the Land Cover topic
Click on the Land Cover topic to list variable categories.
Click on the MODIS variable category. The MODIS variables will be listed.
Note: Clicking on variable labels will provide additional metadata
Select three variables: Evergreen Broadleaf, Urban and built-up, and Croplands, as shown below, to add them to your cart.
Click NEXT when you are finished adding variables.

13
Step 11 Select time
points for
Raster
variables
MODIS data are available at annual time steps for 2001-2012. You must select which years to include in your extract. Ideally, the MODIS data years will match the census years of your area-level data.
Note: The Geographic Levels section of your cart shows the years of your area -level data, along with the Countries.
The time points closest to the area-level years are 2001 and 2010.
Click on years 2001 and 2010
Click NEXT
Click “Switch to multiple time points” so you can select multiple years

14
Step 12 Select Sum-
marization
Operations
for Raster
Variables
Check Percent Area and Total Area on the Binary line of the table to select these operations for all of your selected variables.
Click NEXT to go to the Submit step. Note: You can see the individual variables by expanding the Binary section of the table.
Step 13 Check Data
Cart
Review your cart in the right panel Your data cart should match the screenshot below
Because we are creating an extract for output as area-level data, we must summarize the raster variables over each geographic unit. Depending on the type of raster variable, there are several possible ways to perform the summa-rization. The raster variables we have chosen are all “Binary” type. In the original MODIS IGBP data, each cell has a value indicating the type of land cover at that location, such as Urban or Cropland. In the binary variables, the cells with a given land cover type, such as Urban, are given a value of 1 and all other cells are given a value of 0. To summarize binary variables over geographic units, the options are Percent Area, which will calculate the percent of each unit’s area that is covered by the variable’s land cover type, and Total Area, which will calculate the total area (in hectares or square meters) of the variable’s land cover in each unit.

15
Step 14 Submit
Extract
Give your extract a short, descriptive Extract Title, maybe, “Brazil education, employment, deforestation”. The Extract Title will appear in your Extract History.
You may also provide more detailed Extract Notes, perhaps describing why you created the extract. These notes will appear on the extract details page. (The extract details page has not yet been implemented.)
If you want the GIS shapefiles for the geographic levels used in your extract, check the box to “Include boundary files.” (Not required for this exercise)
Click Submit Extract
You will receive an email when the extract is ready

16
Step 15 Download
your extract
To download the data, follow the link in the e-mail. You can also access your extracts on your account’s Extract History page, as shown below.
The data will be delivered in a compressed format, make sure you have software available to extract the files.