Embed Size (px)
Citation preview

Copyright © Michael Porter 2010120100730 Cerner FINAL
Creating a Value-Based Health Care Organization:
The Strategic Agenda
Professor Michael E. Porter
Harvard Business School
Cerner CEO Summit
July 30, 2010
This presentation draws on Redefining Health Care: Creating Value-Based Competition on Results (with Elizabeth O. Teisberg), Harvard Business
School Press, May 2006; ―A Strategy for Health Care Reform—Toward a Value-Based System,‖ New England Journal of Medicine, June 3, 2009;
―Value-Based Health Care Delivery,‖ Annals of Surgery 248: 4, October 2008; ―Defining and Introducing Value in Healthcare,‖ Institute of Medicine
Annual Meeting, 2007. Additional information about these ideas, as well as case studies, can be found the Institute for Strategy & Competitiveness
Redefining Health Care website at http://www.hbs.edu/rhc/index.html. No part of this publication may be reproduced, stored in a retrieval system, or
transmitted in any form or by any means — electronic, mechanical, photocopying, recording, or otherwise — without the permission of Michael E. Porter
and Elizabeth O.Teisberg.

Copyright © Michael Porter 2010220100730 Cerner FINAL
Redefining Health Care Delivery
• Universal coverage and access to care are essential, but not
enough
• The core issue in health care is the value of health care
delivered
Value: Patient health outcomes per dollar spent
• How to design a health care system that dramatically improves
patient value
– Ownership of entities is secondary (e.g. non-profit vs. for profit vs.
government)
• How to construct a dynamic system that keeps rapidly improving

Copyright © Michael Porter 2010320100730 Cerner FINAL
Creating a Value-Based Health Care System
• Significant improvement in value will require fundamental
restructuring of health care delivery, not incremental
improvements
- Process improvements, lean production concepts, safety
initiatives, care pathways, disease management and other
overlays to the current structure are beneficial, but not
sufficient
- Consumers cannot fix the dysfunctional structure of the
current system
Today, 21st century medical technology is
often delivered with 19th century
organization structures, management
practices, and pricing models

Copyright © Michael Porter 2010420100730 Cerner FINAL
Creating Competition on Value
• Competition for patients/subscribers is a powerful force to
encourage restructuring of care and continuous improvement in
value
• Today’s competition in health care is not aligned with value
Financial success of Patient
system participants success
• Creating positive-sum competition on value is a central
challenge in health care reform in every country

Copyright © Michael Porter 2010520100730 Cerner FINAL
Principles of Value-Based Health Care Delivery
The central goal in health care must be value for patients, not access, volume, convenience, or cost containment
Value =Health outcomes
Costs of delivering the outcomes
How to design a health care system that dramatically improves
patient value
• Outcomes are the full set of patient health outcomes over
the care cycle
• Costs are the total costs of care for the patient’s condition
over the care cycle

Copyright © Michael Porter 2010620100730 Cerner FINAL
Principles of Value-Based Health Care Delivery
• Better health is the goal, not more treatment
• Better health is inherently less expensive than poor health
- Prevention of illness and
recurrences
- Early detection
- Right diagnosis
- Right treatment to the right
patient
- Early and timely treatment
- Treatment earlier in the causal
chain of disease
- Rapid cycle time of diagnosis
and treatment
- Less invasive treatment
methods
- Fewer complications
- Fewer mistakes and repeats in
treatment
- Faster recovery
- More complete recovery
- Less disability
- Fewer relapses or acute
episodes
- Slower disease progression
- Less need for long term care
- Less care induced illness
Quality improvement is the key driver of cost containment and value
improvement, where quality is health outcomes

Copyright © Michael Porter 2010720100730 Cerner FINAL
40 45 50 55 60
Jönköping
County Council
Quality Index
Health Care
Cost Per
Capita (SEK)
Gotland
Gävleborg
Halland
Jämtland
Dalarna
Västmanland
Västernorrland
Västerbotten
Värmland
UppsalaSörmland
Stockholm
Skåne
Norrbotten
Kronoberg
Kalmar
20,000
22,000
18,000
16,000
Östergötland
Örebro
Västragötaland
Note: Cost including; primary care, specialized somatic care, specialized psychiatry care, other medical care, political health- and medical care activities, other subsidies (e.g. drugs) Source: Öpnna jämförelser, Socialstyrelsen 2008;Sjukvårdsdata i fokus 2008; BCG analysis
Higher
cost
Lower
Quality
Higher
Quality
Lower
cost
Cost versus Quality, Sweden
Health Care Spending by County, 2008

Copyright © Michael Porter 2010820100730 Cerner FINAL
Creating a Value-Based Health Care Delivery Organization
The Strategic Agenda
1. Organize into Integrated Practice Units Around Patient
Medical Conditions (IPUs)
− Including primary and preventive care for distinct patient
populations
2. Measure Outcomes and Cost for Every Patient
3. Move to Bundled Prices for Care Cycles
4. Create an Integrated Health System
5. Grow and Affiliate to Drive Excellence
6. Develop an Enabling Information Technology Platform

Copyright © Michael Porter 2010920100730 Cerner FINAL
• A medical condition is an interrelated set of patient
medical circumstances best addressed in an
integrated way
– Defined from the patient’s perspective
– Including the most common co-occurring conditions and
complications
– Involving multiple specialties and services
1. Organize into Integrated Practice Units Around
Patient Medical Conditions (IPUs)
Examples of Medical Conditions:
• Diabetes
• Asthma
• Multiple Sclerosis
• Breast Cancer

Copyright © Michael Porter 20101020100730 Cerner FINAL
Source: Porter, Michael E., Clemens Guth, and Elisa Dannemiller, The West German Headache Center: Integrated Migraine Care, Harvard Business School Case 9-707-559, September 13, 2007
Primary Care
Physicians
Affiliated
Imaging Unit
West German
Headache Center
Neurologists
Psychologists
Physical Therapists
Day Hospital
Network
Neurologists
Essen
Univ.
Hospital
Inpatient
UnitInpatient
Treatment
and Detox
Units
Outpatient
Psychologists
Outpatient
Physical
Therapists
Outpatient
Neurologists
Imaging
Centers
Primary
Care
Physicians
Affiliated “Network”
Neurologists
Existing Model:
Organize by Specialty and
Discrete Services
New Model:
Organize into Integrated
Practice Units (IPUs)
Organizing Around Patient Medical ConditionsMigraine Care in Germany

Copyright © Michael Porter 20101120100604 Medical IPU O + C 20100601
Integration Across the Care CycleBreast Cancer Care Delivery Value Chain

Copyright © Michael Porter 20101220100730 Cerner FINAL
Integration Across the Care CycleBreast Cancer Care Delivery Value Chain

Copyright © Michael Porter 20101320100730 Cerner FINAL
Volume in a Medical Condition Enables Value
• Volume and experience have an even greater impact on value in an
IPU structure than in the current system
Better Results,
Adjusted for Risk
Rapidly Accumulating
Experience
Rising Process
Efficiency
Better Information/
Clinical Data
More Tailored Facilities
Rising
Capacity for
Sub-Specialization
More Fully
Dedicated Teams
Faster Innovation
Greater Patient
Volume in a
Medical
Condition
Improving
Reputation
Costs of IT, Measure-
ment, and Process
Improvement Spread
over More Patients
Wider Capabilities in
the Care Cycle,
Including Patient
Engagement
The Virtuous Circle of Value
Greater Leverage in
Purchasing

Copyright © Michael Porter 20101420100604 Medical IPU O + C 20100601
Fragmentation of Hospital ServicesSweden
Source: Compiled from The National Board of Health and Welfare Statistical Databases – DRG Statistics, Accessed April 2, 2009.
DRG Number of
admitting
providers
Average
percent of
total national
admissions
Average
admissions/
provider/ year
Average
admissions/
provider/
week
Knee Procedure 68 1.5% 55 1
Diabetes age > 35 80 1.3% 96 2
Kidney failure 80 1.3% 97 2
Multiple sclerosis and
cerebellar ataxia
78 1.3% 28
1
Inflammatory bowel
disease
73 1.4% 66
1
Implantation of cardiac
pacemaker
51 2.0% 124
2
Splenectomy age > 17 37 2.6% 3 <1
Cleft lip & palate repair 7 14.2% 83 2
Heart transplant 6 16.6% 12 <1

Copyright © Michael Porter 20101520100730 Cerner FINAL
What is Integrated Care?
Attributes of an Integrated Practice Unit (IPU):
1. Organized around the patient’s medical condition
2. Provides the full cycle of care for the condition
– Encompasses inpatient, outpatient, and rehabilitative care as well
as supporting services (e.g. nutrition, social work, behavioral health)
– Includes patient education, engagement and follow-up
3. Involves a dedicated team who devote a significant portion of
their time to the condition
4. Where providers are part of a common organizational unit
5. Co-located in dedicated facilities
6. Utilizing a single administrative and scheduling structure
7. With a physician team captain and a care manager who
oversee each patient’s care process
8. Where the team meets formally and informally on a regular
basis
9. And measures processes and outcomes as a team, not
individually
10. And accepts joint accountability for outcomes and costs

Copyright © Michael Porter 20101620100730 Cerner FINAL
Integrated care is not the same as:
– A clinical pathway
– Co-location per se
– Care delivered by the same organization
– A multispecialty group practice
– Freestanding focused factories
– An institute or center
– A Center of Excellence
– Medical homes
– Accountable care organizations
– A health plan/provider system (e.g. Kaiser Permanente)
What is Not Integrated Care?

Copyright © Michael Porter 20101720100730 Cerner FINAL
Integrated Models of Primary Care
• Organized around specific patient populations (e.g. healthy
adults, frail elderly, type II diabetics) rather than attempting to be all
things to all patients
• Defined service bundles covering appropriate prevention,
screening, diagnosis, wellness and health maintenance
• Services are provided by multidisciplinary teams, including
ancillary health professionals and support staff in dedicated
facilities
• Alliances with specialty IPUs covering the prevalent medical
conditions represented in the patient population
• Delivered not only in traditional settings but at the workplace,
community organizations, and in other locations that offer
regular patient contact and the ability to develop a group culture of
wellness
• Today’s primary care is fragmented and attempts to address
overly broad needs with limited resources
Copyright © Michael Porter 20101820100730 Cerner FINAL
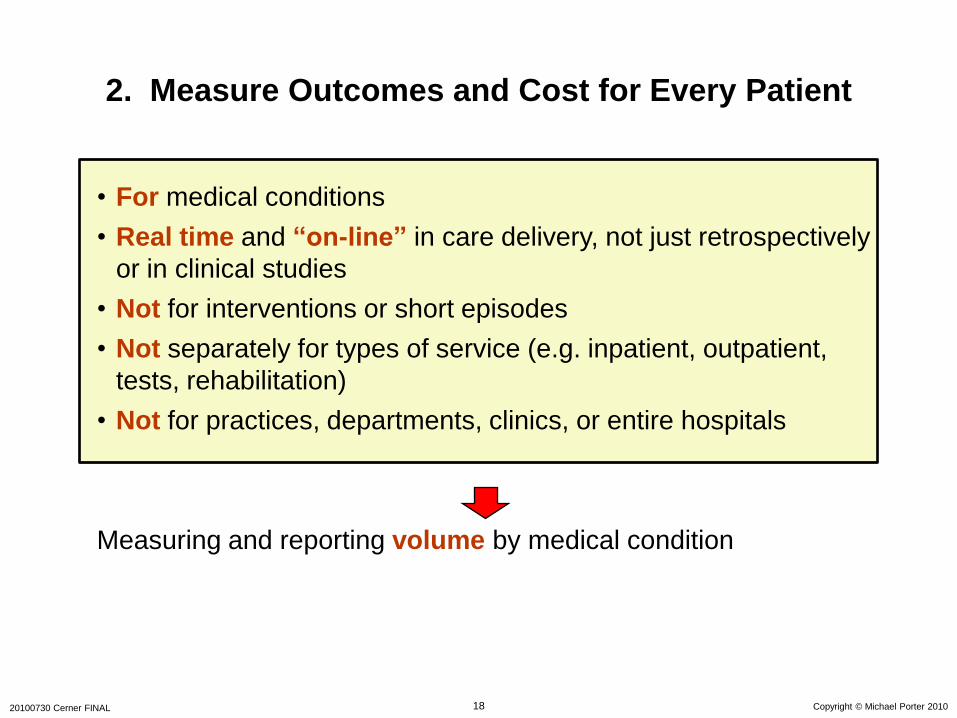
2. Measure Outcomes and Cost for Every Patient
• For medical conditions
• Real time and “on-line” in care delivery, not just retrospectively
or in clinical studies
• Not for interventions or short episodes
• Not separately for types of service (e.g. inpatient, outpatient,
tests, rehabilitation)
• Not for practices, departments, clinics, or entire hospitals
Measuring and reporting volume by medical condition

Copyright © Michael Porter 20101920100730 Cerner FINAL
Patient Compliance
E.g., Hemoglobin
A1c levels for
diabetics
Protocols/Guidelines
Patient Initial
Conditions
0
Processes Indicators (Health)
Outcomes
Measuring Value
Structure
E.g., Staff certification, facilities

Copyright © Michael Porter 20102020100730 Cerner FINAL
The Outcome Measures Hierarchy
Survival
Degree of health/recovery
Time to recovery or return to normal activities
Sustainability of health or recovery and nature of
recurrences
Disutility of the care or treatment process (e.g., diagnostic errors and ineffective care, treatment-related discomfort, complications, or adverse effects, treatment errors and
their consequences in terms of additional treatment)
Long-term consequences of therapy (e.g., care-induced illnesses)
Tier
1
Tier
2
Tier
3
Health Status
Achieved
Process of
Recovery
Sustainability
of Health

Copyright © Michael Porter 20102120100730 Cerner FINAL
• Survival rate
(One year, three year,
five year, longer)
The Outcome Measures HierarchyBreast Cancer
• Degree of remission
• Functional status
• Breast conservation
• Depression
• Time to remission
• Time to functional
status
Survival
Degree of recovery / health
Time to recovery or return to normal activities
Sustainability of recovery or health over time
Disutility of the care or treatment process (e.g., diagnostic errors and ineffective care,
treatment-related discomfort, complications, or adverse effects,
treatment errors and their consequences in terms of additional treatment)
Long-term consequences of therapy (e.g., care-induced
illnesses)
• Nosocomial infection
• Nausea/vomiting• Febrile
neutropenia
• Cancer recurrence
• Sustainability of
functional status
• Incidence of
secondary cancers
• Brachial
plexopathy
Initial Conditions/Risk
Factors
• Stage upon
diagnosis
• Type of cancer
(infiltrating ductal
carcinoma, tubular,
medullary, lobular,
etc.)
• Estrogen and
progesterone
receptor status
(positive or
negative)
• Sites of metastases
• Previous treatments
• Age
• Menopausal status
• General health,
including co-
morbidities
• Psychological and
social factors
• Fertility/pregnancy
complications
• Premature
osteoporosis
• Suspension of therapy
• Failed therapies• Limitation of
motion• Depression

Copyright © Michael Porter 20102220100730 Cerner FINAL
MD Anderson Oral Cavity Cancer Survival by
Registration Year
0 12 24 36 48 60 72 84 96 108 120
SURV
0.0
0.2
0.4
0.6
0.8
1.0
Cu
m S
urv
iva
l
Registration Year Groups
1944-59
1960-69
1970-79
1980-89
1990-99
2000-06
stager = LOCAL
Oral Cavity
p<0.001
0.6
0.4
Oral Cavity- Stage: Localized
Survival
Rate
Months After Diagnosis
2000-2006
1980-1989
1960-1969
1970-1979
1990-1999
1944-1959
0 12 24 36 48 60 72 84 96 108 120
SURV
0.0
0.2
0.4
0.6
0.8
1.0
Cu
m S
urviv
al
Registration Year Groups
1944-59
1960-69
1970-79
1980-89
1990-99
2000-06
stager = REGIONAL
Oral Cavity
p<0.001
0.6
0.4
Survival
Rate
Oral Cavity- Stage: Regional
2000-2006
1980-1989
1960-1969
1970-1979
1990-1999
1944-1959
Months After Diagnosis
Stage: RegionalStage: Local
Source: MD Anderson Cancer Center
0.6
0.4
Survival
Rate
Survival
Rate0.6
0.4
Months after Diagnosis Months after Diagnosis

Copyright © Michael Porter 20102320100730 Cerner FINAL
24%
26%
28%
30%
32%
34%
36%
1997 1998 1999 2000 2001 2002 2003 2004 2005
>400 cycles
201-400 cycles
101-200 cycles
51-100 cycles
1-50 cycles
Percent Live Births per Fresh, Non-Donor Cycle by Clinic Size
Women Age <38, 1997-2005
Success per Cycle
Clinic Size:
Number of Cycles per Year
Percent Live Births per Fresh, Non-Donor Embryo Transferred by Clinic Size
Women Age <38, 1997-2005
7%
8%
9%
10%
11%
12%
13%
14%
15%
16%
17%
18%
1997 1998 1999 2000 2001 2002 2003 2004 2005
>400 cycles
201-400 cycles
101-200 cycles
51-100 cycles
1-50 cycles
Clinic Size:
Number of Cycles per Year
Success per Embryo Transferred
In-vitro FertilizationSuccess Rates Over Time
Source: Michael Porter, Saquib Rahim, Benjamin Tsai, Invitro Fertilization: Outcomes Measurement. Harvard Business
School Press, 2008

Copyright © Michael Porter 20102420100730 Cerner FINAL
40
50
60
70
80
90
100
0 100 200 300 400 500 600
Percent 1 Year Graft Survival
Number of Transplants
Adult Kidney Transplant Outcomes, U.S. Center Results, 1987-1989
16 greater than predicted survival (7%)
20 worse than predicted survival (10%)
Number of programs: 219
Number of transplants: 19,588
One year graft survival: 79.6%

Copyright © Michael Porter 20102520100730 Cerner FINAL
40
50
60
70
80
90
100
0 100 200 300 400 500 600 700
Percent 1 Year Graft Survival
Number of Transplants
Adult Kidney Transplant Outcomes,
U.S. Center Results, 1998-2000
10 greater than predicted survival (4.5%)
14 worse than predicted survival (6.4%)
Number of programs included: 219
Number of transplants: 23,849
One year graft survival: 90.9%

Copyright © Michael Porter 20102620100730 Cerner FINAL
40
50
60
70
80
90
100
0 200 400 600 800
Percent 1 YearGraft Survival
Number of Transplants
Adult Kidney Transplant OutcomesU.S. Center Results, 2005-2007
16 greater than expected graft survival (6.6%)
19 worse than expected graft survival (7.8%)
Number of programs: 240
Number of transplants: 38,515
One year graft survival: 93.2%

Copyright © Michael Porter 20102720100730 Cerner FINAL
Respiratory Diseases
Respiratory Failure Register (Swedevox)
Swedish Quality Register of Otorhinolaryngology
Childhood and Adolescence
The Swedish Childhood Diabetes Registry
(SWEDIABKIDS)
Childhood Obesity Registry in Sweden (BORIS)
Perinatal Quality Registry/Neonatology (PNQn)
National Registry of Suspected/Confirmed Sexual
Abuse in Children and Adolescents (SÖK)
Circulatory Diseases
Swedish Coronary Angiography and Angioplasty
Registry (SCAAR)
Registry on Cardiac Intensive Care (RIKS-HIA)
Registry on Secondary Prevention in Cardiac
Intensive Care (SEPHIA)
Swedish Heart Surgery Registry
Grown-Up Congenital Heart Disease Registry
(GUCH)
National Registry on Out-of-Hospital Cardiac Arrest
Heart Failure Registry (RiksSvikt)
National Catheter Ablation Registry
Vascular Registry in Sweden (Swedvasc)
Swedish National Quality Registers, 2007*
National Quality Registry for Stroke (Riks-Stroke)
National Registry of Atrial Fibrillation and
Anticoagulation (AuriculA)
Endocrine Diseases
National Diabetes Registry (NDR)
Swedish Obesity Surgery Registry (SOReg)
Scandinavian Quality Register for Thyroid and
Parathyroid Surgery
Gastrointestinal Disorders
Swedish Hernia Registry
Swedish Quality Registry on Gallstone Surgery
(GallRiks)
Swedish Quality Registry for Vertical Hernia
Musculoskeletal Diseases
Swedish Shoulder Arthroplasty Registry
National Hip Fracture Registry (RIKSHÖFT)
Swedish National Hip Arthroplasty Register
Swedish Knee Arthroplasty Register
Swedish Rheumatoid Arthritis Registry
National Pain Rehabilitation Registry
Follow-Up in Back Surgery
Swedish Cruciate Ligament Registry – X-Base
Swedish National Elbow Arthroplasty Register
(SAAR)
* Registers Receiving Funding from the Executive Committee for National Quality Registries in 2007

Copyright © Michael Porter 20102820100730 Cerner FINAL
Creating an Outcome Measurement SystemSchön Kliniken
1. Define medical conditions to measure• Identified medical conditions
2. Develop outcome dimensions, measures, and risk adjustments• Measures developed by convening groups of involved physicians and
members of Schön’s quality improvement team
• Five metrics per medical condition
3. Data collection infrastructure• Physicians and nurses enter data during the patient’s stay
• Data can be extracted from the EMR reducing the burden of capture
• Long term follow-up still done manually
4. Incentives and mechanisms for data reporting• Reporting of all metrics is mandated for all physician groups
• Involvement in the metrics development process increases physician buy-in
5. Compliance and accuracy validation• Validates accuracy through trend analysis
6. Outcome reporting• Capture outcome data for 70% of patients
• Report results internally at the individual physician level
• Annual quality report (27 process and outcome measures)
7. Process for outcome improvement• Physicians trust metrics and are convinced of their value in driving
improvement
• Link physician pay to quality of care delivered

Copyright © Michael Porter 20102920100730 Cerner FINAL
Cost Analysis Principles
• Cost should be aggregated at the medical condition level (which includes
common co-occurring conditions and complications), not for services or
entire facilities
• Cost should be aggregated for each patient across the full cycle of care
• The cost of each activity or input attributed to a patient should reflect that
patient’s use of resources (e.g. time, staff, facilities, service), not average
allocations or allocations based on charges
• The only way to properly measure cost per patient is to track the time or
shared resource capacity devoted to each patient by physicians, staff,
facilities, support services, and other shared costs
• Time-Driven Activity Based Costing
– Chart the CDVC
– Assess capacity cost of each shared resource involved in the care process
– Assess actual capacity use in transactions with each patient
– Enable aggregation by patient, by medical condition, etc.
• Cost measurement should be accompanied by outcome measurement

Copyright © Michael Porter 20103020100730 Cerner FINAL
3. Move to Bundled Prices for Care Cycles
Bundled
reimbursement
for medical
conditions
Global
capitation
Global
budgeting
Fee for
service

Copyright © Michael Porter 20103120100730 Cerner FINAL
What is a Bundled Payment?
• A total package price for the care cycle for a medical condition
– Including time-based bundled reimbursement for managing chronic
conditions and for primary/preventive service bundles
– Including responsibility for avoidable complications
• The bundled price should be severity adjusted
What is Not a Bundled Payment
• Price for a short episode (e.g. inpatient only, procedure only)
• Separate payments for physicians and facilities
• ―Medical Home‖ payment for care coordination
• Pay-for-performance bonuses
• DRGs can be a starting point for bundled payment models

Copyright © Michael Porter 20103220100730 Cerner FINAL
• Components of the bundle
• Applies to all relatively healthy patients (i.e. ASA scores of 1 or 2)
• The same referral process from PCPs is utilized as the traditional
system
• Mandatory reporting by providers to the joint registry plus
supplementary reporting
• Provider participation is voluntary but all providers are involved
• The bundled price for a knee or hip replacement is about US $8,000
Bundled Payment in PracticeHip and Knee Replacement in Stockholm, Sweden
- Pre-op evaluation
- Lab tests
- Radiology
- Surgery & related admission
- Prosthesis
- Drugs
- Inpatient rehab, up to 6 days
- 1 follow-up visit within 3 months
- Any additional surgery to the joint
within 2 years
- If post-op infection requiring
antibiotics occurs, guarantee
extends to 5 years
Copyright © Michael Porter 20103320100730 Cerner FINAL
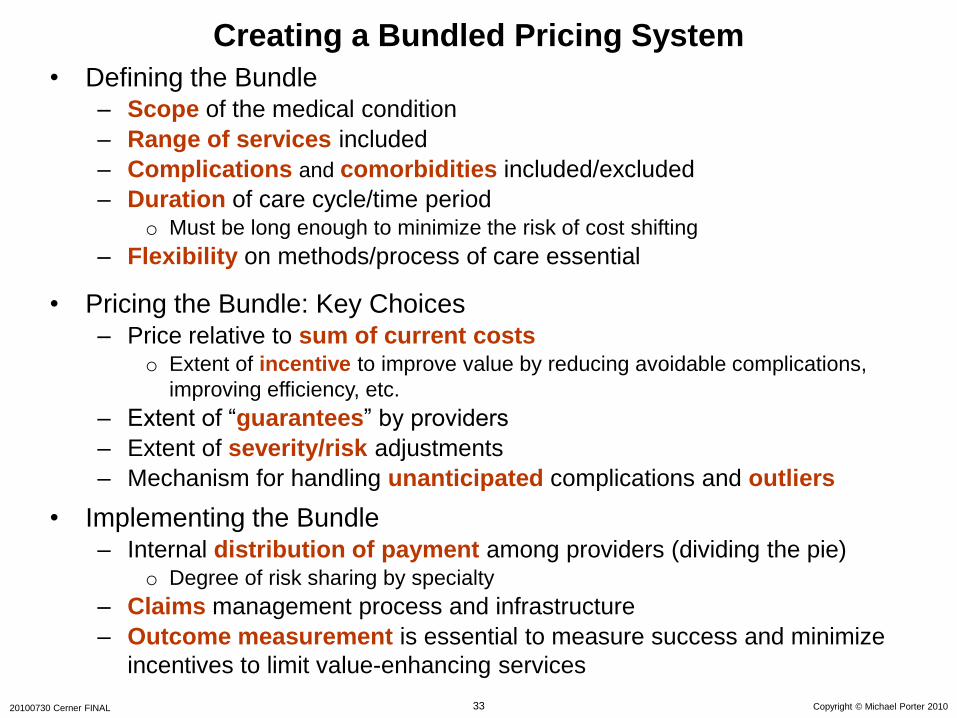
Creating a Bundled Pricing System
• Defining the Bundle– Scope of the medical condition
– Range of services included
– Complications and comorbidities included/excluded
– Duration of care cycle/time periodo Must be long enough to minimize the risk of cost shifting
– Flexibility on methods/process of care essential
• Pricing the Bundle: Key Choices– Price relative to sum of current costs
o Extent of incentive to improve value by reducing avoidable complications,
improving efficiency, etc.
– Extent of ―guarantees‖ by providers
– Extent of severity/risk adjustments
– Mechanism for handling unanticipated complications and outliers
• Implementing the Bundle– Internal distribution of payment among providers (dividing the pie)
o Degree of risk sharing by specialty
– Claims management process and infrastructure
– Outcome measurement is essential to measure success and minimize
incentives to limit value-enhancing services

Copyright © Michael Porter 20103420100730 Cerner FINAL
• Expand geographic coverage
• Increase patient volume
• Expand coverage of the care cycle
• Gather volume for high acuity facilities
• Reduce crowding
4. Integrate Care Delivery Across Separate Facilities
Traditional Motivations for Health Systems

Copyright © Michael Porter 20103520100730 Cerner FINAL
• Determine the scope of service lines
• Rationalize service lines/ IPUs across facilities to improve volume,
avoid duplication, and concentrate excellence
• Offer specific services at the appropriate facility
– E.g. acuity level, cost level, need for convenience
– Patient referrals across units
• Clinically integrate care across facilities, within an IPU structure
– Expand and integrate the care cycle
– Better connect preventive/primary care units to specialty IPUs
• There is a major opportunity to improve value through moving care
out of heavily resourced, tertiary and quaternary facilities
Levels of System Integration
Copyright © Michael Porter 20103620100730 Cerner FINAL
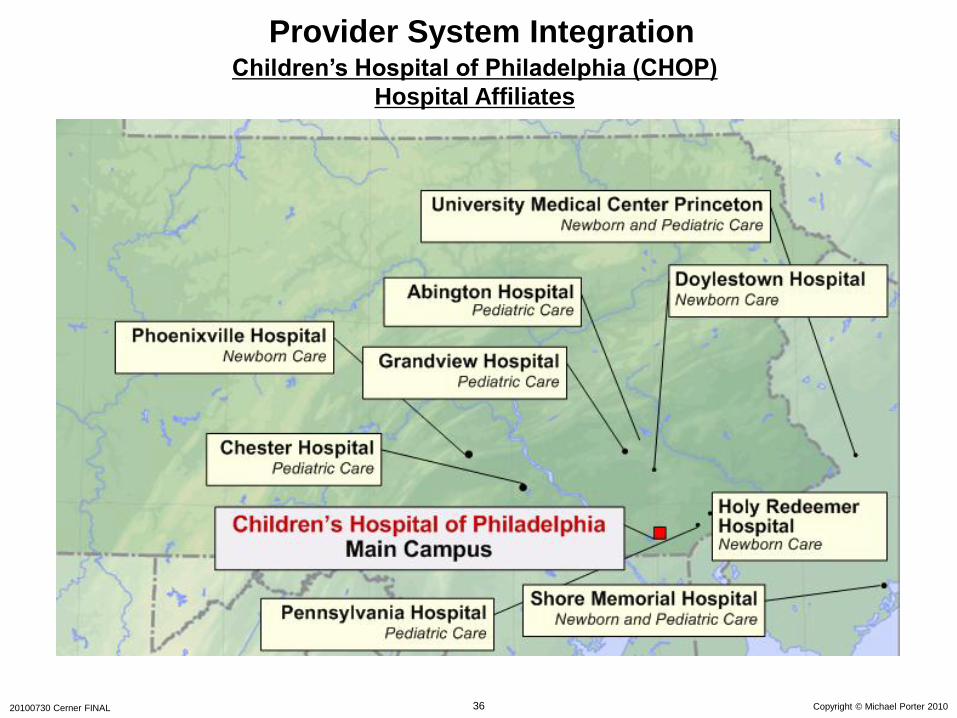
Provider System IntegrationChildren’s Hospital of Philadelphia (CHOP)
Hospital Affiliates

Copyright © Michael Porter 20103720100730 Cerner FINAL
Practice Structure
• IPU structure
– First step is to increase consistency of protocols/processes across sites
– “Virtual” IPUs even if providers practice at different locations
– Case management structure spanning units where appropriate
Scheduling
• Common or federated patient scheduling service across units
Physician Organization
• Employed physicians
• Formal affiliations with independent physicians
– Support service as an inducement for affiliation (E.g. IT, back office)
• Rotation of staff across locations
Common Systems
• Common EMR platform which aggregates information across units
• Common outcome and process measurement systems
Cost Measurement
• Ability to accurately accumulate cost per patient across the entire care cycle
• Ability to measure cost by location for each service/activity
Culture
• Management practices that foster affiliation with the organization, developing
personal relationships, and regular contact among dispersed staff
Enabling System Integration

Copyright © Michael Porter 20103820100730 Cerner FINAL
• Grow in ways that improve value, not just increase volume
• Grow areas of excellence and leverage across locations,
rather than adding broad line, stand-alone units
• Affiliate with excellent providers in medical conditions where
there is insufficient volume or expertise to achieve superior
value
5. Expand Excellent IPUs Across Geography

Copyright © Michael Porter 20103920100730 Cerner FINAL
Cape Fear Valley Health
System, NC
Cardiac Surgery
Cleveland Clinic Florida Weston, FL
Cardiac Surgery
McLeod Heart & Vascular Institute, SC
Cardiac Surgery
CLEVELAND CLINIC
Cardiac Care
Chester County Hospital, PA
Cardiac Surgery
Rochester General Hospital, NY
Cardiac Surgery
Expanding Excellent IPUs Across GeographyThe Cleveland Clinic Managed Practices

Copyright © Michael Porter 20104020100730 Cerner FINAL
Models of Geographic Expansion
Specialty
Hospitals as
Referral Hubs
in Additional
Locations
Complex IPU
Components
(e.g. surgery)
in Additional
Locations
Affiliation
Agreements
with
Independent
Provider
Organizations
Convenience
Sensitive
Service
Locations in the
Community
Second
Opinions and
Telemedicine
Dispersed
Diagnostic
Centers
New Broader-
Line Hospital
Hubs
Affiliations
Dispersed
Services
New Hubs

Copyright © Michael Porter 20104120100730 Cerner FINAL
6. Create an Enabling Information Technology Platform
Utilize information technology to enable restructuring of care delivery
and measuring results, rather than treating it as a solution itself
• Common data definitions
• Combine all types of data (e.g. notes, images) for each patient over time
• Data encompasses the full care cycle, including referring entities
• Allowing access and communication among all involved parties, including
patients
• ―Structured” data vs. free text
• Templates for medical conditions to enhance the user interface
• Architecture that allows easy extraction of outcome, process, and cost
measures
• Interoperability standards enabling communication among different
provider systems
Copyright © Michael Porter 20104220100730 Cerner FINAL
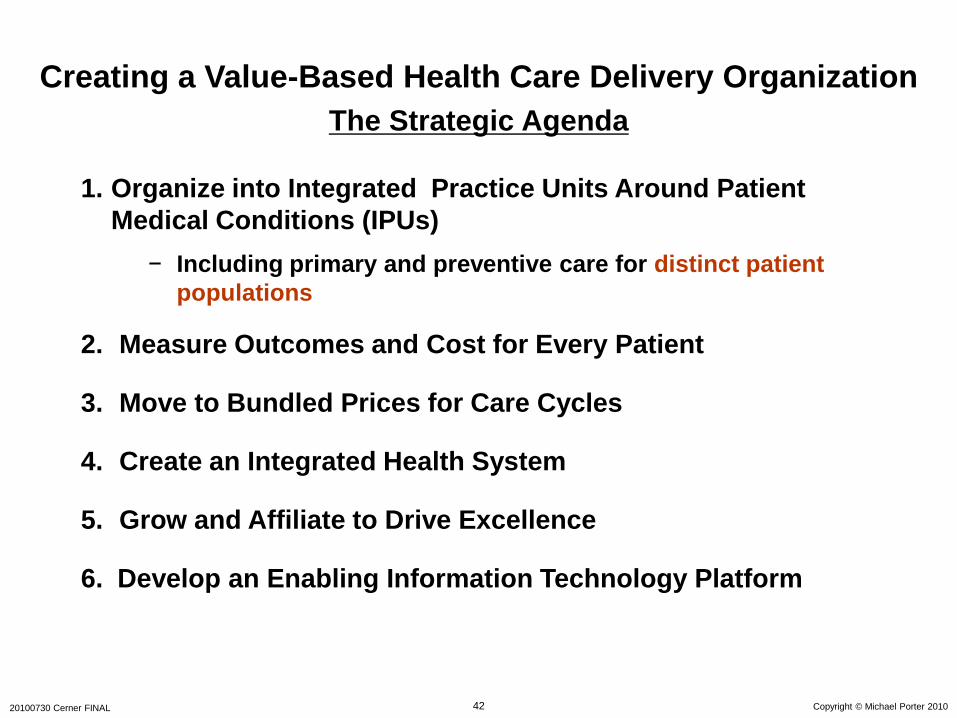
Creating a Value-Based Health Care Delivery Organization
The Strategic Agenda
1. Organize into Integrated Practice Units Around Patient
Medical Conditions (IPUs)
− Including primary and preventive care for distinct patient
populations
2. Measure Outcomes and Cost for Every Patient
3. Move to Bundled Prices for Care Cycles
4. Create an Integrated Health System
5. Grow and Affiliate to Drive Excellence
6. Develop an Enabling Information Technology Platform

Copyright © Michael Porter 20104320100730 Cerner FINAL
Value-Added Health
Organization“Payor”
Value-Based Healthcare Delivery: Implications for Contracting Parties/Health Plans
• Providers can lead in developing new relationships with health
plans through their role in providing health benefits for their
own employees

Copyright © Michael Porter 20104420100730 Cerner FINAL
Value-Based Health Care: The Role of Employers
• Employer interests are more closely aligned with patient
interests than any other system participant
– Employers need healthy, high performing employees
– Employers bear the costs of chronic health problems and poor quality
care
– The cost of poor health is 2 to 7 times more than the cost of health
benefits
o Absenteeism
o Presenteeism
• Employers are uniquely positioned to improve employee health
– Daily interactions with employees
– On-site clinics for quick diagnosis and treatment, prevention, and
screening
– Group culture of wellness
• Providers should establish direct relationships with employers to
enable value based approaches

Copyright © Michael Porter 20104520100730 Cerner FINAL
Value-Based Health Care Delivery:
Implications for Government
• Establish universal measurement and reporting of provider health
outcomes
• Require universal reporting by health plans of health outcomes for
members
• Shift reimbursement systems to bundled prices for cycles of care instead
of payments for discrete treatments or services
• Remove obstacles to the restructuring of health care delivery around the
integrated care of medical conditions
• Open up competition among providers and across geography
• Set policies that encourage greater responsibility of individuals for their
health and their health care
• Mandate EMR adoption that enables integrated care and supports outcome
measurement
– National standards for data definitions, communication, and aggregation
– Software as a service model for smaller providers