Embed Size (px)
Citation preview

1
Grady County Health Department (C) Copyright (2019) All Rights Reserved
Creating a State of Health
S
2019 Community Health Status Assessment
2
Grady County Health Department (C) Copyright (2019) All Rights Reserved
TABLE OF CONTENTS
1. INTRODUCTION 1.1. Mobilizing for Action through Planning and Partnerships (MAPP) 1.2. The MAPP Process 1.3. Community Health Needs Assessment (CHNA)
2. GRADY COUNTY 2.1. Demographics 2.2. Oklahoma State of the State’s Health Report: Grady County Snapshot
3. COMMUNITY HEALTH NEEDS ASSESSMENT 3.1. Sub Committee 3.2. Development 3.3. Questions 3.4. Timeline
4. DATA COLLECTION 4.1. Methods 4.2. Community Partners 4.3. Locations
5. RESULTS 6. CONCLUSION
6.1. Data Analysis 6.2. Data Correlations 6.3. Synopsis
7. NEXT STEPS

3
Grady County Health Department (C) Copyright (2019) All Rights Reserved
1.1. Mobilizing for Action through Planning and Partnerships
(MAPP) The definition of health encompasses a broad range of conditions, not simply health in terms of healthcare.
Improving health is deliberate to ensure the conditions for a dynamic state of complete physical, mental, spiritual, and social well-being. Mobilizing for Action through Planning and Partnerships (MAPP) is a community-wide strategic planning process for improving public health. This framework helps communities prioritize public health issues, identify resources for addressing them, and take action to improve conditions that support healthy living. MAPP is generally led by the local
Health Department and is completed with the input and participation of many organizations and individuals who work, learn, live, and play in the community. 1.2. The MAPP Process The MAPP Process consists of six phases. In Phase One, community members and agencies form a partnership and learn about the MAPP Process. During Phase Two, those who work, learn, live, and play in the community create a common understanding of what it would like to achieve. During Phase Three, qualitative and quantitative data are gathered to provide a comprehensive picture of health in the community through four assessments. In Phase Four, the data are analyzed to uncover the underlying themes that need to be addressed in order for a community to achieve its vision. In Phase Five, the community identifies goals it wants to achieve and strategies it wants to implement related to strategic issues. During Phase Six, the community implements and evaluates action plans to meet goals, address strategic issues, and achieve the community’s vision.
1.3. Community Health Needs
Assessment (CHNA) This report has been prepared to communicate the results of the 2019 Community Health Needs Assessment (CHNA). Provisions of the Patient Protection and Affordable Care Act require each non-profit hospital facility in the United States to conduct a CHNA and adopt an implementation strategy to meet identified community health needs. In conducting the CHNA, non-profit hospitals are required to take into account input from persons who represent the broad interests
1. INTRODUTION

4
Grady County Health Department (C) Copyright (2019) All Rights Reserved
of the community served, including those with special knowledge of or expertise in public health. The CHNA approach is strategic with eights steps. These steps include creation of a sub-committee, creation of a list of indicators, collection of data for community selected indicators, organization and analyzation of data, compilation and dissemination of results, creation of a system to monitor indicators over time, creation of a list of challenges and opportunities, and finally sharing the results with the community.
History of MAPP MAPP was developed to respond to the need to improve public health practice. In 1988, the Institute of Medicine (IOM) published the report The Future of the Public’s Health in the 21st Century, which asserted that the public health system was in disarray. The report was the impetus for creating several types of assessments, standards, and improvement processes. In 1991, NACCHO, with support from the CDC, developed the Assessment Protocol for Excellence in Public Health (APEX PH) to help local health departments assess community health status and establish the leadership role of the health department in the community. APEX PH was continuously updated and revised through the 1990s. In 1997, the IOM published another report titled Improving Health in the Community: A Role for Performance Monitoring, which emphasized the importance of active community involvement in public health performance monitoring and detailed what a community health improvement plan should contain. During this time, public health practitioners were also requesting a process that was driven and owned by the community. In response, APEX PH evolved into MAPP. NACCHO, with support from the CDC, developed MAPP with substantive input from the field and careful attention to research and literature. MAPP was developed to provide structured guidance that would result in an effective strategic planning process that would be relevant to public health agencies and the communities they serve.

5
Grady County Health Department (C) Copyright (2019) All Rights Reserved
2.1. Demographics
Subject Number Percent SEX AND AGE Total population 52,431 100.0 Under 5 years 3,565 6.8 5 to 9 years 3,645 7.0 10 to 14 years 3,761 7.2 15 to 19 years 3,648 7.0 20 to 24 years 3,085 5.9 25 to 29 years 3,248 6.2 30 to 34 years 3,153 6.0 35 to 39 years 3,283 6.3 40 to 44 years 3,330 6.4 45 to 49 years 4,027 7.7 50 to 54 years 4,023 7.7 55 to 59 years 3,479 6.6 60 to 64 years 3,022 5.8 65 to 69 years 2,476 4.7 70 to 74 years 1,797 3.4 75 to 79 years 1,257 2.4 80 to 84 years 864 1.6 85 years and over 768 1.5
Median age (years) 38.3 ( X )
Male population 26,000 49.6
Female population 26,431 50.4
RACE Total population 52,431 100.0 One Race 50,127 95.6 White 44,994 85.8 Black or African American 1,268 2.4 American Indian and Alaska Native 2,841 5.4 Asian 196 0.4 Native Hawaiian and Other Pacific Islander 36 0.1 Some Other Race 792 1.5
Two or More Races 2,304 4.4 White; American Indian and Alaska Native [3] 1,611 3.1 White; Asian [3] 89 0.2 White; Black or African American [3] 214 0.4 White; Some Other Race [3] 151 0.3
2. GRADY COUNTY

6
Grady County Health Department (C) Copyright (2019) All Rights Reserved
Subject Number Percent HISPANIC OR LATINO Total population 52,431 100.0 Hispanic or Latino (of any race) 2,405 4.6 Not Hispanic or Latino 50,026 95.4
HISPANIC OR LATINO AND RACE Total population 52,431 100.0 Hispanic or Latino 2,405 4.6 Not Hispanic or Latino 50,026 95.4
RELATIONSHIP Total population 52,431 100.0 In households 51,349 97.9 In group quarters 1,082 2.1
HOUSEHOLDS BY TYPE Total households 19,892 100.0 Family households (families) [7] 14,535 73.1 Nonfamily households [7] 5,357 26.9
Households with individuals under 18 years 7,031 35.3 Households with individuals 65 years and over 5,099 25.6
Average household size 2.58 ( X ) Average family size [7] 3.02 ( X )
HOUSING OCCUPANCY Total housing units 22,219 100.0 Occupied housing units 19,892 89.5 Vacant housing units 2,327 10.5
HOUSING TENURE Occupied housing units 19,892 100.0
*Information obtained from U.S. Census Bureau American FactFinder on 10/01/2019 based on 2010 Demographic Profile Data. (https://factfinder.census.gov/faces/tableservices/jsf/pages/productview.xhtml?src=CF)
7
Grady County Health Department (C) Copyright (2019) All Rights Reserved
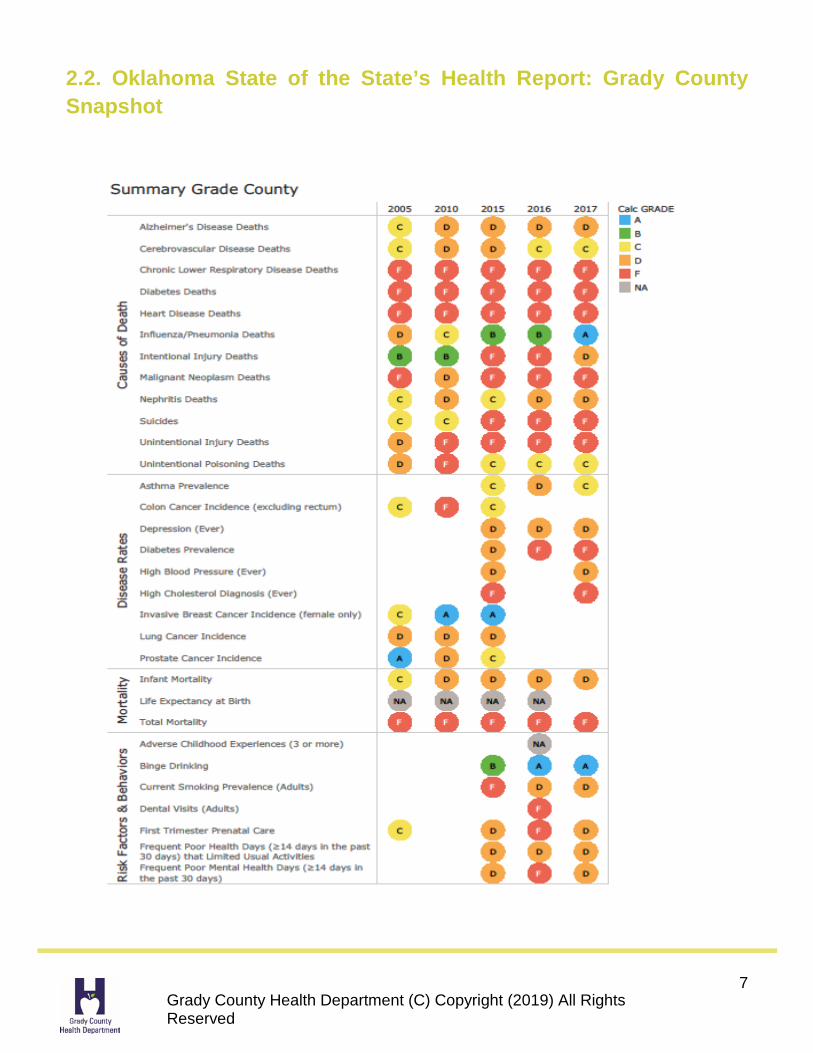
2.2. Oklahoma State of the State’s Health Report: Grady County Snapshot

8
Grady County Health Department (C) Copyright (2019) All Rights Reserved
9
Grady County Health Department (C) Copyright (2019) All Rights Reserved
3.1. Subcommittee
The subcommittee organization began in the summer of 2018. The Cleveland County Health Department and Norman Regional Health System, including representatives from the Tobacco Settlement Endowment Trust's (TSET) Health Living Program, developed the Community Health Needs Assessment. Representative selection was based on data accessibility, data analyzation abilities, abilities to create a system for managing data, and their interest in the data.
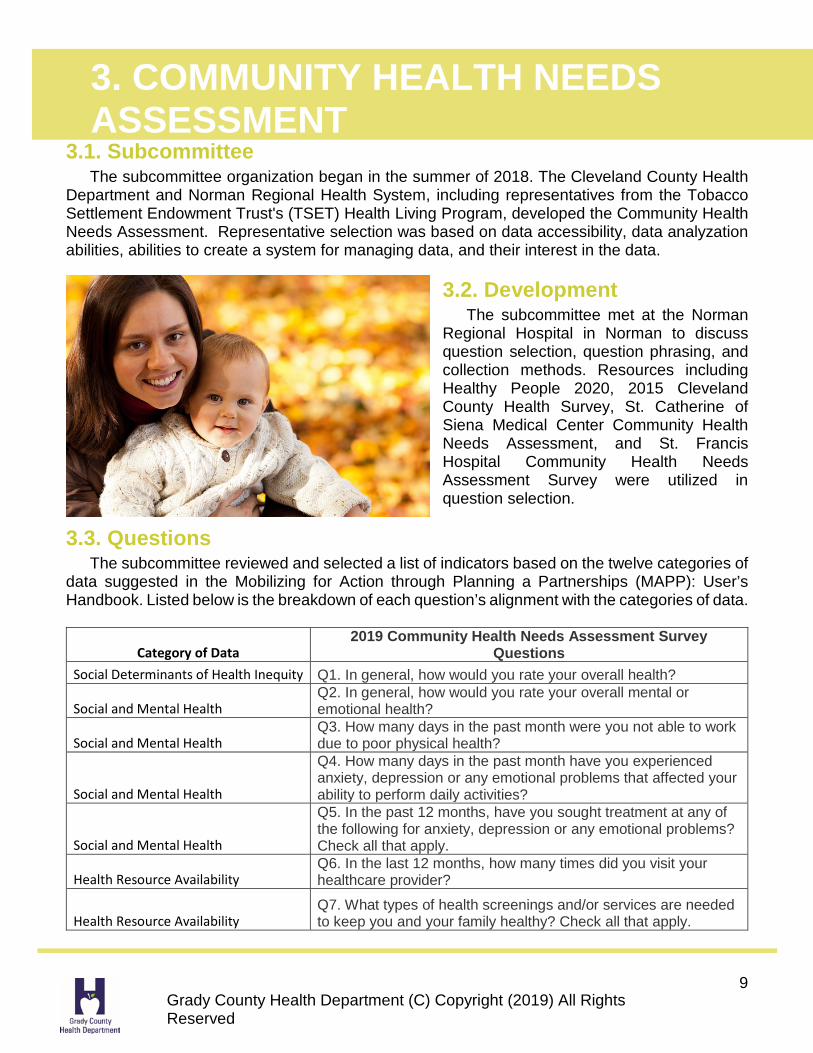
3.2. Development
The subcommittee met at the Norman Regional Hospital in Norman to discuss question selection, question phrasing, and collection methods. Resources including Healthy People 2020, 2015 Cleveland County Health Survey, St. Catherine of Siena Medical Center Community Health Needs Assessment, and St. Francis Hospital Community Health Needs Assessment Survey were utilized in question selection.
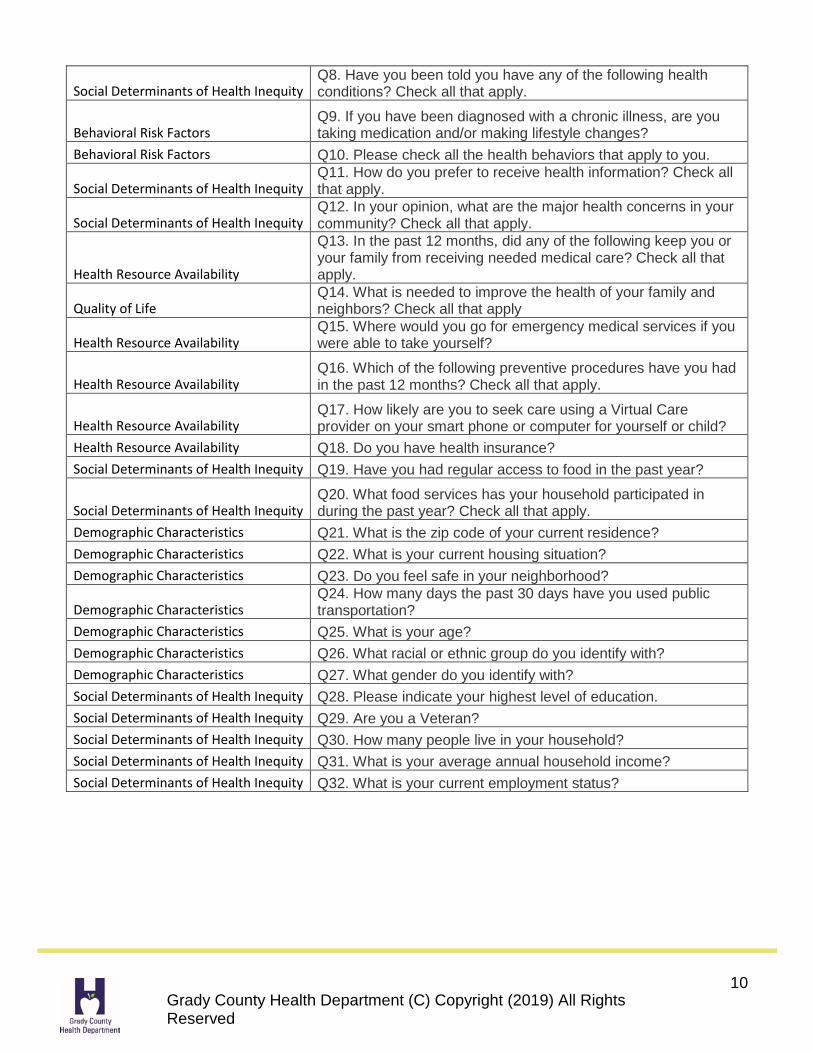
3.3. Questions The subcommittee reviewed and selected a list of indicators based on the twelve categories of
data suggested in the Mobilizing for Action through Planning a Partnerships (MAPP): User’s Handbook. Listed below is the breakdown of each question’s alignment with the categories of data.
Category of Data 2019 Community Health Needs Assessment Survey
Questions Social Determinants of Health Inequity Q1. In general, how would you rate your overall health?
Social and Mental Health Q2. In general, how would you rate your overall mental or emotional health?
Social and Mental Health Q3. How many days in the past month were you not able to work due to poor physical health?
Social and Mental Health
Q4. How many days in the past month have you experienced anxiety, depression or any emotional problems that affected your ability to perform daily activities?
Social and Mental Health
Q5. In the past 12 months, have you sought treatment at any of the following for anxiety, depression or any emotional problems? Check all that apply.
Health Resource Availability Q6. In the last 12 months, how many times did you visit your healthcare provider?
Health Resource Availability Q7. What types of health screenings and/or services are needed to keep you and your family healthy? Check all that apply.
3. COMMUNITY HEALTH NEEDS ASSESSMENT
10
Grady County Health Department (C) Copyright (2019) All Rights Reserved
Social Determinants of Health Inequity Q8. Have you been told you have any of the following health conditions? Check all that apply.
Behavioral Risk Factors Q9. If you have been diagnosed with a chronic illness, are you taking medication and/or making lifestyle changes?
Behavioral Risk Factors Q10. Please check all the health behaviors that apply to you.
Social Determinants of Health Inequity Q11. How do you prefer to receive health information? Check all that apply.
Social Determinants of Health Inequity Q12. In your opinion, what are the major health concerns in your community? Check all that apply.
Health Resource Availability
Q13. In the past 12 months, did any of the following keep you or your family from receiving needed medical care? Check all that apply.
Quality of Life Q14. What is needed to improve the health of your family and neighbors? Check all that apply
Health Resource Availability Q15. Where would you go for emergency medical services if you were able to take yourself?
Health Resource Availability Q16. Which of the following preventive procedures have you had in the past 12 months? Check all that apply.
Health Resource Availability Q17. How likely are you to seek care using a Virtual Care provider on your smart phone or computer for yourself or child?
Health Resource Availability Q18. Do you have health insurance? Social Determinants of Health Inequity Q19. Have you had regular access to food in the past year?
Social Determinants of Health Inequity Q20. What food services has your household participated in during the past year? Check all that apply.
Demographic Characteristics Q21. What is the zip code of your current residence? Demographic Characteristics Q22. What is your current housing situation? Demographic Characteristics Q23. Do you feel safe in your neighborhood?
Demographic Characteristics Q24. How many days the past 30 days have you used public transportation?
Demographic Characteristics Q25. What is your age? Demographic Characteristics Q26. What racial or ethnic group do you identify with? Demographic Characteristics Q27. What gender do you identify with? Social Determinants of Health Inequity Q28. Please indicate your highest level of education. Social Determinants of Health Inequity Q29. Are you a Veteran? Social Determinants of Health Inequity Q30. How many people live in your household? Social Determinants of Health Inequity Q31. What is your average annual household income? Social Determinants of Health Inequity Q32. What is your current employment status?

11
Grady County Health Department (C) Copyright (2019) All Rights Reserved
3.4. Timeline The initial timeline included finalization of question selection by December 2018, distribution of
surveys to the public beginning in April 2019, and collection completion by July 2019. Due to available sample size based on the number of respondents, the extension of the completion date to August 31, 2019 occurred.

12
Grady County Health Department (C) Copyright (2019) All Rights Reserved
4.1. Methods
The 2019 Community Health Needs Assessment Survey was distributed to the public in electronic and paper formats. English and Spanish version were available. The Office of Minority Services at the Oklahoma State Department of Health provided Spanish translation services. The subcommittee utilized Survey Monkey to provide the electronic format platform.
4.2. Community Partners Local community partners included the
Chickasha Area YMCA, Chickasha Public Library and the Tuttle Library. 4.3. Locations
Paper surveys and collection boxes were available to the public at the Chickasha Area YMCA and the Chickasha Public Library from July 15, 2019 until September 4, 2019. They were also available at the Tuttle Library from August 1, 2019 to September 5, 2019.
The zip codes represented in survey responses: 73002, 73018, 73059, 73067, 73082, 73089, and 73092.
4. DATA COLLECTION

13
Grady County Health Department (C) Copyright (2019) All Rights Reserved
4. RESULTS

14
Grady County Health Department (C) Copyright (2019) All Rights Reserved
None
None

15
Grady County Health Department (C) Copyright (2019) All Rights Reserved
None 30.14%

16
Grady County Health Department (C) Copyright (2019) All Rights Reserved

17
Grady County Health Department (C) Copyright (2019) All Rights Reserved

18
Grady County Health Department (C) Copyright (2019) All Rights Reserved

19
Grady County Health Department (C) Copyright (2019) All Rights Reserved

20
Grady County Health Department (C) Copyright (2019) All Rights Reserved

21
Grady County Health Department (C) Copyright (2019) All Rights Reserved

22
Grady County Health Department (C) Copyright (2019) All Rights Reserved

23
Grady County Health Department (C) Copyright (2019) All Rights Reserved

24
Grady County Health Department (C) Copyright (2019) All Rights Reserved
None

25
Grady County Health Department (C) Copyright (2019) All Rights Reserved

26
Grady County Health Department (C) Copyright (2019) All Rights Reserved

27
Grady County Health Department (C) Copyright (2019) All Rights Reserved
28
Grady County Health Department (C) Copyright (2019) All Rights Reserved
5.1. Data Analysis Most Notable:
• 21% of respondents report not having health insurance. • 21% of respondents reported being unemployed, with 40% reporting being employed full
time. • 25% of respondents needed or sought treatment for anxiety, depression, or emotional
concerns with 38% reporting they went untreated. • Free or affordable health screenings, healthier food, and mental health services were
selected as the highest needs for improving the health of family members and neighbors. Needs Attention:
• 26% of respondents experienced anxiety, depression or other emotional problems that affected their ability to perform daily activities for 1-5 days in the last month and 19% reported 5-30 days that were affected.
• Barriers to receiving comprehensive medical care included not having health, dental, and/or vision insurance, and not being able to afford co-pays or pay for prescriptions.
• 11% reported either a lack of transportation or money as barriers to regular food access o 30% of respondents utilize Women, Infant, and Children (WIC), 22% utilize
Supplemental Nutrition Access Program (SNAP), and 4% report utilizing senior nutrition programs.
By the Numbers: • The demographics of the respondents were
o 88% female, 11% male, and 1% reported as other o The highest percentage of respondents fell between 25-34 years of age o 75% of respondents were white, 10% Black or African American, 7% American
Indian or Alaska Native, 7% Hispanic or Latino, and 1% reported as other o 44% rent their home, 38% own their home, 12% report staying with friends or
family, and 3% reported being homeless • 51% of those responding rate their overall health as good, with only 40% reporting their
overall health as very good to excellent. • 34% rate their overall mental or emotional health as good, with 45% reporting their overall
mental or emotional health as very good to excellent. • 79% of those surveyed reported zero days in the past month where they were unable to
work due to poor health, 10% reported being unable to work due to poor physical health 1-5 days in the past month.
• 33% visited their healthcare provider 1-3 times in the last 12 months, 37% visited their healthcare provider 4-10 times or more in the last 12 months, and 30.14% did not visit their healthcare provider at all.
• Most of those surveyed prefer to receive health information by the internet, email, or social media.
• Substance abuse, mental health, obesity, and diabetes were selected as the top major health concerns in the community.
• Blood pressure checks, flu shots, dental cleanings/x-rays, blood sugar and physical exam screenings were the most highly utilized preventive procedures in the past 12 months.
5. CONCLUSION

29
Grady County Health Department (C) Copyright (2019) All Rights Reserved
• Prostate cancer, bone density, hearing, and skin cancer screenings were the least utilized preventive procedures in the past 12 months.
• 23% of respondents said they were likely to very likely to use virtual care, with 27% reporting they are not likely to use virtual care, 32% were not familiar with virtual care.
• 96% of those survey said they feel safe their neighborhood. • The top four health screening and/or services needed to keep families health are:
o Routine Well Checkups o Blood Pressure Screenings o Dental Screenings o Exercise and Physical Activity
• The top four reported health conditions experience by respondents are: o Anxiety o Depression o Overweight by more than 30 pounds o Migraines
• Respondents reported participating in the following health behaviors the most: o Consume fast food at least once a week o Using sunscreen or protective clothing for planned time in the sun o Receiving an annual flu shot o Exercise at least 3 time per week
5.2. Data Correlations
A total of 73 surveys were received from Grady County residents. This sample is approximately .14% of the population based on the 2010 census. Based on demographic information the sample represents the general population for statistical relevance. The majority of respondent reporting is consistent with the State of the State’s County Report Card for Grady County in all aspects except mental or emotional identification and support and lack of chronic illnesses.

30
Grady County Health Department (C) Copyright (2019) All Rights Reserved
5.3. Synopsis
More research is indicated for the population of Grady County for mental health indicators, access to fresh fruits and vegetables, and chronic illness occurrence. The residents of Grady County are requesting more recreation facilities, job opportunities, wellness services, safe places to walk and play, substance abuse rehabilitation, and transportation.

31
Grady County Health Department (C) Copyright (2019) All Rights Reserved
The data from the 2019 Community Health Needs Assessment Survey will be compiled with data from additional assessments. All of this information will be presented to the community leaders. They will select two to three priority areas of focus for community health improvement for the next three years. The selected priorities and the associated objectives and strategies will be available to the public through the Grady County Health Improvement Plan.
6. NEXT STEPS