Embed Size (px)
Citation preview

Creating a GIS Based Traffic Control Planning Tool for the Dallas District
Andrew KarlDr. Maidment
CE 394K.3GIS in Water Resources
Term ProjectDue: 12/4/08

1970 1980 1990 2000 2010 2020 2030 20400
5000000
10000000
15000000
20000000
25000000
30000000
35000000
40000000
45000000
Population Growth in Texas
Year
Popu
latio
n
1975 1980 1985 1990 1995 2000 2005 20100
50,000,000,000
100,000,000,000
150,000,000,000
200,000,000,000
250,000,000,000
300,000,000,000
Vehicle Miles Traveled in Texas
Year
Vehi
cle
Mile
s Tr
avel
ed
• Dallas – Fort Worth area is 5th most congested region in the country• Commuters lose an average of 58 hours per year stuck in traffic• Total hours lost in the region will be over 150 million this year
• Counteract traffic congestion with proper maintenance and construction of new infrastructure

Problem:• Maintenance and upgrades to roadway infrastructure involves lane closures• Detours cost commuters time and money• These user costs are often unaccounted for in traffic management plans• The importance of considering these user costs has driven the need for an aggregate database combining information on roadway properties, capacity, and demand
Solution:• Use data from 3 existing databases:1. Census Road Data: gives roadway geographic information for each county2. Pavement Management Information System (PMIS) + Texas Reference Markers (TRM)
a. PMIS contains physical roadway characteristics (# of lanes, lane width, shoulder width) which are used to calculate a roadway’s capacityb. TRM is a statewide linear referencing database which ties PMIS data to geographical locations
3. Dallas – Fort Worth Regional Travel Model (DFWRTM): provides estimated traffic volumes on roadway links in the Dallas region
MORE PROBLEMS:• No common identifier among the 3 databases• Different coordinate systems were used


1. Create PMIS Labels for Census Road Layer
VBA Program
IH0045LIH0045R

1. Create PMIS Labels for Census Road Layer

2. Add X & Y Coordinates of Start, Mid, and End Points for Census Roads

3. Create PMIS Labels for the Demand Layer• Add Demand shapefile to ArcMap and repeat similar to Step 1
4. Add X & Y Coordinates of Mid-Points of Demand Layers• Repeat similar to Step 2
5. Merge the Demand and Census Road Layers• Export both attribute tables (Demand and Census Road) to EXCEL• VBA program is run to merge the layers• Criteria for matching:
1. Uniform Identifier2. Match the closest links based upon start, mid, end points

6. Calculate Capacity Using PMIS Data• Query necessary data from ACCESS, import to EXCEL, perform calculations• Freeway Capacity: SFi = MSFi(N)(fw)(fHV)(fp)• 2-Lane Highway Capacity: V = vp(PHF)(fg)(fHV)
7. Create Route Event Layer of Capacity Data
• Select roadway segments from Census Road shapefile• Create new layer consisting of only that roadway• Use Linear Referencing Tools Make Route Event Layer

7. Create Route Event Layer of Capacity Data
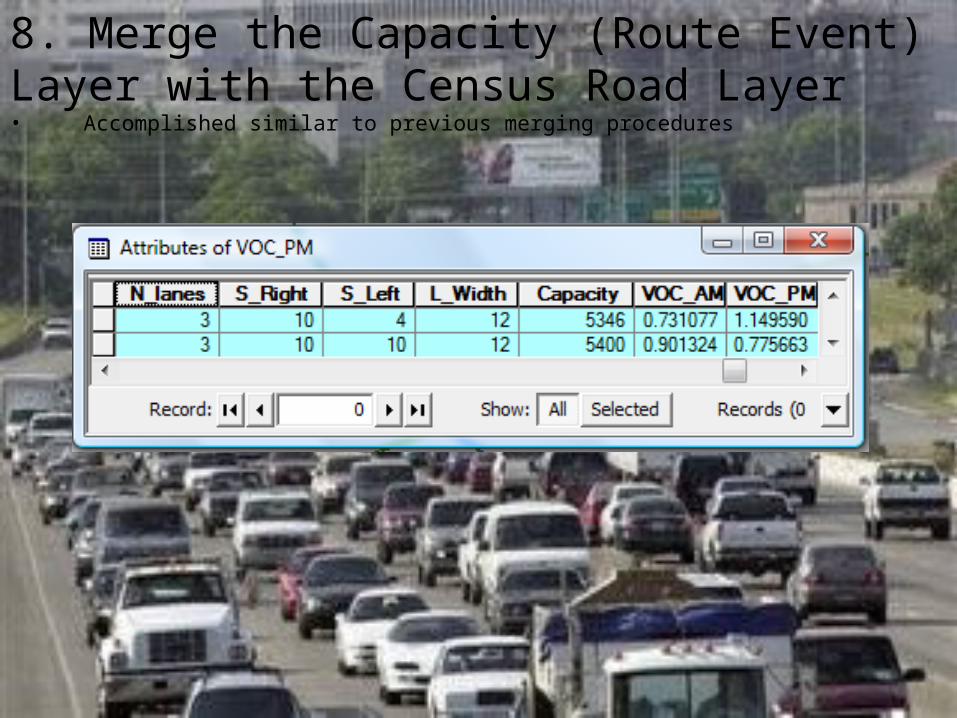
8. Merge the Capacity (Route Event) Layer with the Census Road Layer• Accomplished similar to previous merging procedures

Current GIS Model

Other Neat Features


Future WorkPhase 1:• Currently working on adding frontage roads and arterial streets into the GIS model
Phase 2:• Will provide the model with simulation ability which will generate further information for enhancing traffic flow
Phase 3:• Involves transforming the static model into a dynamic model, thus providing more realistic estimates of traffic flow in the region