Embed Size (px)
Citation preview

Consortium for Research onEducational Access,Transitions and Equity
Can Families in Rural India Bear the AdditionalBurden of Secondary Education? Investigating the
Determinants of Transition
Gaurav Siddhu
CREATE PATHWAYS TO ACCESSResearch Monograph No. 50
November 2010
University of SussexCentre for International Education

The Consortium for Educational Access, Transitions and Equity (CREATE) is a Research ProgrammeConsortium supported by the UK Department for International Development (DFID). Its purpose is to undertakeresearch designed to improve access to basic education in developing countries. It seeks to achieve this throughgenerating new knowledge and encouraging its application through effective communication and disseminationto national and international development agencies, national governments, education and developmentprofessionals, non-government organisations and other interested stakeholders.
Access to basic education lies at the heart of development. Lack of educational access, and securely acquiredknowledge and skill, is both a part of the definition of poverty, and a means for its diminution. Sustained accessto meaningful learning that has value is critical to long term improvements in productivity, the reduction ofinter-generational cycles of poverty, demographic transition, preventive health care, the empowerment ofwomen, and reductions in inequality.
The CREATE partners
CREATE is developing its research collaboratively with partners in Sub-Saharan Africa and South Asia. Thelead partner of CREATE is the Centre for International Education at the University of Sussex. The partners are:
The Centre for International Education, University of Sussex: Professor Keith M Lewin (Director)The Institute of Education and Development, BRAC University, Dhaka, Bangladesh: Dr Manzoor AhmedThe National University of Educational Planning and Administration, Delhi, India: Professor R Govinda
The Education Policy Unit, University of the Witwatersrand, South Africa: Dr Shireen MotalaThe Universities of Education at Winneba and Cape Coast, Ghana: Professor Jerome Djangmah,
Professor Joseph Ghartey AmpiahThe Institute of Education, University of London: Professor Angela W Little
DisclaimerThe research on which this paper is based was commissioned by the Consortium for Research on EducationalAccess, Transitions and Equity (CREATE http://www.create-rpc.org). CREATE is funded by the UKDepartment for International Development (DFID) for the benefit of developing countries and is coordinatedfrom the Centre for International Education, University of Sussex. The views expressed are those of theauthor(s) and not necessarily those of DFID, the University of Sussex, or the CREATE Team. Authors areresponsible for ensuring that any content cited is appropriately referenced and acknowledged, and that copyrightlaws are respected. CREATE papers are peer reviewed and approved according to academic conventions.Permission will be granted to reproduce research monographs on request to the Director of CREATE providingthere is no commercial benefit. Responsibility for the content of the final publication remains with authors andthe relevant Partner Institutions.
Copyright © CREATE 2010ISBN: 0-901881-57-0
Address for correspondence:CREATE,Centre for International Education, Department of EducationSchool of Education & Social WorkEssex House, University of Sussex, Falmer BN1 9QQUnited KingdomTel: + 44 (0) 1273 877984Fax: + 44 (0) 1273 877534Author email: [email protected]: http://www.create-rpc.orgEmail [email protected]
Please contact CREATE using the details above if you require a hard copy of this publication.

Can Families in Rural India Bear the AdditionalBurden of Secondary Education? Investigating the
Determinants of Transition
Gaurav Siddhu
CREATE PATHWAY TO ACCESSResearch Monograph No. 50
November 2010

ii
iii
Contents
Preface..................................................................................................................................... viiSummary................................................................................................................................ viii1. Introduction............................................................................................................................12. What motivates families and makes children want to study? ................................................3
2.1 Factors related to school supply and quality.....................................................................32.2 Factors related to child and household characteristics......................................................42.3 Factors related to the child’s health status ........................................................................52.4 Conclusion ........................................................................................................................6
3. Access to secondary education in India .................................................................................74. The context and the research design ....................................................................................10
4.1 Geographical area of the study .......................................................................................104.2 Access to upper primary and secondary schooling in the survey area ...........................104.3 Children’s characteristics and the choice of schools ......................................................124.4 Household characteristics ...............................................................................................134.5 The economic status of sample families .........................................................................134.6 The methodology for exploring factors influencing transition to the secondary levels .154.7 Conclusions.....................................................................................................................16
5. What makes a child progress to secondary school? The determinants of transition ...........175.1 Parents’ reasons why children did not make it to secondary school level......................175.2 Factors affecting transition status ...................................................................................19
5.2.1 Access to secondary schooling ...............................................................................195.2.2 Parental perception of the child’s performance at the primary level ......................205.2.3 Child characteristics................................................................................................215.2.4 Household characteristics .......................................................................................225.2.5 Economic status of the household...........................................................................23
5.3 Conclusion ......................................................................................................................246. The multivariate analysis of transition.................................................................................25
6.1 Scenario 1: Additional cost and distance to the nearest secondary school .....................256.2 Scenario 2: Additional cost and distance to the same type of secondary school............27
7. Conclusion and policy implications.....................................................................................307.1 The key findings .............................................................................................................307.2 The policy implications...................................................................................................317.3 Areas for future research.................................................................................................31
References................................................................................................................................32Appendices...............................................................................................................................35
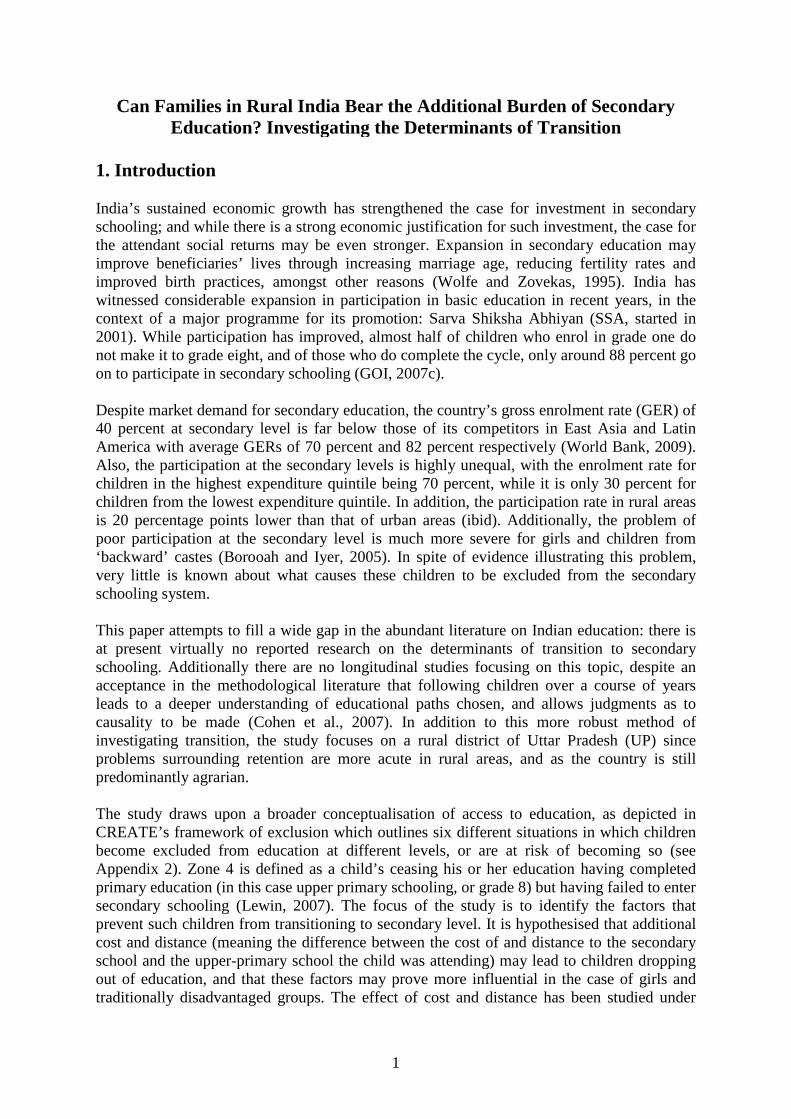
List of Tables
Table 1: Gross enrolment rate 2006-07 by gender and level of education ................................8Table 2: Average distance to primary and secondary schools by school type attended at theupper primary level (kilometres) .............................................................................................11Table 3: Average annual cost of attending primary and secondary schools by type and feeclassification ............................................................................................................................12Table 4: Distribution of children between three school types by caste and religion ...............12Table 5: Possession of assets by families in each asset quintile ..............................................14Table 6: Distribution of families by religion/caste category and wealth quintiles ..................14Table 7: Reasons for not transiting to secondary level by gender and social groups (inpercentage) ...............................................................................................................................17

iv
Table 8: Distribution of children who dropped out by activity of engagement (in percentage)..................................................................................................................................................18Table 9: Average additional cost for attending secondary schools (Rupees) ..........................19Table 10: Average additional distances to secondary schools (kilometres) ............................20Table 11: Average test score of children by transition status and gender ...............................21Table 12: Average attendance of children by transition status and gender .............................21Table 13: Percentage distribution of children by transition status, age category and gender..22Table 14: Percentage distribution of children by transition status, religion and gender..........23Table 15: Percentage distribution of children by transition status, religion and gender..........23Table 16: Percentage distribution of children by transition status, religion and gender..........24Table 17: Percentage distribution of children by transition status, asset index category andgender.......................................................................................................................................24Table 18: Odd ratio for the likelihood of transition (pooled data) – Scenario 1......................27Table 19: Odd ratio for the likelihood of transition (pooled data) – Scenario 2......................29
List of Figures
Figure 1: Distribution of schools in UP and India by type of school and level of education ....8Figure 2: Enrolment trend for JP Nagar...................................................................................11

v
List of Acronyms
BMI Body Mass Index
CFA Confirmatory Factor Analysis
CREATE Consortium for Research on Educational Access, Transitions and Equity
DHS Demographic and Health Survey
DISE District Information System for Education
EFA Exploratory Factor Analysis
GOI Government of India
RMSA Rashtriya Madhyamik Shiksha Abhiyan
SSA Sarva Shiksha Abhiyan
UP Uttar Pradesh
GER Gross Enrolment Rate

vi
Acknowledgements
The author would like to thank CREATE for funding the fieldwork for the study; Prof KeithLewin for his guidance and support; Dr Joanna Härmä for editorial support. The authorwould also like to thank the CREATE team for their inputs.

vii
Preface
This research monograph explores an under researched set of issues that surround thetransition to secondary school on which surprisingly little work has been undertaken. Ittherefore breaks new ground in identifying the characteristics of who goes to secondaryschool and why in a district of Uttar Pradesh in India. If issues surrounding transition tosecondary are not resolved it is clear that India will fail to reach the Millennium DevelopmentGoals and will also fall short of the targets it has set for itself in the 11th Five Year Plan.Universal levels of access to secondary are unattainable with current outputs from Grade 8,especially as these relate to socially excluded groups. Transition rates will also be diminishedunless there are fewer over age children are and the costs of secondary schooling are lowenough to be affordable by the poorest households.
Uniquely this study selects a cohort of children and tracks their progress over two years toestablish patterns of transition and school choice. Costs and distance remain substantialobstacles to enrolment at secondary level for poor households. Costs in particular areexclusionary with even the cheapest option (from public primary school to private aidedsecondary) more than doubling costs to households. Girls are often less likely to transit thanboys, and other groups remain under represented e.g. Muslims. The possible solution ofimproving access by building more secondary schools begs questions of costs and sustainablefinancing, and might not necessarily be the most efficient solution since small secondaryschools can have high unit costs.
This study provides much to reflect on in relation to Rashtriya Madhyamik Shiksha Abhiyanwhich aims to achieve universal retention of children in secondary education by 2015. It is avery welcome contribution to what will be a central debate under the 12th Five Year Plan –how to ensure that India educates most of its children to secondary level as China alreadydoes. It complements work on the transition to secondary school that CREATE has supportedin East and West Africa which is also becoming an African educational dilemma.
Keith LewinDirector of CREATECentre for International EducationUniversity of Sussex

viii
Summary
India has witnessed a major expansion in participation in basic education in recent years, inthe context of a major programme for its promotion: Sarva Shiksha Abhiyan (SSA). Despite asignificantly improved picture at the basic level, a considerable proportion of childrencontinue to drop out before reaching the secondary level. Over half of children who enrol ingrade one do not make it to grade eight, and of those who do complete their basic education(grades one through eight), only 88 percent go on to participate in secondary schooling.Problems surrounding retention are more acute in rural areas of India, and as the country is apredominantly rural society, this study focuses on a farming district of Uttar Pradesh. It is inthis dual context of drop out and rural villages that the present study investigates the factorsinfluencing parents’ decision whether or not to send their children to secondary schooling.
The study draws upon an expanded vision of access to education, embodied in zone 4 ofCREATE’s framework for considering access and transition in education: looking at thosechildren who complete the primary cycle but who do not make the transition to secondaryeducation. The study focuses on four key aspects in parental school decision making:incentives leading parents to view investment in education as worthwhile; the cost ofsecondary education; distance to secondary schools; and the impact of health-related factors.The study is based on survey data collected by the author over the first two school years of afour-year longitudinal study: 2008-09 and 2009-10; and the data is analysed usingmultivariate analysis to identify factors in transition and drop out. Overall the effect ofadditional cost and distance to secondary schooling proves significant, with cost being themost consistent factor, while distance is found to have a more nuanced effect. The study isparticularly relevant in the context of the Government of India’s latest major initiative,Rashtriya Madhyamik Shiksha Abhiyan which aims to achieve universal retention of childrenin secondary education by 2015, and has implications for the direction that interventionsunder this programme should take.
1
Can Families in Rural India Bear the Additional Burden of SecondaryEducation? Investigating the Determinants of Transition
1. Introduction
India’s sustained economic growth has strengthened the case for investment in secondaryschooling; and while there is a strong economic justification for such investment, the case forthe attendant social returns may be even stronger. Expansion in secondary education mayimprove beneficiaries’ lives through increasing marriage age, reducing fertility rates andimproved birth practices, amongst other reasons (Wolfe and Zovekas, 1995). India haswitnessed considerable expansion in participation in basic education in recent years, in thecontext of a major programme for its promotion: Sarva Shiksha Abhiyan (SSA, started in2001). While participation has improved, almost half of children who enrol in grade one donot make it to grade eight, and of those who do complete the cycle, only around 88 percent goon to participate in secondary schooling (GOI, 2007c).
Despite market demand for secondary education, the country’s gross enrolment rate (GER) of40 percent at secondary level is far below those of its competitors in East Asia and LatinAmerica with average GERs of 70 percent and 82 percent respectively (World Bank, 2009).Also, the participation at the secondary levels is highly unequal, with the enrolment rate forchildren in the highest expenditure quintile being 70 percent, while it is only 30 percent forchildren from the lowest expenditure quintile. In addition, the participation rate in rural areasis 20 percentage points lower than that of urban areas (ibid). Additionally, the problem ofpoor participation at the secondary level is much more severe for girls and children from‘backward’ castes (Borooah and Iyer, 2005). In spite of evidence illustrating this problem,very little is known about what causes these children to be excluded from the secondaryschooling system.
This paper attempts to fill a wide gap in the abundant literature on Indian education: there isat present virtually no reported research on the determinants of transition to secondaryschooling. Additionally there are no longitudinal studies focusing on this topic, despite anacceptance in the methodological literature that following children over a course of yearsleads to a deeper understanding of educational paths chosen, and allows judgments as tocausality to be made (Cohen et al., 2007). In addition to this more robust method ofinvestigating transition, the study focuses on a rural district of Uttar Pradesh (UP) sinceproblems surrounding retention are more acute in rural areas, and as the country is stillpredominantly agrarian.
The study draws upon a broader conceptualisation of access to education, as depicted inCREATE’s framework of exclusion which outlines six different situations in which childrenbecome excluded from education at different levels, or are at risk of becoming so (seeAppendix 2). Zone 4 is defined as a child’s ceasing his or her education having completedprimary education (in this case upper primary schooling, or grade 8) but having failed to entersecondary schooling (Lewin, 2007). The focus of the study is to identify the factors thatprevent such children from transitioning to secondary level. It is hypothesised that additionalcost and distance (meaning the difference between the cost of and distance to the secondaryschool and the upper-primary school the child was attending) may lead to children droppingout of education, and that these factors may prove more influential in the case of girls andtraditionally disadvantaged groups. The effect of cost and distance has been studied under

Can Families in Rural India Bear the Additional Burden of Secondary Education?Investigating the Determinants of Transition
2
two different scenarios: scenario 1 analyses the effect of additional cost and distance to thesecondary schools nearest the child’s home, while scenario 2 analyses the effect of additionaldistance and cost to the secondary school of the same type (as the child was attending atupper-primary level), nearest the child’s home. The study is based on survey data collectedby the author over the first two school years of a four-year longitudinal study: 2008-09 and2009-10, coinciding with the launch of a major new initiative of the Government of India toensure universal transition to lower secondary school by 2015: Rashtriya MadhyamikShiksha Abhiyan (RMSA).
Section 2 will review the literature on school participation, while section 3 explains thesituation of secondary education in India. The paper then moves on to explaining themethodology and the context in which the study was carried out. Section 5 presentsqualitative and descriptive bivariate analysis, while section 6 presents the main results fromthe multivariate analysis. The seventh and last section outlines conclusions and policyimplications of the research.

Can Families in Rural India Bear the Additional Burden of Secondary Education?Investigating the Determinants of Transition
3
2. What motivates families and makes children want to study?
While there is a large body of research available investigating factors influencing schoolparticipation in general, there is hardly any research available with transition as its core focus(Hunt, 2008). A substantial number of research papers are available, mostly done using non-experimental data, to identifying factors influencing school participation and achievement.The research papers have identified school participation as a function of demand and supplyfactors as well as government policies (for example Glewwe and Jacoby, 1994 & 1995;Dreze and Kingdon, 2001).
A large volume of available literature which is discussed in the following two sections looksat the impact of demand side factors: school participation being determined by the perceivedcosts and benefits of staying in school. These costs include direct costs, opportunity costs ofwage income and/or home production forgone. On the benefit side are economic gainsresulting from the higher wages available from jobs attainable with more education, as wellas non-income benefits though better health and through families’ increased participation incommunity and public life. Another stream of literature in this area examines aspects offamily background characteristics namely family income, parental education and children’scharacteristics. Besides these demand-side factors studies also analysed the impact of supplyfactors such as schools availability and quality of education on school participation. Thissection briefly attempts to present the key studies on this area.
2.1 Factors related to school supply and quality
The cost of schooling is discussed in the literature as being a significant factor inparticipation, with many studies illustrating the boom effect that fee abolition has had onenrolments in several countries (Rose, 2002). However most of these studies have focused onthe primary level, while there is a lack of complimentary evidence for secondary education.The research has moved on significantly in recent decades, with an early study that examinedthe effect of charging school fees citing evidence that suggested that ‘price elasticity ofdemand is low’ (Jimenez and Lockheed 1995, cited in Glewwe and Kremer, 2005:23).
More recent studies, having utilised both survey data (Arunatilake, 2006; Deininger, 2003;Ohba, 2009) as well as data obtained through randomised trial studies (Kremer et al, 2007),have found participation to be more responsive to cost levels than suggested by Jimenez andLockeed. Direct costs of schooling have been found to negatively affect the attendance ofchildren: Chandrashekhar and Mukhopadhyay’s research (2006) found that a very smallincrease of Rs. 190 per annum in the cost of primary schooling reduces the likelihood of arural Indian child going to school by 3 percentage points, and this cost effect was much largerfor children from scheduled caste families and from families in the lowest income quartile.
Deninger (2003) too found that reduction in the cost of primary schooling increases thelikelihood of children and particularly girls from poor rural Ugandan families attendingprimary school. A similar affect was captured through randomised trial studies; Schultz(2004) in evaluating the effects of the PROGRESA programme in Mexico (through which acash grant is given to mothers conditional on their children’s attendance) found increasededucational attainment amongst the poor (0.66 years) and increased transition to juniorsecondary school (20 percent increase for girls and 10 percent for boys).

Can Families in Rural India Bear the Additional Burden of Secondary Education?Investigating the Determinants of Transition
4
Logically distance and travel times to schools might be considered significant factors,however the effects of these factors have been found to be ambiguous. One study from Ghana(Glewwe and Jacoby, 1995) found differing effects of travel time with regard to primary andmiddle school levels. The travel time to primary school was found to significantly affectdelays in enrolment, but not the age of dropout. Conversely travel time to middle school wasshown to significantly affect dropout age but does not affect delay in enrolment. Suryadarmaet al (2006) and Connelly et al (2003) found significant effects of reducing distance onschooling participation in Indonesia and China. In contrast, Filmer (2004), in his analysis of21 developing countries using DHS data, found that reducing distance to either primaryschool or secondary school increases school enrolment only slightly. The ambiguity of theseresults may stem from statistical issues as noted by Glewwe and Kremer (2005), who statethat there may be issues with the reliability of the findings of most studies on schoolparticipation due to their reliance on retrospective survey data. Additionally these studiesappear to assess distance simply on the basis of the nearest school to the household. Howeverthis study investigates whether parental preference for particular types of schools mightoutweigh distance: if the nearest school is not of the parents’ preferred type, or if that schoolis inaccessible due to cost or some other factor, then distance to the absolute nearest schoolmay not be so important.
The literature reports largely positive results from improvements in school quality indicatorsor proxies, for example Hanushek et al’s study (2006) which found that children attendinghigher quality schools in Egypt are far more likely to continue their education. Dreze andKingdon (2001) found that several school quality variables in India had significant effects onyears of primary school attained. Quality of classrooms was shown to have strong positiveeffects for girls, while teacher absence due to non-teaching duties had a negative effect onboys only, and class size was shown to have a negative effect on both girls and boys. Glewweand Jacoby’s Ghana study (1994) found that years of completed schooling could increase by2 to 2.5 years by raising teacher experience, repairing leaking roofs, providing blackboards toschools without them or reducing travel time, while in another paper Glewwe and Jacoby(1995) utilised the same dataset to find that quality of schooling significantly affects delay inenrolment.
2.2 Factors related to child and household characteristics
In the existing research, family characteristics are examined with regard to their impact onparticipation, including income, social status, parental education and child-specificcharacteristics such as age, gender and birth rank (Connelly et al, 2003; Dreze and Kingdon,2001; Hanushek et al, 2006; Suryadarma et al, 2006). Of note is that certain household andparent characteristics have been found to be related more strongly with certain childrenwithin the family, for example there are some differences between boy and girl children. Inmany societies tradition is associated with families having differing views on prioritiesregarding sons and daughters.
Using survey data, Suryadarma et al (2006) tried to identify factors responsible for lowenrolment at the secondary level. With transition to lower secondary school as the dependentvariable, the authors found that consumption expenditure, used as a proxy for welfare, issignificantly related to the probability of continuation, along with other variables such as thefather’s education, the child’s gender, as well as his or her own innate ability.

Can Families in Rural India Bear the Additional Burden of Secondary Education?Investigating the Determinants of Transition
5
Similar gender results were found by Connelly et al (2003) which used Chinese census datafrom 1990 to analyse educational enrolment and completion of 10 to 18 year olds in rural andurban China. They found that boys have a significantly higher rate of enrolment at bothprimary and middle levels as well as a higher completion rate at primary level in rural areas.Amongst other factors, higher levels of parents’ educational attainment significantlyincreased the probability of enrolment and completion at all levels in both rural and urbanareas.
In the case of India, Dreze and Kingdon (2001) found both parents’ educational level tosignificantly affect the probability of ever being enrolled and current enrolment status, andalso the level of education attained (the latter for girls only). For boys only the fathers’education was found to have a significant effect, while in Hanushek et al (2006) there wasfound to be no statistically significant effect of the years of mothers’ or fathers’ education ondropout. Lastly, the age of the child, where the child is not in the correct grade level, wasfound to lead children in South Africa to drop out due to difficulties with school work(Motala et al, 2009).
To summarise the existing research in this area, the gender of the child has been found to bestrongly related with children’s educational outcomes, with boys often being most favoured.Other issues that often tend to be related with children’s educational outcome include thewealth of the family, the educational attainment of parents, and also the age of the child.
2.3 Factors related to the child’s health status
The previous section has shown that a large number of family-related factors have been foundto affect children’s participation and achievement; but additionally an extensive body ofresearch shows that both acute and chronic hunger also affect children’s participation inschooling. For those children attending school it is found to negatively affect their attentionspan, behaviour in class and educational outcomes such as enrolment age, grade repetition,attendance rate, number of grades completed and test score performance (Grantham-McGregor 2005).
In Ghana, Glewwe and Jacoby (1995) found strong evidence that delayed primary schoolenrolment is caused by nutritional deficiencies in early childhood (measured using the heightto age ratio), and that other factors such as family income or the school fee do not delayenrolment. Another study conducted on data from Pakistan found similar results. Alderman etal (2001) used data from more than 800 households in 45 villages in rural Pakistan, toestimate the impact of pre-school aged child health (measured using height for age) onsubsequent school enrolment. The investigators found significantly positive effects ofpreschool nutrition on the probability of school enrolment and found that children's healthand nutrition is three times more important for enrolment than is suggested by ‘naïve’estimates that assume that children's health and nutrition is predetermined rather thatdetermined by household choices. They also found that not only does improved nutritionincrease enrolment in general, but that it does so even more for girls, thus closing a portion ofthe gender gap.
Using longitudinal data from the Philippines, Glewwe et al (1999), found that under-nourished children enter school later, probably because they are deemed unready for school atthe minimum age of enrolment, and perform more poorly on cognitive achievement tests thantheir better-nourished counterparts. They found one standard deviation increase in height

Can Families in Rural India Bear the Additional Burden of Secondary Education?Investigating the Determinants of Transition
6
raises the achievement score by 5 points which they assert to be equivalent to spending fouradditional months in school. Cueto (2005), on the contrary, found no association between anyanthropometric variables and achievement or advancement to higher grades withoutrepetition. The author suggests that this could be because the research was carried out at analtitude of 3000-3500 metres above sea level (in the mountains of Peru) and the pattern ofheight and weight for children and adolescents at that altitude are different than at sea level.In short, the health of the child has been found to have significant associations with a child’seducation, however it should be born in mind that context may have a bearing on thefindings.
2.4 Conclusion
This section has discussed the various factors that have been found to affect children’sparticipation in schooling. Most of these factors are taken account of in the analysis to follow.Of note is the lack of studies examining factors in transition, a gap in the literature that thisstudy seeks to fill. The next section provides a macro-level picture of access to secondaryeducation in India, providing a larger context in which to situate the current study.

Can Families in Rural India Bear the Additional Burden of Secondary Education?Investigating the Determinants of Transition
7
3. Access to secondary education in India
This section presents a general picture of secondary education in India and UP. It providesinformation on the distribution of schools available by the sector or type, and then discussesenrolments in these schools disaggregated by gender. This provides the background to theproblem: that many children do not make it to secondary school, the reasons for which needto be better understood.
In the majority of Indian states secondary schooling is comprised of two years of lowersecondary and two years of senior secondary education and is generally delivered in threetypes of schools: government and local body schools, private schools that receive governmentgrants-in aid and private unaided schools receiving no government support. The majority ofschools at the primary level are government schools, funded and managed entirely by thegovernment, while by contrast the majority of schools at both lower and senior secondarylevels are private unaided schools, fully funded and managed by private operators. Despiteattempts at government regulation of the unaided sector, these schools have considerableautonomy in setting fee levels, class sizes and in selection of teachers. The third category ofprivate-aided schools are privately owned and managed but receive government grants-in-aidand have less autonomy as a result (Kingdon, 2007). Unlike private unaided school, theprivate-aided schools have less autonomy and are subject to state regulations regardingselection of teachers, admissions and fee levels.
Figure 1 presents the share of these three types of schools at each level of education in UPand in India. In the country as a whole, the share of government and local body schools as apercentage of total schools declines from 89 percent at the primary level to 71 percent at theupper primary level, 39 percent at the lower secondary level and 34 percent at the seniorsecondary level (Government of India 2007c). The share of government and local bodyschools at the secondary level in Uttar Pradesh is even lower: only 6 percent of lowersecondary schools and 5 percent of senior secondary schools belong to this category whereasthe share of private unaided schools at the lower and the senior secondary levels is 60 percentand 59 percent, respectively (ibid.).

Can Families in Rural India Bear the Additional Burden of Secondary Education?Investigating the Determinants of Transition
8
Figure 1: Distribution of schools in UP and India by type of school and level ofeducation
Source: Selected Educational Statistics 2006-07
While India has successfully managed to reduce the gap in primary school participation incomparison with other fast-growing economies, secondary education is characterised by anoverall low participation rate and wide gender disparity. Table 1 presents the gross enrolmentrate for the year 2006-07; for India at the elementary level (primary and upper primary) in2006-07 this was 97 percent with the girls’ enrolment rate being 7 percentage points lowerthan that of boys, whereas the total enrolment rate at the lower secondary and uppersecondary level was only 53 percent and 29 percent, respectively, with an even wider gapbetween girls’ and boys’ enrolment rates. In UP, the gross enrolment rate for elementary,lower secondary and senior secondary levels were 91 percent, 49 percent and 22 percent,respectively. Significantly, girls’ enrolment in Uttar Pradesh at the lower secondary level was23 percentage points lower than that of boys. The data source which provided data for thistable also unfortunately shows that the enrolment rate for scheduled caste children in UttarPradesh at the lower and senior secondary level was only 33 percent and 13 percentrespectively, with girls’ participation being 37 percentage points lower than that of boys. Thisis much lower compared to the national average of 52 percent at the lower secondary leveland 26 percent at the senior secondary level for children from this socially disadvantagedgroup. The gender disparity in participation reduces however at the senior secondary levelindicating that a significantly smaller proportion of boys studying in grade 10 continue withtheir senior secondary schooling as compared to the proportion of girls studying at the samelevel.
Table 1: Gross enrolment rate 2006-07 by gender and level of education
UP India
Boys Girls Total Boys Girls Total
Primary 118 109 114 115 108 111
Upper primary 60 47 54 78 70 74
Lower secondary 59 36 49 59 47 53
Senior secondary 24 19 22 32 26 29Source: Selected Educational Statistics 2006-07

Can Families in Rural India Bear the Additional Burden of Secondary Education?Investigating the Determinants of Transition
9
In terms of availability of secondary schools, UP lags far behind the national average. Whilethere are around ten secondary schools per 100,000 head of population at the national level,there are only three secondary schools per 100,000 people in Uttar Pradesh. In terms ofgeographical coverage, for every 100 square kilometers there are less than two schools in UPwhile the national average is more than three. Additionally the availability of secondaryschools is much lower in the rural areas as compared to urban areas. In 2002, there wereroughly 46,000 secondary schools in urban areas to accept students from around 87,000upper primary schools and there were just 84,000 secondary schools in rural areas for250,000 upper primary schools. The problem of poor participation at the secondary level isnot only related to the physical availability and cost of secondary schools but also toefficiency at the primary and upper primary levels. Between grade 1 and grade 8 more than44 percent of children in Uttar Pradesh drop out of school, which is slightly better than thenational average of 46 percent. But the dropout rate is much higher for children fromscheduled caste families, at almost 60 percent in Uttar Pradesh with the girls’ dropout ratebeing 71 percent (18 percentage points more than for boys). This situation is furtherworsened by the poor transition rate from upper primary to lower secondary level with girls’transition being significantly lower than that of boys. According to Jha and Subrahmanian(2005), the transition rate to lower secondary level in Uttar Pradesh was almost 92 percent forboys but only 70 percent for girls.
In conclusion, there is ample public provision of primary education in India and UP morespecifically, however this provision significantly drops off after the primary level, andreduces sharply at the secondary level. Into this void left by government provision the privateschools have stepped in, with this phenomenon being particularly marked in UP, withapproximately 60 percent of all secondary schools being private unaided. With ability toaccess private schooling being conditional on ability to pay, and with so many childrendropping out during their primary education cycle, this educational landscape indicatesserious obstacles to equitable access to education.

Can Families in Rural India Bear the Additional Burden of Secondary Education?Investigating the Determinants of Transition
10
4. The context and the research design
While the previous section outlined the national and local contexts of participation andtransition, the current section describes the setting in which the study was carried out,including the geographical area, the people and their social make-up, their livelihoods, andthe schools that are available for their children in the selected survey area. The type of schoolselected for sample children at the upper primary level is then discussed in relation to thecharacteristics of the child, in section 4.3. Section 4.4 describes the characteristics of thefamilies of sample children, while section 4.5 shows the economic status of these families.Section 4.6 explains the methodology employed for discovering the determinants of transitionto the secondary level. Section 4.7 briefly concludes.
4.1 Geographical area of the study
The geographical setting for this study comprises seven administrative blocks in District JPNagar in western UP, an area dependent primarily on agriculture and related industries withalmost 75 percent of the population of JP Nagar living in rural areas. All seven administrativeblocks are officially considered ‘educationally backward’ which is evident in the overallliteracy rate of only 49.5 percent, with that for women being even lower at only 34.6 percent.While significant progress has been made in terms of improving participation at the primarylevel, access to upper primary and secondary level education is still very poor. According tothe District Information System for Education (DISE) data for 2007-08, the gross enrolmentrate at the primary level was 155 percent but only 85 percent at the upper primary level.However the transition rate of nearly 72 percent from grade 5 to the upper primary level(grade 6) indicates issues relating to access to post-primary education.
4.2 Access to upper primary and secondary schooling in the survey area
In terms of the educational landscape of the study area specifically, the three types of schoolsdiscussed above are available to varying degrees, with government primary schools present innearly every village, while there is only one government secondary school in the entiredistrict. In the last decade private schooling has expanded greatly; however the market inprimary education is far from stable, with schools opening and closing at a rapid pace1.Private (unaided) secondary schools are far fewer in number than private primary schools,however they tend to be more well-established and enduring than the latter. The UPgovernment has largely relied on private aided schools for the provision of secondaryeducation up to the present time, and so many of these schools are found in the study area.
1 I was involved in the primary data collection for another related study, see Härmä (2010). Within 18 months ofcompletion of the fieldwork, one quarter of the 16 private primary schools visited across 10 villages had closeddown.

Can Families in Rural India Bear the Additional Burden of Secondary Education?Investigating the Determinants of Transition
11
Figure 2: Enrolment trend for JP Nagar
Source: DISE data 2007/08
There are 783 upper primary schools in JP Nagar with 54 percent belonging to the privatesector (aided and unaided) which enrols almost 59 percent of all children at this level. Figure2 presents the enrolment pattern at the elementary level for the years 2003-04 and 2007-08,indicating that a great many children drop out between primary grade 1 and grade 8,suggesting that considerable efforts are required to improve retention and achievement evenat this level. Only one third of children, a very select group, make it to grade 8. The figureshows a slow improvement during the four years between data points, indicating that thepositive effects on future generations of having educated parents and a broadly more highlyeducated society will be very slow to build.
Table 2: Average distance to primary and secondary schools by school type attended atthe upper primary level (kilometres)
Distance to upper primaryschool attended
Distance to nearest privatesecondary school
Distance to nearest aided2
secondary school
Private 1.9 2.0 7.3
Government 1.3 2.7 5.7
Aided 2.1 1.8 6.9
Total 1.7 2.2 6.5
The average distance to any upper primary school in the sample area is two kilometres, withgovernment schools being the closest to households at 1.3 kilometres. Table 2 presentsaverage distances to upper primary schools alongside the average distances to the two typesof secondary schools that children must choose from. While physical access to upper primaryschool is not a problem, at the lower secondary level there are far fewer schools, with theaverage distance to the nearest aided secondary school being over 6 kilometres.
2 Due to the near absence of public secondary schools, aided schools are essentially treated as public schools asthis is the mechanism through which the government provides secondary education.

Can Families in Rural India Bear the Additional Burden of Secondary Education?Investigating the Determinants of Transition
12
Table 3: Average annual cost of attending primary and secondary schools by type andfee classification
Upper Primary (Grade 8) Lower Secondary (Grade 9)
Private Government Aided Private AidedRegistrationandDevelopment 148 48 119 402 90
Tuition Fee 966 123 105 1,440 180
Exam Fee 67 38 42 84 60
Books 401 0 0 660 775
Stationary 423 209 225 450 275
School Dress 303 246 271 400 300
Total 2,307 664 761 3,326 1,68045 Rupees = $1 at the time of the research
Table 3 presents the cost of attending upper primary and lower secondary schools. The directcosts (paid to schools) as a percentage of total cost of attending schools is 51 percent, 31percent and 35 percent for private, government and aided upper primary schools respectively.While the direct cost increases to 58 percent in the case of private lower secondary schools, itreduces to 20 percent in the case of aided lower secondary schools with the single biggestexpenditure in this category being on textbooks which accounts for 46 percent of the totalexpenditure.
4.3 Children’s characteristics and the choice of schools
In terms of the children sampled for this study and the relationship between school sector andgender, in total there were 701 attending grade 8 in 17 sampled schools of which 49 percentwere girls. More than 50 percent of girls attended government schools and 24 percentattended private unaided schools as compared to 43 percent and 30 percent for boysrespectively (the balance of children attend private-aided schools). This indicates preferencefor sending boys to private unaided schools. With regard to the birth rank of the child and theschool selected for that child there is no significant relationship at the upper primary level.
With regard to the preference for sending boys to private schools, this bias is much strongerin the case of Muslim families. There is 5 percentage point difference between the share ofboys and girls attending private schools for both scheduled caste and non-scheduled casteHindu families while the difference is 13 percentage points in the case of Muslim families(table 4).
Table 4: Distribution of children between three school types by caste and religion
Girls Boys
Private Government Aided Total Private Government Aided TotalScheduledCaste 13.8 45.7 40.4 100.0 18.6 40.7 40.7 100.0
Muslim 15.2 72.8 12.0 100.0 28.0 50.0 22.0 100.0Non scheduledcaste Hindu 54.8 22.6 22.6 100.0 59.6 15.8 24.6 100.0

Can Families in Rural India Bear the Additional Burden of Secondary Education?Investigating the Determinants of Transition
13
4.4 Household characteristics
The sample children belong to families drawn from 51 villages in the district. The castemakeup of these families is 26 percent scheduled caste while in terms of religion there are 25percent Muslim families. In terms of the educational levels attained by parents, 31 percent offathers have no qualification, 37 percent have up to upper primary schooling while 32 percenthave secondary schooling or above. More mothers were entirely uneducated, at 67 percent.The average sized household includes almost three adults and over three school aged children(aged 6-17 years). Disaggregated by economic status, families in the poorest income quintiletend to have an average of four school aged children as opposed to those in the richestquintile which have an average of three children.
Most families rely on agricultural employment (40 percent of sample families were found tobe landless), while others have smallholdings in addition to their daily wage labour on theland of others. There are very few larger farms due to past land redistribution and traditionalinheritance practices (of the 60 percent of sample families with land, the average holding is1.7 acres). For 25 percent of families farming is the main source of income, while 34 percentof families rely mainly on unskilled manual labour, 22 percent on subsistence farming alongwith unskilled labour and the remaining 19 percent are engaged in semi-skilled and skilledactivities. For nearly 46 percent of scheduled caste families unskilled manual labour is themain source of income while another 27 percent rely on subsistence farming along withunskilled manual labour.
4.5 The economic status of sample families
One of the key areas of interest for this study is how the economic status of the family affectstransition for individual children; therefore it is necessary to robustly measure the wealth (orpoverty) status of each family. In order to ascertain economic status of sample families, anasset index has been derived using factor analysis methods. A large number of studies haveutilised such indices to examine inequality in household income as they are considered to bebetter proxies of family’s economic status than consumption expenditure (Filmer andPritchett, 2001; Härmä, 2010).
There are two main types of common factor modelling techniques: exploratory factor analysis(EFA) and confirmatory factor analysis (CFA). Both methods aim to represent the observedrelationships among groups of indicators with a smaller set of latent variables (or factors). Acommon factor model postulates that each indicator in a set of observed measures is a linearfunction of one or more common factors, meaning in this case the indices that result from theanalysis which will be used as the measure of economic status in the further analysis. Usinginformation on 17 assets (listed in table 5) owned by rural households, confirmatory factoranalysis was carried out using MPlus. Factor scores were then calculated for each householdand families were then equally divided in five categories (or quintiles). Table 5 also presentsthe incidence of ownership of each of these assets by families in different asset quintiles inorder to demonstrate reliability of these economic categories. For example, average landholding for families in quintile 1 (poorest) is 0.1 bigha3 as compared to 3 bighas for familiesin quintile 5 (the richest).
3 Regional unit of measuring land: 1 acre = 6.25 bigha

Can Families in Rural India Bear the Additional Burden of Secondary Education?Investigating the Determinants of Transition
14
Table 5: Possession of assets by families in each asset quintile
Quintile 1 Quintile 2 Quintile 3 Quintile 4 Quintile 5 All
Chair 0.0 0.0 0.7 29.3 90.7 24.1
Table 0.0 0.0 0.0 32.1 92.9 25.0
Wardrobe 0.0 0.0 0.0 13.6 57.9 14.3
Radio 0.7 2.1 17.9 28.6 47.1 19.3
Working bicycle 39.7 65.0 85.7 82.9 93.6 73.3
Bike/Scooter 0.0 0.0 0.0 9.3 60.0 13.8
Working television 0.0 2.1 15.0 28.6 62.1 21.5
Tractor 0.0 0.0 0.7 9.3 36.4 9.3
Mobile 0.7 25.0 40.7 70.0 90.7 45.4
Gas stove 0.0 0.0 0.7 7.9 50.7 11.8
Cow 4.3 12.1 10.0 23.6 39.3 17.8
Goat 32.6 21.4 17.9 10.7 7.9 18.1
Chicken 5.7 5.0 7.9 5.7 4.3 5.7
Engine 1.4 20.0 52.9 62.1 87.9 44.8
Ox 0.7 15.7 30.7 35.7 58.6 28.2
Fodder machine 60.3 88.6 92.1 86.4 95.7 84.6
Sewing machine 18.4 35.7 43.6 52.1 67.9 43.5
Average number of buffalos 0.5 0.9 1.1 1.2 1.6 1.1Average land holding (inbigha) 0.1 0.3 0.8 1.1 3.0 1.1
The percent distribution of the sample families by asset index score quintiles and according tothe religion and the caste of the family is shown in table 6. Hindu families are almost evenlydistributed across the asset quintiles whereas almost 78 percent Muslim families and allChristian families are in the three poorest quintiles. Disaggregation of Hindu families bycaste reveals that nearly 60 percent of non-scheduled caste Hindu families are in the top twoquintiles as compared to only 13 percent of scheduled caste families; however the distributionof scheduled caste families is fairly even across the quintiles.
Table 6: Distribution of families by religion/caste category and wealth quintiles
Quintile 1 Quintile 2 Quintile 3 Quintile 4 Quintile 5 Total
Religion of family
Christian 33.3 33.3 33.3 0.0 0.0 100.0
Hindu 15.6 18.3 20.0 22.3 23.7 100.0
Muslim 32.7 25.0 20.2 12.5 9.5 100.0
Caste of family
Scheduled caste 24.7 18.5 23.0 20.8 12.9 100.0Non Scheduledcaste Hindus 0.0 8.4 8.4 23.5 59.7 100.0
Total 20.0 20.0 20.0 20.0 20.0 100.0

Can Families in Rural India Bear the Additional Burden of Secondary Education?Investigating the Determinants of Transition
15
4.6 The methodology for exploring factors influencing transition to the secondary levels
In terms of the methodology for the study two ‘educationally backward’4 administrativeblocks were purposively selected due to the author’s familiarity and personal interest in thearea. As the study is school-based, a sampling frame of all available upper-primary schools(grades 6 to 8) was drawn up as the first step. A sample of 17 schools from across the threeschool types (nine government, two private-aided, five private-unaided (governmentrecognised) and one private-unaided (unrecognised) was selected through stratified randomsampling. Due to the small sample size, for the purpose of analysis recognised andunrecognised private-unaided schools were combined. All children in grade 8 of the sampleschools were included in the study, resulting in 701 cases; and it must be borne in mind thatmany of the most ‘vulnerable’ children have already dropped out long before reaching grade8 and therefore this sample may already be considered high-achieving. Informed verbalconsent was gained at three levels: the school, the family and the child, and after the purposeof the study was explained, no prospective participant declined to be included.
As the aim of the study was to determine what factors might influence a child’s transition,data was collected from a variety of sources. The first step, during academic year 2008-09was to capture a range of students’ characteristics. Achievement tests in mathematics andHindi were administered (at the schools), designed by the National Council for EducationalResearch and Training for grade 8 pupils. An IQ test (Raven’s Test5) was also administered,children’s body-mass index scores were captured, and lastly the pupils were interviewed.Certain school-level characteristics were also recorded, such as teacher and infrastructurerelated indicators. Structured interviews were then carried out in the household with at leastone parent to establish relevant household characteristics including socioeconomic status, andparents’ views and aspirations regarding their children’s education were also recorded. Overthe course of the school year three additional unannounced visits were made to schools inorder to record attendance. During the subsequent academic year the households were re-visited in order to establish and record the transition status of the sampled children, andstructured interviews were again carried out with parents of all 701 sampled children. In the130 cases where children were found to have dropped out, qualitative semi-structuredinterviews were conducted in order to gain an understanding of why this occurred.
In order to calculate the effect of cost and distance on transition status, distance to thesecondary schools in the catchment area of sample villages and cost of attending thoseschools was calculated in the second round of the survey. In the analysis two differentscenarios were used to calculate this affect: in scenario 1 additional cost and distance to thenearest secondary school is used; this was calculated by subtracting expenditure on upperprimary school that the child was attending and the distance to that school from cost ofattending the nearest secondary school and the distance to that secondary school. In scenario2 additional cost and distance to the same type of secondary school is used; this is calculatedby subtracting expenditure at the upper primary school that the child was attending and thedistance to that school from the cost of attending the same type of secondary school and thedistance to that same school. For example, if the child was attending private school at theupper primary level, the additional cost of attending nearest private secondary school and thedistance to that school is used. There is only one government secondary school in the entiredistrict hence in order to calculate additional distance and cost to the same type of school for
4 Interview with Basic Education Officer, J.P. Nagar, 3rd September 2008.5 The Raven’s Test is a widely-used test of innate ability, as used by Kingdon, 1996.

Can Families in Rural India Bear the Additional Burden of Secondary Education?Investigating the Determinants of Transition
16
children attending government upper primary schools, private aided schools are used asproxies as these schools by law have the same fee structure and admission criteria as thegovernment schools.
4.7 Conclusions
In conclusion, this section has covered much ground with regard to all contextual issuesrelated to the study. In addition, the methodology employed in the study has been described,meaning that the reader should feel well-situated to explore the heart of the study, startingwith bivariate (section 5) and then moving on to the multivariate analysis (section 6).

Can Families in Rural India Bear the Additional Burden of Secondary Education?Investigating the Determinants of Transition
17
5. What makes a child progress to secondary school? The determinants oftransition
Based on a review of the literature, the central hypothesis of the research is that additionalcost and distance are the key factors in the decision to stop a child’s education after the upperprimary level, with other factors such as the gender of the child also playing a role. The scaleof drop out found during the field research was considerable. Out of the total of 701 childcases, 6 children failed to pass grade 8 and were therefore dropped from the analysis. Out ofthe remaining 695 children, 130 dropped out, meaning a transition rate of 81 percent, and ofthe 130 dropouts, 89 were girls. These girls represent 26 percent of sample girls, while only11.5 percent of sample boys dropped out. Poverty seems to increase the likelihood ofdropping out, with nearly 44 percent of girls and 20 percent of boys in the poorest quintiledoing so, while the proportion for both genders in the richest quintile is only three percent,indicating that gender bias manifests in conjunction with poverty.
Against this backdrop section 5.1 explores the qualitative reasoning given by parents for whytheir child has dropped out. In section 5.2 variables drawn from this reasoning, as well asvariables drawn from the literature, are explored using bivariate analysis before the results ofthe multivariate analysis are presented in the following chapter.
5.1 Parents’ reasons why children did not make it to secondary school level
During interviews with parents, one of the key questions asked regarding a child who had leftschool was ‘what was the main reason for the child dropping out?’ (Table 7). As expected,the most cited reason for all children was cost. For boys the largest single reason was lack ofinterest in studies, with many boys preferring to join the world of work, as one father stated:
I used to try taking him there [the school] every day, but he would just disappear. Icouldn’t keep trying, he just wants to enter some trade so he is joining his uncle to learnhis work.
This tallies with results of Demographic and Health Survey data presenting a high incidenceof the same reason (Government of India, 2007b).
Table 7: Reasons for not transiting to secondary level by gender and social groups (inpercentage)
All Scheduled Caste Muslim
Female Male Female Male Female Male
Cost of education 25.8 26.8 28.6 33.3 28.6 31.3Not interested instudying 6.7 56.1 14.3 50.0 5.7 62.5
Got paid employment 0.0 2.4 0.0 0.0 0.0 0.0
Social reasons 15.7 0.0 4.8 0.0 11.4 0.0
To help with house work 6.7 9.8 4.8 8.3 8.6 0.0
School too far 39.3 2.4 42.9 0.0 40.0 6.3
Ill health 5.6 0.0 4.8 0.0 5.7 0.0
Too old 0.0 2.4 0.0 8.3 0.0 0.0Total number droppedout 89 41 21 12 35 16

Can Families in Rural India Bear the Additional Burden of Secondary Education?Investigating the Determinants of Transition
18
For girls the most common reason was the distance to school, while the second was socialpressures, with these reasons being related. There is a general fear for the security of girlswhen they leave the confines of the home for schooling, which is exacerbated wheredistances are greater. Socially it is considered undesirable for girls, particularly as they reachpuberty, to travel unaccompanied, and other ‘social reasons’ include the general attitude togirls’ education, as one father said:
‘she will belong to her husband’s house. It is good for her to learn some things whichcan help her in life, but she’s not going to become a doctor, is she?’
Indeed some girls dropped out because they were to be married that year. Current ruralattitudes to girls’ schooling dictate that girls should have some education, but that they shouldbe kept close to the home, as far as possible, and that higher levels of education are notnecessary when marriage is the ultimate goal. However the ‘marriage market’ has had somepositive influence, as one parent stated (with many others expressing the same view in similarwords):
‘It’s the demand in the area nowadays, everyone is looking for an educated wife - whowill marry an uneducated ignoramus?’
Table 8: Distribution of children who dropped out by activity of engagement (inpercentage)
Female Male
Not doing anything 2.3 19.5
Helping with house work 79.3 26.8
Helping with commercial work 13.8 19.5
Learning trade 2.3 34.1
Got married 2.3 0.0
In order to examine whether or not the reasons advanced for dropping out matched what thechild was doing in their first year out of school, the child’s current occupation was askedduring the second round of field work, and these reasons and occupations were found tomatch in most cases. By far the main occupation during the following academic year for agirl who had left school was domestic labour, with only a very small percentage (2.3%)having married immediately after (Table 8). The most common current occupation for boyswas the learning of a trade, followed by helping with the commercial/farming and domesticwork of the household.
By way of contrast and comparison with the sample children, questions were asked of parentsin the first round of data collection with regard to non-sample, school aged children found inthe household who were out of school. Parents were asked the reasons for the children’sabsence from school, and where boys were concerned these were broadly similar to thereasons supplied for a sample boy’s dropping out, while for girls the answers were quitedifferent. For non-sample girls, cost was advanced as the reason in 51 percent of cases, andlack of interest in their studies was given as the second most common reason (32 percent ofcases). These reasons contrast with those supplied with regard to sampled children who leftschool at the point of transition to secondary, while these other children within the householdmay have left school in the middle of either primary or upper primary school. It appears thatthe reasons for boys to leave school are relatively stable, clear and few irrespective of the

Can Families in Rural India Bear the Additional Burden of Secondary Education?Investigating the Determinants of Transition
19
boy’s age, while for girls the reasons may depend more on the individual child and the stageof education at which the girl’s continuation becomes in doubt. The case of girls appearsmore complex and nuanced than that of boys.
5.2 Factors affecting transition status
This section presents finding from the descriptive analysis done using cross tabulationbetween the status of transition and variables which came out of the literature and theinterviews with the parents of dropouts. It also presents the degree of correlation between thetransition status and the various explanatory variables. Tetrachoric and polychoric correlationhave been used in the case of binary and ordinal variables. These correlations are presented inappendix 1.2.
5.2.1 Access to secondary schooling
Cost of and distance to secondary schooling which is additional to those applying to thechosen upper primary school are considered in the main analysis (as described in section 4.6),and all direct costs of schooling are quantified, rather than relying on the monthly fee only. Itshould be borne in mind throughout that in most cases, the closest secondary school was infact a private unaided school. The additional cost of attending secondary schools under bothscenarios is presented in Table 9, illustrating that the costs of attending secondary school risefar more steeply for children attending government and private aided upper primary schools.Under scenario 1, the cost increase (i.e. to access the closest secondary school: usually aprivate unaided school) for children attending government and aided school was more thantwice the cost increase of that for children who already attended private schools. Thishighlights the greater additional burden of reaching secondary level education on the poorestfamilies. The additional cost under scenario 2 remains nearly the same for children attendingany type of school at the upper primary level, although approximately Rs1,000 (thedifference in cost) will represent a vastly more significant proportion of familyincome/expenditure for those in the poorest quintile than for the richest families.
Table 9: Average additional cost for attending secondary schools (Rupees)
45 Rupees = $1 at the time of the research
Table 10 illustrates that additional distance under both scenarios for children attendingprivate schools at the upper primary level is almost zero whereas for children attending eithergovernment or private aided schools the average additional distance can be as high as 4.8kilometres. It again highlights that children from the weakest communities face the largestchallenge when hoping to access secondary schools.
Once again bearing in mind that in most cases the closest secondary school is a privateunaided school, for those who can afford to pay, supply of schools is not an issue. Howeverfor those who are less well-off, the existence close by of these higher fee-paying schools is
Type of upperprimary school childwas attending
Scenario 1: Additionalcost to nearest secondaryschool
Scenario 2: Additional cost tonearest secondary school of thesame type
Private 1,065 1,118
Government 2,370 1,042
Aided 2,329 911
Total 2,008 1027

Can Families in Rural India Bear the Additional Burden of Secondary Education?Investigating the Determinants of Transition
20
essentially of no help; these less advantaged children must travel longer distances to access amore affordable option, meaning that the current context has negative equity effects.
Table 10: Average additional distances to secondary schools (kilometres)
Type of upperprimary schoolchild was attending
Scenario 1: Additionaldistance to nearestsecondary school
Scenario 2: Additional distanceto nearest secondary school ofthe same type
Private 0.0 0.1
Government 1.3 4.5
Aided -0.3 4.8
Total 0.6 3.4
In support of parents’ assertions in the previous section and the prima facie evidence, thereproves to be a statistically significant and negative correlation between additional cost anddistance to schools and transition status in both scenarios, with the effect being stronger forgirls, further highlighting the difference in attitudes to girls’ and boys’ schooling. However,the disaggregated analysis shows an insignificant relationship between cost and distance andtransitions status for boys under scenario 2 only.
5.2.2 Parental perception of the child’s performance at the primary level
The reasons for drop out outlined in section 5.1 point to the importance of motivations ofparents and children regarding education. Proxies indicating how well the child’s education isgoing are used as explanatory variable, and are measured by each child’s scores on theRaven’s (IQ), mathematics and Hindi tests, presented in Table 11. The average score for girlsin all three tests is lower than that of boys and for both genders the average scores forchildren who dropped out were lower than those for children who transitioned to thesecondary level. There is a significant correlation between IQ test scores and the transitionstatus of children, however when disaggregated by gender, it is no longer significant for boysbut remains so for girls. The correlation between scores on mathematics and Hindi tests andtransition status is significantly positive for both genders, with the effect being stronger onceagain for girls.
Parents tended to express a lack of motivation with regard to their child’s education when noresults could be observed. As one parent expressed the problem,
‘What is the point in spending so much money when she is not learning anything? Sheis a little thick. Even after so many years she barely knows anything.’
The situation of girls is once again found to be more complex than that for boys – the level ofa boy’s learning appears to impact on parental dedication to education much less than wherea girl is concerned.

Can Families in Rural India Bear the Additional Burden of Secondary Education?Investigating the Determinants of Transition
21
Table 11: Average test score of children by transition status and gender
Female Male Total
No Yes All No Yes All No Yes All
Raven score 13 20 18 18 23 22 14 21 20
Math score 8 11 10 11 15 15 8 13 13
Hindi score 17 21 20 20 23 23 18 22 22(Yes=transition and No=dropout)
Another proxy for the level of motivation of parents and child is the child’s attendance recordover a year, with the average attendance of those children who transitioned to secondaryschool being 27 percentage points higher than for those who dropped out. Table 12 presentsthe average attendance using school records as well as attendance measured as part of theresearch during the survey period. Boys’ attendance using both school and survey records islower than that of girls and the difference in average attendance between those whotransitioned and those of dropped out is 24 percentage points for girls and 36 percentagepoints for boys. The correlation between the attendance record of a child and the transitionstatus is statistically significant across the board, with the relationship between boys’attendance and their transition status being stronger than the same relationship for girls.
Table 12: Average attendance of children by transition status and gender
Female Male Total
No Yes All No Yes All No Yes AllSchoolrecord 70.1 87.4 82.9 65.5 84.1 81.9 68.7 85.6 82.4Surveyrecord 56.6 80.7 74.5 41.2 77.6 73.3 51.7 79.0 73.9
(Yes=transition and No=dropout)
5.2.3 Child characteristics
Certain characteristics of the individual child are highlighted in the literature as beingimportant to the child’s education, such as the age, gender, birth rank, work and body massindex (BMI – a proxy for health and general fitness). It is widely recognised that the genderof the child is significant, with this factor playing a significant role throughout this study. Interms of age, those children who were ‘over age’ for grade 8 by one or more years werefound to be much more likely not to transition than their counterparts of the official age forthe grade; Table 14 shows that over 47 percent of children who were ‘over age’ dropped outas compared to 15 percent of other children. It is likely that there is an element of socialdiscomfort in being significantly older than one’s classmates, which may erode the child’smotivation.
For girls the relationship between age and dropping out may be related to puberty and theirapproach to marriageable age, and the fact that parental fears regarding their daughters’safety and reputation increase as a girl gets older. There may also be some opportunity costsinvolved where daughters would otherwise be helping with domestic work or with the maineconomic work of the family. Indeed, 56 percent of over-age girls were found to havedropped out, with some parents expressing the view that a girl in particular can simplybecome ‘too old to remain in school’, reinforcing the well-documented societal bias against

Can Families in Rural India Bear the Additional Burden of Secondary Education?Investigating the Determinants of Transition
22
girls. Many parents expressed similar concerns regarding the reputation of their familieslinked to an older girl remaining unmarried and having to commute to school:
‘She is almost of the age [for marriage]. We have to consider the society also. Ifsomething happens [to her], what would happen to our family?’
For a boy, dropping out as an older child may be even more strongly related to increasingopportunity costs as their potential for wage earning increases along with their age, with 36percent of over-age boys having dropped out (Table 13). Of those children who dropped out,over 50 percent of boys were found to be engaged in economic activity, while almost 80percent of female dropouts were found to be at home, helping with domestic work.
Table 13: Percentage distribution of children by transition status, age category andgender
Female Male Total
No YesTotalChildren No Yes
TotalChildren No Yes
TotalChildren
Under age 18.8 81.3 16 14.3 85.7 14 16.7 83.3 30
Right age 22.1 77.9 285 9.1 90.9 308 15.3 84.7 593
Over age 56.1 43.9 41 35.5 64.5 31 47.2 52.8 72
Total 26.0 74.0 342 11.6 88.4 353 18.7 81.3 695(Yes=transition and No=dropout)
The correlation between the transition status and the birth order or rank of the child in thefamily is nearly zero and insignificant for both genders, being either oldest or youngest in thefamily does not increase or decrease a child’s chances of making the transition to secondaryschool. Also, a child’s engagement in the work of the family does not affect their transitionstatus; the correlation for both boys and girls is nearly zero and insignificant. Counter-intuitively, the relationship between a child’s BMI and transition is negative and significant,meaning that underweight children are more likely to make the transition compared tochildren who are fitter. However, when the analysis was done only for children who are in theright age group the correlation between BMI and the transition status becomes weak andinsignificant. This indicates that there may be other attendant complications connected with achild’s being outside of the official age range.
5.2.4 Household characteristics
The final group of factors centre around household characteristics which may also impact onthe child’s chance of transition. Caste is widely recognised as having an impact on people’slives in India, and surprisingly it was found that being a member of a scheduled caste appearsto have virtually no relationship with transition, with 18 percent of scheduled caste childrenhaving dropped out which is in line with the trend across the entire sample. However thisfinding may be explained by the fact that in India only around 50 percent of children evermake it to grade 8, meaning that a large proportion of the disadvantaged will have alreadyexited the system, leaving only the more motivated and/or privileged to consider whether ornot to continue into secondary schooling. Table 14 illustrates that the picture of caste changeswhen considering girls: 22 percent of scheduled caste girls dropped out while the proportionis 14 percent of scheduled caste boys. However over all the correlation between caste and thetransition status for both boys and girls is extremely weak and insignificant. This may be

Can Families in Rural India Bear the Additional Burden of Secondary Education?Investigating the Determinants of Transition
23
partly because the ‘non-scheduled caste’ category includes minority religion families whotend to have poorer outcomes, as illustrated below.
Table 14: Percentage distribution of children by transition status, religion and gender
Female Male Total
No YesTotalChildren No Yes
TotalChildren No Yes
TotalChildren
Non scheduledcaste 27.3 72.7 249 10.8 89.2 268 18.8 81.2 517Scheduledcaste 22.6 77.4 93 14.1 85.9 85 18.5 81.5 178
Total 26.0 74.0 342 11.6 88.4 353 18.7 81.3 695(Yes=transition and No=dropout)
Being a member of a minority religion may also impact on transition, which is borne out bythe dropout rate for Muslim children of 29 percent being a significant 10 percentage pointshigher than for the sample as a whole. Additionally, the case of Muslim girls is worse yet,with 38 percent dropping out as opposed to 20 percent of Muslim boys. However, themagnitude of correlation for both boys and girls is almost same and significant. Whendisaggregated by the asset index quintile it is found that almost 46 percent of poorest Muslimchildren dropped out as compared to 24 percent of children in the non-Muslim category(Table 15).
Table 15: Percentage distribution of children by transition status, religion and gender
Female Male Total
No YesTotalChildren No Yes
TotalChildren No Yes
TotalChildren
Non Muslim 21.5 78.5 251 9.2 90.8 273 15.1 84.9 524
Muslim 38.5 61.5 91 20.0 80.0 80 29.8 70.2 171
Total 26.0 74.0 342 11.6 88.4 353 18.7 81.3 695(Yes=transition and No=dropout)
It was also found that the children of older parents are less likely to transition with the affectbeing significantly negative and almost equal for both girls and boys. The effect of father’squalification is mixed when the level attained is below secondary school but the effect isstrongly significant and positive when father’s qualification is secondary or above, with theeffect being stronger yet for a girl child. Conversely a mother’s having any education at all, acharacteristic often associated with better educational outcomes for children, significantlyincreases the likelihood of the child’s transition. As expected, the total number of adults inthe household is insignificant, while the number of school aged children has a significant andnegative effect, with families in the lowest asset index quintile having one child more onaverage than other families.
5.2.5 Economic status of the household
The effect of the family’s main livelihood proves statistically significant across the board,with the direction of this relationship being positive for the children of farmers and skilledlabourers, while it is negative for the children of unskilled workers, 25 percent of whom dropout:

Can Families in Rural India Bear the Additional Burden of Secondary Education?Investigating the Determinants of Transition
24
‘If they [children] don’t work, what will they eat? And whatever we are spending [oneducation] is coming out of our food basket.’
Such concerns were expressed by many unskilled labourers and marginal farming families.Distribution of children by family’s main economic activity is presented in Table 16, it showsthat more than twice as many girls dropout of school in families where the main source ofincome is unskilled manual labour as compared to families whose main source of income iseither skilled work or farming.
Table 16: Percentage distribution of children by transition status, religion and gender
Female Male TotalMain incomesource No Yes
TotalChildren No Yes
TotalChildren No Yes
TotalChildren
Farming 10.5 89.5 86 6.9 93.2 87 8.7 91.3 173
Skilled labour 16.9 83.1 59 8.7 91.3 69 12.5 87.5 128
Unskilled labour 35.5 64.5 197 14.7 85.3 197 25.1 74.9 394(Yes=transition and No=dropout)
Related to this, it is important to capture the economic status of the family as accurately aspossible, with rural households presenting particular difficulties in terms of quantifyingincome or expenditure, often having multiple and irregular sources of income. Table 17illustrates that the economic status of the household, derived using asset index scores has alinear relationship with transition, with the numbers dropping out in each quintile increasingas wealth decreases. Thirty-three percent of children in the lowest wealth quintile droppedout, while the proportion is only 3 percent for those in the highest quintile.
Table 17: Percentage distribution of children by transition status, asset index categoryand gender
Female Male Total
No YesTotalChildren No Yes
TotalChildren No Yes
TotalChildren
Quintile 1 44.0 56.0 75 20.6 79.4 63 33.3 66.7 138
Quintile 2 39.7 60.3 73 21.2 78.8 66 30.9 69.1 139
Quintile 3 23.1 76.9 65 9.3 90.7 75 15.7 84.3 140
Quintile 4 15.4 84.6 65 6.8 93.2 73 10.9 89.1 138
Quintile 5 3.1 96.9 64 2.6 97.4 76 2.9 97.1 140
Total 26.0 74.0 342 11.6 88.4 353 18.7 81.3 695(Yes=transition and No=dropout)
5.3 Conclusion
The bivariate analysis outlined here supports the hypothesis that additional cost and distanceplay a role in a child’s transition. This section has also discussed other factors that appear toplay a role and that must therefore be controlled for in the multivariate analysis, the results ofwhich are presented below.

Can Families in Rural India Bear the Additional Burden of Secondary Education?Investigating the Determinants of Transition
25
6. The multivariate analysis of transition
Taking the above description of the various issues related to transition as a foundation, thissection focuses on the multivariate analysis carried out using forward stepwise logisticregression to determine the factors which are most strongly and closely associated withtransition. The dependent variable is the transition status of the child after one year: whetheror not the child has enrolled in secondary school, with this status recorded at the end of theadmissions period for that academic year. Five different models were constructed to assessthe robustness of the effect of additional cost and additional distance on the transition statusof children. Section 6.1 presents findings from multivariate analysis using scenario 1, andsection 6.2 presents finding from analysis using scenario 2.
6.1 Scenario 1: Additional cost and distance to the nearest secondary school
Taking our variables of most interest first, additional cost is shown to be significantly relatedto transition in the direction expected: additional cost is associated with a significantlyreduced chance that the child will make the transition to secondary school (Table 18). Thisrelationship remains constant throughout the modelling process, but in order to furtherinvestigate the effect, a disaggregated analysis was carried out for each wealth quintile.Coefficients could not be generated for the top two quintiles due to the small numbers ofdropouts, however taking the middle quintile additional cost was found to be insignificantlyrelated to transition, whereas this association was strong and significant for the lowest twoquintiles.
This relationship was also examined through the lens of gender and social groups: additionaldistance is insignificant with regard to boys, but is strongly and negatively significant forgirls. This indicates that it is not solely the cost that is most important but it becomes so whenintersecting with gender bias: the reason most commonly advanced by parents of girldropouts was cost, while for boys this was the child’s lack of interest in school. Also withregard to Muslim children, the additional costs involved significantly reduce the odds oftransition, whereas in the case of scheduled caste families the effect of additional cost wasfound to be insignificant for this group (Appendix 1.3). An investigation of the combinedeffect of gender and caste was not possible due to an insufficient number of observations.
As expected, additional distance is negatively and significantly related to transition, thushighlighting that any increase in distance that a child must travel in order to access secondaryschooling is associated with a decreased chance of transition; this association remainsconstant across models, and even across economic levels. The association is stronger for girlshowever it is also negatively significant for boys, in contrast to the results for costs. Also withregard to scheduled caste and Muslim children, additional distance is significantly related totransition.
The relationship of scores on the three tests (Raven’s, mathematics and Hindi) with transitionis positive but insignificant across models, however when disaggregated, it is found that theinnate ability of girls (Raven’s test score) is significantly positive. The overall finding withregard to achievement tests indicates a weak carry-forward effect of the quality of schoolingon families’ decisions regarding transition. However, attendance at the upper primary level issignificantly and positively related to transition, including for scheduled castes and Muslims.The disaggregated analysis shows that the association is stronger for boys than for girls,which arguably is linked to boys dropping out due to lack of interest in school.

Can Families in Rural India Bear the Additional Burden of Secondary Education?Investigating the Determinants of Transition
26
Counter intuitively, BMI has a weak (insignificant) but negative association with transition,and this is same for both boys and girls, however this requires further investigation and willbe considered in future work from the study. On the other hand, the child’s age issignificantly and negatively related to transition, with a much stronger association for girlsthan for boys. Those children who are already over age for their class are much less likely tomake the transition to secondary school. However, when disaggregated, age is insignificantfor Muslim and scheduled caste children. The child’s birth rank in the family was also foundto be insignificant, however again with regard to girls it proves to be significantly negative.The child’s work status is insignificant for all effects.
Having an older father is shown to be negatively and significantly associated with transition,however this relationship is fairly weak, only becoming significant with regard to Muslimchildren. Compared to fathers and mothers with no education, having primary or post-primary education (or any education for mothers) has no significant effect. Surprisingly, casteand religion, in the pooled analysis, are also insignificantly related to transition; howeverwhen disaggregated we see that the odds of transition are significantly lower for Muslimboys. Consistent with many studies examining factors in school participation, the economicstatus is positively and significantly related to transition, meaning that compared to childrenin the lowest two quintiles, children from the top three quintiles are significantly more likelyto transition to secondary school.

Can Families in Rural India Bear the Additional Burden of Secondary Education?Investigating the Determinants of Transition
27
Table 18: Odd ratio for the likelihood of transition (pooled data) – Scenario 1
Model 1 Model 2 Model 3 Model 4 Model 5
VariablesOddratio
Z-score Odd ratio Z-score Odd ratio Z-score Odd ratio Z-score Oddratio
Z-score
Supply factors
additional distance 0.71 -4.41* 0.68 -3.89* 0.67 -3.82* 0.67 -3.67* 0.67 -3.72*
additional cost /100 0.92 -5.98* 0.95 -3.03* 0.96 -2.73* 0.96 -2.60* 0.95 -2.69*
Parental Incentives
raven 1.03 1.76 1.03 1.70 1.03 1.65 1.03 1.63
math 1.06 1.76 1.06 1.72 1.06 1.60 1.05 1.36
hindi 1.01 0.50 1.01 0.27 0.99 -0.22 0.98 -0.81
attendance 1.03 6.67* 1.03 5.25* 1.03 4.62* 1.03 4.60*
attendance*gender 1.02 3.24* 1.02 1.78 1.02 2.09** 1.02 2.02**
ChildrenCharacteristics
age 0.66 -3.48* 0.67 -2.89* 0.68 -2.81*
gender 0.79 -0.36 0.61 -0.74 0.59 -0.71
birth rank 0.97 -0.31 1.20 1.21 1.17 1.03
work 1.06 0.25 1.07 0.25 0.97 -0.12
body mass index 0.93 -1.06 0.91 -1.31 0.88 -1.63
HouseholdCharacteristics
father age 0.95 -2.28** 0.96 -2.00**father qual-up to upperprimary
0.65 -1.41 0.65 -1.38
father qual-secondaryand above 1.50 1.17 1.33 0.84
mother qualification 0.67 -0.99 0.64 -1.04
total adult 0.91 -0.61 0.88 -0.80
total school age children 0.89 -1.14 0.91 -0.82
skilled labour 0.57 -1.16 0.92 -0.16
unskilled labour 0.35 -2.86* 0.63 -1.06
scheduled caste 1.06 0.20 1.00 0.00
muslim 0.59 -1.62 0.64 -1.41
Asset Index
asset2 0.86 -0.43
asset3 2.53 2.53**
asset4 2.53 2.15**
asset5 4.76 2.29**
Pseudo R-square 0.09 0.30 0.32 0.36 0.39
Sample size 695 695 695 695 695
Note: Z score are calculated using robust standard error.Significance at the 1% and 5%level is indicated with * and **, respectively.
6.2 Scenario 2: Additional cost and distance to the same type of secondary school
In the second scenario additional distance to and cost of the same type of school that the childattended at the upper primary level has been used as the key explanatory variable to studytransition to the secondary level. The association of additional cost and transition remainssignificant and negative across all models but the association of additional distance andtransition, in contrast to scenario 1, becomes insignificant after controlling for the economicstatus of families (Table 19).
Can Families in Rural India Bear the Additional Burden of Secondary Education?Investigating the Determinants of Transition
28
The disaggregated examination of the data illustrates that the additional distance is significantfor girls but insignificant for boys. However additional cost is significantly and negativelyrelated to transition for both boys and girls in the pooled model. For Muslim children neitheradditional distance nor additional cost was significant but for scheduled caste children bothvariables were significantly related to transition with the coefficient of additional distancebeing stronger than that of additional cost (Appendix 1.4).
Achievement scores is significantly related to transition in model 2 but the associationbecomes insignificant when controlled for child and household characteristics. The Raven’stest score is significantly positive for girls and children from the Muslim community but notfor boys and children from scheduled caste families. Attendance as well as the interactionterm of attendance and child’s gender remains significant in the pooled analysis indicating asignificantly stronger association of attendance with the continuation status of boys.Attendance remained significant for both genders and social and religious groups in thedisaggregated analysis, but for scheduled caste and Muslim children the coefficient ofinteraction (even though positive) was insignificant, indicating an insignificantly differenteffect of attendance for boys.
The effects of children’s characteristics are similar to those in scenario 1 with the onlyexception being the child’s birth rank in the disaggregated analysis. Unlike in scenario 1,birth rank is insignificantly related to transition status for girls. Also, the effect of householdcharacteristics was similar as in the case of scenario 1 with the only difference being withregard to the total number of adults in the case of girls and father’s age in the case ofscheduled caste children. The total number of adults in the household is insignificant for girlsand father’s age is significant for scheduled caste children.
Being in asset quintile 4 (second richest) significantly increases the chance of transition forboys and being in (middle) quintile 3 significantly increases the chance of transition for girls.This is in contrast to the finding from the disaggregated analysis in scenario 1 where theeffect of being in any wealth quintile was insignificant for both genders.

Can Families in Rural India Bear the Additional Burden of Secondary Education?Investigating the Determinants of Transition
29
Table 19: Odd ratio for the likelihood of transition (pooled data) – Scenario 2
Model 1 Model 2 Model 3 Model 4 Model 5
VariablesOddratio
Z-score Oddratio
Z-score Oddratio
Z-score Oddratio
Z-score Oddratio
Z-score
Supply factors
additional distance 0.84 -4.62* 0.89 -2.17** 0.90 -1.96** 0.89 -1.96** 0.90 -1.80
additional cost /1000.79 -4.36* 0.82 -3.27* 0.83 -3.02* 0.81 -2.95* 0.78 -3.23*
Parental Incentives
raven 1.03 2.09** 1.03 1.93 1.03 1.91 1.04 1.90
math 1.07 2.08** 1.07 1.99** 1.07 1.81 1.06 1.57
hindi 1.02 0.72 1.01 0.54 1.00 0.00 0.98 -0.66
attendance 1.03 6.92* 1.03 5.59* 1.03 4.77* 1.03 4.86*
attendance*gender 1.02 3.28* 1.02 1.71 1.02 2.03** 1.02 1.97**
Children Characteristics
age 0.67 -3.42* 0.69 -2.70* 0.69 -2.62*
gender 0.84 -0.28 0.65 -0.63 0.68 -0.55
birth rank 0.95 -0.52 1.15 0.96 1.14 0.85
work 1.13 0.51 1.19 0.68 1.09 0.33
body mass index 0.93 -1.09 0.91 -1.39 0.86 -1.91
Household Characteristics
father age 0.95 -2.47** 0.95 -2.26**father qual-up to upperprimary
0.66 -1.36 0.64 -1.43father qual-secondary andabove
1.55 1.28 1.39 0.94
mother qualification 0.73 -0.81 0.70 -0.84
total adult 0.95 -0.35 0.90 -0.61
total school age children 0.89 -1.17 0.92 -0.75
skilled labour 0.64 -0.93 1.09 0.17
unskilled labour 0.36 -2.87* 0.68 -0.91
scheduled caste 1.09 0.28 1.02 0.05
muslim 0.57 -1.76 0.63 -1.48
Asset Index
asset2 0.85 -0.49
asset3 2.64 2.57*
asset4 2.38 2.16**
asset5 6.17 2.31**
Pseudo R-square 0.04 0.28 0.30 0.35 0.37
Sample size 695 695 695 695 695
Note: Z-score are calculated using robust standard error.Significance at the 1% and 5%level is indicated with * and **, respectively.

Can Families in Rural India Bear the Additional Burden of Secondary Education?Investigating the Determinants of Transition
30
7. Conclusion and policy implications
7.1 The key findings
This paper attempts to fill a significant gap in the literature on education in India: establishingthe determinants of transition. As expected from the qualitative data and from the descriptiveanalysis undertaken, the two factors that were expected to be most significant proved to beso: the additional cost and additional distance required to access secondary school. Costappears to be the most consistently significant factor in transition, while the effect of distanceis much more nuanced. While under scenario 1 both additional cost and distance significantlyreduce the probability of transition to the secondary levels, in scenario 2, only the relationshipbetween the additional cost and the transition status remains significant. Of note is that, ineffect, cost outweighs distance: for poorer families the fact that an unaffordable school isclose by is immaterial. Bowing to the financial constraints under which they live, theirchildren must travel longer distances in order to access the cheaper option if they are to makethe transition, meaning that distance comes to appear insignificant.
With regard to the increase in cost involved in transition, even when considering the cheapestoption available (transitioning from government primary school to private aided secondaryschool) the cost increases by 2.5 times, meaning a swift and substantial increase in theeducation cost burden of the family. This can be seen to affect poor families the most, as theincrease in cost from private unaided primary to the same type of secondary (while this sectoris more expensive to begin with) is only 1.5 times. This relationship is compounded by thefact that poorer families tend to have larger family sizes thus leaving them with no option butto prioritise the education of some children within the family, often boys. Those familiessufficiently well off to access private education at the primary level fairly comfortably will beless severely affected by the rise in cost between levels than the poorest families accessingthe cheapest option; a highly inequitable situation.
However the disaggregated analysis leads to further insights. Disaggregation along genderlines suggests that increased distance and cost are most detrimental for girls. With regard toboys under scenario 1, the association of cost and transition proves insignificant, while that ofdistance and transition is significant. In terms of social status, for both boys and girls there isno significant relationship between being scheduled caste and transition status. Howeverbeing a Muslim boy is associated with a lesser chance of transition, with no such relationshipfor Muslim girls. With regard to the age of the child, the relationship with transition for bothboys and girls is significant, however the relationship is more robust in the cast of girls.
When the analysis is disaggregated by caste, the relationship between transition andadditional distance is significant under both scenarios, while cost is only significant underscenario 2. When disaggregated by religious status, the relationship between gender andtransition is insignificant, however with regard to the asset index scores, being in the top twoquintiles significantly increases the chance of transition.
In both the pooled and also all disaggregated analyses the relationship between attendance atthe upper-primary level and transition is very strongly significant. Those children of bothgenders and all socio-economic groups and levels who do not participate strongly andconsistently at this level are much less likely to transition.

Can Families in Rural India Bear the Additional Burden of Secondary Education?Investigating the Determinants of Transition
31
7.2 The policy implications
Under the new policy of RMSA the Government of India is planning to construct many moresecondary schools throughout the country (within 5 kilometres of any habitation), either inentirely new sites or by upgrading of existing upper-primary schools. An increase in thenumber of public secondary schools will have the combined effect of reducing both cost anddistance to secondary schools. The analysis in this paper indicates that an increased supply ofsecondary schools of the lowest possible cost may well have an impact on transition overall.However the magnitude of affect may be lower for boys and children from minority group asindicated by the mixed effect of additional distance and cost under two scenarios.
Apart from possible policy interventions at the secondary level designed to affect transition,attention needs to be paid to policies at the primary level, as experiences of participation atthis level may have long-term effects on the child’s chances of transitioning to secondaryschool. This is indicated by the significant relationship between attendance at the upper-primary level in both pooled and disaggregated analysis, with transition. Where children donot attend regularly, and where the child enters schooling at the wrong age (i.e. older than heor she should be), or is delayed by repetition and interrupted attendance the child is muchmore likely to drop out. It may be that the relevance and quality of education they receive atlower levels (which therefore colours children’s and parents’ views on education) may proveto have a great impact. It should be remembered that approximately half of all pupils drop outof school during the primary cycle, meaning that significant improvements are required atthis level to achieve high participation at the upper-primary and secondary level. Thosechildren reaching grade 8 today can already be considered a relatively select group.
7.3 Areas for future research
More research into related areas would go some way to clarifying how best to improvetransition. Any method of cost subsidisation to aid those for whom cost is a major barrier,requires careful consideration: should the government offer free secondary education, orwould a targeted stipend or voucher yield more efficient and cost-effective results? This mustbe considered in the context of the expanding private sector which in many areas is providinga large supply of schools which are, however, unaffordable to many, and certainly thosebelow the third quintile of wealth. One option for significantly reducing the costs at privateaided school would be to offer free text books, thus cutting the costs of schooling by 45percent. Another significant area for research would be to examine how effective policies toimprove participation and attendance at the primary level have been, and whether these couldbe better designed. There is much work yet to be done, to fully understand the problem oflow transition to secondary education, and to make it more equitable.

Can Families in Rural India Bear the Additional Burden of Secondary Education?Investigating the Determinants of Transition
32
References
Alderman, H., Behrman, J., Lavy, V., Menon, R., 2001. Child Health and School Enrolment:A longitudinal analysis. Journal of Human Resource 36(1), 185-205.
Arunatilake, N., 2006. Education participation in Sri Lanka- Why all are not in school.International Journal of Educational Research 45(3), 137-152.
Bajpai, N., Dholakia, R., Sachs, J., 2005. Scaling up primary education services in ruralIndia. Center on Globalization and Sustainable Development Working Paper No. 28.
Borooah, V., Iyer, S., 2005. Vidya, Veda, and Verna: The influence of religion and caste oneducation in rural India. The Journal of Development Studies 41(8), 1369-1404.
Chandrashekhar, S., Mukhopadhyay, A., 2006. Does cost of primary schooling matter?Evidence from rural India. Indian Statistical Institute. Available online at:www.isid.ac.in/~planning/EDNSSRN.pdf. Accessed on 1st February 2010.
Cohen, L., Manion, L., Morrison, K., 2000. Research Methods in Education, 6th ed.,Routledge, Falmer.
Connelly, R., Zheng, Z., 2003. Determinants of school enrollment and completion of 10 to 18year olds in China. Economics of Education Review 22 (4), 379-388.
Cueto, S. (2005) Height, Weight, and Educational Achievement in Rural Peru, Food andNutrition Bulletin 26(2), S251-S260.
Deininger, K., 2003. Does cost of schooling affect enrollment by the poor? Universal primaryeducation in Uganda. Economics of Education Review 22 (3), 291-305.
Dreze, J., Kingdon G., 2001. School participation in rural India. Review of DevelopmentStudies 5(1), 1-24.
Filmer, D., 2004. If you build it, will they come? School availability and school enrolment in21 poor countries. World Bank Policy Research Working Paper 3340, Washington.
Filmer, D., Pritchett, L., 2001. Estimating wealth effects without expenditure data – or tears:an application to educational enrolments in states of India. Demography, 38(1), 115-132.
Glewwe, P., Jacoby, H., 1994. Student achievement and schooling choice in low-incomecountries: evidence from Ghana. Journal of Human Resources 29(3), 843-864.
Glewwe, P., Jacoby, H., 1995. An economic analysis of delayed primary school enrolment ina low income country: the role of early childhood nutrition. Review of Economics andStatistics 77(1), 156-169.
Glewwe, P., Jacoby, H., King, E., 1999. Early childhood nutrition and academicachievement: A longitudinal analysis. Journal of Public Economics 81(3), 345-368.

Can Families in Rural India Bear the Additional Burden of Secondary Education?Investigating the Determinants of Transition
33
Glewwe, P., Kremer, M., 2005. School, teachers, and education outcomes in developingcountries. CID Working Paper No. 122, Harvard University.
Government of India, 2007a. Rashtriya Madhyamik Shiksha Abhiyan. Available online at:http://pib.nic.in/archieve/others/2007/dec07/e420071225.pdf. Accessed on 1st February2010.
Government of India, 2007b. National Family Health Survey-3 2005-06, Volume 1, India.Available online at: http://www.measuredhs.com/pubs/pdf/FRIND3/02Chapter02.pdf.Accessed on 1st February 2010.
Government of India, 2007c. Selected Education Statistics. Available online at:http://www.educationforallinindia.com/SES2006-07.pdf. Accessed on 1st February 2010.
Grantham-McGregor (2005) Can the provision of breakfast benefit school performance?Food and Nutrition Bulletin 26(2), S144-S158.
Hanushek, E., Lavy, V., Hitomi, K., 2006. Do students care about school quality?Determinants of dropout behavior in developing countries. National Bureau of EconomicResearch Working Paper No 12737.
Härmä, J., 2010. School choice for the poor? The limits of marketisation of primaryeducation in rural India. CREATE Research Monograph 23, University of Sussex,Brighton.
Hulme, D., 2003. Conceptualizing chronic poverty. World Development, 31(3), 403-423.
Hunt, F., 2008. Dropping out from school: A cross country review of literature. CREATEResearch Monograph 16, University of Sussex, Brighton.
Jeffery, P. & Jeffery, R., 1996. What’s the benefit of being educated?: Girls’ Schooling,Women’s Autonomy and Fertility Outcomes in Bijnor. In: Jeffery, R., Basu, A. (Eds.),Girls’ Schooling, Women’s Autonomy and Fertility Change in South Asia. SagePublications, London.
Jha, J., Subrahmanian, R., 2005. Secondary education in the Indian State of Uttar Pradesh:Gender dimensions of State policy and practice. UNRISD.
Kingdon, G., 2007. The progress of school education in India. Oxford Review of EconomicPolicy, 23(2), 168-195.
Kingdon, G., 1996. The quality and efficiency of private and public education: A case-studyof urban India. Oxford Bulletin of Economics and Statistics, 58(1), 57-82.
Kremer, M., Miguel, E., Thornton, R., 2007. Incentives to learn. Harvard University.Available online at:http://economics.harvard.edu/faculty/kremer/files/IncentivesToLearn.pdf. Accessed on 1st
February 2010.

Can Families in Rural India Bear the Additional Burden of Secondary Education?Investigating the Determinants of Transition
34
Lewin, K., 2007. Improving access, equity and transition in education: Creating a researchagenda. CREATE Pathway to Access Series No.1, University of Sussex, Brighton.
Motala, S., Dieltiens, V., Sayed, Y., 2009. Physical access to schooling in South Africa:mapping dropout, repetition and age-grade progression in two districts. ComparativeEducation 45(2), 251-264.
Ohba, A., 2009. Does free secondary education enable the poor to gain access? A study fromrural Kenya. CREATE Research Monograph 21, University of Sussex, Brighton.
Rose, P., 2002. Cost-sharing in Malawian Primary Schooling: From the Washington to thePost-Washington Consensus. Unpublished DPhil thesis, University of Sussex, Brighton.
Schultz, T. P., 2004. School subsidies for the poor: Evaluating the Mexican PROGRESAPoverty Program. Journal of Development Economics 74(1), 199-250.
Suryadarma, D., Suryahadi, A., Sumarto, S., 2006. Causes of low secondary schoolenrollment in Indonesia. SMERU Research Institute, Indonesia. Available online at:http://www.eaber.org/intranet/documents/42/1635/SMERU_Suryadarma_2006.pdf.Accessed on 1st February 2010.
Wolfe, B., Zuvekas, S., 1995. Nonmarket outcomes of schooling. Discussion paper 1065-95.Institute for Research on Poverty, University of Wisconsin-Madison.
World Bank, 2009. Secondary education in India: Universalizing opportunity. HumanDevelopment Unit South Asia Region, Washington.

35
Appendices

36

37
Appendix 1.1: Descriptive statistics for all study variables
Variables Description Range Mean SDSupply factorsadditional distance Additional distance to nearest secondary school -2.0 - 4.0 0.55 1.21
additional cost Additional cost to nearest secondary school 0 - 3690 2009 848
Parental Incentives
raven Score in raven test (maximum = 60) 0 - 52 19.99 11.70
math Score in mathematics test (maximum = 40) 0 - 35 12.56 6.41
hindi Score in Hindi test (maximum = 40) 0 - 38 21.41 6.44
attendance Average attendance in four rounds 0 - 100 73.68 25.25
body mass index Body mass index 12.2 – 23 16.23 1.72
Children Characteristics
age Age of child in years 10 - 17 13.61 0.90
gender Gender of child (0* = female 1 = male) 0 - 1 0.51 0.50
birth rank Rank of child among children in the family(1=oldest)
1 - 7 2.59 1.31
workIs child helping with family’s economic activities(0*=no 1=yes)
0 - 1 0.49 0.50
Household Characteristics
father age Father age in years 30 - 65 40.90 6.87
father qual-no Father qualification (1= No education)* 0 - 1 0.31 0.46
father qual- up to upper primary Father qualification (2= Up to upper primary) 0 - 1 0.32 0.47
father qual-secondary andabove
Father qualification (3= Secondary and above) 0 - 1 0.37 0.48
mother age Mother age in years 28 - 62 38.49 6.88
mother qualificationMother qualification (0*=no education 1=someeducation)
0 - 1 0.23 0.42
total adults Total number of adults in the family 2 - 7 2.90 1.08
total school age children Total number of school age children in the family 1 - 7 3.37 1.25
farming Family’s main economic activity (1=farming)* 0 - 1 0.25 0.43
skilled labour Family’s main economic activity (2=skilled labour) 0 - 1 0.19 0.39
unskilled labour Family’s main economic activity (3=unskilledlabour)
0 - 1 0.56 0.49
scheduled caste Is this a scheduled caste family (0*=no 1=yes) 0 - 1 0.26 0.44
muslim Is this a Muslim family (0*=no 1=yes) 0 - 1 0.25 0.43
asset1 Asset index (1=poorest)* 0 - 1 0.20 0.40
asset2 Asset index (2=not so poor) 0 - 1 0.20 0.40
asset3 Asset index (3=neither rich nor poor) 0 - 1 0.20 0.40
asset4 Asset index (4=not so rich) 0 - 1 0.20 0.40
asset5 Asset index (5=richest) 0 - 1 0.20 0.40
* Refers to the reference category N=695

38
Appendix 1.2: Correlation with dependent variable (0=dropout1=transition to secondary school)
Pooled Girls Boys
Supply factors Correlation SE Correlation SE Correlation SE
Scenario 1
additional distance-0.23* 0.05 -0.24* 0.07 -0.19* 0.07
additional cost -0.35* 0.05 -0.40* 0.06 -0.28* 0.08
Scenario 2
additional distance-0.17* 0.06 -0.23* 0.08 -0.08 0.10
additional cost -0.17* 0.06 -0.18* 0.07 -0.17 0.10
Parental Incentives
raven score 0.36* 0.05 0.41* 0.06 0.18 0.11
math score 0.43* 0.04 0.37* 0.05 0.34* 0.11
hindi score 0.36* 0.05 0.38* 0.06 0.24* 0.09
attendance 0.49* 0.04 0.48* 0.05 0.57* 0.05
Children Characteristics
age -0.31* 0.04 -0.34* 0.06 -0.26* 0.07
gender 0.34* 0.06
birth rank 0.03 0.06 0.02 0.07 0.00 0.09
work 0.03 0.07 -0.09 0.09 0.06 0.11
Household Characteristics
father age -0.18* 0.05 -0.20* 0.07 -0.17* 0.08father qual- up to upperprimary -0.15* 0.07 -0.17 0.09 -0.19 0.11father qual-secondary andabove 0.40* 0.07 0.46* 0.08 0.37* 0.11
mother age -0.18* 0.05 -0.20* 0.07 -0.17* 0.08
mother qualification 0.29* 0.08 0.35* 0.10 0.27* 0.13
total adults -0.05 0.05 -0.10 0.07 0.02 0.09
total school age children -0.10* 0.05 -0.03 0.07 -0.10 0.07
skilled labour 0.17* 0.08 0.21* 0.11 0.11 0.13
unskilled labour -0.35* 0.06 -0.44* 0.08 -0.23* 0.11
scheduled caste 0.01 0.07 0.09 0.10 -0.10 0.12
muslim -0.29* 0.07 -0.29* 0.09 -0.28* 0.11
asset2 -0.29* 0.07 -0.29* 0.09 -0.29* 0.11
asset3 0.08 0.08 0.06 0.11 0.08 0.13
asset4 0.23* 0.08 0.25* 0.11 0.20 0.13
asset5 0.54* 0.08 0.62* 0.09 0.43* 0.13* Statistically significant

39
Appendix 1.3: Odd ratio of likelihood of transition by gender and socialgroups (Scenario 1)
Boys Girls Muslim Scheduled Caste
VariablesOddratio
Z-score
Oddratio
Z-score
Oddratio
Z-score
Oddratio
Z-score
Supply factorsadditional distance 0.66 -
2.16**0.61 -3.38* 0.52 -2.70* 0.49 -
2.48**additional cost /100 0.96 -1.50 0.95 -2.37**
0.95 -1.97**
0.92 -1.32
Parental Incentives
raven 1.00 -0.04 1.05 2.01** 1.05 1.47 1.07 1.46math 1.11 1.62 1.03 0.62 0.96 -0.52 1.13 1.19hindi 0.99 -0.20 0.97 -0.85 0.96 -0.71 0.95 -0.66attendance 1.05 5.33* 1.03 4.24* 1.03 3.42* 1.09 4.44*attendance*gender
Children Characteristics
age 0.62 -1.96**
0.66 -2.30**
0.75 -1.21 0.50 -1.36gender 2.94 1.91 2.84 1.88birth rank 0.78 -0.92 1.53 2.23** 1.08 0.28 2.05 1.77work 0.70 -0.66 1.09 0.24 1.22 0.45 1.07 0.11body mass index 0.82 -1.29 0.87 -1.34 0.83 -1.34 1.10 0.54
Household Characteristics
father age 0.94 -1.57 0.95 -1.80 0.91 -2.35**
0.89 -1.95father qual-up to upper primary 0.27 -
2.31**0.81 -0.54 0.55 -1.08 0.63 -0.58
father qual-secondary andabove 0.61 -0.73 1.70 1.20 1.19 0.23 1.86 0.73mother qualification 0.43 -1.27 0.72 -0.58 5.65 1.79 0.19 -1.63total adult 1.67 1.50 0.68 -
1.96**1.09 0.24 1.22 0.42
total school age children 0.92 -0.43 0.90 -0.71 0.82 -0.98 0.74 -1.03skilled labour 1.25 0.23 0.73 -0.45 1.83 0.58 0.27 -0.91unskilled labour 1.20 0.21 0.38 -1.74 1.88 0.69 0.17 -1.48scheduled caste 0.49 -1.35 1.62 1.06muslim 0.29 -
2.06**0.87 -0.33
Asset Index
asset2 0.97 -0.05 0.81 -0.45 1.17 0.27 1.38 0.26asset3 2.83 1.64 2.45 1.76 3.25 1.61 2.82 1.13asset4 2.23 1.29 2.57 1.57 6.89 2.44** 1.29 0.24asset5 5.54 1.55 5.50 1.64 0.32 -1.40
Pseudo R-square 0.42 0.37 0.35 0.54
Sample size 354 341 158 180
Note: Z-score are calculated using robust standard error.Significance at the 1% and 5%level is indicated with * and **, respectively.

40
Appendix 1.4: Odd ratio of likelihood of transition by gender and socialgroups (Scenario 2)
Boys Girls Muslim Scheduled Caste
VariablesOddratio
Z-score
Oddratio
Z-score
Oddratio
Z-score
Oddratio
Z-score
Supply factorsadditional distance 1.04 0.43 0.81 -
2.24**1.06 0.43 0.71 -
2.19**additional cost /100 1.00 -2.61* 1.00 -2.15**
1.00 -1.47 0.99 -3.22*
Parental Incentives
raven 0.99 -0.19 1.05 2.20** 1.04 1.32 1.12 2.23**math 1.13 1.82 1.04 0.80 1.00 -0.01 1.16 1.42hindi 0.99 -0.08 0.98 -0.63 0.98 -0.34 0.94 -0.75
attendance 1.06 6.07* 1.03 4.59* 1.03 2.83* 1.08 3.64*attendance*gender 1.01 0.75 1.01 0.28
Children Characteristics
age 0.60 -2.00**
0.68 -2.11**
0.78 -1.08 0.47 -1.27
gender 1.00 0.00 1.93 0.32birth rank 0.78 -0.93 1.43 1.94 1.06 0.24 2.14 1.39work 0.81 -0.44 1.20 0.53 1.48 0.83 1.17 0.23body mass index 0.77 -1.54 0.87 -1.50 0.84 -1.40 1.20 0.86
Household Characteristics
father age 0.94 -1.76 0.95 -1.90 0.91 -2.39**
0.88 -2.00**father qual-up to upper primary 0.29 -
2.08**0.82 -0.53 0.52 -1.12 0.49 -0.83
father qual-secondary andabove 0.57 -0.83 1.86 1.34 1.32 0.37 2.23 0.85mother qualification 0.39 -1.42 0.77 -0.49 7.47 1.79 0.20 -1.69
total adult 1.58 1.27 0.71 -1.74 1.02 0.06 1.03 0.05total school age children 0.98 -0.13 0.88 -0.97 0.85 -0.77 0.74 -1.20skilled labour 1.15 0.14 1.19 0.26 2.87 1.03 1.30 0.21unskilled labour 0.89 -0.13 0.58 -1.07 2.18 0.87 0.57 -0.59
scheduled caste 0.51 -1.32 1.65 1.13muslim 0.28 -
2.04**0.84 -0.42
Asset Index
asset2 0.99 -0.01 0.82 -0.43 1.01 0.01 0.86 -0.11
asset3 3.02 1.79 2.87 1.98** 3.66 1.73 2.53 1.04asset4 3.74 2.10** 2.14 1.37 9.12 2.88* 0.96 -0.04asset5 16.68 1.69 6.35 1.73 0.14 -1.55
Pseudo R-square 0.43 0.35 0.31 0.57
Sample size 354 341 158 180Note: Z-score are calculated using robust standard error.
Significance at the 1% and 5%level is indicated with * and **, respectively.

41
Appendix 2: CREATE’s zones of exclusion model
Zone 0 – children who are excluded from pre-school; Zone 1 -children who have never been to school, and are unlikely to attend school; Zone 2 - children who enter primary schooling, but who drop out before completing the
primary cycle; Zone 3 - children who enter primary schooling and are enrolled but are “at risk” of
dropping out before completion as a result of irregular attendance, low achievement,and silent exclusion from worthwhile learning;
Zone 4 – children who fail to make the transition to secondary school grades; Zone 5 children who enter secondary schooling but who drop out before completing the
cycle; Zone 6 children who enter secondary schooling and are enrolled but are “at risk” of
dropping out before completion as a result of irregular attendance, low achievementand silent exclusion from worthwhile learning.

Report summary:India has witnessed a major expansion in participation in basic education in recent years, in the context of a majorprogramme for its promotion: Sarva Shiksha Abhiyan (SSA). Despite a significantly improved picture at the basic level, aconsiderable proportion of children continue to drop out before reaching the secondary level. Over half of children whoenrol in grade one do not make it to grade eight, and of those who do complete their basic education (grades one througheight), only 88 percent go on to participate in secondary schooling. Problems surrounding retention are more acute in ruralareas of India, and as the country is a predominantly rural society, this study focuses on a farming district of Uttar Pradesh.It is in this dual context of drop out and rural villages that the present study investigates the factors influencing parents’decision whether or not to send their children to secondary schooling. The study draws upon an expanded vision of access toeducation, embodied in zone 4 of CREATE’s framework for considering access and transition in education: looking at thosechildren who complete the primary cycle but who do not make the transition to secondary education. The study focuses onfour key aspects in parental school decision making: incentives leading parents to view investment in education asworthwhile; the cost of secondary education; distance to secondary schools; and the impact of health-related factors. Thestudy is based on survey data collected by the author over the first two school years of a four-year longitudinal study: 2008-09 and 2009-10; and the data is analysed using multivariate analysis to identify factors in transition and drop out. Overall theeffect of additional cost and distance to secondary schooling proves significant, with cost being the most consistent factor,while distance is found to have a more nuanced effect. The study is particularly relevant in the context of the Government ofIndia’s latest major initiative, Rashtriya Madhyamik Shiksha Abhiyan which aims to achieve universal retention of childrenin secondary education by 2015, and has implications for the direction that interventions under this programme should take.
Author notes:Gaurav Siddhu is a development economist who has focussed primarily on basic education, having worked with The WorldBank, UNESCO and several NGOs. He is currently a doctoral candidate at the Centre for International Education,University of Sussex, examining factors influencing transition to secondary education in rural Uttar Pradesh, India. He isalso currently a consultant working on monitoring and evaluation of education sector plans for a major DFID-fundededucation project in Nigeria, Education Sector Support Programme in Nigeria (ESSPIN).
Address for Correspondence:CREATE, Centre for International EducationDepartment of Education, School of Education & Social WorkEssex House, University of Sussex, Falmer, BN1 9QQ, UK.Website: http://www.create-rpc.orgEmail: [email protected]