Embed Size (px)
Citation preview
11/2/2010
1
CREATE AND SUSTAIN A CULTURE OF MAXIMIZED VALUE AND PERFORMANCE
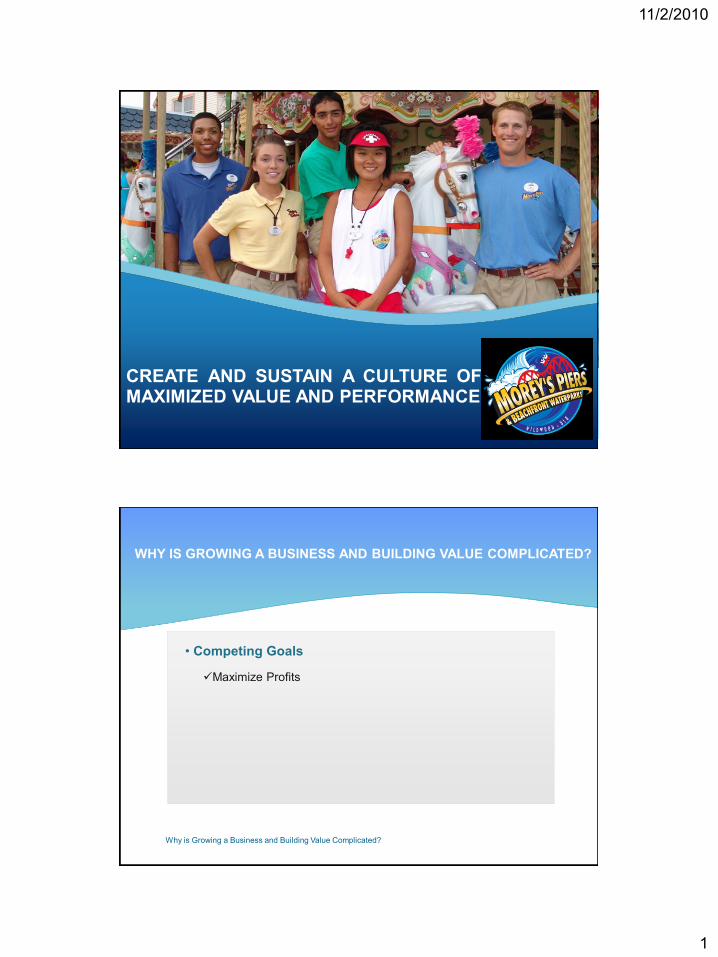
Why is Growing a Business and Building Value Complicated?
• Competing Goals
Maximize Profits
WHY IS GROWING A BUSINESS AND BUILDING VALUE COMPLICATED?
11/2/2010
2
Why is Growing a Business and Building Value Complicated?
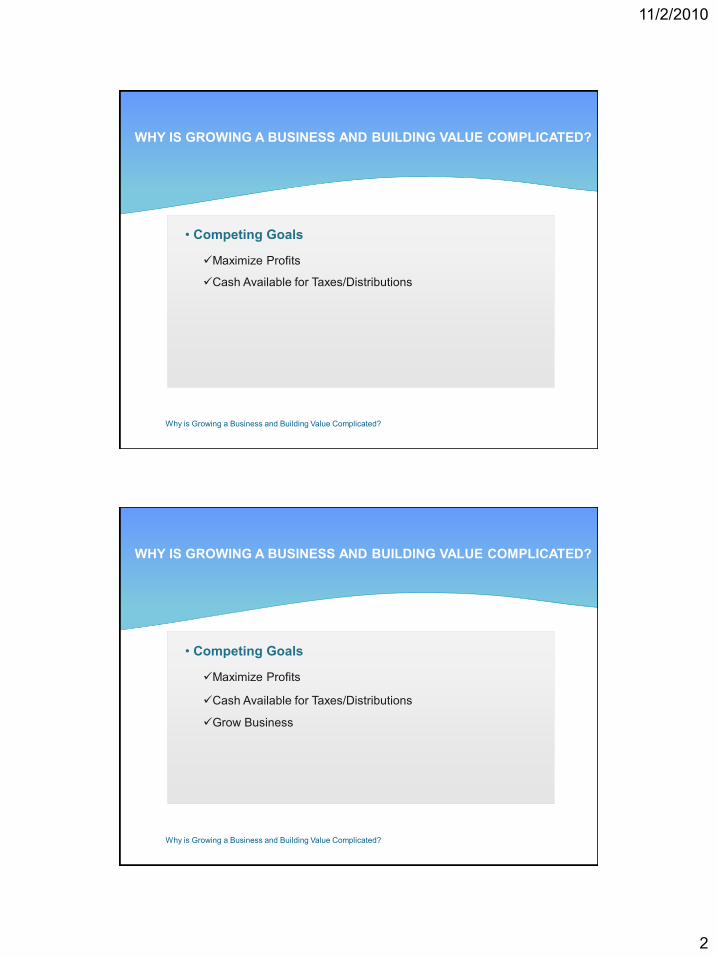
• Competing Goals
Maximize Profits
Cash Available for Taxes/Distributions
WHY IS GROWING A BUSINESS AND BUILDING VALUE COMPLICATED?
Why is Growing a Business and Building Value Complicated?
• Competing Goals
Maximize Profits
Cash Available for Taxes/Distributions
Grow Business
WHY IS GROWING A BUSINESS AND BUILDING VALUE COMPLICATED?
11/2/2010
3
Why is Growing a Business and Building Value Complicated?
• Competing Goals
Maximize Profits
Cash Available for Taxes/Distributions
Grow Business
Regulatory Compliance
WHY IS GROWING A BUSINESS AND BUILDING VALUE COMPLICATED?
Why is Growing a Business and Building Value Complicated?
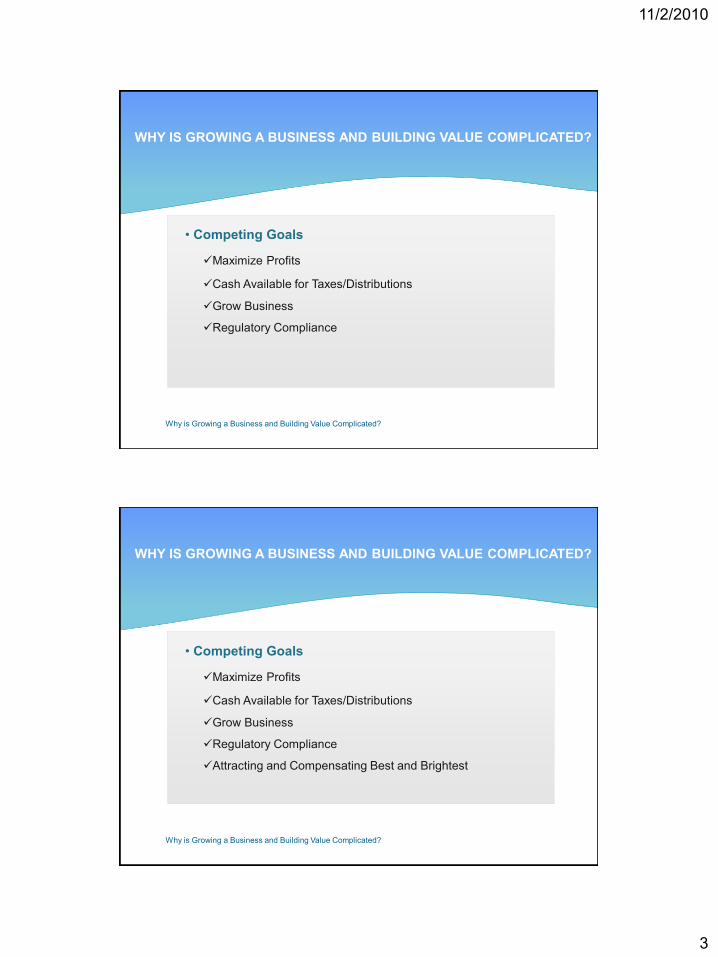
• Competing Goals
Maximize Profits
Cash Available for Taxes/Distributions
Grow Business
Regulatory Compliance
Attracting and Compensating Best and Brightest
WHY IS GROWING A BUSINESS AND BUILDING VALUE COMPLICATED?
11/2/2010
4
Why is Growing a Business and Building Value Complicated?
• Competing Goals
Maximize Profits
Cash Available for Taxes/Distributions
Grow Business
Regulatory Compliance
Attracting and Compensating Best and Brightest
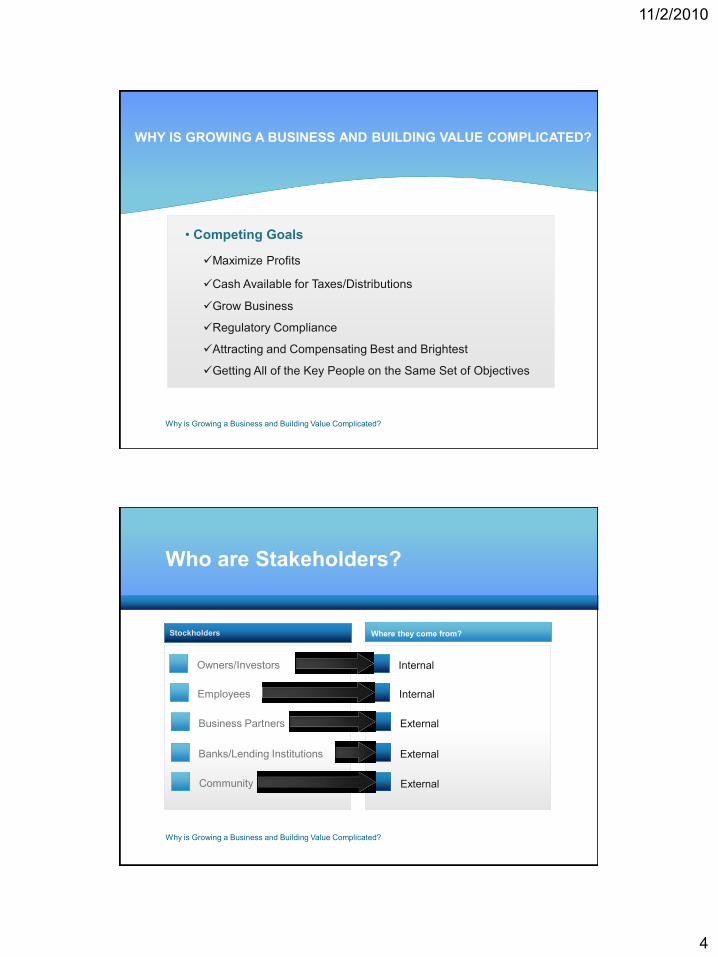
Getting All of the Key People on the Same Set of Objectives
WHY IS GROWING A BUSINESS AND BUILDING VALUE COMPLICATED?
Who are Stakeholders?
Internal
Where they come from?
Owners/Investors
Stockholders
Internal Employees
External Business Partners
External Banks/Lending Institutions
Community
Why is Growing a Business and Building Value Complicated?
External
11/2/2010
5
Why is Growing a Business and Building Value Complicated?
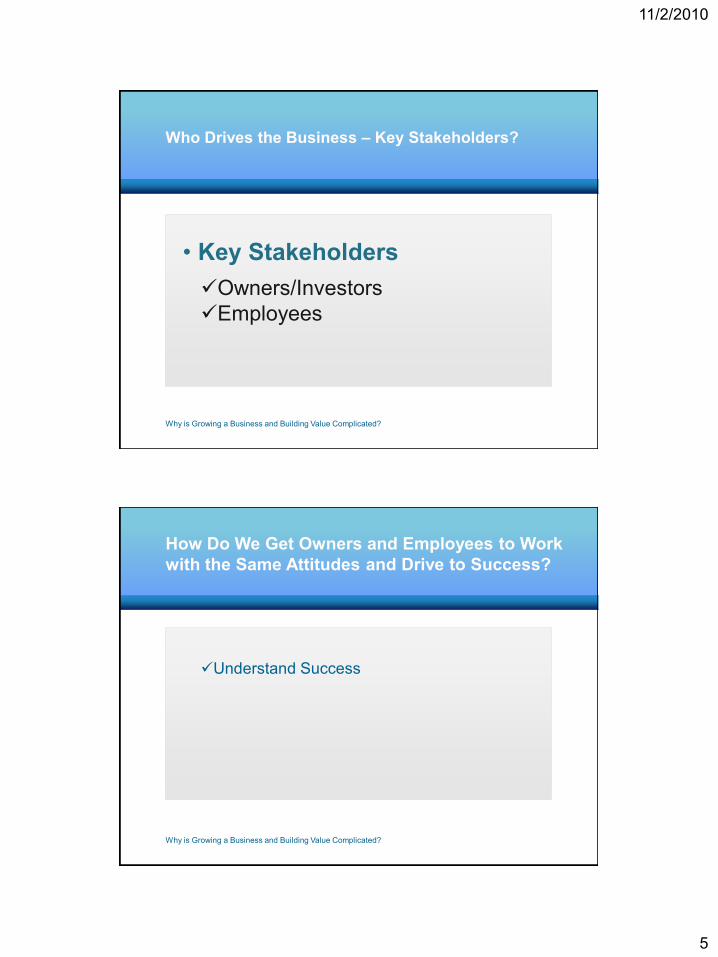
• Key Stakeholders
Owners/Investors
Employees
Who Drives the Business – Key Stakeholders?
Why is Growing a Business and Building Value Complicated?
Understand Success
How Do We Get Owners and Employees to Work
with the Same Attitudes and Drive to Success?
11/2/2010
6
Why is Growing a Business and Building Value Complicated?
Understand Success
Effects of Success
How Do We Get Owners and Employees to Work
with the Same Attitudes and Drive to Success?
Why is Growing a Business and Building Value Complicated?
Understand Success
Effects of Success
Understand the Drivers of Success
How Do We Get Owners and Employees to Work
with the Same Attitudes and Drive to Success?
11/2/2010
7
Why is Growing a Business and Building Value Complicated?
Understand Success
Effects of Success
Understand the Drivers of Success
Work as one with much to gain or lose
How Do We Get Owners and Employees to Work
with the Same Attitudes and Drive to Success?
Why is Growing a Business and Building Value Complicated?
Clear Strategic Objectives
ACHIEVING A WIN/WIN WITH
OWNERS/EXECUTIVE/KEY EMPLOYEES
11/2/2010
8
Why is Growing a Business and Building Value Complicated?
Clear Strategic Objectives
Simplify the Metrics for Success
ACHIEVING A WIN/WIN WITH
OWNERS/EXECUTIVE/KEY EMPLOYEES
Why is Growing a Business and Building Value Complicated?
Clear Strategic Objectives
Simplify the Metrics for Success
Put Together a Long Term Incentive Plan That
Rewards Long Term Thinking
ACHIEVING A WIN/WIN WITH
OWNERS/EXECUTIVE/KEY EMPLOYEES
11/2/2010
9
Why is Growing a Business and Building Value Complicated?
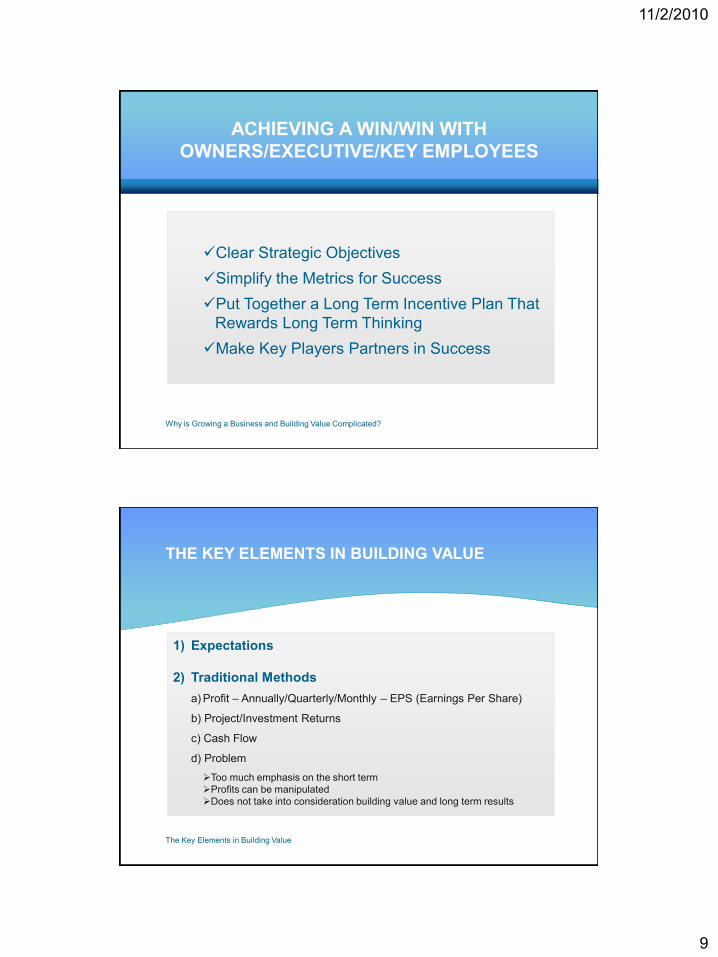
Clear Strategic Objectives
Simplify the Metrics for Success
Put Together a Long Term Incentive Plan That
Rewards Long Term Thinking
Make Key Players Partners in Success
ACHIEVING A WIN/WIN WITH
OWNERS/EXECUTIVE/KEY EMPLOYEES
The Key Elements in Building Value
1) Expectations
2) Traditional Methods
a) Profit – Annually/Quarterly/Monthly – EPS (Earnings Per Share)
b) Project/Investment Returns
c) Cash Flow
d) Problem
Too much emphasis on the short term
Profits can be manipulated
Does not take into consideration building value and long term results
THE KEY ELEMENTS IN BUILDING VALUE
11/2/2010
10
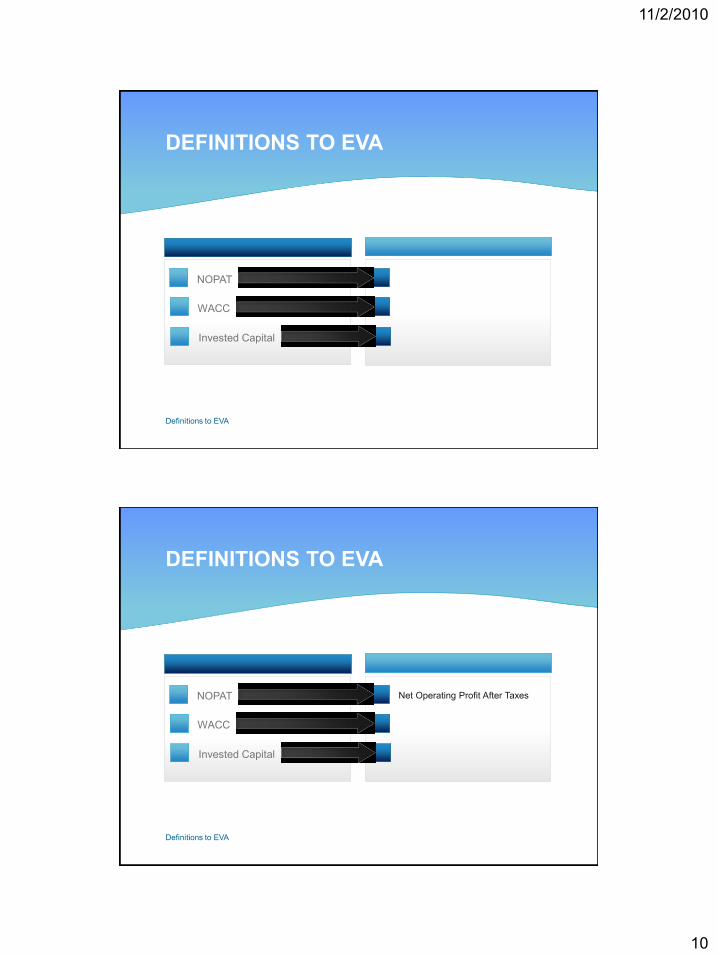
DEFINITIONS TO EVA
NOPAT
WACC
Invested Capital
Definitions to EVA
DEFINITIONS TO EVA
Net Operating Profit After Taxes NOPAT
WACC
Invested Capital
Definitions to EVA
11/2/2010
11
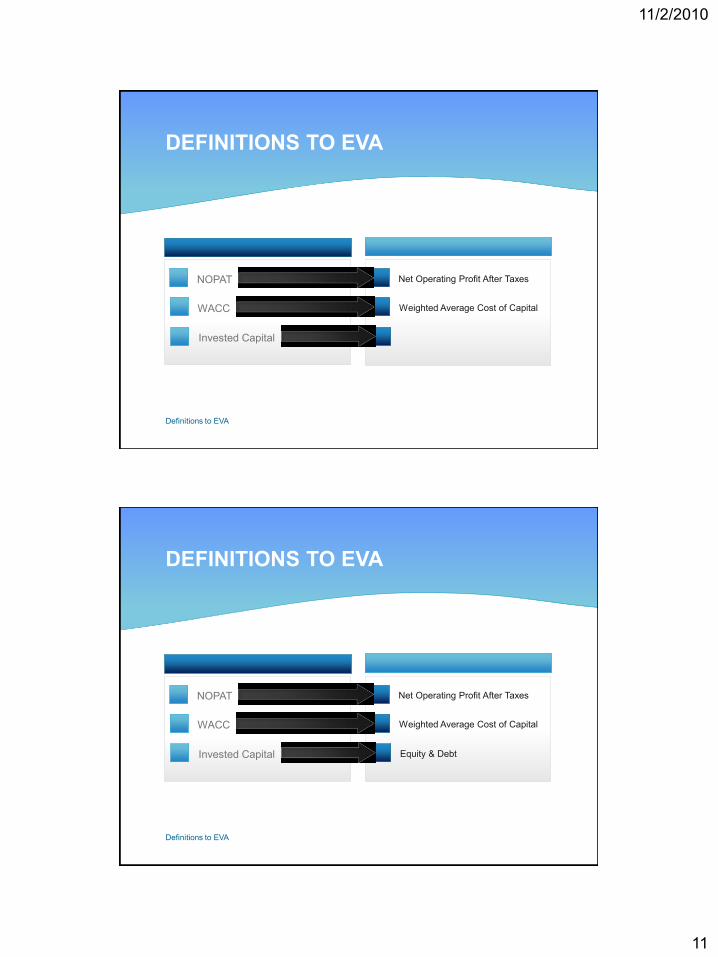
DEFINITIONS TO EVA
Net Operating Profit After Taxes NOPAT
Weighted Average Cost of Capital WACC
Invested Capital
Definitions to EVA
DEFINITIONS TO EVA
Net Operating Profit After Taxes NOPAT
Weighted Average Cost of Capital WACC
Equity & Debt
Invested Capital
Definitions to EVA

11/2/2010
12
Definitions to EVA
Measured by market value of the business
less accumulated equity on Balance Sheet.
MVA = MARKET VALUE ADDED
Value of Business to others (market) – Equity of Owners =
Market Value Added
Definitions to EVA
Measured in absolute dollars by
taking the net Operating Profit
after tax and subtracting (the cost
of capital x the invested capital.)
EVA = ECONOMIC VALUE ADDED
11/2/2010
13
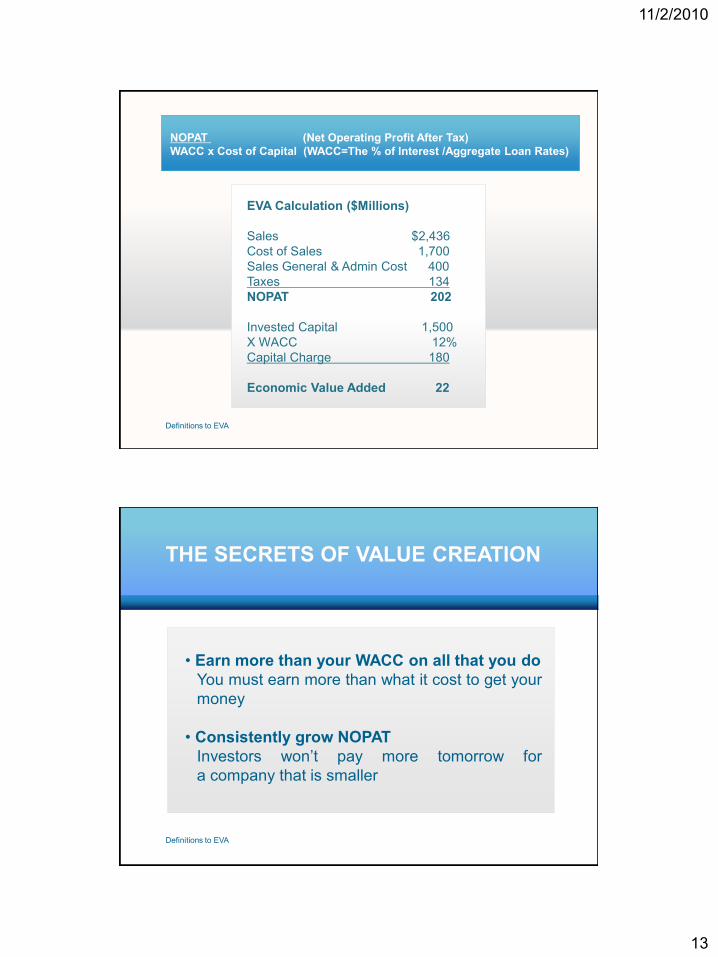
Definitions to EVA
EVA Calculation ($Millions)
Sales $2,436
Cost of Sales 1,700
Sales General & Admin Cost 400
Taxes 134
NOPAT 202
Invested Capital 1,500
X WACC 12%
Capital Charge 180
Economic Value Added 22
NOPAT (Net Operating Profit After Tax)
WACC x Cost of Capital (WACC=The % of Interest /Aggregate Loan Rates)
Definitions to EVA
• Earn more than your WACC on all that you do
You must earn more than what it cost to get your
money
• Consistently grow NOPAT
Investors won’t pay more tomorrow for
a company that is smaller
THE SECRETS OF VALUE CREATION
11/2/2010
14
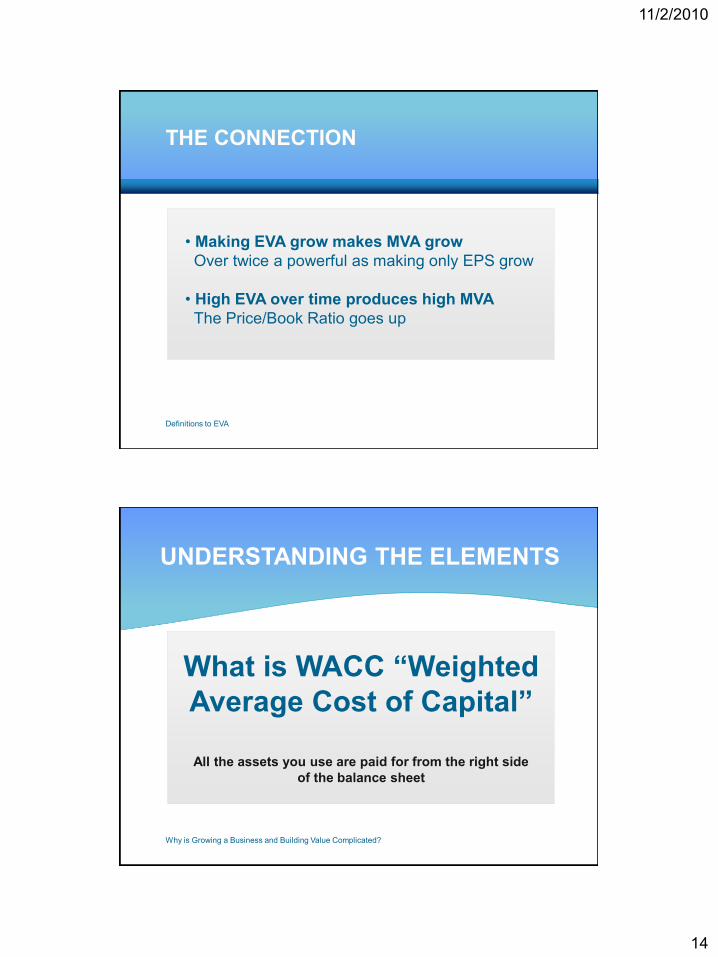
Definitions to EVA
• Making EVA grow makes MVA grow
Over twice a powerful as making only EPS grow
• High EVA over time produces high MVA
The Price/Book Ratio goes up
THE CONNECTION
Why is Growing a Business and Building Value Complicated?
What is WACC “Weighted
Average Cost of Capital”
All the assets you use are paid for from the right side
of the balance sheet
UNDERSTANDING THE ELEMENTS
11/2/2010
15
Why is Growing a Business and Building Value Complicated?
The Two Sources
of Money
Debt and Equity
UNDERSTANDING THE ELEMENTS
Why is Growing a Business and Building Value Complicated?
UNDERSTANDING THE ELEMENTS
The Cost of Equity = What Investors Could Earn
by Investing Elsewhere (It’s Opportunity Cost)
11/2/2010
16
Why is Growing a Business and Building Value Complicated?
UNDERSTANDING THE ELEMENTS
The Cost of Equity = What Investors Could Earn
by Investing Elsewhere (It’s Opportunity Cost)
Why is Growing a Business and Building Value Complicated?
The Cost of Debt = The Interest on the Debt
UNDERSTANDING THE ELEMENTS
11/2/2010
17
Why is Growing a Business and Building Value Complicated?
The Cost of Debt = The Interest on the Debt
UNDERSTANDING THE ELEMENTS
Why is Growing a Business and Building Value Complicated?
WACC = The Weighted Average of the
Cost of Debt and the Cost of Equity
UNDERSTANDING THE ELEMENTS
Typical WACCs: 7% to 12%.
High if company is riskier.
Lower if company is less risky.
11/2/2010
18
The Secrets of Value Creation
Earn More than your WAAC on all that you do
You must earn more than what it costs to get
your money
Consistently grow NOPAT
Investors won’t pay more tomorrow for
a company that is smaller
THE SECRETS OF VALUE CREATION
Strategic Planning Directives
Make NOPAT go up
Earn more than WACC on all that you do
New Capital Projects should earn more than WACC
Get rid of operations that do not earn your WACC
STRATEGIC PLANNING DIRECTIVES
11/2/2010
19
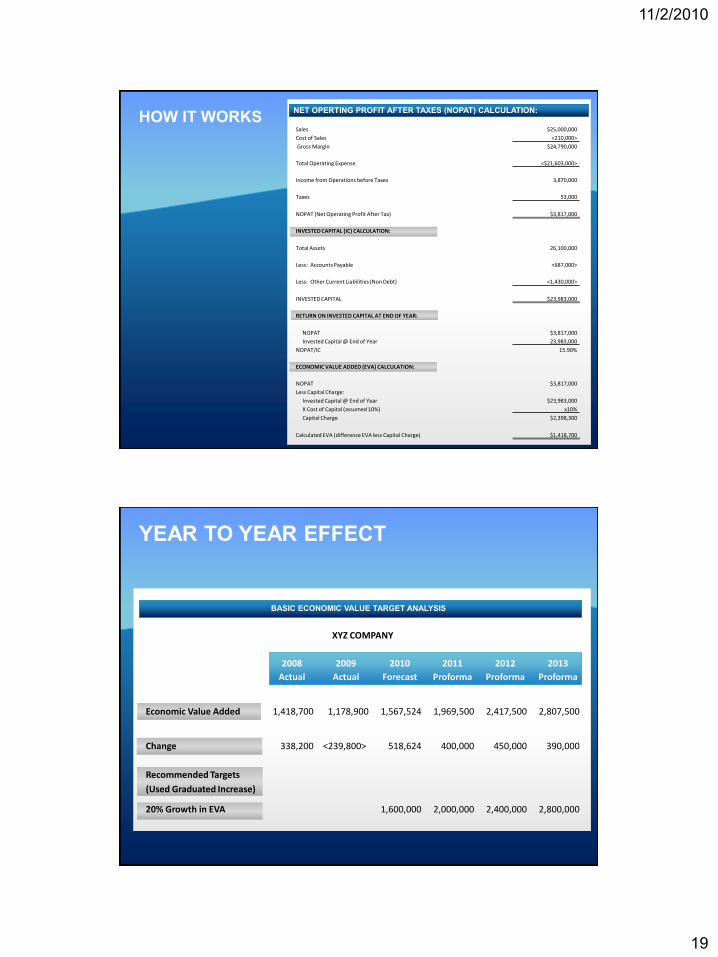
HOW IT WORKS NET OPERTING PROFIT AFTER TAXES (NOPAT) CALCULATION:
Sales $25,000,000
Cost of Sales <210,000>
Gross Margin $24,790,000
Total Operating Expense <$21,603,000>
Income from Operations before Taxes 3,870,000
Taxes 53,000
NOPAT (Net Operating Profit After Tax) $3,817,000
INVESTED CAPITAL (IC) CALCULATION:
Total Assets 26,100,000
Less: Accounts Payable <687,000>
Less: Other Current Liabilities (Non Debt) <1,430,000>
INVESTED CAPITAL $23,983,000
RETURN ON INVESTED CAPITAL AT END OF YEAR:
NOPAT $3,817,000
Invested Capital @ End of Year 23,983,000
NOPAT/IC 15.90%
ECONOMIC VALUE ADDED (EVA) CALCULATION:
NOPAT $3,817,000
Less Capital Charge:
Invested Capital @ End of Year $23,983,000
X Cost of Capital (assumed 10%) x10%
Capital Charge $2,398,300
Calculated EVA (difference EVA less Capital Charge) $1,418,700
YEAR TO YEAR EFFECT
BASIC ECONOMIC VALUE TARGET ANALYSIS
XYZ COMPANY
2008 2009 2010 2011 2012 2013
Actual Actual Forecast Proforma Proforma Proforma
Economic Value Added 1,418,700 1,178,900 1,567,524 1,969,500 2,417,500 2,807,500
Change 338,200 <239,800> 518,624 400,000 450,000 390,000
Recommended Targets
(Used Graduated Increase)
20% Growth in EVA 1,600,000 2,000,000 2,400,000 2,800,000
11/2/2010
20
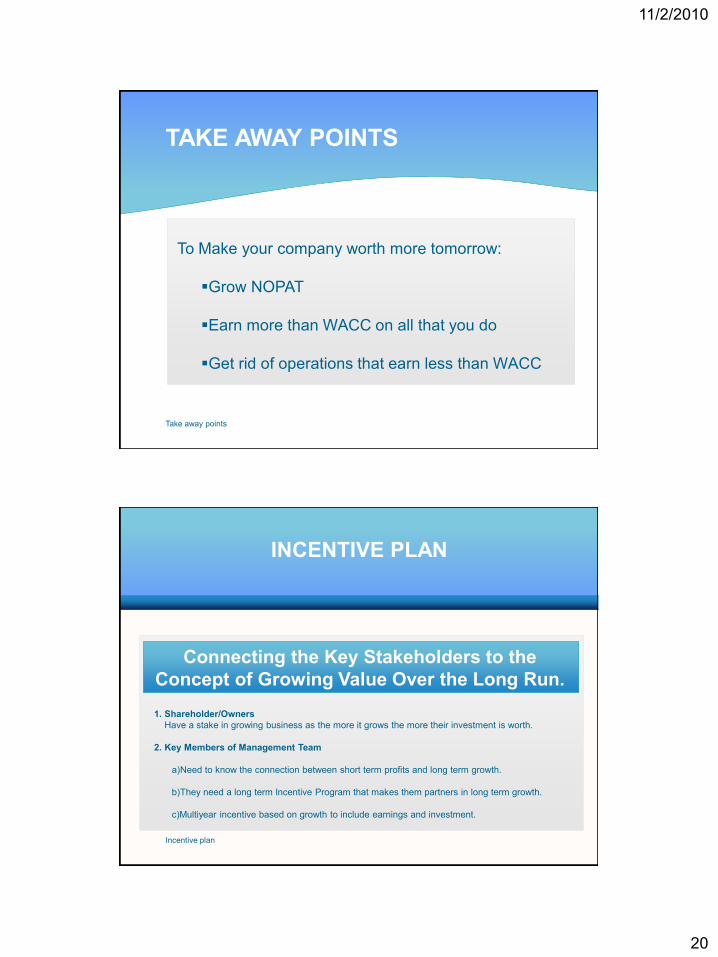
Take away points
To Make your company worth more tomorrow:
Grow NOPAT
Earn more than WACC on all that you do
Get rid of operations that earn less than WACC
TAKE AWAY POINTS
INCENTIVE PLAN
Incentive plan
1. Shareholder/Owners
Have a stake in growing business as the more it grows the more their investment is worth.
2. Key Members of Management Team
a)Need to know the connection between short term profits and long term growth.
b)They need a long term Incentive Program that makes them partners in long term growth.
c)Multiyear incentive based on growth to include earnings and investment.
Connecting the Key Stakeholders to the
Concept of Growing Value Over the Long Run.
11/2/2010
21
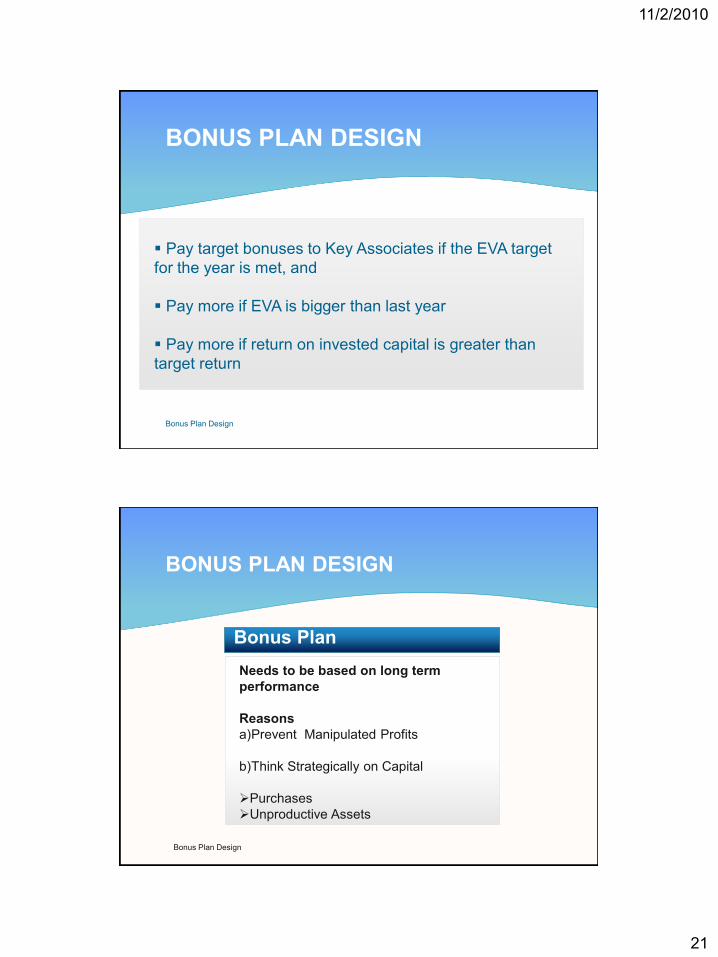
Bonus Plan Design
Pay target bonuses to Key Associates if the EVA target
for the year is met, and
Pay more if EVA is bigger than last year
Pay more if return on invested capital is greater than
target return
BONUS PLAN DESIGN
BONUS PLAN DESIGN
Bonus Plan Design
Bonus Plan
Needs to be based on long term
performance
Reasons
a)Prevent Manipulated Profits
b)Think Strategically on Capital
Purchases
Unproductive Assets
Bonus Plan Design
11/2/2010
22
4 4
3 3
2 2
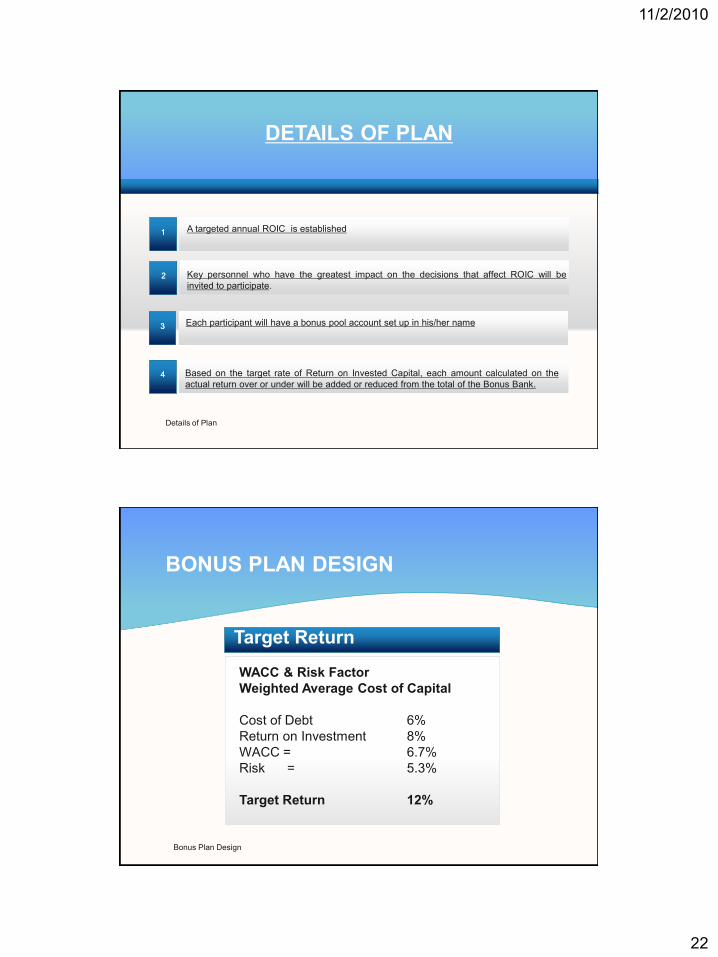
A targeted annual ROIC is established
Each participant will have a bonus pool account set up in his/her name
Key personnel who have the greatest impact on the decisions that affect ROIC will be
invited to participate.
Based on the target rate of Return on Invested Capital, each amount calculated on the
actual return over or under will be added or reduced from the total of the Bonus Bank.
Details of Plan
DETAILS OF PLAN
1 1
BONUS PLAN DESIGN
Bonus Plan Design
Target Return
WACC & Risk Factor
Weighted Average Cost of Capital
Cost of Debt 6%
Return on Investment 8%
WACC = 6.7%
Risk = 5.3%
Target Return 12%
Bonus Plan Design
11/2/2010
23
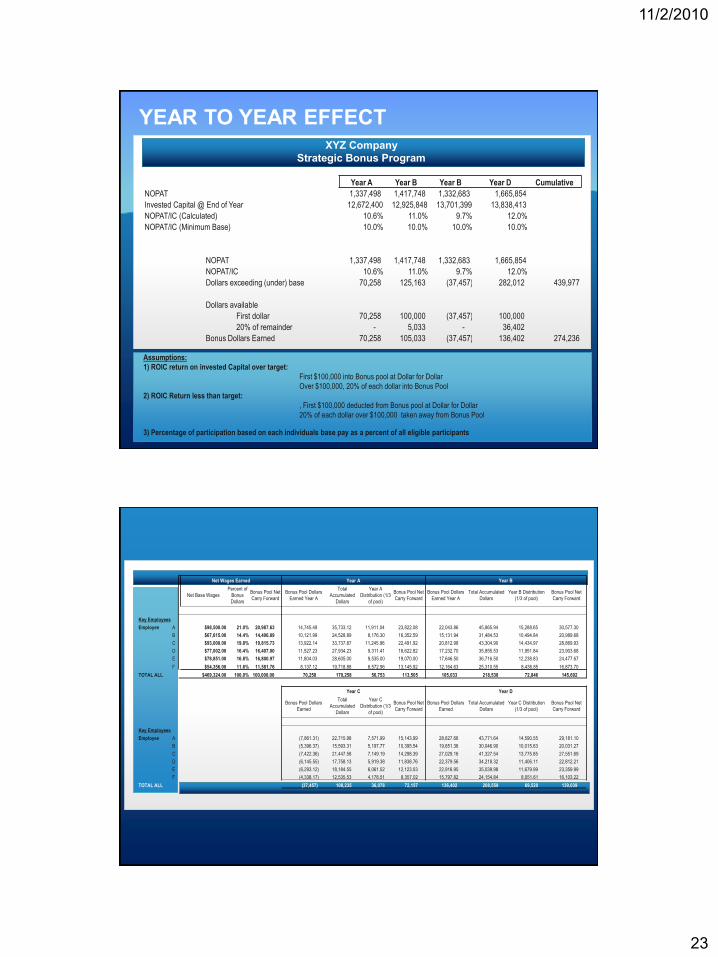
YEAR TO YEAR EFFECT XYZ Company
Strategic Bonus Program
Year A Year B Year B Year D Cumulative
NOPAT 1,337,498 1,417,748 1,332,683 1,665,854
Invested Capital @ End of Year 12,672,400 12,925,848 13,701,399 13,838,413
NOPAT/IC (Calculated) 10.6% 11.0% 9.7% 12.0%
NOPAT/IC (Minimum Base) 10.0% 10.0% 10.0% 10.0%
NOPAT 1,337,498 1,417,748 1,332,683 1,665,854
NOPAT/IC 10.6% 11.0% 9.7% 12.0%
Dollars exceeding (under) base 70,258 125,163 (37,457) 282,012 439,977
Dollars available
First dollar 70,258 100,000 (37,457) 100,000
20% of remainder - 5,033 - 36,402
Bonus Dollars Earned 70,258 105,033 (37,457) 136,402 274,236
Assumptions:
1) ROIC return on invested Capital over target:
First $100,000 into Bonus pool at Dollar for Dollar
Over $100,000, 20% of each dollar into Bonus Pool
2) ROIC Return less than target:
, First $100,000 deducted from Bonus pool at Dollar for Dollar
20% of each dollar over $100,000 taken away from Bonus Pool
3) Percentage of participation based on each individuals base pay as a percent of all eligible participants
Net Wages Earned Year A Year B
Net Base Wages
Percent of
Bonus
Dollars
Bonus Pool Net
Carry Forward
Bonus Pool Dollars
Earned Year A
Total
Accumulated
Dollars
Year A
Distribution (1/3
of pool)
Bonus Pool Net
Carry Forward
Bonus Pool Dollars
Earned Year A
Total Accumulated
Dollars
Year B Distribution
(1/3 of pool)
Bonus Pool Net
Carry Forward
Key Employees
Employee A $98,500.00 21.0% 20,987.63 14,745.49 35,733.12 11,911.04 23,822.08 22,043.86 45,865.94 15,288.65 30,577.30
B $67,615.00 14.4% 14,406.89 10,121.99 24,528.89 8,176.30 16,352.59 15,131.94 31,484.53 10,494.84 20,989.68
C $93,000.00 19.8% 19,815.73 13,922.14 33,737.87 11,245.96 22,491.92 20,812.98 43,304.90 14,434.97 28,869.93
D $77,002.00 16.4% 16,407.00 11,527.23 27,934.23 9,311.41 18,622.82 17,232.70 35,855.53 11,951.84 23,903.68
E $78,851.00 16.8% 16,800.97 11,804.03 28,605.00 9,535.00 19,070.00 17,646.50 36,716.50 12,238.83 24,477.67
F $54,356.00 11.6% 11,581.76 8,137.12 19,718.88 6,572.96 13,145.92 12,164.63 25,310.55 8,436.85 16,873.70
TOTAL ALL $469,324.00 100.0% 100,000.00 70,258 170,258 56,753 113,505 105,033 218,538 72,846 145,692
Year C Year D
Bonus Pool Dollars
Earned
Total
Accumulated
Dollars
Year C
Distribution (1/3
of pool)
Bonus Pool Net
Carry Forward
Bonus Pool Dollars
Earned
Total Accumulated
Dollars
Year C Distribution
(1/3 of pool)
Bonus Pool Net
Carry Forward
Key Employees
Employee A (7,861.31) 22,715.98 7,571.99 15,143.99 28,627.66 43,771.64 14,590.55 29,181.10
B (5,396.37) 15,593.31 5,197.77 10,395.54 19,651.36 30,046.90 10,015.63 20,031.27
C (7,422.36) 21,447.58 7,149.19 14,298.39 27,029.16 41,327.54 13,775.85 27,551.69
D (6,145.55) 17,758.13 5,919.38 11,838.76 22,379.56 34,218.32 11,406.11 22,812.21
E (6,293.12) 18,184.55 6,061.52 12,123.03 22,916.95 35,039.98 11,679.99 23,359.99
F (4,338.17) 12,535.53 4,178.51 8,357.02 15,797.82 24,154.84 8,051.61 16,103.22
TOTAL ALL (37,457) 108,235 36,078 72,157 136,402 208,559 69,520 139,039
11/2/2010
24
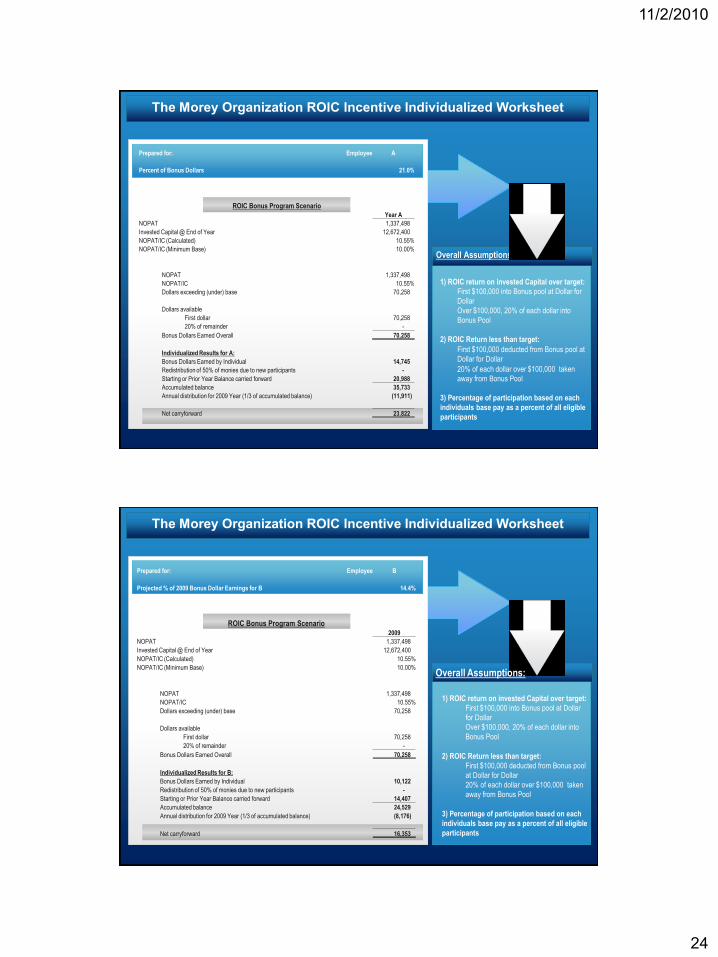
The Morey Organization ROIC Incentive Individualized Worksheet
Overall Assumptions:
1) ROIC return on invested Capital over target:
First $100,000 into Bonus pool at Dollar for
Dollar
Over $100,000, 20% of each dollar into
Bonus Pool
2) ROIC Return less than target:
First $100,000 deducted from Bonus pool at
Dollar for Dollar
20% of each dollar over $100,000 taken
away from Bonus Pool
3) Percentage of participation based on each
individuals base pay as a percent of all eligible
participants
Prepared for: Employee A
Percent of Bonus Dollars 21.0%
ROIC Bonus Program Scenario
Year A
NOPAT 1,337,498
Invested Capital @ End of Year 12,672,400
NOPAT/IC (Calculated) 10.55%
NOPAT/IC (Minimum Base) 10.00%
NOPAT 1,337,498
NOPAT/IC 10.55%
Dollars exceeding (under) base 70,258
Dollars available
First dollar 70,258
20% of remainder -
Bonus Dollars Earned Overall 70,258
Individualized Results for A:
Bonus Dollars Earned by Individual 14,745
Redistribution of 50% of monies due to new participants -
Starting or Prior Year Balance carried forward 20,988
Accumulated balance 35,733
Annual distribution for 2009 Year (1/3 of accumulated balance) (11,911)
Net carryforward 23,822
The Morey Organization ROIC Incentive Individualized Worksheet
Prepared for: Employee B
Projected % of 2009 Bonus Dollar Earnings for B 14.4%
ROIC Bonus Program Scenario 2009
NOPAT 1,337,498
Invested Capital @ End of Year 12,672,400
NOPAT/IC (Calculated) 10.55%
NOPAT/IC (Minimum Base) 10.00%
NOPAT 1,337,498
NOPAT/IC 10.55%
Dollars exceeding (under) base 70,258
Dollars available
First dollar 70,258
20% of remainder -
Bonus Dollars Earned Overall 70,258
Individualized Results for B:
Bonus Dollars Earned by Individual 10,122
Redistribution of 50% of monies due to new participants -
Starting or Prior Year Balance carried forward 14,407
Accumulated balance 24,529
Annual distribution for 2009 Year (1/3 of accumulated balance) (8,176)
Net carryforward 16,353
Overall Assumptions:
1) ROIC return on invested Capital over target:
First $100,000 into Bonus pool at Dollar
for Dollar
Over $100,000, 20% of each dollar into
Bonus Pool
2) ROIC Return less than target:
First $100,000 deducted from Bonus pool
at Dollar for Dollar
20% of each dollar over $100,000 taken
away from Bonus Pool
3) Percentage of participation based on each
individuals base pay as a percent of all eligible
participants
11/2/2010
25
Conclusion
MAKE YOUR KEY PLAYERS PARTNERS IN
SUCCESSFULLY GROWING THE BUSINESS
QUESTIONS AND ANSWER PERIOD
CONCLUSION
THANK YOU!