Embed Size (px)
Citation preview

CRE F in a nCE W RldT h e V o i c e o f C o m m e r c i a l R e a l E s t a t e F i n a n c e
Summer 2015Volume 17 No. 2
®Summer Issue 2015 is Sponsored by
A p
ublic
atio
n of
CR
E Fina
nce Co
uncil
Beyond the Big Six: Identifying Alternative US Office Markets Based on Long Term Demand Generators
Stewart Rubin, Director, New York Life Real Estate Investors
A Lender Roundtable: Real Talk From Real Lenders on Today’s Competitive Commercial and Multifamily Lending Environments
Moderated by Lisa Pendergast, Managing Director, Jefferies LLC Stephanie Petosa, Managing Director, Fitch Ratings
Three Keys to Real Estate CrowdfundingJoanna Schwartz, CEO & Co-Founder, Early Shares
Lower Oil Prices and Multifamily – More Winners Than Losers
Kim Betancourt, Director of Economics, Fannie Mae, Multifamily Economics and Market Research;
Tim Komosa, Economist Manager, Fannie Mae, Multifamily Economics and Market Research
H I G H L I G H T S :

NEW YORK • CHICAGO • ATLANTA • LOS ANGELES • NEWPORT BEACH DALLAS • MIAMI • SEATTLE • WASHINGTON, D.C. • SAN FRANCISCO
BOSTON • DETROIT • COLUMBUS • ST. LOUIS • NASHVILLE
www.ccre.com | 212.915.1700
NATIONAL LEADER IN REAL ESTATE FINANCEOver $ Billion Loans Closed since 2010
Fixed I Floating I Bridge I Agency

Previous issues of CRE Finance World are available in digital format on our website.
Summer 2015Volume 17 No. 2
A p
ublic
atio
n of C
RE Fin
ance C
ouncil
CRE Finance World Summer 2015
1
Summer Issue 2015 is Sponsored by
Contents
CRE F IN A NCE W RL D
3. Letter from the Editor, Nicoletta Kotsianas, Associate Director, Kroll Bond Ratings
4. Welcome Letter, Stephen Renna, President & CEO, CRE Finance Council
6. Real Estate Managers Face New Wave of SEC Security Conrad Axelrod, Associate, Investment Management Group, Schulte Roth & Zabel LLP; Marshall Brozost, Partner, Real Estate Group, Schulte Roth & Zabel LLP
10. Beyond the Big Six: Identifying Alternative US Office Markets Based on Long Term Demand Generators Stewart Rubin, Director, New York Life Real Estate Investors
16. A LENDER ROUNDTABLE: REAL TALK FROM REAL LENDERS ON TODAY’S COMPETITIVE COMMERCIAL AND MULTIFAMILY LENDING ENVIRONMENTS Moderators: Lisa Pendergast, Managing Director, Jefferies LLC Stephanie Petosa, Managing Director, Fitch Ratings Participants: Larry Brown, President, Starwood Mortgage Capital Brian A. Furlong, Managing Director, New York Life Real Estate Investors Spencer Kagan, Managing Director, Barclays PLC Clay M. Sublett, Senior Vice President, Key Bank Real Estate Capital
CROWDED TRADES 24. The Three Keys to Real Estate Crowdfunding Joanna Schwartz, CEO & Co-Founder, Early Shares
26. Crowdfunding: The Future of Commercial Real Estate Lending or Just a Voice Lost in the Crowd? Robert Sullivan, Partner, Co-Chair Finance Group, Alston & Bird; Geoffrey Maibohm, Counsel, Finance Group, Alston & Bird; Stephen Denmark, Associate, Alston & Bird
30. ASERs 2.0: Who Gets the Short End of the Stick? Stacy Ackernman, Partner, K & L Gates LLP; Leslie Hayton, Managing Director, Wells Fargo Bank, N.A
32. CRE As a Source of Systemic Risk: How Normative Should the New Regulatory Norms Be? Christina Zausner, Vice President, Industry and Policy Analysis, CRE Finance Council
35. CMBS 2.0 – State of the Market 2015 Ed Shugrue III, CEO, Talmage LLC
40. Student Housing Performance in CMBS Roxanna Tangen, Assistant Vice President, Global CMBS Global Structured Finance, DBRS; Jorge Lopez, Financial Analyst, Global CMBS, Global Structured Finance, DBRS
43. Some Crystal Ball Gazing on European CMBS Iain Balkwill, Partner, Reed Smith
BOOMTOWNS 45. Lower Oil Prices and Multifamily – More Winners Than Losers Kim Betancourt, Director of Economics, Fannie Mae, Multifamily Economics and Market Research, Tim Komosa, Economist Manager, Fannie Mae, Multifamily Economics and Market Research
50. Low Energy Prices’ Impact on Multifamily May be Negligible, But Office Will Feel Some Pain Dr. Victor Calanog, Chief Economist and Senior Vice President, Reis; Ryan Severino, CFA, Reis; Bradley Doremus, Associate, Research & Economics, Reis
CREFC FOCUS 54. CREFC Global Mission Stacy Stathopoulos, Executive Vice President, CRE Finance Council
56. CREFC Education: Where We Are….Where We’re Going Sara Thomas, Director, Education Initiatives, CRE Finance Council
FORUM SPOTLIGHT 58. Portfolio Lenders Survey: U.S. Life Insurers’ Mortgage Outlook Sonal Paradkar, Assistant Vice President, Trepp
62. Servicers Forum Update Dan Olsen, Senior Vice President, KeyBank Real Estate Capital
65. HYDRA Sub-Forum Update John D’Amico, Director, Trimont
Ro
un
dta
ble

CRE Finance World Summer 2015 2
Publisher: Joseph Philip Forte, Esq.
Editor-in-Chief: Nicoletta Kostiansas
Co-Managing Editors: Paul Fiorilla & Krystyna Blakeslee
Associate Editor: Andrea Rouse
Design: D. Bruce Zahor Production: Kristin Searing
CRE Finance Council Staff
Stephen M. Renna President & Chief Executive Officer
Ed DeAngelo Vice President, Technology & Operations
Nina Fazenbaker Manager, Conference Programming
Elizabeth Janicki Accounts Receivable Associate
Kirsten Kvalsten Executive Assistant & Member Services Manager
Alex Levin Manager, Industry Standards & Strategic Relations
Michelle Mattingly Director, Meetings and Sponsorship
Andrea Rouse Director, Administration; Publication Manager
Martin Schuh Vice President, Legislative and Regulatory Policy
Stacy Stathopoulos Executive Vice President
Sara Thomas Director, Education Initiatives
Christina Zausner Vice President, Industry and Policy
CRE Finance Council Europe
Peter Cosmetatos CEO, Europe
Hannah Liebing Events/Finance Coordinator, Europe
Carol Wilkie Managing Director, Europe
Volume 17, Number 2, Summer 2015
CRE Finance World® is published by the Commercial Real Estate Finance Council (CREFC®), 900 7th Street NW, Suite 501, Washington, DC 20001email: [email protected], website: www.crefc.org.© 2015 CREFC - Commercial Real Estate Finance Council, all rights reserved.
Advertising: For information regarding advertising within CRE Finance World, please contact Andrea Rouse, phone: 202.448.0856, email: [email protected]: Questions? Comments? Send queries and letters to Letters to the Editor, Brian P. Lancaster, Editor-in-Chief, CRE Finance World, email: [email protected] publication is provided by CREFC for general information purposes only. CREFC does not intend for this publication to be a solicitation related to any particular company, nor does it intend to provide investment advice to investors. Nothing herein should be construed to be an endorsement by CREFC of any specific company or its products.
We advise you to confer with your securities counsel to determine whether your distribution of this publication will subject your company to any securities laws.
CRE Finance World assumes no responsibility for the loss or damage of unsolicited manuscripts or graphics. We welcome articles of interest to readers of this magazine. Opinions expressed are those of the author(s) and not necessarily those of CREFC.
®CRE F IN A NCE W RL DT h e V o i c e o f C o m m e r c i a l R e a l E s t a t e F i n a n c e
Timothy B. GallagherChairmanMacquarie Group Gregory R. MichaudChairman-Elect Voya Investment Management Keith A. GollenbergImmediate Past ChairOaktree Capital Management, LP Mitchell ResnickVice ChairmanFreddie Mac
John M. MulliganSecretaryWhite Mountains Advisors LLC Daniel E. BoberTreasurerWells Fargo Bank Brian OlasovMembership Committee ChairMcKenna Long & Aldridge, LLP Paul T. VanderslicePolicy Committee Chair Citigroup Global Markets
Samir LakhaniExecutive Committee MemberBlackRock David M. NassExecutive Committee MemberUBS Nilesh PatelExecutive Committee MemberPrima Capital Advisors Stephen M. RennaPresident & Chief Executive OfficerCRE Finance Council
Jun HanEditor EmeritusTIAA-CREF
Nicoletta KotsianasEditor-in-ChiefKroll Bond Ratings Joseph Philip Forte, EsqPublisherDLA Piper LLP Paul FiorillaCo-Managing Editor Yardi Systems
Krystyna Blakeslee Co-Managing Editor Dechert LLP
Andrea Rouse Publication Manager CRE Finance Council
Patricia BachGenworth Financial Jeffrey BerenbaumCiti
Stacey M. BergerPNC Real Estate/Midland Loan Services
David BrickmanFreddie Mac Dr. Victor CalanogReis, Inc. Sam Chandan, Ph.D.Chandan Economics
James ManziStandard & Poor’s Rating Services David NabwanguDBRS Inc. Brian OlasovMcKenna, Long & Aldridge, LLP
Lisa A. PendergastJefferies LLC Peter Rubinstein
Daniel B. Rubock Moody’s Investors Service, Inc. Clay SublettKeyBank Real Estate Capital
Eric B. ThompsonKroll Bond Ratings
Harris Trifon Western Asset Management
Darrell WheelerAmherst Securities Group LP
CRE Finance Council
OfficersCRE Finance World
Editorial Board Roster
CRE Finance Council 900 7th Street NW, Suite 501 Washington, DC 20001 202.448.0850
www.crefc.org
CRE Finance World is published by Summer Issue 2015 is Sponsored by

A publication of Summer issue 2015 sponsored by CRE Finance World Summer 2015
3
s 2015 inches toward the halfway point, the commercial real estate markets continue to build on their momentum, helped along by an improving economy. Nonetheless, every quarter it seems, the market does a gut check, as we ask ourselves what “inning” we are in — on panels at
conferences, and in our own boardrooms. As the years since the market downturn pass by, we continue to be mindful of the factors that contributed to the credit crunch, hoping to keep our corner of the financial markets in check. At the same time, optimism is palpable and new opportunities and innovations are pushing commercial real estate finance to the next stage.
This issue of CRE Finance World touches upon those themes of cautious optimism. We feature two roundtables, one through the eyes of lenders, while the other takes stock of the state of the markets. Moderated by Stephanie Petosa from Fitch, Lisa Pendergast at Jefferies and Ed Shugrue from Talmage, the discussions are wide ranging and shed a light on perspectives through the eyes of industry leaders.
We also feature two Hot Topic sections in this issue, focused on Crowdfunding and the impact of the downturn in oil prices on our
markets. We are running several pieces on these developments given their rising focus and potential impact on all areas of our markets. Crowdfunding shops in particular are exploding, and how the business model fits into the CRE mold will be an interesting devolvement for the remainder of the year and beyond. On the flip side, the drop in oil prices and a new normal below $60 a barrel may temper the upward trajectory in some markets, as explored in our two pieces on the issue.
As always, the magazine also features several articles spotlighting more technical aspects of the market including: a piece on ASERs in CMBS by Leslie Hayton and Stacy Ackerman, of K & L Gates LLP and Wells Fargo Bank, N.A respectively, an update on SEC regulations by Marshall S. Brozost and Conrad C. Axelrod of Schulte Roth & Zabel LLP, and a look at alternative investments in the office property markets by Stewart Rubin of New York Life Real Estate Investors.
Each issue of CRE Finance World is now available on the CREFC website, and includes a comments section. Feel free to join the discussion! We hope to expand upon our website in the future with feature articles.
A
Editor’s Page
Letter from the EditorNicoletta KotsianasAssociate DirectorKroll Bond Ratings

CRE Finance World Summer 2015 4
elcome to the Summer 2015 edition of CRE Finance World magazine.
With each edition of the magazine, we are excited to present to you an ever improving product both in look
and content. No matter what sector of the industry you work in, I am certain you will find several articles that broaden and enhance your understanding of CRE finance.
In addition to the quality articles, this edition puts the spotlight on two prevailing influences on the industry today: crowdfunding and the plummeting price of energy on commercial real estate finance. The magazine also features two insightful and informative roundtable discussions. One on CRE lending broadly led by Lisa Pendergast of Jefferies and the other on CMBS 2.0 State of the Market written by Ed Shugrue III of Talmage, LLC.
Without the contributions of the many authors who are willing to share their time and insightful analysis of key aspects of the CRE industry, this magazine would not be possible. We are grateful to each of our authors as well as to the magazine editorial board and staff for their efforts in producing a publication of the highest caliber.
The quality of the magazine also makes it an ideal sponsorship and advertising platform. I urge you to consider sponsorship of CRE Finance World. It is seen by the most significant players in the market and it is an effective means of displaying your industry expertise to clients, prospects and colleagues. The advantages of this valuable sponsorship are a better value than ever.
Stephen M. RennaPresident & Chief Executive OfficerCRE Finance Council
W
Letter from Stephen M. Renna President & CEO Stephen M. Renna
President & CEOCRE Finance Council
2014
Level 1HFF, L.P.
Level 2Cushman & Wakefield, Inc.Riemer & Braunstein LLPShearman & Sterling LLPSymetra FinancialWestern Asset Management
Level 3Akerman LLPAllen Matkins Leck Gamble Mallory
& Natsis LLPArent Fox LLPArmada Analytics, Inc.Arnold & Porter LLPBerkshire GroupBluett & AssociatesBofI Federal BankCorAmerica Capital, LLCFirstKey Lending, LLCFried Frank Harris Shriver &
Jacobson LLPGrass River PropertyGuardian Life Insurance Co.Inland Real Estate Investment
CorporationInstitutional Mortgage Capital
Canada, Inc.Korn/Ferry InternationalMcRoberts & Associates, P.C.Northwestern Mutual
Investment ManagementCompany, LLCOrrick, Herrington & Sutcliffe LLPParkStone CapitalPerella Weinberg PartnersPine River CapitalPromontory Interfinancial Network,
BankAssetpointQuietStream FinancialRockwood Capital, LLCRubin, Ehrlich & Buckley, P.C.Saba Capital Management, LPSeer Capital Management LPSilverpeak Real Estate Finance LLCSpring11Streamline Realty Funding, LLCTPG Special Situations Partners LPUSAA Real Estate CompanyWinston & Strawn LLP
2015
Level 1BMO Harris BankNorthMarq Capital, Inc.
Level 2DoubleLine CapitalHunton & Williams LLPKing & Spalding LLPSunTrust Bank, Inc.
Level 3ACORE CapitalBass, Berry & Sims PLCBenefit Street Partners /
Providence EquityPartnersBerger Singerman, LLPBNY MellonBurr & Forman LLPClarion PartnersCrediFi CorpGlobal Atlantic Financial GroupGreenberg Traurig, LLPIron Hound Management
Company, LLCJCR CapitalKGS-Alpha Real EstateKKR - Kohlberg Kravis RobertsMcGuireWoods LLPMCube Financial LLCMiller Mayer LLPMission Peak CapitalNewmark Realty Capital, Inc.ReadyCap Commercial, LLCRed Capital GroupRoetzel & Andress LPASnell & Wilmer LLPSpirides Hotel Finance Brokers, LLCStabilis Capital Management LPTerra Capital PartnersVarde PartnersWestern Alliance Bancorporation
Canadian Chapter CMLS Financial Ltd.Manulife Financial/
John Hancock FinancialMCAP CommercialNational Bank Financial Markets
CRE Finance Council New Members
Welcome to CREFC

MARC IADONISI | [email protected] | 215 882 5877
Find Out For Yourself - Join Our Current Subscriber BaseBroker Dealers | Insurance Companies | Hedge Funds | Money Managers
Visit kcp.kbra.com today for a free trial!
KCP DELIVERS A SUPERIOR PERSPECTIVE ON MONTHLY
CMBS SURVEILLANCE
A heartfelt thanks to those who have subscribed to our monthly surveillance service. We truly appreciate your support and feedback during our inaugural year, which was critical to our success.
Your suggestions resulted in a number of product enhancements including:
You can expect continued improvements as we relentlessly pursue our goal to provide best in class service to the market.
▪ Live XML Data Feeds▪ Advanced Drill Down Capability▪ Expanded Deal Coverage –
Including Freddie K Series
▪ Additional Portfolio Functionality▪ Valuations of ALL Underlying
Loan Collateral▪ Trepp Loan Overrides

CRE Finance World Summer 2015 6
R
Real Estate Managers Face New Wave of SEC Scrutiny
Conrad C. AxelrodAssociate, Investment Management GroupSchulte Roth & Zabel LLP
Marshall S. BrozostPartner, Real Estate GroupSchulte Roth & Zabel LLP
eal estate fund managers were among the myriad private fund advisers affected by changes to the SEC’s registration requirements under the DoddFrank Act in 20111. In the lead-up to the DoddFrank registration deadline in March 2012, and for many months thereafter, newly-registered
fund managers faced numerous challenges when confronted with the reality of implementing an effective compliance program. Following the SEC’s recently announced expansion of its exam program to focus on real estate fund managers, managers should now prepare for those programs to be put to the test — not just on paper but in practice.
Over the last three years, fund managers gradually adjusted to life in the new, regulated world as they familiarized themselves with the bulk of reporting and regulatory requirements. The volume of new registrants and the complexity of their business models prompted a similar engagement phase within the SEC, which responded actively by increasing the resources and training of staff at the Office of Compliance Inspections and Examinations (“OCIE”). As part of this response, OCIE launched a two-year “Presence Exam Initiative” involving focused, risk-based examinations of roughly one-quarter of the new registrants.2 The preliminary results of that initiative were widely publicized in the “Spreading Sunshine” speech delivered in May 2014 by then-OCIE Director Andrew Bowden, who reported a 50% rate of compliance violations among private equity fund managers.3
These findings and other recent regulatory outcomes generated by the SEC continue to make headlines in the financial press, a fact partially attributable to the large sums of public and private pension funds involved. At the same time, political interest in tightened regulation of the financial services industry has shown few signs of abating since the financial crisis of 2008-2009. As a consequence, transparency is one of the key themes stemming from the SEC’s recent efforts — the underlying rationale being that even the most sophisticated institutional investor cannot make educated decisions or exercise contractual rights effectively with respect to matters of which it is not adequately informed. However, some investors have also queried the importance of the SEC’s findings and its perceived role in protecting institutional investors in the context of freely-negotiated management arrangements,4 and some fund managers have expressed concerns over the preservation of legitimate confidentiality arrangements, upon which a substantial part of a manager’s business may be predicated.
Having identified key regulatory concerns with the private equity model, and no doubt aware of the significant role played by real estate in any pension fund’s asset allocation paradigm, OCIE is now bringing its new wealth of expertise and data to bear on the real estate sector. As OCIE turns its attention to real estate fund managers, this article outlines some of the common compliance concerns they may now face.
Compliance ProgramIn the rush of regulatory changes and last-minute amendments to SEC rules in 2011-2012, some fund managers implemented a “one-size-fits-all” compliance solution. Although these programs may check the right boxes, they are not tailored to the business of each particular firm.
From a resource standpoint, many fund managers appointed a long-standing executive as chief compliance officer (“CCO”) and tasked additional reporting requirements to operational staff. However, one of the keys to an effective compliance program (and a successful SEC examination) is an adequately-resourced compliance staff. If the CCO wears other hats, the individual’s operational duties should not detract from his or her compliance role. Typical weaknesses that may demonstrate a lack of resources include a lack of detailed documentation supporting policies, valuation changes and expense allocations.
Although some fund managers historically have seen regulatory compliance as an ancillary cost rather than a mission-critical business function, the SEC’s Enforcement and National Exam Program divisions are now coordinating efforts to identify fund managers who lack effective compliance programs and procedures. This initiative has already resulted in 11 enforcement proceedings at the time of this writing.5 Needless to say, such deficiencies (even if not rising to the level of enforcement action) can severely impact a firm’s investor relations, its day-to-day operations, and ultimately its bottom line.
Annual ReviewRegistered investment advisers are required to conduct an annual review of their compliance policies and procedures (Rule 206(4)-7 under the Advisers Act). In practice, this review is often broken down into component projects that can be spread out over time and summarized in a report at the end of the year. The steps taken as part of the annual review should be carefully documented, and, at a minimum should:

A publication of Summer issue 2015 sponsored by CRE Finance World Summer 2015
7
• Test the comprehensiveness of your policies and procedures, taking into account changes in your business;
• Evaluate the effectiveness of the implementation of these policies;
• Identify compliance violations and remedial measures taken;
• Identify new compliance requirements and actual or contemplated changes to existing policies and procedures arising from the annual review; and
• Include a review of relevant issues by senior management.6
Annual reviews are another high-risk area that fund managers are frequently tempted to relegate to a checklist exercise or delegate to an external consultant, particularly if the CCO is distracted with more pressing operational tasks. But the annual review should be used for what it is: a serious opportunity to give your firm an internal scorecard and, at the same time, demonstrate to the SEC that adequate compliance resources are in place. In the modern era of complex regulation, a simple “all clear — carry on” report is likely to be met with some skepticism.
Personal TradingPerhaps ironically, the conceptual gulf between liquid trading funds (such as hedge funds) and real estate funds engenders a lack of awareness of personal trading restrictions among real estate fund managers, making them susceptible to violations of SEC rules. In particular, Rule 204A-1 under the Advisers Act mandates the establishment, maintenance and enforcement of a “code of ethics” that prescribes certain minimum reporting requirements.
Directors, officers and partners of a fund manager, as well as any supervised persons with access to nonpublic information or investment recommendations (in practice this frequently means all staff) should typically be designated as “access persons” in this context. Designation as an access person imposes initial and ongoing reporting obligations for brokerage accounts and other reportable securities in which the individual has “any direct or indirect beneficial ownership,” which includes, among others, accounts controlled by immediate family members sharing the same household. Personal trading violations have included situations where not all accounts required to be reported were reported.
In addition, access persons are required to seek pre-clearance (typically from the CCO) before participating in any private placement or initial public offering of securities. Care should be taken to address personal real estate holding companies in this context.
Custody RuleFund managers in the real estate sector frequently pursue multiple strategies, and many successful managers operate a diverse platform of closed-ended and open-ended funds alongside separate accounts and deal-by-deal co-investment vehicles. Separate accounts and co-investments continue to be a strong focus for OCIE for a variety of reasons, but can also present a weakness under the SEC’s “custody rule” (Rule 206(4)-2 under the Advisers Act). Registered investment advisers are deemed to have custody of client assets whenever they have the authority to withdraw funds from a client account. This type of “constructive custody” should be considered when structuring or reviewing co-investments and separate accounts. When the custody rule does apply, client assets must be held with a bank, broker-dealer or other “qualified custodian” (unless they are “privately offered securities”) and there are additional notice, account statement delivery and surprise examination requirements (unless annual financial statement audits are prepared and timely delivered to all investors).
In addition, real estate fund managers may inadvertently receive physical possession of rent checks, municipal tax refunds and dividend payments on behalf of funds that they manage (generally due to the use of a “care of” address for special-purpose entities). Strict compliance with Rule 206(4)-2(d)(2)(i) under the Advisers Act requires fund managers to return such checks to the sender within three business days of receipt — and not forward them to the custodian bank, which may seem counterintuitive. Although the SEC has issued limited no-action relief for certain tax refunds and dividend payments that might otherwise be unrecoverable,7 there is no analogous guidance for rent checks. From risk alerts to industry conferences, the SEC has repeatedly put fund managers on notice that the custody rule is not to be treated as a technicality, and several enforcement proceedings have been brought in this area.8 As a result, and also as a matter of operational efficiency, many fund managers are considering requiring their counterparties to make all such payments by ACH or wire transfer.
Other Areas of FocusAs the SEC capitalizes on its recent exam experience with the private equity industry, real estate fund managers should expect scrutiny of operational areas that may appear to overlap with private equity funds, including requirements for enhanced transparency and reporting with respect to transaction fees, accelerated fees, operating partners, group purchasing agreements and cybersecurity. Critically, just because it isn’t interesting to your investors doesn’t mean it isn’t interesting to the SEC.
Real Estate Managers Face New Wave of SEC Scrutiny

CRE Finance World Summer 2015 8
There is no way to guarantee a successful outcome to any SEC exam, but in light of the current regulatory and examination patterns we have observed, real estate fund managers should preemptively revisit the following issues:
Management fee income: Review calculation methodologies and timing critically in order to ensure that disclosures in offering memoranda and governing documents both match Form ADV and align with current practice. Any deviations from the manager’s headline fee structure (such as in connection with co-investments, separate accounts or cornerstone investors) should be disclosed in general terms to all investors on Form ADV.
Transaction-based and other fee income: Review all fees received by the manager (and its staff and affiliates) for conformity with governing documents and adequate disclosure to investors. SEC representatives have publicly expressed an interest in this area, highlighting the “vertically-integrated” nature of certain real estate management models as a source of potential conflicts. Accordingly, particular attention should be given to disclosure of real estate operating fees, including industry-standard leasing, servicing and property management fees. Where practical, OCIE has also strongly supported line-item disclosure of transaction-based fees and expenses when investors receive distributions from the disposal of a property.
Investment-level fees and expenses: Similarly, review all fees and expenses paid by the funds to third parties in connection with the acquisition, holding and disposal of portfolio properties. Although this has not historically been viewed as “best practice” within the industry, OCIE has at times taken the position that investors should be able to inform themselves as to the types (and potential calculation methodologies) of typical investment-level fees and expenses that the fund may incur by virtue of certain types of portfolio investments.
Expense allocation and reimbursement: Ensure that expenses charged to clients are legitimate fund expenses, within both the terms of the governing documents of each fund (which are typically drafted broadly) and the disclosures to investors (Form ADV and offering memoranda). In particular, establish a written policy prescribing the reasonable and consistent allocation of expenses that benefit multiple clients; these vary by firm and by fund, although some commonly shared expenses include umbrella insurance policies, market data analyses and certain infrastructure such as investor portals. Almost as important as the policy itself is documentation supporting the reasonable basis of those allocations
in the context of the manager’s business. Where clients are subject to different policies (for example, co-investment vehicles frequently do not bear many of the typical fund operational expenses), this should be clearly disclosed in offering memoranda and on Form ADV.
ConclusionOur experience of recent examinations reflects the SEC’s increased interest in the real estate sector, and we expect this pattern to continue for some time. As a newer group of registrants, real estate fund managers tend to be less familiar with OCIE’s rigorous standards and face unique challenges when confronted with their first examination. Maintaining accurate records and documenting steps taken in furtherance of the compliance program are vital to this process. A thorough annual review can assist a fund manager in identifying areas of potential weakness, but those findings must be taken seriously. Because you will always know your own business best, this is not a task that should be left exclusively to external consultants. Allocating sufficient resources to the compliance program is the key first step towards successfully implementing those policies and procedures — in practice and not just on paper.
1 Changes to the Investment Advisers Act of 1940 (as amended, the “Advisers Act”) contained in the Dodd-Frank Wall Street Reform and Consumer Protection Act (the “Dodd-Frank Act”) eliminated the widely relied-upon “private adviser” exemption effective July 21, 2011, although existing advisers were permitted to continue to rely on the exemption until March 30, 2012 following an extension of the compliance date.
2 See Schulte Roth & Zabel’s Oct. 9, 2012 Client Alert, “SEC Announces “Presence Exams” For Newly-Registered Investment Advisers.” See also OCIE, Letter Announcing Presence Exams (Oct. 9, 2012).
3 See Andrew Bowden, Director, OCIE, Speech at the Private Equity International (PEI), Private Fund Compliance Forum 2014 (May 6, 2014).
4 PEI Alternative Insight, “PERE CFO and COO Compendium” (2015), LPs on the SEC, 17-19.
5 SEC, 2015 Budget Request by Program 50. See also Julie M. Riewe, Remarks to the IA Watch 17th Annual IA Compliance Conference.
6 SEC, Questions Advisers Should Ask While Establishing or Reviewing Their Compliance Programs (May 2006).
7 SEC No-Action Letter, Investment Adviser Association (Sep. 20, 2007).
8 See, e.g., SEC National Exam Program Risk Alert, “Significant Deficiencies Involving Adviser Custody and Safety of Client Assets” (March 4, 2013); and SEC Compliance Outreach Program, National Seminar (Jan. 30, 2014), Slides.
Real Estate Managers Face New Wave of SEC Scrutiny

InformatIon Is only as good as the perspectIve that comes from It.You’re looking for more than information, and a perspective that can help you make more informed decisions. At Standard & Poor’s Ratings Services, our credit analysts work to bring you a point of view that combines the information you seek with the insight you want.
Visit us at SPRatings.com/CMBS to find highlights of our analytical work, our ratings methodology, information about upcoming events and more.
The analyses, including ratings, of Standard & Poor’s and its affiliates are opinions and not statements of fact or recommendations to purchase, hold, or sell securities. They do not address the suitability of any security, and should not be relied on in making any investment decision. Standard & Poor’s does not act as a fiduciary or an investment advisor except where registered as such.
Copyright © 2014 by Standard & Poor’s Financial Services LLC. All rights reserved.STANDARD & POOR’S and S&P are registered trademarks of Standard & Poor’s Financial Services LLC
www.SPRatings.com

CRE Finance World Summer 2015 10
U
Beyond the Big Six: Identifying Alternative US Office Markets Based on Long Term Demand Generators Stewart Rubin
DirectorNew York Life Real Estate Investors
S office building sale prices are 3.5% above the November 2007 peak of the last cycle (107.6% Percentage Peak-to-Trough Loss Recovered)1. Much of the value increase is associated with major market Central Business District (CBD) office space in Boston, Chicago, Los Angeles,
New York, San Francisco, and Washington. The Office-CBD Major Market Index is 27.5% above its previous peak (155.9% Percentage Peak-to-Trough Loss Recovered). The six major markets have experienced significant foreign and domestic investment. These markets mostly benefit from long term growth factors including high education attainment levels, high share of residents with Science, Technology, Engineering, and Math (STEM) degrees, significant high-tech location quotients (LQ), lack of exposure to the more volatile energy sector, and high current office employment.
Boston, Chicago, Los Angeles, New York, San Francisco, and Washington are global cities with strong economic engines. However, since these major markets are priced well beyond previous peak levels, alternatives will be identified. The alternative investment markets either have or are acquiring some of the underlying characteristics of the big six markets. Although they may never achieve the depth and status of the big six markets, they have long term value growth potential. Many of these metros are being transformed and will likely be larger and stronger office markets in 15 to 20 years time.
The metros that seem poised for long-term growth based on the criteria detailed in this report are Austin, Raleigh, Denver, Salt Lake City, Nashville, and Charlotte. These markets excel in several long term growth factors that spawn and sustain office demand. These demand factors include the aforementioned education and high-tech emphasis, but also include characteristics that are attractive to corporations and young college graduates such as affordable housing. Other markets such as Seattle, San Diego, Atlanta, Dallas- Ft. Worth, Portland, Minneapolis, and Indianapolis exhibit long term growth attributes in certain categories that suggest consideration after factoring qualitative factors and overall market position. The markets are selected from a long term investment perspective independent of short term supply considerations. Focus is placed on secular change underlying cyclical rhythms.
Major MarketsThe major markets of Boston, Chicago, Los Angeles, New York, San Francisco, and Washington, DC are driving high office building values. Aside from the availability of low cost capital, major market CBD office benefitted from foreign investment. US Gateway cities have attracted investors pursuing stable investments and, in addition in the case of foreign capital, the quest for safety. Additionally, Houston had recently been a magnet for investment; however, high energy prices fueled demand, which might quickly evaporate if the
recent decline in energy prices persists. Table 1 details the top metro areas for foreign and domestic investment in office buildings.
Table 1Top 10 Metros Office Total Volume Past 24 Months YE November 2014
© Real Capital Analytics, Inc. 2014
Market values in major markets have soared despite lagging market fundamentals. With the exception of San Francisco, real office rents in major markets are between 11.1% and 22.0% below their previous peak. Overall, record office building values notwithstanding, underlying real estate fundamentals have not recovered back to peak levels experienced before the last recession. In order to invest prudently it is important to identify long-term secular trends that underlay the broader real estate cycle being experienced.
Factors for Evaluating Long-Term Trends in Metro AreasCollege educated people tend to self-sort into metro areas in which there are opportunities. In turn companies locate in places where they can hire educated employees. This circle of opportunity becomes self-perpetuating as jobs are created in these metros. Accordingly, metros with high education attainment rates are favored. We also examined and prioritized markets in which young college educated persons2 (YCE) live and are relocating to. Similarly markets with a high degree of STEM graduates attract employment growth. Technology jobs have a disproportionate impact on local economies. Markets with tech job growth and high location quotients in tech using office jobs are identified.
The primary manifestation of office demand is office-using jobs (OUJ). Markets in which office-using jobs have grown over the past five years and are projected to grow over the next five years will be highlighted later in this report. Young workers are attracted to metro areas with job opportunities and affordable housing. Metro areas with affordable housing include some of the highest population growth markets in the nation. Markets with high growth in the number of children between the ages of 5 and 14 are noted later in this report. In addition to these children representing future demographic growth, the parents of this age group have usually set down roots at this point3, establishing a demographic base.

A publication of Summer issue 2015 sponsored by CRE Finance World Summer 2015
11
Considered individually, the factors may not establish future demand growth. However, the confluence of several of these attributes point to long-term economic expansion.
Once the markets are identified using the aforementioned criteria, metros that benefit from those factors, but are major markets are not included. Markets with demand generators that include technology and energy are performing better than others. It remains to be seen what effect plummeting oil prices will have on energy dependent sectors. Accordingly, we did not including any energy centric markets on our list4. Since there are few barriers to entry in most American metro areas on the supply side, focus is placed on long term sustainable demand.
Educational AttainmentMetro areas with high education attainment levels have experienced much more economic growth than those with significantly below average education rates. This trend will likely continue and reinforce itself as college graduates self-sort to places with other college graduates. This takes the form of a persistent cycle in which “knowledge breeds knowledge”5. As the overall American population grew more educated between 1970 and 2010, metro areas became less alike in their rates of college degree attainment6. “A 10% increase in the percentage of an area’s adult population with a degree in 1980 predicts six percent more income growth between 1980 and 2000”7. “Differences in adults’ rate of bachelor’s degree attainment are associated with nearly three-quarters of the variation in per capita income among metro areas in 2010”8. “Metro areas where more than 33% of adults were college-educated had an average unemployment rate of 7.5 percent in early 2012, compared with 10.5 percent for cities where less than 17% of adults had a college degree”, according to Edward Glaeser9. Aside from serving as a proxy for the overall economic health of a metro area, education attainment rates point to more office-using jobs.
Some of the nation’s highest educational attainment levels are in the major market metro areas. The highest is Washington, DC with 46.8% of residents having achieved a Bachelors Degree or higher. The top 10 are rounded out by San Jose 45.3%, Stamford, CT 44%, San Francisco 43.4%, Madison, WI 43.3%, Boston 43.0%, Raleigh 41%, Austin 39.4%, Denver 38.2% and Minneapolis 37.9%10. The national metro average is 32%.
Demographic TrendsA young growing population is important, as overall long-term demographic trends are cause for concern for office space demand. Once baby boomers leave the workforce in growing numbers between 2015 and 2030, there will be fewer workers to fill office buildings. Metros with a growing college educated
millennial population (born between 1980 and 2000) will have a higher demand for office space.
Population growth alone is not sufficient to fill office buildings. The focus needs to be on college educated population growth. College educated millennials will occupy office buildings well in to 2030 and will not begin retiring until 2045 and beyond. Employers favor locating and expanding operations in metro areas that have a young, highly educated, and growing workforce. Accordingly, we considered which metro areas have an increasing level of educated young people.
The number of YCEs has increased 25.2% from 2000 to 2012 in the 51 largest metro areas11. The share of the YCE population with a 4yr degree in 2012 was 37.5% in the 51 largest metro areas. Markets that exceed the top metro average growth of 25.2% between 2000 and 2012 portend future economic growth and demand for office space relative to other markets. Seventeen metro areas experienced growth of 30% or more and have an existing share of YCEs equal to or greater than 30%. This is highlighted in Table 212.
Table 2College Graduates Aged 25 to 34
Source: Joe Cortright, City Observatory
This list generally follows a pattern of self sorting in which college educated Americans migrate to metros with economic growth opportunities. This is causing certain metros to diverge significantly from others. Oklahoma City and Houston benefited from a growing energy sector. Greater Salt Lake City benefits from internal population growth, in-migration, and a healthy high-tech sector. Nashville has benefitted from a growing healthcare sector, successful entertainment industry, relatively low cost housing, and no state income tax. Charlotte
Beyond The Big Six: Identifying Alternative Us Office Markets Based On Long Term Demand Generators

CRE Finance World Summer 2015 12
is a banking center and together with Nashville has developed into a southern alternative to Atlanta with less congestion and more growth. Denver, Austin, and Portland have performed well and have developed urban life that draws young people. San Diego is a long time favorite destination and Indianapolis has done better than average in drawing YCEs to its low cost environment.
Aside from the major and energy sector dependent markets, the list favors Salt Lake City, Nashville, Denver, Austin, Orlando, San Diego, Tampa, Portland and to a lesser extent Sacramento, Baltimore, Buffalo, Indianapolis and Charlotte.
Stem Education and Hi Tech Employment GrowthHigh-Tech employment growth is directly correlated with the share of residents with a Bachelor’s Degree in science, computer science (Technology), engineering, or math (STEM)13. Markets with a considerable amount of residents with STEM degrees combined with a high growth rate of high-tech employment should portend solid future growth. The chart below presents markets with a strong pool of residents with a Bachelor’s Degree in STEM14.
Table 3
Source: U.S. Census; CoStar Portfolio Strategy
The above data concerning high-tech employment growth and STEM education mostly favors the metros detailed in the upper half of the charts. San Francisco, Nashville, and Salt Lake City exhibited the strongest growth. With the exception of the major markets, the list favors Nashville, Raleigh, Austin, Seattle, San Diego, Denver, Salt Lake City, Minneapolis, Portland, Indianapolis, and Columbus.
Markets with Tech Job GrowthTechnology is not the largest sector of the labor force, but it represents one of the major growth engines of overall employment. Technology jobs constitute 5% of office-using demand in CBDs and 8% in suburban markets, according to data from CoStar Portfolio Strategy; however, they drive demand for other sectors as well. Innovation technology reflects on the overall vibrancy of the market. Consider that for 2014, net office space absorption as a percentage of total inventory excelled in tech heavy markets (San Jose, Seattle, San Francisco, Austin and Raleigh) (1.9% vs 1.1% for non-tech). The net absorption advantage of tech heavy markets was even more substantial for the prior two year period (3.5% vs 1.8% for non-tech) and the prior five year period (7.9% vs 3.3% for non-tech). Enrico Moretti’s research indicates that for each new high-tech job in a metropolitan area, five additional local jobs are created15. The areas with strong growth rates, mostly, have strong concentrations of high-tech office jobs. High-tech office jobs are getting more concentrated as opposed to finance jobs that are dispersing16.
The markets with the highest tech location quotients are as expected in the San Francisco Bay area/Silicon Valley. Other high-tech hubs include Seattle: 2.38, Boston: 1.97, Raleigh: 1.97, Denver: 1.90 and San Diego: 1.62. Other markets with better than average location quotients include regional economic capitals Atlanta: 1.54, Dallas: 1.53, and Chicago: 1.09. Five of the top six US investment markets score well17.
Office-Using JobsOffice demand is driven by jobs that require office space. Office-using jobs (OUJ) for the top 54 markets tracked by CoStar increased 2.7% per year over the past five years and are forecast to grow 2.1% over the next five years.
The markets that led growth patterns over the past five years where Raleigh-Cary NC: 6.6%, Austin-Round Rock-San Marcos TX: 6.2%, Nashville-Davidson-Murfreesboro-Franklin TN: 6.2%, San Jose-Sunnyvale-Santa Clara CA: 5.6%, San Francisco-San Mateo-Red-wood City CA: 5.4%, Jacksonville FL: 4.3%, Dallas-Fort Worth-Arlington TX: 4.1%, Houston-Sugar Land-Baytown TX: 4.0%, Salt Lake City UT: 3.9% and Miami-Miami Beach-Kendall FL: 3.9%.
Beyond The Big Six: Identifying Alternative Us Office Markets Based On Long Term Demand Generators

A publication of Summer issue 2015 sponsored by CRE Finance World Summer 2015
13
The markets projected to lead office-using jobs over the next five years are Phoenix-Mesa-Glendale AZ: 3.5%, Austin-Round Rock-San Marcos TX: 3.5%, West Palm Beach-Boca Raton-Boynton Beach FL: 3.3%, Raleigh-Cary NC: 3.1%, Dallas-Fort Worth-Arlington TX: 3.1%, Miami-Miami Beach-Kendall FL: 3.1%, Atlanta-Sandy Springs-Marietta GA:3.1%, Charlotte-Gastonia-Rock Hill NC-SC: 3.0%, and Nashville-Davidson-Murfreesboro-Franklin TN: 3.0%.
Projected OUJ growth is not by itself an indicator of the long term vibrancy of an office market. For example, high projected job growth may be indicative of a market rebounding from significant great recession and housing bust job losses. These markets may also be fundamentally volatile. Other growth markets may be concentrated in a volatile industry such as energy. Growth markets with very low educational attainment rates may not inspire confidence in long term stability. If we separate out the energy markets, markets rebounding from significant job losses, markets with low education attainment rates, and major markets, the list favors Austin-Round Rock-San Marcos TX, Greater Miami-South-east Florida18, Raleigh-Cary NC, Dallas-Fort Worth-Arlington TX, Atlanta-Sandy Springs-Marietta GA, Charlotte-Gastonia-Rock Hill NC-SC, Nashville-Davidson-Murfreesboro-Franklin TN, Salt Lake City UT, and Indianapolis-Carmel IN.
Housing Affordability And Young FamiliesHousing affordability is important for employers since wages can be lower and young families can purchase homes for less. According to Jed Kolko, chief economist at the online real estate firm Trulia “Cities with the strongest job markets would grow even faster if more people could afford to live there. The additional population would help spur further job growth, which, in turn, would strengthen the local economy and foster more middle-class jobs”19. Housing affordability is a significant draw for YCEs as well as young families with children aged 5-14. This age range is important because it encompasses when parents often move due to the cost of housing, schools and long-term economic security20.
Domestic migration is increasingly driven by the quest for affordable housing. The country’s fastest-growing cities are now those where housing is more affordable than average21.
Table 4 presents metros that in fact have a growing population of young families as evidenced by the number of children between five and fourteen. The top 12 markets attracting young families with children have housing affordability indexes of 4.0 or less.
Table 4Rise in Number of Children Aged 5–14
Source: Joel Kotkin and Wendell Cox for rise in number of children and Wendell Cox and Hugh Pavletich, “11th Annual Demographia International Housing Affordability Survey” (2015 Edition: Data from Third Quarter 2014) for housing affordability
The above chart lists metros attracting families with young children. It includes markets with high growth in YCE, OUJ, and with relative affordable housing such as Raleigh, Austin, Charlotte, Dallas, Houston, and Nashville. The combination of affordable housing and economic growth attract young families, which in turn fosters further growth.22
ConclusionThe metros that seem poised for long-term growth based on the criteria detailed in this report are Austin, Raleigh, Denver, Salt Lake City, Nashville, and Charlotte. These markets exhibit fundamental strength in high and/or growing education attainment levels. They have experienced a relatively high rate of growth in the number of college graduates aged 25 to 34, from 2000 to 2012. They have experienced growth and/or forecast to experience growth in office-using jobs. Housing is relatively affordable and young families have migrated to these metros. Most of the aforementioned metros have growing tech sectors. These office markets stand out in several long term growth factor categories that create and sustain office demand.
Beyond The Big Six: Identifying Alternative Us Office Markets Based On Long Term Demand Generators

CRE Finance World Summer 2015 14
Other markets such as Seattle, San Diego, Atlanta, Dallas-Ft. Worth, Portland, Minneapolis, and Indianapolis exhibit long term growth attributes in certain categories that suggest consideration after factoring qualitative factors and overall market position. Seattle has the fourth highest technology location quotient in the US, a very high education attainment level, and is considered more affordable than rival California tech cities. San Diego has an above average education attainment level and has experienced a high growth rate in the number of college graduates aged 25 to 34. Portland is well known for being attractive to young people and has attracted YCEs and STEM jobs.
Although Atlanta and Dallas-Ft. Worth have had low growth in the number of college graduates aged 25 to 34, they are affordable housing markets that have attracted young families in great numbers. In addition, they have experienced growth in office-using jobs over the past five years and are expected to do the same over the next five years. Minneapolis and Indianapolis are the only Midwestern cities on our list. Minneapolis is notable for its high educational attainment level and high-tech employment growth. Indianapolis has had a high level of office-using job growth over the past five years and is forecast to have above average growth over the next five years. It is an affordable housing market and has attracted young families over the past decade.
In addition, Greater Miami, which lagged in many of the considerations, was included due to its strong projected growth in office-using jobs and it being a global city with potential for category changing growth.
Many of these metros are being transformed into fundamentally stronger cities and office markets. Seattle and Miami may catapult to tier one status over the next 15 to 20 years. Although most of the smaller markets may remain secondary destinations, they can nevertheless achieve long term growth and be a source of solid office building investment returns.
Selecting the appropriate metro is important, but equally as vital is discerning which CBD or suburban submarket are the most suitable. Similarly, strategically choosing the right office building within the preferred submarket is essential.
The metro area considerations detailed above go beyond cyclical rhythms and do not focus on entry points. We include markets that we consider to have sustainable growth over the long run. This is not a total return play and is not reflective of short term profitability23. As is true with all markets, they are subject to cyclicality, overbuilding and supply/demand imbalance.
The Information presented herein does not involve the rendering of personalized investment advice, but is limited to the dissemination of general information on Market conditions. This is an abridged version of a larger paper that can be found on http://www.newyorklife.com/ realestateinvestors/. See same link for important disclosures pertaining to this article. Real Estate Investors is an investment group within NYL Investors LLC. NYL Investors is a wholly owned subsidiary of New York Life Insurance Company.
1 The source for the presented Moody’s CPPI data is Tad Philipp, Kevin Fagan, and Keith Leung, “Moody’s/RCA CPPI: Industrial Leads Price Gains Over the Last Three and 12 Months l”, March 6, 2015. Data is as of January 2015.
2 For the purposes of this report young college educated persons are those between the ages of 25 and 34 as used by City Observatory http://cityobservatory.org/.
3 Joel Kotkin, “Baby Boomtowns: The U.S. Cities Attracting The Most Families”, Forbes, September 12 2014.
4 This does not imply that good investments cannot be made in energy centric markets with the right entry and exit points.
5 Alan Berube as quoted by Sabrina Tavernise, “A Gap in College Gradu-ates Leaves Some Cities Behind”, New York Times, May 30, 2012.
6 Alan Berube, “Where the Grads Are: Degree Attainment in Metro Areas”, Brookings.edu, May 31, 2012.
7 Edward Glaeser, Triumph of the City, Penguin Press, New York, 2013.
8 Alan Berube, “Where the Grads Are: Degree Attainment in Metro Areas of the City”, Brookings.edu, May 31, 2012.
9 Edward Glaeser is an economist at Harvard and the author of “Triumph of the City”. As quoted by Sabrina Tavernise, “A Gap in College Gradu-ates Leaves Some Cities Behind”, New York Times, May 30, 2012.
10 http://www.nytimes.com/interactive/2012/05/31/us/education-in-metro-areas.html. Based on the Brookings Institute’s analysis of US Census American Community Survey data.
11 All the data concerning YCEs is from Joe Cortright, “The Young and Restless and the Nation’s Cities”, CityReport, October 2014.
12 The reason for this screening mechanism is to highlight metro areas that have increases over a substantial base.
13 Source: U.S. Census; CoStar Portfolio Strategy.
14 Source: U.S. Census; CoStar Portfolio Strategy. Residents 25+ as of 2010.
Beyond The Big Six: Identifying Alternative Us Office Markets Based On Long Term Demand Generators

A publication of Summer issue 2015 sponsored by CRE Finance World Summer 2015
15
15 Based on his analysis of 11 million American workers in 320 metropoli-tan areas. See Enrico Moretti, “The New Geography of Jobs”, Mariner Books, Houghton Mifflin Harcourt, Boston, New York, 2013
16 e-mail correspondence with Jon Southard of CBRE also see See Moretti
17 Tech location quotient data from CBRE
18 i.e. Miami-Miami Beach-Kendall FL, Fort Lauderdale-Pompano Beach-Deerfield Beach FL, West Palm Beach-Boca Raton-Boynton Beach FL. Although these markets include some of the negative characteristics noted above, the metropolitan area appears poised for long term secu-lar growth. Please see the addendum of the full report for more detail.
19 Josh Boak, “Why areas with good jobs have hard-to-afford homes” Associated Press as presented in the Wall Street Journal, December 9, 2014.
20 Joel Kotkin “Baby Boomtowns: The U.S. Cities Attracting The Most Families”, Forbes, September 12, 2014.
21 “See Shaila Dewanaug, “Affordable Housing Draws Middle Class to Inland Cities”, New York Times, August 3, 2014.
22 See Joel Kotkin “Baby Boomtowns: The U.S. Cities Attracting The Most Families”, Forbes, September 12, 2014.
23 Although there is no guarantee of future returns, we believe that good investment returns can theoretically be made in many markets with the right investment, entry, and exit timing.
Beyond The Big Six: Identifying Alternative Us Office Markets Based On Long Term Demand Generators
Delivering Innovative Commercial Real Estate Solutions.
Portfolio | Bridge | Conduit | Fannie Mae DUS* | Freddie Mac* | FHA/HUD* *Provided through our affiliate, Pillar Multifamily or Pillar Capital Finance
Rob Lawrence 212 518 5381
Kieran Quinn 404 926 1020GuggenheimPartners.com pillarfinance.com
Wells Fargo Portfolio Various
$95,000,000 Office, Conduit
JANUARY 2015
Shoppes of Fruit Cove St. Johns, FL
$1,600,000 Retail, Small Balance Conduit
FEBRUARY 2015
The Hub at Columbia Columbia, SC
$56,000,000 Student Housing, Portfolio
MARCH 2015
Sunroad Corporate Center San Diego, CA
$110,000,000 Office, Portfolio MARCH 2015

CRE Finance World Summer 2015 16
A Lender Roundtable: Real Talk from Real Lenders on Today’s Competitive Commercial and Multifamily Lending Environments
Moderators:Lisa PendergastManaging DirectorJefferies LLC
Stephanie PetosaManaging DirectorFitch Ratings
Panelists:Larry BrownPresidentStarwood Mortgage Capital
Brian A. FurlongManaging DirectorNew York Life Real Estate Investors
Spencer KaganManaging DirectorBarclays PLC
Clay M. SublettSenior Vice PresidentKey Bank Real Estate Capital
Stephanie Petosa. Thanks to everyone for participating on our 2015 Lender Roundtable. We are fortunate to have a broad spectrum of seasoned CRE lenders with us today: Brian Furlong represents life company lenders, Clay Sublett bank portfolio lenders, Spencer Kagan bank CMBS lenders, and Larry Brown non-bank CMBS lenders. This group provides us with a 360- degree view of today’s lending environment, including its positive, negatives, challenges and opportunities. So let’s get started.
Competition: Never Interrupt Your Enemy When He Is Making a Mistake (Napoleon Bonaparte 1769-1821)
Lisa Pendergast. Few would argue that competition hasn’t increased for all capital providers, be it portfolio lenders, the GSEs, or CMBS lenders. Despite the increasingly competitive lending landscape, demand for capital should increase in 2015 and over the next two years given the anticipated high volume of maturing loans and historically high levels of commercial-property transactions. How is competition affecting the way you think about the business and what you anticipate over the next couple of years?
Brian Furlong. I don’t think real estate or structured finance is leading the way in terms of a boom. It’s not overheated compared to how it was in 2007 when real estate and structured finance in particular did help lead the boom. When you think about what went wrong, a lot of it was excess in structured finance and I don’t think that’s true today. The premise that we’re overheated is probably not true in my opinion.
Clay Sublett. I agree with Brian directionally. I don’t think the market is necessarily overheated, but it is dangerously close to getting there. The rebound in the overall economy and the return of the banking sector as well as other lenders explain the heightened competition and the erosion in loan structure in some cases. The broader level of competition is a good thing as opposed to when one dominant execution prevails. It’s not healthy when one particular sector dominates, no matter if it’s agency, bank, or CMBS. Today, everybody is picking their spots and deciding where they want to lean in. Interestingly, there is an overlap in terms of traditional lenders, and it’s largely driven by interest rates. Traditional floating-rate lenders are choosing to lend fixed rate in some cases because they think it is a better risk or a better bet. Some traditional fixed-rate lenders are choosing to go with floating rate.
Larry Brown. It’s interesting when you look at institutional behavior across lender types… a lot of lessons have been learned. One reason commercial banks are crossing over from floating to fixed rate is because they’re making fewer construction loans, fewer land development loans. They are pursuing the safer products.
Roundtable

A publication of Summer issue 2015 sponsored by CRE Finance World Summer 2015
17
Clay Sublett. Certainly, one of the challenges of the banking sector is that there are somewhere between 6,500 and 7,000 banks.
Spencer Kagan. There has been a lot of capital raised for lending. In reference to the 40 or so CMBS lenders out there, I think we’re at the leading edge of the big maturity wave and I think much of the dollars raised are in anticipation of that big wave. I don’t think we’re quite at equilibrium at this stage. It could come later this year or into next year possibly, but I don’t think we’re there yet. There should be an opportunity for improvement on the credit side as lenders obtain the ability to choose from an increasingly larger pool of potential loans.
Larry Brown. I agree with the crew; there is a sound balance right now. The bad news in terms of the competitive environment is that supposedly there were 30, as-in, three zero, different CMBS lenders as of mid-March. The good news is that there are a record number of 7- and 10-year loans coming due in 2015 through 2017.
Clay Sublett. Spencer, let me ask you a question on CMBS. As a portfolio lender, I can survive on my portfolio, same as Brian. If I choose to back away, I have a portfolio earning assets and certainly, I have maturities and things of that nature. So does a CMBS lender feel: ‘I’ve got to make loans because I don’t have a portfolio that’s generating interest margin? ’
Spencer Kagan. It’s a good question. But, I think the goal is always the same for us; we want to strike a balance between finding collateral that we’re comfortable with and being able to put money out in a competitive environment.
What’s Your Lending Sweet Spot?Stephanie Petosa. What do you consider your ‘sweet spot’ to be when operating in today’s ultra-competitive lending environment? Is there a loan size you prefer, a particular borrower profile, or particular markets? Are you competing against all lender types or just those within your sector?
Spencer Kagan. We look at it from two different perspectives: lending for conduit execution and lending for single-borrower execution. For both, a critical factor is relationships and do they provide us with a little bit of an edge. We want to lend into situations in which we may have an existing relationship. Such relationships come through our different platforms: real estate investment banking or wealth management, for example. Such opportunities also might come via relationships with brokers with whom we’ve
done a substantial amount of business. In a conduit execution, we look first to leverage those relationships to win a deal and then look for some balance in terms of creating diversification via geographic locations and property type. For standalone CMBS, it’s a little bit different because our execution isn’t so much tied to pool diversification.
Larry Brown. Our average loan size is about $12 million, which is probably smaller than many of the bigger shops. We don’t have a volume target. As noted earlier, every good lender should be saying no to more loans than they are saying yes to. So we have sort of a Starwood-specific response versus a global industry answer. We are owned by LNR, a B-piece buyer and the largest special servicer. LNR sits on our credit committee. I like to joke that I know more about a loan at the application stage today than I used to at closing prior to having access to LNR’s database of information. We try to compete on loans that make sense; loans that we don’t think are going to default. LNR assumes they are going to own the B-piece on every loan I close; they’re going to have the exposure for 10 years—so you can understand that there’s an extra level of discipline at SMC than there might be at other houses who assume
every loan closed will be entirely off their books in 45 days.
Brian Furlong. Our normal loan size is $30 to $70 million. Yet, we do much larger loans also, so one sweet spot for us is very large deals, many hundred million dollar deals. We have a low cost of funds. It’s not that hard to compete
when you’re triple-A rated. You can out price others if you care to. We have a mix of fixed- and floating-rate money, which is relatively unusual for insurance companies. And, sometimes, we can put a floating-rate component in a fixed-rate deal to allow for prepayment without yield maintenance.
Stephanie Petosa. Do you find yourselves competing with each other within each segment or are you going across segments?
Brian Furlong. We are competing in fixed-rate debt with a mix of insurance companies and CMBS lenders. While life companies win many of the best institutional loans, some first-rate assets do go to CMBS, particularly in the large-loan area. For example, the Houston Galleria just went CMBS and at very tight pricing. We compete with banks too on big deals, particularly floaters. We don’t compete as often with CMBS lenders on floating-rate loans, because CMBS originators often combine a mezz loan with a mortgage loan to get to a leverage level higher than our targets.
A Lender Roundtable: Real Talk from Real Lenders on Today’s Competitive Commercial and Multifamily Lending Environments
“ I think that the market is fairly well balanced in terms of lender supply and demand. Sure, there are a lot of lenders, but there is a lot of demand as well.” Brian Furlong

CRE Finance World Summer 2015 18
Clay Sublett. On the margin, we all compete with each other, but there is certainly more competition within each lender type. It’s always surprising when you think you complement a lender and then all of a sudden they start competing with you. An example would be multifamily deals that we lost to the agencies. The agencies have become very competitive on value-add multifamily.
Spencer Kagan. Our lending program has a pretty wide spectrum. We compete with conduit lenders in the $10 million space and compete with life companies on very large transactions. So there’s no rule of thumb; but generally we tend to be fairly competitive in CMBS up to $100 million in size and then between $100 and $300 million life companies become competitive. However, once a deal gets to be of a certain size, like Houston Galleria, CMBS lenders tend to come back in competitively on these high-quality assets. On the really large loans, it may be a club deal with an insurance company versus a CMBS execution. Borrowers for those very large deals tend to favor the CMBS execution.
Brian Furlong. I think life companies can do club deals on a single asset up to about $1 to $1.4 billion. There was kind of a ‘tooth-and-nail’ competition on 200 Park Avenue (the MetLife building). It went to CMBS ultimately, but the life company club bid it very aggressively and that was about a $1.4 billion transaction. That’s sort of the upper end of where the clubs cut off on the life-company side. Larger balances are possible for portfolios.
Stephanie Petosa. Tell our readers a little bit about your borrowers. Describe your typical borrower profile.
Clay Sublett. In the banking environment, we like deposits and we like relationships. We do very little broker and intermediary business. That is not to say we don’t do any, but it’s very rare. We’re not chasing transactions; our first discussion is about the borrower and does the borrower fit our target? Our typical borrower is a long-term holder; this doesn’t mean they hold everything, but that they have a philosophy of holding and thus are not just merchant builders. We view ourselves — especially on the balance-sheet side — as short-term lenders. We don’t want to be a permanent lender. We would rather complement a CMBS, agency, or life-company execution. We want borrowers who understand we are going to provide them balance sheet as a means to secure a permanent execution. It is important we understand their business platform; are they ground-up construction, acquisition rehab, and/or opportunistic buyers.
Larry Brown. When so many lenders are seeing these packages, the resulting deals can be pretty negative for bond investors. One of the things I enjoy about having a smaller-borrower profile is that these borrowers tend not to be as demanding and a lender can therefore structure a sounder deal. As a lender, the old adage ‘Be careful what you wish for’ often applies when dealing with some of the larger institutional borrowers.
Spencer Kagan. I have a different perspective than Larry on that point. We often see these large transactions from brokers. Yet, when we win these deals it’s often because we have some other established relationship with the borrower beyond the brokerage business. These borrowers may be a real estate investment banking client, we may be providing them with some advisory service…so we’re more than just a commodity to them. And, although those deals tend to price tighter than conduit loans, they allow us to put out substantial dollars and create loans with added structure. In the conduit space, we oftentimes deal with repeat borrowers, although we may see those coming through brokers. The one big difference between what we’re seeing today versus the previous cycle is more brokered business, but ultimately existing borrower relationships can carry the day.
Lisa Pendergast. What percent of your origination volume comes from pre-existing relationships with borrowers?
Clay Sublett. From a ‘dollars-out-the-door’ perspective, it tends to be the majority of what we do.
Larry Brown. For Starwood, in the past four years we’ve done over 400 loans for $5+ billion. The lion’s share is with repeat clients from both the brokerage community as well as the direct-borrower community.
Brian Furlong. What we’re looking for in a borrower depends on the total loan that’s involved, the all-in leverage, the loan term, etc. If it’s a long-term loan, we might be more sensitive about certain things, such as whether it is an active loan or passive loan in terms of things that need to be done. We’re very sensitive about construction lending given the heavy losses incurred cycle after cycle compared to other types of lending. We try to lean in to the very best sponsors. Same with bridge lending. The one thing that’s different for us compared to commercial banks is that we have less focus on relationship considerations external to the real estate
A Lender Roundtable: Real Talk from Real Lenders on Today’s Competitive Commercial and Multifamily Lending Environments
“ We’re winning our share of the loans we want to win but I think that any good lenders lose the majority of the loans they pursue.” Larry Brown

A publication of Summer issue 2015 sponsored by CRE Finance World Summer 2015
19
loans themselves. A commercial bank tends to consider the overall business relationship. Alternatively, an insurance company considers a loan on a stand-alone basis. It’s more of a pure play in terms of focus because we don’t offer banking services to begin with.
Clay Sublett. Having been on both sides of the bank, the balance-sheet side tends to focus more on the relationship, while the firm side focuses on the fact that the loan is generally non-recourse and thus the transaction must stand on its own. In short, in the banking world, you will do a marginal deal for a good relationship. On the firm side, you’re not going to do a marginal deal regardless of the strength of the relationship.
Challenging Borrower AsksLisa Pendergast. The revival of the CMBS market has seen a renewed focus by investors on borrowers and their behavior during the financial crisis. Yet, despite that focus, borrowers have become more emboldened — in what has become a ‘borrowers’ market — to ask for ‘more.’ What are some of the more challenging borrower ‘asks’ and how do you blend meeting those ‘asks’ with holding the line on credit?
Spencer Kagan. First of all, a lot of the borrower asks we see have more to do with pricing than credit quality. Given the choice between profitability and credit, we would rather price something a little bit tighter and hold on credit rather than give on credit. With that said, asks for interest-only periods started off as an exception, but now a short interest-only period is almost expected by every borrower. Most recently, you’re seeing significant push back on the part of B-piece buyers with respect to the long interest-only periods, which is positive from a credit standpoint.
Lisa Pendergast. What about loan structure?
Spencer Kagan. With CMBS, there’s certainly pressure with reserves and escrows so we try to find a balance. We’ll sometimes get a little bit less than what we think is actually needed for tenant improvements and leasing commissions, but only if we think the borrower’s going to stay with the property, there’s enough equity in the deal, and the borrower has deep enough pockets. The reality is we’re probably collecting around two-thirds of what might really be needed, but we believe there’s incentive for the borrower to stay with the property. Those requests come up frequently.
Stephanie Petosa. Any particular carve-out push backs?
Spencer Kagan. Yes. The one we have the hardest time with is bankruptcy, voluntary bankruptcy.
Larry Brown. It feels like many CMBS lenders are currently treating the interest-only period as the ante to get into the game. We try to structure around that. We might actually, heaven forbid, suggest lower amortization or something to augment that IO feature. As Spencer said, we do receive some funky ‘asks’ every now and then around reserves and things like that, but, again, we find creative ways to underwrite that generally.
Clay Sublett. Pricing is always a pressure point. That’s just a given regardless of who you are. It’s difficult to hold the line when you’re hearing, ‘I’m getting
quotes that are 70% to 75% leverage on a non-stabilized asset, on a non-recourse basis.’ I would say the biggest issue right now is pushback on recourse.
Brian Furlong. For us it is some of the same concerns already mentioned and the long back-end open periods. We’re seeing more of it and I think some of it was mispriced by CMBS investors.
CMBS Borrowers: Can’t Get No Satisfaction?Stephanie Petosa. Borrower-satisfaction issues were empha-sized during the first CMBS go around. Borrowers found CMBS structures inflexible and voiced concerns over their ability to approach servicers during the crisis. What are you hearing today from borrowers as far as their appetite for CMBS as a funding source. Is there borrower trepidation about getting into a CMBS loan today?
Spencer Kagan. CMBS can provide the best pricing for a borrower, but oftentimes comes with less servicing flexibility. Borrowers need to determine what’s most important to them. The lack of flexibility
A Lender Roundtable: Real Talk from Real Lenders on Today’s Competitive Commercial and Multifamily Lending Environments
“ I’ve often said, it’s very difficult to guard against the stupid lender when you look at it from a 30,000-foot level. banks are probably doing a reasonable amount of volume…but if you’re getting everything you’re quoting, you’re clearly too aggressive.” Clay Sublett

CRE Finance World Summer 2015 20
in terms of documentation is one area that causes borrowers, especially smaller borrowers, concern. Larger CMBS borrowers tend to enjoy more tailored documentation, particularly as it relates to release provisions in large portfolio loans.
Clay Sublett. I think borrowers are still very much concerned about the servicing aspect. We have borrowers — bank clients — that say CMBS is their execution of last resort. Small- and medium-sized borrowers in particular continue to struggle with things like SNDAs, collateral releases, or collateral lease approvals of major tenants. Knowledgeable borrowers tell us they’ll consider CMBS if the loan is secured by a totally stabilized property. I’ve got a good bank client today working to develop a multifamily property. He wants to carve off a portion of the existing collateral and the special servicer is saying, fine, but for me to consider this you need to send me X amount of money. That really sits poorly with an awful lot of borrowers.
Larry Brown. Look, CMBS is a trillion dollar industry, so while any system could always be improved, I often advise borrowers of both the positives and negatives of CMBS. You often get the most proceeds for the best rate, but there are potentially more hoops to jump through in the servicing of your loan.
Brian Furlong. I think the difference between winning and losing a loan is about 5 to 20 basis points. If a life company is quoting the same price or is a basis point tighter than a CMBS lender, it is going to win 99% of the time. Five or 10 basis points is about where things begin to really matter.
Does Size Matter? Large Loan Single-Asset/Borrower CMBS or Conduit Pari-Passu Notes?Lisa Pendergast. Why are we seeing such a large preponderance of single-borrower deals in the market today?
Spencer Kagan. I think we have tension right now between how large a conduit deal can get in terms of total size. This becomes difficult, particularly when you’re trading triple-A bonds. Before the financial crisis, it was not unusual to have $4 billion or $5 billion, even up to $7 billion pools. Large loans that would previously go into a conduit execution can’t in today’s environment, so larger loans are currently being securitized as stand-alone transactions. But we haven’t seen enough demand, particularly at the triple-A levels, to accommodate what we would like to do for large loans in conduit executions.
Stephanie Petosa. When would you do a large loan as a standalone vs. splitting a large loan into pari-passu notes and placing it in several conduit CMBS?
Spencer Kagan. It’s a matter of managing spread risk and deal size. There are many different things that we consider when determining how to execute. Pari-passu notes create more granularities in pools, but the elongated timing slows down the execution velocity and thereby exposes the issuer to spread risk. The other thing I would say is that a number of standalone deals to date have been floating rate. The floating-rate market is not as strong as we all thought it might be a year ago; so some of those deals are more likely to be executed as standalone.
Brian Furlong. As Spencer pointed out, I think there’s more depth in the fixed-rate, very large single-asset/single-borrower space. The floating-rate space is a bit more challenging given that it used to be supported by European banks and SIVs that no longer exist. The result is that the market is seeing less of that sort of debt and, when it does come to market, it usually is a little bit off the run.
Clay Sublett. The banks are a bit different because we lend on less-stabilized properties. So we look to the relationship and the profile of the borrower. By profile we mean are they holders of real estate or just transactional? We’re not as interested in a transaction borrower because we think there is higher risk.
We want to have a relationship and lend money to people who are long-term holders of real estate with a cash-flowing portfolio. We are playing in a mid-tier market in terms of borrower and asset size and in terms of financial strength. We generally target borrowers with $50 million to $500 million of real-estate assets and less than 20% of their portfolios in new construction or under development.
The Wall of Maturities: Opportunity or Risk?Lisa Pendergast. Do you view the ‘Wall of Maturities’ as an opportunity or a risk?
Brian Furlong. On the one hand, the refinance risk has been scaled down from where it was just a few years ago. This is due largely to the current environment in which values on almost all commercial real estate have risen sharply as cap rates remain low and capital availability high. On the other hand, I think we don’t really know how bad it may get. The 2006-2007 underwriting was really very bad and so it hasn’t been tested. I think the jury is still out to some degree but it seems a little less scary than it did a few years ago.
A Lender Roundtable: Real Talk from Real Lenders on Today’s Competitive Commercial and Multifamily Lending Environments
“ Hopefully, the increased demand for capital allows lenders to become increasingly more selective about the product they’re willing to lend on.” Spencer Kagan

A publication of Summer issue 2015 sponsored by CRE Finance World Summer 2015
21
Clay Sublett. I see it generally as an opportunity. However, the opportunities won’t come without significant expenditures of time and energy as sponsors attempt to refinance loans with significant issues. Many of those deals are highly leveraged and oftentimes in tertiary markets. Some will be recapitalized, others will be acquired, and some may have a component of debt forgiveness. For many lenders the risk is that significant energy is spent on something that may never come to fruition.
Larry Brown. The opportunity is that lenders can be more selective as to what they lend on as maturity volume increases. This is an improvement from the ‘there aren’t enough loans out there, and I’ve got to do something aggressive to put some numbers up.’ The risk, however, is that with so many lenders right now, is there a lender for any and every loan? You sure hope not. The hope is that there’s discipline in the market and that not all loans are going to make it. A lot of the ‘good stuff’ has already been refinanced. It’s possible the tail end of this wall may not be the prettiest.
Spencer Kagan. I would agree with that. I think a lot of people are looking at this three-year window, but the reality is that some of those loans, especially when you start getting in 2017, may need to be extended. To date, that’s worked for a lot of loans — servicers extended the loan out and it eventually got paid off. To the positive, a lot of dollars have been raised to recap transactions that need gap financing because the senior might be too high leverage for today’s standard. Overall, I see the wall as more of an opportunity than a risk, just be mindful of the fact that some loans are more than likely to get extended out.
Lisa Pendergast. Is there a risk in extending these loans? No one who would argue back in 2009, 2010, 2011 and 2012 that loan extensions represented the best course of action in many cases. During that period, the markets recovered nicely as benchmark rates and cap rates declined and commercial real estate became a real focus for value-minded investors. Going forward, there’s less likelihood of substantial continued value improvement, with an increase in cap rates likely to offset the anticipated uptick in topline growth. It seems to me that there is more risk in extension today than there was three or four years ago.
Spencer Kagan. Certainly there’s a portion of the loans that should take losses, but we still think that we’re in an economic environment in which there is opportunity for substantial increases in top-line growth. So give some of these properties more time to improve
their financial performance and they could build their way into senior loans that make sense. At a minimum, extensions may bring these loans back into a situation where there could be a recap with gap financing that’s so common.
Brian Furlong. So who benefits from kicking the can down the road? I think that that’s a very pertinent question. I was walking through Stuy Town this weekend and they’ve done beautiful things with it. I was thinking to myself what a food fight it would be if they put it on the market today in this environment. But, somewhere the cash register rings and the decision is made to kick that can down the road. When the wall of maturities hits, who’s going to benefit from kicking the can down the road and who will suffer?
Clay Sublett. You have someone still controlling the asset that realizes they’re not going to get any money out and so they have essentially given up hope. Extending it just runs the risk of deterioration in your income trade.
How Concerned Should We Be About Refinance Risk on Today’s Loans?Lisa Pendergast. The lack of amortization in today’s deals and the very real likelihood that mortgage rates are higher ten years from now than they are today raise concerns about refinance risk in CMBS 2.0/3.0 loans. What are your thoughts as lenders? How do you protect?
Larry Brown. I echo your concern. I think investors should be very wary of full-term IO and I believe significant focus should be placed on LTV and LTC at maturity. In CMBS 1.0, the market drank itself into believing that values would bail these loans out. And some even point to the 2005 through 2007 vintages and suggest that they actually did. But that happened only because interest rates got so low just in time for this refinance wave. I would tell you that there is every reason to be concerned about refinance risk 10 years from now based on where rates are and the amount of IO getting done. I think that those lenders doing full-term IO at high going-in LTVs should be penalized when it comes time to selling those loans via the capital markets.
Stephanie Petosa. Given the uncertainty related to the direction of interest rates and the general concern regarding the impact of a macro event, do all of you perform refinance tests on newly originated loans?
Larry Brown. Absolutely.
A Lender Roundtable: Real Talk from Real Lenders on Today’s Competitive Commercial and Multifamily Lending Environments
“ I subscribe to the theory that the larger deals have the better sponsors. but, to be very candid, these types of loans are usually shopped to every lender on the Street, so we often put these loan packages in the shredder, because the “winner” has actually “lost” in terms of what he has to stoop to from a credit standpoint to win that deal .” Larry Brown

CRE Finance World Summer 2015 22
Brian Furlong. Yes. I think we’ve got to. Almost every sensibly originated loan should perform well in a low interest-rate environment during the term. But there are certain interest-rate traps there. Looking at it from a debt-yield versus a debt-service-coverage-ratio perspective, I’m somewhat concerned about the real low debt yield loans that are often associated with the most sought
after properties, like multifamily for which the agencies allow for very low debt yields and properties in places like Manhattan that may be beautiful assets but never-
theless have low debt yields. Whether or not the trophy Manhattan asset or the decent-quality multifamily asset will save you is unclear…the jury is out on that because when interest rates rise these loans may get caught by an interest-rate trap that doesn’t relate to the quality of the property. For example, loans exist that have long leases in place that aren’t going to inflation-adjust when rates change and the inflation environment changes. We’re ground lenders and we see 30-40% LTV loans that could go bad at the balloon date unless the ground rent first adjusts up to the point where it provides for the debt yield needed to refinance the loan at its balloon date. If such a loan defaults due to an interest rate rise, that default will have happened for reasons totally independent of the occupancy of the property, the quality of the rent roll, or other traditional credit factors.
Larry Brown. And the statistics from LNR and others bear out what Brian just said. Would you ever have guessed that multifamily loans have among the highest default rate during the two-plus decades of CMBS? Would you ever have guessed that hotels are among the sectors with the lowest default rate? And, within hotels, would you have guessed that it’s non-flagged hotels with the lowest default rate when compared to flagged? Why? Here’s why: Everyone gets more aggressive because they need to originate multifamily loans and so are more willing to underwrite more aggressively. They’re dealing with crazy cap rates and things like that. In contrast, the approach with hotels is ‘I have to be conservative.’
And so what happens to those loans 20 years later is that hotels are actually performing relatively better than multifamily. It’s fascinating, but not surprising with hindsight.
Spencer Kagan. From our perspective, we certainly aren’t going in with a lot of the heavy IO loans that are out there. Yet, in very supply-constrained markets and in any type of inflationary environment, I do think it’s likely those assets will benefit from topline growth. Oftentimes deals with amortization today are located in tertiary markets or have significant term risk, like concentrated roll during the term of the loan, so you may not actually get the benefit of all the amortization. All else equal, we would much rather have loans with amortization than without. Yet, we do provide some allowance for IO loans, particularly in very tight markets where there is more opportunity to push rents than is the case in tertiary markets.
Clay Sublett. From the portfolio side, we’re certainly looking at the staying power of the sponsor. Most of what we do is floating rate, so we are much more sensitive to the fact that if we see a near-term rate increase, it will hit us during the loan term and not just at maturity. So we’re always doing sensitivity analyses. We always approach refinance risk with some cushion in it. That said, we ultimately look at the staying power of the sponsor and the benefits of recourse. A totally non-recourse loan means I scale back the leverage to reduce refinance risk and the loan’s sensitivity to interest-rate movements.
Lisa Pendergast. A quick last word…While it is impossible to foresee where rates will be 10 years from now, the changes we’ve seen from the rating agencies should help investors with not only refinance risk but also term defaults. It’s a positive industry development that CMBS credit enhancement is almost double what it was pre-crisis. Investors are far better protected today than they were pre-crisis, and the additional protection helps to address ‘uncontrollable’ factors such as the competition induced increase in IO or a market induced back up in interest rates and thus heightened refinance risks.
Stephanie Petosa. Thanks to all of our panelists for their participation and candor.
A Lender Roundtable: Real Talk from Real Lenders on Today’s Competitive Commercial and Multifamily Lending Environments
“ life companies compete with CMbS in the fixed-rate space and particularly the large fixed-rate space all the time. CMbS is a very potent competitor.” Brian Furlong
“ on the banking side, loans have full or at least partial recourse with some burn down; but that’s been one of the big pressure points of late — borrowers asking for and getting higher leverage than has historically been the case and getting it non-recourse.” Clay Sublett

The structured finance analysis you rely on should be built on a thorough understanding of the critical risk factors. At Morningstar Credit Ratings, we provide ratings analysis that takes a broad and deep view of the assets and parties that make up structured finance transactions. We identify and quantify credit risk, and provide a concise Morningstar perspective that investors can use to make better-informed investment decisions. Our insightful presale analysis, timely surveillance reviews, and objective operational risk assessments combine to provide a comprehensive analytical package for investors in CMBS, RMBS, single-family rental securities, and ABS.
Credit Perspective Built on Strong Risk AnalysisMorningstar Credit Ratings, LLCratingagency.morningstar.com +1 800 299-1665
©2015 M
orningstar, Inc. All rights reserved. Morningstar’s N
RSRO ratings, outlooks, and analysis are provided by Morningstar Credit Ratings, LLC. M
orningstar Credit Ratings, LLC is a wholly ow
ned subsidiary of Morningstar, Inc.,
and is registered with the U.S. Securities and Exchange Com
mission as a nationally recognized statistical rating organization (N
RSRO).

CRE Finance World Summer 2015 24
T
The Three Keys of Real Estate CrowdfundingUnderstanding New Capital Formation Options Joanna Schwartz
CEO & Co-FounderEarly Shares
hrough new capital raising regulations implemented in September 2013 under the JOBS Act, “real estate crowdfunding” has become a highly active sector of the private finance market. According to a recent report from Massolution, a research and advisory firm serving the
crowdfunding industry, over $1 billion of capital was infused into the real estate space through various crowdfunding platforms in 2014.
Crowdfunding — the practice of raising funds from a group of people, leveraging online tools — has evolved beyond its origins in donation-based fundraising into the world of sophisticated equity and debt capital raising. Through so-called “equity crowdfunding,” business owners can raise investment capital online from individual investors who pool their funds with others to buy shares in private ventures.
Real estate is the fastest growing sector of the emerging equity crowdfunding market, and its attractiveness to “crowd” investors is unsurprising. Though the JOBS Act — short for “Jumpstart Our Business Startups” — was originally designed to increase capital allocation from individual investors into early-stage companies, the high level of risk inherent in startup investing has made investors hesitant to participate in growth opportunities under the new regulations. Real estate, on the other hand, is a more tangible and familiar asset for investors to understand.
“When investors are presented with different opportunities on a crowdfunding platform, I believe the majority prefer to co-invest with a sponsor who has been in business for a long time, rather than in a start-up business,” Jack Glottman, President of Saglo Development Corporation, told CRE Finance World. Saglo is a Miami-based retail shopping center investment and management company that owns, leases and manages 800,000 SF of shopping centers and provides third party management and leasing for an additional 230,000 SF of commercial property in Florida. Saglo conducted two successful $3+ million capital raises on Early-Shares, a private investing platform that specializes in real estate crowdfunding.
“They’re not without risk, but real estate investment opportunities come with firm time horizons and yield projections,” Glottman continued. “When investors can get 7-9% returns on a project that they can invest in online, that’s a pretty appealing prospect for them.”
Crowdfunding’s appeal for investors is matched by its appeal for capital raisers. Most real estate developers, project sponsors, and
operators are already well-acquainted with deal syndication — the process of pooling investments from a group of investors to finance a portion of the equity for a project. Today’s crowdfunding (or “private investing”) platforms provide tools, resources, and services designed to make the syndication process more efficient.
It’s crucial, however, to understand the background and nuances of the new real estate crowdfunding market before utilizing it as a tool for real estate capital formation or investing. This includes gaining familiarity with the current regulatory environment, the types of platforms in the market, and sponsors’ options for raising capital — all of which are highlighted below.
#1: Regulations: Making the Private Market PublicThe real estate crowdfunding industry has arisen thanks to the enactment of Title II, which is one of the seven titles of the JOBS Act. Enacted in September 2013, Title II lifted the ban on the public advertising or “general solicitation” of private investment opportunities.
The regulatory exemption for general solicitation is Regulation D Rule 506(c). Prior to the rule’s implementation, all real estate syndications were traditional private placements under the long-standing Rule 506(b) securities exemption. 506(b) stipulated that capital raisers (“issuers”) could only raise funds from those investors with whom they had “substantive, pre-existing” relationships.
As such, the pool of investors for a given real estate deal was largely limited to the sponsor or developer’s network. With general solicitation, however, dealmakers can now solicit investments from any accredited investor. The key stipulation is that the issuer is required to verify that all investors qualify as accredited according to the SEC’s income or net worth criteria — $200,000 in annual individual income ($300,000 joint) or $1 million in net worth, not counting the value of primary residence.
By moving the capital raising process online and broadening issuers’ access to potential investors, 506(c) “crowdfunding” is helping facilitate an evolution for the real estate industry. Bringing dealmaking out of the country club and into the 21st century is a significant change for the industry — one that may have the potential transform the real estate finance landscape.
#2 Platforms: Powering Real Estate Through TechnologyDespite the relative newness of the real estate crowdfunding market, investors and sponsors can already choose from a multitude of platforms to fit their needs.
CRoWded tRadeS: CRoWdfundIng enteRS CoMMeRCIal Real eState

A publication of Summer issue 2015 sponsored by CRE Finance World Summer 2015
25
At their core, most platforms offer largely the same tech-driven features and benefits. For deal sponsors (“issuers”), platforms help streamline capital formation through deal monitoring tools, transaction management functionality, privacy controls, and access to a database of registered investor users. For investors, they provide transparent access to all of the tools and the information needed to review, evaluate, and invest in a variety of opportunities.
Yet that doesn’t mean all platforms are created equal. Beyond the technology benefits, platforms vary across seven key variables:
1. Focus: Does the portal concentrate on a specific type of real estate asset or a particular geographic region?
2. Due Diligence: Does the platform vet its deals? If so, how? What are its investment selection criteria?
3. Products: Does the platform offer debt or equity investment opportunities?
4. Regulatory Profile: Does the platform operate as a registered broker-dealer or just an intermediary?
5. Service Range: Does the platform help issuers craft their investment offerings or is it self-service?
6. Deal Structure: Do investors receive notes or make direct investments into the deals on the platform? Or, are investments pooled into a special purpose fund?
7. Portal Compensation: Is the platform paid via profit participation, points, or a flat fee?
Issuers and investors should research a platform to understand its niche in the overall market before investing or pursuing a capital raise. The most reputable platforms — among them EarlyShares, RealCrowd, Fundrise, and several others — offer a wealth of educa-tional materials and resources to help you make the most of their products and services.
#3 Capital Raises: Options for Streamlined SyndicationGiven the vast number of real estate crowdfunding platforms on the web — now estimated at over 100 — there are variety of fundraising vehicles available to developers and sponsors to help them capitalize on the crowdfunding trend. Investors and issuers alike should understand the different options, since they can impact the structure of the investment offerings.
Private Raise-506(b): Leverage technology to conduct a tech-powered private placementMany platforms offer issuers the option to utilize their transaction management and deal tracking tools without making the deal public (and thus incurring the legal requirements that come with initiating a 506(c) raise). With a private raise, sponsors can leverage the benefits of technology without having to go through the investor verification process. Issuers simply invite members of their existing networks to view and invest in their deal(s). The drawbacks: no marketing exposure beyond their existing network, and no investments from new audiences.
Direct Crowdfunding: Raise funds publicly and directly from accredited investorsIn this model, an issuer posts a deal to a platform — triggering 506(c) — and accepts investments from members of his or her network and new investors who contact the issuer through the platform. The sponsor publicly syndicates a portion of the debt or equity (usually between $1 and $5 million) and accepts 5-40 new investors into the deal (on average, depending on offering size and minimum investment). Typically, the platform takes care of investor verification and furnishes the sponsor with documentation for his or her records.
‘Fund’ Crowdfunding: Raise capital into a fund and share profits with your platformThis option is largely the same as the one above, but involves slightly different structure. The platform will pool all investor commitments into an LP or LLC and then use the fund to invest directly in the issuer’s deal. As such, the sponsor only has one new investor in the offering: the fund. Some platforms pre-fund the deal by underwriting it up front and syndicating it to investors after the fact. Others open the fund directly to investors and close the offering once the target goal is reached. The platform typically acts as the fund manager and shares a percentage of the profits after investors receive their take.
No matter which approach appeals to you, it’s a smart move for all constituents in the real estate market to familiarize themselves with the concept of crowdfunding, given its growing popularity and its potential to fundamentally change the way real estate dealmakers do business. Now is the time to act, because the real estate crowdfunding industry is expected to grow to more than $2.5 billion in 2015.
The Three Keys of Real Estate Crowdfunding

CRE Finance World Summer 2015 26
T
Crowdfunding: The Future of Commercial Real Estate Lending or Just a Voice Lost in the Crowd?
Geoffrey MaibohmCounsel, Finance GroupAlston & Bird
Stephen DenmarkAssociateAlston & Bird
Robert SullivanPartner, Co-Chair Finance GroupAlston & Bird
he future of traditional lending has challenges ahead. As technology advances and capital becomes more readily available, traditional lenders are likely to see increased pressures to lend and increased pressures on profit margins from lending. Crowdfunding, assuming it
can withstand increased regulatory scrutiny, looks well suited to fill a niche that traditional lending may not be able to fill. However, traditional lending will likely not see any challenges posed by crowdfunding for larger and/or more complex transactions. The next several years will provide challenges and opportunities, and entities that can overcome challenges and execute on opportunities presented by technology and the widening availability of capital will be well positioned to flourish. Less nimble entities are likely to get trampled by the crowd.
Crowdfunding: What Is It and What Are Its Applications in CRE Finance?Crowdfunding has been described as, “[t]he practice of raising funds from two or more people over the internet towards a common service, project, product, investment, cause, and experience.”1 In crowdfunding, various small investors serve as the source of capital for the project. Applications of crowdfunding have been used for a wide range of capital intensive projects over the last several years, which include the production of major motion pictures and video games.2 In crowdfunding, a party seeking financing for a project goes onto the internet to a website that arranges the financing. The project is published on the website, and registered users are given an opportunity to invest in the project in some small increment. At the most basic level, crowdfunding is syndicated investing/lending on a micro level. It is a global phenomenon changing investing and lending.3 Knowing what crowdfunding is at its most basic level allows a look at its application and rise in the world of CRE lending.
The principles of crowdfunding applied to CRE lending suggest that potential CRE borrowers would go to a website dedicated to crowdfunding to seek capital from the investors on that website that have “signed up” or agreed to participate in the proposed project through investing. There are already a number of crowdfunding websites devoted to CRE investments featuring different risk profiles for both assets and investors alike.4 The role of the “crowd” in crowdfunding for CRE is varied. Some crowdfunding websites, acting as the arrangers, utilize crowdfunding structures where the crowd acts as direct lender to the CRE borrower. Some arrangers utilize a structure where the related CRE loan is prefunded, and interests in the loan are sold to investors. Other crowdfunding platforms utilize structures where the arrangers create a lending vehicle with funds collateralized by the investors’ investments. The
vehicle then lends such funds to the related borrower(s), and the investors are given ownership interests in the lending vehicle itself. When structured in these ways, crowdfunding looks very much like a microcosm of traditional lending. Yet, other crowdfunding arrangements work where the arranger funds upfront and creates a project note and the related crowd invests in that note. At its core, crowdfunding is a blend of traditional lending strategies that are being made available to the general small investor. In a market that has been dominated by traditional large lending institutions and large institutional real estate investors, this could signal a major shift in CRE lending away from its traditional lending present form. Nonetheless, the mechanics of crowdfunding and its ability to service the needs of CRE borrowers must be considered. In this regard, the rise of the crowd may just not be enough to replace traditional lending.
Crowdfunding: Who is in the Crowd and Who Regulates It?As mentioned earlier, investors/lenders in crowdfunding are not traditional CRE lenders; they are the antithesis. They are individuals interested in CRE finance. They may have no experience in CRE investment, and generally are neither institutional investors nor the wealthy individual investor that have otherwise dominated CRE finance from its beginnings to present day. This raises questions and concerns simultaneously. In particular, many wonder how regulatory agencies will deal with the phenomenon that is crowdfunding.
Crowdfunding in the United States arises from the recently enacted Jumpstart Our Business Startups Act (the Jobs Act).5 According to the legislative history of the Jobs Act, crowdfunding was designed to improve liquidity and investment in small business.6 Most notably, the Jobs Act amended Section 4 of the Securities Act of 1933 (the 33 Act) to include provisions that permit crowdfunding in new Section 4(a)(6), yet limit the amount that may be invested by each investor within any given 12-month period.7
On October 23, 2013, the Securities and Exchange Commission (SEC) proposed implementing rules related to the newly amended Section 4(a)(6) of the 33 Act and crowdfunding (Crowdfunding Proposed Rules).8 While the Crowdfunding Proposed Rules have not yet been adopted by the SEC, they contain several key points for discussion that are beyond the scope of this article. Relevant for purpose of this article, however, is discerning the legislative intent. The text of Section 4(a)(6), as amended by the Jobs Act, and the Crowdfunding Proposed Rules arguably demonstrate the legislative intent of Congress and the SEC. Congress and the SEC want to grant small business easier access to capital markets, but at the same time, protect small and/or unsophisticated investors from overreaching. The limitations that Congress and the SEC have
CRoWded tRadeS: CRoWdfundIng enteRS CoMMeRCIal Real eState

A publication of Summer issue 2015 sponsored by CRE Finance World Summer 2015
27
placed on both the amount that may be offered for investment and the amount that may be invested seem to demonstrate this underlying intent. In addition, several states have already begun to regulate Crowdfunding utilizing provisions similar to the Crowdfunding Proposed Rules.9 This leads to the next question: how will these new regulations potentially impact crowdfunding when applied to CRE?
It is highly likely that regulators would view crowdfunding of CRE very carefully and perhaps with greater scrutiny. Traditionally, CRE for both lenders and investors has been an area where only those with the requisite capital and investing experience have entered. Moreover, the regulations do not adequately provide enough capital to fund most CRE projects of any appreciable size. The length of the investment period permitted under Section 4(a)(6) does not provide a long enough period of time for traditional borrowers or investors of CRE that would otherwise seek out traditional lending. Therefore, in and of itself, crowdfunding does not pose a threat to traditional lending for the “trophy properties” that often fill the CRE lending space. In addition, given the nature of CRE and the nature of the investment, there would likely be little liquidity for a crowdfunding investor to dispose of the investment.
Another potential concern related to crowdfunding revolves around lender consent issues — especially in the context of workouts and/or defaulted loan disposition. A group of investors (even if they waive their rights to vote in any plan of disposition and/or workout) will likely have a very difficult time achieving a workout of a CRE loan that has crowdfunding. The situation is analogous to the highly leveraged CRE loans made prior to 2008. It has been very difficult for investors to exercise their rights on such loans given the complex nature of the debt stacks and the diametrically opposed interests that the holder of those debt stacks often have. It is not inconceivable that in a crowdfunding scenario the situation will be even worse given the possibly unsophisticated nature of the investors in crowdfunding. Even if they were to waive their rights to participate as an active voice in a workout, it is conceivable that litigation would arise amongst the investors for any workout or disposition strategy that goes awry, or even if such workout or strategy were to perform reasonably well, litigation would likely arise as a result of one or more of the investors being dissatisfied.
The SEC has not yet taken a stance on the Crowdfunding Proposed Rules. One scholar suggests this is a result of the SEC’s concern over fraud and/or loss in crowdfunding investments.10 Complex CRE (or CRE of a substantial nature) might involve the very risks that the SEC may have concern over. It would not take much to invite the SEC in to harshly scrutinize CRE investments utilizing crowdfunding were investors to suffer heavy losses. Potentially, this might make CRE borrowers wary of seeking this type of
financing and push them toward traditional lending. How any of this unfolds remains to be seen. Suffice it to say that the regulatory mechanics involving crowdfunding are far from finalized, and if they were to invite heightened regulatory scrutiny, it may not be appealing for institutions currently engaged and (relatively) comfortable with traditional lending.
In light of the above, regulators would likely take a heightened level of scrutiny for arrangers attempting to use crowdfunding to fund a large, complex and/or highly syndicated CRE loan. Despite these obstacles, it does not mean that crowdfunding cannot fill other liquidity requirements needed in CRE.
Crowdfunding: Who Needs a Crowd Anyway?While crowdfunding may not have great utility for long-term CRE finance and/or complex leveraged lending structures, crowdfunding in CRE may offer unique liquidity solutions for smaller balance loans short-term in nature. A CRE borrower looking for short-term financing at a low cost of funds, with minimal upfront origination fees, may find a crowdfunding solution very attractive. Indeed, origination fees currently range from a low of 0% to a high of 4%. Also, the speed at which a project can be funded and the loan closed may be quicker than the time necessary for a traditional CRE lender to fund a loan. Moreover, the loans tend not to feature asset management fees and/or other costs of borrower type fees. The lack of fees and costs, coupled with very favorable interest rates, may make crowdfunding-backed CRE loans very attractive to small, non-institutional borrowers looking for capital to develop their CRE projects. If this were the case, it arguably aligns well with legislative intent both at the federal and state levels for permitting crowdfunding.
In addition, crowdfunding can (and is) being used to attract investors that would be “accredited investors” for purposes of Section 501 and Section 506 of Regulation D to the 33 Act.11 Under Section 506, unlimited numbers of investors, as long as they qualify under Section 501 as accredited investors and are given the notices and materials required under Section 506, may participate and/or have materials directed to them for an offering, and that offering will not be subject to registration under the 33 Act. Access to investing on a crowdfunding website could potentially be restricted to individuals that are accredited investors via password protection and other security procedures. Some CRE crowdfunding websites do limit themselves to participation by only accredited investors, and such investors are required to certify that they meet the requirements of Section 501. With this new phenomenon on the rise, the reactions of traditional lenders in the traditional lending space to crowdfunding are of great interest.
Crowdfunding: The Future of Commercial Real Estate Lending or Just a Voice Lost in the Crowd?

CRE Finance World Summer 2015 28
Crowdfunding: Join the Crowd or Disperse It?With new developments to crowdfunding taking place, the reactions of traditional lenders in CRE to crowdfunding will be quite interesting. As the traditional CRE lending space is currently constituted, investment banks, state chartered banks, and other regulated lenders will likely have a difficult time competing with the speed of closing and cost of funds that crowdfunding is capable of providing. Moreover, the arrangers in the crowdfunding space are likely to draw a younger, more “entrepreneurial” type of borrower and/or investor that is not as likely going to be drawn to traditional lenders given their rigors and institutional nature. Conversely, the types of products that these borrowers are seeking through crowdfunding are not assets that lenders in CRE traditional lending typically finance. Yet crowdfunding’s basic proposition of utilizing technology to draw in capital that would not otherwise be available is not so dissimilar from the rise of securitized lending several decades ago. If lenders in CRE traditional lending are going to take advantage and otherwise co-opt the crowd, their optimal strategy would likely be to acquire a current crowdfunding lending platform. This would probably be an easier endeavor administratively as opposed to such lenders building their crowdfunding platforms from the ground up. Crowdfunding may provide an expedient financing source for smaller projects of short duration. In this sense, crowdfunding may have already carved out its niche from traditional CRE financing. Although, regulatory concerns for the financial safety of unsophisticated internet investors may temper that analysis.
Conversely, for larger, more complex financings where efficient servicing is required and demanded, crowdfunding does not seem poised to challenge traditional lending. For borrowers seeking an easier end-user experience or requiring a sophisticated CRE lender, crowdfunding as currently constituted is unlikely to provide a particularly attractive debt strategy. Moreover, even if it were, it is likely that regulators would view any crowdfunding arrangements with scrutiny. The uncertainty surrounding crowdfunding may dissuade institutional borrowers from using crowdfunding, as stability in lending is valued greatly by these borrowers. So in the larger CRE financings, there is no need to disperse the crowd because the crowd is unlikely to gather in the first place.
1 Drake, David. “CROWDFUNDING: IT’S NO LONGER A BUZZWORD”. http://www.crowdsourcing.org.
2 Brian Crecente (24 August 2013). The Veronica Mars Movie Project: https://www.kickstarter.com/projects/559914737/the-veronica-mars-movie-project?ref=discovery.
3 Catherine Clifford (19 May 2014). http://www.entrepreneur.com/article/234051?newsletter=true “Crowdfunding Generates More Than $60,000 an Hour (Infographic)”. Entrepreneur. Entrepreneur Media, Inc.
4 See, http://www.crowdcrux.com/top-real-estate-crowdfunding-websites/.
5 Pub. L. No. 112-106, 126 Stat. 306 (2012).
6 See, e.g., 158 CONG. REC. S1781 (daily ed. Mar. 19, 2012) (statement of Sen. Carl Levin) (“Right now, the rules generally prohibit a company from raising very small amounts from ordinary investors without significant costs.”); 157 CONG. REC. H7295-01 (daily ed. Nov. 3, 2011) (statement of Rep. Patrick McHenry) (“[H]igh net worth individuals can invest in businesses before the average family can. And that small business is limited on the amount of equity stakes they can provide investors and limited in the number of investors they can get. So, clearly, something has to be done to open these capital markets to the average investor[.]”).
7 Section 4(a)(6) imposes the following limits on investments from any investor within any 12-month period: (i) the greater of $2,000.00 or 5% of the investor’s annual income or net worth, if the annual income or net worth of the investor is less than $100,000.00, or (ii) the greater of 10% of the investor’s annual income or net worth (not to exceed an amount sold of $100,000.00), if the investor’s annual income or net worth is greater than $100,000.00
8 (Release No.33-9470) http://www.sec.gov/rules/proposed/2013/ 33-9470.pdf.
9 As of the date of this article, Alabama, Maine, Michigan, Texas, Washington, Wisconsin, District of Columbia, Idaho, Indiana, Massachusetts, New Mexico, Oregon and Pennsylvania have either adopted or proposed rules and laws similar to the Crowdfunding Proposed Rules.
10 Solomon, Steven, S.E.C.’s Delay on Crowdfunding May Just Save It. http://dealbook.nytimes.com/2014/11/18/s-e-c-s-delay-on-crowd-funding-may-just-save-it-2/?_r=0.
11 See CFR §230.501 and §230.506.
Crowdfunding: The Future of Commercial Real Estate Lending or Just a Voice Lost in the Crowd?

Morgan Stanley is a global leader in the origination, financing, securitization and trading of both commercial mortgages and commercial mortgage backed securities (CMBS). As a direct lender, Morgan Stanley provides expedient and attractively priced fixed and floating rate financings on a broad range of stabilized and transitional commercial property types worldwide.
Learn more at morganstanley.com/realestate.
GLOBAL LEADER IN COMMERCIAL REAL ESTATE
© 2
014
Mor
gan
Stan
ley
& Co
. LLC
. Mem
ber S
IPC.
8025579 FID Singh Finance World Corp Ad m1.indd 1 10/9/14 5:10 PM

CRE Finance World Summer 2015 30
O
ASERs 2.0: Who Gets the Short End of the Stick?
Leslie HaytonManaging DirectorWells Fargo Bank, N.A
Stacy AckernmanPartnerK & L Gates LLP
ne of the outcomes of the market downturn in 2007 was an increased focus on advances. Master servicers saw exponential growth in the liquidity needs of the CMBS trust, and as obligated by the Pooling and Servicing Agreements (“PSA”), master servicers advanced funds
accordingly. According to Trepp, the aggregate amount of outstanding advances increased from approximately $426 million in the first quarter of 2006 to approximately $617 million in the first quarter of 2008.1 Declining collateral values during the downturn created a surge in the use of the Appraisal Reduction Amount (“ARA”)2 and Appraisal Subordinate Entitlement Reduction (“ASER”) mechanics in PSAs. The use of ARAs and ASERs is described in further detail below but ultimately may result in a reduction of the amount of interest a master servicer advances as part of a principal and interest advance (“P&I Advance”). Between CMBS 1.0 and 2.0 there was a change in the priority of ASER recoveries such that in most CMBS 2.0 PSAs, certain loan recoveries (primarily liquida-tion proceeds) are allocated in those deals to unpaid principal instead of being allocated as a recovery of prior interest shortfalls to subordinate certificateholders. We as an industry need to be prepared for the practical application of this waterfall change and the implications thereof.
The calculations of both an ARA and subsequent ASER are defined in most PSAs and are tied to the decline in the value of the underlying collateral. An ARA is triggered when a certain specified event (“Appraisal Reduction Event”) occurs. An Appraisal Reduction Event typically includes certain modifications, a transfer to special servicing, bankruptcy and payment defaults. Following the occurrence of an Appraisal Reduction Event, a new appraisal is ordered and any ARA is recalculated as prescribed in the PSA. In its simplest form, an ARA is calculated as follows: (outstanding principal balance plus outstanding advances and interest on advances) minus (90% of the appraised value + escrows). If a new appraisal is not obtained within a specified period of time, most PSAs allow for an assumed ARA of 25% of the outstanding principal balance of the loan. If the outcome of this exercise is positive, it indicates that the value of the underlying property does not currently support the debt outstanding. Each monthly P&I Advance will therefore be reduced by the shortfall as calculated by the ASER. The ASER is typically calculated as (ARA/Scheduled Principal Balance) * Net
Scheduled Interest. This reduced P&I Advance results in less cash flow being sent to subordinate tranches during the normal monthly remittance cycle in recognition of the decline in collateral value and potential future loss.
It is important to understand the cash flows of the CMBS transaction and the implications of an ASER on the deal cash flows prior to liquidation. The bond waterfall calculations allow for the shorted interest due to the ASER to reduce the cash flows to the most subordinate bond classes. It should also be noted that once a master servicer deems a loan non-recoverable, the point is moot since the master servicer has stopped making P&I Advances. There were no changes to the calculation and impact of the ASER in the ongoing cash flows of a deal in CMBS 2.0 versus CMBS 1.0.
Once a loan with an ASER is liquidated, most CMBS 1.0 deals provide for the recapture of the ASERs prior to the allocation of proceeds to principal repayment but after the recovery of servicer advances, liquidation fees and other holdbacks. The outcome of this basically wiped out everything that was intended to happen with the ASER. Subordinate classes which previously absorbed shortfalls are then reimbursed for their shortfalls as opposed to directing the funds to senior classes as principal. In addition to delaying the principal repayment to senior classes, this increases realized losses to subordinate classes, thus reducing the credit support across the structure and potentially affecting controlling class rights.
If the goal of the ASER was to account for expected losses due to the declining value of the collateral and prevent enrichment to the subordinate classes at the expense of principal bond holders higher in the capital stack, this ASER/ARA mechanism in CMBS 1.0 deals (combined with the liquidation proceeds definitions within the PSAs) has failed its goal.
The CMBS industry is constantly evolving to meet the demands of investors and adjust for the changing marketplace. PSAs, while individual to each issuer, all typically contain certain industry-wide concepts. When an adjustment is needed, all PSAs will eventually conform to the new market standard. We saw this with the introduction of Work-Out Delayed Reimbursement Amounts

A publication of Summer issue 2015 sponsored by CRE Finance World Summer 2015
31
(“WODRA”) to the PSA in late 2003. WODRA provided a mechanism for master servicers to recover advances from principal collections first as the result of workouts in which the applicable borrowers were specifically obligated to pay such advances. In CMBS 2.0 PSAs (mostly PSAs issued 2010 or later), the industry adjusted the waterfall for liquidation proceeds to properly account for the intentions of the ASER. In the new PSAs, recoveries of ASERs are after principal repayments, allowing for higher rated bonds to recover their principal before subordinate classes recapture interest.
Whereas CMBS 1.0 PSAs generally directed that recoveries on any loan be allocated to unpaid interest prior to being allocated to unpaid principal, CMBS 2.0 PSAs generally (and particularly with respect to liquidation proceeds) direct that recoveries on any loan be allocated to unpaid interest less the portion of any interest that was not advanced due to an Appraisal Reduction Amount (Appraisal Reduced Interest) prior to being allocated to unpaid principal and then only allow for allocations to recover Appraisal Reduced Interest once unpaid principal has been recovered in full. The impact of this change is illustrated below in the comparison of the hypothetical liquidation waterfall with outstanding ASERs in CMBS 1.0 and CMBS 2.0 deals.
Exhibit 1
As illustrated above, in CMBS 2.0, the principal loss to the trust is less than in CMBS 1.0 due to the ASER recovery mechanics. In CMBS 1.0, the ASER recovery would have been passed through to the subordinate bond holders instead of the more senior bond holders. Allocating the first loss to the most subordinate bondholders is the true intention of the ASER concept.
This change to waterfall calculations will have a substantial impact on many different CMBS constituents. We have not yet seen any post-CMBS 2.0 losses that would follow this new waterfall convention; however as an industry it is time for us to be prepared for the first one. Master servicers, special servicers, trustees, and certificate administrators should be training their staff on what to look for in the PSA to make sure they are following the proper conventions. The CREFC IRP committee needs to revisit the current Realized Loss Templates to determine if adjustments are required to handle the reporting for this allocation. Rating agencies must make sure their models are aligned with the PSA waterfall definitions to properly account for the potential impacts. Lastly, investors need to be aware of which of their holdings could potentially be impacted by these changes. Proactively addressing this change will prevent us from marketplace surprises, something no one in the CMBS industry wants to see.
1 See Trepp Outstanding Advances. Excel Spreadsheet (Trepp, LLC, New York, N.Y.), March 24, 2015.
2 According to Trepp, LLC data the total amount of ARAs (in 000s) for (1) loans originated in 2006 is $2,232,505, (2) loans originated in 2008 is $2,484 and (3) loans originated in 2010 is $570. See Origination Year by Appraisal Reduction Stratification Matrix. Excel Spreadsheet (Trepp, LLC, New York, N.Y.), March 24, 2015.
ASERs 2.0: Who Gets the Short End of the Stick?

CRE Finance World Summer 2015 32
uring the crisis, the regulators aimed for model accuracy as their guideline toward normalization of the marketplace. To jump start the process, regulators applied stress tests to aid in price discovery and to rebuild capital. They also set about developing Basel III to permanently close off
regulatory capital arbitrage loopholes identified in the crisis.
Their thesis was that first, if everyone could agree on the fundamental value of an asset then, where necessary, troubled assets could be cleared through the system. Secondly, if more sensible capital charges could be assessed, then the public’s confidence could be restored in critical financial institutions.
While not the source of contagion in this latest cycle, commercial real estate (CRE) assets were treated with especial vigor. The stress tests forced relatively aggressive revaluations of legacy CRE assets, and risk-based capital reforms are encouraging capital levels permanently higher along a number of dimensions.
And yet, the Financial Stability Oversight Council (FSOC) and the Office of Financial Research (OFR) have never outed CRE as a source of systemic risk. Each of these bodies publishes an annual report, which is really more of a review of accomplishments during the year combined with a risk assessment of the global markets. None of these reports, at least not as of their most recent, the OFR’s December 2014 annual, suggests that the CRE sector poses a threat to financial stability.
Considering that our European counterparts take a very dim view of CRE, it is interesting to note that for the U.S. regulators, one of CRE’s minuses may be protecting it from a systemic risk label. Unlike other traded credit classes, CRE products resist product standardization, and therefore are limited in the degree to which they can be integrated into faster-paced trading strategies. Other product sets that are more actively traded have attracted a considerable amount of attention from the regulators.
From a systemic risk perspective, CRE debt’s idiosyncratic nature can be viewed as a strength. If all of our financial products were standardized enough to be actively bought and sold, then the system as a whole would be relatively more exposed to herding behavior. By this measure, CRE represents a stabilizing influence, because our investors can be counted upon to be somewhat less reactive in bad times.
But, enough is often not enough. In their April 6, 2015 Liberty Street Blog post, members of the New York Fed’s Research and Statistics Group made the case that over time, the stress tests are yielding some convergence between regulatory and bank models.
This would be expected, as banks would naturally try to anticipate their supervisors’ requirements in order to pass the tests. However, according to this recent analysis, the two sides remain farther apart still on net charge-off estimates, and especially those related to CRE loans. That’s not good news for commercial real estate lending.
Chart 1Breakdown in Differences in Net Charge-Off Projections
Source: Authors’ calculations
On the surface of things, variance between the regulatory and the industry models can suggest poorly quantified risk-taking on the part of the banks. Potential model inaccuracies gained attention well before this spring with earlier analyses by the Basel Committee on Banking Supervision (BCBS). As part of their efforts to further refine Basel III, the BCBS has run a series of analyses of bank capital estimations over time to learn more about bank practices. At least on the surface, the BCBS has found that despite the rollout of Basel III, many jurisdictions continue to view capital requirements differently. Looking below the surface, however, these differences do not necessarily mean anything other than the portfolios in question might not be as similar as we think.
To determine whether model variances are a sign of accuracy or of aggressive risk-taking, further work needs to be done. A model used to estimate capital requirements for a CMBS portfolio in the U.S. may act differently than a model used to estimate capital for CMBS in Italy. Both models could be equally robust, yet the underlying risks are very different, which could explain even large variances in capital requirements.
Nuances in product type, market functioning, legal system, and other factors could easily account for differentials in model output across banks and especially across jurisdictions. Concluding that these variances are a sign of problems with the models may be ignoring valid differences in portfolio fundamentals, and the regulators may be promoting conservatism over accuracy. Yet, the
D
CRE as a Source of Systemic Risk: How Normative Should the New Regulatory Norms Be? Christina Zausner
Vice President, Industry and Policy AnalysisCRE Finance Council

Join us for specialized education, knowledge sharing and networking!
Get all the details and register now at: www.appraisalinstitute.org/annualmeeting
July 27-29, 2015Sheraton Dallas | Dallas, Texas
2015 Appraisal Institute Annual Meeting
Attention commercial real estate professionals! Join your peers at the Annual Meeting for education designed especially for you, including:
• That’s Logistics: The Valuation of Warehouses• Going-Concern Gas Station Appraisal• Green Features: Coming Soon to a Building Near You!• Valuation and Market Analysis of Seniors Housing Properties
Co ectAI®
Where people and ideas come together.

CRE Finance World Summer 2015 34
regulators typically do not provide the depth of analysis necessary to explain model variances, though international working groups have consistently requested that they do so.
Yogi Berra summed it up pretty well, when he said, “If you don’t know where you are going, you might end up someplace else.” For some, the idea of accuracy may have been more palatable before the propensity for dispersion was made plain.
To get back to that place they had imagined the regulators have a couple of tools at their disposal. Firstly, they can seek convergence through the stress tests by encouraging the banks to agree to more conservative charge-off assumptions. Since their introduction in 2009, the stress tests effectively guided capital estimates higher by forcing banks to use compromise assumptions that blend peak and trough conditions. Secondly, for more consistency in the capital regime ongoing and across a greater number of institutions, the regulators are also preparing to interject a set of floors into the internal models approach for Basel III risk-based capital. Going forward, the Basel floors would effectively set a bottom limit on the amount of capital that could be assessed, no matter what an internal model might suggest.
While the regulators clearly believe that further conservatism at the banks is necessary, there is a growing concern that the authorities are breaching an historic and foundational divide between themselves and industry. Even without further adjustments to the capital regime, regulators have become integrally involved in balance sheet allocation decisions and are therefore influencing strategic decision-making.
Extending this idea out, regulators across jurisdictions are encouraging decision-making at the banks that will lead to a new set of challenges for the financial system:
• At the asset class level, the regulators will likely seek more conservative charge-off assumptions for CRE in the 2016 stress test, since they went out of their way to point out these particular variances. Earnings are a source of stability in and of themselves and there is little proof that the regulatory methodologies are more accurate than the industry’s.
• At the banking system level, model convergence can encourage risk concentrations of assets, maturities and counterparties, all of which can serve as triggers for herding behaviors.
• At the systemic level, the transfer of CRE lending from the banking sector to the nonbanks should gain additional momentum. At the same time, regulators have highlighted this shift in recent speeches and papers, including those delivered at the spring World Bank — IMF meetings, emphasizing that disintermediation requires careful monitoring.
Offsetting variances in internal models will come at a price of additional regulatory burden and changes in the nature of risk. The decision to make convergence the norm risks compromising the progression toward model accuracy and the diversity of behaviors in CRE lending. Without better justification, especially while so many other pieces of regulation are still washing through the system, this is the time to step back and to observe market reactions before fixing reforms that have yet to be fully implemented.
CRE as a Source of Systemic Risk: How Normative Should the New Regulatory Norms Be?

A publication of Summer issue 2015 sponsored by CRE Finance World Summer 2015
35
or this article, we examine the CMBS 2.0 “State of the Market” and have brought together industry leaders who not only shape and define the CMBS market but who also represent different segments including investment (from AAA to Mezzanine), origination, distribution, trading
and special servicing. With 2015 CMBS origination already 33% ahead of 2014 levels, delinquencies reaching new lows and loans in special servicing at approximately half of peak levels, we wanted to explore where the current opportunities (and risks) are, where we are in the cycle, current challenges, and what “keeps us up at night.” Our participants included:
Matt Borstein — Head of Commercial Real Estate Lending, Deutsche Bank
George Carleton — Executive Managing Director, C-III Capital Partners
Michael Nash — Senior Managing Director, Blackstone Real Estate Debt Strategies
Rich Sigg — Head of CMBS trading, Bank of America Merrill Lynch
The consensus observations were that real estate fundamentals are strong and continue to improve, low interest rates will be here for some time, valuations will continue to climb and that transactions are generally more conservative and better structured than 2006/7, but that credit standards continue to gradually loosen. Global factors, including interest rates, the price of oil, currency fluctuations, and the emergence of the sovereign buyer are creating new challenges and paradigms, and all agreed that CMBS (and related commercial real estate debt) continues to provide compelling values “across the stack” if you know where to look and are able to maintain discipline.
Where are we in the Cycle?All of our participants agreed that we are still early (fifth or sixth inning) in the cycle for real estate fundamentals and that as the U.S. economy continues to improve/expand, so too will property occupancies, rent rolls and cash flows. While valuations are currently on the high end due to a combination of low interest rates and an influx of foreign capital, leverage levels are comparatively modest, particularly as compared to the 2006/7 vintages as illustrated by the valuations and leverage points for the ESA Portfolio depicted below.
Exhibit 1ESA Comparative Capital Structures 2015 vs 2007
Sources: Various Offering Circulars, Public Information & Talmage ResearchThe Extended Stay America Hotel Portfolio is used for this illustrative example.
Additionally, new, larger “permanent capital” buyers with longer holding horizons have replaced the heavily leveraged buyer of the pre-financial crisis days. “You can’t compare today’s long-term, highly capitalized, and generally conservatively leveraged investors with the individual pre-financial crisis buyer of 2007 who was beholden to the capital markets at a 6x leverage ratio. While prices are higher, the structures are fundamentally more stable,” noted Michael Nash from Blackstone.
It was also observed that we are now living in a global property market where prices in New York are not only being compared to other U.S. gateway cities but also to their international counterparts such as London, Hong Kong and Tokyo. On this new metric, which may take a certain amount of acclimation, the consensus was that the U.S. remains fundamentally cheap — though “rich” to historical levels.
Exhibit 2Global Class A CBD Office Rental Rates and Valuations
Source: World Property Journal, CBRE
F
CMBS 2.0 — State of the Market 2015
Ed Shugrue IIICEOTalmage LLC

CRE Finance World Summer 2015 36
How is Today Different from 2006/2007?The consensus was that we are in a totally different, more rational and more stable market today than in 2006/7. Our panelists cited several reasons, all of which serve to protect the stability of today’s market:
1. More Dealer Discipline. CMBS conduit transactions are smaller (see below) and are issued more rapidly since dealers are less willing to retain/warehouse inventory.
2. More Control from CMBS Buyers. Today’s ‘AAA’ and ‘AA’ buyers are able to exert more influence on CMBS credit quality — rewarding stronger transactions and punishing weaker ones — resulting in higher and more consistent asset quality.
3. Less Leveraged Buyers. Particularly in larger loans, gone are the days of unlimited leverage.
4. Better Ratings. New rating agencies have emerged post financial crisis and have created a healthier and more competitive ratings market benefitting investors.
The CMBS spreads, issuance levels, average transaction sizes and debt service coverage levels of today are presented as compared to 2007 levels.
Exhibit 3CMBS Metrics — 2015 vs 2007 ($ Billions)
Source: CMA, Talmage Research
“From the issuer’s perspective, all of us have several constraints (regulatory, balance sheet, risk management, etc.) that are forcing us to be very careful on asset selection and to be disciplined about securitizing, or otherwise disposing of inventory, in a timely fashion — this is healthy for the markets,” commented Rich Sigg from Bank of America Merrill Lynch. Indeed, others agreed that dealers have been very mindful of inventory levels and have been better at partnering with buy-side investors as opposed to being an outright competitor.
Rates – How low can you go?As noted below, global interest rates are at historically low levels, and in the case of Switzerland, negative levels. Given the large scale and liquidity of the U.S. investment market, the U.S. has attracted unprecedented amounts of foreign capital which has fundamentally altered traditional equity valuation metrics. While our participants agreed that the “V” in loan-to-value was reaching record territory for Class “A” properties in gateway cities, all agreed that those investments were supported by substantial equity contributions and comparatively modest leverage ratios.
Exhibit 4Ten-Year Sovereign Treasury Yields (April 2015)
Source: Bloomberg
Low interest rates, it was felt, have also acted as a governor to the recovery of CMBS spreads which appear to be “range bound” at swaps+80, as compared to swaps+30 pre-crisis, as CMBS investors struggle with minimum “total return” thresholds. Despite outsized CMBS spreads (as compared to pre-crisis spreads), everyone agreed that given the combination of low interest rates, easy monetary policy and investor demand for yield product, the current environment represents an outstanding time to finance real property.
Further, despite a healthy and recovering U.S. economy, coupled with clear pronouncements from the Federal Reserve that easy monetary policy would be ending, our panel felt strongly that foreign capital would keep U.S. rates range bound at current levels for the foreseeable future, other things being equal.
A “Three Tier” Market?Despite the rising tide that lifted all boats equally pre-financial crisis, our participants felt that the commercial real estate market in 2015 has evolved and been refined into a three-tier market of clear winners, losers, and the overlooked assets stuck in the middle.
CMBS 2.0 — State of the Market 2015

A publication of Summer issue 2015 sponsored by CRE Finance World Summer 2015
37
The Top Tier. The top tier markets/assets are in the 24/7 “inter-national” gateway cities led by New York City (driven primarily by the international buyer, the availability of trophy acquisitions and the lack of new supply), San Francisco (driven more by technology and its in-fill location), and South Florida driven primarily by the Latin American buyer. Common themes are shared by these three markets: 1) attraction of foreign capital, 2) in-fill locations with barriers to entry, and 3) limited supply of available assets. In an increasingly global world, domestic buyers are competing vigorously for real assets with foreign capital which often has exogenous reasons for investing in the U.S., including capital safety and sovereign diversification.
The Bottom Tier. The bottom tier represents the assets with the highest loss severities and the assets that were indiscriminately lifted with the rising tide of valuations leading up to the financial crisis. These assets represent the third mall in a one-mall town, the last limited service hotel built on the edge of town, and many assets trapped in those cities and suburbs experiencing negative growth and/or bankruptcy, including cities such as Detroit. These assets are experiencing the highest loss severities (often approaching 100%) and are the loans that have taken on permanent residence in special servicing and will be the last assets of the trust to be resolved. Often performing until they are not, these assets have provided many unhappy endings for CMBS investors.
The Middle Tier. Assets in this tier have been overlooked and are somewhat flying under the radar. They may represent assets in markets such as Atlanta, Dallas and southern California. To be clear, not all assets here will succeed but managers who can identify the diamond in the rough in these markets will be handsomely rewarded.
As the real property (and CMBS) markets continue to become more clearly stratified and tiered by asset, CMBS investors will be rewarded and/or punished for their ability to select the winners and emerging winners from the middle tier as well as to avoid the lower tier assets. “We are focusing on the middle-tier markets and working hard to find the winners there,” commented George Carleton from C-III. “This is the area in CMBS where we are finding the most value added. It is overlooked at the moment and requires substantial local knowledge.”
Where are the Opportunities?With CMBS spreads and volumes having recovered significantly since 2009, all of our participants lamented that it has become increasingly difficult, though still possible, to generate outsized returns in CMBS and commercial real estate debt. As spreads have improved, the CMBS market has evolved from a “commodity”
market with many hot money managers replacing traditional investors, to a specialist market requiring the combined skills of deep real estate know how, coupled with bond structuring capabilities. Among our participants, four general areas of opportunity emerged, domestically.
Transition Lending. Transition lending, as well as construction lending in top tier cities, is seen as an excellent current opportunity. These kinds of loans do not fit in CMBS and are often challenging for a traditional bank or life insurance company to provide efficiently or in a timely fashion. While transition lending has long been a staple of opportunistic lenders, construction lending represents a new frontier for non-traditional lenders.
Risk Retention Arbitrage. Our panelists saw an opportunity to acquire subordinate CMBS and “B-Pieces” ahead of the adoption of Risk Retention in 2016 as these investments will carry greater liquidity and tradability and will therefore contain substantial trading upside. It was also felt that the credit quality of these investments for the recent vintages was much stronger than their cohorts in CMBS 1.0.
Manufacturing Mezzanine. As Mezzanine loans have come back into vogue and pricing has continued to tighten, an opportunity has been identified to originate the whole loan, sell the senior and retain the resulting highly-customized Mezzanine loan with premium pricing. It was observed that the senior portions of such loans could be sold directly (to either a portfolio lender or into a CMBS securitization), or indirectly via a CLO or CDO financing which has made a comeback in 2014/2015.
CMBS “Legacy” Markets. Finally, all agreed that multiple opportunities remain in the CMBS “Legacy” market for those investors with the expertise to sift through the collateral and identify undervalued assets. Structured Investment Vehicles (SIVs) seized during the financial crisis, as well as “hot money” investors, are providing a steady stream of legacy CMBS opportunities to the secondary market. Additionally, as banks and dealers are facing increasing capital pressure, their CMBS inventories must be kept lean, creating opportunities for longer-term investors.
While the market opportunities are changing daily against an increasingly volatile and globally interconnected investment universe, CMBS, and related real estate debt (such as transition loans), continues to present attractive investments for seasoned investors with the requisite expertise and discipline. “We are fortunate to be in a strong capital position and to have a steady track-record of lending in the U.S. which affords us the opportunity to expand our lending envelope to more transition oriented lending
CMBS 2.0 — State of the Market 2015

CRE Finance World Summer 2015 38
with top tier sponsors,” commented Matt Borstein, the Head of U.S. Lending for Deutsche Bank, the most active U.S. CMBS loan contributor in 2014 and thus far in 2015.
Where are the Risks?Having enjoyed fairly consistent spread and origination improvement since 2009, where are the current risks in CMBS? Our panelists saw CMBS as having substantial stability and generally better asset quality than CMBS 1.0 but saw the major risks facing CMBS as fourfold:
A Bolt from the Blue. Everyone saw “A bolt from the blue” as the greatest risk facing the CMBS market and the hardest to predict/prepare for. All acknowledged that we are living in an increasingly volatile world and that despite strong underlying fundamentals, CMBS could experience significant price fluctuations from various “outside” events whether the collapse of the Euro, a terror event, or the price of oil.
Interest Rates. While everyone expected rates to be “range bound” for some time and any increases to be fairly well announced and gradual, all expressed concern of the unintended consequences of a sharp and sustained spike in U.S. interest rates for CMBS.
Discipline. Substantial concern existed regarding the market “losing discipline.” Post financial crisis, the CMBS market and its participants, whether investors, dealers or rating agencies, have been conservative and disciplined in their asset selection, underwriting and investment approach. All panelists registered concern about losing discipline using phrases such as “slippery slope”, “bracket creep” and “boiling frogs” to express their trepidation.
Third Tier Assets. Concern was raised about the potential impact of the third tier assets on loss severities in CMBS, particularly during the “wave of maturities” in 2016/7 and the echo impact that may have on CMBS, generally.
Concerns were generally forward looking and focused on items beyond the market’s control such as interest rates and a bolt from the blue. All took comfort from the strength and stability of underlying property fundamentals as well as the maintenance of discipline, across the board, at least for the time being. “While discipline is here at the moment,” commented Rich Sigg from Bank of America Merrill Lynch, he also noted that, “as investors stretch for yield, they continue to move further out on the risk spectrum and into increasingly “cuspy” investments.”
We’re all globally connectedCMBS, though mostly a U.S. asset class, has gone global, post financial crisis. CMBS are purchased by foreign investors, the underlying assets are owned by offshore buyers, valuations are impacted by international interest rates and monetary flows, unconnected to U.S. property valuations, can significantly impact CMBS prices and investors’ performance.
Top Tier U.S cities and properties, as noted previously, are playing catch-up to the international market, in terms of rental rates and valuations, and still have a long way to go. These new valuations, driven by offshore comparables, are changing property valuations across the country — positively for the “haves” and negatively for the “have nots”. CMBS investors will need to carefully monitor these trends.
How far new offshore valuations of U.S. property will reach, and their impact on CMBS, is unclear. However, all agreed that foreign capital appears to have found a permanent and growing home in the U.S. and that foreign dollars bring overlays of exogenous factors such as foreign currency, interest rates and political stability/instability as dynamic overlays into the property and CMBS markets.
ConclusionsThe CMBS market is in a good place. New issuance is matching maturities and the overall size of the market has stabilized and begun to grow again. Delinquencies continue to decline, loans in special servicing are likewise decreasing and the “wall of maturities” is being whittled away, assisted by a historically low interest rate environment and by a global quest for yield. On the other hand, valuations are reaching all-time highs and global inter-connectedness is creating heightened volatility. Overall, four major themes emerged from our informal CMBS roundtable of market participants:
1. CMBS is part of a globally interconnected financial world, impacted by many factors unrelated (for better or worse) to the underlying health or performance of CMBS or its collateral;
2. Volatility is on the rise and with many indices at record highs (such as the Dow Jones, Class A office prices) or record lows (such as interest rates, the price of oil, and the Euro), CMBS is impacted by sharp changes in these markets;
3. Continued discipline — by investors, issuers and rating agencies — will be essential to the continued health and prosperity of CMBS; and
CMBS 2.0 — State of the Market 2015

A publication of Summer issue 2015 sponsored by CRE Finance World Summer 2015
39
4. Opportunities continue to exist in CMBS, and related privately-traded commercial property debt, for seasoned investors with strong underwriting skills, real estate know how and discipline.
In our sixth year following the Global Financial Crisis, CMBS has recovered steadily and found a healthy “new normal” in terms of annual issuance, spreads, subordination and asset quality. CMBS is beginning to grow again and growing with new investors and borrowers. It will be up to the market participants to maintain discipline, lending standards and asset quality. Disruptions, of
course, will occur in the ordinary course, often due to outside events. These events will create short-term windows of meaningful opportunity for those prepared to dive in.
Edward L. Shugrue III is the CEO of Talmage, LLC. Talmage is an independently owned commercial real estate investor and Special Servicer. Talmage professionals have made in excess of $10 billion of real estate debt investments and acted as the Special Servicer or advisor on over $40 billion of loan resolutions. Talmage is headquartered in New York City. www.talmagellc.com
CMBS 2.0 — State of the Market 2015
At UBS, we have built our
business around you.
Whether you’re looking for investment banking, equities, fixed income or foreign exchange services, we have the
global strength and industry experience to deliver.
What’s more, we provide expert advice, innovative solutions and outstanding execution tailored to our clients’ needs.
Providing the tools to succeed, today and tomorrow.
www.ubs.com
© UBS 2015. All rights reserved.

CRE Finance World Summer 2015 40
s students continue to arrive on college campuses across the country every fall, developers have continued building apartment complexes to keep up with demand for student housing, resulting in a large spike in off-campus construction in the last several years. According to a March 2015 article
in the National Real Estate Investor, developers added approximately 60,000 and 63,000 beds to the student housing inventory in 2013 and 2014, respectively. While construction ahead of the 2015-2016 school year is expected to be lower at just 48,000, this still exceeds inventory growth for this property type at the peak of the market in 2008. The CMBS industry has also seen an uptick in the number of student housing properties being securitized in transactions. Based on a study of loan data conducted by DBRS, the increase of these securitizations seems to mimic the frequency of watchlist, delinquency and special servicing events associated with student housing properties across CMBS transactions issued in 2010 and later. This would lead one to believe that loans secured by student housing properties are more prone to default than those secured by traditional multifamily properties.
Exhibit 1US CMBS: Student Housing (% of total Multifamily Issuance)
As a sub-category of multifamily properties, student housing assets have been deemed by DBRS to carry a greater probability of default given their vulnerability to shifts in occupancy and cash flow. All leases generally start and expire in the same month, depending on whether nine-month or 12- month leases are required. If an operator misses during the critical, concentrated leasing period for college students who need to secure housing ahead of the fall semester, it becomes challenging to make up the lost ground during the school year and maintain market rental rates. In comparison,
traditional multifamily properties benefit from a more diverse tenant profile with lease expiration dates that are spread more evenly throughout the year. The result is two-fold: greater occupancy volatility and greater cash flow volatility for student housing properties compared to non-student housing properties.
The graph below compares the volatility1 of occupancy and net cash flow between student housing and non-student housing properties securitized in CMBS transactions since 2010. The year-over-year occupancy and net cash flow changes were calculated using the FYE financials as reported in the investor reporting package (IRP) for each financial year reported.
Exhibit 2US CMBS: NCF & Occupancy Volatilities for SH/NonSH
Perhaps the most significant performance factor for any student housing venture is its proximity to a college campus. This geographic limitation means that developers have had to find other ways to market a property’s appeal. Many in the industry have commented on the growing list of demands student tenants bring to the table. These include tenant lounges, resort-style pools, game rooms, fitness centers, tanning beds, campus shuttles and high end finishes such as granite counter tops, stainless steel appliances and upgraded flooring. It is not uncommon for property managers to offer leasing incentives such as gift cards or flat-screen televisions, and many, if not all, of these amenities are deemed necessary to remain competitive as new student housing properties are added to the market. It would follow, then, that replacement costs and operating expenditures for these properties are higher than those that do not cater to students.
A
Student Housing Performance in CMBS
Jorge LopezFinancial Analyst, Global CMBS, Global Structured FinanceDBRS
Roxanna TangenAssistant Vice President, Global CMBS, Global Structured FinanceDBRS

A publication of Summer issue 2015 sponsored by CRE Finance World Summer 2015
41
Exhibit 3US CMBS: Annual Revenues and Expenses per Unit for SH/NonSH
DBRS sampled all multifamily properties securitized in CMBS deals of all vintages and based on borrower reported financials (rather than servicer normalized), found that the expense ratio between student housing (44.2%) and non-student housing properties (45.2%) are essentially the same. The overall operating expense on a per unit basis was found to be $5,808 and $4,881 for student housing and non-student housing properties, respectively. Looking at income, annual revenue per unit was also found to be higher for student housing properties ($10,045) versus non-student housing properties ($9,443). The data does suggest, however, that reported replacement costs were are on average 20.6% higher for student housing properties ($268.25 per unit) than non-student housing properties ($222.47 per unit). While there are some in the market, including DBRS, which underwrite above-average capital expenditures on properties with student concentrations in order to reflect this trend, it is not a method employed universally among lenders.
Exhibit 4US CMBS: CapEX & Expense Ratio for SH/NonSH
In legacy CMBS (transactions issued prior to 2010) student housing properties have roughly the same probability of loss (10.3%) when compared to non-student housing multifamily properties (11.1%); they have a similar albeit slightly higher loss severity (53% vs. 49%) . However, there is reason to suspect that CMBS 2,0 student housing is different than the legacy student housing and that its performance will be different than non-student housing multifamily going forward. As noted in the graph below, the watchlist rate for student housing properties securitized in transactions issued in 2010 through present day is significantly higher than the watchlist rate for non-student housing multifamily properties.
Exhibit 5US CMBS: Student Housing Watchlist Rate Since 2010
Breaking out those transactions issued by Freddie Mac, the trend continues, which is interesting given the agency’s well-defined lending guidelines. In the CMBS industry, it is widely believed that Freddie Mac, and its GSE sister, Fannie Mae, is offered the first look to lend on multifamily properties because of its attractive cost of capital and therefore can be selective in its lending practices. The elevated watchlist rate of even Freddie Mac loans secured by student housing properties versus non-student housing multifamily Freddie Mac loans further perpetuates the perception of increased volatility associated with these assets.
Student Housing Performance in CMBS

CRE Finance World Summer 2015 42
One can argue that there are non-performance related reasons a loan may be flagged by the servicer for watchlist status, including borrower issues and upcoming maturity. Upon further analysis, DBRS has concluded that most of the loans included in the count above are currently on the watchlist for performance-related issues. CREFC guidelines dictate that properties experiencing a substantial decline in occupancy may be flagged for the watchlist, though the investor reporting package does not account for seasonality. Given the nature of student housing, it is common that these asset types experience higher vacancy during the summer months. Freddie Mac generally requires that its borrowers submit financial reports on a quarterly basis, which would theoretically lead to a rise of loans secured by student housing properties flagged for occupancy issues in those quarterly reporting periods that fall during the summer months. Based on its review of the data, DBRS does not believe seasonality to be a driving factor behind the propensity of student housing properties to fall on the servicer’s watchlist. Beyond the watchlist, loans secured by student housing properties also experience delinquency and special servicing transfers more often than loans secured by traditional multifamily properties, as illustrated in the charts below.
Exhibit 6US CMBS: Student Housing Delinquency Rate
Exhibit 7US CMBS: Student Housing SS Rate
As long as university enrollment continues to increase and on-campus development remains stagnant, developers of off-campus student housing will continue to see business opportunities. It would stand to reason that the largest and most popular universities will support a more sustainable student housing market. This opinion is echoed by senior industry professionals, who regularly prefer large schools in states such as Texas, Florida and Virginia, where student enrollments and demand for housing continues to rise. The expectation for new construction and increased competition means that owners will need to constantly invest in their properties to remain viable in the student housing sector with the added challenge of convincing tenants and their cosigners that the upgrades are worth the rising rental rates. DBRS does not expect to see a slow-down in the securitization of student housing collateral in the near term, but will continue to view this particular property type as being susceptible to higher credit risk than traditional multifamily. Since demand is directly correlated with college enrollment, greater volatility in occupancy rates and net cash flow and historic performance issues is to be expected.
1 As measured by the standard deviation of annual cash flow changes for all post 2010 CMBS student housing properties.
Student Housing Performance in CMBS

A publication of Summer issue 2015 sponsored by CRE Finance World Summer 2015
43
ith approximately US $3.7 billion issued in 2014, the European market is a whopping US $78 billion short of its 2006 peak. With predictions of between US $5 billion and US $9 billion for Europe in 2015, now is an opportune time to take stock of the European CMBS
market and consider what is inhibiting its growth and what is likely to drive it forward.
Following the onset of the global financial crisis (GFC) in the summer of 2007, true primary issuance of CMBS remained dormant until Deutsche Bank brought to market Deco 2011-CSPK in June 2011 (Chiswick Park). Although the deal flow since has demonstrated that CMBS 2.0 is a useful and valuable funding tool for European commercial real estate (CRE), the volume of issuance over the past few years remains disappointing. In one sense, given the turbulent and fragile European economy that has presided over this period, it is not a surprise that CMBS (a product that was badly tarnished by the GFC) has failed to balloon. However given that CMBS, like any other capital markets instrument, is a product driven by market demand, a closer look at the drivers of originators, investors and borrowers alike will inevitably shed some light on the reasons behind the subdued level of issuance.
OriginatorsFor originators whose business model was to originate to distribute (primarily through CMBS), the decimation of the CMBS market at the onset of the GFC proved catastrophic. Unfortunately these players were left in the un-enviable position of having a significant CRE exposure on their balance sheet which they were incapable of off-loading due to tumultuous market conditions. Understandably, having been burnt by the originate to distribute model, a large number of once active players in the CMBS market either closed their CRE lending businesses or simply confined lending activities to core clients of the bank with the sole intention of holding such loans on their balance sheet. Given the significant shortage of originators with a CMBS exit in mind, it is therefore unsurprising that this has manifested itself in subdued levels of primary issuance.
With improving market fundamentals, an increasing number of market players that were formerly active in this area are announcing their intention to return to this space, which would clearly add a much welcomed boost to the level of primary issuance. Although the return by such players has been slow, they can be forgiven for being reticent, given that the following has made CMBS a lot more unwieldy:
• With Article 405 of the Capital Requirements Regulation requiring originators to retain a 5 percent net economic interest in CMBS, and given the regulatory capital requirements that apply with respect to retaining such an interest, there is now a new and significant cost to banks participating in the new vintage of CMBS deals.
• Given the cost of providing a liquidity facility, fewer third party banks are prepared to provide these. Therefore CMBS arrangers are invariably having to make internal arrangements for such a facility, creating another drag on the profitability of CMBS 2.0.
• There continues to be widespread regulatory uncertainty on both the capital treatment for holding CRE loans prior to a CMBS exit and for investing in CMBS notes.
• Given the increased breadth of CRE lenders in Europe, originators are increasingly facing stiffer competition on the sourcing of suitable CRE loans that are essential for an originator to execute a successful CMBS deal.
As demonstrated by those originators that are currently active in the CMBS 2.0 market, none of these factors can be considered insurmountable, but nevertheless they certainly make it harder and more of a challenge for banks to enter the market than was the case prior to the GFC. Although originators will continue to commit to this market, they are only likely to do so at a considered pace, the corollary of which is that the market is unlikely to witness a sudden surge of new entrants and therefore a surge in primary CMBS issuance.
InvestorsOne of the major impacts of the GFC on CMBS is the profound affect it has had on CMBS investors. Prior to the GFC, major investors (on behalf of banks) were the so-called SIVs (structured investment vehicles), however with a sudden rise of short term interest rates, the vulnerabilities of these vehicles were quickly exposed and with this came the vapourisation of an entire investor class. Similarly, insurance companies, who were another major investor in CMBS, have become stifled by the stringent requirements of Solvency II, which has effectively prevented them from investing in CMBS. However, despite these notable changes to the investor base, no CMBS 2.0 has so far failed due to a lack of appetite for the product and thus the diminutive volume of CMBS 2.0 cannot be attributed to lack of investor demand.
W
Some Crystal Ball Gazing on European CMBS
Iain BalkwillPartnerReed Smith

CRE Finance World Summer 2015 44
BorrowersIn the pre-GFC era, the main attraction to a borrower of a CMBS loan was the hugely attractive pricing compared to balance sheet loans. As interest rates rose in the months immediately prior the GFC, the attractive price offered by CMBS loans fuelled the exponential growth of the CMBS market with increasing numbers of borrowers seeking finance through this means. However today’s market is the complete antithesis of this with interest rates at record lows which, coupled with increased competition from lenders (especially the less regulatory constrained shadow banks), has enabled borrowers to obtain financing at record low rates without the need to turn to CMBS. Consequently, despite the re-opening of the CMBS market there is not the same appetite from borrowers for CMBS loans that generated the surge of issuance in the months prior to the GFC.
What are the drivers?ArrangersAlthough the level of CMBS 2.0 issuance has been low compared to the levels reached at the peak of the market, this is unsurprising given how few arrangers are bringing CMBS deals to the market. Inevitably over time, the number of arrangers will undoubtedly increase, providing a much needed boost to primary issuance however such players can also be forgiven for being reticent. The successful execution of multi-loan and multi-borrower transactions during 2014 is a much welcomed boost to opening up the market for new arrangers, as such deals demonstrate the market is not simply confined to sourcing and securitising a very limited stock of large loans but it has also given the nod to the securitisation of a portfolio of smaller loans.
InvestorsOn the investor side, with the continued low interest rate environment, the ECB’s introduction of large scale quantitative easing, and investors’ relentless search for yield, CMBS is increasingly looking like a desirable proposition for the fixed income investor. Unfortunately, due to the stuttering and lumpy nature of issuance over the past few years, investors have been reluctant to put in place the internal resources and infrastructure required to invest in this asset class with any real volume. If however, the market can demonstrate that
it is capable of delivering greater primary issuance with a smoother flow of deals, this will precipitate the deeper and stronger investor base required to absorb and competitively price the volume of deals that should hopefully be destined for the market.
BorrowersThe real driver for significant primary CMBS issuance is however likely to lie in the hands of the borrowers and their demand for better priced loans spurred on by a rising interest rate environment. However before CMBS becomes flavour of the month for such borrowers, the regulators will have to first clamp down on the shadow banks and through regulation erode the competitive advantage that they currently enjoy over traditional CRE lenders (although given the pace of regulatory change this is unlikely to happen anytime soon). With the levelling of the regulatory playing field and a rising interest rate environment, it is likely that borrower demand will drive the CMBS market and then once again we will see significant primary growth.
As has been demonstrated by the number and type of CMBS 2.0 deals that have hit the market since Chiswick Park, CMBS clearly has a role as a financing tool for CRE in Europe. In particular, CMBS has an integral role for financing those assets that would otherwise be more difficult (due to size of the loan or complexity of their underlying structure) for a bank to distribute in the syndication market.
It is inevitable, that with more arrangers in the market there will eventually be a greater volume of CMBS issuance. Equally with regard to the seasoned players, they will generate more deals as they become more efficient in executing transactions in various jurisdictions. However it will not be until interest rates start to rise and there has been a greater standardisation of regulations that apply to the shadow banks that we will start to see a meaningful increase in CMBS issuance. Although it is frustrating that there has not been a boom in primary issuance, this may not be a thing. The gradual growth coupled with the refining and finessing of structures that we are currently witnessing, will ultimately make European CMBS a far more sustainable and robust financing tool for CRE.
Some Crystal Ball Gazing on European CMBS

A publication of Summer issue 2015 sponsored by CRE Finance World Summer 2015
45
he recent drop in oil prices has been an unanticipated shock — or a happy welcome — to both local and national economies. The rise in North American oil production and a continued high level of output from traditional overseas oil producers, coupled with an expected lull in international
oil demand this year, has resulted in a worldwide supply glut. This glut has resulted in oil prices dropping to around $50 per barrel as of February 2015, down significantly from around $90-$100 per barrel during most of 2014. While prices have recently inched up from their nadir, market forecasters expect that prices should rise and settle at around $65 a barrel for the remainder of 2015.
Unfortunately, at $65 per barrel many North American drilling locations become uneconomical. In fact, a number are already being shuttered, most notably in North Dakota. At first glance, this might appear to potentially be alarming for multifamily investors as recent economic growth, and in turn, household growth, in several metros has been fueled by oil exploration and production via hydraulic fracturing, or “fracking.” In reality, these low oil prices will probably have more of an immediate and negative impact on the more volatile office and industrial sectors, since those property types will endure the brunt of rig closures and production slowdowns first, before the multifamily sector begins suffering from adverse demographic trends.
Fracking Created an Oil Boom in Certain AreasThe vast majority of recent U.S. oil production has come out of two states: North Dakota and Texas. The Bakken formation in the region surrounding Williston and Minot, North Dakota has been producing an estimated 1.2 million barrels of oil per day for the past several years, although that is expected to decline considerably this year. In Texas, the Permian, Eagle Ford, and Barnett formations have been producing around 3.4 million barrels per day. In comparison, the Marcellus and Utica formations in the greater Pittsburgh region, combined with the Niobrara formation in the greater Denver area, together produce fewer than 350,000 barrels per day, relying instead on primarily producing natural gas.
Exhibit 1U.S. Oil Producing Regions and Well Breakeven Costs
Source: CBRE Research, December 2014
Lower Energy Prices = Good News for the National EconomyLower oil prices are actually a net stimulus to the national economy, particularly for energy-importing metros. Because lower fuel prices allow consumers to enjoy more immediate disposable income, Moody’s Analytics estimates that the recent oil price decline will add anywhere from 0.25 percent to 0.75 percent to this year’s Gross Domestic Product, meaning that an impressive $165 billion is now available for consumers to spend in other ways than filling up the tank.
Potential Winners from Low Oil PricesAs seen in the chart below, the metro areas that are expected to benefit from lower oil prices are a diverse set. Some metros, including Atlanta, Philadelphia, and Boston should benefit because it will be less expensive to heat and/or cool buildings and homes. Other metros should benefit because consumers will now have more disposable income, allowing for a stimulus in tourism, in places like Phoenix, Tampa, and Orlando.
T
Lower Oil Prices and Multifamily — More Winners than Losers Tim Komosa
Economist ManagerFannie Mae, Multifamily Economics and Market Research
Kim BetancourtDirector of EconomicsFannie Mae, Multifamily Economics and Market Research
booMtoWnS: tHe KnoCK on effeCtS of oIl PRICeS

CRE Finance World Summer 2015 46
Exhibit 2Estimated Change in Local GDP Due to Lower Oil Prices
Source: CoStar; R-Squared reflects the magnitude of the importance of oil in a metro’s economy
Potential Losers from Low Oil PricesAmong major U.S. cities, Houston has the most to lose from lower oil prices and is the only primary metro in the U.S. that is expected to be negatively impacted in a meaningful way. As the energy capital of North America, its economy will be hit with the most direct impact of the shock. Fortunately, that hit should not be devastating since Houston has diversified its local economy in very important ways since the oil bust a few decades ago, which should end up blunting the anticipated drag on overall job growth.
There are several smaller metros that may not be so lucky and are expected to encounter significant economic turbulence and out-right job losses. These metros include Williston, North Dakota, Oklahoma City, and Midland-Odessa, Texas, which have been among the fastest growing metros in the country over the past several years, as they have been riding the wave of growth related to new oil well drilling. In addition, New Orleans will likely be negatively impacted, albeit to a lesser extent.
As seen in the table below, there are several metros with nominally large but proportionally small oil industry operations, like Williamsport, PA, Denver, and Dallas, that could see a negative impact on their local economies. However, the positive aspects of low oil prices, like enhanced consumer spending and marginal expansion of manufacturing due to lower energy costs, is expected to balance out any negatives in these metros.
Exhibit 3Oil/Gas Industry Employment (Including Support Businesses) and Multifamily Housing
Source: Fannie Mae Economics & Mortgage Market Analysis, Moody’s Analytics, ACS; counts as of 2012.
Not Much Multifamily in Impacted MetrosWhile housing may be in for a period of decline in fundamentals in certain metros with a disproportionate dependence on oil extraction, in truth, few of these metros have any significant concentration of multifamily housing. Nationally, approximately 18 percent of housing units are in multifamily structures. As seen in the table above, of the 33 metros listed that have a higher-than-average concentration of jobs in the oil and gas industry, just six metros have a concentration of multifamily housing exceeding 18 percent. And of those six metros, the only one with both an unusually high concentration of oil and gas jobs (24.8 percent) as well as a high concentration of multifamily housing (18.1 percent) is Midland, Texas.
What’s Ahead for Houston?Houston is headed for a slowdown, no doubt about it. However, there is little agreement about the severity of the slowdown. Fortunately, none of the major macroeconomic and commercial real estate data providers expect the Houston economy to fall into
Lower Oil Prices and Multifamily — More Winners than Losers

A publication of Summer issue 2015 sponsored by CRE Finance World Summer 2015
47
recession. The general consensus is that Houston’s job market will slow from being one of the fastest-growing in the nation, to one that achieves just national average growth rates. For example, Moody’s Analytics is forecasting that Houston’s 2015 job growth will be about half of what was previously expected, but still viable enough to produce an estimated 63,000 new jobs in 2015. Commercial real estate data provider Axiometrics has a slightly more optimistic forecast: 73,000 new jobs in 2015, down from 93,000 prior to the oil price decline, or about 20 percent fewer jobs than was previously expected.
Prior to the recent decline in oil prices, the apartment supply surge was well on its way in Houston. After several years of apartment market tightening, Houston was already expected to see some easing in rent growth and occupancy levels this year, as new supply hits the market. Now, with the anticipated slowing down of job growth, there is likely to be a short-term oversupply of units over the next 12 to 24 months.
Previous Undersupply Will Help Houston NowThere are about 18,000 new apartment units underway in Houston, with expected completions occurring over the next two years. With job growth anticipated at about 2 percent, that should produce demand for about 13,000 units, which would appear to create a supply/demand imbalance. Mitigating this condition, however, is the fact that Houston has been undersupplied over the past several years: Only 22,500 units were completed since 2011 but more than 250,000 jobs were added, creating estimated demand for about 50,000 multifamily rental units.
Worthy of note is that there are sections of Houston that will actually benefit from low oil prices. The metro’s east side submarket has been seeing a surge in construction of chemical and manufacturing plants that are taking advantage of low natural gas prices. This is expected to continue, and possibly expand, if oil prices remain low.
North Dakota: A Slippery SlopeNorth Dakota has been one of the primary beneficiaries of the North American fracking boom and Williston, in particular, has been the center of that activity. Williston has grown tremendously over the past few years, to nearly 30,000 people, and is the nation’s fastest growing micropolitan area. It has seen its population increase by an average 7.0 percent per year since 2010, compared to just 0.7 percent growth at the national level. Needless to say, all this extraordinary growth has occurred specifically because of drilling activity in the area.
Now with an extended period of low oil prices, the metro area, and the entire state, could fall into a recession. While extraction costs
are estimated to be lower here than in some areas, the combined cost of construction of new wells and transportation of crude oil to refineries located on the coasts of the Gulf of Mexico and the Mid-Atlantic will likely make new investments in the area uneconomical.
As seen in the chart below, as the price of oil declines, the state’s active rig count also declines. And as of February 2015, it has only worsened. The state’s active rig count has declined to 121, down from 190 a year ago, according to data from the North Dakota Department of Mineral Resources. This means that the state is now unable to produce its previous output level of about 1.2 million barrels per day. In addition, of these active rigs, 115 are concentrated in just four counties: Dunn, McKenzie, Mountrail and Williams — all of which are located in the most prolific section of the Bakken formation.
Exhibit 4Monthly North Dakota Rig Count & Bakken Shale Sweet Crude Oil Prices Jan. 2014–Jan. 2015
Source: Compiled by NGI’s Shale Daily from North Dakota DMR reports
Williston’s Multifamily Sector Likely ImpactedWilliston has a fairly large multifamily inventory considering its rural setting and relatively small population size. The influx of workers coming to the oil fields has resulted in a significant housing shortage and a sizeable inventory of temporary housing. As of 2013, there were about 6,000 multifamily housing units in Williston, according to a recent City of Williston/NDHFA Housing Study. Multifamily, which likely includes this sizable inventory of temporary dwellings, represents 49 percent of all housing stock, with about 9 percent consisting of mobile homes and another 40 percent consisting of single-family homes.
Rents already appear to be declining and concessions commonplace. A review of one rental apartment website reveals concessions of $550 being offered on a $1,800 monthly rental, or about -2.5 percent, significantly above the national average of just -0.9 percent.
Lower Oil Prices and Multifamily — More Winners than Losers

CRE Finance World Summer 2015 48
Williston’s multifamily sector is expected to see further decreases in rent and higher concession rates if the rig counts continue declining over the next few months — a very likely scenario.
Slowdown in Midland-Odessa, TexasMidland-Odessa has the highest concentration of oil and gas industry jobs in the country and, as a result, has been in the midst of an exceptional expansion for the past several years. The area’s job market has grown by an average 6.4 percent per year since 2009 – more than four times the national average.
This has been driven by the oil economy in the region, which has accounted for an estimated 40 percent of the 45,000 jobs created since 2009. Yet, during this period, apartment development has been unexpectedly muted. Since 2009, just 10 apartment projects have come online, accounting for 2,400 units. For context, there are an estimated 20,000 multifamily units in the Midland-Odessa area.
With falling oil prices, Midland-Odessa is poised for a significant slowdown, though calamitous conditions in the job and apartment markets are not expected. Moody’s Analytics estimates that job growth in the area will remain positive, slowing to a still-respectable 2.2 percent this year compared to an enviable 5.6 percent in 2014, as seen in the chart below. Moody’s Analytics provides an additional forecast that keeps oil prices low longer than expected, and even in that forecast Midland-Odessa’s job market is forecasted to contract by just -1.2 percent in 2015, with job growth rebounding to 2.4 percent in 2016.
The base forecast for Midland-Odessa’s job market results has real estate research firm Reis, Inc., anticipating that the metro’s apartment market will see vacancy rise to 7.0 percent by year-end 2015, up from 6.1 percent in 2014, and rent growth remaining positive — though slowing — to an enviable 6.8 percent for 2015, down from 7.8 percent for 2014.
Exhibit 5Midland-Odessa Quarterly Job Growth Forecast (CAGR)
Source: Moody’s Analytics
Keeping an Eye on Some MetrosOther mid-sized metro areas that have a concentration of oil jobs and could have some more trying times ahead include Lafayette, Louisiana; Corpus Christi, Texas; Oklahoma City; Shreveport, Louisiana; and Bakersfield, California. All of these metro areas have seen oil drilling jobs enhance their local economies over the past several years, and are poised to see that additional job growth diminish if oil prices remain low, especially over the long-term.
From a multifamily rental sector perspective, these metros are likely to see some softening conditions ahead but none of these places have been hotbeds of apartment development activity, and the impact of a slowdown in oil jobs should not obliterate local apartment sector demand.
National Benefits and the Multifamily SectorThe rise in North American oil production and the recent drop in worldwide oil prices should be a benefit to consumers across the country. Greater disposable income would stimulate tourism, retail sales, as well as a diverse set of industries, allowing the national economy to potentially grow more than previously forecast, in turn bolstering a generally healthy national apartment market. Indeed, some suburban and especially exurban submarkets in most major metros could end up seeing an improvement in overall housing fundamentals since commuting would now be less expensive, thanks to lower gasoline prices.
The fall in oil prices would be felt more acutely in just a few geographical areas and in certain local jobs. Fortunately, for most of these areas, the stimulus from oil production has simply enhanced an already healthy economy. The slowdown resulting from the drop in oil prices should not result in large scale, metro-wide job losses, but rather should impact clusters of oil-dependent jobs. Local apartment markets, many of which were already poised for a rise in vacancy and an easing of rent growth, will likely see some additional softening, but this is not expected to be a significantly negative event for the nation’s multifamily sector.
Opinions, analyses, estimates, forecasts and other views of Fannie Mae’s Multifamily Economics and Market Research Group (MRG) included in these materials should not be construed as indicating Fannie Mae’s business prospects or expected results, are based on a number of assumptions, and are subject to change without notice. How this information affects Fannie Mae will depend on many factors. Although the MRG bases its opinions, analyses, estimates, forecasts and other views on information it considers reliable, it does not guarantee that the information provided in these materials is accurate, current or suitable for any particular purpose. Changes in the assumptions or the information underlying these views could produce materially different results. The analyses, opinions, estimates, forecasts and other views published by the MRG represent the views of that group as of the date indicated and do not necessarily represent the views of Fannie Mae or its management.
Lower Oil Prices and Multifamily — More Winners than Losers

Registration is open contact: Hannah – [email protected]
Sponsorship is now available contact: Carol – [email protected]
www.crefceurope.org
9 & 10 November, London
Autumn Conference2015
Early registration closes – Friday 28 August

CRE Finance World Summer 2015 50
n late January 2015, crude oil prices hit a 52-week low around $44.08 per barrel, capping off a staggering decline from a 52-week high of about $108 in mid-2014. Prices bounced back somewhat to above $50 in mid-February, fell again, reaching a new 52-week low of $44.02 per barrel.
The massive decline in oil prices has already begun to reverberate throughout the economy, with different effects for various firms, industries, regions and, in the case of commercial real estate, property types. Much of the coverage and analysis surrounding the decline in oil prices has centered on Houston, the energy capital of the U.S. and one of the hottest commercial real estate markets in the country. But contrary to all of the doom and gloom underlying much of that coverage, we expect the impact of low energy prices on the multifamily sector in Houston to be minimal. On the other hand, the Houston office market is likely to feel more pain and indications are already pointing to that conclusion.
Not surprisingly, the decline in the price of oil will have a negative impact on energy-oriented economies around the country. However, at most this will slow growth in major metro areas, not drive them into recession. Texas is the state that will be most directly impacted by this. Other states that will be hit, but to a lesser extent, are North Dakota, Oklahoma, Colorado, New Mexico, Wyoming and, if oil prices remain depressed for a while, West Virginia (because of the price substitution effect between natural gas and coal). The areas in Texas that are under the most direct threat are smaller, less diverse metro economies such as Midland and Odessa. And yet even in the case of these two metros, any adverse effect on employment has so far been unsubstantial. Year-over-year employment growth in Midland was still 8.8% as of February and down just 50 basis points from the peak last October. In Odessa, year-over-year employment growth is down 130 basis points since October, but still registered a 7.6% increase as of February.
Among larger metros, Houston and, to a lesser extent, Fort Worth will be impacted because of the relatively high concentration of exploration jobs in those metros. Even though the oil price decline will mostly hit the exploration industry, there are also many professional services firms in the area that rely on business from the energy industry creating the potential for significant secondary employment impacts. Job growth in the oil and gas extraction industry has certainly slowed since mid-2014. As of February, oil and gas extraction payrolls expanded by 1.9% year-over-year, compared with 3.1% as of February 2014. Yet the rapid pace of job growth in this industry was already in decline in Houston well before the downturn in oil prices; after reaching a cyclical high of 12.6% in mid-2012, annual increases in payrolls have gradually slowed through early 2014. Since then, growth has been steady around 1%-2%. Overall, job growth has still remained positive. Houston actually registered an
annual increase in payrolls of 3.4% as of February. This is down from the 3.8% increase as of December, but in line with annual job growth figures from late 2013 to early 2014. January did see the first monthly job losses in the metro since 2011, but January has been a weak month for job growth for several years. Moreover, job growth has been muted across the country during the first few months of the year.
Exhibit 1Houston Nonfarm Payroll Employment
Source: Bureau of Labor Statistics
On the bright side, the larger Texas metros are not as dependent on the energy sector as they once were, such as during the 1980s oil price decline, so they are better positioned to weather the downturn. In Houston, a greater presence from healthcare, research and professional services firms will help keep the metro’s economy growing. And in fact, payroll gains within Education and Health Services and Professional and Business Services has bolstered Houston’s recent job gains. Employment in the Leisure and Hospitality industry has also been solid. The state also benefits from very positive demographic trends. Houston’s population is projected to grow 8.7% over the next five years, driving an 11.0% increase in households. This compares to expectations of 5.3% and 7.5% growth in each respective category for the nation as a whole. This strong population growth should continue to support household formation and the demand for apartments.
As such, low energy prices have had little effect on our multifamily outlook for Houston. Let us be clear — we are not saying that the metro’s market will continue to do incredibly well. We are already calling for increasing vacancies and a moderation in rent growth
I
Low Energy Prices’ Impact Mixed, Multifamily May Be Least Pronounced Ryan Severino, CFA
Senior Economist and Director of ResearchReis
Bradley DoremusAssociate, Research & EconomicsReis
Dr. Victor CalanogChief Economist and Senior Vice PresidentReis
booMtoWnS: tHe KnoCK on effeCtS of oIl PRICeS

A publication of Summer issue 2015 sponsored by CRE Finance World Summer 2015
51
through 2019 due to new development and the maturation of the multifamily cycle. It is for these reasons that we believe vacancy will rise in the coming years, not because of falling energy prices. Our preliminary first quarter results show that vacancy held steady at 5.8% but is up 20 basis points over the past 12 months. Quarterly rent growth was 1.0%, ranking 13th in the nation. Oil prices have been declining for nine months but the multifamily market has remained resilient. Household formation and population growth are strong while employment growth has held steady despite the hit to the energy sector. The vacancy will begin to rise, however, as more and more new supply is completed. In 2014, 10,065 units were completed, a 1.9% increase in inventory. Reis forecasts construction to total more than 18,500 units in 2015, increasing inventory by 3.4%. The current vacancy rate should also be viewed in context. The metro’s long-term average vacancy rate is roughly 9.2%. Without counting the 1980s, a decade of extreme overbuilding in the metro, long-term vacancy is about 7.4%. So even forgetting the recent fall in energy prices, the combination of below-average vacancy and a significant influx of new supply is already signaling vacancy increases over the next several years. The fall in oil prices will not have a serious impact on this market trajectory.
We also believe that Houston’s diverse economy, resilient job growth and strong population growth will insulate the retail sector from any major negative pullback from low oil prices. Preliminary first quarter 2015 results further confirmed our outlook. Vacancy among Houston’s neighborhood and community centers fell 30 basis points in the first quarter to 11.3%, the eighth largest decline among Reis’ primary metros. Effective rents also grew 0.8% for the quarter, almost on par with rent growth exhibited in the multifamily sector. Annual rent growth is now at 3.1%, the tenth largest increase in the country.
Exhibit 2Houston Apartment Supply and Demand Trends
Source: Reis
Office and industrial properties in major energy metros are more likely to be directly impacted by oil price declines and the subsequent layoffs in the energy sector. Energy companies and supporting professional service firms are major users of both office and industrial space and attached to a significant number of projects in the development pipeline. With major energy firms like Schlumberger and Halliburton already announcing layoffs, many planned expansions may potentially be delayed or cancelled, depressing demand for commercial space. The key is that for more established companies, the break-even point for oil is far lower for fracking wells ($35 to $45 per barrel) than the new, highly-levered entrants that bought/leased land when energy prices were far higher ($75 to $85 per barrel). The newer, highly-leveraged firms are the ones that may go out of business. The bigger, monolithic firms will lay some people off, but this will mostly be confined to exploration. Still, our office and industrial projections for Houston have been reduced to account for the decline in demand.
The negative impact on the Houston office market was already evident in preliminary results for the first quarter of 2015. Net absorption was barely positive during the first quarter and was actually negative in February and March. Meanwhile, construction was relatively robust for the quarter, resulting in a 60 basis point increase in vacancy since the end of 2014. This was tied for the third largest increase in vacancy across the country. As a result the Houston market’s vacancy rate currently sits at 15.1%, the highest level since the third quarter of 2011. Moreover, the Federal Reserve Bank of Dallas noted in the March release of the Beige Book that some energy firms are seeking to sublet office space in Houston. And unless a large portion of projects are put on hold, there is more office space to be delivered in the near future. Over 7.5 million square feet of office space in Houston will likely be delivered in 2015, representing 19% of all projected completions due across the nation. In 2016, that figure falls to 16% but the actual amount of space to be completed is even larger, on the order of 7.7 million square feet.
For most other metros, a steep decline in oil prices will be a boon for consumers and businesses alike (particularly in energy-intensive industries), effectively acting as a tax break. This leads to a rise in disposable incomes for consumers and a decline in costs for firms. Retailers should benefit directly when more money remains in the hands of shoppers and leads to higher sales. This process was already underway as of late 2014; fourth quarter GDP figures indicated personal consumption grew at its highest rate in years, bolstered by the decline in oil prices. However, retail sales growth has actually turned negative in early 2015. Excluding autos and gasoline, sales were down 0.1% in January and 0.2% in February. Much of this decline can be attributed to severe inclement weather and below-average temperatures across a large swath of the
Low Energy Prices’ Impact Mixed, Multifamily May Be Least Pronounced

CRE Finance World Summer 2015 52
country. Year-over-year figures (excluding autos and gas) are still in line with the latter half of 2014, indicating spending may not be suffering like headline monthly figures suggest.
The regions of the country poised to benefit most from the decline in oil prices are those that have underperformed since the beginning of the recovery, namely the Northeast and Midwest. Both regions have very little exposure to the oil industry compared to the South and West and stand to reap the benefits of falling oil prices without bearing the brunt of negative effects. Since energy costs are generally higher in the Northeast and Midwest, declining oil prices will have a greater positive effect than elsewhere. Moreover, the reliance on industrial production in the Midwest leaves the region susceptible to fluctuations of oil prices given their use as an input in the manufacturing process. Auto manufacturers, stalwarts of the Midwestern manufacturing industry, should gain two-fold from a decline in oil prices. Input costs decrease and boost profits while lower gasoline prices make buying a car more attractive.
Exhibit 3West Texas Intermediate Crude Oil — Price per Barrel
Source: Federal Reserve Bank of St. Louis
We must be careful not to overstate the effect a decline in oil prices may have on the commercial real estate market. As we have noted, the major energy metro, Houston, has diversified its economic base significantly over the past couple of decades. The demographic trends in the metro are very favorable. Also, it is not a given that prices will remain at current depressed levels for an extended period. We are more than 9 months into the current downturn in oil prices. A recent analysis by the Federal Reserve Bank of St. Louis took a look at all major episodes of oil price declines in non-recessionary environments since 1983. They calculated the average duration of each of these declines to be 8.6 months, a figure that was heavily influenced by a 23 month-long episode in the late 1990s, with a median of just 6 months. While this by no means indicates we are at the end of the current decline, it is telling that we are already past the average duration of such episodes and well past the median. As of the writing of this article, the WTI spot price is in the low $50 range. At present, most forecasts call for oil prices in the $50 per barrel range by late 2015 and into the $60 range in 2016. This is still quite low, but remains comfortably above the $35 to $45 per barrel breakeven point for the larger oil companies.
The consequences of lower energy prices will mostly be felt by office and industrial properties. Any effect on the multifamily and retail sectors will be felt indirectly, but we believe neither will suffer any significant downward pressure on fundamentals. As such, our forecasts in Houston for these two property types have not changed much due to the decline in oil prices. Overall we are not saying that real estate fundamentals will continue to improve indefinitely for Houston multifamily: for a variety of reasons unrelated to low energy prices, we have already been forecasting a rise in vacancies and a moderation in rent growth over the next five years. However, to claim that the impact of low energy prices will be substantive, or changing our current view of the trajectory of fundamentals in a significant way, is an overreaction.
Low Energy Prices’ Impact Mixed, Multifamily May Be Least Pronounced

Capitalizing on new opportunitiesThe long-term relationships KeyBank enjoys with our clients are rooted in superior execution and proven expertise in:
• Permanent Mortgage Financing
• Construction and Interim Financing
• Master, Primary and Special Loan Servicing
• Cash Management
Our clients’ confidence in Key’s consistency and customer service excellence inspires us every day, and it helped us gain a reputation as a trusted presence in the industry.
Let us put our expertise to work for you.
Banking products and services are offered by KeyBank National Association. All credit, loan and leasing products subject to credit approval. Key.com is a federally registered service mark of KeyCorp. ©2014 KeyCorp. KeyBank is Member FDIC. ADL7583
To learn more contact: Matthew Ruark, Head of Commercial Production and Investor Placement, at 913-317-4237 or Dan Olsen, Senior Vice President, Servicing, at 214-414-2564Visit key.com/realestate

CRE Finance World Summer 2015 54
hose of you actively engaged in CREFC activities in the early to mid- 2000’s may recall that historically, CREFC’s mission has been: “To promote the strength and liquidity of commercial real estate finance worldwide.”
Due to the repercussions of the liquidity crisis on the CRE finance industry and CREFC as an association our focus on executing our mission on a global basis was largely suspended. However, with the CRE finance markets health and vibrancy returned and the organization’s balance sheet on strong footing, CREFC is now in position to move forward with promoting the CREFC mission worldwide.
CREFC’s objective is to bring its value propositions to the global marketplace in a coordinated and collaborative way. We are seeking to accomplish this through:
• Establishing the CREFC brand through participation in global conferences;
• Collaborative execution with our CREFC affiliates in Europe and Japan;
• The production of global commercial real estate finance conferences and events;
• The publication and dissemination of CRE educational primers and materials; and
• The establishment of global CREFC chapters in re-emerging markets.
Establishing the CREFC BrandThis past March, CREFC President & CEO Steve Renna produced and moderated one of the highest profiled panels at the Annual MIPIM World Property Market Conference in Cannes, France on the topic of global CRE finance markets. Steve, along, with Executive Vice President Stacy Stathopoulos, also took advantage of the 93 countries represented at this real estate event to hold numerous meetings with commercial real estate finance professionals from various continents. These meetings facilitated the connection to and understanding of CRE finance markets, companies and participants all over the world. Similar meetings also were held during their trip to London for the CREFC-Europe Spring Conference.
Facilitating Global ConnectivityCREFC is facilitating global connectivity on several fronts. We are actively collaborating with international counterparts on global regulations impacting structured finance as well as the overall commercial real estate finance markets. Christina Zausner, CREFC Vice President for Industry and Policy Analysis, is running point on these efforts and is in communication with regulatory bodies such as the Basel Committee on Banking Supervision.
CREFC also is actively assessing future opportunities to host international meetings and conferences on CRE finance that would be attended and presented by CRE professionals from across the globe, and co-hosted by our Europe and Japan affiliates. These conferences will provide the platform from which the CRE finance industry can associate and benefit from a multi-continent perspective on markets, best practices, regulatory regimes, central banking policy and more.
Promotion of Foreign Investment in U.S. Commercial Real Estate Debt ProductsForeign investor demand for U.S. commercial real estate debt products is increasing. However, understanding of U.S. markets, debt products and their sponsors amongst foreign investors is lagging. Investors benefit from dedicated conference programming at which the lending community can educate investors on the various CRE debt products.
To that end, CREFC recently partnered with MIPIM to provide a cornerstone of the programming for their inaugural MIPIM Japan Conference in Tokyo. This conference focused on investment into Japan as well as outbound investment to the U.S. CREFC held a s reception with investors that provided meaningful information on U.S. CRE debt market investment to investors and created strong business development opportunities for our members.
Creation and Publication of Educational Primers and MaterialsWith the release of its newly revised CMBS Educational Primer this month, CREFC has laid the cornerstone of its E-Primer series for global commercial real estate finance professionals. Additional E-primers in the series are scheduled for release during the course of 2015 and include: Multifamily Lending, High Yield and Distressed Realty Assets, and Underwriting Principles.
T
CREFC’s Global Mission
Stacy StathopoulosExecutive Vice PresidentCRE Finance Council
CRefC foCuS

A publication of Summer issue 2015 sponsored by CRE Finance World Summer 2015
55
CREFC’s E-Primer series is designed to provide an in-depth introductory overview of that sector of the commercial real estate finance market. These primers were developed by knowledgeable graduate school professors and are available in an e-book format with supplemental video recordings. CREFC investment in the development of young professionals in the CRE finance market is a high priority and we are dedicated to providing the resources and tools to achieve that goal.
Establishment of CREFC Canadian ChapterCREFC recently re-established its Canada Chapter (previously in existence from 2000-2007). The Canadian commercial real estate finance market is a steadily growing, increasingly important sector of economy and this Chapter is dedicated to providing Canadian member companies with a platform to create quality conference events, develop best practices, and connect with industry participants in Canada and the United States. Recent programming includes featured panels at the January and June Annual Conferences.
With 280 member companies and 7,000 individual members, CREFC is well positioned to take on this leadership role in the global marketplace.
CREFC’s Global Mission
Over $1000
Kevin BlauchLarry BrownRobert BrennanUS Bank PACMatthew SalemCharles SchrankKeith GollenbergRichard JonesRobert RicciChris AlbanoStacey BergerDaniel BoberMatthew BorsteinTimothy GallagherMichael GambroStuart GoldsteinJoseph KellyLarry KravetzDavid LinderBrigid MattinglyJohn MulliganMichael NashDavid NassCory OlsonNilesh PatelGeorge PetrowPatrick QuinnPat SargentJonathan StrainMichael SyersKent BornGuy JohnsonStephen KraljicPaul HughsonAnand GajjarGrace HuebscherCaroline BlakelyKatherine BurroughsNik ChillarToby CobbJack CohenMargie CustisDavid EckelsJeffrey FastovDavid FortiHarry FunkAnna GlickChris HoeffelBob KarnerBrian KrisbergSamir LakhaniZanda LynnGregory MichaudJonathan NunesBrian OlasovJan SterninLaura SwihartPaul VandersliceDarrell WheelerGreg Winchester
Under $1000
Daniel OlsenDavid BurkholderScott ChisholmJohn D’AmicoGreta GuggenheimNelson HioeMichael KaplanRobert KimBill O’ConnorLisa PauquetteFrank PolverinoMichael RiccioJeffrey RotblatJodi SchwimmerTimothy StaffordClay SublettKahlil YearwoodMark ZytkoKathleen OlinMidge BroganMerrick “Rick” GrossMarty LaniganMark McCarthyMichael MoranBob CherryLarry GolinskyRon SchragerBrian TagesonKevin WodickaRandolph WolpertRichard CoppolaDavid DorrosThomas GoodwinJason HullDavid IannaroneVanessa ImmeKen RivkinTed Wright
2014 PAC Contributors
Thank You To Our

CRE Finance World Summer 2015 56
early one year ago, CREFC launched an ambitious initiative to revamp our education platform and integrate, in a strategic and structured way, young commercial real estate finance professionals into CREFC.
A strategic plan was developed which specifically focused on providing quality and innovative educational content to the commercial real estate finance space.
Our goal is to broaden the competency levels of our industry’s young professionals with respect to many different aspects of CRE finance.
The first step in revamping the platform was to produce educational materials that provided a comprehensive overview of different types of CRE lending products. Guiding us in this process is an education survey of CREFC members conducted in 2014 which probed the level of demand for educational products and programming and the best format in which to deliver them .
The survey results clearly indicate that the robust demand for professional development and education materials in the CRE finance space. The best place to begin reaching our goal was to improve upon existing education content. That led to our decision to re-write the CREFC CMBS E-Primer and develop a series of E-Primers on other types of lending within the CRE finance industry.
These E-Primers are timely, comprehensive educational resources in a convenient e-book format. CREFC contracts with graduate school professors from some of the leading real estate programs in the country to prepare the materials. The professors are guided by subject matter experts from our Education Committee.
The educational content will be hosted on a new education learning management system platform. This system will allow us to sell the products on an individual basis or as a company license so they can be incorporated into firm employee training programs; particularly the CMBS E-Primer.
The E-Primers will eventually become program content for our breakfast and after work education events for young professionals. CREFC members are a crucial part of the development and review of these E-Primers. Representatives of the High Yield Distressed Realty Assets Forum and the GSE Multifamily Forum serve in an advisory capacity to address critical topics and issues to include in our educational materials. They also guide the professors in the shaping of the E-primer content and presentation as well as provide editorial oversight.
This summer, we will develop an Underwriting Principles E-Primer based off of the existing CREFC – Principles-Based Underwriting Framework resource. The E-Primers are intended to benefit: those who are relatively new to this industry; new entrants to the market who may be seasoned investors in other asset classes; more expe-rienced employees who wish to improve their competency across a wide variety of disciplines within the industry, or professionals seeking to fill a knowledge gap.
The CREFC Education Series will cover the following:
CREFC CMBS E-Primer• An Overview of CMBS
• CMBS History and Evolution
• Originating and Underwriting Commercial Mortgages for CMBS
• Structuring
• AAA Rated CMBS Securities
• Investing in Mezzanine CMBS
• Investing in IO
• Investing in B-Piece CMBS
• Closing CMBS Transactions, Parties, Key Documents and Servicing
• An Overview of the Taxation Of REMICs
• CMBS Subordinate Debt
N
CREFC Education: Where We Are…Where We’re Going
Sara ThomasDirector, Education InitiativesCRE Finance Council
CRefC foCuS

A publication of Summer issue 2015 sponsored by CRE Finance World Summer 2015
57
CREFC High Yield and Distressed Realty Assets E-Primer• An Overview of High Yield and Distressed Realty Assets
• Mechanics of a Loan
• Underwriting Transitional Assets
• Secondary Market for Securitized Loans
• Distressed Assets
• Emerging/Non-Traditional Securitization Financing
• Bankruptcy
• Receivership
CREFC Multifamily Lending E-Primer• An Overview of U.S. Multifamily Lending
• Multifamily Asset Classes
• Originating and Underwriting Multifamily Loans
• Closing Multifamily, GSE Loans, Parties, Key Documents and Servicing
• Securitization and Distribution
• Investing in Multifamily and GSE Bonds
• Trading
• GSE Reform
For any questions regarding the E-Primers or general education inquiries, please contact Sara Thomas at [email protected].
CREFC Education: Where We Are…Where We’re Going
ATLANTA · NEW YORK · IRVINE · LONDON · AMSTERDAM
WORLD-CLASS PROJECTS.FROM START TO FINISH.
Over three decades, we've serviced thousands of complex construction loans of all shapes and sizes. This track record has earned us the highest possible Construction Servicer rating awarded by Standard & Poor's.
If you're ready to build, we're with you all the way.
CONSTRUCTION LOAN ADMINISTRATION IS A COMPLEX PROCESS. THAT'S WHERE WE COME IN.
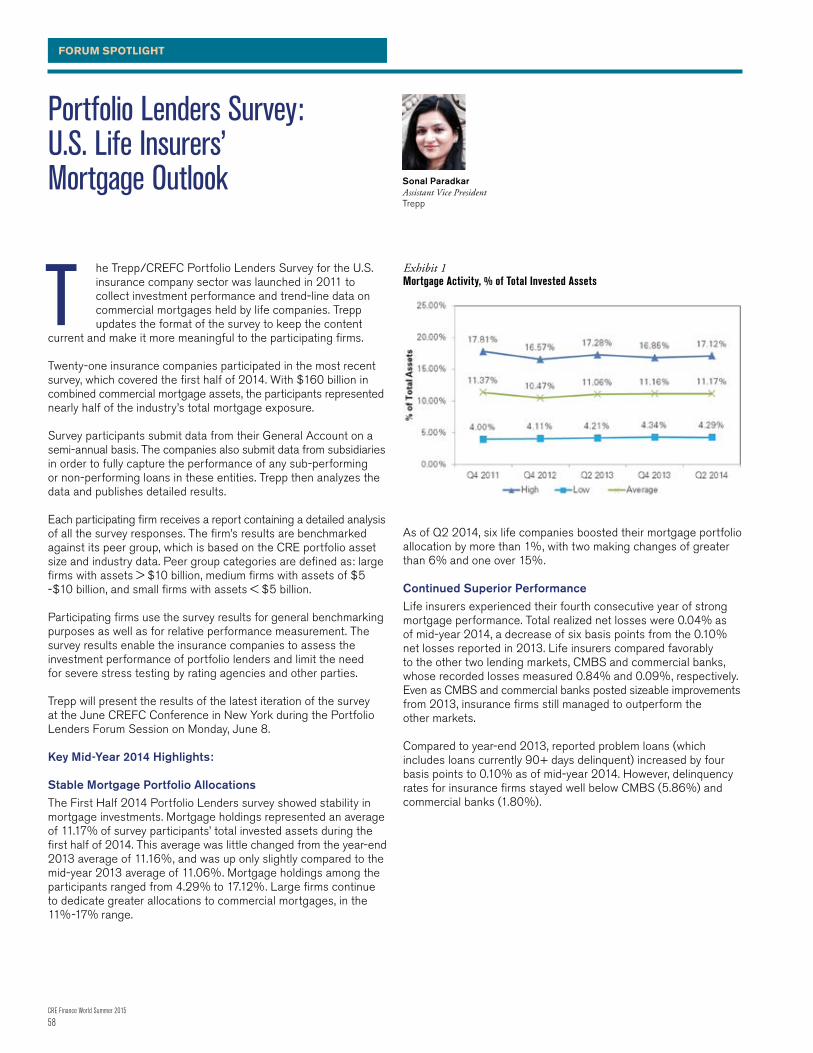
CRE Finance World Summer 2015 58
he Trepp/CREFC Portfolio Lenders Survey for the U.S. insurance company sector was launched in 2011 to collect investment performance and trend-line data on commercial mortgages held by life companies. Trepp updates the format of the survey to keep the content
current and make it more meaningful to the participating firms.
Twenty-one insurance companies participated in the most recent survey, which covered the first half of 2014. With $160 billion in combined commercial mortgage assets, the participants represented nearly half of the industry’s total mortgage exposure.
Survey participants submit data from their General Account on a semi-annual basis. The companies also submit data from subsidiaries in order to fully capture the performance of any sub-performing or non-performing loans in these entities. Trepp then analyzes the data and publishes detailed results.
Each participating firm receives a report containing a detailed analysis of all the survey responses. The firm’s results are benchmarked against its peer group, which is based on the CRE portfolio asset size and industry data. Peer group categories are defined as: large firms with assets > $10 billion, medium firms with assets of $5 -$10 billion, and small firms with assets < $5 billion.
Participating firms use the survey results for general benchmarking purposes as well as for relative performance measurement. The survey results enable the insurance companies to assess the investment performance of portfolio lenders and limit the need for severe stress testing by rating agencies and other parties.
Trepp will present the results of the latest iteration of the survey at the June CREFC Conference in New York during the Portfolio Lenders Forum Session on Monday, June 8.
Key Mid-Year 2014 Highlights:
Stable Mortgage Portfolio AllocationsThe First Half 2014 Portfolio Lenders survey showed stability in mortgage investments. Mortgage holdings represented an average of 11.17% of survey participants’ total invested assets during the first half of 2014. This average was little changed from the year-end 2013 average of 11.16%, and was up only slightly compared to the mid-year 2013 average of 11.06%. Mortgage holdings among the participants ranged from 4.29% to 17.12%. Large firms continue to dedicate greater allocations to commercial mortgages, in the 11%-17% range.
Exhibit 1Mortgage Activity, % of Total Invested Assets
As of Q2 2014, six life companies boosted their mortgage portfolio allocation by more than 1%, with two making changes of greater than 6% and one over 15%.
Continued Superior PerformanceLife insurers experienced their fourth consecutive year of strong mortgage performance. Total realized net losses were 0.04% as of mid-year 2014, a decrease of six basis points from the 0.10% net losses reported in 2013. Life insurers compared favorably to the other two lending markets, CMBS and commercial banks, whose recorded losses measured 0.84% and 0.09%, respectively. Even as CMBS and commercial banks posted sizeable improvements from 2013, insurance firms still managed to outperform the other markets.
Compared to year-end 2013, reported problem loans (which includes loans currently 90+ days delinquent) increased by four basis points to 0.10% as of mid-year 2014. However, delinquency rates for insurance firms stayed well below CMBS (5.86%) and commercial banks (1.80%).
T
Portfolio Lenders Survey: U.S. Life Insurers’ Mortgage Outlook Sonal Paradkar
Assistant Vice PresidentTrepp
foRuM SPotlIgHt

A publication of Summer issue 2015 sponsored by CRE Finance World Summer 2015
59
Exhibit 2Total Realized Net Losses
Source: Bank Losses & DQs — Trepp Bank NavigatorCMBS Losses & DQs — TreppCMBS
Exhibit 3Delinquencies 90+ Days
Source: Bank Losses & DQs — Trepp Bank NavigatorCMBS Losses & DQs — TreppCMBS
Looking across the spectrum of firm sizes, the losses recorded in the first half of 2014 for Large and Medium firms were much lower than year-end 2013 figures. Small firm losses, on the other hand, increased slightly. Larger firms tend to take their losses early, while cumulative losses for small firms have stayed low and have been more evenly distributed over time. For delinquencies of 90+ days, both Small and Medium firms reported higher delinquencies at mid-year 2014 than at year-end 2013. Large firms reported no 90+ day delinquencies as of mid-year 2014.
Exhibit 4Total Realized Net Losses by Firm Size
Exhibit 5Delinquencies (90+ Days) by Firm Size
Permanent First mortgage loan losses represented 83.54% of the total losses reported at mid-year 2014, which is a slight decline from year-end 2013. Subordinate debt losses increased 7.5% to 16.46%. No losses were reported for Construction loans. Subordinate debt had the highest loss severity of approximately 51% as of mid-year 2014—a clear reminder of the volatility of subordinate debt and the weaker position of junior lien holders versus first lien holders.
Portfolio Lenders Survey: U.S. Life Insurers’ Mortgage Outlook

CRE Finance World Summer 2015 60
Exhibit 6Realized Losses — Loss Severity by Investment Type
In line with recent trends, we expect mortgages to perform strongly and losses to decline further in the coming quarters with low impairments and delinquencies.
Improving LTVs & DSCRsOver the last few years, the average reported portfolio loan-to-value (LTV) and debt service coverage ratio (DSCR) have improved for the commercial mortgages held by insurance companies. The average commercial mortgage LTV held within participating company portfolios was 55.1% as of mid-year 2014, with 1.19% of loan exposure for all companies above a 100% LTV. The average DSCR for the portfolios was 2.0x and approximately 95% of all exposure held was above a 1.0x DSCR. Compared to year-end 2013, the average portfolio LTV was down 1.3% and DSCR was up four basis points. We expect the year-end data to show the same continued decline in LTV and continued improved performance of properties with DSCR increasing at a steady rate. However, it will be interesting to see what these statistics will look like in the coming quarters if interest rates rise in 2015.
Exhibit 7Average Portfolio LTV
Exhibit 8Average Portfolio DSCR
New Originations GrowingIn search of better yields, life companies have increased their focus on the commercial mortgage market, resulting in rising new loan originations for insurance companies in recent years. New originations reported by the 21 participants in the mid-year 2014 survey totaled $14.5 billion. We expect these numbers to more than double in the year-end 2014 data.
Portfolio Lenders Survey: U.S. Life Insurers’ Mortgage Outlook

A publication of Summer issue 2015 sponsored by CRE Finance World Summer 2015
61
The top states in which participants originated new loans were California, Texas, Illinois, and New York. Ninety percent of new originations were fixed-rate loans and the remaining 10% were floating rate loans. Among the various real estate product types, multifamily and office properties led originations, at 30% and 32% of the dollar volume total, respectively. Retail and industrial each represented about 15% of total dollar volume.
Exhibit 9Loan Type
Exhibit 10Property Type
The credit quality of insurance companies’ mortgages, as measured by the new mortgage designations Commercial Mortgage (CM) Test Scores, appears to be good. Not all of the 21 survey respondents provided this information. Data was available for about half of the new originations, approximately $7 billion. The majority of insurers that reported this data had strict lending requirements and maintained very high allocations to both CM1 and CM2 scores, totaling a combined 90% or greater. These insurers would be less affected by increased capital requirements if their portfolios became stressed. Three of the insurance companies had exposure to CM3 mortgages, two of which had exposures greater than 17% and the third had an exposure slightly over 6%. Exposure to CM4 mortgages was de minimis, and no firm had allocations in CM5 mortgages.
Exhibit 11CM Test Score
Portfolio Lenders Survey: U.S. Life Insurers’ Mortgage Outlook

CRE Finance World Summer 2015 62
s of April 2015, the Servicers Forum had 656 members and the IRP Committee had 163 members.
Servicers Forum Leadership:Chair: Dan Olsen, KeyBank Real Estate CapitalChair-Elect: Lindsey Wright, C-III Asset ManagementPast-Chair: Tom Nealon, LNR Partners
IRP Committee Leadership:Leslie Hayton, Wells FargoHeather Wagner, PNC/Midland
The Servicers Forum is not only the largest of CREFC’s Forums, but it is also one of the most active. Currently the Servicers Forum is engaged in numerous initiatives outlined in this article. Members include Master Servicers, Special Servicers, Rating Agencies, Trustees, Certificate Administrators, Operating Advisors, Data Providers, and counsel, among others, making the Servicers Forum the most comprehensive forum with representation from a wide segment of industry participants. With nearly 700 individual members, the Servicers Forum, together with the IRP Committee, plays an integral role in setting industry standards and best practices for the CMBS market. In addition to these important industry initiatives, the Servicers Forum also promotes educational programming. This year, we plan to host After-Work Seminars in Charlotte, Kansas City, Miami, and San Francisco.
The industry is currently facing several regulatory challenges that will be impacting the CMBS market, including Regulation AB II and Risk Retention, which have a direct impact on the servicing sector. CREFC is addressing implementation issues resulting from these comprehensive rules through various working groups. In addition to its efforts on regulatory issues, the Servicers Forum and IRP Committee also address current market business challenges and trends. There are many active working groups, some of which have already released final best practice drafts and recommendations. The Servicers Forum’s continued objective is the efficiency and effectiveness of the execution of CMBS servicer related responsibilities, especially with regard to communication and timing, and the promotion of market transparency for all parties, including investors.
Many of the initiatives the Servicers Forum is working on will require coordination and support from the other CREFC forums to ensure optimal results. We encourage other forum leaders to reach out to the Servicers Forum Leadership with any ideas that will improve our industry.
Here are the highlights of these various initiatives, including why they are important to the market and when they go into effect.
Reg AB II Schedule AL Working Group — (Active)Co-Chair Leslie Hayon, Wells FargoCo-Chair Kathleen Olin, CWCapital
In order to ensure a standardized industry approach to implementation of the new asset-level disclosure and reporting requirements in Reg AB II, which was finalized August 27, 2014, CREFC has created a Schedule AL Working Group.
Schedule AL will be used for both the offering disclosure as well as ongoing disclosures. While many of CREFC’s recommendations regarding asset-level data points were adopted, the new Schedule AL does not map exactly to the CREFC IRP or Annex A.
This working group is comprised of master and special servicers and other market participants, and has conducted a line by line comparison of the SEC’s required asset-level data points to the CREFC IRP and Annex A to determine which fields are new or similar, and how to report such information going forward in the most efficient and useful manner.
Current StatusThe working group held a fly-in meeting in Dallas on January 27 & 28 to conduct a line-by-line comparison of the SEC Schedule AL and CREFC IRP. The data mapping draft document is currently being reviewed by working group members. The working group also held conference calls with XML experts from various master servicers and trustees to review programming and cost estimates for implementing the Schedule AL XML reporting requirements. Next, the working group will reconvene to discuss finalizing the data mapping document and to review procedures for producing Schedule AL in XML format. It is expected that the trustee will be the party responsible for filing Schedule AL with the SEC once it is in XML.
17g-5 Best Practices — (Active)Co-Chair Stacy Ackermann, K&L GatesCo-Chair Adam Fox, Fitch RatingsCo-Chair Iris Woo, Wells Fargo
Effective June 2010, The Securities and Exchange Commission (SEC) promulgated a regulation, 17g-5, which imposed additional disclosure and conflict of interest requirements on nationally
A
2015 Servicers Forum Overview
Dan OlsenSenior Vice PresidentKeyBank Real Estate Capital
foRuM SPotlIgHt

A publication of Summer issue 2015 sponsored by CRE Finance World Summer 2015
63
recognized statistical rating organizations (“NRSROs”) and, by extension, additional disclosure requirements on issuers, sponsors, and underwriters (collectively, “arrangers”) of structured finance products. The stated purpose of the Rule is to encourage more ratings of structured finance deals by non-hired NRSROs, thereby mitigating the effects of any conflict of interest that may be associated with a rating obtained under the arranger-paid framework, and discouraging “ratings shopping.”
Last fall CREFC formed a 17g-5 working group to address ongoing implementation issues relating to the flow of information through 17g-5 websites between Servicers, Rating Agencies, and IP Providers. Issues include timing of web posts, push confirmations, and technological issues, and inconsistent PSA language.
Current StatusBest practices are expected to be finalized and adopted in 2Q 2015.
Operating Statements, Rent Rolls and OSARs (OSAR) Best Practices — (Complete)Chair Grace Holst, Strategic Asset Services
The OSARs working group was created to establish best practices for the delivery and information flow of Operating Statements, Rent Rolls and OSARs.
The working group produced a best practices document that was released on December 29th, 2014 and is effective immediately.
Special Servicer Transfers Best Practices — (Complete)Co-Chair Tom Nealon, LNR PartnersCo-Chair Chris Nuxoll, U.S. BankCo-Chair Lindsey Wright, C-III Asset ManagementCo-Chair Kenda Tomes, Stinson Leonard Street LLP
The Special Servicer Transfers working group was formed to address challenges that arise when dealing with the transfer of the named Special Servicer on a CMBS trust, including the flow of information and documents between Servicers, RACs, logistical and timing issues, appraisals, and reporting/communication issues.
The SS Transfers working group produced a best practices document that was released on December 29th, 2014 and is effective immediately.
Best Practices for Reporting on Excess Liquidation Proceeds — (Complete)Chair Craig Zedalis, Wells Fargo
The working group addressed reporting issues under circumstances when there is an REO loan that subsequently is sold and results in excess proceeds. The group produced a best practices document that was released on December 29th, 2014 and is effective immediately.
Guidance for Writing-off B-notes and Realized Loss Reporting — (Complete)Chair Bob Brice, Midland Loan Services
The working group developed guidance on reporting subsequent losses on B-notes in a modified loan situation. The group produced a guidance document that was released on December 29th, 2014 that is effective immediately.
New and Revised Watchlist Criteria — (Complete)Co-Chair Michael Brunner, JP MorganCo-Chair Tricia Hall, AIGCo-Chair Leslie Hayton, Wells Fargo
Last fall CREFC launched an initiative to perform a comprehensive review of the current Watchlist criteria and reporting practices with the objective of making recommendations to enhance the value of the Watchlist to market participants, especially investors. The Watchlist serves as an early warning system that identifies loans with a high potential for default.
The Watchlist Subcommittee includes representatives from all CMBS market participants including Master Servicers, Investors, Issuers, Data Providers and Rating Agencies.
As a result of several months of working group meetings along with input from the Servicers Forum and IG Bondholders Forum, the IRP Committee and Watchlist Subcommittee have approved proposed changes to the CREFC Watchlist, Portfolio Review Guidelines, and newly created Implementation Guideline. The Implementation Guideline, designed to assist Servicers and Investors, contains best practices for commentary and provides further clarification for triggers.
2015 Servicers Forum Overview

CRE Finance World Summer 2015 64
One of the biggest changes users of the Watchlist will find is the creation of a “Credit or Informational” column on the Watchlist and in the Portfolio Review Guidelines to accompany each trigger. The purpose of this new column is to help users navigate the Watchlist more efficiently so that loans triggering for “Credit” issues are easily identified.
Current StatusCREFC held an open comment period from March 19 to April 25, 2014 for members to submit their input on these proposed changes and the Forums adopted the new and revised Watchlist criteria. The implementation date is June 30, 2015. No early adoption is permitted.
Loan and REO Liquidation Reports Best Practices — (Complete)Chair Libby Luther, C-III Asset Management
The Loan and REO Liquidation Reports best practices working group was created to develop a best practices document. The working group addressed the following issues:
• Determine what codes from the IRP file can be auto populated to the Loan and REO Liquidation templates
• Reach out to the investor community and solicit their feedback on the reporting of loan and REO resolutions
• Establish consistent information reported on the Loan and REO Liquidation Templates (i.e. add/delete fields, participated loans, multi-property loans)
• Clarify fields reported on the Loan and REO Liquidation Templates (i.e. total fees to special servicer affiliated entities)
• Identify reporting contacts at the Master Servicer and Certificate Administrator for template submission
The best practices document was released on December 29th, 2014 and is effective immediately.
1099 Tax Reporting Best Practices Update – (Complete)Chair Grace Holst, Strategic Asset Services
The 1099 Tax Reporting working group was reconvened this year to address confusion within the industry on how to appropriately use the 1099 Tax forms. To complement the 1099 Tax Reporting Best Practices in Section IX of the IRP, the working group updated the 1099 Servicer Contact sheet to ensure that filings are completed on a timely basis and with the appropriate party. Additionally, the working group created a 1099 Tax Reporting “Reference Sheet” and a list of “Frequently Asked Questions” to further assist Servicers in navigating the 1099 filing process.
Other InitiativesIn addition to the aforementioned projects, the Servicers Forum is looking to create new working groups to address best practices for Winding Down CMBS Trusts and the standardization of procedures and requirements for performing loan consent forms. We are also looking to re-start the Rating Agency Transition Standardization working group. Please contact the Servicers Forum leadership or CREFC if you would like to co-chair or be involved in one of these initiatives.
While the Servicers Forum has considerable work to do in 2015, the forum’s leadership is always open to any recommendations for additional issues to improve our industry. Please feel free to contact the forum leadership or CREFC with your ideas. We greatly appreciate all the efforts of the working group leaders and members for all their hard work.
2015 Servicers Forum Overview

A publication of Summer issue 2015 sponsored by CRE Finance World Summer 2015
65
ecall the chemistry demonstration where a beaker of water was placed onto a Bunsen burner, and as it boiled, the vapor collected in another beaker as it cooled off. In grammar school we thought it was magic, but by high school we realized it was pure science. As we grew older,
and our viewpoints and horizons expanded, the experiment can be thought of as indicative of the circle of life and the cosmic meaningfulness of how this simple experiment could keep our planet, if not the entire universe alive.
Well, a similar experiment is in full force with respect to distressed realty assets. Things have indeed heated up as a flood of money has come to commercial real estate finance resulting in an evaporation of the opportunities available in non-performing loans. Competition for new loans is intense and as lenders look deeper and further for yield, they are funding riskier and more transitional deals, driving up values. This heating up has started to bubble over resulting in troubled deals vaporizing right before our eyes. Have they disappeared? Not exactly — just like the water vapor of our simple experiment, they are merely in another form, waiting for things to cool off until they condense and fill some other container ready for consumption by those seeking that new liquid NPL.
In short — we are in the part of the commercial real estate finance cycle where it’s easy to borrow, increasingly valuable to sell and harder and harder to find great opportunities at marked down prices. This has been the message that has resounded at all of the HYDRA Forum meetings and summits held over the past year. Yet, there is a realization that cycles are called cycles because they are ever changing and evolving and the opportunities that evaporate will condense elsewhere and there will be new water for those who participate in the distressed realty markets to drink.
Despite the evaporation of opportunity, the HYDRA Distressed Realty Sub-Forum has remained active and has grown in participants. John D’Amico of Trimont Realty Advisors has served as Chair of the Sub-Forum and Jonathan Schultz as Chair-elect over the past year. Working together with Nik Chillar and Donald Sheets of the High Yield sub-forum and other members of both sub-forums, we have carried out two Forum Conference meetings, two Summits, an After Work Seminar and a high exposure, high fun reception to attract new forum members.
CREFC Annual Meeting, New York, June 2014. The June 2014 HYDRA meeting featured a much more interactive style meeting where audience members were sought out to spar with a panel consisting of HYDRA leadership. John D’Amico roamed the room with a microphone, peppering Kevin Donahue, Greta Guggenheim, Bill O’Connor and others with pointed questions and then sought
follow up comments from Forum participants. The conversation proved lively and Forum members were able to address a variety of topics of interest.
CREFC Investors Conference, Miami Beach, January 2015. The January Forum meeting featured a fascinating presentation by Donald (Don) Sheets on the correlation between oil prices and United States commercial real estate values. Don gave an interesting view not only on markets in Texas and North Dakota, but throughout the country. While many thought that improved consumer cash flow could have a positive effect on commercial real estate, Don’s statistics pointed to a possible decline in commercial real estate values as those states which led the country out of the recession reverse direction by reason of reduced oil production.
HYDRA Summit East, New York and CRE Finance Summit West, Santa Monica. HYDRA ran a very successful Summit in New York in March and as of this writing is planning the West Coast Summit to be held in May. The number of participants in both Summits has held up despite the lack of availability of distressed product and the emphasis of the Summits has moved more towards high yield investment and new focuses of investment such as construction financing, EB5 investment and crowdfunding.
After Work Seminar — The Risk and Return in High Yield Lending. While this event is currently being planned for New York on April 16, 2015, it will have occurred by the time this article is published. I trust that it will be another quality event with lots of interesting and useful information provided to all attendees by our panel plus another great opportunity to network with industry participants.
HYDRA Reception in conjunction with the Trigild Lenders Conference in San Diego. Once again the HYDRA Forum was able to hold an evening reception at the fall Trigild Lenders Conference in San Diego. The purpose of the reception was to introduce industry participants, especially those on the West Coast, to the HYDRA Forum and CREFC, the “voice of commercial real estate finance.” It is amazing that there are people involved in commercial real estate finance who do not truly understand what CREFC and HYDRA do and membership increases can be directly related to these receptions.
HYDRA is committed to providing the best education on the most up to date issues facing our industry and the best way to take advantage of this mission is to get involved. We urge everyone to join the Forum and provide it with your energy and ideas. In the meantime, keep your eye on that second beaker — it’s likely to start showing some condensation very soon.
R
HYDRA Sub-Forum Spotlight Distressed Realty Assets Sub-Forum John D’Amico
DirectorTrimont
foRuM SPotlIgHt

A Single Platform for Seamless Execution and Value Creation
C-III Capital Partners
Acquisition & Disposition Transactions
Lending & Equity
Capitalization
Servicing &Asset
Management
For more informationplease visit www.c3cp.com
Cadwalader, Wickersham & Taft LLPwww.cadwalader.com
To stay ahead,we actually draw the curve.
Cadwalader is a recognized leader in capital markets and real estate finance. Our standout lawyers have extensive track records advising clients on the origination, underwriting, structuring and securitization of commercial real estate loans across the full spectrum of projects and portfolios. We offer the insight and experience necessary to navigate complex markets offering myriad challenges and opportunities.
WHERE REAL ESTATE IS MOVING™
IN REAL ESTATE, MONEY TALKS. OVER $30 BILLION SOLD in commercial & residential real estate
INTERESTED IN SELLING?
AUCTION.COM/CREFC

Distinctively DechertIn an increasingly complex marketplace, clients worldwide rely on Dechert’s commercial judgment and expertise to achieve their business goals.
Our finance and real estate team represents major industry players in structuring, securitizing, managing and servicing complex and highly structured and securitized commercial real estate debt assets.
To learn more, please contact:
Richard D. Jones +1 212 698 3844
Visit our blog at CrunchedCredit.com
D dechert.com
Having resolved over $44 billion of CRE loans, CWCapital has seen it all. We help clients avoid potential problems and fix the ones that occur. At the forefront of the commercial real estate industry for 20 years, we offer clients unique and extensive CMBS expertise. Resolutions. Results.
We know a bad loan when we see it.
cwcapital.com© CW Financial Services LLC 2014. All rights reserved.
Attorney advertising. Prior results do not guarantee future outcomes. ©2015 Kaye Scholer LLP, 250 West 55th Street, New York, NY 10019-9710. (04072015)
www.kayescholer.com
Kaye Scholer. Building Real Solutions.
Originations
Equity
Debt sales and acquisitions
Securitizations
Syndications
Loan sales
Workouts and restructurings
Leaders in Real Estate Capital Markets
At Fitch Ratings,
we continually meet with
market participants to ensure
our offerings address changing needs.
That’s why we recently enhanced our
U.S. CMBS presale reports to bring you
more comprehensive and actionable
deal information.
Have a look for yourself at fitchratings.com

Capital markets leadershipWells Fargo focuses on maintaining strong relationships with our clients, using the breadth of our platform to deliver exceptional access to capital, liquidity, and investment opportunities. Working with you, project after project, has made us the largest commercial real estate lender in the U.S.1
CMBS loans • Balance sheet loansCapital markets distribution • Warehouse lending Commercial mortgage servicing • Trust services
wellsfargo.com/realestate
Recent CMBS transaction Bank of America Plaza, Los Angeles, CA
1 MBA Commercial Real Estate/Multifamily Finance Firms Annual Origination Volumes, year ending December 31, 2014. Wells Fargo Securities is the trade name for the capital markets and investment banking services of Wells Fargo & Company and its subsidiaries, including but not limited to Wells Fargo Securities, LLC, a member of NYSE, FINRA, NFA and SIPC, Wells Fargo Prime Services, LLC, a member of FINRA, NFA and SIPC, and Wells Fargo Bank, N.A. Wells Fargo Securities, LLC and Wells Fargo Prime Services, LLC are distinct entities from affiliated banks and thrifts © 2015 Wells Fargo Bank, N.A. All rights reserved. WCS-1223650 (04/15)
@ S
hutte
rsto
ck.c
om
www.natixis.com
Because your best interests come first...
Natixis Real Estate Capital offers flexible and creative structures, a simplified process and professional execution, delivered by bankers empowered to make decisions.
Natixis (A/A2/A by S&P/Moody’s/Fitch) is the corporate, investment and financial services arm of Groupe BPCE, France’s second-largest banking group with over 108,000 employees, 8,000 branches and €23.6 billion of Net Revenue.
Phone (212) 891-5700 / [email protected] / www.re.natixis.com
...get the right real estate financing solution
Is your business Powered by Trepp?
Sometimes close enough isn’t good enough.Accuracy and timeliness count.
www.trepp.com
Moody’s Investors ServiceRecognized by global markets as the leading provider of credit ratings, research and risk analysis.
#1 US Credit Rating Agency: 2012, 2013, 2014
#1 Asia Credit Rating Agency: 2012, 2013, 2014
Most Influential Credit Rating Agency: 2013, 2014
© 2
014
Moo
dy's
Inve
stor
s Ser
vice
, Inc
. and
/or i
ts li
cens
ors
and
affil
iate
s. Al
l rig
hts
rese
rved
.

a publication of
CRE FinanCE CounCil EduCation SERiES
CRE Finance Council CMBS E-PrimerA comprehensive review of Commercial Mortgage Backed Securities
CMBS E-Primer Bundle Package PDF format and video recording.
this convenient e-book gives the reader an introductory, yet comprehensive, review of Commercial Mortgage Backed Securities financing.
• a revised and expanded CMBS E-Primer package available for purchase in June, 2015• package will include a PDF and video recording• will be sold by individual user or as a company licenseto purchase the E-Primer, or for more information, visit www.crefc.org or contact Sara thomas, director, Education initiatives, at [email protected].
FUNDS MANAGEMENT SPECIAL SERVICING
430 Park Avenue New York, New York 10022 talmagellc.com