Embed Size (px)
Citation preview
CRÉDIT AGRICOLE GROUP - PILLAR 3 AT 30 JUNE 2016 1
CRÉDIT AGRICOLE GROUP BASEL 3 PILLAR 3 DISCLOSURES
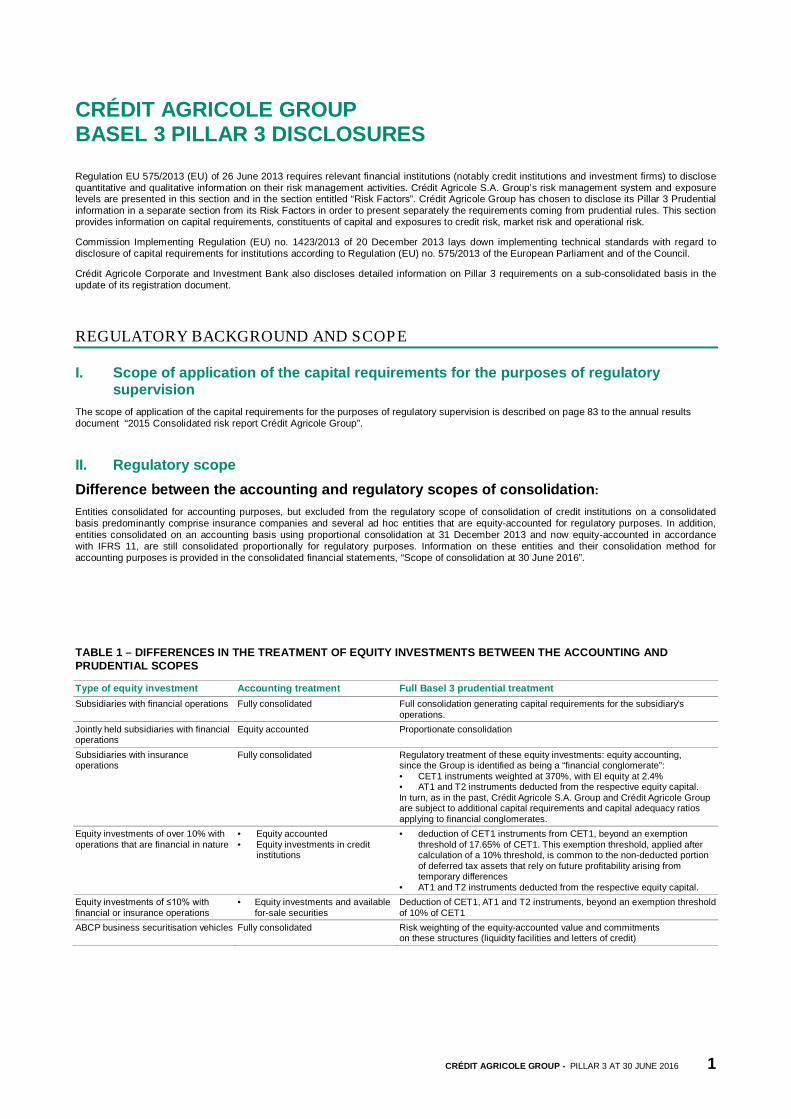
Regulation EU 575/2013 (EU) of 26 June 2013 requires relevant financial institutions (notably credit institutions and investment firms) to disclose quantitative and qualitative information on their risk management activities. Crédit Agricole S.A. Group’s risk management system and exposure levels are presented in this section and in the section entitled “Risk Factors”. Crédit Agricole Group has chosen to disclose its Pillar 3 Prudential information in a separate section from its Risk Factors in order to present separately the requirements coming from prudential rules. This section provides information on capital requirements, constituents of capital and exposures to credit risk, market risk and operational risk.
Commission Implementing Regulation (EU) no. 1423/2013 of 20 December 2013 lays down implementing technical standards with regard to disclosure of capital requirements for institutions according to Regulation (EU) no. 575/2013 of the European Parliament and of the Council.
Crédit Agricole Corporate and Investment Bank also discloses detailed information on Pillar 3 requirements on a sub-consolidated basis in the update of its registration document.
REGULATORY BACKGROUND AND SCOPE
I. Scope of application of the capital requirements for the purposes of regulatory supervision
The scope of application of the capital requirements for the purposes of regulatory supervision is described on page 83 to the annual results document “2015 Consolidated risk report Crédit Agricole Group”.
II. Regulatory scope
Difference between the accounting and regulatory scopes of consolidation: Entities consolidated for accounting purposes, but excluded from the regulatory scope of consolidation of credit institutions on a consolidated basis predominantly comprise insurance companies and several ad hoc entities that are equity-accounted for regulatory purposes. In addition, entities consolidated on an accounting basis using proportional consolidation at 31 December 2013 and now equity-accounted in accordance with IFRS 11, are still consolidated proportionally for regulatory purposes. Information on these entities and their consolidation method for accounting purposes is provided in the consolidated financial statements, “Scope of consolidation at 30 June 2016”.
TABLE 1 – DIFFERENCES IN THE TREATMENT OF EQUITY INVESTMENTS BETWEEN THE ACCOUNTING AND PRUDENTIAL SCOPES
Type of equity investment Accounting treatment Full Basel 3 prudential treatment Subsidiaries with financial operations Fully consolidated Full consolidation generating capital requirements for the subsidiary’s
operations. Jointly held subsidiaries with financial operations
Equity accounted Proportionate consolidation
Subsidiaries with insurance operations
Fully consolidated Regulatory treatment of these equity investments: equity accounting, since the Group is identified as being a “financial conglomerate”: • CET1 instruments weighted at 370%, with El equity at 2.4% • AT1 and T2 instruments deducted from the respective equity capital. In turn, as in the past, Crédit Agricole S.A. Group and Crédit Agricole Group are subject to additional capital requirements and capital adequacy ratios applying to financial conglomerates.
Equity investments of over 10% with operations that are financial in nature
• Equity accounted • Equity investments in credit
institutions
• deduction of CET1 instruments from CET1, beyond an exemption threshold of 17.65% of CET1. This exemption threshold, applied after calculation of a 10% threshold, is common to the non-deducted portion of deferred tax assets that rely on future profitability arising from temporary differences
• AT1 and T2 instruments deducted from the respective equity capital. Equity investments of ≤10% with financial or insurance operations
• Equity investments and available for-sale securities
Deduction of CET1, AT1 and T2 instruments, beyond an exemption threshold of 10% of CET1
ABCP business securitisation vehicles Fully consolidated Risk weighting of the equity-accounted value and commitments on these structures (liquidity facilities and letters of credit)
CRÉDIT AGRICOLE GROUP - PILLAR 3 AT 30 JUNE 2016 2
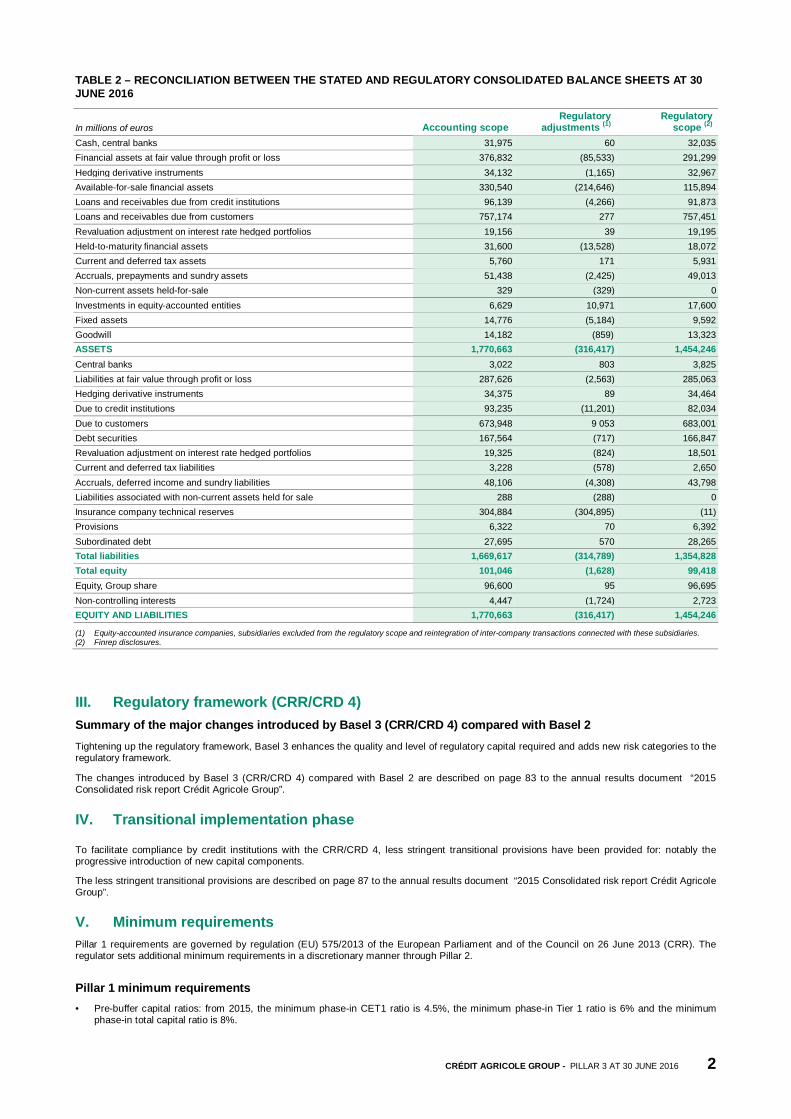
TABLE 2 – RECONCILIATION BETWEEN THE STATED AND REGULATORY CONSOLIDATED BALANCE SHEETS AT 30 JUNE 2016
In millions of euros Accounting scope Regulatory
adjustments (1) Regulatory
scope (2) Cash, central banks 31,975 60 32,035 Financial assets at fair value through profit or loss 376,832 (85,533) 291,299 Hedging derivative instruments 34,132 (1,165) 32,967 Available-for-sale financial assets 330,540 (214,646) 115,894 Loans and receivables due from credit institutions 96,139 (4,266) 91,873 Loans and receivables due from customers 757,174 277 757,451 Revaluation adjustment on interest rate hedged portfolios 19,156 39 19,195 Held-to-maturity financial assets 31,600 (13,528) 18,072 Current and deferred tax assets 5,760 171 5,931 Accruals, prepayments and sundry assets 51,438 (2,425) 49,013 Non-current assets held-for-sale 329 (329) 0 Investments in equity-accounted entities 6,629 10,971 17,600 Fixed assets 14,776 (5,184) 9,592 Goodwill 14,182 (859) 13,323 ASSETS 1,770,663 (316,417) 1,454,246 Central banks 3,022 803 3,825 Liabilities at fair value through profit or loss 287,626 (2,563) 285,063 Hedging derivative instruments 34,375 89 34,464 Due to credit institutions 93,235 (11,201) 82,034 Due to customers 673,948 9 053 683,001 Debt securities 167,564 (717) 166,847 Revaluation adjustment on interest rate hedged portfolios 19,325 (824) 18,501 Current and deferred tax liabilities 3,228 (578) 2,650 Accruals, deferred income and sundry liabilities 48,106 (4,308) 43,798 Liabilities associated with non-current assets held for sale 288 (288) 0 Insurance company technical reserves 304,884 (304,895) (11) Provisions 6,322 70 6,392 Subordinated debt 27,695 570 28,265 Total liabilities 1,669,617 (314,789) 1,354,828 Total equity 101,046 (1,628) 99,418 Equity, Group share 96,600 95 96,695 Non-controlling interests 4,447 (1,724) 2,723 EQUITY AND LIABILITIES 1,770,663 (316,417) 1,454,246
(1) Equity-accounted insurance companies, subsidiaries excluded from the regulatory scope and reintegration of inter-company transactions connected with these subsidiaries. (2) Finrep disclosures.
III. Regulatory framework (CRR/CRD 4) Summary of the major changes introduced by Basel 3 (CRR/CRD 4) compared with Basel 2 Tightening up the regulatory framework, Basel 3 enhances the quality and level of regulatory capital required and adds new risk categories to the regulatory framework.
The changes introduced by Basel 3 (CRR/CRD 4) compared with Basel 2 are described on page 83 to the annual results document “2015 Consolidated risk report Crédit Agricole Group”.
IV. Transitional implementation phase
To facilitate compliance by credit institutions with the CRR/CRD 4, less stringent transitional provisions have been provided for: notably the progressive introduction of new capital components.
The less stringent transitional provisions are described on page 87 to the annual results document “2015 Consolidated risk report Crédit Agricole Group”.
V. Minimum requirements Pillar 1 requirements are governed by regulation (EU) 575/2013 of the European Parliament and of the Council on 26 June 2013 (CRR). The regulator sets additional minimum requirements in a discretionary manner through Pillar 2.
Pillar 1 minimum requirements • Pre-buffer capital ratios: from 2015, the minimum phase-in CET1 ratio is 4.5%, the minimum phase-in Tier 1 ratio is 6% and the minimum
phase-in total capital ratio is 8%.
CRÉDIT AGRICOLE GROUP - PILLAR 3 AT 30 JUNE 2016 3
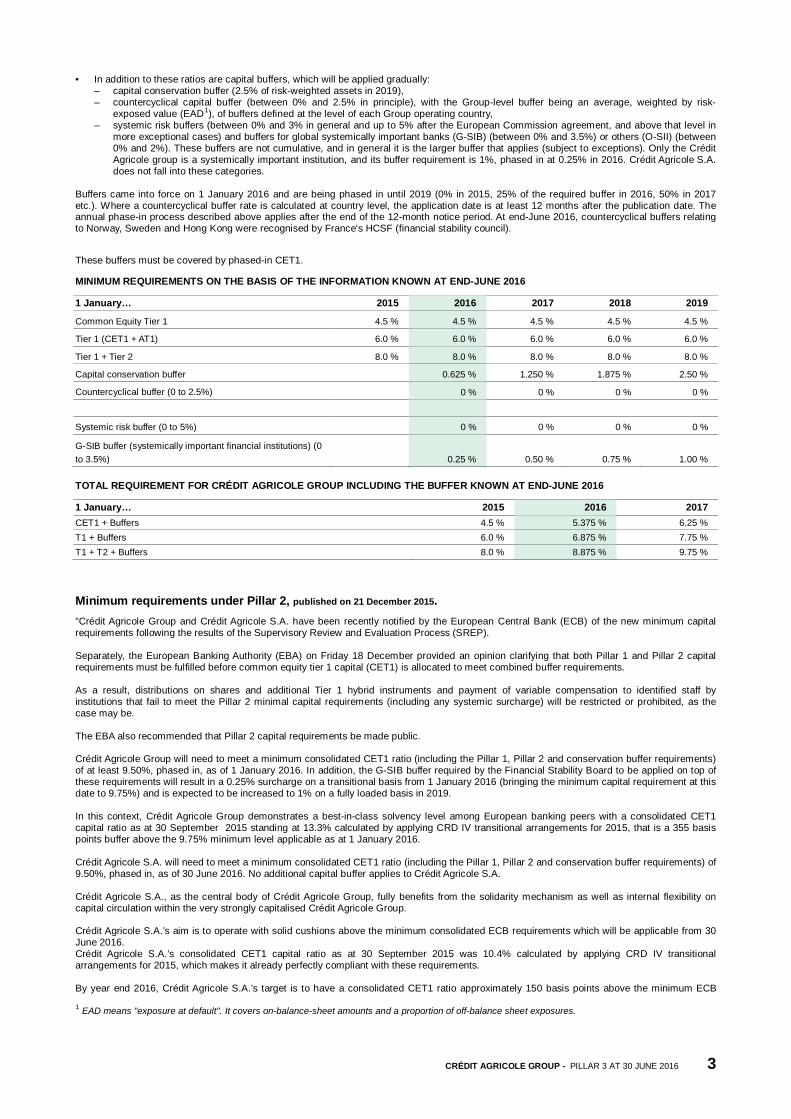
• In addition to these ratios are capital buffers, which will be applied gradually: – capital conservation buffer (2.5% of risk-weighted assets in 2019), – countercyclical capital buffer (between 0% and 2.5% in principle), with the Group-level buffer being an average, weighted by risk-
exposed value (EAD1), of buffers defined at the level of each Group operating country, – systemic risk buffers (between 0% and 3% in general and up to 5% after the European Commission agreement, and above that level in
more exceptional cases) and buffers for global systemically important banks (G-SIB) (between 0% and 3.5%) or others (O-SII) (between 0% and 2%). These buffers are not cumulative, and in general it is the larger buffer that applies (subject to exceptions). Only the Crédit Agricole group is a systemically important institution, and its buffer requirement is 1%, phased in at 0.25% in 2016. Crédit Agricole S.A. does not fall into these categories.
Buffers came into force on 1 January 2016 and are being phased in until 2019 (0% in 2015, 25% of the required buffer in 2016, 50% in 2017 etc.). Where a countercyclical buffer rate is calculated at country level, the application date is at least 12 months after the publication date. The annual phase-in process described above applies after the end of the 12-month notice period. At end-June 2016, countercyclical buffers relating to Norway, Sweden and Hong Kong were recognised by France's HCSF (financial stability council).
These buffers must be covered by phased-in CET1.
MINIMUM REQUIREMENTS ON THE BASIS OF THE INFORMATION KNOWN AT END-JUNE 2016
1 January… 2015 2016 2017 2018 2019
Common Equity Tier 1 4.5 % 4.5 % 4.5 % 4.5 % 4.5 %
Tier 1 (CET1 + AT1) 6.0 % 6.0 % 6.0 % 6.0 % 6.0 %
Tier 1 + Tier 2 8.0 % 8.0 % 8.0 % 8.0 % 8.0 %
Capital conservation buffer 0.625 % 1.250 % 1.875 % 2.50 %
Countercyclical buffer (0 to 2.5%) 0 % 0 % 0 % 0 %
Systemic risk buffer (0 to 5%) 0 % 0 % 0 % 0 %
G-SIB buffer (systemically important financial institutions) (0 to 3.5%) 0.25 % 0.50 % 0.75 % 1.00 % TOTAL REQUIREMENT FOR CRÉDIT AGRICOLE GROUP INCLUDING THE BUFFER KNOWN AT END-JUNE 2016
1 January… 2015 2016 2017 CET1 + Buffers 4.5 % 5.375 % 6.25 % T1 + Buffers 6.0 % 6.875 % 7.75 % T1 + T2 + Buffers 8.0 % 8.875 % 9.75 %
Minimum requirements under Pillar 2, published on 21 December 2015. "Crédit Agricole Group and Crédit Agricole S.A. have been recently notified by the European Central Bank (ECB) of the new minimum capital requirements following the results of the Supervisory Review and Evaluation Process (SREP). Separately, the European Banking Authority (EBA) on Friday 18 December provided an opinion clarifying that both Pillar 1 and Pillar 2 capital requirements must be fulfilled before common equity tier 1 capital (CET1) is allocated to meet combined buffer requirements. As a result, distributions on shares and additional Tier 1 hybrid instruments and payment of variable compensation to identified staff by institutions that fail to meet the Pillar 2 minimal capital requirements (including any systemic surcharge) will be restricted or prohibited, as the case may be. The EBA also recommended that Pillar 2 capital requirements be made public. Crédit Agricole Group will need to meet a minimum consolidated CET1 ratio (including the Pillar 1, Pillar 2 and conservation buffer requirements) of at least 9.50%, phased in, as of 1 January 2016. In addition, the G-SIB buffer required by the Financial Stability Board to be applied on top of these requirements will result in a 0.25% surcharge on a transitional basis from 1 January 2016 (bringing the minimum capital requirement at this date to 9.75%) and is expected to be increased to 1% on a fully loaded basis in 2019. In this context, Crédit Agricole Group demonstrates a best-in-class solvency level among European banking peers with a consolidated CET1 capital ratio as at 30 September 2015 standing at 13.3% calculated by applying CRD IV transitional arrangements for 2015, that is a 355 basis points buffer above the 9.75% minimum level applicable as at 1 January 2016. Crédit Agricole S.A. will need to meet a minimum consolidated CET1 ratio (including the Pillar 1, Pillar 2 and conservation buffer requirements) of 9.50%, phased in, as of 30 June 2016. No additional capital buffer applies to Crédit Agricole S.A. Crédit Agricole S.A., as the central body of Crédit Agricole Group, fully benefits from the solidarity mechanism as well as internal flexibility on capital circulation within the very strongly capitalised Crédit Agricole Group. Crédit Agricole S.A.’s aim is to operate with solid cushions above the minimum consolidated ECB requirements which will be applicable from 30 June 2016. Crédit Agricole S.A.’s consolidated CET1 capital ratio as at 30 September 2015 was 10.4% calculated by applying CRD IV transitional arrangements for 2015, which makes it already perfectly compliant with these requirements. By year end 2016, Crédit Agricole S.A.’s target is to have a consolidated CET1 ratio approximately 150 basis points above the minimum ECB
1 EAD means "exposure at default". It covers on-balance-sheet amounts and a proportion of off-balance sheet exposures.
CRÉDIT AGRICOLE GROUP - PILLAR 3 AT 30 JUNE 2016 4
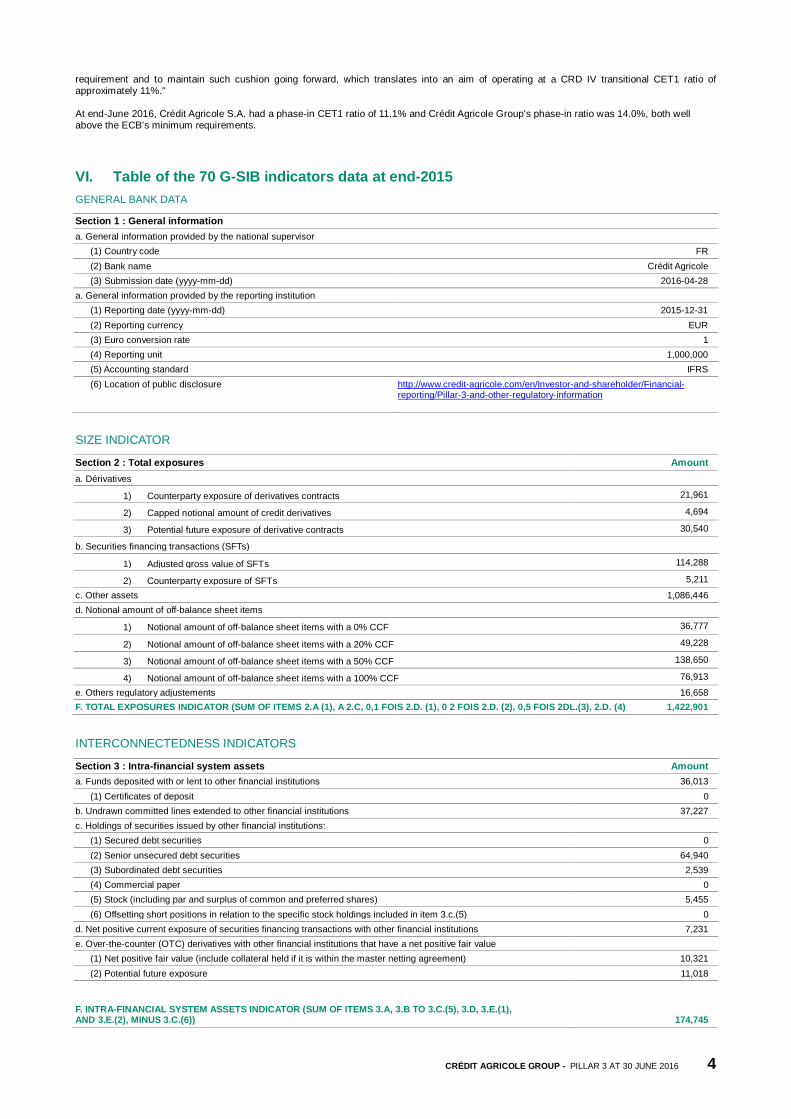
requirement and to maintain such cushion going forward, which translates into an aim of operating at a CRD IV transitional CET1 ratio of approximately 11%." At end-June 2016, Crédit Agricole S.A. had a phase-in CET1 ratio of 11.1% and Crédit Agricole Group's phase-in ratio was 14.0%, both well above the ECB's minimum requirements.
VI. Table of the 70 G-SIB indicators data at end-2015 GENERAL BANK DATA
Section 1 : General information a. General information provided by the national supervisor
(1) Country code FR (2) Bank name Crédit Agricole (3) Submission date (yyyy-mm-dd) 2016-04-28
a. General information provided by the reporting institution (1) Reporting date (yyyy-mm-dd) 2015-12-31 (2) Reporting currency EUR (3) Euro conversion rate 1 (4) Reporting unit 1,000,000 (5) Accounting standard IFRS (6) Location of public disclosure http://www.credit-agricole.com/en/Investor-and-shareholder/Financial-
reporting/Pillar-3-and-other-regulatory-information
SIZE INDICATOR
Section 2 : Total exposures Amount a. Dérivatives
1) Counterparty exposure of derivatives contracts 21,961
2) Capped notional amount of credit derivatives 4,694
3) Potential future exposure of derivative contracts 30,540
b. Securities financing transactions (SFTs)
1) Adjusted gross value of SFTs 114,288
2) Counterparty exposure of SFTs 5,211
c. Other assets 1,086,446 d. Notional amount of off-balance sheet items
1) Notional amount of off-balance sheet items with a 0% CCF 36,777
2) Notional amount of off-balance sheet items with a 20% CCF 49,228
3) Notional amount of off-balance sheet items with a 50% CCF 138,650
4) Notional amount of off-balance sheet items with a 100% CCF 76,913
e. Others regulatory adjustements 16,658 F. TOTAL EXPOSURES INDICATOR (SUM OF ITEMS 2.A (1), A 2.C, 0,1 FOIS 2.D. (1), 0 2 FOIS 2.D. (2), 0,5 FOIS 2DL.(3), 2.D. (4) 1,422,901
INTERCONNECTEDNESS INDICATORS
Section 3 : Intra-financial system assets Amount a. Funds deposited with or lent to other financial institutions 36,013
(1) Certificates of deposit 0 b. Undrawn committed lines extended to other financial institutions 37,227 c. Holdings of securities issued by other financial institutions:
(1) Secured debt securities 0 (2) Senior unsecured debt securities 64,940 (3) Subordinated debt securities 2,539 (4) Commercial paper 0 (5) Stock (including par and surplus of common and preferred shares) 5,455 (6) Offsetting short positions in relation to the specific stock holdings included in item 3.c.(5) 0
d. Net positive current exposure of securities financing transactions with other financial institutions 7,231 e. Over-the-counter (OTC) derivatives with other financial institutions that have a net positive fair value
(1) Net positive fair value (include collateral held if it is within the master netting agreement) 10,321 (2) Potential future exposure 11,018
F. INTRA-FINANCIAL SYSTEM ASSETS INDICATOR (SUM OF ITEMS 3.A, 3.B TO 3.C.(5), 3.D, 3.E.(1), AND 3.E.(2), MINUS 3.C.(6)) 174,745
CRÉDIT AGRICOLE GROUP - PILLAR 3 AT 30 JUNE 2016 5
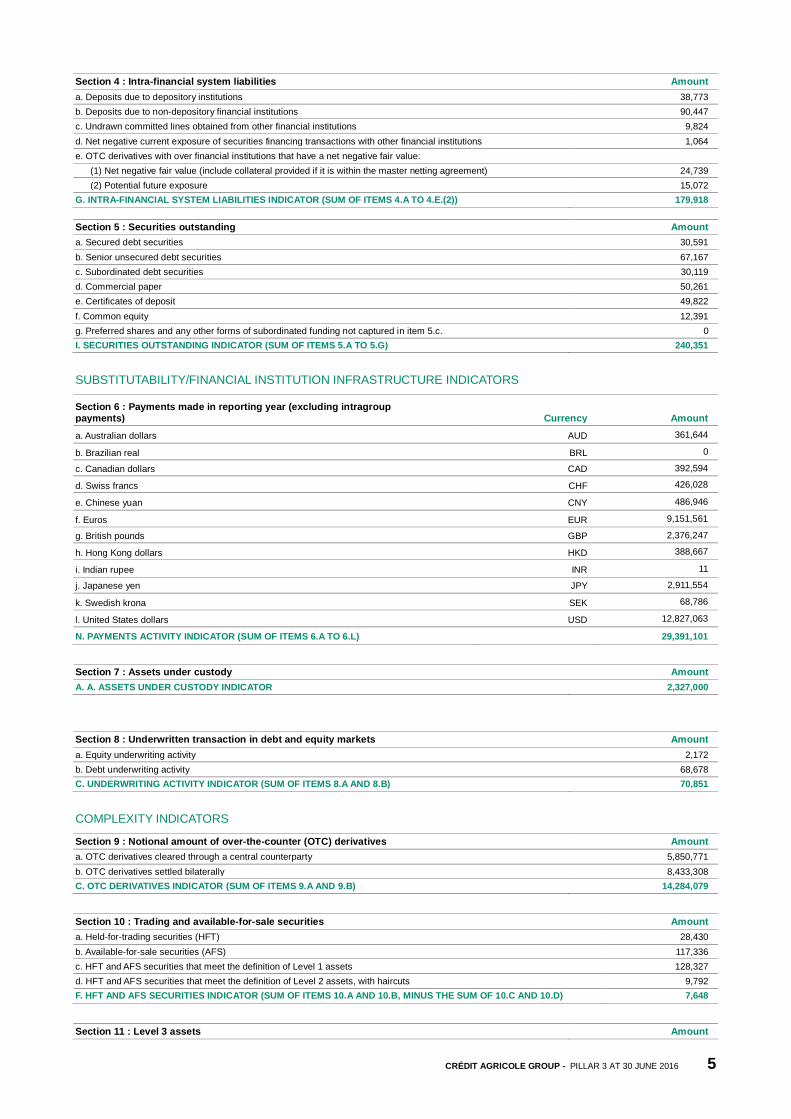
Section 4 : Intra-financial system liabilities Amount a. Deposits due to depository institutions 38,773 b. Deposits due to non-depository financial institutions 90,447 c. Undrawn committed lines obtained from other financial institutions 9,824 d. Net negative current exposure of securities financing transactions with other financial institutions 1,064 e. OTC derivatives with over financial institutions that have a net negative fair value:
(1) Net negative fair value (include collateral provided if it is within the master netting agreement) 24,739 (2) Potential future exposure 15,072
G. INTRA-FINANCIAL SYSTEM LIABILITIES INDICATOR (SUM OF ITEMS 4.A TO 4.E.(2)) 179,918 Section 5 : Securities outstanding Amount a. Secured debt securities 30,591 b. Senior unsecured debt securities 67,167 c. Subordinated debt securities 30,119 d. Commercial paper 50,261 e. Certificates of deposit 49,822 f. Common equity 12,391 g. Preferred shares and any other forms of subordinated funding not captured in item 5.c. 0 I. SECURITIES OUTSTANDING INDICATOR (SUM OF ITEMS 5.A TO 5.G) 240,351
SUBSTITUTABILITY/FINANCIAL INSTITUTION INFRASTRUCTURE INDICATORS
Section 6 : Payments made in reporting year (excluding intragroup payments) Currency Amount a. Australian dollars AUD 361,644
b. Brazilian real BRL 0
c. Canadian dollars CAD 392,594
d. Swiss francs CHF 426,028
e. Chinese yuan CNY 486,946
f. Euros EUR 9,151,561
g. British pounds GBP 2,376,247
h. Hong Kong dollars HKD 388,667
i. Indian rupee INR 11
j. Japanese yen JPY 2,911,554
k. Swedish krona SEK 68,786
l. United States dollars USD 12,827,063
N. PAYMENTS ACTIVITY INDICATOR (SUM OF ITEMS 6.A TO 6.L) 29,391,101
Section 7 : Assets under custody Amount A. A. ASSETS UNDER CUSTODY INDICATOR 2,327,000
Section 8 : Underwritten transaction in debt and equity markets Amount a. Equity underwriting activity 2,172 b. Debt underwriting activity 68,678 C. UNDERWRITING ACTIVITY INDICATOR (SUM OF ITEMS 8.A AND 8.B) 70,851
COMPLEXITY INDICATORS
Section 9 : Notional amount of over-the-counter (OTC) derivatives Amount a. OTC derivatives cleared through a central counterparty 5,850,771 b. OTC derivatives settled bilaterally 8,433,308 C. OTC DERIVATIVES INDICATOR (SUM OF ITEMS 9.A AND 9.B) 14,284,079
Section 10 : Trading and available-for-sale securities Amount a. Held-for-trading securities (HFT) 28,430 b. Available-for-sale securities (AFS) 117,336 c. HFT and AFS securities that meet the definition of Level 1 assets 128,327 d. HFT and AFS securities that meet the definition of Level 2 assets, with haircuts 9,792 F. HFT AND AFS SECURITIES INDICATOR (SUM OF ITEMS 10.A AND 10.B, MINUS THE SUM OF 10.C AND 10.D) 7,648
Section 11 : Level 3 assets Amount
CRÉDIT AGRICOLE GROUP - PILLAR 3 AT 30 JUNE 2016 6
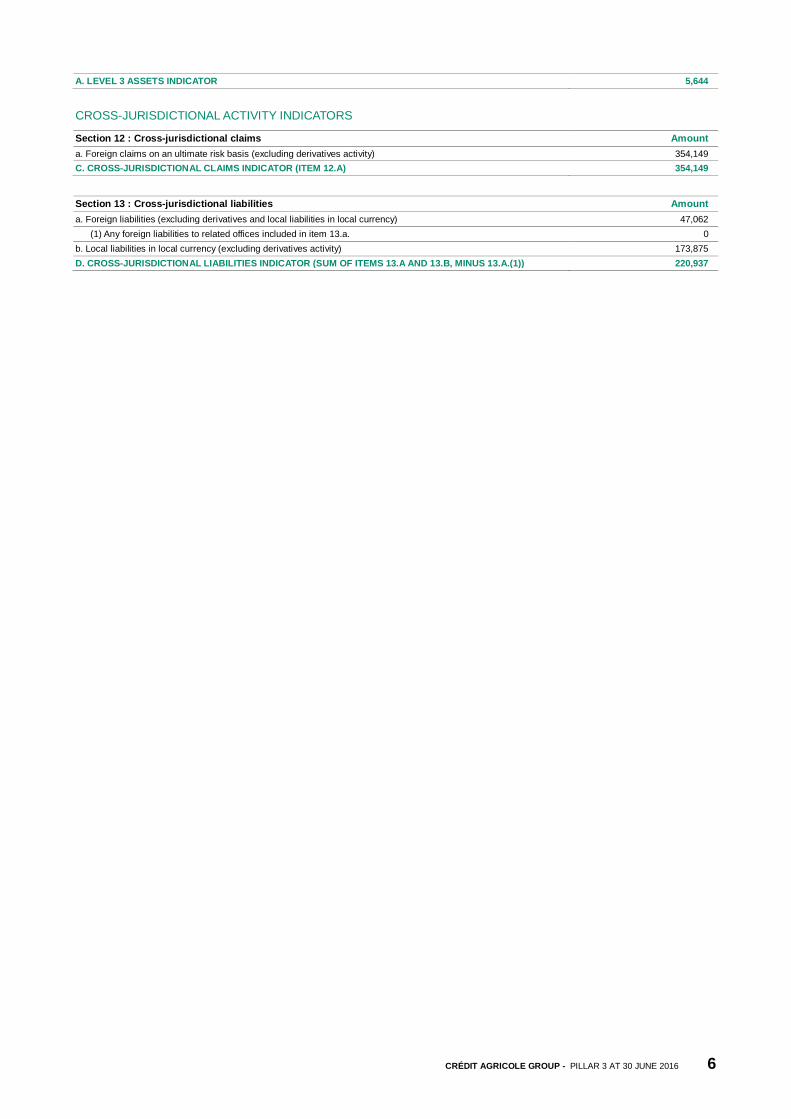
A. LEVEL 3 ASSETS INDICATOR 5,644
CROSS-JURISDICTIONAL ACTIVITY INDICATORS
Section 12 : Cross-jurisdictional claims Amount a. Foreign claims on an ultimate risk basis (excluding derivatives activity) 354,149 C. CROSS-JURISDICTIONAL CLAIMS INDICATOR (ITEM 12.A) 354,149
Section 13 : Cross-jurisdictional liabilities Amount a. Foreign liabilities (excluding derivatives and local liabilities in local currency) 47,062
(1) Any foreign liabilities to related offices included in item 13.a. 0 b. Local liabilities in local currency (excluding derivatives activity) 173,875 D. CROSS-JURISDICTIONAL LIABILITIES INDICATOR (SUM OF ITEMS 13.A AND 13.B, MINUS 13.A.(1)) 220,937
CRÉDIT AGRICOLE GROUP - PILLAR 3 AT 30 JUNE 2016 7
INDICATORS AND REGULATORY RATIOS
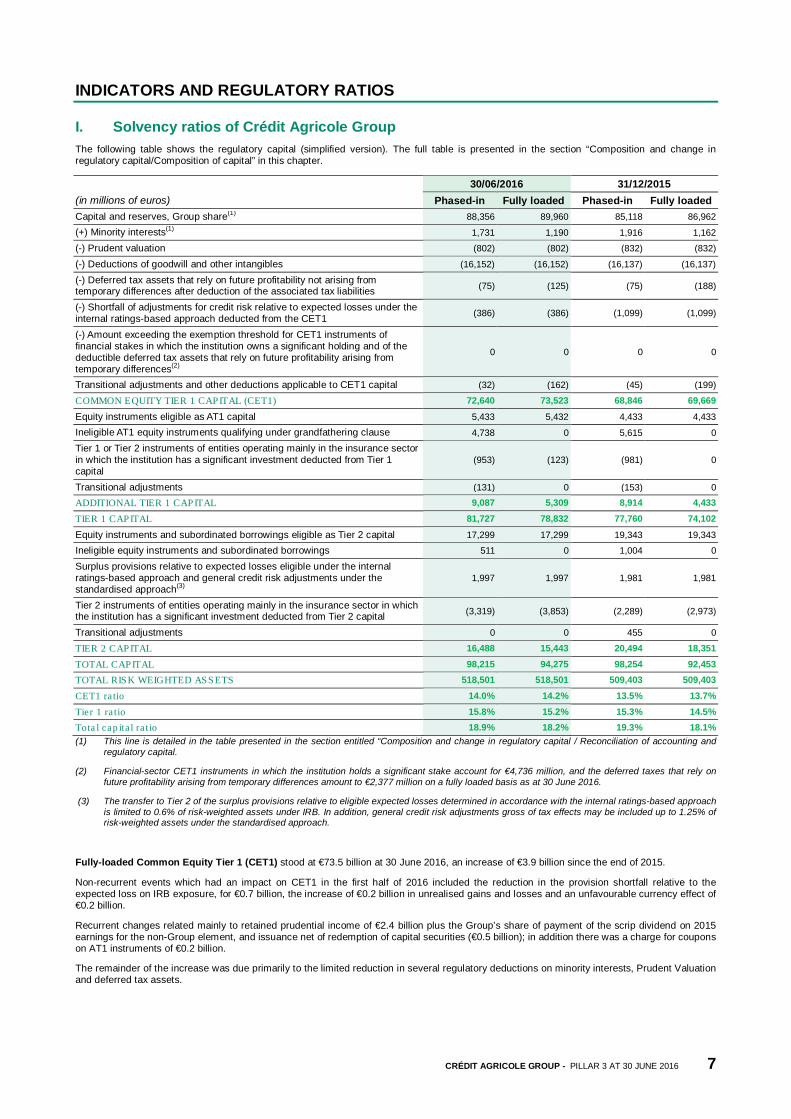
I. Solvency ratios of Crédit Agricole Group The following table shows the regulatory capital (simplified version). The full table is presented in the section “Composition and change in regulatory capital/Composition of capital” in this chapter.
(in millions of euros) 30/06/2016 31/12/2015
Phased-in Fully loaded Phased-in Fully loaded Capital and reserves, Group share(1) 88,356 89,960 85,118 86,962 (+) Minority interests(1) 1,731 1,190 1,916 1,162 (-) Prudent valuation (802) (802) (832) (832) (-) Deductions of goodwill and other intangibles (16,152) (16,152) (16,137) (16,137)
(-) Deferred tax assets that rely on future profitability not arising from temporary differences after deduction of the associated tax liabilities (75) (125) (75) (188)
(-) Shortfall of adjustments for credit risk relative to expected losses under the internal ratings-based approach deducted from the CET1 (386) (386) (1,099) (1,099)
(-) Amount exceeding the exemption threshold for CET1 instruments of financial stakes in which the institution owns a significant holding and of the deductible deferred tax assets that rely on future profitability arising from temporary differences(2)
0 0 0 0
Transitional adjustments and other deductions applicable to CET1 capital (32) (162) (45) (199) COMMON EQUITY TIER 1 CAPITAL (CET1) 72,640 73,523 68,846 69,669 Equity instruments eligible as AT1 capital 5,433 5,432 4,433 4,433 Ineligible AT1 equity instruments qualifying under grandfathering clause 4,738 0 5,615 0 Tier 1 or Tier 2 instruments of entities operating mainly in the insurance sector in which the institution has a significant investment deducted from Tier 1 capital
(953) (123) (981) 0
Transitional adjustments (131) 0 (153) 0 ADDITIONAL TIER 1 CAPITAL 9,087 5,309 8,914 4,433
TIER 1 CAPITAL 81,727 78,832 77,760 74,102
Equity instruments and subordinated borrowings eligible as Tier 2 capital 17,299 17,299 19,343 19,343 Ineligible equity instruments and subordinated borrowings 511 0 1,004 0 Surplus provisions relative to expected losses eligible under the internal ratings-based approach and general credit risk adjustments under the standardised approach(3)
1,997 1,997 1,981 1,981
Tier 2 instruments of entities operating mainly in the insurance sector in which the institution has a significant investment deducted from Tier 2 capital (3,319) (3,853) (2,289) (2,973)
Transitional adjustments 0 0 455 0 TIER 2 CAPITAL 16,488 15,443 20,494 18,351
TOTAL CAPITAL 98,215 94,275 98,254 92,453 TOTAL RISK WEIGHTED ASSETS 518,501 518,501 509,403 509,403
CET1 ra tio 14.0% 14.2% 13.5% 13.7%
Tier 1 ra tio 15.8% 15.2% 15.3% 14.5% Tota l cap ita l ra tio 18.9% 18.2% 19.3% 18.1% (1) This line is detailed in the table presented in the section entitled “Composition and change in regulatory capital / Reconciliation of accounting and
regulatory capital.
(2) Financial-sector CET1 instruments in which the institution holds a significant stake account for €4,736 million, and the deferred taxes that rely on future profitability arising from temporary differences amount to €2,377 million on a fully loaded basis as at 30 June 2016.
(3) The transfer to Tier 2 of the surplus provisions relative to eligible expected losses determined in accordance with the internal ratings-based approach is limited to 0.6% of risk-weighted assets under IRB. In addition, general credit risk adjustments gross of tax effects may be included up to 1.25% of risk-weighted assets under the standardised approach.
Fully-loaded Common Equity Tier 1 (CET1) stood at €73.5 billion at 30 June 2016, an increase of €3.9 billion since the end of 2015.
Non-recurrent events which had an impact on CET1 in the first half of 2016 included the reduction in the provision shortfall relative to the expected loss on IRB exposure, for €0.7 billion, the increase of €0.2 billion in unrealised gains and losses and an unfavourable currency effect of €0.2 billion.
Recurrent changes related mainly to retained prudential income of €2.4 billion plus the Group’s share of payment of the scrip dividend on 2015 earnings for the non-Group element, and issuance net of redemption of capital securities (€0.5 billion); in addition there was a charge for coupons on AT1 instruments of €0.2 billion.
The remainder of the increase was due primarily to the limited reduction in several regulatory deductions on minority interests, Prudent Valuation and deferred tax assets.
CRÉDIT AGRICOLE GROUP - PILLAR 3 AT 30 JUNE 2016 8
On a phased-in basis, CET1 was €72.6 billion at 30 June 2016, €0.9 billion lower than the fully-loaded figure. In summary, the negative impact of phasing in of the €1.7 billion in unrealised gains is partially offset by the positive effect of the reintegration of 40% of the derecognised minority interests, for €0.5 billion. The balance corresponds to the phasing in of deductions linked to deferred tax assets relating to carried losses and to treasury shares.
Details of changes in fully-loaded and phased-in CET1 are as follows:
• capital and reserves on a fully-loaded basis stood at €90 billion, an increase of €3 billion on end-2015, resulting primarily from retained prudential income of €2.4 billion plus the non-Group share of payment of the scrip dividend on 2015 earnings, issuance of capital instruments for €0.5 billion, and an increase in unrealised gains of €0.2 billion.
In the opposite direction, coupons on AT1 instruments resulted in a charge of €0.2 billion and there was a negative currency effect of €0.2 billion.
Lastly, the impact on reserves of changes in the scope of consolidation was €0.2 billion.
On a phased-in basis, capital and reserves were €88.4 billion, an increase of €3.2 billion on end-2015, resulting from the same factors as detailed above plus €0.3 billion from the transitional treatment of unrealised gains and losses;
• minority interests were €1.2 billion on a fully-loaded basis, a slight increase over the first half, and were €0.5 billion higher on a phased-in basis due to the reintegration of 40% of derecognised minority interests;
• the deduction for prudent valuation was €0.8 billion, virtually unchanged on the level at 31 December 2015;
• deductions for goodwill and other intangibles were €16.2 billion on both a fully-loaded and phased-in basis and were virtually stable over the first half;
• deferred tax assets that rely on future profitability arising from tax loss carryforwards amounted to €0.1 billion on a fully-loaded basis, €0.1 billion lower than at end-2015; phased-in, they were 60% of this amount;
• the provision shortfall relative to the expected loss on IRB exposures was €0.4 billion on 30 June 2016 on both a fully-loaded and a phased-in basis. This was €0.7 billion lower than at 31 December 2015 due mainly to the publication by the EBA of a FAQ which authorised the offsetting of surpluses on healthy exposures against shortfalls on non-performing loans;
• CET1 instruments of financial stakes of over 10% amounted to €4.7 billion, an increase of €0.2 billion. These are subject to the calculation of an exemption threshold, which was not exceeded at 30 June 2016. They were therefore treated as risk weighted assets with a weighting of 250%.
Fully-loaded Tier 1 capital amounted to €78.8 billion and was €4.7 billion higher than at 31 December 2015, whilst phased-in Tier 1 capital was €81.7 billion, €4.0 billion higher than at 31 December 2015. This includes the Common Equity Tier 1 capital described above and Additional Tier 1 capital which underwent the following changes:
• the hybrid securities included in Tier 1 capital eligible under Basel 3 amounted to €5.4 billion, an increase of €1.0 billion due mainly to a €1.3 billion issue of super-subordinated noted in January and to foreign currency effects;
• the entire stock prior to 1 January 2014 is ineligible on a fully-loaded basis ;
On a phased-in basis, the amount of grandfathered instruments decreased due to the early redemption of two super-subordinated notes for €0.5 billion (as part of the liability management programme) and GBP0.2 billion (€0.3 billion); the total amount of grandfathered instruments therefore remains below the level authorised by the grandfathering provision that makes it possible to include, in addition to CRR/CRD 4-eligible instruments, an amount of debt equivalent to a maximum of 60% of the base at 31 December 2012;
• since the first quarter of 2016, a deduction of €0.1 billion has been recognised in the fully-loaded figures due to the reclassification of a CAA instrument from Tier 2 into Additional Tier 1 (transition to Solvency 2).
• lastly, on a phased-in basis, subordinated receivables from credit institutions and insurance companies, mainly representative of Tier 2 instruments, were deducted for their share of the deduction from Tier 1. This category amounted to €1.0 billion at 30 June 2016, stable on the level at 31 December 2015, despite the change in phasing percentage.
At €15.4 billion, fully-loaded Tier 2 capital was €2.9 billion lower than at 31 December 2015, due primarily to active management of hybrid instruments, the subscription of €1.0 billion of insurance Tier 2 instruments and regulatory amortisation. Phased-in Tier 2 capital was €16.5 billion, €4.0 billion less than at 31 December 2015.
• The hybrid securities included in Tier 2 capital eligible for Basel 3 amounted to €17.3 billion, €2.0 billion lower than at 31 December 2015, due to three calls on eligible dated subordinated debts (TSR) for a total of €1.8 billion, partial redemptions of €0.9 billion (prudent valuation) as part of liability management transactions, four new TSR issues for a total of €1.9 billion and lastly regulatory amortisation.
On a phased-in basis, there was an additional €0.5 billion of ineligible instruments, a reduction of €0.5 billion, due mainly to the redemption of an undated deeply subordinated note.
• Surplus provisions relative to expected losses on the internal ratings-based approach and general credit risk adjustments gross of tax effects under the standardised approach amounted to €2.0 billion at 30 June 2016, similar to the level at 31 December 2015, as the threshold of 0.6% of weighted IRB exposure was still exceeded.
• Subordinated loans and receivables from credit institutions and insurance companies, all representative of Tier 2 instruments, were fully deducted from fully-loaded Tier 2 in the amount of €3.9 billion, an increase of €0.9 billion compared to 31 December 2015 following Crédit Agricole S.A.’s subscription to a subordinated instrument issued by Crédit Agricole Assurances.
On a phased-in basis, these securities amounted to €3.3 billion for their share of the deduction from Tier 2, an increase of €1.0 billion compared to 31 December 2015, with the change in the phasing percentage coming in addition to the impact of the Crédit Agricole Assurances issue.
CRÉDIT AGRICOLE GROUP - PILLAR 3 AT 30 JUNE 2016 9
In all, fully-loaded total capital at 30 June 2016 was €94.3 billion, €1.8 billion higher than at 31 December 2015. Phased-in total capital was €98.2 billion, and was virtually stable over the first half.
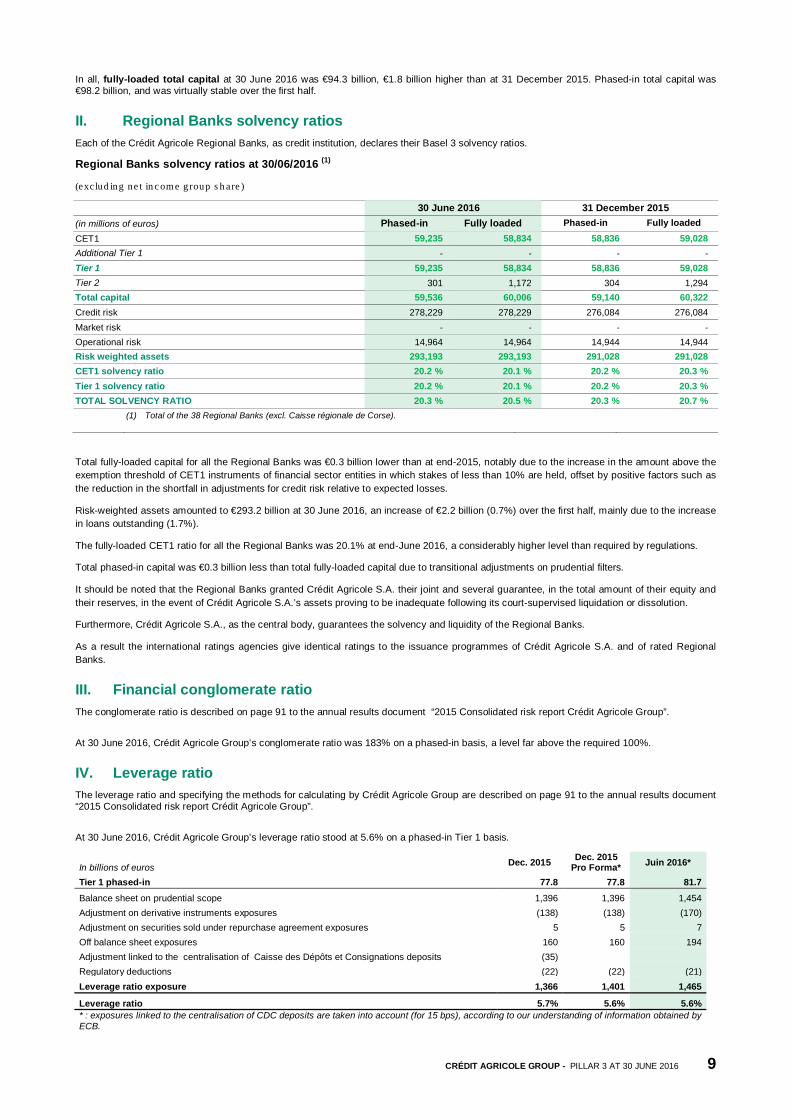
II. Regional Banks solvency ratios Each of the Crédit Agricole Regional Banks, as credit institution, declares their Basel 3 solvency ratios.
Regional Banks solvency ratios at 30/06/2016 (1)
(exclud ing ne t in c om e group s h are )
30 June 2016 31 December 2015 (in millions of euros) Phased-in Fully loaded Phased-in Fully loaded CET1 59,235 58,834 58,836 59,028 Additional Tier 1 - - - - Tier 1 59,235 58,834 58,836 59,028 Tier 2 301 1,172 304 1,294 Total capital 59,536 60,006 59,140 60,322 Credit risk 278,229 278,229 276,084 276,084 Market risk - - - - Operational risk 14,964 14,964 14,944 14,944 Risk weighted assets 293,193 293,193 291,028 291,028 CET1 solvency ratio 20.2 % 20.1 % 20.2 % 20.3 % Tier 1 solvency ratio 20.2 % 20.1 % 20.2 % 20.3 % TOTAL SOLVENCY RATIO 20.3 % 20.5 % 20.3 % 20.7 % (1) Total of the 38 Regional Banks (excl. Caisse régionale de Corse).
Total fully-loaded capital for all the Regional Banks was €0.3 billion lower than at end-2015, notably due to the increase in the amount above the exemption threshold of CET1 instruments of financial sector entities in which stakes of less than 10% are held, offset by positive factors such as the reduction in the shortfall in adjustments for credit risk relative to expected losses.
Risk-weighted assets amounted to €293.2 billion at 30 June 2016, an increase of €2.2 billion (0.7%) over the first half, mainly due to the increase in loans outstanding (1.7%).
The fully-loaded CET1 ratio for all the Regional Banks was 20.1% at end-June 2016, a considerably higher level than required by regulations.
Total phased-in capital was €0.3 billion less than total fully-loaded capital due to transitional adjustments on prudential filters.
It should be noted that the Regional Banks granted Crédit Agricole S.A. their joint and several guarantee, in the total amount of their equity and their reserves, in the event of Crédit Agricole S.A.’s assets proving to be inadequate following its court-supervised liquidation or dissolution.
Furthermore, Crédit Agricole S.A., as the central body, guarantees the solvency and liquidity of the Regional Banks.
As a result the international ratings agencies give identical ratings to the issuance programmes of Crédit Agricole S.A. and of rated Regional Banks.
III. Financial conglomerate ratio The conglomerate ratio is described on page 91 to the annual results document “2015 Consolidated risk report Crédit Agricole Group”.
At 30 June 2016, Crédit Agricole Group’s conglomerate ratio was 183% on a phased-in basis, a level far above the required 100%.
IV. Leverage ratio The leverage ratio and specifying the methods for calculating by Crédit Agricole Group are described on page 91 to the annual results document “2015 Consolidated risk report Crédit Agricole Group”.
At 30 June 2016, Crédit Agricole Group’s leverage ratio stood at 5.6% on a phased-in Tier 1 basis.
In billions of euros Dec. 2015 Dec. 2015 Pro Forma* Juin 2016*
Tier 1 phased-in 77.8 77.8 81.7 Balance sheet on prudential scope 1,396 1,396 1,454 Adjustment on derivative instruments exposures (138) (138) (170) Adjustment on securities sold under repurchase agreement exposures 5 5 7 Off balance sheet exposures 160 160 194 Adjustment linked to the centralisation of Caisse des Dépôts et Consignations deposits (35)
Regulatory deductions (22) (22) (21) Leverage ratio exposure 1,366 1,401 1,465
Leverage ratio 5.7% 5.6% 5.6% * : exposures linked to the centralisation of CDC deposits are taken into account (for 15 bps), according to our understanding of information obtained by ECB.
CRÉDIT AGRICOLE GROUP - PILLAR 3 AT 30 JUNE 2016 10
V. MREL/TLAC ratio
MREL ratio The MREL ratio and specifying the methods for calculating by Crédit Agricole Group are described on page 92 to the annual results document “2015 Consolidated risk report Crédit Agricole Group”.
Crédit Agricole Group is targeting MREL of 8% excluding senior debt before end-2016, which would enable recourse to European resolution fund before applying the bail-in to senior debt, creating an additional layer of protection for senior investors. The achievement of this target is based on organic growth of own funds and complementary issuance of Tier 2, partially substituting for senior unsecured debt issues.
Crédit Agricole Group, like Crédit Agricole S.A., will be subject to MREL target defined by the supervisor, which could be different from the Group’s target of 8%.
At 30 June 2016, Crédit Agricole Group's MREL ratio was estimated at 8.1% excluding eligible senior debt1.
TLAC ratio The TLAC ratio and specifying the methods for calculating by Crédit Agricole Group are described on page 92 to the annual results document “2015 Consolidated risk report Crédit Agricole Group”. Crédit Agricole Group must comply with a TLAC ratio over 19.5% (including a capital conservation buffer of 2.5% and a G-SIB buffer of 1%) from 2019 then 21.5% from 2022. Crédit Agricole Group aims to comply with these TLAC requirements excluding eligible senior debt, subject to changes in methods of calculating risk-weighted assets
Crédit Agricole Group aims to comply with these TLAC requirements by 2019, excluding senior debt, subject to changes in methods of calculating risk weighted assets.
As at 30 June 2016, the TLAC to risk weighted assets ratio is estimated at 19.5% for Crédit Agricole Group, excluding eligible senior debt.
1 Calculation based on Crédit Agricole S.A. current understanding of draft regulatory texts
CRÉDIT AGRICOLE GROUP - PILLAR 3 AT 30 JUNE 2016 11
COMPOSITION AND CHANGES IN REGULATORY CAPITAL
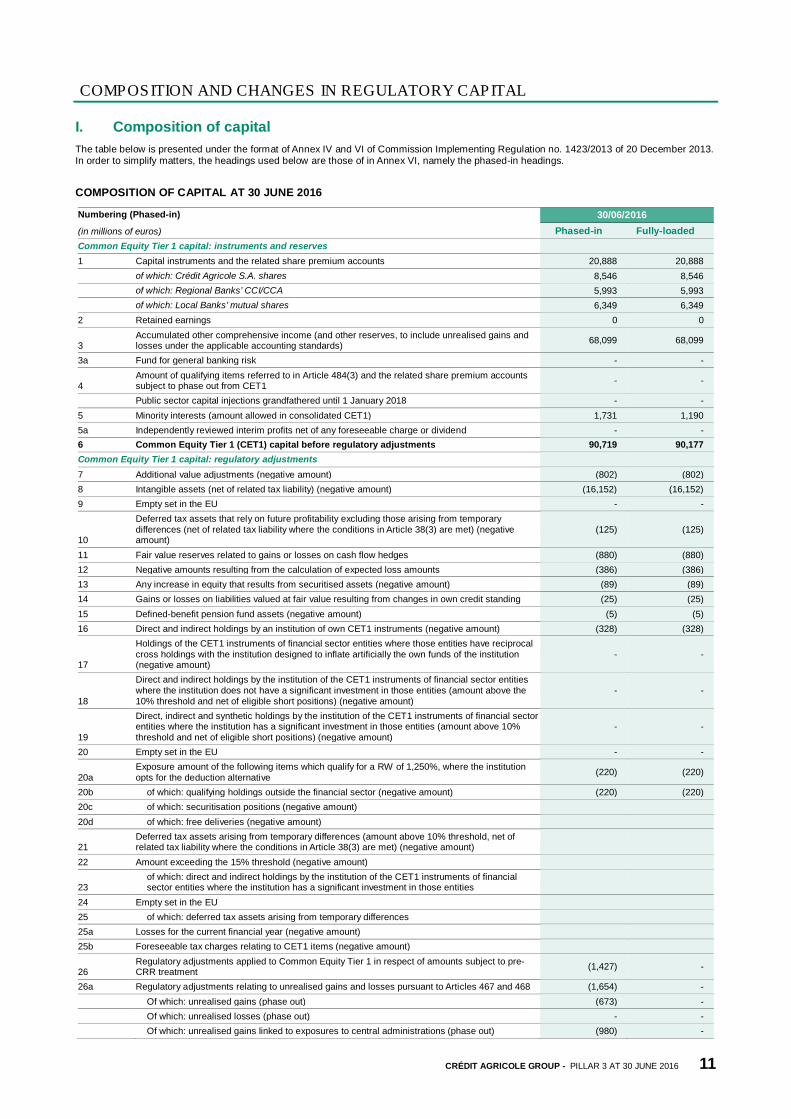
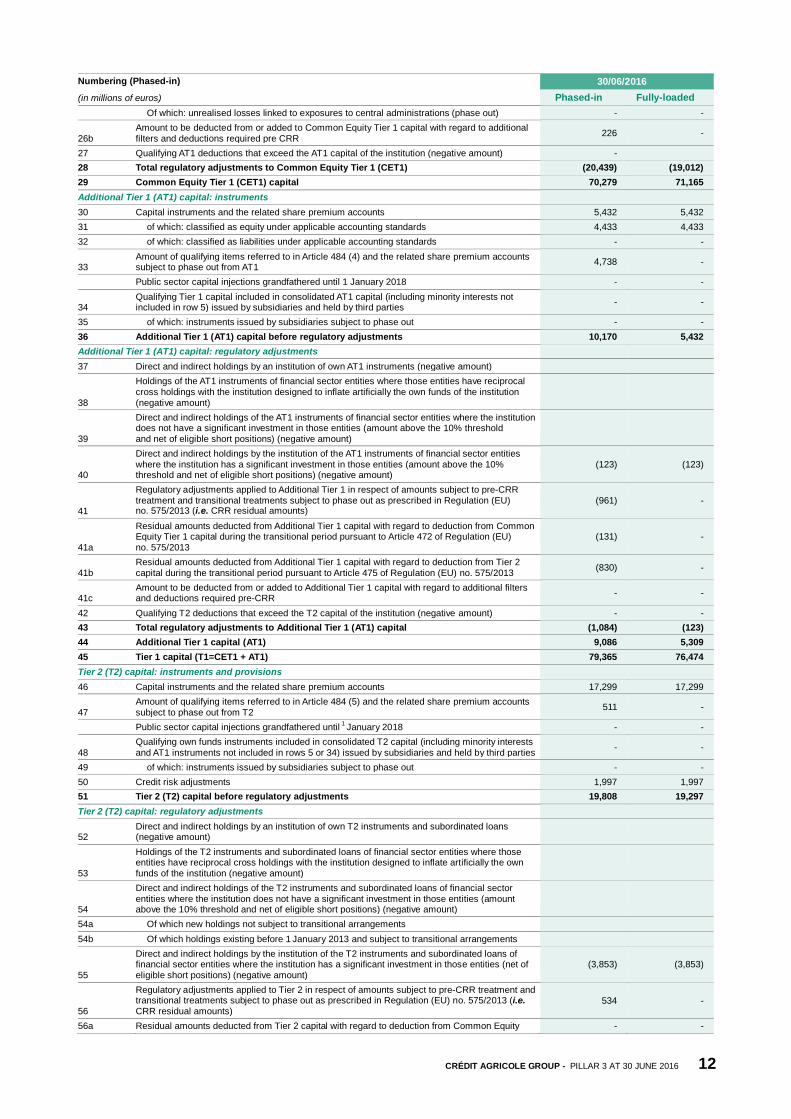
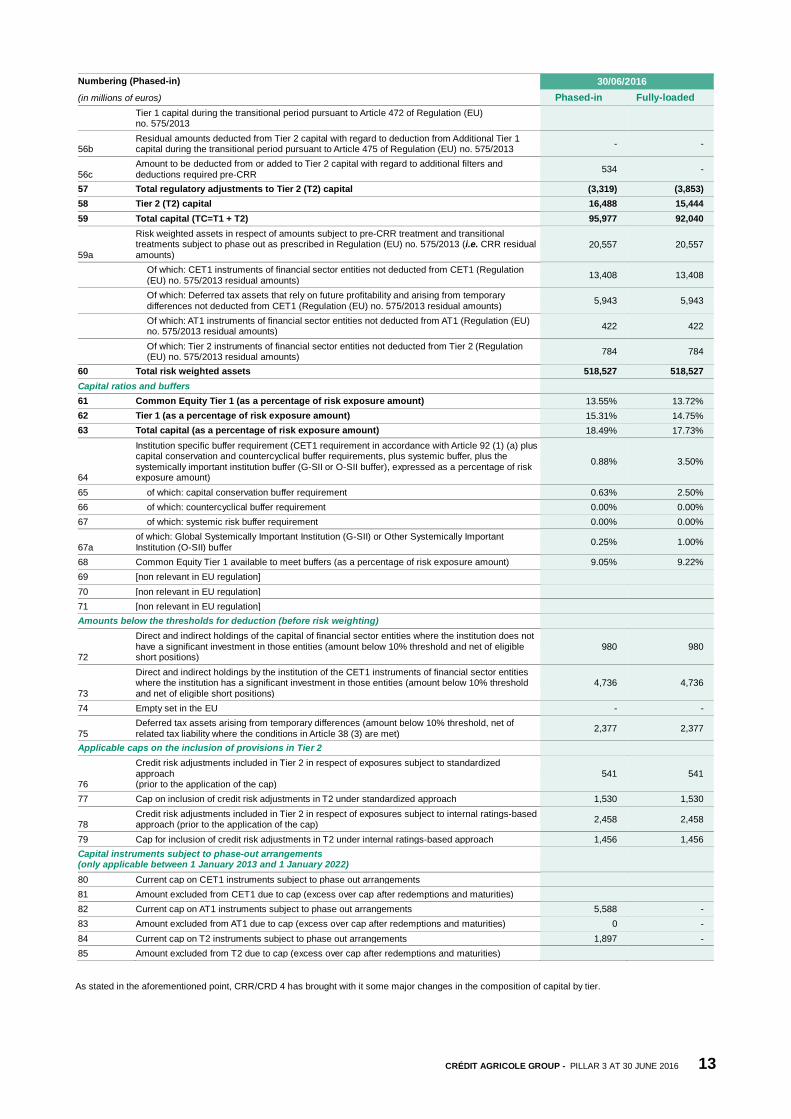
I. Composition of capital The table below is presented under the format of Annex IV and VI of Commission Implementing Regulation no. 1423/2013 of 20 December 2013. In order to simplify matters, the headings used below are those of in Annex VI, namely the phased-in headings.
COMPOSITION OF CAPITAL AT 30 JUNE 2016
Numbering (Phased-in)
(in millions of euros) 30/06/2016
Phased-in Fully-loaded Common Equity Tier 1 capital: instruments and reserves 1 Capital instruments and the related share premium accounts 20,888 20,888
of which: Crédit Agricole S.A. shares 8,546 8,546 of which: Regional Banks’ CCI/CCA 5,993 5,993 of which: Local Banks’ mutual shares 6,349 6,349
2 Retained earnings 0 0
3 Accumulated other comprehensive income (and other reserves, to include unrealised gains and losses under the applicable accounting standards) 68,099 68,099
3a Fund for general banking risk - -
4 Amount of qualifying items referred to in Article 484(3) and the related share premium accounts subject to phase out from CET1 - -
Public sector capital injections grandfathered until 1 January 2018 - - 5 Minority interests (amount allowed in consolidated CET1) 1,731 1,190 5a Independently reviewed interim profits net of any foreseeable charge or dividend - - 6 Common Equity Tier 1 (CET1) capital before regulatory adjustments 90,719 90,177 Common Equity Tier 1 capital: regulatory adjustments 7 Additional value adjustments (negative amount) (802) (802) 8 Intangible assets (net of related tax liability) (negative amount) (16,152) (16,152) 9 Empty set in the EU - -
10
Deferred tax assets that rely on future profitability excluding those arising from temporary differences (net of related tax liability where the conditions in Article 38(3) are met) (negative amount)
(125) (125)
11 Fair value reserves related to gains or losses on cash flow hedges (880) (880) 12 Negative amounts resulting from the calculation of expected loss amounts (386) (386) 13 Any increase in equity that results from securitised assets (negative amount) (89) (89) 14 Gains or losses on liabilities valued at fair value resulting from changes in own credit standing (25) (25) 15 Defined-benefit pension fund assets (negative amount) (5) (5) 16 Direct and indirect holdings by an institution of own CET1 instruments (negative amount) (328) (328)
17
Holdings of the CET1 instruments of financial sector entities where those entities have reciprocal cross holdings with the institution designed to inflate artificially the own funds of the institution (negative amount)
- -
18
Direct and indirect holdings by the institution of the CET1 instruments of financial sector entities where the institution does not have a significant investment in those entities (amount above the 10% threshold and net of eligible short positions) (negative amount)
- -
19
Direct, indirect and synthetic holdings by the institution of the CET1 instruments of financial sector entities where the institution has a significant investment in those entities (amount above 10% threshold and net of eligible short positions) (negative amount)
- -
20 Empty set in the EU - -
20a Exposure amount of the following items which qualify for a RW of 1,250%, where the institution opts for the deduction alternative (220) (220)
20b of which: qualifying holdings outside the financial sector (negative amount) (220) (220) 20c of which: securitisation positions (negative amount) 20d of which: free deliveries (negative amount)
21 Deferred tax assets arising from temporary differences (amount above 10% threshold, net of related tax liability where the conditions in Article 38(3) are met) (negative amount)
22 Amount exceeding the 15% threshold (negative amount)
23 of which: direct and indirect holdings by the institution of the CET1 instruments of financial sector entities where the institution has a significant investment in those entities
24 Empty set in the EU 25 of which: deferred tax assets arising from temporary differences 25a Losses for the current financial year (negative amount) 25b Foreseeable tax charges relating to CET1 items (negative amount)
26 Regulatory adjustments applied to Common Equity Tier 1 in respect of amounts subject to pre-CRR treatment (1,427) -
26a Regulatory adjustments relating to unrealised gains and losses pursuant to Articles 467 and 468 (1,654) - Of which: unrealised gains (phase out) (673) - Of which: unrealised losses (phase out) - - Of which: unrealised gains linked to exposures to central administrations (phase out) (980) -
CRÉDIT AGRICOLE GROUP - PILLAR 3 AT 30 JUNE 2016 12
Numbering (Phased-in)
(in millions of euros) 30/06/2016
Phased-in Fully-loaded Of which: unrealised losses linked to exposures to central administrations (phase out) - -
26b Amount to be deducted from or added to Common Equity Tier 1 capital with regard to additional filters and deductions required pre CRR 226 -
27 Qualifying AT1 deductions that exceed the AT1 capital of the institution (negative amount) - 28 Total regulatory adjustments to Common Equity Tier 1 (CET1) (20,439) (19,012) 29 Common Equity Tier 1 (CET1) capital 70,279 71,165 Additional Tier 1 (AT1) capital: instruments 30 Capital instruments and the related share premium accounts 5,432 5,432 31 of which: classified as equity under applicable accounting standards 4,433 4,433 32 of which: classified as liabilities under applicable accounting standards - -
33 Amount of qualifying items referred to in Article 484 (4) and the related share premium accounts subject to phase out from AT1 4,738 -
Public sector capital injections grandfathered until 1 January 2018 - -
34 Qualifying Tier 1 capital included in consolidated AT1 capital (including minority interests not included in row 5) issued by subsidiaries and held by third parties - -
35 of which: instruments issued by subsidiaries subject to phase out - - 36 Additional Tier 1 (AT1) capital before regulatory adjustments 10,170 5,432 Additional Tier 1 (AT1) capital: regulatory adjustments 37 Direct and indirect holdings by an institution of own AT1 instruments (negative amount)
38
Holdings of the AT1 instruments of financial sector entities where those entities have reciprocal cross holdings with the institution designed to inflate artificially the own funds of the institution (negative amount)
39
Direct and indirect holdings of the AT1 instruments of financial sector entities where the institution does not have a significant investment in those entities (amount above the 10% threshold and net of eligible short positions) (negative amount)
40
Direct and indirect holdings by the institution of the AT1 instruments of financial sector entities where the institution has a significant investment in those entities (amount above the 10% threshold and net of eligible short positions) (negative amount)
(123) (123)
41
Regulatory adjustments applied to Additional Tier 1 in respect of amounts subject to pre-CRR treatment and transitional treatments subject to phase out as prescribed in Regulation (EU) no. 575/2013 (i.e. CRR residual amounts)
(961) -
41a
Residual amounts deducted from Additional Tier 1 capital with regard to deduction from Common Equity Tier 1 capital during the transitional period pursuant to Article 472 of Regulation (EU) no. 575/2013
(131) -
41b Residual amounts deducted from Additional Tier 1 capital with regard to deduction from Tier 2 capital during the transitional period pursuant to Article 475 of Regulation (EU) no. 575/2013 (830) -
41c Amount to be deducted from or added to Additional Tier 1 capital with regard to additional filters and deductions required pre-CRR - -
42 Qualifying T2 deductions that exceed the T2 capital of the institution (negative amount) - - 43 Total regulatory adjustments to Additional Tier 1 (AT1) capital (1,084) (123) 44 Additional Tier 1 capital (AT1) 9,086 5,309 45 Tier 1 capital (T1=CET1 + AT1) 79,365 76,474 Tier 2 (T2) capital: instruments and provisions 46 Capital instruments and the related share premium accounts 17,299 17,299
47 Amount of qualifying items referred to in Article 484 (5) and the related share premium accounts subject to phase out from T2 511 -
Public sector capital injections grandfathered until 1 January 2018 - -
48 Qualifying own funds instruments included in consolidated T2 capital (including minority interests and AT1 instruments not included in rows 5 or 34) issued by subsidiaries and held by third parties - -
49 of which: instruments issued by subsidiaries subject to phase out - - 50 Credit risk adjustments 1,997 1,997 51 Tier 2 (T2) capital before regulatory adjustments 19,808 19,297 Tier 2 (T2) capital: regulatory adjustments
52 Direct and indirect holdings by an institution of own T2 instruments and subordinated loans (negative amount)
53
Holdings of the T2 instruments and subordinated loans of financial sector entities where those entities have reciprocal cross holdings with the institution designed to inflate artificially the own funds of the institution (negative amount)
54
Direct and indirect holdings of the T2 instruments and subordinated loans of financial sector entities where the institution does not have a significant investment in those entities (amount above the 10% threshold and net of eligible short positions) (negative amount)
54a Of which new holdings not subject to transitional arrangements 54b Of which holdings existing before 1 January 2013 and subject to transitional arrangements
55
Direct and indirect holdings by the institution of the T2 instruments and subordinated loans of financial sector entities where the institution has a significant investment in those entities (net of eligible short positions) (negative amount)
(3,853) (3,853)
56
Regulatory adjustments applied to Tier 2 in respect of amounts subject to pre-CRR treatment and transitional treatments subject to phase out as prescribed in Regulation (EU) no. 575/2013 (i.e. CRR residual amounts)
534 -
56a Residual amounts deducted from Tier 2 capital with regard to deduction from Common Equity - -
CRÉDIT AGRICOLE GROUP - PILLAR 3 AT 30 JUNE 2016 13
Numbering (Phased-in)
(in millions of euros) 30/06/2016
Phased-in Fully-loaded Tier 1 capital during the transitional period pursuant to Article 472 of Regulation (EU) no. 575/2013
56b Residual amounts deducted from Tier 2 capital with regard to deduction from Additional Tier 1 capital during the transitional period pursuant to Article 475 of Regulation (EU) no. 575/2013 - -
56c Amount to be deducted from or added to Tier 2 capital with regard to additional filters and deductions required pre-CRR 534 -
57 Total regulatory adjustments to Tier 2 (T2) capital (3,319) (3,853) 58 Tier 2 (T2) capital 16,488 15,444 59 Total capital (TC=T1 + T2) 95,977 92,040
59a
Risk weighted assets in respect of amounts subject to pre-CRR treatment and transitional treatments subject to phase out as prescribed in Regulation (EU) no. 575/2013 (i.e. CRR residual amounts)
20,557 20,557
Of which: CET1 instruments of financial sector entities not deducted from CET1 (Regulation (EU) no. 575/2013 residual amounts) 13,408 13,408
Of which: Deferred tax assets that rely on future profitability and arising from temporary differences not deducted from CET1 (Regulation (EU) no. 575/2013 residual amounts) 5,943 5,943
Of which: AT1 instruments of financial sector entities not deducted from AT1 (Regulation (EU) no. 575/2013 residual amounts) 422 422
Of which: Tier 2 instruments of financial sector entities not deducted from Tier 2 (Regulation (EU) no. 575/2013 residual amounts) 784 784
60 Total risk weighted assets 518,527 518,527 Capital ratios and buffers 61 Common Equity Tier 1 (as a percentage of risk exposure amount) 13.55% 13.72% 62 Tier 1 (as a percentage of risk exposure amount) 15.31% 14.75% 63 Total capital (as a percentage of risk exposure amount) 18.49% 17.73%
64
Institution specific buffer requirement (CET1 requirement in accordance with Article 92 (1) (a) plus capital conservation and countercyclical buffer requirements, plus systemic buffer, plus the systemically important institution buffer (G-SII or O-SII buffer), expressed as a percentage of risk exposure amount)
0.88% 3.50%
65 of which: capital conservation buffer requirement 0.63% 2.50% 66 of which: countercyclical buffer requirement 0.00% 0.00% 67 of which: systemic risk buffer requirement 0.00% 0.00%
67a of which: Global Systemically Important Institution (G-SII) or Other Systemically Important Institution (O-SII) buffer 0.25% 1.00%
68 Common Equity Tier 1 available to meet buffers (as a percentage of risk exposure amount) 9.05% 9.22% 69 [non relevant in EU regulation] 70 [non relevant in EU regulation] 71 [non relevant in EU regulation] Amounts below the thresholds for deduction (before risk weighting)
72
Direct and indirect holdings of the capital of financial sector entities where the institution does not have a significant investment in those entities (amount below 10% threshold and net of eligible short positions)
980 980
73
Direct and indirect holdings by the institution of the CET1 instruments of financial sector entities where the institution has a significant investment in those entities (amount below 10% threshold and net of eligible short positions)
4,736 4,736
74 Empty set in the EU - -
75 Deferred tax assets arising from temporary differences (amount below 10% threshold, net of related tax liability where the conditions in Article 38 (3) are met) 2,377 2,377
Applicable caps on the inclusion of provisions in Tier 2
76
Credit risk adjustments included in Tier 2 in respect of exposures subject to standardized approach (prior to the application of the cap)
541 541
77 Cap on inclusion of credit risk adjustments in T2 under standardized approach 1,530 1,530
78 Credit risk adjustments included in Tier 2 in respect of exposures subject to internal ratings-based approach (prior to the application of the cap) 2,458 2,458
79 Cap for inclusion of credit risk adjustments in T2 under internal ratings-based approach 1,456 1,456 Capital instruments subject to phase-out arrangements (only applicable between 1 January 2013 and 1 January 2022) 80 Current cap on CET1 instruments subject to phase out arrangements 81 Amount excluded from CET1 due to cap (excess over cap after redemptions and maturities) 82 Current cap on AT1 instruments subject to phase out arrangements 5,588 - 83 Amount excluded from AT1 due to cap (excess over cap after redemptions and maturities) 0 - 84 Current cap on T2 instruments subject to phase out arrangements 1,897 - 85 Amount excluded from T2 due to cap (excess over cap after redemptions and maturities)
As stated in the aforementioned point, CRR/CRD 4 has brought with it some major changes in the composition of capital by tier.
CRÉDIT AGRICOLE GROUP - PILLAR 3 AT 30 JUNE 2016 14
1. Tier 1 capital This includes Common Equity Tier 1 (CET1) and Additional Tier 1 capital (AT1):
A. COMMON EQUITY TIER 1 (CET1) The Common Equity Tier 1 Group is described on page 95 to the annual results document “2015 Consolidated risk report Crédit Agricole Group”.
B. ADDITIONAL TIER 1 CAPITAL (AT1)
Additional Tier 1 capital eligible under Basel 3 fully-loaded
The Additional Tier 1 (AT1) capital eligible under Basel 3 fully-loaded is described on page 95 to the annual results document “2015 Consolidated risk report Crédit Agricole Group”.
The five Basel 3 eligible issues have two loss absorption mechanisms that are triggered when:
• Crédit Agricole S.A. Group’s phased-in CET1 ratio drops below 5.125%,
• Crédit Agricole Group’s phased-in CET1 ratio falls below 7%.
At 30 June 2016, the phased-in ratios of Crédit Agricole Group and of Crédit Agricole S.A. were 14.0% and 11.1% respectively. They thus represent a capital buffer of €36.3 (for Crédit Agricole Group’s threshold) and of €18.7 billion (for the Crédit Agricole S.A.’s threshold) in capital relative to the loss absorption thresholds.
At 30 June 2016, there was no applicable restriction on the payment of coupons.
At 30 June 2016, the potentially distributable items of Crédit Agricole S.A. totalled €25.9 billion, including €13.9 billion in distributable reserves and €12.0 billion in share premiums.
Additional Tier 1 capital eligible under Basel 3 phased-in
During the transitional phase, the amount of Tier 1 included in the ratios represents
• Additional Tier 1 capital eligible under Basel 3 (AT1); and
• a fraction of the ineligible Tier 1, equal to the lower of:
• the actual amount of ineligible Tier 1 instruments on the closing date (after amortization, any calls, redemptions, etc.), including preferred shares,
• 60% (threshold for 2016) of the Tier 1 stock at 31 December 2012. The Tier 1 stock at 31 December 2012 stood at €9,314 million, with a maximum amount of €5,588 million possibly being recognised.
The Tier 1 amount exceeding this regulatory threshold is included in phased-in Tier 2, up to the regulatory threshold applicable to Tier 2 itself.
CRÉDIT AGRICOLE GROUP - PILLAR 3 AT 30 JUNE 2016 15
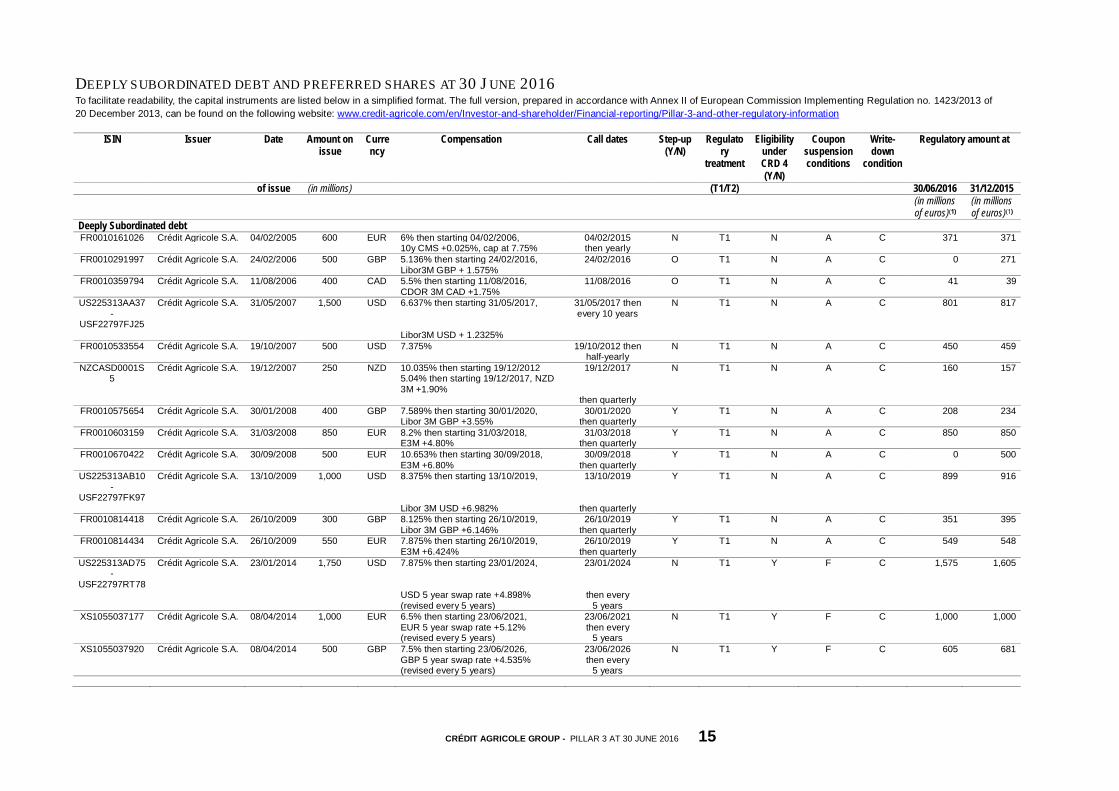
DEEPLY SUBORDINATED DEBT AND PREFERRED SHARES AT 30 J UNE 2016 To facilitate readability, the capital instruments are listed below in a simplified format. The full version, prepared in accordance with Annex II of European Commission Implementing Regulation no. 1423/2013 of 20 December 2013, can be found on the following website: www.credit-agricole.com/en/Investor-and-shareholder/Financial-reporting/Pillar-3-and-other-regulatory-information
ISIN Issuer Date Amount on issue
Currency
Compensation Call dates Step-up (Y/N)
Regulatory
treatment
Eligibility under CRD 4 (Y/N)
Coupon suspension conditions
Write-down
condition
Regulatory amount at
of issue (in millions) (T1/T2) 30/06/2016 31/12/2015 (in millions
of euros)(1) (in millions of euros)(1)
Deeply Subordinated debt FR0010161026 Crédit Agricole S.A. 04/02/2005 600 EUR 6% then starting 04/02/2006, 04/02/2015 N T1 N A C 371 371
10y CMS +0.025%, cap at 7.75% then yearly FR0010291997 Crédit Agricole S.A. 24/02/2006 500 GBP 5.136% then starting 24/02/2016, 24/02/2016 O T1 N A C 0 271
Libor3M GBP + 1.575% FR0010359794 Crédit Agricole S.A. 11/08/2006 400 CAD 5.5% then starting 11/08/2016, 11/08/2016 O T1 N A C 41 39
CDOR 3M CAD +1.75% US225313AA37
- USF22797FJ25
Crédit Agricole S.A. 31/05/2007 1,500 USD 6.637% then starting 31/05/2017, 31/05/2017 then every 10 years
N T1 N A C 801 817
Libor3M USD + 1.2325% FR0010533554 Crédit Agricole S.A. 19/10/2007 500 USD 7.375% 19/10/2012 then
half-yearly N T1 N A C 450 459
NZCASD0001S5
Crédit Agricole S.A. 19/12/2007 250 NZD 10.035% then starting 19/12/2012 5.04% then starting 19/12/2017, NZD 3M +1.90%
19/12/2017 N T1 N A C 160 157
then quarterly FR0010575654 Crédit Agricole S.A. 30/01/2008 400 GBP 7.589% then starting 30/01/2020, 30/01/2020 Y T1 N A C 208 234
Libor 3M GBP +3.55% then quarterly FR0010603159 Crédit Agricole S.A. 31/03/2008 850 EUR 8.2% then starting 31/03/2018, 31/03/2018 Y T1 N A C 850 850
E3M +4.80% then quarterly FR0010670422 Crédit Agricole S.A. 30/09/2008 500 EUR 10.653% then starting 30/09/2018, 30/09/2018 Y T1 N A C 0 500
E3M +6.80% then quarterly US225313AB10
- USF22797FK97
Crédit Agricole S.A. 13/10/2009 1,000 USD 8.375% then starting 13/10/2019, 13/10/2019 Y T1 N A C 899 916
Libor 3M USD +6.982% then quarterly FR0010814418 Crédit Agricole S.A. 26/10/2009 300 GBP 8.125% then starting 26/10/2019, 26/10/2019 Y T1 N A C 351 395
Libor 3M GBP +6.146% then quarterly FR0010814434 Crédit Agricole S.A. 26/10/2009 550 EUR 7.875% then starting 26/10/2019, 26/10/2019 Y T1 N A C 549 548
E3M +6.424% then quarterly US225313AD75
- USF22797RT78
Crédit Agricole S.A. 23/01/2014 1,750 USD 7.875% then starting 23/01/2024, 23/01/2024 N T1 Y F C 1,575 1,605
USD 5 year swap rate +4.898% then every (revised every 5 years) 5 years
XS1055037177 Crédit Agricole S.A. 08/04/2014 1,000 EUR 6.5% then starting 23/06/2021, 23/06/2021 N T1 Y F C 1,000 1,000 EUR 5 year swap rate +5.12% then every (revised every 5 years) 5 years
XS1055037920 Crédit Agricole S.A. 08/04/2014 500 GBP 7.5% then starting 23/06/2026, 23/06/2026 N T1 Y F C 605 681 GBP 5 year swap rate +4.535% then every (revised every 5 years) 5 years
CRÉDIT AGRICOLE GROUP - PILLAR 3 AT 30 JUNE 2016 16
ISIN Issuer Date Amount on issue
Currency
Compensation Call dates Step-up (Y/N)
Regulatory
treatment
Eligibility under CRD 4 (Y/N)
Coupon suspension conditions
Write-down
condition
Regulatory amount at
of issue (in millions) (T1/T2) 30/06/2016 31/12/2015 (in millions
of euros)(1) (in millions of euros)(1)
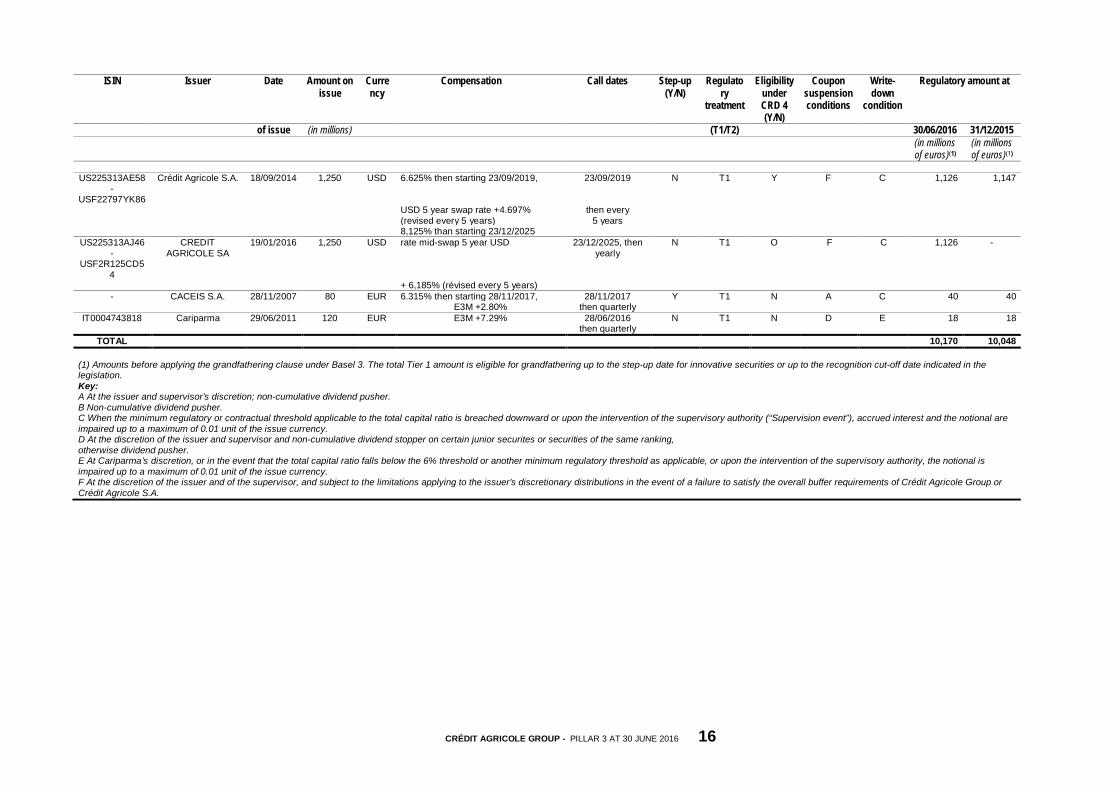
US225313AE58
- USF22797YK86
Crédit Agricole S.A. 18/09/2014 1,250 USD 6.625% then starting 23/09/2019, 23/09/2019 N T1 Y F C 1,126 1,147
USD 5 year swap rate +4.697% then every (revised every 5 years) 5 years 8,125% than starting 23/12/2025
US225313AJ46 -
USF2R125CD54
CREDIT AGRICOLE SA
19/01/2016 1,250 USD rate mid-swap 5 year USD 23/12/2025, then yearly
N T1 O F C 1,126 -
+ 6,185% (révised every 5 years) - CACEIS S.A. 28/11/2007 80 EUR 6.315% then starting 28/11/2017, 28/11/2017 Y T1 N A C 40 40 E3M +2.80% then quarterly
IT0004743818 Cariparma 29/06/2011 120 EUR E3M +7.29% 28/06/2016 N T1 N D E 18 18 then quarterly
TOTAL 10,170 10,048 (1) Amounts before applying the grandfathering clause under Basel 3. The total Tier 1 amount is eligible for grandfathering up to the step-up date for innovative securities or up to the recognition cut-off date indicated in the legislation. Key: A At the issuer and supervisor’s discretion; non-cumulative dividend pusher. B Non-cumulative dividend pusher. C When the minimum regulatory or contractual threshold applicable to the total capital ratio is breached downward or upon the intervention of the supervisory authority (“Supervision event”), accrued interest and the notional are impaired up to a maximum of 0.01 unit of the issue currency. D At the discretion of the issuer and supervisor and non-cumulative dividend stopper on certain junior securites or securities of the same ranking, otherwise dividend pusher.
E At Cariparma’s discretion, or in the event that the total capital ratio falls below the 6% threshold or another minimum regulatory threshold as applicable, or upon the intervention of the supervisory authority, the notional is impaired up to a maximum of 0.01 unit of the issue currency. F At the discretion of the issuer and of the supervisor, and subject to the limitations applying to the issuer’s discretionary distributions in the event of a failure to satisfy the overall buffer requirements of Crédit Agricole Group or Crédit Agricole S.A.
CRÉDIT AGRICOLE GROUP - PILLAR 3 AT 30 JUNE 2016 17
2. Tier 2 capital (Tier 2)
The Tier 2 capital is described on page 96 to the annual results document “2015 Consolidated risk report Crédit Agricole Group”.
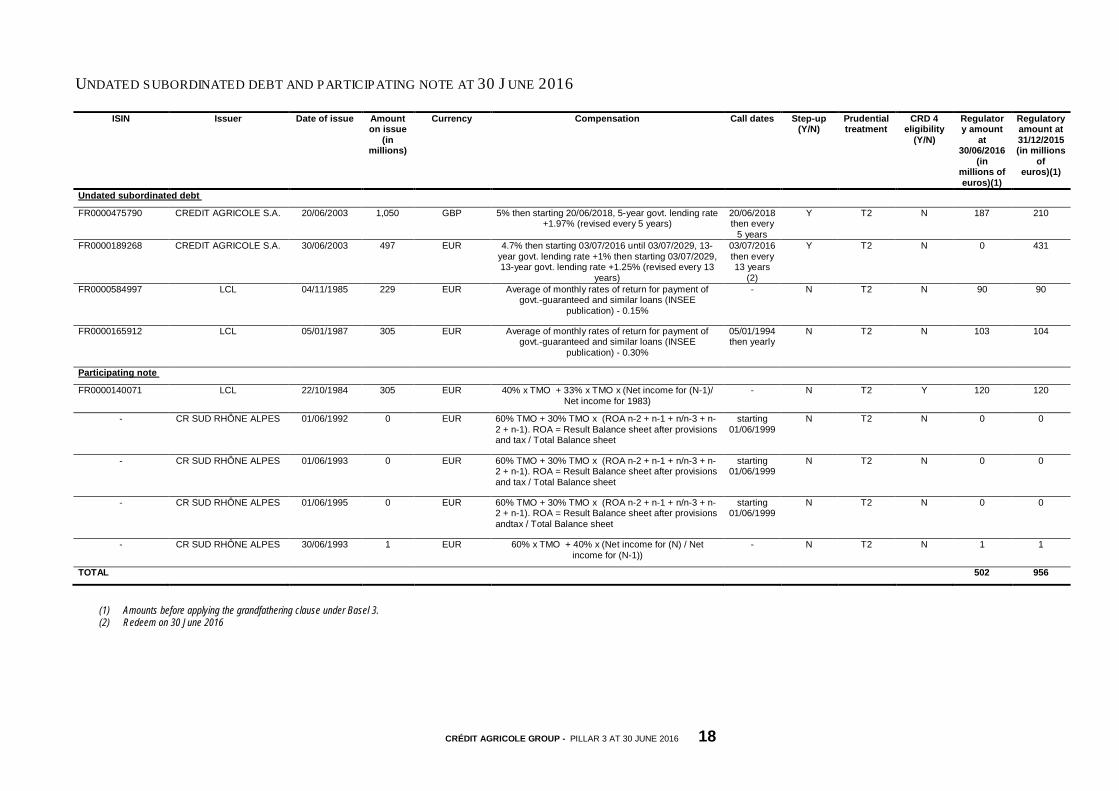
The subordinated debt is presented below with the distinction existing at 31 December 2013 between undated subordinated debt and participating note, on the one hand, and dated subordinated debt, on the other hand.
The amount of Tier 2 included in the ratios represents:
• in fully loaded: CRD 4 eligible Tier 2;
• in phased-in: CRD 4 eligible Tier 2, plus the lower of:
• ineligible Tier 2 securities and, as applicable, the remainder of Tier 1 securities exceeding the 60% threshold (threshold for 2016) of ineligible Tier 1 securities,
• 60% (threshold for 2016) of the CRD 4 ineligible Tier 2 stock at 31 December 2012. The CRD 4 ineligible Tier 2 stock at 31 December 2012 stood at €3,161 million, or a maximum amount of €1,897 million possibly being recognised.
CRÉDIT AGRICOLE GROUP - PILLAR 3 AT 30 JUNE 2016 18
UNDATED SUBORDINATED DEBT AND PARTICIPATING NOTE AT 30 J UNE 2016
ISIN Issuer Date of issue Amount on issue
(in millions)
Currency Compensation Call dates Step-up (Y/N)
Prudential treatment
CRD 4 eligibility
(Y/N)
Regulatory amount
at 30/06/2016
(in millions of euros)(1)
Regulatory amount at 31/12/2015 (in millions
of euros)(1)
Undated subordinated debt
FR0000475790 CREDIT AGRICOLE S.A. 20/06/2003 1,050 GBP 5% then starting 20/06/2018, 5-year govt. lending rate +1.97% (revised every 5 years)
20/06/2018 then every
5 years
Y T2 N 187 210
FR0000189268 CREDIT AGRICOLE S.A. 30/06/2003 497 EUR 4.7% then starting 03/07/2016 until 03/07/2029, 13-year govt. lending rate +1% then starting 03/07/2029, 13-year govt. lending rate +1.25% (revised every 13
years)
03/07/2016 then every 13 years
(2)
Y T2 N 0 431
FR0000584997 LCL 04/11/1985 229 EUR Average of monthly rates of return for payment of govt.-guaranteed and similar loans (INSEE
publication) - 0.15%
- N T2 N 90 90
FR0000165912 LCL 05/01/1987 305 EUR Average of monthly rates of return for payment of govt.-guaranteed and similar loans (INSEE
publication) - 0.30%
05/01/1994 then yearly
N T2 N 103 104
Participating note
FR0000140071 LCL 22/10/1984 305 EUR 40% x TMO + 33% x TMO x (Net income for (N-1)/ Net income for 1983)
- N T2 Y 120 120
- CR SUD RHÔNE ALPES 01/06/1992 0 EUR 60% TMO + 30% TMO x (ROA n-2 + n-1 + n/n-3 + n-2 + n-1). ROA = Result Balance sheet after provisions and tax / Total Balance sheet
starting 01/06/1999
N T2 N 0 0
- CR SUD RHÔNE ALPES 01/06/1993 0 EUR 60% TMO + 30% TMO x (ROA n-2 + n-1 + n/n-3 + n-2 + n-1). ROA = Result Balance sheet after provisions and tax / Total Balance sheet
starting 01/06/1999
N T2 N 0 0
- CR SUD RHÔNE ALPES 01/06/1995 0 EUR 60% TMO + 30% TMO x (ROA n-2 + n-1 + n/n-3 + n-2 + n-1). ROA = Result Balance sheet after provisions andtax / Total Balance sheet
starting 01/06/1999
N T2 N 0 0
- CR SUD RHÔNE ALPES 30/06/1993 1 EUR 60% x TMO + 40% x (Net income for (N) / Net income for (N-1))
- N T2 N 1 1
TOTAL 502 956
(1) Amounts before applying the grandfathering clause under Basel 3. (2) Redeem on 30 June 2016
CRÉDIT AGRICOLE GROUP - PILLAR 3 AT 30 JUNE 2016 19
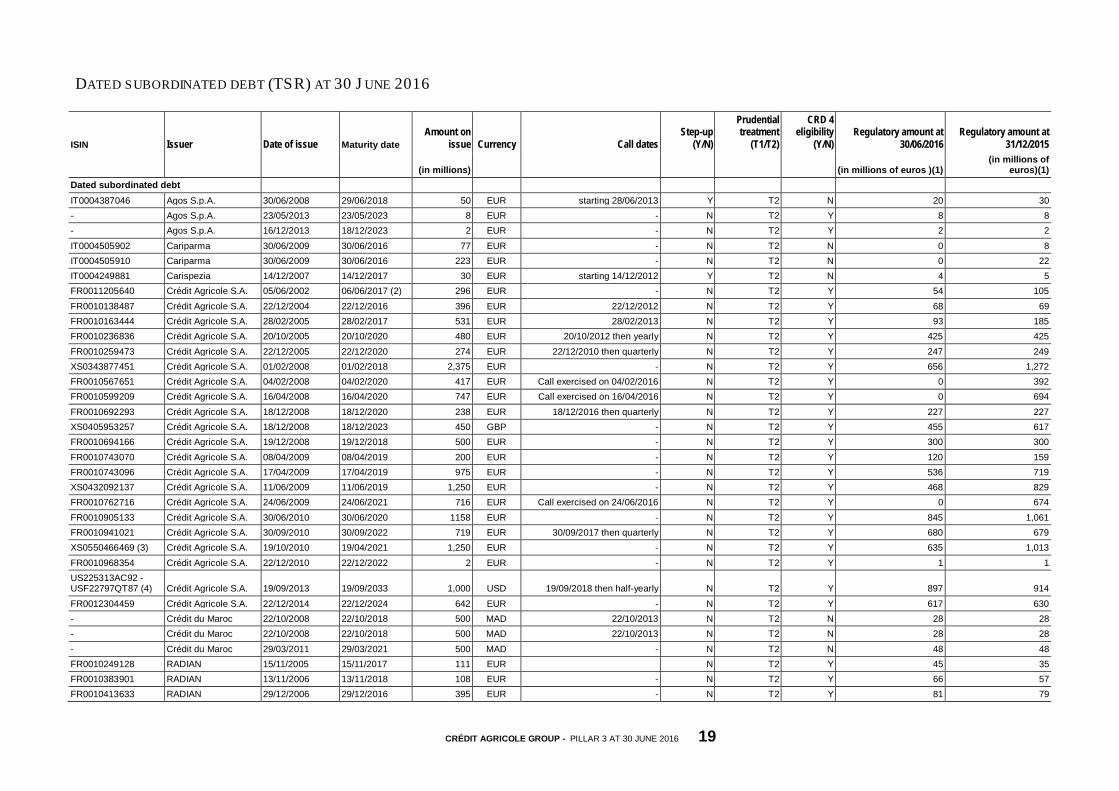
DATED SUBORDINATED DEBT (TSR) AT 30 J UNE 2016
ISIN Issuer Date of issue Maturity date Amount on
issue Currency Call dates Step-up
(Y/N)
Prudential treatment
(T1/T2)
CRD 4 eligibility
(Y/N) Regulatory amount at
30/06/2016 Regulatory amount at
31/12/2015
(in millions) (in millions of euros )(1) (in millions of
euros)(1) Dated subordinated debt IT0004387046 Agos S.p.A. 30/06/2008 29/06/2018 50 EUR starting 28/06/2013 Y T2 N 20 30 - Agos S.p.A. 23/05/2013 23/05/2023 8 EUR - N T2 Y 8 8 - Agos S.p.A. 16/12/2013 18/12/2023 2 EUR - N T2 Y 2 2 IT0004505902 Cariparma 30/06/2009 30/06/2016 77 EUR - N T2 N 0 8 IT0004505910 Cariparma 30/06/2009 30/06/2016 223 EUR - N T2 N 0 22 IT0004249881 Carispezia 14/12/2007 14/12/2017 30 EUR starting 14/12/2012 Y T2 N 4 5 FR0011205640 Crédit Agricole S.A. 05/06/2002 06/06/2017 (2) 296 EUR - N T2 Y 54 105 FR0010138487 Crédit Agricole S.A. 22/12/2004 22/12/2016 396 EUR 22/12/2012 N T2 Y 68 69 FR0010163444 Crédit Agricole S.A. 28/02/2005 28/02/2017 531 EUR 28/02/2013 N T2 Y 93 185 FR0010236836 Crédit Agricole S.A. 20/10/2005 20/10/2020 480 EUR 20/10/2012 then yearly N T2 Y 425 425 FR0010259473 Crédit Agricole S.A. 22/12/2005 22/12/2020 274 EUR 22/12/2010 then quarterly N T2 Y 247 249 XS0343877451 Crédit Agricole S.A. 01/02/2008 01/02/2018 2,375 EUR - N T2 Y 656 1,272 FR0010567651 Crédit Agricole S.A. 04/02/2008 04/02/2020 417 EUR Call exercised on 04/02/2016 N T2 Y 0 392 FR0010599209 Crédit Agricole S.A. 16/04/2008 16/04/2020 747 EUR Call exercised on 16/04/2016 N T2 Y 0 694 FR0010692293 Crédit Agricole S.A. 18/12/2008 18/12/2020 238 EUR 18/12/2016 then quarterly N T2 Y 227 227 XS0405953257 Crédit Agricole S.A. 18/12/2008 18/12/2023 450 GBP - N T2 Y 455 617 FR0010694166 Crédit Agricole S.A. 19/12/2008 19/12/2018 500 EUR - N T2 Y 300 300 FR0010743070 Crédit Agricole S.A. 08/04/2009 08/04/2019 200 EUR - N T2 Y 120 159 FR0010743096 Crédit Agricole S.A. 17/04/2009 17/04/2019 975 EUR - N T2 Y 536 719 XS0432092137 Crédit Agricole S.A. 11/06/2009 11/06/2019 1,250 EUR - N T2 Y 468 829 FR0010762716 Crédit Agricole S.A. 24/06/2009 24/06/2021 716 EUR Call exercised on 24/06/2016 N T2 Y 0 674 FR0010905133 Crédit Agricole S.A. 30/06/2010 30/06/2020 1158 EUR - N T2 Y 845 1,061 FR0010941021 Crédit Agricole S.A. 30/09/2010 30/09/2022 719 EUR 30/09/2017 then quarterly N T2 Y 680 679 XS0550466469 (3) Crédit Agricole S.A. 19/10/2010 19/04/2021 1,250 EUR - N T2 Y 635 1,013 FR0010968354 Crédit Agricole S.A. 22/12/2010 22/12/2022 2 EUR - N T2 Y 1 1 US225313AC92 - USF22797QT87 (4) Crédit Agricole S.A. 19/09/2013 19/09/2033 1,000 USD 19/09/2018 then half-yearly N T2 Y 897 914 FR0012304459 Crédit Agricole S.A. 22/12/2014 22/12/2024 642 EUR - N T2 Y 617 630 - Crédit du Maroc 22/10/2008 22/10/2018 500 MAD 22/10/2013 N T2 N 28 28 - Crédit du Maroc 22/10/2008 22/10/2018 500 MAD 22/10/2013 N T2 N 28 28 - Crédit du Maroc 29/03/2011 29/03/2021 500 MAD - N T2 N 48 48 FR0010249128 RADIAN 15/11/2005 15/11/2017 111 EUR N T2 Y 45 35 FR0010383901 RADIAN 13/11/2006 13/11/2018 108 EUR - N T2 Y 66 57 FR0010413633 RADIAN 29/12/2006 29/12/2016 395 EUR - N T2 Y 81 79
CRÉDIT AGRICOLE GROUP - PILLAR 3 AT 30 JUNE 2016 20
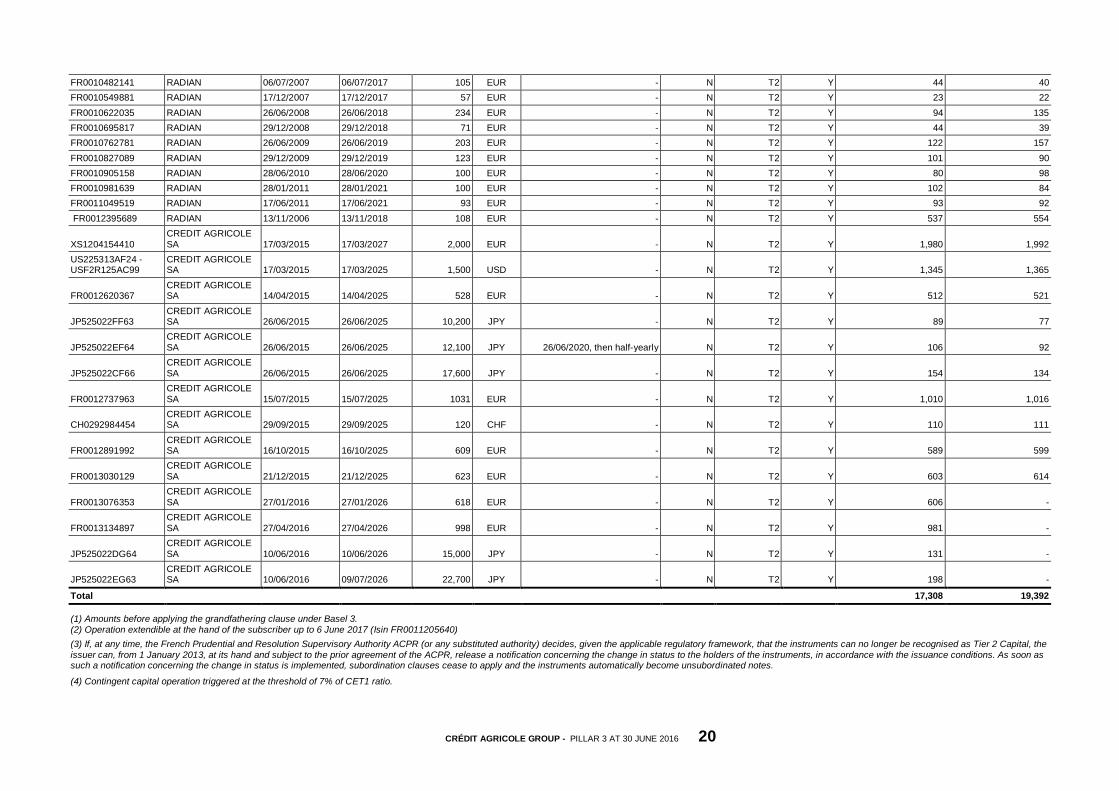
FR0010482141 RADIAN 06/07/2007 06/07/2017 105 EUR - N T2 Y 44 40 FR0010549881 RADIAN 17/12/2007 17/12/2017 57 EUR - N T2 Y 23 22 FR0010622035 RADIAN 26/06/2008 26/06/2018 234 EUR - N T2 Y 94 135 FR0010695817 RADIAN 29/12/2008 29/12/2018 71 EUR - N T2 Y 44 39 FR0010762781 RADIAN 26/06/2009 26/06/2019 203 EUR - N T2 Y 122 157 FR0010827089 RADIAN 29/12/2009 29/12/2019 123 EUR - N T2 Y 101 90 FR0010905158 RADIAN 28/06/2010 28/06/2020 100 EUR - N T2 Y 80 98 FR0010981639 RADIAN 28/01/2011 28/01/2021 100 EUR - N T2 Y 102 84 FR0011049519 RADIAN 17/06/2011 17/06/2021 93 EUR - N T2 Y 93 92 FR0012395689 RADIAN 13/11/2006 13/11/2018 108 EUR - N T2 Y 537 554
XS1204154410 CREDIT AGRICOLE SA 17/03/2015 17/03/2027 2,000 EUR - N T2 Y 1,980 1,992
US225313AF24 - USF2R125AC99
CREDIT AGRICOLE SA 17/03/2015 17/03/2025 1,500 USD - N T2 Y 1,345 1,365
FR0012620367 CREDIT AGRICOLE SA 14/04/2015 14/04/2025 528 EUR - N T2 Y 512 521
JP525022FF63 CREDIT AGRICOLE SA 26/06/2015 26/06/2025 10,200 JPY - N T2 Y 89 77
JP525022EF64 CREDIT AGRICOLE SA 26/06/2015 26/06/2025 12,100 JPY 26/06/2020, then half-yearly N T2 Y 106 92
JP525022CF66 CREDIT AGRICOLE SA 26/06/2015 26/06/2025 17,600 JPY - N T2 Y 154 134
FR0012737963 CREDIT AGRICOLE SA 15/07/2015 15/07/2025 1031 EUR - N T2 Y 1,010 1,016
CH0292984454 CREDIT AGRICOLE SA 29/09/2015 29/09/2025 120 CHF - N T2 Y 110 111
FR0012891992 CREDIT AGRICOLE SA 16/10/2015 16/10/2025 609 EUR - N T2 Y 589 599
FR0013030129 CREDIT AGRICOLE SA 21/12/2015 21/12/2025 623 EUR - N T2 Y 603 614
FR0013076353 CREDIT AGRICOLE SA 27/01/2016 27/01/2026 618 EUR - N T2 Y 606 -
FR0013134897 CREDIT AGRICOLE SA 27/04/2016 27/04/2026 998 EUR - N T2 Y 981 -
JP525022DG64 CREDIT AGRICOLE SA 10/06/2016 10/06/2026 15,000 JPY - N T2 Y 131 -
JP525022EG63 CREDIT AGRICOLE SA 10/06/2016 09/07/2026 22,700 JPY - N T2 Y 198 -
Total 17,308 19,392
(1) Amounts before applying the grandfathering clause under Basel 3. (2) Operation extendible at the hand of the subscriber up to 6 June 2017 (Isin FR0011205640)
(3) If, at any time, the French Prudential and Resolution Supervisory Authority ACPR (or any substituted authority) decides, given the applicable regulatory framework, that the instruments can no longer be recognised as Tier 2 Capital, the issuer can, from 1 January 2013, at its hand and subject to the prior agreement of the ACPR, release a notification concerning the change in status to the holders of the instruments, in accordance with the issuance conditions. As soon as such a notification concerning the change in status is implemented, subordination clauses cease to apply and the instruments automatically become unsubordinated notes. (4) Contingent capital operation triggered at the threshold of 7% of CET1 ratio.
CRÉDIT AGRICOLE GROUP - PILLAR 3 AT 30 JUNE 2016 21
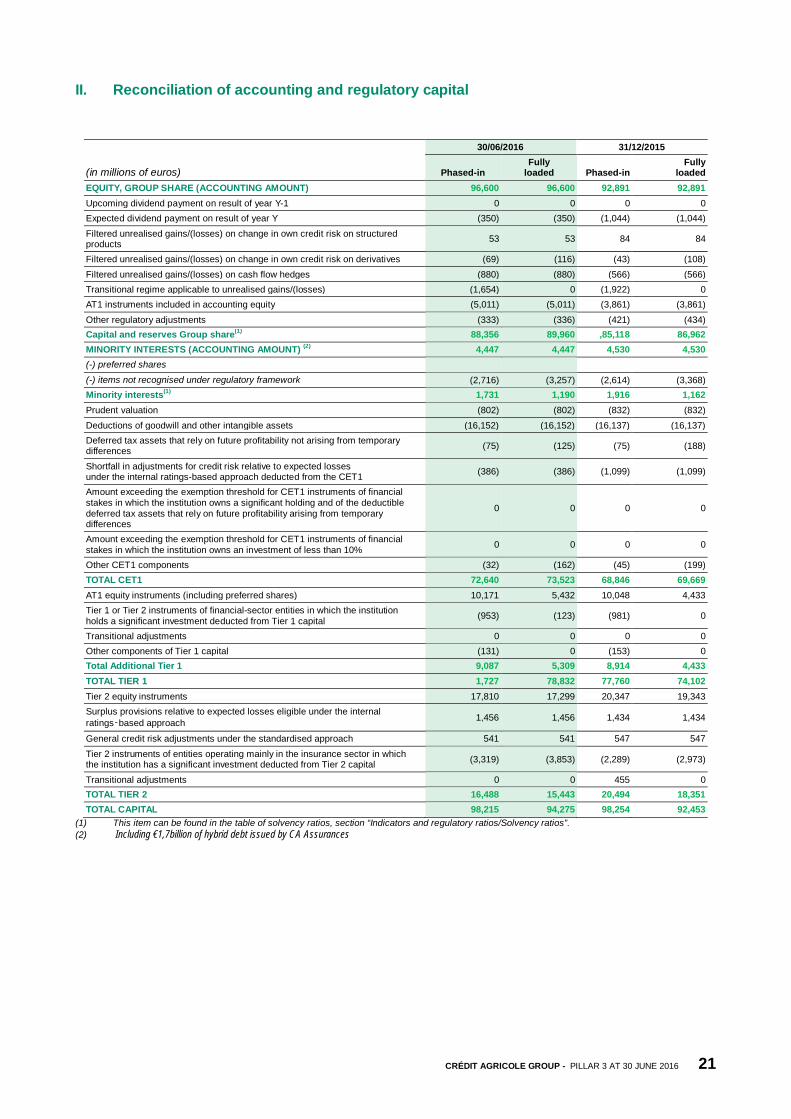
II. Reconciliation of accounting and regulatory capital
(in millions of euros)
30/06/2016 31/12/2015
Phased-in Fully
loaded Phased-in Fully
loaded EQUITY, GROUP SHARE (ACCOUNTING AMOUNT) 96,600 96,600 92,891 92,891 Upcoming dividend payment on result of year Y-1 0 0 0 0 Expected dividend payment on result of year Y (350) (350) (1,044) (1,044) Filtered unrealised gains/(losses) on change in own credit risk on structured products 53 53 84 84
Filtered unrealised gains/(losses) on change in own credit risk on derivatives (69) (116) (43) (108) Filtered unrealised gains/(losses) on cash flow hedges (880) (880) (566) (566) Transitional regime applicable to unrealised gains/(losses) (1,654) 0 (1,922) 0 AT1 instruments included in accounting equity (5,011) (5,011) (3,861) (3,861) Other regulatory adjustments (333) (336) (421) (434) Capital and reserves Group share(1) 88,356 89,960 ,85,118 86,962 MINORITY INTERESTS (ACCOUNTING AMOUNT) (2) 4,447 4,447 4,530 4,530 (-) preferred shares (-) items not recognised under regulatory framework (2,716) (3,257) (2,614) (3,368) Minority interests(1) 1,731 1,190 1,916 1,162 Prudent valuation (802) (802) (832) (832) Deductions of goodwill and other intangible assets (16,152) (16,152) (16,137) (16,137) Deferred tax assets that rely on future profitability not arising from temporary differences (75) (125) (75) (188)
Shortfall in adjustments for credit risk relative to expected losses under the internal ratings-based approach deducted from the CET1 (386) (386) (1,099) (1,099)
Amount exceeding the exemption threshold for CET1 instruments of financial stakes in which the institution owns a significant holding and of the deductible deferred tax assets that rely on future profitability arising from temporary differences
0 0 0 0
Amount exceeding the exemption threshold for CET1 instruments of financial stakes in which the institution owns an investment of less than 10% 0 0 0 0
Other CET1 components (32) (162) (45) (199) TOTAL CET1 72,640 73,523 68,846 69,669 AT1 equity instruments (including preferred shares) 10,171 5,432 10,048 4,433 Tier 1 or Tier 2 instruments of financial-sector entities in which the institution holds a significant investment deducted from Tier 1 capital (953) (123) (981) 0
Transitional adjustments 0 0 0 0 Other components of Tier 1 capital (131) 0 (153) 0 Total Additional Tier 1 9,087 5,309 8,914 4,433 TOTAL TIER 1 1,727 78,832 77,760 74,102 Tier 2 equity instruments 17,810 17,299 20,347 19,343 Surplus provisions relative to expected losses eligible under the internal ratings‑based approach 1,456 1,456 1,434 1,434
General credit risk adjustments under the standardised approach 541 541 547 547 Tier 2 instruments of entities operating mainly in the insurance sector in which the institution has a significant investment deducted from Tier 2 capital (3,319) (3,853) (2,289) (2,973)
Transitional adjustments 0 0 455 0 TOTAL TIER 2 16,488 15,443 20,494 18,351 TOTAL CAPITAL 98,215 94,275 98,254 92,453
(1) This item can be found in the table of solvency ratios, section “Indicators and regulatory ratios/Solvency ratios”. (2) Including €1,7billion of hybrid debt issued by CA Assurances
CRÉDIT AGRICOLE GROUP - PILLAR 3 AT 30 JUNE 2016 22
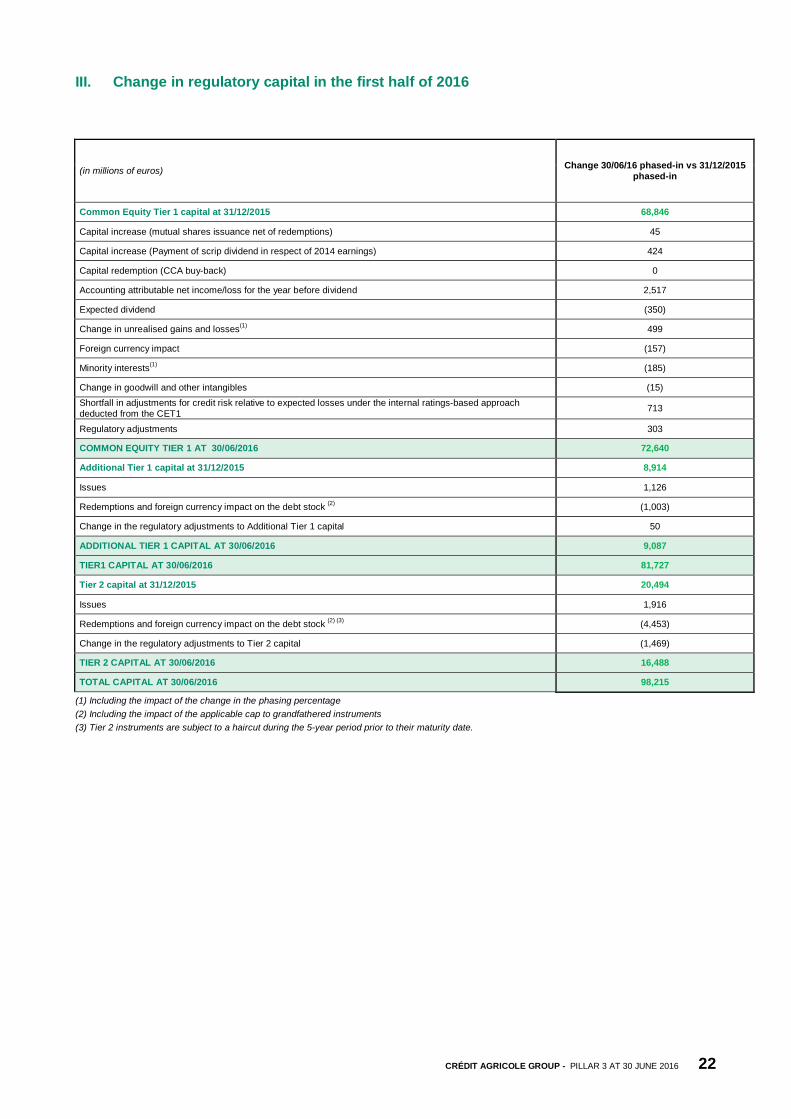
III. Change in regulatory capital in the first half of 2016
(in millions of euros) Change 30/06/16 phased-in vs 31/12/2015 phased-in
Common Equity Tier 1 capital at 31/12/2015 68,846
Capital increase (mutual shares issuance net of redemptions) 45
Capital increase (Payment of scrip dividend in respect of 2014 earnings) 424
Capital redemption (CCA buy-back) 0
Accounting attributable net income/loss for the year before dividend 2,517
Expected dividend (350)
Change in unrealised gains and losses(1) 499
Foreign currency impact (157)
Minority interests(1) (185)
Change in goodwill and other intangibles (15) Shortfall in adjustments for credit risk relative to expected losses under the internal ratings-based approach deducted from the CET1 713
Regulatory adjustments 303
COMMON EQUITY TIER 1 AT 30/06/2016 72,640
Additional Tier 1 capital at 31/12/2015 8,914
Issues 1,126
Redemptions and foreign currency impact on the debt stock (2) (1,003)
Change in the regulatory adjustments to Additional Tier 1 capital 50
ADDITIONAL TIER 1 CAPITAL AT 30/06/2016 9,087
TIER1 CAPITAL AT 30/06/2016 81,727
Tier 2 capital at 31/12/2015 20,494
Issues 1,916
Redemptions and foreign currency impact on the debt stock (2) (3) (4,453)
Change in the regulatory adjustments to Tier 2 capital (1,469)
TIER 2 CAPITAL AT 30/06/2016 16,488
TOTAL CAPITAL AT 30/06/2016 98,215
(1) Including the impact of the change in the phasing percentage (2) Including the impact of the applicable cap to grandfathered instruments (3) Tier 2 instruments are subject to a haircut during the 5-year period prior to their maturity date.
CRÉDIT AGRICOLE GROUP - PILLAR 3 AT 30 JUNE 2016 23
COMPOSITION AND CHANGES IN RISK WEIGHTED ASSETS
I. Use of internal ratings model
Use of internal ratings model to calculate regulatory capital is described in the update A.01 of the registration document on pages 100 and 101.
Advanced method scope has not changed for the first half of 2016.
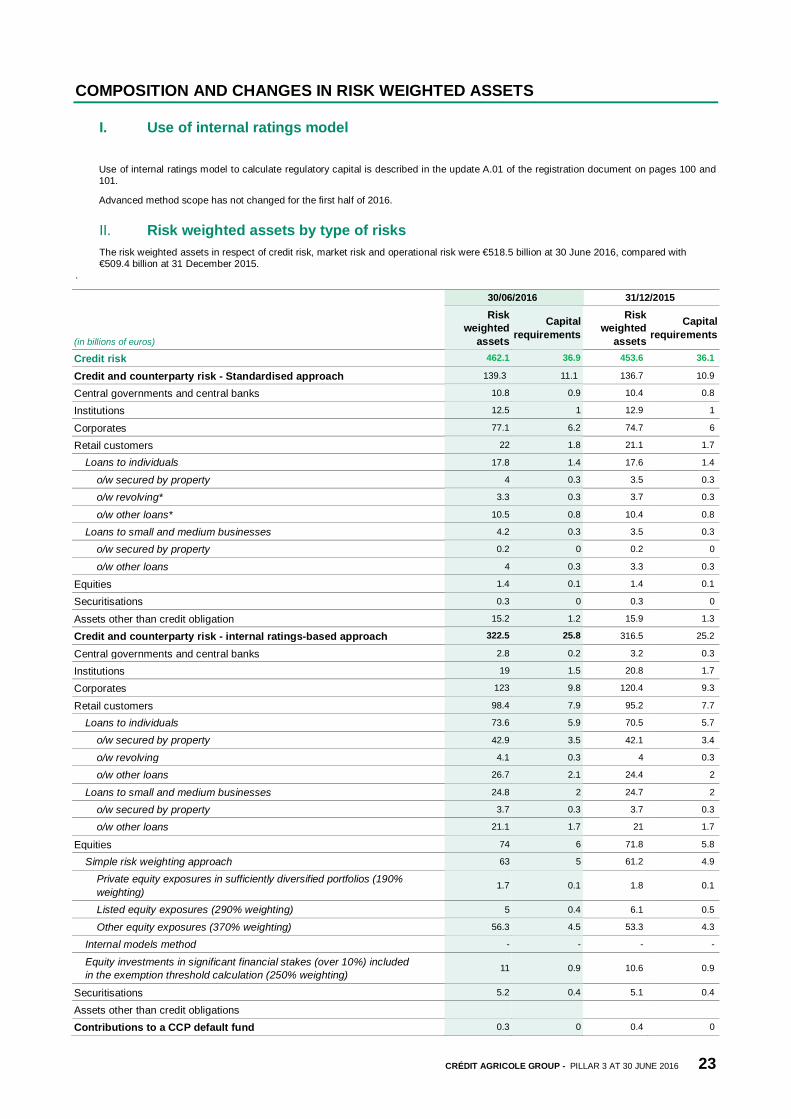
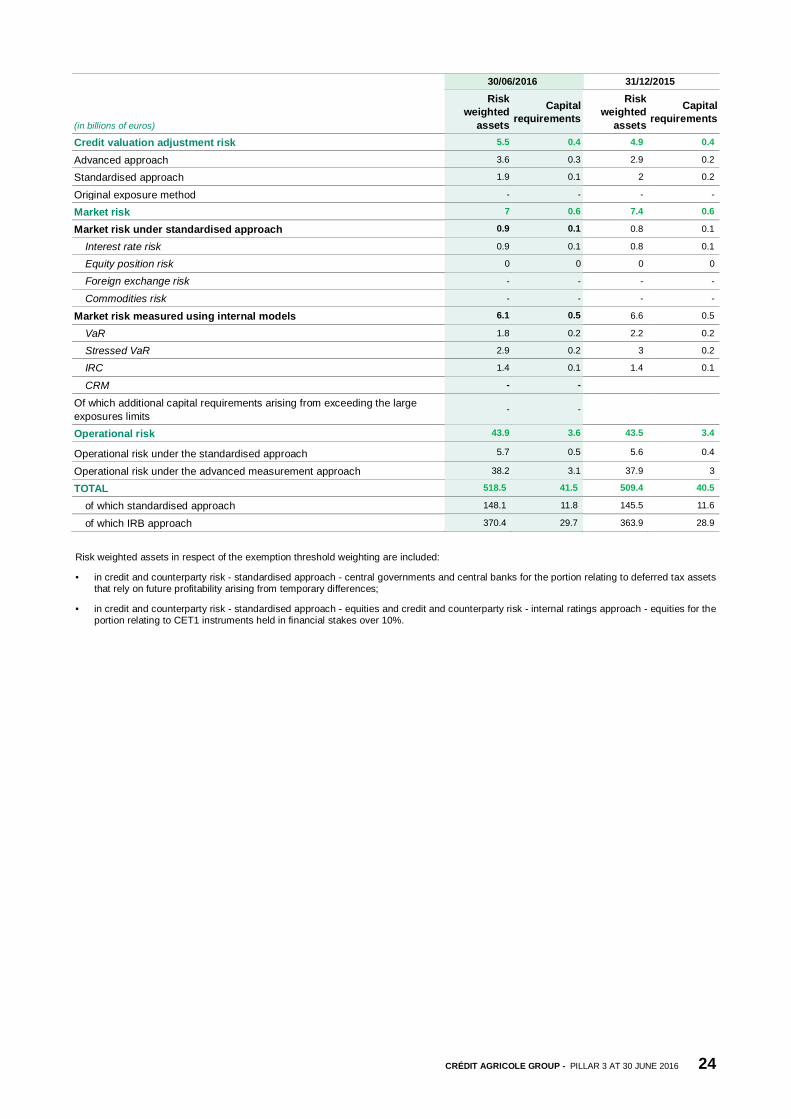
II. Risk weighted assets by type of risks The risk weighted assets in respect of credit risk, market risk and operational risk were €518.5 billion at 30 June 2016, compared with €509.4 billion at 31 December 2015.
.
(in billions of euros)
30/06/2016 31/12/2015
Risk weighted
assets
Capital requirements
Risk weighted
assets
Capital requirements
Credit risk 462.1 36.9 453.6 36.1
Credit and counterparty risk - Standardised approach 139.3 11.1 136.7 10.9 Central governments and central banks 10.8 0.9 10.4 0.8
Institutions 12.5 1 12.9 1
Corporates 77.1 6.2 74.7 6
Retail customers 22 1.8 21.1 1.7
Loans to individuals 17.8 1.4 17.6 1.4
o/w secured by property 4 0.3 3.5 0.3
o/w revolving* 3.3 0.3 3.7 0.3
o/w other loans* 10.5 0.8 10.4 0.8
Loans to small and medium businesses 4.2 0.3 3.5 0.3
o/w secured by property 0.2 0 0.2 0
o/w other loans 4 0.3 3.3 0.3
Equities 1.4 0.1 1.4 0.1
Securitisations 0.3 0 0.3 0
Assets other than credit obligation 15.2 1.2 15.9 1.3
Credit and counterparty risk - internal ratings-based approach 322.5 25.8 316.5 25.2
Central governments and central banks 2.8 0.2 3.2 0.3
Institutions 19 1.5 20.8 1.7
Corporates 123 9.8 120.4 9.3
Retail customers 98.4 7.9 95.2 7.7
Loans to individuals 73.6 5.9 70.5 5.7
o/w secured by property 42.9 3.5 42.1 3.4
o/w revolving 4.1 0.3 4 0.3
o/w other loans 26.7 2.1 24.4 2
Loans to small and medium businesses 24.8 2 24.7 2
o/w secured by property 3.7 0.3 3.7 0.3
o/w other loans 21.1 1.7 21 1.7
Equities 74 6 71.8 5.8
Simple risk weighting approach 63 5 61.2 4.9
Private equity exposures in sufficiently diversified portfolios (190% weighting)
1.7 0.1 1.8 0.1
Listed equity exposures (290% weighting) 5 0.4 6.1 0.5
Other equity exposures (370% weighting) 56.3 4.5 53.3 4.3
Internal models method - - - -
Equity investments in significant financial stakes (over 10%) included in the exemption threshold calculation (250% weighting)
11 0.9 10.6 0.9
Securitisations 5.2 0.4 5.1 0.4
Assets other than credit obligations
Contributions to a CCP default fund 0.3 0 0.4 0
CRÉDIT AGRICOLE GROUP - PILLAR 3 AT 30 JUNE 2016 24
(in billions of euros)
30/06/2016 31/12/2015
Risk weighted
assets
Capital requirements
Risk weighted
assets
Capital requirements
Credit valuation adjustment risk 5.5 0.4 4.9 0.4
Advanced approach 3.6 0.3 2.9 0.2
Standardised approach 1.9 0.1 2 0.2
Original exposure method - - - -
Market risk 7 0.6 7.4 0.6
Market risk under standardised approach 0.9 0.1 0.8 0.1 Interest rate risk 0.9 0.1 0.8 0.1
Equity position risk 0 0 0 0
Foreign exchange risk - - - -
Commodities risk - - - -
Market risk measured using internal models 6.1 0.5 6.6 0.5 VaR 1.8 0.2 2.2 0.2
Stressed VaR 2.9 0.2 3 0.2
IRC 1.4 0.1 1.4 0.1
CRM - -
Of which additional capital requirements arising from exceeding the large exposures limits
- -
Operational risk 43.9 3.6 43.5 3.4
Operational risk under the standardised approach 5.7 0.5 5.6 0.4
Operational risk under the advanced measurement approach 38.2 3.1 37.9 3
TOTAL 518.5 41.5 509.4 40.5
of which standardised approach 148.1 11.8 145.5 11.6
of which IRB approach 370.4 29.7 363.9 28.9
Risk weighted assets in respect of the exemption threshold weighting are included:
• in credit and counterparty risk - standardised approach - central governments and central banks for the portion relating to deferred tax assets that rely on future profitability arising from temporary differences;
• in credit and counterparty risk - standardised approach - equities and credit and counterparty risk - internal ratings approach - equities for the portion relating to CET1 instruments held in financial stakes over 10%.
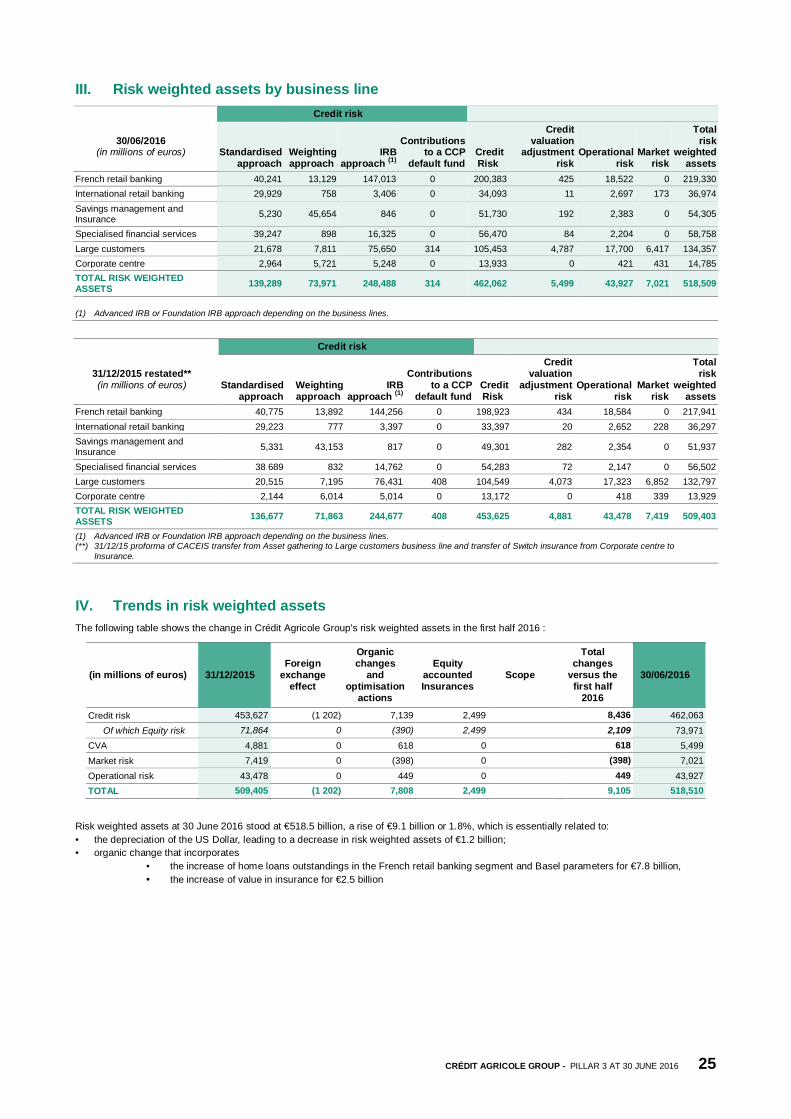
CRÉDIT AGRICOLE GROUP - PILLAR 3 AT 30 JUNE 2016 25
III. Risk weighted assets by business line Credit risk
30/06/2016 (in millions of euros) Standardised
approach Weighting approach
IRB approach (1)
Contributions to a CCP
default fund Credit Risk
Credit valuation
adjustment risk
Operational risk
Market risk
Total risk
weighted assets
French retail banking 40,241 13,129 147,013 0 200,383 425 18,522 0 219,330 International retail banking 29,929 758 3,406 0 34,093 11 2,697 173 36,974 Savings management and Insurance 5,230 45,654 846 0 51,730 192 2,383 0 54,305
Specialised financial services 39,247 898 16,325 0 56,470 84 2,204 0 58,758 Large customers 21,678 7,811 75,650 314 105,453 4,787 17,700 6,417 134,357 Corporate centre 2,964 5,721 5,248 0 13,933 0 421 431 14,785 TOTAL RISK WEIGHTED ASSETS 139,289 73,971 248,488 314 462,062 5,499 43,927 7,021 518,509
(1) Advanced IRB or Foundation IRB approach depending on the business lines.
Credit risk
31/12/2015 restated** (in millions of euros) Standardised
approach Weighting approach
IRB approach (1)
Contributions to a CCP
default fund Credit Risk
Credit valuation
adjustment risk
Operational risk
Market risk
Total risk
weighted assets
French retail banking 40,775 13,892 144,256 0 198,923 434 18,584 0 217,941 International retail banking 29,223 777 3,397 0 33,397 20 2,652 228 36,297 Savings management and Insurance 5,331 43,153 817 0 49,301 282 2,354 0 51,937
Specialised financial services 38 689 832 14,762 0 54,283 72 2,147 0 56,502 Large customers 20,515 7,195 76,431 408 104,549 4,073 17,323 6,852 132,797 Corporate centre 2,144 6,014 5,014 0 13,172 0 418 339 13,929 TOTAL RISK WEIGHTED ASSETS 136,677 71,863 244,677 408 453,625 4,881 43,478 7,419 509,403
(1) Advanced IRB or Foundation IRB approach depending on the business lines. (**) 31/12/15 proforma of CACEIS transfer from Asset gathering to Large customers business line and transfer of Switch insurance from Corporate centre to
Insurance.
IV. Trends in risk weighted assets The following table shows the change in Crédit Agricole Group's risk weighted assets in the first half 2016 :
(in millions of euros) 31/12/2015 Foreign
exchange effect
Organic changes
and optimisation
actions
Equity accounted Insurances
Scope
Total changes
versus the first half
2016
30/06/2016
Credit risk 453,627 (1 202) 7,139 2,499 8,436 462,063 Of which Equity risk 71,864 0 (390) 2,499 2,109 73,971
CVA 4,881 0 618 0 618 5,499 Market risk 7,419 0 (398) 0 (398) 7,021 Operational risk 43,478 0 449 0 449 43,927 TOTAL 509,405 (1 202) 7,808 2,499 9,105 518,510
Risk weighted assets at 30 June 2016 stood at €518.5 billion, a rise of €9.1 billion or 1.8%, which is essentially related to: • the depreciation of the US Dollar, leading to a decrease in risk weighted assets of €1.2 billion; • organic change that incorporates
• the increase of home loans outstandings in the French retail banking segment and Basel parameters for €7.8 billion, • the increase of value in insurance for €2.5 billion