Embed Size (px)
Citation preview

1
Activity metabolism in live-held southern bluefin tuna (Thunnus maccoyii), Phase 2
Quinn Fitzgibbon, Peter Frappell, Timothy Clark, Jeffrey Buchanan, David Ellis, Chris Carter, Richard Musgrove,
John Carragher and Roger Seymour
Final Report
April 2008 Aquafin CRC Project 1 A. 7(2) (FRDC Project No. 2005/200)

2
National Library of Australia Cataloguing-in-Publication Entry
ISBN 978-0-7308-5389-3
© (Aquafin CRC, Fisheries R&D Corporation, and the University of Adelaide) This work is copyright. Except as permitted under the Copyright Act 1968 (Cth), no part of this publication may be reproduced by any process, electronic or otherwise, without the specific written permission of the copyright owners. Neither may information be stored electronically in any form whatsoever without such permission. Every attempt has been made to provide accurate information in this document. However, no liability attaches to Aquafin CRC, its Participant organisations or any other organisation or individual concerned with the supply of information or preparation of this document for any consequences of using the information contained in the document.
Printed by South Australian Research and Development Institute on behalf of: The University of Adelaide, Adelaide, South Australia, 5005

3
Activity metabolism in live-held southern bluefin tuna (Thunnus maccoyii), Phase 2
Quinn Fitzgibbon, Peter Frappell, Timothy Clark, Jeffrey Buchanan, David Ellis, Chris Carter, Richard Musgrove,
John Carragher and Roger Seymour
April 2008
Aquafin CRC Project 1 A. 7 (2) (FRDC Project No. 2005/200)
Aquafin CRC is established and supported under the Australian Government’s Cooperative Research Centres Program

4
TABLE OF CONTENTS
NON TECHNICAL SUMMARY..........................................................................................................6 KEYWORDS ..........................................................................................................................................9 ACKNOWLEDGEMENTS .................................................................................................................10 BACKGROUND...................................................................................................................................10 NEED.....................................................................................................................................................12 OBJECTIVES.......................................................................................................................................13
CHAPTER 1: THE ENERGETIC CONSEQUENCE OF SPECIFIC DYNAMIC ACTION IN SOUTHERN BLUEFIN TUNA (THUNNUS MACCOYII)
ABSTRACT..........................................................................................................................................14 INTRODUCTION...................................................................................................................................14 METHODS ...........................................................................................................................................16 RESULTS.............................................................................................................................................22 DISCUSSION........................................................................................................................................26
CHAPTER 2: THE EFFECT OF BAITFISH LIPID CONTENT ON THE ENERGETIC COST OF SPECIFIC DYNAMIC ACTION IN SOUTHERN BLUEFIN TUNA (THUNNUS MACCOYII)
ABSTRACT..........................................................................................................................................32 INTRODUCTION...................................................................................................................................33 METHODS ...........................................................................................................................................34 RESULTS.............................................................................................................................................34 DISCUSSION........................................................................................................................................42
CHAPTER 3: EFFECTS OF HYPOXIA ON OXYGEN CONSUMPTION, SWIMMING VELOCITY AND GUT EVACUATION IN SOUTHERN BLUEFIN TUNA (THUNNUS MACCOYII)
ABSTRACT..........................................................................................................................................47 INTRODUCTION...................................................................................................................................48 METHODS ...........................................................................................................................................50 RESULTS.............................................................................................................................................53 DISCUSSION........................................................................................................................................57
CHAPTER 4: RELATIONSHIP BETWEEN ROUTINE METABOLIC RATE AND VISCERAL WARMING IN SOUTHERN BLUEFIN TUNA (THUNNUS MACCOYII).
ABSTRACT..........................................................................................................................................64 INTRODUCTION...................................................................................................................................65 METHODS ...........................................................................................................................................68 RESULTS.............................................................................................................................................71 DISCUSSION........................................................................................................................................79
CHAPTER 5: HEART RATE OF FREE-SWIMMING SOUTHERN BLUEFIN TUNA (THUNNUS MACCOYII).
ABSTRACT..........................................................................................................................................86 INTRODUCTION...................................................................................................................................86 METHODS ...........................................................................................................................................87 RESULTS.............................................................................................................................................89 DISCUSSION........................................................................................................................................93
CHAPTER 6: NITROGEN BALANCE AND PROTEIN SYNTHESIS IN SOUTHERN BLUEFIN TUNA (THUNNUS MACCOYII)
ABSTRACT..........................................................................................................................................96 INTRODUCTION...................................................................................................................................96 METHODS ...........................................................................................................................................97 RESULTS.............................................................................................................................................99

5
DISCUSSION......................................................................................................................................101
BENEFITS AND ADOPTION ..........................................................................................................103 FURTHER DEVELOPMENTS ........................................................................................................104 PLANNED OUTCOMES...................................................................................................................105 CONCLUSION...................................................................................................................................107 REFERENCES ...................................................................................................................................110 APPENDIX A. LIST OF ABBREVIATIONS..................................................................................122
APPENDIX B. INTELLECTUAL PROPERTY .............................................................................123 APPENDIX A.STAFF........................................................................................................................123

6
2005/200 Activity metabolism in live-held southern bluefin tuna (Thunnus maccoyii), Phase 2
PRINCIPAL INVESTIGATOR: Professor Roger Seymour
ADDRESS: University of Adelaide
School of Earth and Environmental Sciences
North Terrace
Adelaide, SA, 5005
Telephone: (08) 8303 4364, Fax: (08) 8303 5596
Email: [email protected]
OBJECTIVES:
1. To examine the metabolic cost of specific dynamic action in SBT
2. To determine the relationship between visceral warming and metabolic rate
associated to specific dynamic action in SBT
3. To assess the metabolic cost and behavioral responses of SBT to hypoxia
4. To evaluate the critical limits of dissolved oxygen for SBT
5. To investigate the effects of stage of farming season on the metabolism of
SBT
6. To develop an archival tag for the in-situ monitoring of heart rate of free
swimming SBT under aquaculture conditions
7. Measurement of protein synthesis of SBT
NON TECHNICAL SUMMARY
Bluefin tuna have a variety of anatomical and physiological adaptations that enhance
performance and make them distinctive among fish. This unique physiology means
that many common aquacultural beliefs are not applicable to this fish. However, due
to the logistical difficulties of studying these large pelagic fish, our understanding of
tuna physiology lags far behind that of other aquaculture fish species. In this study,
some critical aspects of southern bluefin tuna (SBT) physiology (principally
7
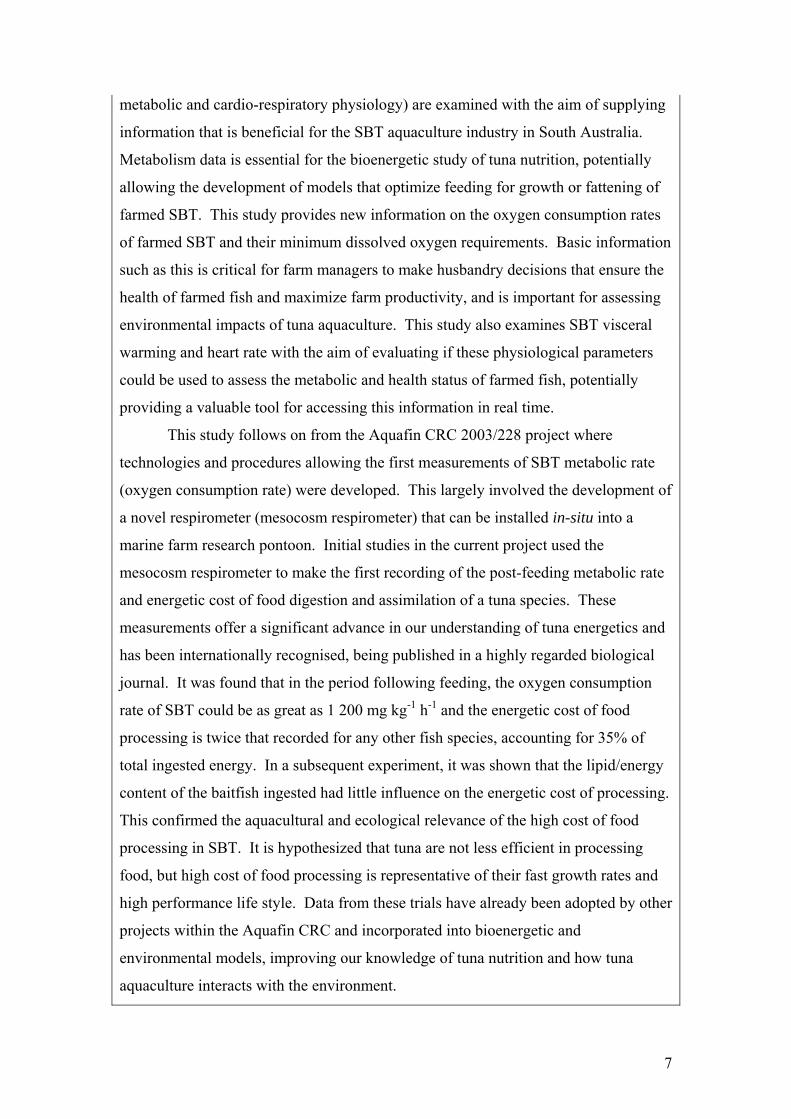
metabolic and cardio-respiratory physiology) are examined with the aim of supplying
information that is beneficial for the SBT aquaculture industry in South Australia.
Metabolism data is essential for the bioenergetic study of tuna nutrition, potentially
allowing the development of models that optimize feeding for growth or fattening of
farmed SBT. This study provides new information on the oxygen consumption rates
of farmed SBT and their minimum dissolved oxygen requirements. Basic information
such as this is critical for farm managers to make husbandry decisions that ensure the
health of farmed fish and maximize farm productivity, and is important for assessing
environmental impacts of tuna aquaculture. This study also examines SBT visceral
warming and heart rate with the aim of evaluating if these physiological parameters
could be used to assess the metabolic and health status of farmed fish, potentially
providing a valuable tool for accessing this information in real time.
This study follows on from the Aquafin CRC 2003/228 project where
technologies and procedures allowing the first measurements of SBT metabolic rate
(oxygen consumption rate) were developed. This largely involved the development of
a novel respirometer (mesocosm respirometer) that can be installed in-situ into a
marine farm research pontoon. Initial studies in the current project used the
mesocosm respirometer to make the first recording of the post-feeding metabolic rate
and energetic cost of food digestion and assimilation of a tuna species. These
measurements offer a significant advance in our understanding of tuna energetics and
has been internationally recognised, being published in a highly regarded biological
journal. It was found that in the period following feeding, the oxygen consumption
rate of SBT could be as great as 1 200 mg kg-1 h-1 and the energetic cost of food
processing is twice that recorded for any other fish species, accounting for 35% of
total ingested energy. In a subsequent experiment, it was shown that the lipid/energy
content of the baitfish ingested had little influence on the energetic cost of processing.
This confirmed the aquacultural and ecological relevance of the high cost of food
processing in SBT. It is hypothesized that tuna are not less efficient in processing
food, but high cost of food processing is representative of their fast growth rates and
high performance life style. Data from these trials have already been adopted by other
projects within the Aquafin CRC and incorporated into bioenergetic and
environmental models, improving our knowledge of tuna nutrition and how tuna
aquaculture interacts with the environment.

8
Measurements of the rates of nitrogen excretion and protein synthesis of SBT
were also attempted opportunistically, during mesocosm respiration measurements. In
keeping with their high metabolic rate, it was found that ammonia excretion rates of
SBT could be as great as 800 mg N kg-1day-1, which is more than double that recorded
for any other fish species to date. Attempts to measure protein synthesis were
unsuccessful, due to analytical issues.
In other experiments, the effects of low dissolved oxygen (hypoxia) on the
physiological and behavioural responses of SBT were examined. In moderate
hypoxia (40-60% saturation) SBT respond by increasing swimming speed,
presumably to facilitate increased ventilation. It was found that they can tolerate
surprisingly low dissolved oxygen levels, surviving several hours below 30%
saturation. Amazingly, feeding did not significantly influence their tolerance to
hypoxia in the short term and they even maintained digestion at dissolved oxygen
levels below 40% saturation. It is thought that their acute hypoxia tolerance is another
physiological adaptation (such as great gill surface area and enhanced cardio-
respiratory capabilities), representative of their great metabolic scope. However, the
effects of prolonged hypoxia exposure are unknown and large, fattened tuna may be
more susceptible because of their decreased gill surface to body mass ratio. Despite
the fact that hypoxia is unlikely to be lethal under normal aquaculture conditions, it is
likely that even mild hypoxia will decrease growth due to the increased energetic
costs for ventilation (through increased swimming speed) and likely suppressive
effect on their metabolic scope.
We also conducted the first examination of the relationship between the
warming of the digestive cavity (viscera) and metabolic rate in SBT. The purpose of
this research was to determine if visceral temperature could be used to estimate
metabolic rate (energy consumption). Whereas metabolic rate is extremely difficult to
measure, visceral temperature is relatively easy (using archival temperature loggers).
Development of an easily measured correlate for metabolic rate could facilitate more
detailed examination of tuna nutrition by allowing comprehensive bioenergetic
modelling of free swimming SBT. These models could be used to describe or predict
the nutritional needs of growing or fattening tuna in aquaculture. It was found that
post-feeding visceral warming was directly related to metabolic rate; however, the
relationship was dependent on fish mass and water temperature. Differences in

9
warming capacity with mass and water temperature are likely due to changes in
thermal inertia and heat retention efficiency, and are evidence of physiological control
of warming. These results suggest that visceral temperature could be used to estimate
the metabolic rate of fish of similar size and at similar water temperatures. Thus,
visceral temperature could be a useful tool for the studies of SBT nutritional
requirements.
Heart rate has been shown in other species to correlate well with activity,
visceral temperature changes and digestion following bouts of feeding. The principle
behind this relationship is that changes in these parameters are associated with
systematic changes in heart rate which in turn, according to the Fick equation for
circulation, are related to metabolic rate. To this end, a surgically implantable
archival tag was customised to record heart rate and visceral temperature in freely
swimming southern bluefin tuna held in research pontoons at Port Lincoln. Initial
tests concentrated on determining the validity of this approach, modifying archival tag
design and improving the surgical implantation of the archival tag. More recently,
archival tags were deployed in a preliminary study using several southern bluefin
tuna, and a number of different feeding regimes were undertaken to determine the
influence of feeding on heart rate. Following implantation, tuna recommenced
feeding 3-4 days after logger implantation, and the loggers remained in the fish for the
40 days of the experiment, with no adverse effects. Initial analysis reveals that post-
feeding heart rate correlates closely with the size of the meal ingested. Together, with
variables already being collected (visceral and water temperatures), activity
determined through tail-beat frequency (measurement of which is currently being
developed) and calibrations associated with fast changes in the rate of oxygen
consumption that accompany various activities, heart rate could provide accurate
estimates of rapid changes in energy expenditure in southern bluefin tuna.
KEYWORDSTuna, metabolism, specific dynamic action, oxygen, hypoxia, endothermy,
cardiovascular physiology, heart rate.

10
ACKNOWLEDGEMENTS
We thank SBT Aquaculture Subprogram leader Steven Clarke for his continual
scientific and logistical support. This work required an enormous amount of technical
assistance. We thank skippers; Brenton Ebert, John Collinson, Guy Manthorpe, Neil
Chigwidden, and divers Kane Williams and Dan Gorman. Their enthusiasm and
problem solving abilities were instrumental to the success of this work. Our greatest
appreciation goes to Brian Taylor for his efforts in customisation of the heart rate
monitor. From industry, we thank the Tuna Boat Owners Association of South
Australia, Dave Warland (Sekol Farm Tuna), Adam Watkins (DI Fishing Co), Chris
Pitney (Tony’s Tuna International) and Doug Grasky and the boys (Eyre Diving).
This work formed part of a project of Aquafin CRC, and received funds from the
Australian Government’s CRCs Program, the Fisheries R&D Corporation and other
CRC Participants.
BACKGROUND
Tuna share an assortment of anatomical and physiological traits that enhance
performance and make them distinct from most other teleosts. They have evolved
muscle, bone and tendon anatomy that supports swimming with minimal body lateral
movement (thunniform swimming mode), which is specialized for both high-
performance and long-distance locomotion (Altringham and Shadwick, 2001;
Westneat and Wainwright, 2001). Their cardio-respiratory systems are adapted for
high rates of oxygen uptake and transport, and include large gill surface areas, thin
gill epithelia, large hearts, high heart rates, high cardiac outputs, high ventricular
pressures, high proportions of compact myocardium, and well-developed coronary
circulations (Muir and Hughes, 1969; Farrell et al., 1992; Brill and Bushnell, 2001;
Blank et al., 2004). Their enhanced ability for oxygen uptake and delivery supports
high metabolic rates. The standard metabolic rates of tuna have been shown to be
between 2-5 times greater than those of most other active fish (Brill, 1979; Brill,
1987; Dewar and Graham, 1994; Fitzgibbon et al., 2006). High basal metabolism is
thought to be due to energetically expensive adaptations that support a great metabolic
scope (Brill and Bushnell, 1991; Korsmeyer et al., 1996). A great metabolic scope
provides the power to maintain multiple metabolic functions, such as rapid sustained

11
swimming, fast growth rates, rapid digestion, and potential for quick repayment of
oxygen debt. Tuna also have counter-current vascular heat exchangers (retia
mirabilia) that enable them to accumulate metabolically-generated heat to maintain
the temperature of certain tissues (red muscle, cranial tissues and the viscera) above
water temperature (regional endothermy). It is hypothesized that regional endothermy
enhances aerobic swimming performance and has allowed tuna to expand their
thermal niche (Block et al., 1993; Graham and Dickson, 2000; Dickson and Graham,
2004). Due to these adaptations, tuna are commonly classed as “high performance
fishes”. However, maintaining their high performance physiology comes at a great
energetic cost. This energetic cost is reflected in tunas’ high metabolic intensity,
which in many respects parallels that of mammals and birds (Korsmeyer and Dewar,
2001). Due to the unique ‘high performance’ physiology of tuna, many of the
common finfish aquacultural beliefs are probably not applicable to these fish.
Amongst tuna, bluefin (Thunnus maccoyii, T. orientalis and T. thynnus) could
be considered to have the highest performance physiology. Pacific bluefin (T.
orientalis) have higher heart rates and cardiac outputs, maintain cardiac performance
at lower temperatures and have greater metabolic rates at a given swimming velocity
than yellowfin tuna (T. albacares) (Blank et al., 2002; Blank et al., 2004; Blank et al.,
2007). Bluefin also have the most advanced endothermy anatomy (Collette et al.,
2001), with well developed lateral retia mirabilia to warm the muscles (Carey and
Teal, 1969b) and visceral retia mirabilia to accumulate heat within the peritoneal
cavity (Carey et al., 1984; Fudge and Stevens, 1996). This physiology has allowed
bluefin to extend their distribution further into productive cooler waters of higher
latitudes (Gunn and Block, 2001; Block et al., 2005).
Although our understanding of tuna physiology is rapidly increasing, it still
lags far behind that other teleosts such as salmonids. Many fundamental aspects of
tuna physiology remain unknown. This is because tuna possess many attributes that
make them difficult experimental specimens. They are large, strong, and difficult to
maintain in culture conditions. Furthermore, they need to swim continuously in order
to ventilate their gills and to maintain hydrodynamic equilibrium (Brown and Muir,
1970; Magnuson, 1973). As a result, only recently has the first measurement of
bluefin tuna metabolism been conducted (Fitzgibbon et al., 2006).

12
NEED
The rapid development of intensive SBT aquaculture in South Australia has resulted
in a need for a greater understanding of their metabolic physiology. Metabolism is the
biochemical engine that powers all physiological activities such as swimming, growth
and reproduction. An understanding of its fundamental processes and the effects of
environmental factors is required to optimize it for aquaculture objectives (i.e growth
or fattening).
Any further expansion of the current SBT aquaculture industry must come
from greater or more efficient growth of the quota-limited supply of fish. Metabolic
data are essential for a bio-energetic approach to improve our understanding of SBT
nutritional needs for growing or fattening. Similarly, protein synthesis is a critical
process affecting the efficiency of growth, but this has yet to be measured for SBT,
and an understanding of protein synthesis and nitrogen balance will be important for
bioenergetic models. Such models could be used to formulate baitfish and/or
formulated diet matrices that deliver optimal nutritional value. Also, these models
could improve our understanding of feed conversion ratios and the effects of differing
feeding strategies.
Metabolic data will increase our understanding of how the environment
(principally dissolved oxygen) affects the growth and health of SBT in culture
conditions. The environment influences the physiological processes of an organism
through its metabolism. Dissolved oxygen is considered to be a limiting factor,
setting the upper limit of aerobic metabolism and thus defining the metabolic scope.
Reduced metabolic scope results in reduced growth potential. Although the effects of
reduced dissolved oxygen may not be acutely apparent, prolonged exposure can result
in reduced growth performance. Before this study, the oxygen consumption rates and
minimum dissolved oxygen requirements of SBT in aquaculture were unknown. This
information is critical for farm managers to make husbandry decisions to ensure the
health of their fish and maximize farm productivity.
Conversely, a greater understanding of metabolic physiology and nitrogen
metabolism will increase our knowledge of how SBT aquaculture affects the
environment. This will allow the prediction of pontoon- and regional-scale dissolved
oxygen demands and nitrogen excretion, and thus carrying capacities.

13
Further physiological understanding may also identify parameters that can be
used to assess the metabolic and health status of farmed tuna. This study examines
visceral warming as a correlate for metabolism. The development of an easily
measured estimate of metabolic rate would greatly enhance the potential for
comprehensive bioenergetic modeling of free swimming tuna, greatly enhancing our
understanding of tuna nutrition. This study also examines heart rate which provides a
more accurate measurement of aerobic energy requirements, and thus has proven a
particularly desirable variable to measure in fish undertaking normal activities in the
farmed situation.
Overall, ecological and economic sustainability of tuna aquaculture operations
depend on appropriate management. Overfeeding is costly and a source of organic
enrichment, which if it were to occur could threaten the economic viability of
operations, while underfeeding reduces growth and may influence fish welfare.
Finding optimal feeding regimes and environmental conditions in which to raise fish
requires intimate knowledge of the physiology and behaviour of fish. Such data
provide the basis on which sound aquaculture models for improved farm yield are
built.
OBJECTIVES 1. To examine the metabolic cost of specific dynamic action in SBT
2. To determine the relationship between visceral warming and metabolic rate
associated to specific dynamic action in SBT
3. To assess the metabolic cost and behavioral responses of SBT to hypoxia
4. To evaluate the critical limits of dissolved oxygen for SBT
5. To investigate the effects of stage of farming season on the metabolism of
SBT
6. To customize an archival tag for the in-situ monitoring of heart rate of free
swimming SBT under aquaculture conditions
7. Measurement of protein synthesis of SBT

14
Chapter 1: The energetic consequence of specific dynamic action in southern bluefin tuna (Thunnus maccoyii)
Abstract
The effect of feeding on the rate of oxygen consumption ( M. O2) of four groups of three
southern bluefin tuna (SBT) (Thunnus maccoyii) was examined in a large static
respirometer at water temperatures of 18.2-20.3oC. Six feeding events of rations
between 2.1 and 8.5 % body mass (%Mb) of sardines (Sardinops sagax) were recorded
(two of the groups were fed twice). Before feeding, fish swam between 0.71 and 1.4
body lengths s-1 (BL s-1) and the routine metabolic rate (RMR) was 366 ± 33 (SE) mg
kg-1 h-1. For all trials, M. O2 was elevated post-feeding, presumably as a result of
specific dynamic action (SDA). Swimming velocity was also elevated post-feeding
for periods similar to that of M. O2 (between 20-45 h, longer for the larger rations).
Post-feeding swimming velocity increased to between 0.9-2.6 BL s-1 and was also
dependent on ration consumed. It is suggested that the purpose of increased
swimming velocity was to increase ventilation volume as a response to the enhanced
metabolic demand associated with SDA. Peak postprandial M. O2 increased linearly
with ration size to a maximum of 1 290 mg kg-1 h-1, corresponding to 2.8 times the
RMR. When converted to its energy equivalent, the total magnitude of SDA was
linearly correlated with ration size to a maximum of 192 kJ kg-1 h-1. As a proportion
of gross energy ingested (SDA coefficient) the magnitude of SDA averaged 34.7 ±
2.2 %. These results demonstrate that, although the factorial increase of SDA in SBT
is similar to that of other fish species, the absolute energetic cost of SDA is much
higher. The feed ration that SBT require to equal the combined metabolic costs of
SDA and RMR is estimated in this study to be 3.5 %Mb of sardines per day.
Introduction
Tunas are highly specialized marine predators that are widely distributed throughout
the world’s tropical and temperate oceans. In this vast habitat, they have evolved

15
numerous unique anatomical, biochemical and physiological adaptations that have
been instrumental to their success (Bushnell and Jones, 1994; Brill, 1996; Graham and
Dickson, 2004). Of particular interest are the adaptations in the areas of metabolism
and energetics. Tunas are known to have standard metabolic rates (SMR, the rate
when theoretically at complete rest) and metabolic scopes that greatly exceed those of
most other well studied fish species (Korsmeyer and Dewar, 2001). These elevated
metabolic states allow tuna to achieve physiological feats, including rapid digestion
and quick recovery from oxygen-debt, that enable them to take advantage of the
ocean’s patchy prey distribution. However, this metabolic amplification comes at an
energetic cost, which has led some authors to describe tuna as “energy speculators”,
animals that gamble high rates of energy expenditure on potential higher rates of
energy return (Brill, 1987; Korsmeyer et al., 1996).
Our understanding of tuna energetics lags far behind that of smaller species
such as salmonids. The size and difficulty of handling tuna has meant only a small
number of metabolic measurements have been possible. The majority of research on
tuna metabolism has focused on evaluation of the SMR or quantification of swimming
costs (Brill, 1979; Gooding et al., 1981; Graham and Laurs, 1982; Brill, 1987;
Graham et al., 1989; Dewar and Graham, 1994; Sepulveda and Dickson, 2000). The
metabolic cost of specific dynamic action (SDA) has yet to be examined in any tuna
species.
Specific dynamic action (often referred to as apparent specific dynamic action,
calorigenic effect or heat increment of feeding) refers to the total energy cost involved
with ingestion, digestion, absorption and assimilation of a meal. In fish, SDA is a
substantial component of total bioenergetics, representing between 5 and 20% of
gross ingested energy (Muir and Niimi, 1972; Beamish, 1974; Carter and Brafield,
1992; Chakraborty et al., 1992; Peck et al., 2002; Fu et al., 2005c). However none of
these studies have examined marine pelagic fish. Specific dynamic action has been
hypothesized to be a significant component of metabolism of tuna, because of their
high rates of food consumption and digestion (Korsmeyer and Dewar, 2001).
Furthermore, it is hypothesized that rapidly growing fish, such as tuna, should show
the greatest postprandial increase in metabolic rate (Jobling, 1981; Brill, 1996). This
theory is based on the consensus that a large proportion of the energetic cost of SDA
is related to metabolic work responsible for growth, i.e. protein synthesis and turnover

16
(Jobling, 1981; Brown and Cameron, 1991b; Brown and Cameron, 1991a; Lyndon et
al., 1992).
This study uses a large, sea-based, metabolic chamber to overcome some of
the logistical difficulties with working with large, pelagic fish (Fitzgibbon et al.,
2006). The spacious, low-stress environment of the sea-based respirometer supports
voluntary feeding, allowing this study to make the first recording of SDA of a tuna
species, southern bluefin tuna (SBT) (Thunnus maccoyii), ingesting sardine
(Sardinops sagax), an important food component in the diets of both wild and
aquaculture SBT (Ward et al., 2006).
Methods
Experimental animals
SBT were acquired courtesy of the Tuna Boat Owners Association of South Australia.
The SBT were purse-seine netted in the Great Australian Bight, most likely from a
single wild school, in early January 2005. They were transferred to a specially-
designed tow pontoon and slowly towed approximately 200 nautical miles back to the
marine farms in the waters off Port Lincoln, South Australia. Soon after arrival,
twelve juvenile SBT (10 ± 0.4 kg, mean ± SE) were transferred into a 12 m diameter,
8 m deep sea-cage, moored in a small bay at the south end of Boston Island. Fish
were fed sardines and allowed 2 months to recover from the tow and transfer, and to
become accustomed to the sea-cage environment.
Mesocosm respirometer
Mesocosm respirometer design, deployment and maintenance were as described in
Fitzgibbon et al. (2006), however clear polyvinyl windows were reduced from 2m in
diameter to 1 m to reduce algal growth on the internal materials (Fig. 1). The
mesocosm was pump-filled with sea-water to capacity (approximately 400 000 l) to
reduce the likelihood of confinement stress. However, in subsequent experiments,
water volume was reduced to 350 000 l as the initial volume was found to be slightly
in excess of what was required to maximise available space within the respirometer.

17
Fig. 1. Diagram of the mesocosm respirometer showing; 1entrance port, 2windows, 3
sample ports, 4wave break wall, 5cable entrance ports, 6oxygen probes, 7float, 8lead
weights, 9video cameras, 10lights, and 11water level.
SBT were introduced into the mesocosm from the adjacent holding pontoon by
use of a baited, barb-less hook as described in Fitzgibbon et al. (2006) or, in the case
when the fish were hook-shy, by crowding the fish in a net and a skin-diver securing
them by hand and passing them across a soft, wet, slipway into the respirometer.
After introduction, any air bubbles that had collected on the internal surface (from
scuba-diver expiration or oxygen injection) were rolled out of the access port, before
the mesocosm was sealed. Oxygen consumption rates (M. O2) were determined by
measuring the drop in mesocosm internal dissolved oxygen (DO) level over time.
Mesocosm mixing was monitored by manual recordings of DO at the beginning and
end of each experimental trial; these were made through screw cap access ports in the
18
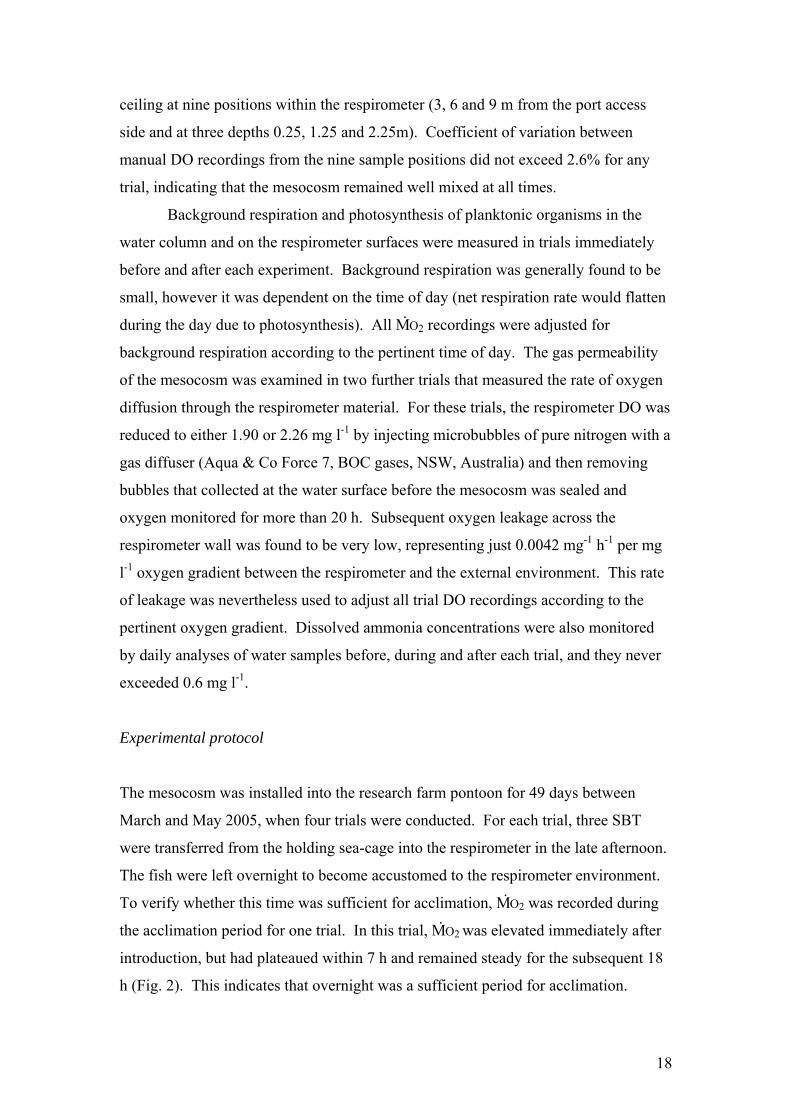
ceiling at nine positions within the respirometer (3, 6 and 9 m from the port access
side and at three depths 0.25, 1.25 and 2.25m). Coefficient of variation between
manual DO recordings from the nine sample positions did not exceed 2.6% for any
trial, indicating that the mesocosm remained well mixed at all times.
Background respiration and photosynthesis of planktonic organisms in the
water column and on the respirometer surfaces were measured in trials immediately
before and after each experiment. Background respiration was generally found to be
small, however it was dependent on the time of day (net respiration rate would flatten
during the day due to photosynthesis). All M. O2 recordings were adjusted for
background respiration according to the pertinent time of day. The gas permeability
of the mesocosm was examined in two further trials that measured the rate of oxygen
diffusion through the respirometer material. For these trials, the respirometer DO was
reduced to either 1.90 or 2.26 mg l-1 by injecting microbubbles of pure nitrogen with a
gas diffuser (Aqua & Co Force 7, BOC gases, NSW, Australia) and then removing
bubbles that collected at the water surface before the mesocosm was sealed and
oxygen monitored for more than 20 h. Subsequent oxygen leakage across the
respirometer wall was found to be very low, representing just 0.0042 mg-1 h-1 per mg
l-1 oxygen gradient between the respirometer and the external environment. This rate
of leakage was nevertheless used to adjust all trial DO recordings according to the
pertinent oxygen gradient. Dissolved ammonia concentrations were also monitored
by daily analyses of water samples before, during and after each trial, and they never
exceeded 0.6 mg l-1.
Experimental protocol
The mesocosm was installed into the research farm pontoon for 49 days between
March and May 2005, when four trials were conducted. For each trial, three SBT
were transferred from the holding sea-cage into the respirometer in the late afternoon.
The fish were left overnight to become accustomed to the respirometer environment.
To verify whether this time was sufficient for acclimation, M. O2 was recorded during
the acclimation period for one trial. In this trial, M. O2 was elevated immediately after
introduction, but had plateaued within 7 h and remained steady for the subsequent 18
h (Fig. 2). This indicates that overnight was a sufficient period for acclimation.

19
Fig. 2. Oxygen consumption
rates (M. O2) of three SBT after
introduction into the
mesocosm respirometer,
showing the plateau in M. O2
within 7 h from transfer and
subsequently calculated mean
routine metabolic rate (RMR,
dotted line, ±SE of
measurements (3 h periods)).
Measurement of the routine metabolic rate (RMR) was commenced the
morning following introduction of the SBT, when the respirometer was sealed and
M. O2 was monitored for 16-24 h. RMR was calculated as the mean, post-acclimation
M. O2 over this period (Fig. 2).
The following morning the mesocosm was re-opened and DO was returned to
approximately 100 % saturation by injecting pure oxygen with the diffuser. The SBT
were then left for roughly 1 h to recover from this disturbance before they were
offered sardines through the entrance port. Sardines were sourced frozen from local
commercial fish fleets from Port Lincoln, Australia and were caught from surrounding
waters. Nutritional content of sardines is shown in Table 1. All tuna consumed
sardines during all attempts at feeding within the respirometer. Attempts were made
to differentiate rations consumed by individual tuna from both the surface and by a
diver observing from within the mesocosm. However these attempts proved largely
unsuccessful as it was not always possible to differentiate individual tuna from the
surface and they would often fail to ingest in the presence of a diver. After feeding, a
diver collected any uneaten sardines, and this mass was subtracted from the known
mass of sardines offered to establish total consumption. Following feeding, the
respirometer was sealed and M. O2 monitored for the subsequent 40 h + (except for one
trial when logging failed after 26 h).

20
Table 1: Nutritional content of the sardines (Sardinops sagax) ingested
by SBT in SDA experiments.
Feed component Content
Protein 20.2%
Fat 1.7%
Ash 3.2%
Dry Matter 27.4%
Moisture 72.6%
Energy 5.6 mJ kg-1
Sardines were sourced from local commercial fish fleets from Port Lincoln, Australia
Proximal analysis conducted by Weston Food Laboratories (NSW, Australia).
Feed component presented as % wet weight.
Energy value calculated on the basis of 23.6 and 39.5 kJ g-1 of protein and lipid (Suarez et al., 1995).
Dissolved oxygen and water temperature measurement
Two luminescence dissolved oxygen meters (Hach HQ10, Loveland, CO, USA)
permanently installed at a depth of 1 and 2 m respectively, both 3 m from the wall,
logged mesocosm DO and water temperature. Meters were calibrated according to
the manufacturer’s instructions at the start of the trials and the calibration was
checked following the completion of all trials. Meters recorded DO (0.01 mg l-1
resolution) that was automatically compensated for water temperature and salinity set
at 350/00. Oxygen meters were set to log DO every 5 or 15 min, depending on the
trial-logging interval required (24 or 48 h, respectively). All DO recordings were
broken up into 3 h blocks according to time of day (starting at midnight) and linear
regressions were fitted to the change in DO (mg l-1) representative for that 3 h period.
The approximate drop in mesocosm DO was ∼ 0.04 mg l-1 h-1 during RMR
measurement and as great as 0.12 mg l-1 h-1 during SDA measurement. The high-
resolution stability of these luminescent meters meant that the linear regression
coefficient of determination generally remained between R2 = 0.96-0.99 over each 3 h
period. M. O2 calculations were adjusted for the mean background respiration rate
(mean of pre- and post-SDA trial background recording) recorded for the respective
time of day (3 h block) and oxygen leakage through the respirometer walls. A similar
DO meter was used to make daily recording of the DO in the external environment,
which remained between 7.1 and 7.4 mg l-1.

21
Swimming velocity analysis
SBT behaviour was monitored (both day and night) with a permanently installed
video system (SciElex Pty. Ltd., Hobart, Australia) that consisted of two 0.05 lux
black and white underwater video cameras and two 6 W white LED lights (housed
within resin) (Fig. 1). The system was programmable through a central controller and
power supply unit that were secured to the sea-cage. The cameras were programmed
to record for 4 min every 90 min (first by the horizontal camera, then immediately
following by the vertical camera) and data stored on a pocket video recorder (Archos
AV400, Greenwood Village, CO, USA). The lights were programmed to turn on at
dusk and remain on until dawn. The system was powered by a single 32 Ah, 12 V
battery that was exchanged daily.
Video recordings were viewed in the video editing program (VirtualDub
1.5.10, Avery Lee, www.virtual.dub.org). Suitable records were defined as those
containing a fish that was swimming perpendicularly to the camera and at least one
frame in which body length (BL) could be measured for scaling. This sequence was
imported into video motion analysis software (Video Point Version 2.5, Lenox
Softworks, www.lsw.com) where swimming velocity was analysed by tracking
movement across the field. SBT BL was used to calibrate the image scale, accounting
for variable distances between the fish and the camera. Any camera movement was
corrected for by referring to a stable point within the respirometer on a frame-by-
frame basis.
Data analysis
Swimming velocity data were collated within the same 3 h time periods as DO. For
each 3 h period, between four and seven video footage segments were analysed for
swimming velocity and the mean taken as representative for that period (a total of
four hundred and forty eight footage segments were analysed). Due to poor quality
footage, four suitable footage segments were not available for some 3 h periods.
Video records after 24 h in trial 6 were lost due to video-recorder failure.
Mean swimming velocity recordings made during the RMR measurement are
subsequently referred to as the routine swimming velocity (Ur) and velocity
measurements made post-feeding as the SDA swimming velocity (Usda). Usda refers to

22
the duration that post-feeding swimming velocity remained one standard error (SE)
above U. The effect of meal size on metabolic rate was quantified by the following
parameters: SDA peak (maximum post-prandial M. O2), SDA factorial scope (SDA
peak divided by RMR), SDA duration (duration that post prandial M. O2 remained
greater than one SE above the RMR), SDA magnitude (total oxygen consumed above
the RMR within the SDA duration period) and SDA coefficient (SDA magnitude as a
percentage of gross ingested energy). Conversion from oxygen consumed to the
energy equivalent was calculated assuming 14.32 J of energy are expended per
milligram oxygen consumed (Beamish and Trippel, 1990).
Results
Table 2: SBT body mass (Mb), body length (BL), water temperature (Tw), routine
swimming velocity (Ur), calculated routine metabolic rate (RMR), ingested ration of
sardines, total ingested energy (IE), mean swimming velocity during the SDA period
(Usda), duration of elevate postprandial swimming velocity (Usda duration) and SDA
peak, factorial scope, duration, magnitude and coefficient. Trial 1 2 3 4 Mean
(n = 4 or 6)
Mb (kg) 9.4 ± 1.6 9.9 ± 0.9 10.5 ± 1.3 11.3 ± 1.4 10.3 ± 0.4
BL (cm) 81 ± 5 83 ± 2 88 ± 3 86 ± 2 84 ± 2
Tw(oC) 19.7-20.1 20.1-20.3 19.1-19.7 18.2-18.5 19.3 ± 0.4
Ur (BL s-1) 0.71 1.40 0.78 0.83 0.92 ± 0.15
RMR (mg kg-1 h-1) 300 456 355 354 366 ± 33
Feed trials 1 1 2 1 2 1 -
Ration (%Mb) 5.7 6.0 8.5 2.1 6.8 4.1 5.5 ± 0.9
IE (mJ) 8.96 10.0 14.1 3.70 12.1 7.73 9.48 ± 1.48
Usda (BL s-1) 0.9 2.0 2.6 0.8 1.7 1.4 1.6 ± 0.9
Usda Duration (h) 26 38 45+ 20 45+ 24+ 33 ± 5
Peak (mg kg-1 h-1) 728 1, 240 1, 290 469 840 669 872 ± 133
Factorial scope 2.4 2.7 2.8 1.3 2.3 1.9 2.2 ± 0.2
Duration (h) 24 23 42 27 45+ 25 31 ± 4
Magnitude (kJkg-1) 99 130 192 31 148 75 112 ± 23.
Coefficient (%) 31.3 38.5 40.2 26.4 38.8 32.9 34.7 ± 2.2
Values are mean for the three fish used in each trial. ± SE.
During the RMR measurement, three of the four groups of SBT swam slowly and
consistently between approximately 0.7 and 0.8 BL s-1, the other group swam

23
considerably faster at around 1.4 BL s-1 (Ur, Table 2). The fish that swam the fastest
also consumed the most oxygen with a strong linear relationship (R2 = 0.94) between
swimming velocity and RMR (Fig. 3A). The evaluated RMR, taking into account
background respiration and diffusion, ranged between 300 and 456 mg kg-1 h-1
corresponding to a mean of 366 ± 33 mg kg-1 h-1 (n = 4). This is less than the RMR
of SBT previously recorded (460 mg kg-1 h-1, Fitzgibbon et. al., 2006). The
discrepancy is likely due to individual variability in voluntary swimming speeds and
the longer acclimation period used in the present study (16+ h versus 6 h).
Fig. 3. (A) The relationship
between the routine swimming
velocity (Ur, body lengths s-1) and
the routine metabolic rate (RMR)
of SBT with fitted linear regression
(y = 219x – 166, R2 = 0.94).
Values shown are means ± SE (n =
5-9, 3 h periods). (B): the
relationship between ration
consumed (% Body weight) and
the factorial increase swimming
velocity recorded during the SDA
period (%Ur) with fitted linear
regression (y = 14.1x + 82.5, R2 =
0.53). Values are means ± SE (n =
5-15, 3 h periods).

24
Six feeding events of rations between 2.1 and 8.5 % body mass (%Mb) of
Australian sardines were recorded (two of the experimental groups were fed twice, the
other two experimental groups fed only once) (Table 2). On all occasions, swimming
velocity increased post-feeding. The duration before swimming velocity returned to
pre-feeding levels (Ur) appeared to increase with ration size, from 20 h for the
smallest ration to longer than the 45 h measurement period for the greatest two rations.
The mean swimming velocity recorded during the SDA period (Usda) was linearly
related to ration size (R2 = 0.53) (Fig. 3B).
Fig. 4. Post feeding oxygen consumption rate for SBT for the six feeding events
recorded of ration size between 2.1 and 8.5% Body weight (%Mb) in the four
mesocosm respirometer experiments (A), (B), (C), and (D). Dotted line represents the
calculated routine metabolic rate (RMR).

25
In all trials, M. O2 was elevated above the RMR post-feeding, however the
nature of this elevation was highly dependent on ration size and experiment (Fig. 4).
Maximum postprandial M. O2 (SDA peak) increased linearly with ration size (R2 =
0.71) (Fig. 5A). At the greatest ration consumed (8.5 %Mb), SDA peak was 1 290 mg
kg-1 h-1, corresponding to 2.8 times the RMR, whilst with the smallest ration
(2.2 %Mb), SDA peak was 469 mg kg-1 h-1, or just 1.3 times the RMR (Table 2). The
duration of SDA ranged between 23 and 45 h and was poorly correlated with ration
size (R2 = 0.38) (Fig. 5B). At the four lowest rations, SDA duration did not appear to
be affected by ration size, however above a ration of 6 %Mb, SDA duration was
greatly elevated. The magnitude of SDA ranged between 31 and 191 kJ kg-1 (Table 2)
and was strongly linearly correlated with ration size (R2 = 0.98) (Fig. 5C). SDA
coefficient averaged 34.7 ± 2.2% (n = 6) (Table 2).
Fig. 5. Relationship between sardine ration
ingested by SBT (% body weight) and, (A)
specific dynamic action (SDA) peak with
fitted regression (y = 124x + 190, R2 = 0.71),
(B) SDA duration (y = 2.7x + 15.8, R2 =
0.38) and (C) SDA magnitude (y = 25.2x +
26.7, R2 = 0.98), for the six feeding events
recorded in the mesocosm respirometer.

26
Discussion
Effect of meal size on SDA
The pattern of SDA in fish is characterized by a rapid increase in M. O2 after feeding
before gradually falling back to the resting level (Jobling, 1981). The pattern of SDA
response appears to be no different for SBT. The factorial scope and duration of SDA
is comparable to many fish species examined (Jobling, 1981; Chakraborty et al., 1992;
Lyndon et al., 1992; Hunt von Herbing and White, 2002; Peck et al., 2002; Fu et al.,
2005b; Fu et al., 2005a). Also like most fish species, the peak, duration and
magnitude of SDA appear to be directly related to ration size (Muir and Niimi, 1972;
Jobling and Davis, 1980; Carter and Brafield, 1992; Chakraborty et al., 1992; Fu et al.,
2005c; Fu et al., 2006). However, the energetic cost of SDA is approximately double
(SDA coefficient = 35 %) those recorded in other teleost species (generally between
5-20%). It appears that although the factorial pattern of SDA (SDA peak and
duration) in SBT is consistent with other fish, the absolute metabolic cost of SDA is
much higher.
High metabolic cost of SDA
A complete understanding of the physiological basis of SDA remains unclear,
however much of its effect is attributed to the metabolic cost of growth. That is, the
postprandial influx of amino acids stimulates rapid synthesis and turnover of tissue
proteins resulting in much of the increase in metabolic rate known as SDA (Jobling,
1981; Brown and Cameron, 1991b; Brown and Cameron, 1991a; Lyndon et al., 1992).
In fish, both protein synthesis and degradation rates have been shown to rise linearly
with growth rate (Houlihan et al., 1988), and therefore are likely to contribute more to
the metabolic cost of SDA in fast growing species. The growth rates of tuna, like
other large pelagic fishes, are known to be high (Uchiyama and Struhsaker, 1980;
Brill, 1996; Sainsbury et al., 1997; Glencross et al., 2002). Furthermore, the SBT
used in the present study, although large in comparison to other specimens examined,
were in fact juveniles (Collette and Nauen, 1983; Schaefer, 2001). Juvenile fish have
been shown to divert a proportionately high amount of available metabolic scope to

27
support SDA, to meet the demands of their fast growth rates (Hunt von Herbing and
White, 2002). The likely discrepancy between SDA duration and food gut passage
time in SBT gives evidence to support that SDA is mostly a post-absorptive effect.
The recorded duration of SDA (between 25 and 45 h) is far greater than the likely gut
evacuation time, which in tuna has been shown to be very short (∼10-12 h)
(Magnuson, 1969; Schaefer, 1984; Olson and Boggs, 1986). This suggests that high
protein turnover and synthesis rates associated with fast growth rates of juvenile SBT
are likely to elevate the metabolic cost of SDA. Unfortunately, there is no
information on the cost of SDA in other fast growing pelagic fishes for comparison.
It is possible that the low energy value of the sardines ingested may have
contributed to the high SDA coefficient recorded. The nutritional balance of the diet
can affect SDA, in particular the protein level and its balance with non-protein energy
sources. Deamination of ingested amino acids is considered to be a significant
proportion of SDA in carnivorous fish (Beamish and Trippel, 1990; Cho and Kaushik,
1990). Diets with excess amounts of protein or insufficient non-protein energy
sources (i.e. fat or digestible carbohydrates) can elevate the energy expenditure of
SDA as a result of increased deamination of amino acids (Jobling and Davis, 1980;
LeGrow and Beamish, 1986; Beamish and Trippel, 1990; Chakraborty et al., 1992;
Peres and Oliva-Teles, 2001). When represented in terms of the digestible protein (P,
g) and digestible energy (E, mJ), the P:E ratio of the sardines fed in the present study
(34 g mJ-1, assuming 90% and 85% digestible energy and protein, respectively) is
considerably greater than that of diets thought to be optimal in aquaculture of
salmonid species (P:E = 20 g mJ-1) (Cho and Kaushik, 1990). It is likely that this
excessive protein to energy ratio would have resulted in high levels of amino acid
deamination contributing the high SDA coefficient recorded in the present study.
However, this nutritional profile is typical for sardines caught in Southern Australian
waters (Ellis and Rough, 2005) and as the sardine is an important wild-fish food
source (Kemps et al., 1999, Ward et al., 2006), this high SDA is biologically relevant.
Elevated energy expenditure associated with postprandial visceral warming
may also contribute to SDA. Tuna of the subgenus Thunnus can elevate their visceral
temperature (Collette et al., 2001) which is characterised by a rapid increase following
feeding, before slowly cooling to a basal temperature of 2oC above ambient water
temperature up to 60 h post feeding (Gunn et al., 2001). The primary purpose of

28
visceral warming is thought to be to accelerate digestion (Stevens and McLeese,
1984). The source of heat is hypothesized to be a result of aerobic metabolism
associated with SDA which is retained by counter-current exchange in retia mirabilia
that thermally isolate the stomach, caecum, intestines and spleen (Carey et al., 1984).
The liver however, is on the cold side of the rete and thus does not contribute to
visceral warming. This is surprising, as the liver is considered to have the highest
rates of protein synthesis of teleost tissues (Carter and Houlihan, 2001) and thus
would be an obvious source of SDA-associated heat production. Protein synthesis
rates in the livers of juvenile Atlantic cod have been shown to increase rapidly after
feeding and after 6 h account for 31% of whole body protein synthesis compared to
just 9% for the stomach (Lyndon et al., 1992). This suggests that only a small fraction
of SDA contributes to visceral warming (related to gastrointestinal work and
absorption) leaving potential for the involvement of another mechanism. Support for
this was given by Gunn et al. (2001), who found that, for a given ration, the
magnitude of SBT visceral warming was much greater in winter than in summer.
They suggested that SBT possess a compensatory acclimation mechanism to provide
increased digestive efficiency at low ambient temperatures, possibly facilitated by
increased aerobic metabolism and/or the heat conservation (through changes in the
activity of the visceral retia). Thus, it appears that visceral warming may not simply
be the accumulation of heat by-product of SDA, but may be an energy-consuming
mechanism to maintain optimal digestive rates.
The observed increase in swimming velocity after feeding would have
contributed to the measured metabolic cost of SDA. SBT on average swam 1.7 times
faster after feeding (1.6 compared to 0.92 BL s-1). Based on the relationship between
M. O2 and swimming velocity described by Dewar and Graham (1994) for 2.2 kg
yellowfin tuna (Thunnus albacares), an increase in swimming velocity from 0.92 to
1.6 BL s-1 would increase metabolic rate from 409 to 585 mg kg-1 h-1. A potential
explanation for faster swimming is to increase ventilation volume as a response to the
enhanced metabolic demand associated with SDA. This theory is supported by the
fact that the SBT that consumed the most also swam the fastest (Fig. 3B) and for most
of the feeds examined, the duration of elevated swimming velocity post feeding (Usda
duration) is similar to the duration of SDA. However, the pattern of post-feeding
swimming velocity was more difficult to distinguish than that of SDA, as for the two
greatest rations it failed to return to pre-feeding levels within the 45 h time frame of

29
the experiment. The reason for the discrepancy between swimming velocity and SDA
is unknown; however, it may be due to measurement error caused by individual
variation in swimming speed due to unequal ration consumption, or diurnal swimming
cycles (fish appeared to swim faster at dusk and dawn). More intensive examination
of the effects of feeding on individual tuna swimming velocity over longer
experimental periods is required to verify the metabolic cost of faster postprandial
swimming.
SDA and metabolic scope
Consistent with some fish species, SBT peak postprandial M. O2 increased with ration
size (Muir and Niimi, 1972; Chakraborty et al., 1992); however for other species,
SDA peak reaches a maximum and plateaus with increased ingestion (Beamish, 1974;
Fu et al., 2005c). In the latter, SDA peak has a species-specific maximum that limits
the proportion of available metabolic scope devoted to SDA and allows other
metabolic activities to occur simultaneously (Beamish, 1974). It is possible that SBT
reach this plateau at a ration size greater than that examined in the present study
(8.5 %Mb). However, this is unlikely as anecdotal evidence from SBT farm managers
indicates that 8.5 %Mb is close to the maximum feed intake that SBT accept in a
single meal. According to cardiorespiratory models, the factorial scope of skipjack
(Katsuwonus pelamis) and yellowfin tuna is approximately 8-9 times the SMR (Brill
and Bushnell, 1991; Korsmeyer and Dewar, 2001). If a similar factorial scope of 7
times the RMR is assumed for SBT (less than that predicted above as the comparison
is based on a low RMR, not the SMR), it corresponds to 2 560 mg kg-1 h-1, which is
similar to the maximum-recorded M. O2 of a tuna species, 2 500 mg kg-1 h-1 (Gooding
et al., 1981). The maximum recorded postprandial metabolic rate (1 300 mg kg-1 h-1)
measured in the present study is approximately 50% of this predicted metabolic scope,
suggesting that even during the peak of SDA at the greatest ration recorded, the SBT
examined would still have had considerable metabolic scope available to perform
other tasks (such as oxygen debt recovery and locomotory costs beyond the
requirement for hydrostatic equilibrium and ventilation). This supports the theory that
the main benefit of high aerobic scope in tunas is to simultaneously support multiple
metabolic functions needed to sustain their high performance requirements (Brill and
Bushnell, 1991; Korsmeyer et al., 1996).

30
Energetic consequence of a high metabolic cost of SDA
To estimate minimum daily energetic cost of feeding SBT, the total energy
expenditure as a percentage of ingested energy for the six feeding trials (calculated as
the total oxygen consumption the 24 h post feeding) has been plotted (Fig. 6). The
break-even point (feed ration at which energy expenditure was equal to ingested
energy) is approximately a ration of 3.5 %Mb day-1. However, the minimum daily
ration of sardines needs to be greater than this, as some ingested energy is indigestible
and further energy is lost in the form of urine, gill excretion and surface losses.
Furthermore, the calculated energetic cost is likely to be a minimum, as activity was
restricted. With wild fish, the cost of activity is likely to be much greater due to the
activity requirement of predation and competition.
Fig. 6. Relationship between sardine
ration ingested by SBT (% body
mass, %Mb) and total SBT energy
consumption (calculated as the total
oxygen consumption the 24 h post
feeding) in the 24 h after feeding as a
percentage of ingested energy for the
six feeding events recorded in the
mesocosm respirometer. The dotted
line represents the theoretical point at
which the amount of energy used by
the fish’s metabolic processes equals
the amount of ingested energy.
Several bioenergetic models for tuna species have been described (Kitchell et
al., 1978; Korsmeyer et al., 1996). These show that tuna are “energy speculators”,
gambling high rates of energy expenditure for potentially higher rates of energy
returns. The work presented here agrees with this conclusion; however it shows that
one aspect of tuna energetics, the metabolic costs of SDA, may have been
considerably underestimated. Previous models have estimated the cost of SDA to be

31
only 15 % of the ingested energy (Kitchell et al., 1978; Korsmeyer et al., 1996). For
SBT in research pontoons, consuming sardines, the predominant natural food source
in Australia’s southern oceans, 35 % of the ingested energy is lost in the SDA process.
This finding further exemplifies the risk that tuna take in balancing performance with
efficiency.

32
Chapter 2: The effect of baitfish lipid content on the energetic cost of specific dynamic action in southern bluefin tuna (Thunnus maccoyii)
Abstract
This study examines the effects of feeding sardines (Sardinops sagax) of varying lipid
levels (but similar protein content) on the rate of oxygen consumption (M. O2), and
swimming velocity of southern bluefin tuna (SBT) (Thunnus maccoyii). Five groups
of two or three SBT (mean mass = 19.8 ± 0.5 SE kg, n = 14) were fed a total of
thirteen times. Eight times they were fed a low-lipid sardine from southern Australia
(1.8-4.0 % lipid, 5.2-6.6 MJ kg-1 gross energy (GE)) and five times a high-lipid
sardine from western America (12.9 %, 9.2 MJ kg-1 GE). Before feeding, SBT swam
at 0.75 ± 0.03 body lengths per second (BL s-1) (n = 5) and their routine metabolic rate
was 306 ±15 mg kg-1 h-1. M. O2 was elevated after feeding presumably as a result of
specific dynamic action (SDA). However the effect was greatest for the fish that
ingested the high-lipid sardine. The magnitude of SDA for fish that ingested the high-
lipid sardines (3.20 ± 0.23 MJ per kg sardine ingested, n = 5) was significantly greater
than that for fish that ingested the low-lipid sardines (1.93 ±0.10 MJ kg-1, n = 8). SBT
also swam faster during the SDA period with the increase in velocity being greatest
for the fish that ingested the high-lipid sardine (1.33 ± 0.04 BL s-1). When the
energetic cost of SDA is represented as a proportion of ingested energy, there was no
difference between fish that ingested the high- (34.3 ± 2.4%) and low-lipid sardine
(31.5 ± 2.9%). This demonstrates that the enhanced SDA magnitude for high-lipid
sardines was proportional to the increased ingested energy. This shows that, for
baitfish diets with lipid contents over a range that is likely to span that of wild tuna
prey, the energetic cost of SDA in SBT is approximately double that recorded in other
teleosts. These results support those previously found and confirm that the high
energetic cost of SDA is ecologically relevant. The majority of the high cost of SDA
is hypothesized to be attributed to high-protein synthesis rates, therefore
representative of the energetic costs of their fast growth rates.

33
Introduction
Specific dynamic action (SDA) is the increase in metabolic rate that occurs during a
period after feeding (Jobling, 1981; McCue, 2006). The first measurements of SDA
in a tuna species, southern bluefin tuna (SBT) (Thunnus maccoyii, Castelnau, 1872)
were reported on in chapter 1. These measurements show that the duration and
factorial peak of SDA is typical for teleost fishes, but the absolute energy increment is
much greater. For SBT ingesting sardines (Sardinops sagax), approximately 35% of
gross ingested energy is used in the processes of SDA (SDA coefficient), which is
approximately double the 5-20% commonly recorded in other teleosts (Fitzgibbon et
al., 2007). However, in that study the lipid content of the sardine ingested was low
(∼2% wet weight), corresponding to a low energy diet that was dominated by protein
(20%). In carnivorous fish, diets with greater protein have been shown to elevate the
energy expenditure of SDA presumably as a result of increased deamination of amino
acids (Jobling and Davis, 1980; LeGrow and Beamish, 1986; Beamish and Trippel,
1990; Chakraborty et al., 1992). Furthermore, if there are insufficient non-protein
energy sources (i.e. lipids), dietary protein is deaminated and oxidized to meet the
energy requirement (LeGrow and Beamish, 1986; Beamish and Trippel, 1990). In
this case, a decrease in the protein-to-energy ratio, by increasing the lipid content, is
said to “spare” protein from deamination and oxidation for energy, in turn reducing
the magnitude of SDA (LeGrow and Beamish, 1986; Peres and Oliva-Teles, 2001).
Therefore, there was a possibility that the high SDA coefficient recorded in chapter 1
was at least partially related to the nutritional content of the sardines ingested and
might not be representative of tuna ingesting higher-lipid diets.
There is a strong likelihood that wild SBT would commonly consume higher-
lipid diets. The mean lipid content of sardines caught in the SBT feeding ground of
the Great Australian Bight is ∼4% (Ellis and Rough, 2005). Furthermore, there is
evidence to suggest that SBT plan their annual movement to the Great Australian
Bight to coincide with a period of high productivity (Austral summer-autumn) to feed
on sardines when their lipid content is highest (up to 6.8%) (Ward et al., 2006).
Elsewhere they have been shown to feed mainly on small pelagic fishes such as jack
mackerel (Trachurus declivis) and red bait (Emmelichthys nitidus nitidus) (Young et
al., 1997; Kemps et al., 1998). The lipid content of these two baitfish species is

34
considerably higher than that of sardines: jack mackerel mean ∼6% (Vlieg, 1988) and
red bait mean ∼9% (Ellis and Rough, 2005).
The aim of this study is to determine whether increasing the lipid content of
baitfish diets significantly reduces the SDA coefficient in SBT and to establish if the
previously recorded high SDA coefficients were specific to the diet and thus not
ecologically relevant. This study has significant bioenergetic implications for tuna, as
it will ascertain to what degree the high energetic cost of SDA is associated with their
unique high performance physiology and thus may be common for all tuna.
Methods
Experimental animals
In January 2006, fourteen SBT were sourced from a marine aquaculture farm in the
waters off Port Lincoln, South Australia, through the Tuna Boat Owners Association
of South Australia. These SBT had been purse-seine netted in the Great Australian
Bight one month earlier. From the commercial farm, forty individual SBT were
hooked with a baited, barb-less hook and transferred into a 12 m diameter, 8 m deep
holding pontoon that was towed and moored in a protected bay (Rotten Bay) at the
southern end of Boston Island, where all trials were conducted. SBT were left to
recover from transfer for 1 month during which time they were fed both high- and
low-lipid sardines twice per day to satiation. Archival temperature loggers (TX,
Vemco, www.vemco.com) were then surgically implanted into the body cavity to
record visceral temperature by procedures described in chapter 4. Following logger
implantation the SBT were left to recover for at least one month. Again during this
period they were fed sardines twice per day but were starved for between 48-72 h
before introduction to the respirometer to allow the effects of SDA to subside
(Fitzgibbon et al., 2007). SBT were transferred into the respirometer by crowding
them within a purse-seine net and a skin diver securing the fish by hand and passing it
across a soft, wet slipway into the adjacent respirometer.

35
Mesocosm respirometer
SBT oxygen consumption rate (M. O2) was determined by the drop in dissolved oxygen
(DO) over time within a large static respirometer (mesocosm respirometer), as
described in chapter 1. The respirometer was filled with calibrated pumps to a total
water volume of between 400 000-402 000 l (variation between experiments due to
water exchanges).
Experimental protocol
Five experimental trials were conducted between March and May 2006. As SBT
were obviously distressed when confined within the respirometer alone, either two or
three fish were used for each trial. SBT were introduced in the late afternoon, the
respirometer was sealed, and DO measured for the subsequent 36 h. SBT M. O2 was
commonly elevated after introduction, presumably as a result of transfer stress, but
would plateau within 6-20 h of transfer. Routine metabolic rate (RMR) was
determined as the mean M. O2 after this period.
The following morning, the mesocosm access port was opened and DO
returned to ∼100-110 % saturation by oxygen injection with an oxygen diffuser (Force
7, Aqua & Co, BOC Gases, NSW, Australia). After 1 h to allow for recovery from
this disturbance, SBT were fed weighed sardines to satiation through the access port
and any uneaten sardines were removed by a diver to obtain the net consumption.
Two different sardines were fed in separate trials, a low-lipid (1.8-4.0%) sardine that
was sourced frozen from commercial fishing fleets in Port Lincoln, Australia, and a
high-lipid (12.9% lipid) sardine that was sourced frozen from commercial fishing
fleets in northern California, USA (Table 1). Any collected bubbles were then
removed from the respirometer before it was sealed and DO monitored until the
morning approximately 48 h later. The experiment was then either terminated, SBT
removed and body length (BL) and mass (Mb) recorded, or the DO was returned to
∼100% saturation and SBT fed again with the same procedure.

36
Table 1. Nutritional content of sardines (Sardinops sagax) ingested by SBT.
Feed Component Low-Lipid High-Lipid
Lipid 1.8-4.0 12.9
Protein 17.2-20.5 17.1
Ash 3.3-3.5 3.3
Water 76.0-70.9 64.4
Gross Energy (MJ kg-1) 5.2-6.6 9.2
Analysis conducted by the South Australian Research and Development Institute, Pig & Poultry Production Institute, (Adelaide,
Australia).
Feed components presented as % wet weight. Gross energy derived by bomb calorimetry.
Low-lipid sardines were sourced from local commercial fish fleets from Port Lincoln, Australia. High-lipid sardines were
imported from commercial fishing fleets in northern California, USA.
Variation in low lipid sardine nutritional content was due to use of different sardine batches. Only one batch of high lipid
sardines was used.
Further to SBT M. O2 experiments, background changes in dissolved oxygen
due to respiration and photosynthesis were measured in association with time of day
immediately before and after each experiment. The oxygen holding capacity of the
mesocosm membrane was found to be excellent as there was no discernable
difference in the background changes in DO when the mesocosm was sealed at
∼100% saturation or at ∼30% saturation.
Dissolved oxygen, water temperature, and swimming velocity measurement.
Dissolved oxygen (DO), water temperature and swimming velocity (U) were
measured as described in full in chapter 1. Essentially, two permanently installed
dissolved oxygen meters (model HQ10, Hach, Loveland, CO, USA) logged
temperature and salinity (set at 350/00) adjusted DO (0.01 mg l-1 resolution) every 15
min. SBT swimming behaviour was recorded by two, permanently installed video
cameras (SciElex Pty. Ltd., Hobart, TAS, Australia) that were programmed to record
for 4 min every 90 min, and data was stored on a video recorder (AV400, Archos,
Greenwood Village, CO, USA). Two 6 W white LED lights gave sufficient
illumination for filming at night. Suitable footage segments were selected in a video-
editing program (VirtualDub 1.5.10, Avery Lee, www.virtual.dub.org), and U
analysed by tracking SBT movement with video motion analysis software (Video
Point Version 2.5, Lenox Softworks, www.lsw.com). SBT BL was used to calibrate

37
image scale and any camera movement was corrected for by referring to a stable point
within the respirometer on a frame-by-frame basis.
Data analysis
Dissolved oxygen recordings were broken up into 3 h blocks according to time of day
(starting at midnight) and linear regression fitted to the change in DO to establish SBT
M. O2 (mg kg-1 h-1). All M
. O2 calculations were adjusted for background
respiration/photosynthesis effects (mean of pre- and post-trial background recordings)
representative for the time of day. Swimming velocity data were also collated within
the same 3 h time periods, where between four and seven footage segments were
analysed and the mean taken as representative of swimming velocity for that period.
A total of 692 segments were analysed for swimming velocity with a minimum of 35
for any individual trial. Due to video recorder failure, swimming velocity
measurement is not available for one feeding event (Trial 1; feed 2).
The effect of meal size on M. O2 was quantified by the following parameters:
SDA peak (maximum postprandial); SDA duration (duration that postprandial M. O2
remained greater than one standard error (SE) above the RMR); SDA magnitude (total
energy consumed above the RMR within the SDA duration period); ingestion-specific
magnitude (magnitude per kg ration ingested) and SDA coefficient (magnitude as a
percentage of gross ingested energy). Conversion from oxygen consumed to the
energy equivalent was calculated assuming 14.32 J of energy were expended per
milligram oxygen consumed (Beamish and Trippel, 1990). Significant differences of
means were established by the use of two-tailed Students T-tests, and regression
slopes and intercepts by ANOVA within the StatistiXL program (version 1.5,
www.statistixl.com).
Results
SBT RMR (306 ± 15 mg kg-1 h-1) and U (0.75 ± 0.03 BL s-1) (Table 2) were not
significantly different from those in chapter 1 (366 mg kg-1 h-1 and 0.93 BL s-1, P =
0.11 and P = 0.33, respectively) despite SBT in the present study being significantly
larger in body mass (19.8 kg vs 10.3 kg, P <0.00).

38
Table 2. Experimental parameters for the groups of two or three SBT examined in
each of the five trials before feeding.
Trial 1 2 3 4 5 Mean ± SE
Mb (kg) 17.9 ± 2.0 (3)
20.2 ± 0.1 (3)
19.8 ± 0.3 (3)
20.9 ± 1.8 (2)
20.4 ± 1.3 (3)
19.8 ± 0.5
BL (cm) 102 ± 1 106 ± 1 104 ± 1 108 ± 4 106 ± 2 105 ± 1
Tw (oC) 20.1-19.6 18.7-18.2 17.1-16.6 16.9-16.4 16.1-15.7 17.5 ± 0.7
U (BL s-1) 0.83 0.68 0.79 0.71 0.74 0.75 ± 0.03
RMR (mg kg-1 h-1) 272 292 286 357 320 306 ± 15
Mb, body mass; BL, body length; Tw, experimental water temperature; U, routine swimming velocity; RMR, routine metabolic
rate Values are means ±SE, () = number of fish
Thirteen feeding trials were recorded, eight with low-lipid, and five with high-
lipid sardines (Table 3). Rations of high-lipid sardines (1.72 ± 0.19 kg) were
significantly greater (P <0.01) than that of low-lipid sardines (1.08 ± 0.08 kg). As
SBT were fed to satiation, this suggests a dietary preference for the high-lipid sardines.
The reason for this is not known; however, the high-lipid sardines were larger (∼80 g
fish-1) and appeared in better condition (i.e. less freezing and storage damage) than the
low-lipid sardines (∼40 g fish-1), which may have contributed to this preference. U of
all SBT increased post-feeding, however the increase was significantly greater (P
<0.01) for SBT that ingested the high-lipid (1.33 ± 0.04 BL s-1) than for the low-lipid
baitfish (0.94 ± 0.06 BL s-1).

39
Table 3. Specific dynamic action parameters. Trial\
feed
Lipid
level
Ration
(kg)
U
(BL s-1)
IE
(MJ)
Peak
(mg kg h-1)
Dur
(h)
Mag
(MJ)
IS Mag
(MJ kg-1)
SDA Coef
(%)
1\1 Low 1.59 1.21 10.49 668 26 3.24 2.04 30.9
1\2 Low 1.04 - 5.40 595 12 2.26 2.17 41.8
2\1 Low 0.98 0.75 6.47 430 18 1.85 1.89 28.6
2\2 Low 1.00 0.93 5.20 596 13 2.23 2.22 42.9
3\1 Low 0.84 0.82 5.54 413 16 1.32 1.57 23.7
3\2 Low 0.98 0.99 6.47 476 20 2.01 2.05 31.0
4\1 Low 1.16 0.89 7.65 549 23 2.07 1.79 27.1
5\1 Low 1.08 0.97 7.13 535 22 1.82 1.69 25.6
Mean
± SE
1.08
± 0.08
0.94
± 0.06
6.80
± 0.08
531
± 36
18
± 2
2.10
± 0.19
1.93
± 0.10
31.5
± 2.9
3\3 High 1.28 1.32 11.77 647 26 3.20 2.40 27.1
3\4 High 1.60 1.29 14.72 735 29 5.23 3.27 35.5
4\2 High 1.68 1.20 15.45 727 44 4.50 2.68 29.1
4\3 High 1.60 1.42 14.72 869 31 5.58 3.48 37.9
5\2 High 2.42 1.42 22.26 1015 36 9.26 3.83 41.6
Mean
± SE
1.72
± 0.19**
1.33
± 0.04**
15.79
± 1.74**
798
± 59**
33
± 7**
5.56
± 1.01*
3.20
± 0.23*
34.3
± 2.4
Ration, total mass of sardines ingested; U, swimming velocity during the specific dynamic period; IE, ingested energy; Peak,
maximum postprandial oxygen consumption rate; Dur, duration of specific dynamic action; Mag, magnitude energy consumed
above the routine metabolic rate within the SDA duration period; IS Mag, magnitude of SDA per kg ration consumed; and SDA
Coef energy consumption by SDA as a proportion of ingested energy.
*mean significantly different to low-lipid mean (P<0.05), **(P<0.01).
M. O2 increased post-feeding in all trials presumably as a result of SDA (Fig. 1).
Similar to that recorded in chapter 1, magnitude of SDA was directly related to ration
size (R2 = 0.94 and 0.83, for the high- and low-lipid sardines, respectively) (Table 4).
Comparisons by ANOVA found no significant difference between regressions
recorded with low-lipid sardines in the present study and those recorded in chapter 1
(P = 0.46 and 0.26 for regression slope and intercept, respectively) (Fig. 2).

40
Fig. 1. Example of increase in oxygen consumption rate for SBT after ingesting
similar sized rations of low-lipid (1.2 kg, trial\feed = 4\1, filled circles) and of high-
lipid sardines in the same trial (1.6 kg, trial\feed = 4\3, open circles). Flat, dashed line
represents the pre-feeding routine metabolic rate (±SE).
Table 4. Parameters of least squares regression (y = bx - a) relating specific dynamic
action magnitude (MJ) and ration size (kg) in SBT ingesting high- and low-lipid
sardines.
Lipid level Ration
range (kg)
n a b R2 ANOVA P
(slope)
Low 0.84-1.59 8 0.32 2.23 0.83
High 1.28-2.42 5 3.37 5.20 0.94
<0.01
n = number of measurements.
ANOVA P (slope), ANOVA probability that slopes of regressions are not significantly different.
Comparisons between the high- and low-lipid sardines demonstrate that SDA
was greater for the SBT that ingested the high-lipid sardines. Indeed, SDA peak,
SDA duration, SDA magnitude, ingestion-specific magnitude and regression slope
were all significantly greater for SBT that ingested the high-lipid than those the low-
lipid sardines (Tables 3 and 4, Fig. 2). The greater intake-specific magnitude and

41
regression slope confirms that the larger magnitude was not due to the larger rations
ingested. However, when the energetic cost of SDA was represented as a proportion
of ingested energy, there was no significant (P = 0.95) difference between the high-
(34.3 ±2.4%) and low-lipid sardines (31.5 ± 2.9%) (Table 3).
Fig. 2. Magnitude of Specific Dynamic Action (SDA) for SBT ingesting low-lipid
(closed circle) and high-lipid (open circles) sardines in comparison to results recorded
in chapter 1 for SBT also consuming low-lipid sardines (crosses). Solid lines are
linear regressions for high-lipid sardines (y = 5.2x - 3.7, R2 = 0.94, n = 5) and for low-
lipid sardines (y = 2.4x - 0.6, R2 = 0.96, n = 14).

42
Discussion
Ingestion of the high-lipid sardine induced a greater SDA response than that of the
low-lipid sardine (Fig. 2). The increase in response was proportionate to the increase
in energy ingested, as evidenced by the similar SDA coefficients (∼35%, Table 3). As
protein content was similar between the sardines (17.1-20.5%), it can be assumed that
this effect was a result of the increased lipid level and subsequent enhanced energy
content.
A similar result was recorded with rainbow trout (Oncorhynchus mykiss) in
which increasing lipid content of low-lipid compound diets increased SDA magnitude
but had little effect on the SDA coefficient (LeGrow and Beamish, 1986). However,
with this species increasing lipid content of a low protein diet resulted in significant
reduction in SDA magnitude and coefficient. In this case it was assumed that
increasing lipid level served to spare protein utilization for energy catabolism
resulting in a reduction in magnitude of SDA (LeGrow and Beamish, 1986; Beamish
and Trippel, 1990). This protein sparing effect was largely absent when lipid levels
were increased with higher-protein, higher-energy diets. This led LeGrow and
Beamish (1986) to propose a dietary energy intake “threshold”, below which energy is
limiting and high levels of deamination and oxidation of dietary protein for energy
results in the elevation of SDA.
The apparent lack of protein sparing effect observed in the present study
suggests that the span of dietary energy content examined did not cross this energy
threshold for SBT. At present, it is not known if this energy threshold is below the
energy level of the low-lipid or above the energy level of the high-lipid sardine diet
examined. However, the baitfish lipid content range used (1.8-12.9%), is likely to
span that of wild tuna prey (∼4-9%)(Ellis and Rough, 2005; Ward et al., 2006),
confirming that the high energetic cost of SDA is ecologically relevant.
The results of this study support those found in chapter 1, that the energetic
cost of SDA in SBT is higher (approximately double) than recorded in other teleost
species. In that chapter it was proposed that the mechanism of SDA in SBT is no
different from that of other teleosts, but some metabolic aspects are enhanced in
association with other adaptations specific to the high-performance fishes and bluefin
tuna (T. maccoyii, T. thynnus and T. orientalis). Specifically these adaptations

43
include a high energetic cost of rapid protein synthesis and degradation rates due to
the fast growth rates, metabolic cost of faster postprandial swimming, and the
energetic cost of postprandial visceral warming. However, the degree that each may
contribute to SDA is unclear.
It is likely that the major contributing factors to the high recorded metabolic
cost of SDA are high protein synthesis and degradation rates associated with the fast
growth rates of juvenile SBT. Protein synthesis is known to be a highly energy
consuming process (Carter and Houlihan, 2001) and much of SDA represents the
costs of protein anabolism and hence growth (Brown and Cameron, 1991b; Brown
and Cameron, 1991a; Lyndon et al., 1992). In the comparatively slow growing cod
(Gadus morhua), protein synthesis has been shown to contribute up to 44% of
postprandial increase in M. O2 (Lyndon et al., 1992). As protein synthesis and
degradation rates have been shown to increase with growth rate (Houlihan et al.,
1988), their metabolic costs are likely to be much greater in fast growing tuna. This is
supported by the finding that the RNA:protein ratio (correlate of protein degradation,
synthesis and growth) of SBT white muscle has been shown to be higher than those
predicted for salmonids growing at equivalent rates, or cyprinids at the same water
temperatures (Carter et al., 1998). Unfortunately, there is no information on the cost
of SDA in other fast-growing, high-performance fish for comparison, however high
protein synthesis costs have been hypothesized to greatly contribute to the
postprandial M. O2 of these fish (Brill, 1996). Comparisons with other fast-growing
species would yield insight into the proportion of SDA that is specifically associated
with fast growth rates and not related to tuna-specific adaptations.
As previously recorded, swimming speed was elevated during the SDA period,
however in this case, the increase in velocity was dependent on the baitfish ingested,
being greatest for the high-lipid sardine. As the high-lipid sardines also induced the
greatest postprandial metabolic demand, this supports the theory that the purpose of
faster post-feeding swimming is to increase ventilation volume to facilitate enhanced
oxygen uptake (Fitzgibbon et al., 2007). To increase ventilation, obligate ram-
ventilating fish must increase swimming speed and/or mouth gape. Ram ventilating
sharks have been shown to enhance ventilation by increasing both speed and mouth
gape in response to hypoxia (Parsons and Carlson, 1998; Carlson and Parsons, 2001).
Skipjack (Katsuwonus pelamis) and yellowfin tuna (Thunnus albacares) have also
been shown to increase velocity in response to hypoxia, however in these cases there

44
is debate whether the purpose was to increase ventilation or a behavioural escape
response to the low dissolved oxygen (Dizon, 1977; Gooding et al., 1981; Bushnell
and Brill, 1991). As a postprandial escape response seems implausible, the increase
in swimming speed in the present study was most likely to enhance oxygen extraction
and was likely coupled with an increase in mouth gape. This increase in speed would
have contributed to the metabolic cost of SDA. An estimation of its cost can be made
by using the relationship between oxygen consumption rate and velocity of fasted
tuna species (Blank et al., 2007) (Table 5). From this estimation, the metabolic cost
of faster postprandial U is a significant component of total magnitude of SDA (up to
∼30%), however it is unlikely to account for the high SDA coefficient recorded.
Furthermore, increased post-feeding ventilatory costs are not exclusive to ram-
ventilating fish and are also likely to be a significant component of SDA magnitude in
buccal-pumping species. Interestingly, the increase in post-feeding swimming speed
of SBT that ingested the high-lipid sardines was proportionately greater than the
increase in ingested energy, as evident by the greater proportion of SDA used (∼30%
compared to ∼15% for low-lipid sardines). It is possible that this is related to the
counterproductive effect of increasing speed to facilitate increased ventilation.
Increasing swimming velocity incurs its own metabolic demand and must be
supported by another increase, and so on. The greater the metabolic load of SDA, the
greater the increase in U, and thus the greater the compounding effect.
Table 5. Estimation of the metabolic cost of faster postprandial swimming as a
proportion of SBT SDA. U
(BL s-1)
M. O2
(mg kg0.88 h-1)ab
SDA
Duration
(h)
M. O2 Magnitude
(mg kg0.88)a b
SBT SDA
Magnitude
(mg kg0.88)b
% SDA
Magnitude
Pre-feeding 0.75 233 - - - -
Low lipid 0.94 272 18 541 3808 14
High lipid 1.33 364 33 3343 10662 31
U, mean swimming velocity of southern bluefin tuna (SBT) before and after ingestion of low- and high-lipid sardines; M. O2,
calculated oxygen consumption rate of fasted Pacific bluefin tuna (Thunnus orientalis); SDA Duration, mean duration of SBT
specific dynamic action (SDA); M. O2 Magnitude, post-feeding M
. O2 subtracted from the pre-feeding level and multiplied by SDA
duration; % SDA Magnitude, M. O2 magnitude presented as a proportion of total magnitude of SBT SDA magnitude measured in
the present study. aBased on the relationship between swimming velocity and M
. O2 of a 8.3 kg Pacific bluefin tuna (Thunnus orientalis) (Blank et al.,
2007). bMass independent assuming a scaling coefficient of 0.88 ((White and Seymour, 2005; Fitzgibbon et al., 2006) adjusted to the
present study temperature of 17.5oC assuming a Q10 = 1.65 (White and Seymour, 2005).

45
As the exact mechanism of postprandial visceral warming is still poorly
understood, it is difficult to estimate its metabolic cost. However, it is unlikely to
greatly contribute to the high metabolic cost of SDA recorded with SBT. The source
of visceral heat is thought to be an accumulation of heat by-product of SDA (Carey et
al., 1984). However, the major tissue sites for SDA associated protein synthesis (thus
heat production), the liver and white muscle (Houlihan et al., 1988; Carter and
Houlihan, 2001), are thermally isolated from the viscera (Carey et al., 1984).
Therefore, only a fraction of SDA associated heat production (produced in the
stomach, caecum, intestines and spleen) contributes to visceral warming. However, it
has been estimated that the heat released by metabolizing less than 5% of gross
ingested energy is sufficient to account for visceral warming in large Atlantic bluefin
tuna (Thunnus thynnus) (Carey et al., 1984). This is less than 15% of the SDA
magnitude observed in SBT. The proportion of SDA associated with physiological
processes that take place within the tissues of the viscera is likely to be much greater
than this. These include pre-absorptive and absorptive processes such as gut
peristalsis, enzyme and acid secretion, protein catabolism, and intestinal absorption
(McCue, 2006). The cost of gut peristalsis alone has been shown to contribute as
much as 30% of SDA response in fish (Tandler and Beamish, 1979). This combined
with the effective heat retention due to highly efficient retia mirabilia (Carey and
Gibson, 1983) and efficient insulation by a thick fatty belly wall (Carey et al., 1984),
suggests that although only a small proportion of the heat by-product of SDA
contributes to visceral warming, it is likely to be largely sufficient. Furthermore, the
energetic cost of visceral warming appears unlikely to account for the observed
differences in SDA magnitude between the sardine diets. Gunn et al. (2001) found
that the magnitude of visceral warming was twice as great for SBT ingesting low-lipid
(3.2%) as for high-lipid (7.0%) baitfish. This suggests that the metabolic cost of
visceral warming is greatest for low-lipid baitfish. However, this result was
confounded by a substantial difference in study ambient water temperature (6-7oC).
Therefore it is unknown if the result was related to the lipid content of the diet or a
compensatory mechanism to increase digestion rate at low temperatures. Clearly,
more research is required to decipher the effects of diet energy levels on bluefin tuna
visceral warming.
The results of this study confirm that the metabolic cost of SDA for SBT is
approximately double that recorded in other teleosts (∼35% of gross injected energy)

46
and it is most likely related to their high-performance physiology (principally their
fast growth rates) and thus probably common to all tuna. This verifies another aspect
of tuna metabolic physiology that is greatly enhanced when compared to other teleost
species (including standard metabolic rates and metabolic scopes), which emphasizes
their great aerobic requirements. However, this does not necessarily mean that tuna
SDA is less energy efficient than that of other teleosts. As it appears that the majority
of the high cost of SDA is attributed to rapid protein anabolism, it mainly represents
the “cost of growth” and thus reducing SDA is unlikely to improve dietary energy
utilization efficiency (Lyndon et al., 1992).

47
Chapter 3: Effects of hypoxia on oxygen consumption, swimming velocity and gut evacuation in southern bluefin tuna (Thunnus maccoyii)
Abstract
Of the few measurements of the behavioural and physiological responses of tuna to
hypoxia, most are restricted to shallow diving tropical species. Furthermore, when
wild tuna experience low dissolved oxygen (DO), they are likely to have an increased
oxygen demand associated to the metabolic cost of food digestion and assimilation
(specific dynamic action, SDA). However the response of postprandial tuna to
hypoxia has never been examined. This study focuses on the metabolic and
behavioural responses of both fasted and postprandial southern bluefin tuna (Thunnus
maccoyii, SBT) to low DO. Separate groups of three fasted SBT (10.0 kg ± 0.9 SE, n
= 9) were exposed to mean DO levels of 4.44 (∼60% saturation), 3.23 (∼40%), 2.49
(∼30%), and 1.57 mg l-1 (∼20%) for 20-21 h. In moderate hypoxia (4.44 and 3.23 mg
l-1), swimming velocity (U) was enhanced (1.5 and 1.3 times normoxic speed,
respectively) presumably to increase ventilation volume. Routine metabolic rate
(RMR) was similarly elevated (1.3 and 1.2 times normoxic RMR, respectively), most
likely due to increased metabolic demand of faster swimming. At 2.49 mg l-1, U
increased to over double the normoxic speed, possibly as an escape response. At 1.57
mg l-1, both U and RMR were suppressed (0.8 and 0.9 times normoxic level,
respectively), and SBT failed to survive the entire 20 h exposure period. This reveals
that the short-term critical oxygen level of the size SBT studied is between 1.57 and
2.49 mg l-1, demonstrating that SBT are remarkably well adapted to low DO. Feeding
did not greatly influence their hypoxia tolerance, as a further group of three fish (11.4
± 1.4 kg) survived exposure to DO levels between 2.96 and 1.81 mg l-1 (~35-25 %)
for 21 h, after ingestion of a 6.7 % body weight ration of sardines (Sardinops sagax).
In a subsequent experiment to determine the effects of hypoxia on digestion rate,
three groups of three SBT (19.4 ± 0.7 kg, n = 9) were fed to satiation at low DO (4.57
mg l-1) immediately before the DO was further reduced (to 2.84 mg l-1, ~30%) for an
exposure period of 6.5-8 h, and compared to a single control group of two SBT (20.9
± 1.8 kg) in normoxia. There was no significant difference in U, RMR and gastric

48
evacuation rates of SBT in hypoxia compared to those in normoxia. This
demonstrates that in moderate to severe hypoxia, SBT are still capable of aerobically
supporting basal maintenance, routine swimming and SDA. It is hypothesized that
adaptations that support the large metabolic scope of tuna are also likely to be
beneficial for oxygen extraction and delivery in conditions of hypoxia.
Introduction
Tuna achieve oxygen consumption rates (M. O2) that exceed those of most other
teleosts. Their standard metabolic rate is between 2 and 5 times greater than that of
most other active fish (Korsmeyer and Dewar, 2001; Graham and Dickson, 2004).
This elevated basal metabolism has been attributed to energetically expensive
adaptations that support a great metabolic scope (Brill and Bushnell, 1991; Brill,
1996; Korsmeyer et al., 1996; Korsmeyer and Dewar, 2001). Because of
exceptionally high oxygen demands it seems reasonable to assume that tuna would be
very sensitive to hypoxia (Bushnell et al., 1990). However, the oceans are not
homogeneous, and significant reductions in dissolved oxygen (DO) occur at depths
frequented by tuna (Sund et al., 1981). Bigeye tuna (Thunnus obesus) spend
substantial amounts of the day time at great depths (>500m), in waters that can be
severely hypoxic (as low as 1.5 mg l-1) (Hanamoto, 1987; Dagorn et al., 2000;
Schaefer and Fuller, 2002; Musyl et al., 2003), and Atlantic (Thunnus thynnus) and
southern bluefin tuna (SBT, Thunnus maccoyii) dive to greater than 400 m (Block et
al., 2001; Gunn and Block, 2001). Although high oxygen requirements might be
expected to limit tolerance to hypoxia, at least some tuna species are well adapted to
low DO.
There have been few measurements of responses of tuna to hypoxia, and of
these most have been with tropical species. Laboratory studies with either paralysed
or swimming skipjack (Katsuwonus pelamis), yellowfin (Thunnus albacares), and
bigeye tuna, have shown that all respond to relatively mild reductions in DO (∼5-5.5
mg l-1) with significant cardio-respiratory adjustments (Bushnell et al., 1990; Bushnell
and Brill, 1991; Bushnell and Brill, 1992). The M. O2 of swimming albacore tuna
(Thunnus alalunga) was reduced in DO levels between 2.6 and 5.1 mg l-1 (Graham et
al., 1989). Similarly, paralysed yellowfin and skipjack tuna were able to maintain

49
M. O2 at normoxic levels at 3.85, but not at 2.14 mg l-1 (Bushnell and Brill, 1992). In
that study however, skipjack drew from venous oxygen reserves at 3.85 mg l-1
whereas yellowfin did not, suggesting that yellowfin are more hypoxia tolerant. The
greater hypoxia tolerance of yellowfin is supported by tank studies that found they
could survive periods in excess of 3 h at DO levels of just 1.4-1.6 mg l-1 (Dizon,
1977), whereas skipjack survived only about 60 min at a DO level of 3 mg l-1 (Dizon,
1977; Gooding et al., 1981). However, this finding has been largely ignored, as the
depth distribution of yellowfin tuna is believed to be limited to waters with DO above
6 mg l-1 (Cayré and Marsac, 1993). Indeed, intraspecific variation in hypoxia
tolerance is thought to correlate with the species’ vertical movement patterns, with
more tolerant tuna diving deeper and for longer than other species (Hanamoto, 1987;
Cayré and Marsac, 1993; Brill, 1994). Consequently it is hypothesized that deeper
diving tuna such as bluefin (T. thynnus, T. maccoyii, and T. orientalis) and bigeye
tuna may be better adapted to low DO. However, the tolerance of these species to
severe hypoxia has yet to be examined, which emphases our limited understanding of
the physiological constraints of low DO on tuna species.
The response of wild tuna to hypoxia is likely to be complicated by the
circumstances in which they experience it. Unlike many marine fish species that
avoid hypoxia (Claireaux et al., 1995; Schurmann et al., 1998; Claireaux et al., 2000),
tuna likely voluntarily enter areas of low DO in the pursuit of food. There is a strong
body of evidence showing that some tuna forage on deep prey, especially in the deep
scattering layer (Dagorn et al., 2000; Gunn and Block, 2001; Marcinek et al., 2001;
Schaefer and Fuller, 2002; Musyl et al., 2003). Feeding enhances oxygen demand
associated with prey capture and the metabolic cost of digestion and assimilation
(often referred to as specific dynamic action, SDA). In chapter 1 it was shown that
the M. O2 of postprandial SBT can be as much as three times the basal routine
metabolic rate. The effect of hypoxia on teleost SDA is largely unknown as only
recently have the first measurements of SDA of a fish species in reduced DO been
made (Jordan and Steffensen, 2007). In that study, Atlantic cod (Gadus morhua)
SDA continued at DO level of 2.7 mg l-1, however maximum postprandial M. O2 was
depressed and the duration of SDA prolonged, compared with that in normoxia
(Jordan and Steffensen, 2007). However in comparison to tuna, the Atlantic cod is a
relatively inactive species. How hypoxia affects tuna SDA is unknown. It is likely
that the elevated metabolic load associated with feeding and SDA greatly amplifies

50
the challenge that tuna face when balancing oxygen demand with oxygen availability
in deep hypoxic waters. Therefore, the effect of feeding must be assessed in order to
understand the responses of wild tuna to hypoxia.
This study examines the metabolic and behavioural responses of both fasted
and postprandial SBT to low DO. SBT can spend much time at great depths (to 400
m) feeding on omastrophic squid associated with the deep scattering layer, a similar
behavioural pattern to bigeye (Gunn and Block, 2001). Further to improving our
understanding on how tuna interact with their environment, physiological data on
environmental thresholds are important for population assessments and fisheries
management (Brill, 1994), and critical for captive fish management in the expanding
bluefin tuna aquaculture industry (Farwell, 2001).
Methods
Experimental animals
Two separate trials were conducted in early 2005 and 2006. In January of both years,
SBT were sourced from a marine aquaculture farm near Port Lincoln, South Australia,
through the Tuna Boat Owners Association of South Australia. Details of their
capture, maintenance, and handling are described in chapters 1 and 2.
Mesocosm respirometer
All experiments were conducted within a large static respirometer as described in
chapter 1. Dissolved oxygen (DO) was manipulated by high pressure injection of
micro-bubbles of either pure oxygen or nitrogen with a gas diffuser (Force 7, Aqua &
Co, BOC Gases, NSW, Australia). Injection of oxygen would rapidly raise DO (∼6
mg l-1 h-1) with nearly all bubbles being completely absorbed before reaching the
surface. However nitrogen injection was slower to reduce DO (∼1.5 mg l-1 h-1)
because oxygen had to be carried away in the nitrogen bubbles. Bubbles that
collected beneath the top of the respirometer were removed by rolling them towards
and out of the access port.

51
General experimental procedures
All experiments involved two or three fish. They were introduced in the late
afternoon, and routine metabolic rate (RMR) was determined over the subsequent
36 h. M. O2 was commonly elevated after introduction (presumably as a result of
transfer stress) but plateaued within 6-20 h, so RMR was determined as the mean M. O2
after this period. Fish were then used in SDA experiments as described in chapters 1
and 2. Therefore before the commencement of hypoxia trials, fish had spent a
minimum of 3 days within the respirometer, during which time they had ingested at
least one substantial meal of sardines. Hypoxia trials did not begin until 48-72 h after
feeding to allow the effects of SDA to subside. Fish were fed weighed sardines
through the access port and any uneaten baitfish removed by a diver to obtain the net
consumption.
Background changes in DO by bacterial/algal respiration and photosynthesis
were measured in trials immediately before and after each experiment, and all M. O2
recordings adjusted according to the time of day. Trials were also conducted to
measure the rate of oxygen leakage into the respirometer by reducing the DO to
∼2 mg l-1 in absence of SBT. Very low levels of leakage (0.0042 mg-1 h-1 per mg l-1
DO gradient between the respirometer and external environment) were found in
experiment 1 and negligible levels in experiment 2. These rates of leakage were
nevertheless used to adjust all trial DO recordings according to the pertinent oxygen
gradient.
Dissolved oxygen, water temperature and swimming velocity were measured
as described in chapter 1. In summary, SBT M. O2 was determined by the drop in DO
over time using two permanently installed luminescent DO meters (HQ10, Hach,
Loveland, CO, USA) that logged temperature and salinity (set at 350/00) adjusted DO
(0.01 mg l-1 resolution) every 5 min. SBT swimming velocity was measured by two,
permanently installed video cameras (SciElex, Hobart, TAS, Australia) which were
programmed to record for 4 min every 60-90 min, and data stored on a video recorder
(AV400, Archos, Greenwood Village, CO, USA). Two 6 W white LED lights gave
enough illumination for filming at night. Suitable footage segments were selected in a
video-editing program (VirtualDub 1.5.10, Avery Lee, www.virtual.dub.org) and
swimming velocity analysed by tracking fish movement with video motion analysis

52
software (Video Point® 2.5, Lenox Softworks, www.lsw.com). SBT body length
(BL) was used to calibrate image scale and any camera movement was corrected for
by referring to a stable point within the respirometer on a frame-by-frame basis.
Experiment 1
Trials were conducted in 2005 following SDA experiments as described in chapter 1
with SBT with a mean mass (Mb) of 10.3 ± 0.6 kg (n = 12) (Table 1). For each trial,
respirometer DO was reduced before SBT M. O2 and behaviour were monitored for the
subsequent 20-21 h. Initial DO levels were 4.66, 3.42, 2.79 or 1.65 mg l-1 (60, 40, 30
and 20% saturation trials, respectively). A further trial (30% saturation feed trial) was
conducted to determine if feeding affected hypoxia tolerance. At DO level of 4.75
mg l-1, SBT were fed sardines to satiation before respirometer DO was further reduced
to 2.96 mg l-1 and M. O2 and behaviour monitored for the subsequent 21 h. All trials
were conducted with different groups of three SBT except the 20% trial which was
performed with the same fish as the 40% experiment after a 24 h recovery period in
normoxia.
Experiment 2
Trials were conducted in 2006 following SDA experiments as described in chapter 2
with SBT with a mean Mb of 19.7 ± 0.8 kg (n = 11) (Table 2). At DO between 3.25-
5.17 mg l-1, three groups of three SBT were fed sardines to satiation before the DO
was further reduced to between 2.90 and 3.13 mg l-1 (∼40% saturation) and M. O2 and
behaviour monitored for 6.5-8.0 h from the time of feeding. SBT were then removed
by divers, killed according to normal commercial harvesting procedures and contents
of the stomach removed, blotted dry, and weighed. At this stage, divers also
inspected the respirometer for any regurgitated sardines. This was compared to a
control group of two SBT run at 7.81 mg l-1 (∼100% saturation) using the same
procedures.

53
Data analysis
DO recordings were broken up into 3 h blocks according to time of day (starting at
midnight) and linear regression fitted to the change in DO to establish SBT M. O2
(mg kg-1 h-1). All M. O2 calculations were adjusted for background
respiration/photosynthesis effects (mean of pre- and post-trial background recordings)
representative for the time of day. Swimming velocity data were also collated within
the same 3 h time periods, where between four and seven video footage segments
were analysed and their mean taken as representative of swimming velocity for that
period. Significant differences were established using Students T-test (StatistiXL
program version 1.5, www.statistixl.com). Values are means ± standard errors of
means.
Results
Experiment 1
In the 60% saturation trial, mean DO level was 4.44 mg l-1 and all SBT survived the
20 h experimental period (Table 1). U and RMR were greater than those recorded in
normoxia, being 1.5 and 1.3 times greater, respectively (Fig. 1). A similar result was
recorded at a mean DO of 3.23 mg l-1 (∼40% saturation), with U being 1.3 times, and
RMR 1.2 times greater, then in normoxia. However, at 2.49 mg l-1 (∼30%), increase
in U was 2.2 times greater than in normoxia. RMR was also elevated (1.4 times
normoxic level) but not to the extent of U. The first lethal effects of hypoxia were
observed at 1.57 mg l-1 (∼20%). Video footage showed that two of the three SBT died
after 5 h, the other after 7 h. Before mortality, both U and RMR were suppressed to
0.8 and 0.9 times the level in normoxia, respectively.

54
Table 1: Parameters for experiment 1 of groups of three fasted SBT in normoxia and
when exposed to hypoxia levels of ∼60, 40, 30, and 20% dissolved oxygen saturation,
and one group of SBT when exposed to ∼30% saturation after being fed sardines to
satiation.
60% 40% 30% 20% 30% feed
Mb (kg) 9.4 ± 1.6 9.9 ± 0.9 10.6 ± 1.3 9.9 ± 0.9 11.4 ± 1.4
BL (cm) 81 ± 5 83 ± 2 88 ± 3 83 ± 2 86 ± 2
Tw (oC) 19.7-20.1 20.1-20.3 19.1-19.7 20.1-20.3 18.2-18.5
Ur (BL s-1) 0.71 1.35 0.78 1.35 0.83
RMR (mg kg-1 h-1) 300 456 355 456 354
Ration (%BW) - - - - 6.7
DOrange (mg l-1) 4.66-4.21 3.42-3.03 2.79-2.18 1.65-1.49 2.96-1.81
DOmean (mg l-1) 4.44 3.23 2.49 1.57 2.39
Duration (h) 20.0 21.0 20.0 20.0 21.0
Uh (BL s-1) 1.05 1.84 1.68 1.09 1.53
RMRh (mg kg-1 h-1) 400 525 497 405 715
Values are means for groups of three SBT ± SE (n = 3).
Mb, body mass; BL, body length; Tw, experimental water temperature; Ur, routine swimming velocity (normoxia); RMR, routine
metabolic rate (normoxia); DOrange, range in experimental dissolved oxygen level; DOmean, mean experimental dissolved oxygen
level; Duration, duration of experimental trial; Uh, swimming velocity in hypoxia; RMRh, routine metabolic rate in hypoxia.
U of SBT at 2.39 mg l-1 after ingestion of a 6.7 %Mb ration of sardines (30%
feed trial) was twice that before feeding in normoxia and similar to that of fasted fish
at a comparable hypoxia level (Fig 1). RMR however, was substantially greater than
in fasted SBT at this hypoxia level, and twice that before feeding in normoxia. By the
end of this feeding experiment, DO had fallen to 1.81 mg l-1 (∼24%). Although all
SBT survived the entire 21 h experimental period, two of the three died when stressed
by divers during capture. This suggests that 24% saturation was close to their lethal
limit and similar to that of fasted SBT (∼20%).

55
Fig. 1. Factorial difference from normoxia of groups of three fasted SBT swimming
velocity (U, open circles) and routine metabolic rate (RMR, closed circles) when
exposed to reduced dissolved oxygen (DO) levels. Also included is the U (open
triangle) and RMR (closed triangle) of SBT in reduced DO, after ingestion of a 6.7 %
body mass ration of sardines.
Experiment 2
There were no significant differences in SBT Mb, BL, U or RMR between hypoxia
trials and the normoxia control (Table 2). Despite the low DO levels at feeding in
hypoxia trials (4.57 ± 0.66 mg l-1), SBT still voluntarily ingested substantial rations of
sardines (2.7 ± 0.3 %Mb). However, this was less than ingested in the normoxic
control (4.0 %Mb, P = 0.04). In hypoxia (2.84 ± 0.07 mg l-1), mean U was 1.8 ± 0.1
times greater, and RMR 1.6 ± 0.1 times greater, than before feeding in normoxia (Fig.
2). U and RMR were similarly elevated post-feeding in the normoxic control (1.9 and
1.8 times pre-feeding level, respectively). On no occasion were regurgitated sardines
found within the respirometer at the end of experiments. A mean of 17.3 ± 4.3 % of
ingested ration mass remained within the stomach of SBT in hypoxia, which was not

56
significantly different from those in the normoxia (16.7 %). When corrected for
variable experimental duration, there was no difference in gastric evacuation rate of
fish in hypoxia (11.1 ± 0.7 % h-1) compared to those in normoxia (12.8 % h-1).
Table 2. Parameters for experiment 2 of SBT before and after ingestion of a ration of
sardines and exposure to a period of hypoxia (∼40% saturation) or normoxia. Hypoxia 1 Hypoxia 2 Hypoxia 3 Hypoxia mean Normoxia
Mb (kg) 17.9 ± 2. 19.8 ± 0.3 20.4 ± 1.3 19.4 ± 0.7 20.9 ± 1.8
BL (cm) 102 ± 1 104 ± 1 106 ± 2 104 ± 1 108 ± 4
Tw (oC) 20.1-19.6 17.1-16.6 16.1-15.7 17.8-17.3 16.9-16.4
U (BL s-1) 0.83 0.79 0.74 0.79 ± 0.03 0.71
RMR (mg kg-1 h-1) 272 286 320 293 ± 14 357
Ration (%Mb) 2.2 3.1 2.9 2.7 ± 0.3* 4.0
DOfeed (mg l-1) 5.17 5.30 3.25 4.57 ± 0.66* 7.81
N2inject time (h) 2.50 2.25 0.00 1.58 ± 0.79 0.00
DOrange (mg l-1) 3.13-2.84 2.90-2.67 3.06-2.43 3.03-2.65 7.81-7.29
DOmean (mg l-1) 2.99 2.79 2.75 2.84 ± 0.07** 7.55
Duration (h) 8.0 6.5 8.0 7.5 ± 0.5 6.5
Uh (BL s-1) 1.46 1.42 1.39 1.42 ± 0.02 1.34
RMRh (mg kg-1 h-1) 391 499 557 482 ± 49 655
Gut contents (%ration) 8.6 21.9 21.5 17.3 ± 4.3 16.7
Gut evacuation (% h-1) 11.4 12.0 9.8 11.1 ± 0.7 12.8
*mean significantly different to normoxia (P<0.05), **(P<0.01). Values are means of three SBT ± SE (n = 3), except for
normoxia trial were two SBT were used. Mb, body mass; BL, body length; Tw, water temperature; U, swimming velocity (U);
RMR, routine metabolic rate; ration of sardines ingested; DOfeed, dissolve oxygen (DO) at time of feeding; N2inject time, time
require to lower dissolved oxygen to experimental level; DOrange, range in experimental DO; DOmean, mean experimental DO
level; Duration, time from feeding until end of experiment; Uh, U in hypoxia; RMRh, RMR in hypoxia; gut contents, mass of
contents of gut at end of experiment; Gut evacuation, % of intake ration evacuated from the gut per hour from feeding.

57
Fig. 2: Factorial change of swimming velocity (U, open circles) and routine metabolic
rate (RMR, closed circles) of three groups of three SBT after ingestion of 2.7 ±0.3%
body weight (%Mb) ration of sardines in hypoxia (mean 2.84 mg l-1) (values are
means ± SE, n=3) compared to that of a control group of two fish that ingested a
4.0%Mb ration in normoxia (7.55 mg l-1).
Discussion
Fasted southern bluefin tuna
SBT swim faster in moderate hypoxia (4.44 and 3.23 mg l-1) than in normoxia (1.3
and 1.5 times normoxic speed, respectively, Fig. 1). This is similar to that recorded
with skipjack (Dizon, 1977; Gooding et al., 1981; Bushnell and Brill, 1991), and
yellowfin tuna (Bushnell and Brill, 1991). It is likely that faster swimming is required
to increase ventilation volume in response to decreased oxygen availability. Obligate
ram-ventilating fish such as tuna must increase speed and/or mouth gape in order to
increase ventilation. Video footage, taken by divers at the end of hypoxia trials,

58
confirm a noticeable increase in SBT mouth gape with decreasing DO (Q. P.
Fitzgibbon, personal observation). Ram-ventilating sharks increase ventilation
volume by increasing both speed and mouth gape in response to hypoxia (Parsons and
Carlson, 1998; Carlson and Parsons, 2001). However, increasing speed also increases
oxygen demand. Indeed, RMR and swimming speed of SBT are similarly enhanced
in moderate hypoxia (1.2-1.5 times), compared to normoxia. As the M. O2 of
immobilized tuna remains constant from normoxia through to moderate hypoxia
(Bushnell and Brill, 1992), this indicates that the increase in RMR is due to the faster
swimming. This seemingly paradoxical effect has led to debate over whether the
metabolic costs of faster swimming outweigh its benefits to oxygen delivery
(Bushnell and Brill, 1991). Oxygen demand and delivery models for yellowfin and
skipjack indicate that increasing swimming velocity above routine levels is an
ineffective response to hypoxia, and that adequate oxygen delivery is best achieved by
doubling mouth gape without an increase in velocity (Bushnell and Brill, 1991). For
these species, it is suggested that the increase in speed is an escape response to
remove themselves from hypoxic waters. It should be noted however, that the speed
of SBT in normoxia (study mean = 0.75 BL s-1) was substantially less than that
recorded for yellowfin (∼1.2 BL s-1) and skipjack (∼1.6 BL s-1) (Dizon, 1977;
Gooding et al., 1981; Bushnell and Brill, 1991). Instead, the velocity of SBT in
moderate hypoxia (1.05-1.84 BL s-1) was similar to that found to be optimal for
oxygen delivery for these other tuna species (1.2-1.4 BL s-1). Therefore the observed
increase in swimming velocity combined with an increase in mouth gape was likely to
have been effective for improving oxygen delivery. In severe hypoxia (2.49 mg l-1)
however, swimming speed increased to 2.2 times the speed in normoxia. The
metabolic cost of this great increase in swimming velocity is likely to outweigh its
benefits to oxygen delivery, suggesting that it was an escape response.
All fish are able to extract enough oxygen to maintain minimal metabolic
function throughout some degree of hypoxia (Fry, 1971; Hughes, 1973). Cardio-
respiratory studies show that tuna do so mainly by increasing ventilation volume
(Bushnell et al., 1990; Bushnell and Brill, 1991; Bushnell and Brill, 1992). However,
below the critical oxygen level (Scrit), they need to resort to anaerobic metabolism,
which is not sustainable. SBT are able to maintain minimal aerobic uptake, down to
and including the DO level of 2.49 mg l-1 (∼30% saturation), for the period of these

59
experiments. When DO is reduced to 1.57 mg l-1 (∼20% saturation), they are no
longer able to support their minimal metabolic requirements, and die within 5-7 h.
Therefore the Scrit of SBT is between 1.57 and 2.49 mg l-1. As the Scrit of fish has
been widely examined, it proves a useful tool for comparing hypoxia tolerance
between species. However when comparing the Scrit of SBT, it must be noted that the
Scrit is most commonly evaluated with resting fish as the DO level in which the fish is
no longer able to maintain its standard metabolic rate (SMR). The present study
evaluates the Scrit with unrestrained tuna swimming between 0.71 and 1.84 BL s-1. As
the active metabolism of fish is more strongly influenced by DO then the SMR (Fry,
1971), the Scrit of a swimming fish will be at a higher DO than that for a resting fish.
Even so, the Scrit of SBT is comparable to many other teleosts, especially those of
other marine species (Table 3), which reveals that SBT are well adapted to low DO.
This tolerance of hypoxia seems counterintuitive considering the well documented
elevated oxygen demands of tuna (Korsmeyer and Dewar, 2001; Graham and Dickson,
2004). However, much of the high oxygen demand of tuna is associated with
adaptations that enhance oxygen uptake and delivery, which in turn support their great
metabolic scope. Some of these adaptations include large gill surface area and thin
gill epithelia (Muir and Hughes, 1969; Hughes, 1984), and high heart rates and
cardiac output (Brill and Bushnell, 2001; Blank et al., 2004). These energetically
expensive adaptations also improve the oxygen extraction and utilization capabilities
of tuna when exposed to low DO.

60
Table 3: Interspecific comparison of the critical oxygen level (Scrit) of some teleost
species. Common name Species Habitat Mb
(kg)
Tw
(oC)
U
(BL s-1)
Scrit
(mg l-1) Southern bluefin tuna1 Thunnus maccoyii O 10 18.2-20.3 0.71-1.84 1.57-2.49
Mulloway2 Argyrosomus japonicus C,E 0.34 22.0 0.9 1.5
Atlantic cod3 Gadus morhua C 0.30 15 0.0 2.58
Common dentex4 Dentex dentex C 0.39 20.8 0.0 2.5
Atlantic salmon5 Salmo salar C, FWs, FWm 0.04 12.5 0.0 4.0
Brook trout6 Salvelinus fontinalis FWs,FWm 0.10-0.28 15 0.0 3.8
Rainbow7 trout Oncorhynchus mykiss FWs,FWm 0.54 20 0.0 1.6
Carp7 Cyprinus carpio FWs 1.6 25 0.0 1.1
Cichlid8 Oreochromis niloticus FWs,FWm 0.22 20 0.0 1.1
Darter9 Etheostoma rufilineatum FWm - 20 0.0 6.1
Darter9 Etheostoma flabellare. FWs,FWm - 20 0.0 2.1
Darter9 Etheostoma duryi FWs,FWm - 20 0.0 2.0
Darter9 Etheostoma squamiceps FWs,FWm - 20 0.0 2.3
Darter9 Etheostoma boschungi FWs,FWm - 20 0.0 1.7
Darter9 Etheostoma fusiforme FWs - 20 0.0 2.9
European eel10 Anguilla anguilla FWs 0.12 25 0.0 1.3
Trahia11 Hoplias malabaricus FWs,FWm 0.04 25 0.0 0.94-1.67
Trairao12 Hoplias lacerdae FWs,FWm 0.3-0.5 25 0.0 1.83
Gulf killifish13 Fundulas grandis E, FWs 0.01 25 0.0 1.73 1Present study; 2Fitzgibbon et al., (In press); 3Schurmann and Steffensen (1997); 4Valverde et al., (2006); 5Stevens et al., (1998); 6Beamish, (1964); 7Ott et al., (1980); 8Fernandes and Rantin, (1989); 9Ultsch et al., (1978); 10Cruz-Neto and Steffensen, (1997); 11Kalinin et al., (1993); 12Rantin et al., (1992), 13Virani and Rees, (2000).
Mb, body mass; Tw, temperature; U, swimming velocity.
O, oceanic; C, coastal; E, estuarine; FWs, still fresh water; FWm, moving freshwater
Tolerance of SBT to hypoxia is similar to that of yellowfin tuna (Dizon, 1977),
suggesting that the ability to tolerate severe hypoxia may be common to the Thunnus
genus. This implies that the depth distribution limitation of yellowfin tuna to well
oxygenated waters (Cayré and Marsac, 1993) is a behavioural response and not a
physiological threshold. Similar behavioural avoidance of moderate hypoxia have
also been recorded in other marine teleosts such as Atlantic cod and sea bass
(Dicentrarchus labrax) (Claireaux et al., 1995; Schurmann et al., 1998; Claireaux et
al., 2000). Contrary to this are bigeye tuna which regularly dive into hypoxic waters
(Dagorn et al., 2000; Schaefer and Fuller, 2002; Musyl et al., 2003). Bigeye tuna may
be more tolerant of hypoxia than other tuna due to higher blood oxygen affinity (Jones
et al., 1986; Bushnell et al., 1990; Lowe et al., 2000; Brill and Bushnell, 2006).
However, their behavioural patterns are not necessarily evidence of greater hypoxia
adaptation. Although bigeye tuna may briefly frequent waters with DO levels as low

61
as ∼1.5 mg l-1 (Hanamoto, 1987; Musyl et al., 2003), they are largely limited to DO
levels above ∼3 mg l-1 with regular (1-2.5 hourly) ascents into the mixed surface
waters (Dagorn et al., 2000; Musyl et al., 2003). This type of hypoxia exposure is
probably well within the physiological capabilities of SBT (and yellowfin), suggesting
that bigeye tuna need not be more hypoxia tolerant. The prolonged deep diving
behaviour of bigeye tuna may be a behavioural preference or a greater tolerance of
low water temperatures that are often closely associated with deep hypoxic waters.
Effects of feeding
SBT voluntarily ingest substantial rations of sardines at DO levels as low as 3.25
mg l-1 (∼40% saturation), demonstrating their willingness to feed in hypoxic
conditions. Indeed, rations ingested in hypoxia (6.7 and 2.7 ± 0.25 %Mb for
experiments 1 and 2, respectively) were greater than recorded with the same fish in
normoxia (5.5 ± 1.2 %Mb, n = 6, chapter 1 and 2.0 ± 0.2 %Mb, n = 8, chapter 2,
respectively). This suggests that moderate hypoxia has little effect on the appetite of
SBT. The opposite is true for Atlantic cod, turbot (Scophthalamus maximus) and
European sea bass where feed intake is reduced in hypoxia (Chabot and Dutil, 1999;
Thetmeyer et al., 1999; Pichavant et al., 2001). Furthermore, SBT retain ingested
food when the DO is further reduced to as low as 2.5 mg l-1 (∼30%). Regurgitation in
severe hypoxia has been demonstrated in Atlantic cod (Claireaux et al., 2000).
Hypoxia-induced reduction in both feed intake and retention is suggested to be as a
result of the limiting effect of hypoxia on the metabolic scope (Claireaux et al., 2000;
Mallekh and Lagardere, 2002). It is thought that fish adjust the energy necessary for
SDA according to their capacity to provide energy to support other simultaneous
metabolic requirements. Hypoxia would almost certainly reduce the metabolic scope
of tuna as it does in other teleosts (Fry, 1971; Claireaux et al., 2000). However, tuna
are known to have scopes that greatly exceed that of most other fish (Korsmeyer et al.,
1996; Korsmeyer and Dewar, 2001; Graham and Dickson, 2004). Even during the
peak of SDA, free-swimming SBT are suggested to still have over 50% of their
metabolic scope available (chapter 1). Therefore, even with a substantial reduction in
scope, they are still likely to retain a large aerobic capacity to support SDA and other
essential metabolic requirements. Indeed, the present study shows that at a DO level

62
as low as 2.84 mg l-1 (∼40%), SBT do support digestion at a similar rate as in
normoxia. Postprandial RMR is similarly elevated in hypoxia (1.6 times pre-feeding
level in normoxia) as it was in normoxia (1.8 times), indicating the metabolic cost of
SDA is similar. Gastric evacuation rate during hypoxia is as rapid (11.1 ± 0.7% wet
mass h-1) as in normoxia (12.8% wet mass h-1) and similar to that documented for
other tuna species tuna (Schaefer, 1984; Olson and Boggs, 1986). This is in contrast
to Atlantic cod where at a similar level of hypoxia (2.7 mg l-1), maximum postprandial
M. O2 was reduced by 25% and to compensate the duration of SDA more than doubled
(Jordan and Steffensen, 2007). In cod, the peak in postprandial M. O2 in hypoxia
occupied ∼70% of the metabolic scope leaving little energy for other activities.
Maintaining digestion when faced with a diminished metabolic scope (as
assumed in hypoxia) would most likely occur at the expense of reduced oxygen
availability for other activities and processes. Sea bass maintain postprandial
gastrointestinal blood flow in hypoxia at the cost of blood supply to other organs
(Axelsson et al., 2002). Metabolic functions most likely affected by reduced aerobic
capacity include aerobic swimming and oxygen debt recovery capacity. When tuna
experience hypoxia, they would most likely have a swimming requirement associated
with predation. This combined with the elevated swimming requirement for
ventilation suggests that little of the remaining metabolic scope is available for
oxygen debt recovery. This supports the theory that one of the reasons bigeye tuna
regularly return to normoxic waters is to repay accumulated oxygen debt (Dagorn et
al., 2000; Musyl et al., 2003).
This study has shown that both fasted and postprandial SBT are highly tolerant
of low DO. This conclusion is based on the examination of relatively small SBT (∼10
kg). Larger tuna may be better adapted to low DO as the hypoxia tolerance of fish
improves with increasing body mass (Kalinin et al., 1993). However, fattened tuna in
aquaculture may be more susceptible to hypoxia due to decreased gill surface area to
body mass ratio. Oxygen uptake and delivery adaptations that support the great
metabolic scope of tuna are also likely to be beneficial in hypoxic waters.
Furthermore, it appears that the large metabolic scope of tuna maintains appetite and
permits digestion at low DO levels (less then 40% saturation). It is widely considered
that the great metabolic scope of tuna has evolved to allow the simultaneous support
of multiple metabolic functions associated with their high performance physiology

63
and behaviour, principally that of rapid sustained swimming, fast growth rates, rapid
digestion, regional endothermy and potential for quick repayment of oxygen debt
(Brill and Bushnell, 1991; Brill, 1996; Korsmeyer et al., 1996; Korsmeyer and Dewar,
2001; Graham and Dickson, 2004). Here it is suggested, that a large aerobic capacity
is also integral in supporting their ability to cope with low DO, allowing some tuna
species to exploit prey resources in deep, hypoxic waters.

64
Chapter 4: Relationship between routine metabolic rate and visceral warming in southern bluefin tuna (Thunnus maccoyii)
Abstract
The ability of tuna to conserve metabolic heat to maintain temperatures of the muscles
above ambient water temperature is thought to have allowed them to expand their
thermal niche and contributed to their evolutionary success. Tuna of the subgenus
Thunnus, which includes bluefin, also have the ability to warm the viscera. Species
capable of visceral warming occur in cooler water, which is possibly related to
improved thermoregulatory capabilities. However, the mechanisms of visceral
endothermy are poorly understood. The source of visceral heat is hypothesised to be a
by-product of the metabolic cost of food digestion and assimilation (specific dynamic
action, SDA) and it is not known if tuna are capable of regulating the efficiency of
visceral heat retention. In this study, 768 h of simultaneous recordings of metabolic
rate (MR; measured by oxygen consumption and equivalent to heat production rate)
and visceral temperature were made in both fasted and postprandial southern bluefin
tuna (SBT, Thunnus maccoyii) of two sizes (∼10 and 20 kg) and at two water
temperatures (∼19 and 16oC). In all trials, excess temperature (the difference between
visceral and water temperature) was directly related to postprandial MR. Duration
and magnitude of SDA were strongly related to duration and magnitude of
postprandial visceral warming providing the first empirical evidence of a link between
SDA and postprandial visceral warming. Unexpectedly, visceral temperature of
fasted SBT was also directly related to MR. In this case, the source of heat is thought
to be metabolic work performed within the red muscles which warmed the viscera
through thermal conductance. At any level of heat production (postprandial MR),
visceral excess temperatures were significantly warmer (over 1oC warmer) in larger
(∼20 kg) than smaller SBT (∼10 kg) at equivalent water temperature. Better heat
retention ability of the larger SBT is likely attributed to improved retia mirabilia
development and greater thermal inertia. Also at any level of heat production, SBT at
16oC maintained visceral excess temperatures significantly warmer (0.5oC warmer)

65
than similarly sized fish at 19oC. This demonstrates some ability of SBT to
physiologically regulate visceral warming. These results demonstrate that visceral
excess temperatures could be used to estimate metabolic rate for a given fish mass and
water temperature. As measurement of visceral temperature is relatively easy, this
could facilitate a greater examination of tuna bioenergetics and nutrition.
Introduction
Unlike the majority of teleost fishes that have body temperatures close to ambient
water temperatures (Tw) (ectotherms), tuna are capable of warming certain tissues
substantially above Tw (regional endothermy). Regional endothermy has evolved
independently in several fish lineages including lamnid sharks, billfishes and tuna, all
of which are large, high-energy demand fishes (Dickson and Graham, 2004). The
degree of specializations for endothermy varies considerably within the Thunnini tribe
and correlates strongly with tuna phylogeny (Block et al., 1993; Collette et al., 2001).
Tissues capable of being warmed include locomotor muscles, cranial tissues (eyes and
brain), and the viscera (Graham and Dickson, 2000; Graham and Dickson, 2001;
Dickson and Graham, 2004). Amongst tuna species examined, most can elevate
temperatures of the muscles and cranial tissues. However, only species within the
subgenus Thunnus are capable of visceral endothermy, including southern bluefin
(Thunnus maccoyii, SBT), Atlantic bluefin (T. thynnus), Pacific bluefin (T. orientalis),
albacore (T. alalunga) and bigeye tuna (T. obesus) (Collette et al., 2001). Large
Atlantic bluefin (>200 kg) achieve excess temperatures (temperature above Tw) of the
muscles and viscera of up to 21oC and can maintain 8-15oC for months (Carey, 1973;
Carey et al., 1984; Stevens et al., 2000; Block et al., 2001; Gunn and Block, 2001).
Smaller SBT and Pacific bluefin (<50 kg) maintain muscle and visceral excess
temperatures between 3-9oC (Kitagawa et al., 2000; Gunn et al., 2001; Marcinek et al.,
2001; Itoh et al., 2003; Kitagawa et al., 2006). Physiological benefits believed to
result from elevated body temperatures include enhanced rates of muscle contraction
and power output (Carey and Teal, 1969a; Brill, 1978; Johnson and Brill, 1984;
Wardle et al., 1989; Altringham and Block, 1997), cellular respiration (Stevens and
Carey, 1981), visual acuity and neural processing (Block and Carey, 1985) and
digestion (Carey et al., 1984; Stevens and McLeese, 1984). It is thought that the
major evolutionary advantages of endothermy are that it allows tuna to expand their

66
thermal niche (both horizontally and vertically) and enhances their aerobic swimming
performance (Block et al., 1993; Graham and Dickson, 2000; Dickson and Graham,
2004).
Endothermy requires a source of heat and a mechanism to retain it. The
source of heat is commonly thought to be a by-product of normal metabolic processes.
This heat is retained within the tissue by arterial and venous blood vessels arranged as
counter current heat exchangers (retia mirabilia) that reduce convective heat loss
from the tissue and loss to the surrounding water across the gills (Graham, 1975;
Fudge and Stevens, 1996). Locomotory work performed by the slow-oxidative
myotomal muscle fibers (red muscle) is a continuous source of muscle heat due to
tunas’ requirement to swim continuously to maintain hydrostatic equilibrium
(Magnuson, 1973) and ram ventilation (Brown and Muir, 1970). Bluefin tuna retain
heat within the red muscles by retia positioned laterally along the outer body wall
(supplied by both lateral arteries) (Carey and Teal, 1969b; Graham, 1975). The red
muscle of tuna is located axially, deep within the white muscle that insulates it from
conductive heat losses across surface areas. Thermal conductance results in the
establishment of a temperature profile throughout the body (Carey and Teal, 1969b).
The source of cranial heat in tuna is unknown, however bluefin have retia on each
carotid artery (Graham and Dickson, 2001). The source of visceral heat is thought to
be the by-product of metabolic work associated with food digestion and assimilation
(commonly referred to as specific dynamic action, SDA) (Carey et al., 1984). This
heat is retained within the viscera by retia that supply blood to the stomach, spleen,
caecum and intestines (Carey et al., 1984; Fudge and Stevens, 1996). SDA in SBT as
in other fish, is characterized by a rapid increase and peak in postprandial metabolic
rate, before gradually declining over several hours or days to the pre-feeding level
(Jobling, 1981; McCue, 2006; Fitzgibbon et al., 2007). Postprandial visceral warming
displays a similar abrupt rise followed by a steady decline (Carey et al., 1984; Gunn
and Block, 2001; Gunn et al., 2001). The magnitude (total increase above basal level)
of SDA and postprandial visceral warming are proportional to the amount of food
ingested (Gunn et al., 2001; Fitzgibbon et al., 2007). This supports the theory that the
heat by-product of SDA is the source for postprandial visceral warming.
Thermoregulatory options for tuna can be grouped into three categories,
behavioural, passive and physiological (Dizon and Brill, 1979b). Behavioural
thermoregulation can be achieved by the spatial selection of favourable environmental
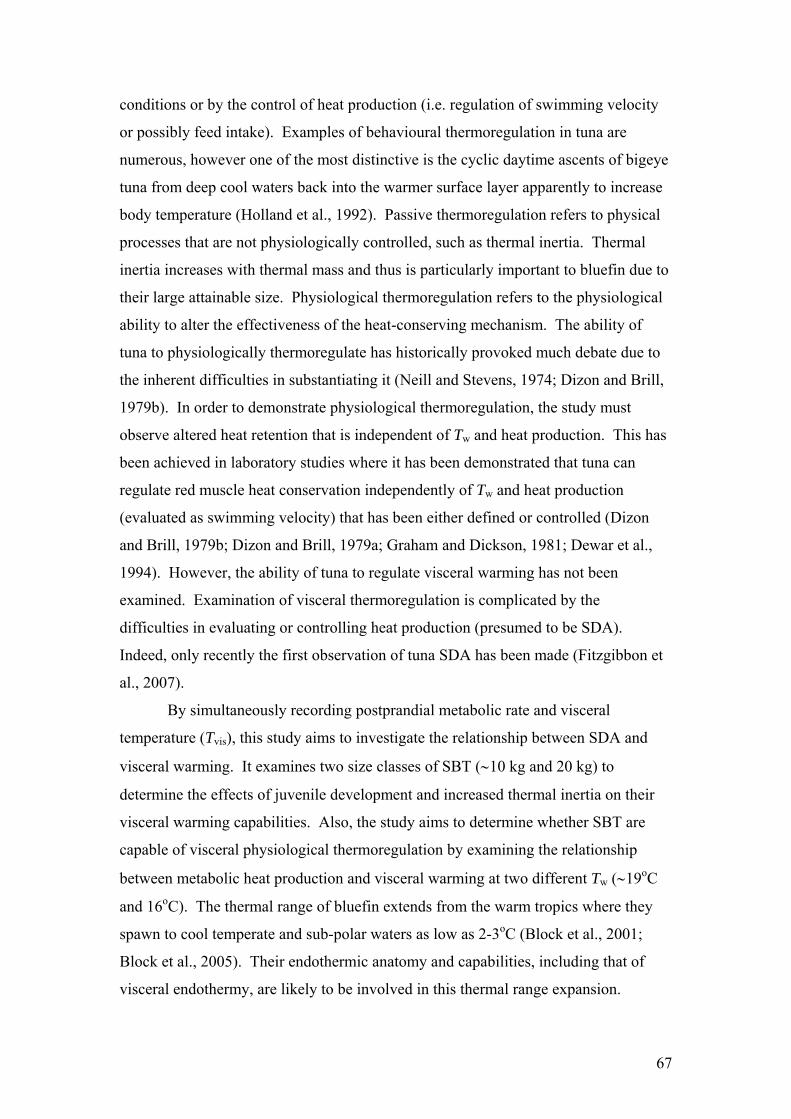
67
conditions or by the control of heat production (i.e. regulation of swimming velocity
or possibly feed intake). Examples of behavioural thermoregulation in tuna are
numerous, however one of the most distinctive is the cyclic daytime ascents of bigeye
tuna from deep cool waters back into the warmer surface layer apparently to increase
body temperature (Holland et al., 1992). Passive thermoregulation refers to physical
processes that are not physiologically controlled, such as thermal inertia. Thermal
inertia increases with thermal mass and thus is particularly important to bluefin due to
their large attainable size. Physiological thermoregulation refers to the physiological
ability to alter the effectiveness of the heat-conserving mechanism. The ability of
tuna to physiologically thermoregulate has historically provoked much debate due to
the inherent difficulties in substantiating it (Neill and Stevens, 1974; Dizon and Brill,
1979b). In order to demonstrate physiological thermoregulation, the study must
observe altered heat retention that is independent of Tw and heat production. This has
been achieved in laboratory studies where it has been demonstrated that tuna can
regulate red muscle heat conservation independently of Tw and heat production
(evaluated as swimming velocity) that has been either defined or controlled (Dizon
and Brill, 1979b; Dizon and Brill, 1979a; Graham and Dickson, 1981; Dewar et al.,
1994). However, the ability of tuna to regulate visceral warming has not been
examined. Examination of visceral thermoregulation is complicated by the
difficulties in evaluating or controlling heat production (presumed to be SDA).
Indeed, only recently the first observation of tuna SDA has been made (Fitzgibbon et
al., 2007).
By simultaneously recording postprandial metabolic rate and visceral
temperature (Tvis), this study aims to investigate the relationship between SDA and
visceral warming. It examines two size classes of SBT (∼10 kg and 20 kg) to
determine the effects of juvenile development and increased thermal inertia on their
visceral warming capabilities. Also, the study aims to determine whether SBT are
capable of visceral physiological thermoregulation by examining the relationship
between metabolic heat production and visceral warming at two different Tw (∼19oC
and 16oC). The thermal range of bluefin extends from the warm tropics where they
spawn to cool temperate and sub-polar waters as low as 2-3oC (Block et al., 2001;
Block et al., 2005). Their endothermic anatomy and capabilities, including that of
visceral endothermy, are likely to be involved in this thermal range expansion.

68
Methods
Experimental animals
Trials were conducted with two separate cohorts of SBT in 2005 and 2006. In
January of both years, SBT were sourced from a marine aquaculture farm near Port
Lincoln, Australia, through the Tuna Boat Owners Association of South Australia.
These fish had been captured using a purse-seine net from wild schools in the Great
Australian Bight a month earlier. From the commercial farms, individual fish were
hooked with a baited, barb-less hook and transferred into a 12 m diameter, 8 m deep
holding sea-cage. This was towed and moored in a protected bay at the southern end
of Boston Island, where all trials were conducted. The SBT were left to recover from
transfer for 1 month during which time they were fed sardines (Sardinops sagax)
twice per day to satiation.
Archival temperature loggers (TX, Vemco, www.vemco.com) were then
surgically implanted into the body cavity to record Tvis. Individual SBT were
removed from the holding cage, either by hook (as described above), or by hand
whereby the fish were crowded within a small purse-seine net, captured by a skin
diver and passed to waiting deck crew. The fish was then inverted, placed into a
padded cradle and a wet cloth put over its eyes to aid with settling. A 5-8 cm incision
into the belly wall along the central line, approximately 10-12 cm anterior to the vent,
was made with a sharp knife and the peritoneum perforated by the surgeon’s finger.
The logger, which was coated in antiseptic (Betadine, Purdue Pharma,
www.pharma.com) was then inserted through the hole so that it lay along the belly
wall ventral to the stomach and caecum with the thermistor pointing towards the head.
A 2.5 ml dose of broad spectrum antibiotic (Amoxil, GlaxoSmithKline,
www.gsk.com) was then injected into the opening and the wound was sealed with two
stitches (Vicryl suture, Ethicon, www.ethicon.com). The fish was then released, the
entire process taking ∼1-1.5 min. The loggers were programmed to record Tvis every
4 min.
Following logger implantation the SBT were left to recover for at least one
month. Again during this period they were fed sardines twice per day but were
69
starved for between 48-72 h before introduction to the respirometer to allow the
effects of SDA to subside (Fitzgibbon et al., 2007). SBT were transferred into the
respirometer by hand as described above.
General experimental procedures
All experiments were conducted within a large static respirometer described in
chapter 1. The SBT were obviously distressed when confined within the respirometer
alone, but settled down when accompanied by others. Therefore all experiments
involved three fish. They were introduced in the afternoon, the respirometer was
sealed and metabolic rate (MR) was recorded until the morning approximately 36-42
h later. Data collected during this period were subsequently used as representative of
fasted fish. Respirometer dissolved oxygen (DO) was then returned to between 100-
115% saturation by oxygen injection with a gas diffuser (Force 7, Aqua & Co, BOC
Gases, NSW, Australia). After 1 h recovery from this disturbance, fish were then fed
either high- or low-lipid sardines (described in chapter 2) through the access port.
Uneaten sardines were removed by a diver to obtain the net consumption. The
respirometer was again sealed and MR recorded for 48 h. Data collected during this
period were considered representative of postprandial fish. Feeding was subsequently
repeated between two and four times in each trial with the same procedures.
Dissolved oxygen was measured as described in full in chapter 1. In summary,
SBT MR was determined by the drop in DO over time that was measured by two
permanently installed luminescent DO meters (HQ10, Hach, Loveland, CO, USA) that
logged temperature and salinity (set at 350/00) adjusted DO (0.01 mg l-1 resolution)
every 5 min. These meters also logged water temperature (Tw) every 5 min. An
individual MR datum was taken as the mean over a 3 h period. The periods started at
midnight.
Background changes in DO due to respiration and photosynthesis were
measured in trials immediately before and after each experiment, and all MR
recordings adjusted accordingly to the pertinent time of day. Trials were also
conducted to measure the rate of oxygen leakage into the respirometer by reducing the
DO to ∼2 mg l-1 in the absence of SBT. Very low levels of leakage (0.0042 mg-1 h-1
per mg l-1 DO gradient between the respirometer and external environment) were

70
found in 2005 and negligible levels in 2006. These rates of leakage were nevertheless
used to adjust all trial DO recordings according to the pertinent oxygen gradient.
Experimental trials
Three experiments were conducted to examine the effects of body mass (Mb) and
water temperature (Tw), each consisting of two trials with three SBT.
10 kg/ 19oC experiment: These trials were conducted in 2005 with SBT mean
body mass (Mb) of 10.2 ± 1.0 kg at a mean Tw of 19.3 ± 0.1oC (Table 1). MR and Tvis
were recorded for a total of 195 h equating to 65 (17 fasted and 48 postprandial)
simultaneous measurements. SBT were fed sardines twice in each of the two trials.
Mean ration voluntarily ingested was 5.8 ± 1.3 % body mass (%Mb).
20 kg/ 19oC experiment: To examine the effects of increased Mb, this
experiment was conducted at an equivalent Tw (19.0 ± 0.1oC), however with SBT
approximately double the Mb (19.1 ± 0.7 kg) as in the first experiment. It was carried
out in 2006 and consisted of 84 simultaneous measurements. Again, SBT were fed
sardines twice in each of the two trials, however rations voluntarily ingested (2.1 ±
0.3 %Mb) were less than the experiment with 10 kg fish.
20 kg/ 16oC experiment: This experiment aimed to examine the effects of
reduced Tw and was performed with the same cohort of SBT (Mb = 20.1 ± 0.6 kg) as
the second experiment, but later in the Austral autumn season when mean Tw was
∼3oC cooler (16.2 ± 0.1oC). One hundred and seven simultaneous measurements of
MR and Tvis were recorded. SBT were fed sardines twice in the first trial and four
times in the second. Rations ingested were similar (2.3 ±0.5 %Mb) to the 19oC trial.
Attempts were made to conduct experiments during the Austral winter when
ambient water temperatures were further reduced. However these proved
unsuccessful, as rough weather restricted access and caused substantial equipment
failure. Furthermore, SBT failed to voluntarily ingest sardines, presumably due to a
reduced appetite associated with the low Tw.

71
Table 1. Parameters for SBT trials. Trials No. of
fish
Mb
(kg)
Tw range
(oC)
Tw mean
(oC)
n
(Fasted)
n
(postprandial)
No. of
feeds
Ration
(%BW)
10 kg/ 19oC 6 10.2 ±1.0 18.2-20.7 19.3 ±0.1 17 48 4 5.8 ±1.3
20 kg/ 19oC 6 19.1 ±0.7 18.4-20.2 19.0 ±0.1 31 53 4 2.1 ±0.3
20 kg/ 16oC 6 20.1 ±0.6 15.6-16.8 16.2 ±0.1 28 79 6 2.3 ±0.5
Mb, body mass: n, number of measurements. Tw=water temperature.
Data analysis
DO recordings were broken up into 3 h blocks according to the time of day (starting at
midnight) and linear regression fitted to the change in DO to establish SBT MR (mg
kg-1 h-1). Tvis (mean of the three SBT) and water temperature (Tw) data were also
collated within the same 3 h time periods, where the mean was taken. Immediately
following feeding, Tvis would commonly drop due to the cooling effect of sardines
ingested (which were at or below Tw) (Fig. 1). For this reason, data collected within 3
h of feeding were excluded from comparison. The difference in Tvis from Tw is
referred to as Tvis excess.
Specific dynamic action (SDA) was quantified with the following parameters:
SDA duration (duration that postprandial MR remained greater than the pre-feeding
level), and SDA magnitude (total oxygen consumed above the pre-feeding MR within
the SDA duration period). Postprandial visceral warming was quantified with the
following parameters: Tvis duration (duration that postprandial Tvis remained greater
than the pre-feeding level) and Tvis magnitude (total temperature (in oh) above the pre-
feeding Tvis within the Tvis duration period). Significant differences of means were
established by the use of two-tailed students T-tests, and regression slopes and
intercepts by ANOVA within the StatistiXL program (version 1.5,
www.statistixl.com).
Results
Fig. 1 demonstrates data recorded in one trial of the 20 kg/ 19oC experiment.
Measurements began immediately after the transfer of SBT into the respirometer and
continued for ∼6 days. Tvis fluctuated, however basal temperatures were always

72
between 2 and 3oC above Tw. This was common for all trials and similar to that
previously recorded with equivalent sized SBT (15-37 kg) (Gunn and Block, 2001;
Gunn et al., 2001). SBT had not been fed for at least 48 h before introduction,
therefore data collected before feeding were used as representative for fasted fish.
After transfer, MR and Tvis were initially elevated, but gradually decreased over ∼20 h
to a plateau. It is presumed that this was due to physical exertion and stress associated
with capture and transfer. For transfer, SBT were crowded within a net and captured
by a skin diver. Fish would struggle when accidentally caught in the net and when
grasped by the diver. During this trial, SBT ingested two small rations of sardines
(1.7 % body weight) and data taken in the subsequent 48 h of each feed were used as
representative of postprandial SBT. These feeding events were characterized by an
initial drop in Tvis (due to the lower temperature of sardines ingested) followed by a
rapid increase of Tvis and MR, both of which appear to take ∼20-30 h to fall to the pre-
feeding level. Tw fluctuated between 18.4 and 18.8 oC in what appeared to be a
diurnal cycle.
Fig. 1: Simultaneous measurement of SBT visceral temperature (Tvis) and metabolic
rate (MR) in one trial of the 20 kg/ 19oC experiment. Measurements began
immediately after transfer into the respirometer and the SBT were fed sardines twice
(both 1.7 % body mass rations) during the trial. Tw are ambient water temperatures.
Values are means of three SBT.
73
Fasted SBT
Tvis ranged between 18.7 and 23.7 oC in fasted SBT (Fig. 2A). It was related to MR in
all experiments (P <0.01, <0.01 and 0.01 for 10 kg/ 19oC, 20 kg/ 19oC, 20 kg/ 16oC
experiments, respectively) (Table 2). Comparisons between the three experiments
found that the regressions slopes were not significantly different. However, intercepts
were different, with the 20 kg SBT at 19oC experiment having the warmest Tvis and
the fish at 16oC the coolest.
Minimum Tvis above Tw (Tvis excess) was 1.7 oC (Fig. 2B). Tvis excess was
directly related to MR for all experiments (P = 0.01, <0.01 and <0.01 for 10 kg/ 19oC,
20 kg/ 19oC and 20 kg/ 16oC experiments, respectively) (Table 2). The slope of
regression for the 10 kg/ 19oC trial, was significantly less than the other two
experiments (Table 2). The slopes of regressions of the 20 kg/ 19oC and 20 kg/ 16oC
experiments were not different but the SBT at 16oC maintained Tvis excess
significantly warmer (∼0.5oC) than the fish at 19oC.

74
Fig. 2. Relationship between fasted SBT metabolic rate (MR) and A) visceral
temperature (Tvis), and B) visceral temperature difference from ambient water
temperature (Tvis excess), for SBT with body mass (Mb) of ∼10 kg at a ambient water
temperatures of 19oC (crosses), Mb ∼20 kg at ∼19oC (filled circles), and Mb ∼20 kg at
∼16oC (open circles). Full details of trials are given in Table 1. Lines represent linear
regressions, solid line for 10 kg/ 19oC, long dashes for 20 kg/ 19oC and dashes and
dots for 20 kg/ 16oC. Details for regressions are given in Table 2. Each data point is
the means of three fish over a 3 h period.

75
Table 2. Parameters for fasted and postprandial SBT. Regressions relating metabolic
rate (MR, mg kg-1 h-1), with visceral temperature (Tvis, oC) and difference in visceral
temperature from water temperature (Tvis excess, oC) (Tvis or Tvis excess = b • MR +a)
as recorded in trials described in Table 1. n b a R2 P
(slope)
Sig. Diff.
(slope)
Sig. Diff.
(intercept)
Fasted Tvis 10 kg/ 19oC 17 0.0055 19.73 0.67 <0.01 a a
20 kg/ 19oC 31 0.0091 19.45 0.52 <0.01 a b
20 kg/ 16oC 28 0.0072 17.30 0.27 0.01 a c
Tvis excess 10 kg/ 19oC 17 0.0027 0.92 0.39 0.01 a -
20 kg/ 19oC 31 0.0109 -0.31 0.63 <0.01 b a
20 kg/ 16oC 28 0.0105 0.15 0.58 <0.01 b b
Tvis 10 kg/ 19oC 48 0.0051 18.97 0.60 <0.01 a a
20 kg/ 19oC 53 0.0058 19.97 0.45 <0.01 a b
20 kg/ 16oC 79 0.0032 19.21 0.25 <0.01 b -
Tvis excess 10 kg/ 19oC 48 0.0035 0.71 0.62 <0.01 a a
20 kg/ 19oC 53 0.0041 1.81 0.47 <0.01 a b
Post-
prandial
20 kg/ 16oC 79 0.0043 2.27 0.43 <0.01 a c
n, number of measurements; R2, regression coefficient; P, probability that regression slope is significantly different from zero;
Sig. Diff. (slope) and Sig. Diff. (intercept), significant differences (P<0.05) of linear regression slope and intercept (intercept
differences were only tested when regression slopes were not significantly different) by ANOVA with Post Hoc analysis.
Different letters denote significant differences between regressions.
Postprandial SBT
Minimum Tvis of postprandial SBT (18.9oC) was similar to fasted SBT, however the
maximum achieved (up to 26.1oC) was greater (Fig. 3A). Postprandial Tvis was
related to MR in all experiments (P <0.01) (Table 2). Comparisons of slopes found
the 20 kg/ 16oC experiment to be different to the other two experiments. Comparison
of regression intercepts between the 10 and 20kg SBT at 19oC revealed that the 20 kg
SBT maintained Tvis approximately 1oC warmer relative to MR.
Tvis excess of postprandial SBT ranged between 1.8-7.1oC (Fig. 3B). Tvis
excess was again directly related to MR in all experiments (P <0.01) (Table 2).
Intercepts of regression were however significantly different between experiments.
At a given MR, Tvis excess of 10 kg SBT were approximately 1oC cooler than the 20
kg fish. Tvis excess of 20 kg SBT at 16oC were approximately 0.5oC warmer than
similar sized fish at ∼19oC.

76
Fig. 3. Relationship between postprandial SBT metabolic rate (MR) and A) visceral
temperature (Tvis), and B) visceral temperature difference from ambient water
temperature (Tvis Excess), for SBT with body mass (Mb) of ∼10 kg at a ambient water
temperatures of 19oC (crosses), Mb ∼20 kg at ∼19oC (filled circles), and Mb ∼20 kg at
∼16oC (open circles). Full details of trials are given in Table 1. Lines represent linear
regressions, solid line for 10 kg/ 19oC, long dashes for 20 kg/ 19oC and dashes and
dots for 20 kg/ 16oC. Details for regressions are given in Table 2. Each data point is
the mean of three SBT over a 3 h period.

77
Specific dynamic action parameters
Duration of SDA was directly related to the duration of postprandial visceral warming
for the 20 kg/ 19oC, and 20 kg/ 16oC experiments (P = 0.01 and 0.04, respectively) but
not the 10 kg/ 19oC experiment (P = 0.19) however, there was no significant
difference in regressions between experiments (Table 3). When the data from all
experiments are combined, duration of SDA and visceral warming are strongly related
(P <0.01) (Fig. 4A).
Magnitude of SDA was directly related to the magnitude of postprandial
visceral warming for the the10 kg/ 19oC and 20 kg/ 16oC experiments (P = 0.02 and
0.01, respectively) but not the 20 kg/ 19oC (P = 0.06). Slopes of regressions were
similar between experiments however the intercept in the 10 kg/ 19oC experiment was
significantly less than in the 20 kg/ 16oC experiment. When the data for the 20 kg
SBT were combined, SDA and Tvis magnitude were strongly related (P <0.01) (Fig.
4B).
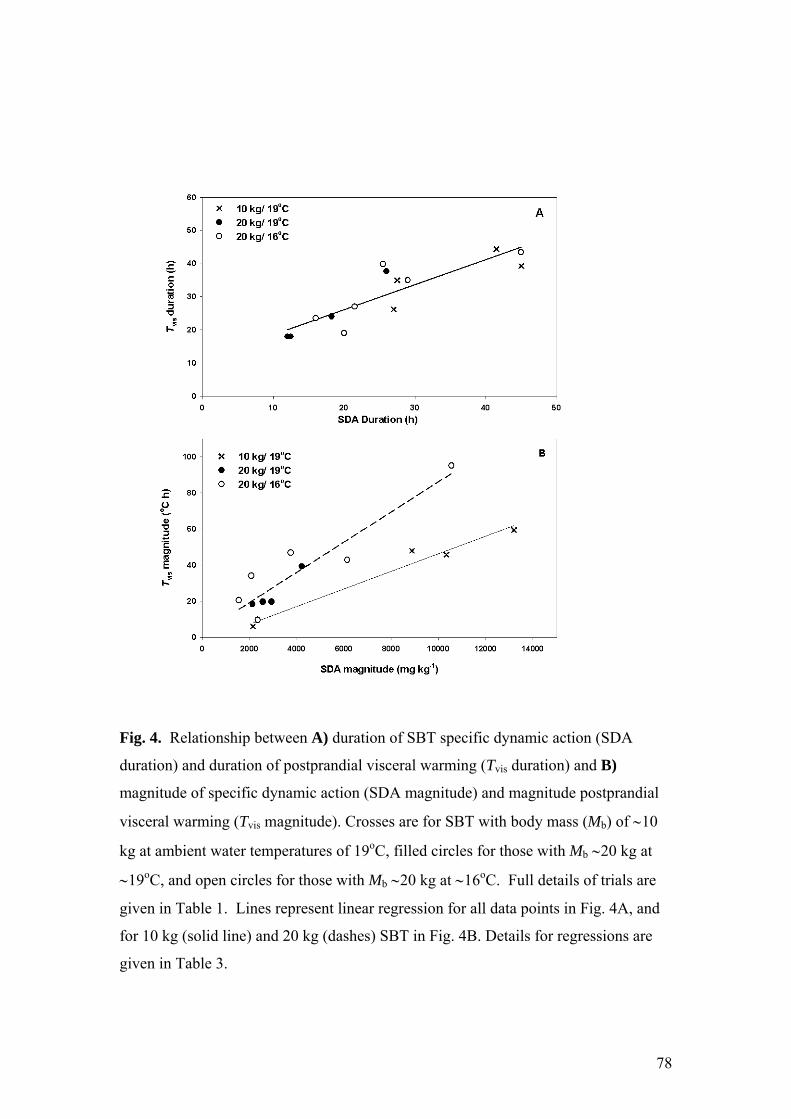
78
Fig. 4. Relationship between A) duration of SBT specific dynamic action (SDA
duration) and duration of postprandial visceral warming (Tvis duration) and B)
magnitude of specific dynamic action (SDA magnitude) and magnitude postprandial
visceral warming (Tvis magnitude). Crosses are for SBT with body mass (Mb) of ∼10
kg at ambient water temperatures of 19oC, filled circles for those with Mb ∼20 kg at
∼19oC, and open circles for those with Mb ∼20 kg at ∼16oC. Full details of trials are
given in Table 1. Lines represent linear regression for all data points in Fig. 4A, and
for 10 kg (solid line) and 20 kg (dashes) SBT in Fig. 4B. Details for regressions are
given in Table 3.

79
Table 3. Details of linear regressions (Tvis (duration or magnitude) = b • SDA
(duration or magnitude) +a) for correlations between parameters of SBT specific
dynamic action (mg kg-1) and postprandial visceral warming (oC h) as recorded in
trials described in Table 1. n b a R2 P
(slope)
Sig. Diff.
(slope)
Sig. Diff.
(intercept)
10 kg/ 19oC 4 0.6607 12.93 0.64 0.19 a a
20 kg/ 19oC 4 1.4097 0.20 0.97 0.01 a a
Duration
20 kg/ 16oC 6 0.7750 11.00 0.68 0.04 a a
All data 14 0.7568 10.91 0.76 <0.01 - -
10 kg/ 19oC 4 0.0049 2.20 0.96 0.02 a a
20 kg/ 19oC 4 0.0106 7.23 0.90 0.06 a ab
Magnitude
20 kg/ 16oC 6 0.0080 6.43 0.85 0.01 a b
20 kg combined 10 0.0084 2.60 0.86 <0.01 - -
Duration, relationship between duration of SDA and postprandial visceral warming; Magnitude, relationship between SDA and
visceral warming magnitude.
n, number of measurements; R2, regression coefficient; P, probability that regression slope is significantly different from zero;
Sig. Diff. (slope) and Sig. Diff. (intercept), significant differences (P<0.05) of linear regression slope and intercept (intercept
differences were only tested when regression slopes were not significantly different) by ANOVA with Post Hoc analysis.
Different letters denote significant differences between regressions.
Discussion
The duration and magnitude of SDA are strongly related to duration and magnitude of
postprandial visceral warming (Fig. 4). This provides the first empirical evidence of a
link between SDA and postprandial visceral warming. However, it is unlikely that all
of the heat by-product of SDA contributes to visceral warming because not all of the
physiological processes involved in SDA occur in the organs supplied with blood
through visceral retia mirabilia (stomach, spleen, caecum and intestines). Processes
of SDA that do occur within these tissues include enzyme production and secretion,
gut peristalsis, acid secretion, mechanical digestion, and intestinal absorption (McCue,
2006). These pre-absorptive and absorptive processes are likely completed well
before that of visceral warming. Gut evacuation rates of tuna are extremely fast (∼10-
12 h) (Magnuson, 1969; Schaefer, 1984; Olson and Boggs, 1986), however, the
visceral temperatures of bluefin can remain elevated for longer than 48 h after feeding.
Instead, SDA in fish is considered mostly a post-absorptive effect attributed to

80
catabolism events such as amino acid deamination (Beamish and Trippel, 1990; Cho
and Kaushik, 1990) or anabolic processes like protein synthesis (Brown and Cameron,
1991b; Brown and Cameron, 1991a; Lyndon et al., 1992). The metabolic cost of
tissue anabolism in tuna is also likely to be greater than in most other teleosts, due to
their fast growth rates (Fitzgibbon et al., 2007). The major tissue site of postprandial
catabolism is the liver whilst the majority of tissue anabolism occurs within the white
muscle (Carter and Houlihan, 2001; McCue, 2006). Blood supply to the liver or white
muscle does not pass through retia mirabilia, thus they should not accumulate heat
(Carey et al., 1984; Fudge and Stevens, 1996). However, the ventral surfaces of the
liver of visceral warming tuna species have distinctive patterns of radiating vessels,
which resemble two dimensional heat exchangers (Carey et al., 1984; Fudge and
Stevens, 1996). Although the anatomical functions of these vessels has not been
completely determined, it is hypothesised that they act as crude counter-current heat
exchangers, resulting in a temperature gradient along the liver (Fudge and Stevens,
1996). Indeed, temperature measurements of the livers of freshly killed Atlantic
bluefin displayed a proximal/distal temperature gradient (Carey et al., 1984). Visceral
warming in bluefin tuna may be best explained by a spike of heat production during
the pre- and absorptive stage of SDA which is maintained within the viscera by
efficient retia mirabilia and insulated by a partially warm liver that forms a barrier
between the viscera and the cold heart, kidneys and gills. The finding that peak
postprandial Tvis corresponds to the gut evacuation time in northern bluefin (Carey et
al., 1984) supports this pattern of visceral warming. As the magnitude of pre- and
absorptive stage of SDA is likely to be proportional to absolute SDA, it thus explains
the relationship between visceral warming and SDA recorded in the present study.
Unexpectedly, Tvis excess of fasted SBT was also directly related to MR (Fig.
2B). Elevated visceral temperatures (as great as 6.4oC above water temperature),
were observed immediately after introduction to the respirometer (Fig. 1). As SBT
were starved for between 48 and 72 h before transfers, the source of metabolic heat
was not SDA and thus was unlikely performed within the viscera. Instead, it was
most probably due to metabolic work performed within the red muscle, resulting from
physical exertion and stress associated with capture and transfer. Indeed, muscle
temperatures of Pacific bluefin (13.9- 20.0 kg) have been shown to be greatly elevated
after capture and transmitter attachment (muscle temperature excess greater than
12oC) (Marcinek et al., 2001). Muscle temperatures of blue marlin (Makaira

81
nigricans) and swordfish (Xiphias gladius) have also been observed to be elevated
after release (Carey and Robinson, 1981; Block et al., 1992). High muscle
temperatures likely warmed the viscera through thermal conductance. If proven, this
finding has considerable significance as it demonstrates the potential of thermal
conductance for heat transfer between the muscles and the viscera. As muscle
temperature was not recorded in the present study, it is difficult to determine the
efficiency of heat transfer. The slope of regression between MR (presumed to = heat
production) and Tvis excess of fasted SBT was significantly greater than that for
postprandial fish (20 kg SBT, P <0.01). This suggests that heat produced in the red
muscle is more efficient in warming the viscera than SDA. However, high visceral
temperatures relative to MR of fasted SBT are more likely attributed to the fish being
in a non-steady state of heat transfer, with much of the heat generation occurring
before commencement of experiments (during capture and transfer). Nevertheless,
the high Tvis excess of fasted SBT (maximum 6.4oC), which is only 0.7oC less than
maximum Tvis excess of postprandial fish (7.1oC), does suggest a great potential for
conductive heat transfer between the muscles and the viscera. Interestingly, SBT
swim faster during the SDA period than before feeding (Fitzgibbon et al., 2007),
which suggests that conductance of heat from the muscles may contribute to
postprandial visceral warming.
At any level of heat production (postprandial MR), larger tuna (Mb ∼20 kg)
maintained a Tvis excess over 1oC warmer than smaller fish (Mb ∼10 kg) (Fig. 3B).
However to make a correct comparison, mass scaling of MR needs to be corrected
between trials. When MR is represented independent of mass (assuming a mass
scaling coefficient of 0.88, White and Seymour, 2005), excess temperatures of larger
fish are still over 1oC greater than that of smaller fish. This demonstrates that the
larger SBT have greater heat retention ability. Red muscle retia mirabilia length and
the number of vessel rows in juvenile tuna increase with growth which may improve
efficiency of heat conservation (Funakoshi et al., 1985; Dickson et al., 2000). Larger
tuna also have a lower surface area to volume ratio, thicker belly walls, more
insulating subcutaneous fat, and greater thermal inertia (Graham and Dickson, 2001).
Juvenile Pacific bluefin with fork lengths of 70 cm maintain appreciably greater
visceral excess temperatures than 50 cm specimens (Kitagawa et al., 2001). Heat
budget models suggest that reduced whole body thermal conductance coefficients

82
result in larger bluefin maintaining greater visceral excess temperatures (Kitagawa et
al., 2006). In fact, it is believed that large bluefin need to inhabit cooler waters to
avoid overheating (Kitagawa et al., 2006). Reduced thermal inertia is also likely to
explain why the visceral excess temperatures of smaller SBT (10 kg) were only mildly
affected by MR (Fig. 2B). Greater thermal inertia results in larger tuna warming more
extensive regions of their body (Carey et al., 1971; Linthicum and Carey, 1972; Carey
et al., 1984). Therefore the potential for heat transfer between the muscles and viscera
is likely to increase with mass.
SBT at 16oC maintained visceral excess temperatures significantly warmer
(0.5oC warmer) at any level of heat production (postprandial MR) than similar sized
fish at 19oC (Fig. 3B). This suggests SBT have an ability to control thermal
conductance and thus to physiologically regulate Tvis. The ability of tuna to
physiologically control the heat balance of muscles has been previously recorded. In
tank studies, yellowfin (Thunnus albacares) and skipjack (Katsuwonus pelamis)
muscle excess temperatures were not related to swimming speed (assumed to equal
red muscle heat production) (Dizon et al., 1978; Dizon and Brill, 1979b; Dizon and
Brill, 1979a). Restrained albacore tuna can alter red muscle thermal conductance and
reduce their rate of cooling (Graham and Dickson, 1981). Yellowfin tuna swimming
at constant velocities within a large water tunnel alter their muscle thermal rate
coefficient dependant on both Tw and the magnitude and direction of Tw change
(Dewar et al., 1994). It is hypothesized that this enables yellowfin to suppress heat
loss during descents into cool waters and increase heat gain when back in warmer
surface waters (Dewar et al., 1994), a pattern observed in telemetry studies with
bigeye tuna (Holland et al., 1992). Although the mechanisms involved are not
completely understood, it is likely achieved by modulating blood flow through retia,
thereby adjusting heat-exchange efficiency (Graham and Dickson, 2001). Rete
arterial and venule walls have layers of smooth muscles which may provide a
mechanism to regulate blood flow (Graham and Dickson, 2001). The observed
greater heat retention of SBT at 16oC was probably to maintain preferably warm Tvis.
Long term physiological reductions in thermal conductance coefficients are likely to
be instrumental for the ability of bluefin to maintain prolonged visceral excess
temperatures which have been recorded as high as 15oC for several months (Block et
al., 2005).

83
Postprandial visceral excess temperatures were directly related to metabolic
rate in all trials however, the relationship was dependant on fish mass and water
temperature. This suggests that visceral excess temperatures could be used to
estimate metabolic rate with fish of similar size and water temperatures. As metabolic
rate can be used as a measurement of total energy consumption (through indirect
calorimetry), an estimation of metabolic rate is commonly required for nutritional and
bioenergetic studies. The inherent difficulties of measuring metabolic rate of free-
swimming tuna has meant our current understanding of tuna bioenergetics is restricted
to simplistic models largely based on theoretical energy consumption data (Kitchell et
al., 1978; Korsmeyer et al., 1996). Visceral temperature is comparatively easy to
measure and substantial data sets have been collected for both wild and impounded
bluefin (Gunn and Block, 2001; Gunn et al., 2001). The use of visceral excess
temperature as a correlate of metabolic rate could potentially facilitate significant
advances in the understanding of tuna energy utilization. However, visceral
temperature can only be used as a correlate when the influence of fish mass and water
temperature have been defined. Furthermore, the extreme physical exertion of fish
capture and transfer in the present experiment modified the relationship between
visceral temperature and metabolic rate. Although the uncoupling of the relationship
could be due to a non-steady state of heat transfer, it does suggests that visceral excess
temperature can only be used as a correlate during low routine levels of activity.
It is believed that one advantage of postprandial visceral warming is to speed
the processes of digestion, allowing tuna to eat more when prey is sporadically
available (Carey et al., 1984). This theory is supported by laboratory studies which
found that visceral warming in bluefin tuna results in a threefold increase in the
activity of digestive peptidases (Stevens and McLeese, 1984). The gastric evacuation
rates of SBT (Q. P. Fitzgibbon, unpublished data), yellowfin (Olson and Boggs, 1986)
and black skipjack (Euthynnus lineatus) (Schaefer, 1984) are similarly accelerated
when compared to other teleosts. However, rapid evacuation rates are unlikely to be
the sole consequence of visceral warming as neither of the later two species have
visceral retia and thus are unlikely to exhibit postprandial visceral warming. Further
evidence that visceral warming is not exclusively responsible for the rapid digestion
rate of tuna is offered by Gunn et al. (2001) who found that the time required for SBT
gastric evacuation (assumed to correspond to time to reach peak postprandial Tvis) was
similar in winter as it was in summer despite peak Tvis being 3-4oC lower in winter.

84
These authors hypothesised that SBT maintain digestive rates in winter by positive
thermal compensation through the activation of cold adapted isozymes in the digestive
system (Gunn et al., 2001). It is possible that the primary function of visceral
warming is as an added source of heat to maintain elevated core and muscle
temperatures. The present study indicates that heat generated within the muscle may
be able to warm the viscera through thermal conductance. Therefore it is reasonable
to assume that given the opposite thermal gradient, heat generated within the viscera
would warm the muscles. The ability to accumulate some of the heat by-product of
SDA within the viscera provides an additional source of heat that is not available to
non-visceral warming species. Although it is difficult to establish the magnitude of
this added heat source, it is likely to be substantial. The magnitude of SDA in SBT is
twice that of other fish species examined, attributing to 35% of ingested energy
(Fitzgibbon et al., 2007). Among tuna, the distribution of species capable of warming
the viscera extends further into cooler waters of higher latitudes or greater depths
(Holland et al., 1992; Dagorn et al., 2000; Gunn and Block, 2001; Marcinek et al.,
2001; Schaefer and Fuller, 2002; Musyl et al., 2003). Thus, visceral endothermy is
linked to improved thermoregulatory capability. The timing of visceral heat
production may also be particularly beneficial for maintaining core temperatures
during deep dives below the thermocline. It is widely considered that the purpose of
deep diving of tuna is to forage on deep prey, especially in the deep scattering layer
(Dagorn et al., 2000; Gunn and Block, 2001; Schaefer and Fuller, 2002; Musyl et al.,
2003; Kitagawa et al., 2004). Postprandial visceral warming during these diving
events would provide heat when the thermoregulatory challenge is most severe and
may be critical in allowing tuna to dive deeper and forage longer. Unfortunately there
have been few measurements of the muscle temperature of free swimming tuna and
they have been insufficient in duration and corresponding data to decipher the effects
of feeding-related heat production (Carey and Lawson, 1973; Holland et al., 1992;
Marcinek et al., 2001). In one study the muscle temperature of impounded giant
Atlantic bluefin (>400 kg) were compared to the Tvis of another tuna within the same
pound (Stevens et al., 2000). Apart from immediately following ingestion of partially
frozen baitfish (when Tvis fell dramatically) Tvis exceeded muscle temperature by 4 to
5oC. Therefore, assuming thermal conductance between the tissues, accumulated heat
within the viscera would have warmed the muscles. However in that study,
fluctuations in Tvis were not reflected in the muscle which remained at a relatively
85
constant temperature (Stevens et al., 2000). This led these authors to propose that
giant bluefin actively regulate muscle temperature. Further to altering rete efficiency,
bluefin may be able to regulate muscle temperature by increasing relative blood flow
via the dorsal aorta (carrying cool blood to the red muscle) and the lateral arteries
(Graham and Dickson, 2001). However, the stability of muscle temperature could
also be attributed to the great thermal inertia of these very large animals. Clearly
more data with a range of fish sizes is required to evaluate the relationship between
heat accumulated within the viscera and muscles.

86
Chapter 5: Heart rate of free-swimming southern bluefin tuna (Thunnus maccoyii).
Abstract Obtaining accurate estimates of energy expenditure in freely swimming aquacultured
tuna would enable the costs of various activities and behaviours to be determined and
the subsequent adoption of optimal farming practices. The measurement of heart rate
and the use of the Fick equation, with appropriate calibration, is one approach that can
be used to estimate the rate of oxygen consumption, equivalent to aerobic energy
expenditure, in freely moving animals. The purpose of this study was to test whether
an appropriately modified archival tag that was capable of measuring heart rate and
visceral temperature every fifteen minutes was suitable for use in tuna. The archival
tag was successfully implanted into eleven tuna for an experimental period of 40 days.
Measurements of heart rate and visceral temperature thus obtained demonstrated that
the archival tag technology was able to reliably detect and record heart beat traces in
tuna. Further, by noting the size of various meals during feeding bouts, it is clear that
heart rate varied in accordance with the specific dynamic action associated with
digestion. With appropriate calibration, an archival heart rate tag can provide
energetic data that can be used in bio-energetic models to improve farming practices
and optimise feeding regimes.
Introduction
Since the farming of tuna has recently become a reality throughout the world, there is
a need to understand the physiology of these animals if we are to improve their
survival and maximise growth performance under aquaculture conditions. Measuring
the heart rate of an animal can provide information on the physiology, health, stress
levels, and water quality conditions that fish experience (Davison et al., 1995; Schreer
et al., 2001). The main difficulty with measuring heart rate in fish is that the fish
usually must be tethered to a recording device, or they must be restricted to a confined
area where it is possible to measure the electrical signals from the heart (Thorarensen
et al., 1996). The primary aim of this component of the project was to customise an
implantable heart rate and temperature archival tag such that we could measure heart

87
rate and visceral temperature in free-swimming southern bluefin tuna (SBT) under
typical aquaculture conditions.
Heart rate is closely related to energy expenditure in most vertebrates in
accordance with the Fick equation for the cardiovascular system:
EE = HR * SV * OE,
where EE = energy expenditure, HR = heart rate, SV = stroke volume of the heart,
and OE = oxygen extraction at the tissues. If stroke volume and oxygen extraction
remain constant or vary in a systematic manner with energy expenditure, then it
should be possible to accurately predict energy expenditure from measurements of
heart rate (Priede and Tytler, 1977). An additional aim of this project, therefore, was
to determine if heart rate in tuna was an appropriate variable to correlate with energy
expenditure.
Methods Experimental Animals
Early trials to determine the validity of using an archival heart rate tag in southern
bluefin tuna (SBT) were undertaken in 2005/06. These trials were limited and
primarily led to improvements in the surgical implantation of the tag and appropriate
modification of an existing archival tag design (e.g., lead length, shape, coating,
amplification gain and heart rate sensor improvements) to make it suitable for use in
tuna. Final, though still preliminary, trials were conducted with SBT in April and
May 2007, the fish being sourced through the Tuna Boat Owners Association of
South Australia. These fish had been captured using a purse-seine net from wild
schools in the Great Australian Bight and had been in a commercial farm for 2-3
months. Individual fish were hooked with a baited, barb-less hook and transferred
into a 12 m diameter, 8 m deep holding sea-cage that was moored in a protected bay
at the southern end of Boston Island, where all trials were conducted. Fish were left
to recover from transfer for 2 weeks during which time they were fed Australian
sardines (Sardinops sagax) twice per day to satiation.
Archival tag

88
The archival tag (designed in-house, La Trobe University) comprises a double sided
printed circuit board with an inbuilt temperature sensor (calibrated in the laboratory in
a water bath accurate to 0.1oC). Heart rate is detected from the ballistic shock wave
mechanically propagated through the body from the heart with each
contraction. While the heart rate varies with metabolic rate, the waveform of the
contraction remains essentially constant making detection potentially more reliable
than an electrocardiogram (ecg), which can be contaminated with electromyograms
(emg). This acoustic signal is detected with a small microphone, appropriately
amplified and filtered, which extracts the key waveforms. Each 15 minutes a 12
second waveform, sampled at 200 Hz, is stored in non-volatile memory. Each record
has a time and data stamp from an on-board, real time clock. The current model is 38
mm x 12 mm x 20 mm, and weighs ~ 25 g.
Surgical Procedure
Fish were removed from the holding cage by hook, inverted, placed into a padded
cradle and a wet cloth put over the eyes to aid with settling. A 5-8 cm incision into
the belly wall along the ventral midline approximately 10-12 cm anterior to the vent
was made with a sharp knife and the peritoneum perforated. A sterilised (Aidal Plus,
www.whiteley.com.au) archival tag (modified from Woakes et al. 1995, for
construction) was implanted so that the electrode lead passed along the abdominal
wall above the liver and was positioned close to the heart. Prior to closure of the
wound with two stitches (Vicryl suture, Ethicon, www.ethicon.com) a 2.5 ml dose of
broad spectrum antibiotic (Amoxil, GlaxoSmithKline, www.gsk.com) was injected
into the opening. The fish was then released, the entire process taking ∼2 minutes.
Following implantation of the archival tag the fish were left to recover until they
began normal feeding behaviours (~3 d).
General Protocol
Twelve SBT were implanted with archival heart rate and temperature tags, with 11
fish surviving the full experimental period. In general, fish were fed once per day, or

89
sometimes a day was skipped to allow complete digestion of large meals (>6% body
mass in a single feed). Ration size per meal varied, but was maximally about 7-8% of
body weight in a single feed. The number of Australian sardines eaten per feeding
bout, and hence mass of food consumed, was not always reliably determined. Meal
size was regulated throughout the experiment to induce varying digestive challenges,
but with an aim to satisfy daily nutritional requirements. At the end of the experiment,
40 days after implantation of the archival tag, fish were harvested and their archival
tags removed.
Data Analysis
Data for heart rate and visceral temperature were read from each tag with a
customised interface (La Trobe University), stored as a CSV file and imported, with
corresponding dates and times, into Chart (ADInstruments, Australia) for appropriate
waveform analysis. Time to reach the peak of digestion was considered as the time
interval between the feeding bout and when visceral temperature reached its highest
point during that digestive period. Time to complete digestion was considered as the
time interval between the feeding bout and when visceral temperature returned to
within 0.3oC of its value 3 h prior to feeding.
Results After implantation of a data logger and release back into the water, the heart rate of
each tuna was typically around the maximum attainable level (see Fig. 1). Heart rate
rapidly decreased after logger implantation, to reach values around 40 beats min-1, and
then some fish required another 24 hours for heart rate to stabilise at a value around
50 – 60 beats min-1 (Fig. 1). These values for ‘resting’ heart rates are lower than was
previously thought to be achievable in tuna (Brill and Bushnell, 2001), which is
evidence that this approach to measuring heart rate provides unstressed values and is
an advance on previously trialled methods.
Feeding bouts were characterised by rapid increases in heart rate due to
activity, and rapid decreases in visceral temperature due to the feed (thawed sardines)
being cooler than the visceral cavity (Fig. 1; Table 1). Following the feeding bout,

90
visceral temperature increased for a length of time that was closely associated with
feed ration size (Fig. 2). That is, a small ration such as 2% of body mass resulted in a
relatively short period of increased visceral temperature (12 h), whereas a large ration
such as 7% of body mass caused visceral temperature to remain elevated for twice the
period of time (24 h).
Heart rate declined gradually following its increase during the feeding bout,
but it never returned to resting levels during the digestive period (Table 1). Instead,
heart rate followed a similar profile to the visceral temperature trace, remaining
elevated for the duration of the digestive period. This provides evidence that the
increase in energy expenditure during digestion (specific dynamic action) in tuna is
largely correlated to, and probably modulated by, increases in heart rate. Although all
fish had a higher heart rate at the peak of digestion than prior to feeding, those fish
that had relatively high heart rates prior to feeding maintained high heart rates
throughout the digestive period (Fig. 3). This highlights the inter-individual variation
in routine heart rate, yet the consistent increase during digestion.
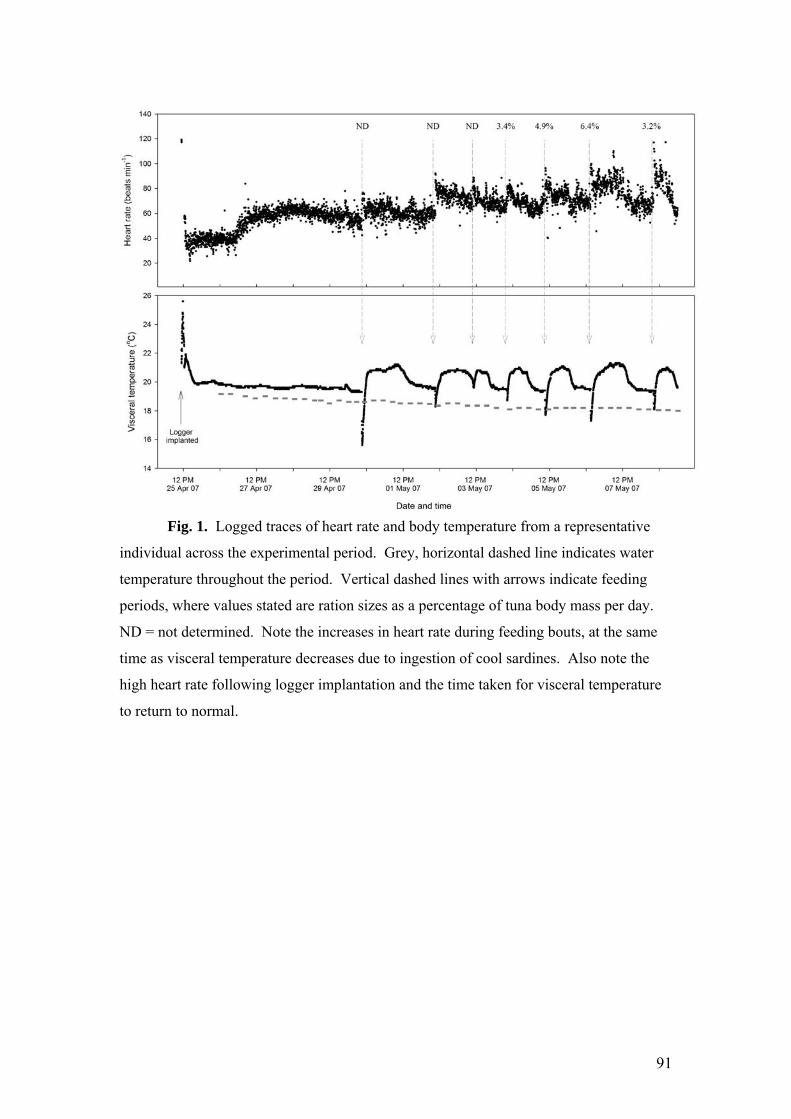
91
Fig. 1. Logged traces of heart rate and body temperature from a representative
individual across the experimental period. Grey, horizontal dashed line indicates water
temperature throughout the period. Vertical dashed lines with arrows indicate feeding
periods, where values stated are ration sizes as a percentage of tuna body mass per day.
ND = not determined. Note the increases in heart rate during feeding bouts, at the same
time as visceral temperature decreases due to ingestion of cool sardines. Also note the
high heart rate following logger implantation and the time taken for visceral temperature
to return to normal.

92
Fig. 2. Effects of ration size on digestive period. Digestion was considered complete
when visceral temperature returned to within 0.3oC of what it was three hours prior to
feeding. Time to complete digestion correlates strongly with feed ration size.

93
Table 1. Visceral temperature (TV) and heart rate (HR) in SBT prior to feeding,
during feeding and digestion. Values are means, with standard deviations in
parentheses. Ration size (% body mass)
N 3 h prior to feed At feed At digestion peak After feed
TV HR TV HR TV HR TV HR 3 – 4 7 19.7
(0.3) 58.1
(14.4) 19.1 (0.8)
90.1 (15.8)
22.6 (1.7)
76.6 (14.1)
20.0 (0.3)
48.8 (13.8)
4 – 5 7 19.6 (0.3)
57.1 (10.8)
18.3 (0.9)
100.4 (12.6)
22.1 (0.7)
87.8 (19.4)
19.9 (0.3)
54.1 (12.1)
5 – 6 6 20.1 (0.4)
53.3 (17.9)
18.9 (0.9)
84.4 (29.6)
23.2 (0.8)
87.7 (27.7)
20.4 (0.4)
56.3 (24.3)
6 – 7 10 20.1 (0.4)
55.8 (19.7)
18.3 (1.0)
93.0 (18.7)
22.4 (1.1)
87.6 (21.0)
20.4 (0.4)
56.0 (15.0)
Discussion
Archival heart rate and temperature tags can be successfully implanted into SBT and
record useful data. The rate of oxygen consumption, hence heart rate (as dictated by
the Fick equation), in SBT was varied by specific dynamic action, achieved through
altered meal sizes. Changes in heart rate in SBT correlated with changes in meal size.
A similar finding was recently reported for Antarctic notothenioid fishes (Egginton et
al., 2006). Other researchers (see Webber et al., 1998) have shown in fish that cardiac
output has a better correlation with the rate of oxygen consumption than heart rate.
However, another study revealed that cardiac output provided almost no advantage
over heart rate as a predictor of metabolic rate due to the variability around the
regression lines between cardiac output and the rate of oxygen consumption (Brodeur
et al., 2001). Furthermore, tuna hearts have a high proportion of compact
myocardium that seems to reduce compliance and limit stroke volume, thus resulting
in modulation of cardiac output by changes in heart rate with a relatively constant
stroke volume. Together, with the more invasive nature of the measurement of
cardiac output, it suggests that heart rate in fish, particularly tuna, is a valid method to
predict metabolic rate. Indeed, the use of heart rate as a reliable predictor of
metabolic rate in free living animals has been demonstrated numerous times (see
Butler et al., 2004 for review). The use of an archival heart rate tag (or possibly in the
future real time transmission of heart rate data) will enable more accurate estimates to

94
be made of the activity, feeding activity and various behaviours of free-swimming
SBT, thereby strengthening bioenergetic models for this fish. Nevertheless, before
this can be achieved a robust calibration of heart rate and the rate of oxygen
consumption needs to be determined for SBT in a respirometer with a resolution that
permits appropriate activities, such as sustained or burst swimming and digestion, to
be distinguished.
Fig. 3. Heart rates at the peak of digestion (determined from visceral temperature
trace) as a function of heart rates prior to feeding. A high heart rate prior to the feed
was correlated with a high heart rate at the peak of digestion.
While it has been demonstrated (see Chapter 3, this report) that moderate to
severe hypoxia appears to have no short-term effect in SBT on basal maintenance,
routine swimming and specific dynamic action, this is somewhat surprising given the
high aerobic scope of SBT. Nevertheless, this tolerance could be, as we suggest,
because the adaptations which support the large aerobic scope of tuna are also of
benefit for oxygen extraction and delivery under conditions of hypoxia. It is

95
interesting that in juvenile cod (Gadus morhua) a contrasting situation exists, hypoxia
depressed the peaks of specific dynamic action and subsequently lengthened the
duration of the postprandial increase in metabolic rate (Jordan and Steffensen, 2007).
Further, the peaks associated with specific dynamic action substantially reduced the
aerobic scope in hypoxia in juvenile cod, hence leaving little energy for other
activities (Jordan and Steffensen, 2007).
Behaviour of wild SBT can involve rapid changes in energy needs and
environmental factors, such as the levels of oxygen or water temperature (by diving to
considerable depths whilst feeding), which can affect metabolic demand on a fine
time scale. It is therefore not possible to fully explore the metabolic characteristics of
this species by direct measurement of respiration in a mesocosm, nor by using
measurements of visceral temperature alone. In fact, as tuna increase in body mass,
heat increments of feeding are more difficult to decipher because relative meal sizes
are generally less than in smaller individuals. Although heart rate archival tags offer
potential to measure fine-scale metabolic characteristics, as they can differentiate
rapid changes in metabolic rate in the short term, a calibration must be achieved
between heart rate and metabolic rate. This is suggested to be the highest priority for
further research in this area.

96
Chapter 6: Nitrogen balance and protein synthesis in southern bluefin tuna (Thunnus maccoyii) Abstract
The nitrogen balance and ammonia excretion post feeding was examined for two
groups of southern bluefin tuna (SBT). Attempts were also made to measure the rate
of protein synthesis but these were unsuccessful. A group of 2 (first experiment) or 3
(second experiment) SBT in the mesocosm was fed known amounts of sardines, each
labelled with N15 algae (by incorporating label in capsules gelatine capsules inserted
into the sardine body cavity), and the water was sampled for 48 h following feeding to
measure ammonia and nitrogen excretion. Results demonstrated that SBT had a
negative nitrogen balance over 48 h following a feed intake of approximately 4% of
their body mass in sardines, that is an intake of 4% body mass was insufficient to
meet the SBT protein requirement. The measured ammonia excretion rates of 811 and
448 mg N kg-1day-1 were considerably higher than those recorded for other fish
species.
Introduction
Protein metabolism is a large energetic cost for animals, and in feeding fish it
accounts for a significant proportion of observed specific dynamic action (SDA), or
heat increment. In southern bluefin tuna (SBT, Thunnus maccoyii) protein metabolism
has not been previously investigated, as this species is large and highly active, and
relatively difficult to handle. The reported feed conversion ratio (FCR) for this species,
which exceeds 12:1 (Fernandes et al 2007), indicates a very low retention of protein
for baitfish diets that are typically 16-20% crude protein on a wet basis (Buchanan
2007).
A less-invasive technique for measuring protein synthesis is the use of stable
isotopes (Carter et al 1994) . Briefly, this method involves measuring the amount of
protein that is retained by the animal from a particular feed over a defined period, to
calculate the rate of synthesis. This is achieved by feeding a known dose of protein
labelled with the stable isotope N15, and measuring the difference between the
ingested dose (adjusted for protein digestibility) and the quantum that appears in
excreted ammonia and urea. Protein nitrogen that is not accounted for in excretion is

97
assumed to be incorporated into the animal’s protein. The stable isotope method
requires collection of the nitrogenous excretions of the fish, considered to be feasible
using a mesocosm. A study of nitrogen balance and protein synthesis was
opportunistically included with the SDA mesocosm experiments. This study aimed to
examine the nitrogen balance of SBT over a 48 h period, and measure the rate of
protein synthesis over a single feeding event.
Methods
Measurements were conducted in the tuna metabolism mesocosm (see
Fitzgibbon et al., 2007 for detailed description). Live SBT were transferred into the
mesocosm and maintained on a baitfish diet for approximately one week. Tuna in
Experiment 1 (12/5/2006) had a weight of 20.94±2.18kg (mean±SE n=2) and those in
Experiment 2 (22/05/2006) 20.43±1.26 kg (n=3). These SBT were fasted for 48 h
before the protein synthesis experiment, and then fed a known meal of sardines
labelled with N15. Water samples were then taken from within the mesocosm 6-hourly
for the following 48 h.
Feed Preparation and Feeding
As the SBT used in the mesocosm trials were not adapted to pelleted feeds,
the label was incorporated into the base feed (high-lipid sardines, Sardinops sagax —
see chapter 2 for composition). The label used for the study was enriched ‘Spirulina
mass’ powder + 98% N15 (crude protein 60%.) (Spectra Gases, New York), and it was
incorporated into pre-weighed sardine using gelatine capsules (1.37 ml, Tyco Health
Care, Sydney). The enriched Spirulina powder was pre-weighed on shore into the
gelatine capsules (0.450 g per capsule in experiment 1 and 0.435 g per capsule in
experiment 2). Immediately before inserting the capsules into the sardines, a small
volume of sea water (approximately 0.25 ml) was injected into each capsule with a 1
mL disposable syringe (to remove the buoyancy effects of excess air). A small knife
was inserted through the mouth of each sardine to open the stomach into the body
cavity of the fish, and two capsules were inserted by hand through the mouth and
placed in the centre of the body cavity. Capsules maintained integrity for at least 40
min after immersion in seawater, ensuring the full dose of labelled product was
consumed by the SBT without loss to water.

98
SBT in the mesocosm were offered pre-weighed labelled sardines and
unconsumed sardines were collected from the bottom of the mesocosm at the end of
the feeding period, to calculate intake. The chamber was then sealed.
Seawater was collected immediately after feeding and again every 6 h for 48 h
after feeding. All seawater samples were collected using a 10 mm tube connected to
the mesocosm through a surface port located in the centre of the mesocosm, with the
opening of the tube approximately 60 cm below the surface of the mesocosm.
Seawater was pumped out using a small electric diaphragm pump. On each occasion
the pump was first run for approximately 3 min to clear any residual water from the
sample line, and then four 2 L HDPE bottles were then filled, sealed, placed on ice,
transferred to a freezer, and stored until analysis of N15 content. In addition, a further
two 2 L jugs were filled, and each of these samples was filtered with a 0.45 μm pre-
filter and sub samples transferred to two 50 mL HDPE bottles. These were also placed
on ice and frozen. Total dissolved nitrogen (TDN) and total ammonia nitrogen (TAN)
were measured at the Water Studies Centre of Monash University’s Science Faculty,
in Clayton, Victoria. Ammonia and total nitrogen excretion (TNE) was calculated as
final concentration minus initial concentration, multiplied by mesocosm volume
(400,000 L for both experiments, volume calculated by the time required to fill the
mesocosm using calibrated pumps).
Ammonia nitrogen isotope measurements were collected from the 2L sample
bottles using acidified fibre glass filter packs according to the methods of Holmes et
al. (1998), with the incubation volume increased from 50 mL to 450 mL of water to
compensate for the lower ammonia concentrations. Filters containing the ammonia
were submitted to the CSIRO Land and Water Laboratory for mass-spectroscopy
measurement of isotope levels.
Protein synthesis was calculated by the method of Carter et al. (1994). Briefly,
fish were fed a known dose of N15 labelled protein, and all dissolved nitrogenous
waste was collected for 48 h following this to measure the proportion of the dose that
appeared in the nitrogenous excretions. The difference between the fed dose
(corrected for digestibility) and the amount of dissolved nitrogen as measured to be
excreted is assumed to be incorporated into the protein of the fish. This is calculated
as follows:
Incorporated protein = Initial dose – (final [NH3]*[N15] – initial [NH3]* [N15]) Initial dose

99
Results
Labelled sardines were consumed by SBT, but feed intakes were considerably
lower than expected, and corresponded to 4% body mass (%Mb) (Table 1). These
were only about half the intakes achieved in mesocosm experiments in previous years
(Chapter 1). Given the higher mesocosm volume than in previous seasons (400,000L
vs 250,000L), this resulted in lower-than-expected ammonia concentrations.
Ammonia and TDN increased in the mesocosm after feeding; the greatest increase in
ammonia and TDN was between 6 and 30 h post feeding (Figures 1 and 2). However,
a large rise in total nitrogen was observed during the final 6 h of Experiment 2, but
not in Experiment 1.
TNE measured for the two 48 h periods (Table 2) exceeded protein nitrogen
consumed in feed for both feeding events (Table 1). This indicates that SBT were in
negative nitrogen balance over the period of measurement and feed intakes (~4%BW
in 48h) were not high enough to meet metabolic requirements. The level of nitrogen
ammonia excretion (mg N/kg SBT BW) measured for the 48 h period was 812 mg kg-
1day-1 for the first experiment, and 448 mg kg-1 day-1 for the second experiment.
Fig. 1. Measured water nitrogen concentration in mesocosm following feeding
experiment 1.
2D Graph 1
Hours post-feeding
0 10 20 30 40 50
Nitr
ogen
mgL
-1
0.4
0.6
0.8
1.0
1.2
Total N Ammonia N

100
Fig. 2. Measured water nitrogen concentration in mesocosm following feeding -
experiment 2.
The N15 component of the TAN, and thus the protein synthesis rate, has not
been measured successfully to date, since concentrations were below detection limits.
Further samples are undergoing analysis.
Table 1 Feed intake of SBT in experiment on an as-fed basis. Digestible nitrogen is assumed to be 90%, based on previous studies SBT studies (Van Barneveld et al, in preparation). Date SBT
intake %BW day-1
Mass (kg) of sardines
Number of sardines
Spirulina powder (g)
Crude protein consumed (g)
Nitrogen consumed (g) (digestible N, 90%)
10/05/06 4.0 1.68 21 18.9 287 45.92 (42.33)
20/05/06 3.9 2.42 28 24.36 414 66.24 (59.61)
2D Graph 5
Hours post-feeding
0 10 20 30 40 50
Nitr
ogen
mgL
-1
0.4
0.6
0.8
1.0
1.2
1.4
1.6
Total N Ammonia N

101
Table 2 Nitrogen flux in mesocosm following excretion of nitrogen. Total Dissolved Nitrogen Ammonia Nitrogen Date Initial
mgL-1 Final mgL-1
Difference mgL-1
g N Initial mgL-1
Final mgL-1
Difference mgL-1
g N
12/5/06 0.68 0.91 0.23 92 0.47 0.64 0.17 68
22/5/06 0.87 1.4 0.53 212 0.63 0.77 0.14 55
Discussion The data indicate that total nitrogen balances were strongly negative for both feeding
events, and SBT were in significant nitrogen deficit over the 48 h period. Despite the
significant amount of nitrogen consumed, this is not particularly surprising, since the
energetic studies in this project have shown that SBT at an intake of 4 %Mb for a 48 h
period were at less than maintenance level. Energy maintenance is estimated to be
close to 7 %Mb for this 48h period (3.5 %Mb day-1, Chapter 1). The negative nitrogen
balance at a time of energy deficit strongly suggests that SBT were utilising body
protein as an energy source.
The ammonia excretion rates of 811 and 448 mg N kg-1day-1 for the SBT in
this experiment are higher than those reported for other species. For example, sea bass
produced 150 to 400 mg N kg-1day-1 when fasted or fed 1.5 %Mb day-1 at 25°C (Peres
and Oliva-Teles 2005), and rainbow trout produced 110 to 211 mg N kg-1day-1 when
fasted or fed 3 %Mb day-1 (respectively), at 11°C (Kajimura et al. 2004). Similarly,
the rate of excretion of ammonia in Atlantic halibut at 12°C ranged from 80 to 120 mg
N kg-1day-1 for the 48 h following a single feeding event (Fraser et al 1998). The
higher nitrogen metabolism measured in this study is also to be expected given the
relatively high metabolic rate of SBT (Fitzgibbon et al., 2007) and is consistent with
the relatively low nitrogen retention estimate from mass balance of tuna farms
(Fernandes et al 2007).
Ammonia excretion was the dominant form of nitrogen loss in SBT, especially
up to 42 h after feeding. In the first experiment the increase in TDN (excluding
ammonia) was approximately one third of the ammonia nitrogen. In the second
experiment, the results were less clear, in that a large increase in total dissolved
nitrogen was measured 42 h after feeding. This unexpected result is difficult to
interpret. It may, for example, indicate that nitrogen excreted into the seawater in the

102
mesocosm had not diffused evenly throughout the mesocosm to reach equilibrium
point at that time of sampling.
The use of the sealed mesocosm in this study placed some important
constraints on the methodology, as it was possible to sample only a relatively small
volume from a single point. As a consequence, an assumption of this study is that
seawater in the mesocosm is homogeneous at all times. This assumption is consistent
with the results of other metabolic experiments, which showed that the oxygen level
throughout the mesocosm varied little (chapter 1), suggesting good water mixing. In
the present study, by contrast, variation between measures of nitrogen in duplicate
water samples was relatively high, and this suggests that mixing is in fact less uniform
than expected. This indicates that absolute values of nitrogen should be treated
cautiously, as the large volume of the mesocosm will exacerbate any errors in
concentration measurement.
Another constraint of the mesocosm was that faecal matter could not be
removed during the experiment. For the purposes of these experiments, it was
assumed that any faecal nitrogen remained suspended in the mesocosm in organic
form. Tuna faeces contain less than 5% of their nitrogen in ammonia form and
negligible nitrate and nitrite (Fernandes et al. 2007), and any microbial oxidation of
faecal protein would make a relatively small contribution to total ammonia production
relative to the ration size, given the high digestibility of the diet and the short
experimental time-frame.
A further constraint with the design was that it was not possible to remove
phytoplankton from the system, and any uptake of nitrogen by phytoplankton might
have led to an underestimation of excretion rates. However given the limited access to
light in the mesocosm and that the nitrogen balance measurements were conducted
when the tuna had been in the mesocosm for over a week, it is unlikely that
phytoplankton were absorbing significant amounts of nitrogen.
The apparent relatively high rates of ammonia excretion by these fish are
consistent with their high overall metabolic rate. The negative nitrogen balance at 4%
body weight intake (over 48 hours) is also supportive of the finding that, based on
oxygen consumption, maintenance requirements of SBT are above 3.5% body weight
per day for sardines.
However, given these limitations, and the small sample size (n=2), this first
indication of the nitrogen excretion rates of SBT needs to be treated with caution.

103
BENEFITS AND ADOPTION This study greatly expands our knowledge of SBT physiology. Applications of this
knowledge are numerous for the managers and researchers of both the aquaculture
and wild fisheries.
Farm managers now have a much better understanding of the oxygen demands
of their fish in aquaculture. In particular this project has been successful in defining
the effects of feeding on the oxygen consumption rate of free swimming tuna. This
information can be used to estimate farm scale oxygen requirements and has been
incorporated into the Oxytuna tuna model (Aquafin CRC 2003/226). This model aids
farm managers to make husbandry decisions, such as when and how much to feed, to
ensure sufficient oxygen availability dependant of the prevailing oxygen supply (i.e.
tidal flow rate). Increased knowledge of tuna oxygen demands has facilitated a better
understanding of the environmental impact of tuna farms and in turn farm site
carrying capacities.
This study defined the short-term lethal limits of, and physiological and
behavioural response of southern bluefin tuna to, low dissolved oxygen. This,
combined with the improved information on tuna oxygen demands, provides the
aquaculture industry with the knowledge necessary to ensure fish health and maximise
farm productivity. For example, this project has demonstrated that dissolved oxygen
levels below 60% saturation will cause significant reductions in productivity due to
increased costs of ventilation (faster swimming) and below 30% saturation will cause
mortality. A better understanding of tuna oxygen requirements may also better equip
industry to identify the causative agents for unexplained SBT mortality that is thought
to be stress related.
This study has significantly improved the understanding of southern bluefin
tuna energy and nutritional requirements. Data from these trials have already been
adopted by the southern bluefin nutrition program (Aquafin CRC 2001/249) and
incorporated into bioenergetic models which have aided interpretation of previous
nutritional trials. The finding that visceral warming in southern bluefin tuna is
directly related to metabolic rate, potentially has profound implications for further
bioenergetic studies. This easily measured correlate for metabolic rate could facilitate
more comprehensive bioenergetic studies that greatly enhance our understanding of
farmed SBT nutritional requirements. Greater nutritional understanding will improve

104
aquaculture productivity, efficiency, enhance product quality and reduce nutrient
release into the environment.
The combination of visceral temperature and heart rate data (together with an
indicator of activity when incorporated in the archival tag) should provide precise and
accurate predictions of the energetic requirements of tuna. Further, given that heart
rate is sensitive to hypoxia monitoring, heart rate and activity will permit better
comprehension of the effects and critical levels of falling oxygen levels in the water.
Such data will permit farming practices that optimize feeding regimes and
environmental conditions in which to raise fish. Ultimately, the use of ‘tagged’ SBT
carrying implants that measure physiological variables, coupled with real-time
transmission of the data, could act as bio-monitors of the conditions being
experienced by the fish and enable real-time decisions that govern farm management.
In addition, we will be able to monitor the physiological impact on individual fish
when harvested and assist with the development of improved practices, policies and
standards to enhance the quality of the product for market.
FURTHER DEVELOPMENTS
This project has further demonstrated the value of the mesocosm respirometer as a
tuna research tool. The mesocosm could be used to achieve further research
objectives which require tuna to be maintained within a sealed environment.
It is clear that high protein turnover rates associated with their fast growth rate
distinguish tuna from other cultured fish taxa. Further mesocosm studies of tuna
protein turnover would be particularly beneficial for our understanding of tuna
nutrition.
The mesocosm could also be used for screening newly-developed
manufactured diets. By measuring metabolic and protein synthesis rates of
postprandial SBT it would provide great insight, rapidly, into the energy utilization of
manufactured diets.
The finding that SBT visceral warming is related to metabolic rate provides a
method for a closer examination of SBT energy usage. Further feeding trials with
archival tagged SBT may allow comprehensive bioenergetic modelling, in
commercial sized cages and at commercial stocking densities.

105
The archival tags and analytical techniques are continually being improved by
the research group at La Trobe University, and future loggers are already being
developed with pressure/depth sensors and accelerometers for detecting motion,
together with the ability to transmit the data in real-time. For a truly robust
bioenergetic model, future endeavours should aim to quantify the relationship
between heart rate and energy expenditure (measured through the rate of oxygen
consumption) in SBT, using some form of swimming respirometer. Unfortunately, a
large mesocosm respirometer has a poor resolution of short-term changes in
respiration that would be necessary to correlate with short-term changes in heart rate.
PLANNED OUTCOMES
The planned outcomes of this project were to increase the productivity, prevent
mortality and reduce the environmental impact of SBT aquaculture. This was to be
achieved through the outputs of:
• Knowledge to better understand tuna metabolic physiology and energetics.
• Processes and technologies related to improved husbandry and feeding types
or strategies.
• Knowledge to increase certainty of critical limits.
Knowledge of physiology and energetics
This project has greatly improved the knowledge of physiology and energetics of SBT
and tuna in general. Some notable achievements include:
• First measurement of the postprandial metabolic rates of a tuna species.
• First measurement of the energetic costs of food digestion and assimilation
(specific dynamic action) in a tuna species.
• First examination of the physiological and behavioural response of bluefin
tuna to low dissolved oxygen.
• First measurements of the lethal limits of low dissolved oxygen of a bluefin
tuna.
• First examination of the relationship between tuna visceral warming and
metabolic rate.
• First measurement of the heart rate of a free swimming tuna.

106
This knowledge has been released to the southern bluefin tuna aquaculture
industry through direct contact with industry companies; presentations at SBT
Aquaculture Subprogram and Aquafin CRC conferences, workshops and meetings;
and Tuna-brief news articles. It has also been made available to the public and
international scientific community through media releases (Port Lincoln Times news
articles, PIRSA Open Gate news article, FRDC newsletter articles, ABC local radio
interviews); peer reviewed journal publication (one published and a further four either
submitted or in preparation), and the production of a PhD thesis by Mr Q. P.
Fitzgibbon, that has been accepted.
Processes and technology
The project has provided metabolic data that have been incorporated in bioenergetic
models that improve our understanding of the energy and nutritional requirements of
farmed southern bluefin tuna. With further development by the nutrition program,
these models have the potential to be used to better formulate baitfish and/or
formulated diet matrices that deliver optimal nutritional value, and to improve our
understanding of feed conversion ratios and the effects of differing feeding strategies.
Data from the project have been incorporated into farm oxygen demand models,
providing the industry with a useful farm management tool to ensure fish health and
maximize productivity. Data have also been incorporated into environmental impact
models which are beneficial for industry sustainability and public perceptions of this
commercially important activity.
An implantable archival heart rate and temperature tag was customised and
demonstrated to work in southern bluefin tuna. Heart rate is potentially an excellent
correlate of energetics in southern bluefin tuna as it is modulated in response to
feeding, digestion, temperature and activity; all of which can be incorporated into a
multi-factorial model to improve accuracy. To be truly useful in a bioenergetic model,
heart rate will require calibration with more direct measurements of changes in energy
expenditure (measured by oxygen consumption in an appropriately designed
respirometer.
Knowledge of critical limits

107
The project has not only been successful in defining the critical limit of dissolved
oxygen but also the physiological and behavioural responses of southern bluefin tuna
to non-lethal levels of hypoxia.
CRC contract outcomes
The project has very successfully addressed the relevant Commonwealth Agreement
outcome of Aquafin CRC, namely “Better understanding of activity metabolism and
physiology of tuna, leading to improved husbandry, especially when holding through
more than one season” by discovering much new information about tuna metabolism,
integrating it into a coherent form and providing tools both for future research and for
monitoring the state of tuna in the farming context.
CONCLUSION Although the objectives of the project could be considered highly ambitious, the
project was successful in achieving nearly all goals. The objectives and the extent
that each was met are as follows:
Objective 1. To examine the metabolic cost of specific dynamic action in SBT
The project was successful in making the first recordings energetic cost of food
digestion and assimilation of a tuna species. In total, 19 recordings of the metabolic
cost of specific dynamic action induced by the ingestion of sardines with both high
and low lipid content were made. It was found that energetic cost of food processing
is twice that recorded for any other fish species, attributing to 35% of total ingested
energy, regardless of the lipid/energy content of the baitfish ingested. These
measurements offer a significant advancement in our understanding of tuna energetics,
and have been internationally recognised. It is hypothesized that this high cost of
food processing does not necessarily mean tuna are less efficient at processing food
but is rather representative of their fast growth rates.
Objective 2. To determine the relationship between visceral warming and metabolic
rate associated to specific dynamic action in SBT
The project was successful in obtaining 768 h of simultaneous recordings of
metabolic rate and visceral temperature of both fasted and postprandial southern

108
bluefin tuna of two sizes (∼10 and 20 kg) and at two water temperatures (∼19 and
16oC). It was found that postprandial visceral warming was directly related to
metabolic rate. However, the relationship was dependent on SBT mass and water
temperature. A difference in warming capacity with fish mass and water temperature
is likely due to changes in thermal inertia, heat retention efficiency and is evidence of
some degree of physiological control of warming. These results suggest that visceral
excess temperatures could be used to estimate metabolic rate with fish of similar size
and water temperatures. Thus, visceral temperature could be a useful tool for studies
of nutritional requirements of SBT.
Objective 3. To assess the metabolic cost and behavioral responses of SBT to hypoxia
The project examined the metabolic and behavioral responses of SBT to four levels of
hypoxia, ~60, 40, 30 and 20% dissolved oxygen saturation. It was found that above
the critical limit, SBT respond by increasing swimming velocity presumably to
facilitate increased ventilation or possibly as an escape response. The increase in
swimming velocity was coupled with an increase in metabolic rate. This
demonstrates that hypoxia will decrease growth productivity by increasing the energy
demand for locomotion.
Objective 4. To evaluate the critical limits of dissolved oxygen for SBT
It was found that the critical dissolved oxygen level for ∼20 kg SBT was between 1.5
and 2.5 mg l-1. Feeding did not significantly influence their tolerance to hypoxia and
they even maintained digestion at dissolved oxygen levels below 40% saturation.
This demonstrates that SBT are surprisingly well adapted to low dissolved oxygen. It
is thought that their hypoxia tolerance is representative of physiological adaptations
that support their great metabolic scopes such as large gill surface area and enhanced
cardio-respiratory capabilities. These results suggest that acute hypoxia is unlikely to
be responsible for mortalities during normal tuna aquaculture. However, the effects
of prolonged hypoxia exposure are unknown
Objective 5. To investigate the effects of stage of farming season on the metabolism of
SBT
This was the only objective not achieved by the project. Several attempts were made

109
to accomplish this objective however it was found that rough weather conditions
during winter made the necessary sea-based experiments unattainable.
Objective 6. To customize an archival tag for the in-situ monitoring of heart rate of
free swimming SBT under aquaculture conditions:
Customization and deployment of an implantable archival tag that measured heart rate
and visceral temperature in farmed SBT was successful. It was found that heart rate
could be measured in SBT that were freely swimming under farmed conditions.
Further, it was demonstrated that changes in specific dynamic action associated with
feeding were reflected as changes in heart rate. With appropriate calibration against
the rate of oxygen consumption for various activities, heart rate can provide an
accurate prediction of energy expenditure in free-swimming tuna.
Objective 7. Measurement of protein synthesis of SBT:
The main part of this objective was not accomplished by the project, as lower than
predicted feed intakes and higher than expected dilutions of marker (15N ammonia)
prevented successful analytical measurement of protein synthesis. However, post-
feeding nitrogen balance of SBT was able to be measured, and suggested that fish
eating 3% of body mass per day were in negative nitrogen balance.

110
REFERENCES Altringham, J. D. and Block, B. A. (1997). Why do tuna maintain elevated slow
muscle temperatures? Power output of muscle isolated from endothermic and ectothermic fish. Journal of Experimental Biology 200, 2617-2627.
Altringham, J. D. and Shadwick, R. E. (2001). Swimming and muscle function. In Tuna Physiology, Ecology, and Evolution, vol. 19 (ed. B. A. Block and E. D. Stevens), pp. 313-344. San Diego: Academic Press.
Axelsson, M., Altimiras, J. and Claireaux, G. (2002). Post-prandial blood flow to the gastrointestinal tract is not compromised during hypoxia in the sea bass Dicentrarchus labrax. Journal of Experimental Biology 205, 2891-2896.
Barneveld, R. van. Southern Bluefin Tuna Aquaculture Subprogram: Development and commercial evaluation of manufactured diets. Aquafin CRC project 1A.4, FRDC 2001-249 Final report (in preparation).
Beamish, F. W. H. (1964). Respiration of fishes with special emphasis on standard oxygen consumption. Canadian Journal of Zoology 42, 355-366.
Beamish, F. W. H. (1974). Apparent specific dynamic action of largemouth bass, Micropterus salmoides. Journal of Fisheries Research Board of Canada 31, 1763-1769.
Beamish, F. W. H. and Trippel, E. A. (1990). Heat Increment: A static or dynamic dimension in bioenergetic models. Transactions of the American Fisheries Society 119, 649-661.
Blank, J. M., Farwell, C. J., Morrissette, J. M., Schallert, R. J. and Block, B. A. (2007). Influence of swimming speed on metabolic rates of juvenile Pacific bluefin tuna and yellowfin tuna. Physiological and Biochemical Zoology 80, 167-177.
Blank, J. M., Morrissette, J. M., Davie, P. S. and Block, B. A. (2002). Effects of temperature, epinephrine and Ca2+ on the hearts of yellowfin tuna (Thunnus albacares). Journal of Experimental Biology 205, 1881-1888.
Blank, J. M., Morrissette, J. M., Landeira-Fernandez, A. M., Blackwell, S. B., Williams, T. D. and Block, B. A. (2004). In situ cardiac performance of Pacific bluefin tuna hearts in response to acute temperature change. Journal of Experimental Biology 207, 881-890.
Block, B. A., Booth, D. and Carey, F. G. (1992). Depth and temperature of the blue marlin, Makaira nigricans, observed by acoustic telemetry. Marine Biology 114, 175-183.
Block, B. A. and Carey, F. G. (1985). Warm brain and eye temperatures in sharks. Journal of Comparative Physiology 156B, 229-236.
Block, B. A., Dewar, H., Blackwell, S. B., Williams, T. D., Prince, E. D., Farwell, C. J., Boustany, A., Teo, S. L. H., Seitz, A., Walli, A. et al. (2001). Migratory movements, depth preferences, and thermal biology of Atlantic bluefin tuna. Science 293, 1310-1314.

111
Block, B. A., Finnerty, J. R., Stewart, A. F. R. and Kidd, J. (1993). Evolution of endothermy in fish: mapping physiological traits on a molecular phylogeny. Science 260, 210-214.
Block, B. A., Teo, S. L. H., Walli, A., Boustany, A., Stokesbury, M. J. W., Farwell, C. J., Weng, W. C., Dewar, H. and Williams, T. D. (2005). Electronic tagging and population structure of Atlantic bluefin tuna. Nature 28, 1121-1127.
Brill, R. W. (1978). Temperature effects on speeds of muscle contraction and stasis metabolic rate. In The physiological ecology of tunas, (ed. G. D. Sharp and A. E. Dizon), pp. 277-283. New York: Academic Press.
Brill, R. W. (1979). The effect of body size on the standard metabolic rate of skipjack tuna, Katsuwonus pelamis. Fishery Bulletin 77, 494-498.
Brill, R. W. (1987). On the standard metabolic rates of tropical tunas, including the effect of body size and acute temperature change. Fishery Bulletin 85, 25-35.
Brill, R. W. (1994). A review of temperature and O2 tolerance studies of tunas pertinent to fisheries oceanography, movement models and stock assessments. Fisheries Oceanography 3, 204-216.
Brill, R. W. (1996). Selective advantages conferred by the high performance physiology of tunas, billfish, and dolphin fish. Comparative Biochemistry and Physiology 113A, 3-15.
Brill, R. W. and Bushnell, P. G. (1991). Metabolic and cardiac scope of high energy demand teleosts, the tunas. Canadian Journal of Zoology 69, 2002-2009.
Brill, R. W. and Bushnell, P. G. (2001). The cardiovascular system of tunas. In Fish Physiology, vol. 19 (ed. B. A. Block and E. D. Stevens). San Diego: Academic Press.
Brill, R. W. and Bushnell, P. G. (2006). Effects of open- and closed-system temperature changes on blood O2-binding characteristics of Atlantic bluefin tuna (Thunnus thynnus). Fish Physiology and Biochemistry 32, 283-294.
Brodeur J. C., Dixon D. G. and McKinley R. S. (2001). Assessment of cardiac output as a predictor of metabolic rate in rainbow trout. Journal of Fish Biology. 58,439-452.
Brown, C. E. and Muir, B. S. (1970). Analysis of ram ventilation of fish gills with application to skipjack tuna (Katsuwonus pelamis). Journal of Fisheries Research Board of Canada 27, 1637-1652.
Brown, C. R. and Cameron, J. N. (1991a). The induction of specific dynamic action in channel catfish by infusion of essential amino acids. Physiological Zoology 64, 276-297.
Brown, C. R. and Cameron, J. N. (1991b). The relationship between specific dynamic action (SDA) and protein synthesis rates in the channel catfish. Physiological Zoology 64, 298-309.
Buchanan J. G. (2007). Quality and nutritional evaluation of baitfish used for tuna farming. Aquafin CRC Project 1A2.(2) FRDC Project 2000-221.2. Final report.

112
Bushnell, P. G. and Brill, R. W. (1991). Responses of swimming skipjack (Katsuwonus pelamis) and yellowfin (Thunnus albacares) tuna to acute hypoxia, and a model of their cardiorespiratory function. Physiological Zoology 64, 787-811.
Bushnell, P. G. and Brill, R. W. (1992). Oxygen transport and cardiovascular responses in skipjack tuna (Katsuwonus pelamis) and yellowfin tuna (Thunnus albacares) exposed to acute hypoxia. Journal of Comparative Physiology B162, 131-143.
Bushnell, P. G., Brill, R. W. and Bourke, R. E. (1990). Cardiorespiratory responses of skipjack tuna (Katsuwonus pelamis), yellowfin tuna (Thunnus albacares), and bigeye tuna (Thunnus obesus) to acute reductions of ambient oxygen. Canadian Journal of Zoology 68, 1857-1865.
Bushnell, P. G. and Jones, D. R. (1994). Cardiovascular and respiratory physiology of tuna: adaptations for support of exceptionally high metabolic rates. Environmental Biology of Fishes 40, 303-318.
Butler P. J., Green J. A., Boyd I. L. and Speakman J. R. (2004). Measuring metabolic rate in the field: the pros and cons of the doubly labelled water and heart rate methods. Functional Ecology. 18,168-183.
Carey, F. G. (1973). Fishes with warm bodies. Scientific American 228, 36-44.
Carey, F. G. and Gibson, Q. H. (1983). Heat and oxygen exchange in the rete mirabile of the bluefin tuna, Thunnus Thynnus. Comparative Biochemistry and Physiology, 333-342.
Carey, F. G. and Lawson, K. D. (1973). Temperature regulation in free-swimming bluefin tuna. Comparative Biochemistry and Physiology 44A, 375-392.
Carey, F. G. and Robinson, B. H. (1981). Daily patterns in the activities of swordfish, Xiphias gladius, observed by acoustic telemetry. Fishery Bulletin 79, 277-294.
Carey, F. G. and Teal, J. M. (1969a). Mako and porbeagle: warm-bodied sharks. Comparative Biochemistry and Physiology 28, 199-204.
Carey, F. G. and Teal, J. M. (1969b). Regulation of body temperature by the bluefin tuna. Comparative Biochemistry and Physiology 28, 205-213.
Carey, F. G., Teal, J. M., Kanwisher, J. W., Lawson, K. D. and Beckett, J. S. (1971). Warm-bodied fish. American Zoologist 11, 137-145.
Carey, F. G., Teal, J. M. and Stevens, E. D. (1984). Bluefin tuna warm their viscera during digestion. Journal of Experimental Biology 109, 1-20.
Carlson, J. K. and Parsons, G. R. (2001). The effects of hypoxia on three sympatric shark species: physiological and behavioural responses. Environmental Biology of Fishes 61, 427-433.
Carter, C. G. and Brafield, A. E. (1992). The relationship between specific dynamic action and growth in grass carp, Ctenopharyngodon idella (Val.). Journal of Fish Biology 40, 895-907.
Carter, C. G. and Houlihan, D. F. (2001). Protein Synthesis. In Fish Physiology, Nitrogen Excretion, vol. 20 (ed. W. S. Hoar D. J. Randall and A. P. Farrell), pp. 31-75. San Diego: Academic Press.

113
Carter, C. G., Seeto, G. S., Smart, A., Clarke, S. and Van Barneveld, R. J. (1998). Correlates of growth in farmed juvenile southern bluefin tuna Thunnus maccoyii (Castelnau). Aquaculture 161, 107-119.
Carter, C. G., Owen, S. F., He, Z. Y., Watt, P. W., Scrimgeour, C., Houlihan, D. F. and Rennie, M. J. (1994). Determination of protein synthesis in rainbow trout, Oncorhynchus mykiss, using a stable isotope. Journal of Experimental Biology 189, 279-284.
Cayré, P. and Marsac, F. (1993). Modelling the yellowfin tuna (Thunnus albacares) vertical distribution using sonic tagging results and local environmental parameters. Aquatic Living Resources 6, 1-14.
Chabot, D. and Dutil, J.-D. (1999). Reduced growth of Atlantic cod in non-lethal hypoxic conditions. Journal of Fish Biology 55, 472-491.
Chakraborty, S. C., Ross, L. G. and Ross, B. (1992). Specific dynamic action and feeding metabolism in common carp, Cyprinus carpio L. Comparative Biochemistry and Physiology 103A, 809-815.
Cho, C. Y. and Kaushik, S. J. (1990). Nutritional energetics in fish: energy and protein utilization in rainbow trout (Salmo gairdneri). World Review of Nutrition and Dietetics 61, 132-172.
Claireaux, G., Webber, D. M., Kerr, S., R. and Boutilier, R. G. (1995). Physiology and behaviour of free-swimming Atlantic cod (Gadus morhua) facing fluctuating salinity and oxygenation conditions. Journal of Experimental Biology 198, 61-69.
Claireaux, G., Webber, D. M., Lagardere, J. P. and Kerr, S. R. (2000). Influence of water temperature and oxygenation on the aerobic metabolic scope of Atlantic cod (Gadus morhua). Journal of Sea Research 44, 257-265.
Collette, B. B. and Nauen, C. E. (1983). FAO Species Catalogue. Vol. 2. Scombrids of the World. An Annotated and Illustrated Catalogue of Tunas, Mackerels, Bonitos and Related Species Known to Date. Rome: Food and Agriculture Organization of the United Nations.
Collette, B. B., Reeb, C. and Block, B. A. (2001). Systematics of the tunas and mackerels. In Tuna Physiology, Ecology, and Evolution, vol. 19 (ed. B. A. Block and E. D. Stevens). San Diego: Academic Press.
Cruz-Neto, A. P. and Steffensen, J. F. (1997). The effects of acute hypoxia and hypercapnia on oxygen consumption of the freshwater European eel. Journal of Fish Biology 50, 759-769.
Dagorn, L., Bach, P. and Josse, E. (2000). Movement patterns of large bigeye tuna (Thunnus obesus) in the open ocean, determined using ultrasonic telemetry. Marine Biology 136, 361-371.
Davison, W., Axelsson, M., Forster, M. and Nilsson, S. (1995). Cardiovascular responses to acute handling stress in the Antarctic fish Trematomus bernacchii are not mediated by circulatory catecholamines. Fish Physiology 14, 253-257.
Dewar, H. and Graham, J. B. (1994). Studies of tropical tuna swimming performance in a large water tunnel I. Energetics. Journal of Experimental Biology 192, 13-31.

114
Dewar, H., Graham, J. B. and Brill, R. W. (1994). Studies of tropical tuna swimming performance in a large water tunnel. II. Thermoregulation. Journal of Experimental Biology 192, 33-44.
Dickson, K. A. and Graham, J. B. (2004). Evolution and consequences of endothermy in fishes. Physiological and Biochemical Zoology 77, 998-1018.
Dickson, K. A., Johnson, N., Donley, J. M., Hoskinson, J. A., Hansen, M. W. and Tessier, J. D. (2000). Ontogenetic changes in characteristics required for endothermy in juvenile black skipjack tuna (Euthynnus lineatus). Journal of Experimental Biology 203, 3077-3087.
Dizon, A. E. (1977). Effect of dissolved oxygen concentration and salinity on swimming speed of two species of tuna. Fishery Bulletin 75, 649-653.
Dizon, A. E. and Brill, R. W. (1979a). Thermoregulation in the yellowfin tuna. Thunnus albacares. Physiological Zoology 52, 581-593.
Dizon, A. E. and Brill, R. W. (1979b). Thermoregulation in tunas. American Zoologist 19, 249-265.
Dizon, A. E., Brill, R. W. and Yuen, H. S. H. (1978). Correlations between environment, physiology, and activity and the effects on thermoregulation in skipjack tuna. In The Physiological Ecology of Tunas, (ed. G. D. Sharp and A. E. Dizon), pp. 233-259. San Diego: Academic Press.
Egginton S., Campbell, H. and Davison, W. (2006). Cardiovascular control in Antarctic fish. Deep-Sea Research Part II-Topical Studies in Oceanography. 53,1115-1130.
Ellis, D. and Rough, K. (2005). Quality and nutritional evaluation of baitfish used for SBT farming (including baitfish profiles), pp. 1-39. Adelaide: Aquafin CRC.
Farrell, A. P., Davie, P. S., Franklin, C. E., Johansen, J. A. and Brill, R. W. (1992). Cardiac physiology in tuna. 1. In vitro perfused heart preparations from yellowfin and skipjack tunas. Canadian Journal of Zoology 70, 1200-1210.
Farwell, C. J. (2001). Tunas in captivity. In Tuna Physiology, Ecology, and Evolution, vol. 19 (ed. B. A. Block and E. D. Stevens). San Diego: Academic Press.
Fernandes, M. N. and Rantin, F. T. (1989). Respiratory responses of Oreochromis niloticus (Pisces, Cichlidea) to environmental hypoxia under different thermal conditions. Journal of Fish Biology 35, 509-519.
Fernandes, M., Angove, M. Sedawie, T. and Cheshire A. (2007). Dissolved nutrient release from solid wastes of southern bluefin tuna (Thunnus maccoyii, Castelnau) aquaculture. Aquaculture Research 38, 388-397.
Fitzgibbon, Q. P., Baudinette, R. V., Musgrove, R. J. and Seymour, R. S. (2006). The routine metabolic rate of southern bluefin tuna (Thunnus maccoyii). Comparative Biochemistry and Physiology A, doi:10.1016/j.cbpa.2006.08.046.
Fitzgibbon, Q. P., Seymour, R. S., Ellis, D. and Buchanan, J. (2007). The energetic consequence of specific dynamic action in southern bluefin tuna (Thunnus maccoyii). Journal of Experimental Biology 210, 290-298.
115
Fitzgibbon, Q. P., Strawbridge, A. and Seymour, R. S. (In Press). Metabolic scope, swimming performance and the effects of hypoxia in the mulloway (Argyrosomus japonicus). Aquaculture.
Fraser, K. P., Lyndon, A. R. and Houlihan, D. F. (1998). Protein Synthesis and growth in juvenile Atlantic halibut Hippolossus Hippolossus : application of 15N stable isotope tracer. Aquaculture Research 29, 289-298.
Fry, F. E. J. (1971). The effect of environmental factors on the physiology of fish. In Fish Physiology, vol. 6 (ed. W. S. Hoar and D. J. Randall), pp. 1-99. San Diego: Academic Press.
Fu, S. J., Cao, Z. D. and Peng, J. L. (2006). Effect of meal size on postprandial metabolic response in Chinese catfish (Silurus asotus Linnaeus). Journal of Comparative Physiology 176B, 489-495.
Fu, S. J., Xie, X. J. and Cao, Z. D. (2005a). Effect of dietary composition on specific dynamic action in southern catfish Silurus meridionalis Chen. Aquaculture Research 36, 1384-1390.
Fu, S. J., Xie, X. J. and Cao, Z. D. (2005b). Effect of feeding level and feeding frequency on specific dynamic action in Silurus meridionalis. Journal of Fish Biology 67, 171-181.
Fu, S. J., Xie, X. J. and Cao, Z. D. (2005c). Effect of meal size on postprandial metabolic response in southern catfish (Silurus meridionalis). Comparative Biochemistry and Physiology 140A, 445-451.
Fudge, D. S. and Stevens, E. D. (1996). The visceral retia mirabilia of tuna and sharks: an annotated translation and discussion of the Eschricht & Muller 1835 paper and related papers. Guelph Ichthyology Reviews 4, 1-53.
Funakoshi, S., Wada, K. and Suzuki, T. (1985). Development of the rete mirabile with growth and muscle temperature in the young bluefin tuna. Bulletin of the Japanese Society of Scientific Fisheries 51, 1971-1975.
Glencross, B. D., Clarke, S., Buchanan, J., Carter, C. G. and Van Bareveld, R. J. (2002). Temporal growth patterns of farmed juvenile southern bluefin tuna, Thunnus maccoyii (Castelnau) fed moist pellets. Journal of the World Aquaculture Society 33, 138-145.
Gooding, R. M., Neill, W. H. and Dizon, A. E. (1981). Respiration rates and low-oxygen tolerance limits in skipjack tuna, Katsuwonus pelamis. Fishery Bulletin 79, 31-48.
Graham, J. B. (1975). Heat exchange in the yellowfin tuna, Thunnus albacares, and skipjack tuna, Katsuwonus pelamis, and the adaptive significance of elevated body temperatures in scombrid fishes. Fishery Bulletin 73, 219-229.
Graham, J. B. and Dickson, K. A. (1981). Physiological thermoregulation in the albacore Thunnus alalunga. Physiological Zoology 54, 470-486.
Graham, J. B. and Dickson, K. A. (2000). The evolution of thunniform locomotion and heat conservation in scombrid fishes: New insights based on the morphology of Allothunnus fallai. Zoological Journal of the Linnean Society 129, 419-466.

116
Graham, J. B. and Dickson, K. A. (2001). Anatomical and physiological specializations for endothermy. In Fish Physiology, vol. 19 (ed. B. A. Block and E. D. Stevens), pp. 121-165. San Diego: Academic Press.
Graham, J. B. and Dickson, K. A. (2004). Tuna comparative physiology. Journal of Experimental Biology 207, 4015-4025.
Graham, J. B. and Laurs, R. M. (1982). Metabolic rate of the albacore tuna Thunnus alalunga. Marine Biology 72, 1-6.
Graham, J. B., Lowell, W. R., Lai, N. C. and Laurs, R. M. (1989). O2 tension, swimming-velocity, and thermal effects on the metabolic rate of the Pacific albacore Thunnus alalunga. Experimental Biology 48, 89-94.
Gunn, J. and Block, B. A. (2001). Advances in acoustic, archival, and satellite tagging of tunas. In Fish Physiology, vol. 19 (ed. B. A. Block and E. D. Stevens). San Diego: Academic Press.
Gunn, J., Hartog, J. and Rough, K. (2001). The relationship between food intake and visceral warming in southern bluefin tuna (Thunnus maccoyii). In Electronic Tagging and Tracking in Marine Fisheries, vol. 1 (ed. J. R. Sibert and J. L. Nielsen), pp. 1009-130. Dordrecht: Kluwer Academic Publishers.
Hanamoto, E. (1987). Effect of oceanographic environment on bigeye tuna distribution. Bulletin of the Japanese Society of Fisheries and Ocenography 51, 203-216.
Holland, K. N., Brill, R. W., Chang, R. K. C., Sibert, J. R. and Fournier, D. A. (1992). Physiological and behavioural thermoregulation in bigeye tuna (Thunnus obesus). Nature 358, 410-412.
Holmes, R. M., McClelland, J. W., Sigman, D. M., Fry, B. and Peterson, B. J. (1998). Measuring 15N–NH4 in marine, estuarine and fresh waters: An adaptation of the ammonia diffusion method for samples with low ammonium concentrations. Marine Chemistry 60, 235–243.
Houlihan, D. F., Hall, S. J., Gray, C. A. and Noble, B. S. (1988). Growth rates and protein turnover in Atlantic cod, Gadus morhua. Canadian Journal of Fisheries and Aquatic Sciences 45, 951-964.
Hughes, G. M. (1973). Respiratory responses to hypoxia in fish. American Zoologist 13, 475-489.
Hughes, G. M. (1984). General anatomy of the gills. In Fish Physiology, vol. XA (ed. W. S. Hoar and D. J. Randall), pp. 1-72. Orlando: Academic Press.
Hunt von Herbing, I. and White, L. (2002). The effect of body mass and feeding on metabolic rate in small juvenile Atlantic cod. Journal of Fish Biology 61, 945-958.
Itoh, T., Tsuji, S. and Nitta, A. (2003). Swimming depth, ambient water temperature preference, and feeding frequency of young Pacific bluefin tuna (Thunnus orientalis) determined with archival tags. Fishery Bulletin 101, 535-544.
Jobling, M. (1981). The influences of feeding on the metabolic rate of fishes: a short review. Journal of Fish Biology 18, 385-400.

117
Jobling, M. and Davis, J. C. (1980). Effect of feeding on the metabolic rate, and the specific dynamic action in plaice, Pleuronectes platessa L. Journal of Fish Biology 16, 629-638.
Johnson, I. A. and Brill, R. W. (1984). Thermal dependence of contractile properties of single skinned muscle fibers from Antarctic and various warm water marine fishes including skipjack tuna (Katsuwonus pelamis) and kawakawa (Euthynnus affinis). Comparative Biochemistry and Physiology 155B, 63-70.
Jones, D. R., Brill, R. W. and Mense, D. C. (1986). The influence of blood gas properties on gas tension and pH of ventral and dorsal aortic blood in free-swimming tuna, Euthynnus affinis. Journal of Experimental Biology 120, 201-213.
Jordan, A. D. and Steffensen, J. F. (2007). Effects of ration size and hypoxia on specific dynamic action in the cod. Physiological and Biochemical Zoology 80, 178-185.
Kajimura, M. et al. (2004). Dogmas and controversies in the handling of nitrogenous wastes: the effect of feeding and fasting on the excretion of ammonia, urea and other nitrogenous waste products in rainbow trout." Journal of Experimental Biology 207, 1993-2002.
Kalinin, A. L., Rantin, F. T. and Glass, M. L. (1993). Dependence on body size of respiratory function in Hoplias malabaricus (Teleostei, Erthrinidae) during graded hypoxia. Fish Physiology and Biochemistry 12, 47-51.
Kemps, H. A., Totterdell, J. A., Nishida, T. and Gill, H. S. (1998). Dietary comparisons between southern bluefin tuna (Thunnus maccoyii) of different sizes and in different locations - with suggestions and a rationale for future work, pp. 14-17. Hobart, Tasmania: CSIRO.
Kemps, H. A., Totterdell, J. A., Nishida, T. and Gills, H. S. (1999). Preliminary analysis on the diet and feeding ecology of juvenile southern bluefin tuna, Thunnus maccoyii, in relation to the southern coastal waters of Western Australia, pp. 16. Hobart: CSIRO Marine Research.
Kitagawa, T., Kimura, S., Nakada, M. and Yamada, H. (2004). Diving behaviour of immature, feeding Pacific bluefin tuna (Thunnus thynnus orientalis) in relation to season and area: the East China Sea and the Kuroshio-Oyashio transition regoin. Fisheries Oceanography 13, 161-180.
Kitagawa, T., Kimura, S., Nakata, H. and Yamada, H. (2006). Thermal adaptation of Pacific bluefin tuna Thunnus orientalis to temperate waters. Fisheries Science 72, 149-156.
Kitagawa, T., Nakata, H., Kimura, S., Itoh, T., Tsuji, S. and Nitta, A. (2000). Effect of ambient temperature on the vertical distribution and movement of Pacific bluefin tuna Thunnus thynnus orientalis. Marine Ecology Progress Series 206, 251-260.
Kitagawa, T., Nakata, H., Kimura, S. and Tsuji, S. (2001). Thermoconservation mechanisms inferred from peritoneal cavity temperature in free-swimming Pacific bluefin tuna Thunnus thynnus orientalis. Marine Ecology Progress Series 220, 253-263.

118
Kitchell, J. F., Neill, W. H., Dizon, A. E. and Magnuson, J. J. (1978). Bioenergetic spectra of skipjack and yellowfin tunas. In The Physiological Ecology of Tunas, (ed. G. D. Sharp and A. E. Dizon), pp. 357-368. New York: Academic Press.
Korsmeyer, K. E. and Dewar, H. (2001). Tuna metabolism and energetics. In Fish Physiology: Tuna Physiology, Ecology, and Evolution, vol. 19 (ed. B. A. Block and E. D. Stevens), pp. 35-78. San Diego: Academic Press.
Korsmeyer, K. E., Dewar, H., Lai, N. C. and Graham, J. B. (1996). The aerobic capacity of tunas: Adaptation for multiple metabolic demands. Comparative Biochemistry and Physiology 113A, 17-24.
LeGrow, S. M. and Beamish, F. W. H. (1986). Influence of dietary protein and lipid on apparent heat increment of rainbow trout, Salmo gairdneri. Canadian Journal of Fisheries and Aquatic Sciences 43, 19-25.
Linthicum, D. S. and Carey, F. G. (1972). Regulation of brain and eye temperatures by bluefin tuna. Comparative Biochemistry and Physiology 43A, 425-433.
Lowe, T. E., Brill, R. W. and Cousins, K. L. (2000). Blood oxygen-binding characteristics of bigeye tuna (thunnus obesus), a high-energy-demand teleost that is tolerant of low ambient oxygen. Marine Biology 136, 1087-1098.
Lyndon, A. R., Houlihan, D. F. and Hall, S. J. (1992). The effect of short-term fasting and single meal on protein synthesis and oxygen consumption in cod, Gadus morhua. Comparative Biochemistry and Physiology 162B, 209-215.
Magnuson, J. J. (1969). Digestion and food consumption by skipjack tuna (Katsuwonus pelamis). Transactions of the American Fisheries Society 98, 379-392.
Magnuson, J. J. (1973). Comparative study of adaptations for continuous swimming and hydrostatic equilibrium of scombroid and xiphoid fishes. Fishery Bulletin 71, 337-356.
Mallekh, R. and Lagardere, J. P. (2002). Effect of temperature and dissolved oxygen concentration on the metabolic rate of the turbot and the relationship between metabolic scope and feeding demand. Journal of Fish Biology 60, 1105-1115.
Marcinek, D. J., Blackwell, S. B., Dewar, H., Freund, E. V., Farwell, C., Dau, D., Seitz, A. C. and Block, B. A. (2001). Depth and muscle temperature of Pacific bluefin tuna examined with acoustic and pop-up satellite archival tags. Marine Biology 138, 869-885.
McCue, M. D. (2006). Specific dynamic action: A century of investigation. Comparative Biochemistry and Physiology 144A, 381-394.
Muir, B. S. and Hughes, G. M. (1969). Gill dimensions for three species of tunny. Journal of Experimental Biology 51, 271-285.
Muir, B. S. and Niimi, A. J. (1972). Oxygen consumption of euryhaline fish aholehole (Kuhlia sandvicensis) with reference to salinity, swimming, and food consumption. Journal of the Fisheries Research Board of Canada 29, 67-77.

119
Musyl, M. K., Brill, R. W., Boggs, C. H., Curran, D. S., Kazama, T. K. and Seki, M. P. (2003). Vertical movements of bigeye tuna (Thunnus obesus) associated with islands, buoys, and seamounts near the main Hawaiian Islands from archival tagging data. Fisheries Oceanography 12, 152-169.
Neill, W. H. and Stevens, E. D. (1974). Thermal inertia versus thermoregulation in "warm" turtles and tunas. Science 184, 1008-1010.
Olson, R. J. and Boggs, C. H. (1986). Apex predation by yellowfin tuna (Thunnus albacares): Independent estimates from gastric evacuation and stomach contents, bioenergetics, and cesium concentrations. Canadian Journal of Fisheries and Aquatic Sciences 43, 1760-1775.
Ott, M. E., Heisler, N. and Ultsch, G. R. (1980). A re-evaluation of the relationship between temperature and the critical oxygen tension in freshwater fishes. Comparative Biochemistry and Physiology 67A, 337-340.
Parsons, G. R. and Carlson, J. K. (1998). Physiological and behavioural response to hypoxia in the bonnethead shark, Syhyrna tiburo: routine swimming and respiratory regulation. Fish Physiology and Biochemistry 19, 189-196.
Peck, M. A., Buckley, L. J. and Bengtson, D. A. (2002). Energy losses due to routine and feeding metabolism in young-of-the-year juvenile Atlantic cod (Gadus morhua). Canadian Journal of Fisheries and Aquatic Sciences 60, 929-937.
Peres, H. and Oliva-Teles, A. (2001). Effect of dietary protein and lipid level on metabolic utilization of diets by European sea bass (Dicentrarchus labrax) juveniles. Fish Physiology and Biochemistry 25, 269-275.
Peres, H. and Oliva-Teles, A. (2005). Protein and energy metabolism of European seabass (Dicentrarchus labrax) juveniles and estimation of maintenance requirements. Fish Physiology and Biochemistry 31, 23-31.
Priede, I. G. and Tytler, P. (1977). Heart rate as a measure of metabolic rate in teleost fishes; Salmo gairdneri, Salmo trutta and Gadus morhua. Journal of Fish Biology 10, 231-242.
Pichavant, K., Person-Le-Ruyet, J., Le Bayon, N., Severe, A., Le Roux, A. and Boeuf, G. (2001). Comparative effects of long-term hypoxia on growth, feeding and oxygen consumption in juvenile turbot and European sea bass. Journal of Fish Biology 59, 875-883.
Rantin, F. T., Kalinin, A. L., Glass, M. L. and Fernandes, M. N. (1992). Respiratory responses to hypoxia in relation to mode of life of two erythrinid species (Hoplias malabaricus and Hoplias lacerdae). Journal of Fish Biology 41, 805-812.
Sainsbury, K., Polacheck, T., Klaer, N., Gunn, J., Campbell, R., Hearn, W., Davis, T., Betlehem, A., Preece, A. and Cowling, A. (1997). Recent developments and methods in southern bluefin tuna fishery assessments. Hobart, Tasmania: CSIRO Division of Marine Report.
Schaefer, K. M. (1984). Swimming performance, body temperatures, and gastric evacuation times of black skipjack, Euthynnus lineatus. Copeia 1984, 1001-1004.

120
Schaefer, K. M. (2001). Reproductive biology of tunas. In Tuna Physiology, Ecology, and Evolution, vol. 19 (ed. B. A. Block and E. D. Stevens), pp. 225-270. San Diego: Academic Press.
Schaefer, K. M. and Fuller, D. W. (2002). Movements, behavior, and habitat selection of bigeye tuna (Thunnus obesus) in the eastern equatorial Pacific, ascertained through archival tags. Fishery Bulletin 100, 765-788.
Schurmann, H., Claireaux, G. and Chartois, H. (1998). Changes in vertical distribution of sea bass (Dicentrarchus labrax) during a hypoxic episode. In Advances in Invertebrates and Fish Telemetry, (ed. J. P. Lagardere M.-L. Begout Anras and G. Claireaux), pp. 207-213. Dordrecht: Academic Publishers.
Schurmann, H. and Steffensen, J. F. (1997). Effects of temperature, hypoxia and activity on the metabolism of juvenile Atlantic cod. Journal of Fish Biology 50, 1166-1180.
Schreer, J.F., Cooke, S.J. and McKinley, R.S. (2001). Cardiac response to variable forced exercise at different temperatures: an angling simulation for smallmouth bass. Transactions of the American Fisheries Society 130, 783-795.
Sepulveda, C. and Dickson, K. A. (2000). Maximum sustainable speeds and cost of swimming in juvenile kawakawa tuna (Euthynnus affinis) and chub mackerel (Scomber japonicus). Journal of Experimental Biology 203, 3089-3101.
Stevens, E. D. and Carey, F. G. (1981). One why of the warmth of warm-bodied fish. American Journal of Physiology 240, R151-R155.
Stevens, E. D., Kanwisher, J. W. and Carey, F. G. (2000). Muscle temperature in free-swimming giant Atlantic bluefin tuna (Thunnus thynnus L.). Journal of Thermal Biology 25, 419-423.
Stevens, E. D. and McLeese, J. M. (1984). Why bluefin tuna have warm tummies: temperature effect on trypsin and chymotripsin. American Journal of Physiology 246, R487-R494.
Stevens, E. D., Sutterlin, A. and Cook, T. (1998). Respiratory metabolism and swimming performance in growth hormone transgenic Atlantic salmon. Canadian Journal of Fisheries and Aquatic Sciences 55, 2028-2035.
Suarez, N. D., Hidalgo, M. C., Garcia-Gallego, M., Sanz, A. and de la Higuera, M. (1995). Influence of the relative proportions of energy yielding nutrients on the liver intermediary metabolism of the European eel. Comparative Biochemistry and Physiology 111A, 421-428.
Sund, P. N., Blackburn, M. and Williams, F. (1981). Tunas and their environment in the Pacific Ocean: a review. Oceanography and Marine Biology. An Annual Review 19, 443-512.
Tandler, A. and Beamish, F. W. H. (1979). Mechanical and biochemical components of apparent specific dynamic action in largemouth bass, Micropterus salmoides Lacepede. Journal of Fish Biology 14, 343-350.

121
Thetmeyer, H., Waller, U., Black, K. D., Inselmann, S. and Rosenthal, H. (1999). Growth of European sea bass (Dicentrarchus labrax L.) under hypoxic and oscillating oxygen conditions. Aquaculture 174, 355-367.
Thorarensen, H., Gallaugher, P. And Farrell, A. P. (1996). Cardiac output in swimming rainbow trout, Oncorhynchus mykiss, acclimated to seawater. Physiological Zoology 69, 139-153.
Uchiyama, J. H. and Struhsaker, P. (1980). Age and growth of skipjack tuna, Katsuwonus pelamis, and yellowfin tuna, Thunnus albacares, as indicated by daily growth increments of sagittae. Fishery Bulletin 79, 151-162.
Ultsch, G. R., Boschung, H. and Ross, M. J. (1978). Metabolism, critical oxygen tension, and habitat selection in darters (Etheostoma). Ecology 59, 99-107.
Valverde, J. C., Lopez, F. J. M. and Garcia, B. G. (2006). Oxygen consumption and ventilatory frequency responses to gradual hypoxia in common dentex (Dentex dentex): Basis for suitable oxygen level estimations. Aquaculture 256, 542-551.
Virani, N. A. and Rees, B. B. (2000). Oxygen consumption, blood lactate and inter-individual variation in the gulf killifish, Fundulas grandis, during hypoxia and recovery. Comparative Biochemistry and Physiology A126, 397-405.
Vlieg, P. (1988). Proximate composition of New Zealand marine finfish and shellfish. Palmerston North: New Zealand Institute for Crop & Food Research.
Ward, T. M., McLeay, L. J., Dimmlich, W. F., Rogers, P. J., McClatchie, S. A. M., Matthews, R., Kampf, J. and Van Ruth, P. D. (2006). Pelagic ecology of a northern boundary current system: effects of upwelling on the production and distribution of sardine (Sardinops sagax), anchovy (Engraulis australis) and southern bluefin tuna (Thunnus maccoyii) in the Great Australian Bight. Fisheries Oceanography 15, 191-207.
Wardle, C. S., Videler, J. J., Arimoto, T., Franco, J. M. and He, P. (1989). The muscle twitch and the maximum swimming speed of giant bluefin tuna, Thunnus thynnus L. Journal of Fish Biology 35, 129-137.
Webber, D.M., Boutilier, R.G. and Kerr S. R. (1998). Cardiac output as a predictor of metabolic rate in cod Gadus morhua. Journal of Experimental Biology. 201, 2779-2789.
Westneat, M. W. and Wainwright, S. A. (2001). Mechanical design for swimming: muscle, tendon, and bone. In Tuna Physiology, Ecology, and Evolution, vol. 19 (ed. B. A. Block and E. D. Stevens), pp. 271-311. San Diego: Academic Press.
White, C. R. and Seymour, R. S. (2005). The scaling and temperature dependence of vertebrate metabolism. Biology Letters 2, 125-127.
Young, J. W., Lamb, T. D., Le, D., Bradford, R. W. and Whitelaw, A. W. (1997). Feeding ecology and interannual variations in diet of southern bluefin tuna, Thunnus maccoyii, in relation to coastal and oceanic waters off eastern Tasmania, Australia. Environmental Biology of Fishes 50, 275-296.

122
APPENDIX A. LIST OF ABBREVIATIONS
SBT Southern bluefin tuna
M. O2 Rate of oxygen consumption
SDA Specific dynamic action
Mb Body mass
% Mb Percent body mass
BL Body length
SMR Standard metabolic rate
RMR Routine metabolic rate
RMRh Routine metabolic rate in hypoxia
U Swimming velocity
Ur Swimming velocity during routine metabolic rate measurement
Usda Swimming velocity during the specific dynamic action period
Uh Swimming velocity in hypoxia
DO Dissolved oxygen
Tw Water temperature
Tvis Visceral temperature
Tvis excess Temperature of viscera above water temperature.
Scrit Critical dissolved oxygen level

123
APPENDIX B INTELLECTUAL PROPERTY 1. Copyright in the chapters of this report resides with the respective major authors of the chapters: Quinn Fitzgibbon (Chapters 1-4), Peter Frappell (Chapter 5), Jeffrey Buchanan (Chapter 6). 2. It is the intention to assign the project data to the University of Adelaide upon the closure of Aquafin CRC in June 2008. 3. The intellectual property in the design of the heart rate loggers is held by Peter Frappell, Brian Taylor and La Trobe University. For access to data, contact the author as indicated above. APPENDIX C STAFF Russell Baudinette Geoff Bayly Jeffery Buchanan John Carragher Chris Carter Timothy Clark Neil Chigwidden Steven Clarke John Collinson Brenton Ebert David Ellis Audrey Farber Quinn Fitzgibbon Peter Frappell Dan Gorman Doug Grasky Jane Ham Wayne Hutchinson Guy Manthorpe Richard Morrison Richard Musgrove Chris Pitney Roger Seymour Jayne Skinner Aaron Strawbridge Jason Tanner Dave Warland Adam Watkins Kane Williams