Embed Size (px)
Citation preview

CRATER PLANNING DISTRICT COMMISSION
2020 COMPREHENSIVE ECONOMIC DEVELOPMENT STRATEGY
DRAFT


TABLE OF CONTENTS Page INTRODUCTION 1 Overview of the Crater District 4 History of the Crater District 7 Employment Structure 9 Table 1 – 30 Largest Employers 10 Population 11 Table 2: Population Estimates 11 Table 3: Population Change – 1980 – 2010 13 Table 4: Population Projections – 2020-2040 14 Table 5: Population by Group Quarters 15 Table 6: Population: Urban & Rural - 2010 15 Table 7: Population Density 16 Summary of Economic Development Conditions 16 CLUSTER ANALYSIS 17 Table 8: Industry Clusters for Crater District 18 Current Initiatives 19 ECONOMIC DEVELOPMENT OPPORTUNITIES AND CHALLENGES 22 Opportunities 22 Challenges 25 VISION STATEMENT 34 IMPLEMENTATION PLAN 35 Goals and Objectives 37 PERFORMANCE MEASURES 41

TABLE OF CONTENTS – Continued
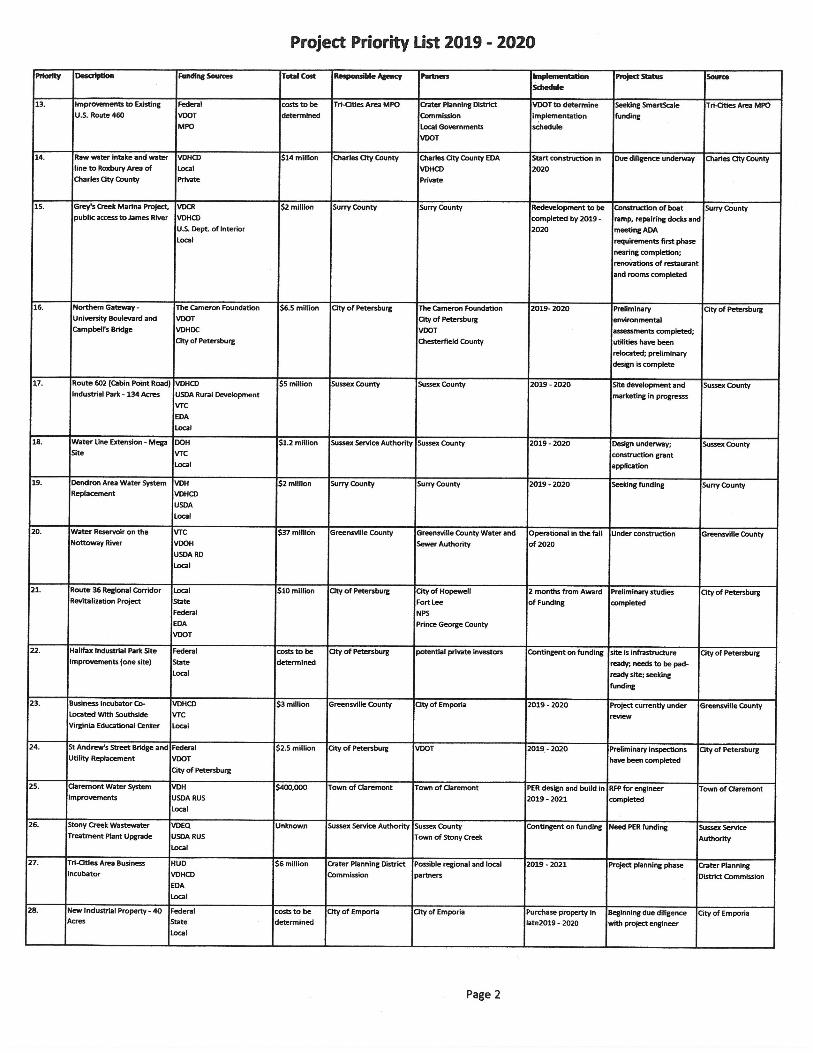
SUPPORTING ECONOMIC RESILIENCY WITHIN THE CRATER DISTIRCT 43 INTEGRATION WITH STATE PRIORITIES 45 Appendices Appendix I - Summary of Economic Development Conditions Appendix II - Project Priority List – 2019-2020

COMPREHENSIVE ECONOMIC DEVELOPMENT STRATEGY UPDATE
INTRODUCTION The Crater Planning District Commission facilitates an ongoing economic development strategy planning process through the engagement of public and private sector stakeholders who are committed to innovation in the expansion of the District’s economic base. These stakeholders recognize the need for strengthening the District’s workforce by providing the education necessary for the creation of higher skilled, higher wage jobs that will result in a region that is attractive to investment and offers a high quality of life for its citizens. The CEDS process is an efficient and effective mechanism for coordinating the efforts of individuals, organizations, local governments, and private industry, all of which are committed to and working toward economic development. The CEDS document:
• sets forth the District’s goals, strategies and implementation plan; • describes the challenges, opportunities, and resources of the Crater District; • details the demographics, infrastructure, and natural resources of the Region; and • identifies priority programs, performance measures and projects for
implementation; and • discusses supporting economic resilience within the Region.
The CEDS Committee was appointed by the Crater Planning District Commission and is representative of the many multi-jurisdictional initiatives and organizations that work under the PDC “umbrella” or are stakeholders in the economic development of the Crater District. Six multi-jurisdictional entities engage with the Planning District Commission on economic development initiatives: Crater Regional Small Business Development Center of Longwood University (co-located with PDC), Virginia’s Gateway Region*, which is the regional economic development marketing entity that provides research, technical assistance, lead generation and business outreach/assistance on behalf of its member localities and corporate partners; Crater Regional Workforce Investment Group, which is the designated regional convener and administrator that coordinates workforce training and career services through federal funding from the Workforce Innovation & Opportunity Act; Crater Procurement Technical Assistance Center (co-located with PDC), which provides one-on-one counseling and group training to assist small businesses to expand their markets via government contracting; the Tri-Cities Area Metropolitan Planning Organization (co-located with PDC), which undertakes the Crater Region’s transportation planning process for both urbanized and rural areas in cooperation with the Federal Highways Administration and the Virginia Department of Transportation; Petersburg Area Regional Tourism (co-located with PDC), which implements a regional tourism marketing and promotional program; and the GO Virginia Region 4 Regional Council. * The City of Emporia and Greensville County are marketed by Virginia’s Growth Alliance.

Together these multi-jurisdictional entities, working collaboratively through the PDC, encompass a broad-based economic development planning process reflecting the varied needs of the District. They bring together members from the public and private sectors, including community leaders, educators, small and large employers, local elected officials, local government staff, and Fort Lee representatives who have contributed to the CEDS process. Participation of community stakeholders has continued to grow and the CEDS is now “familiar” and “recognized” by the local governments and by business and community leaders. In particular, private sector representatives are becoming better informed about the region’s demographics and its economy, whereas they might previously have been more focused on a particular locality. The awareness and understanding of a “regional” approach to economic development/job creation has grown throughout the District as a result of the CEDS process. Beyond awareness and familiarity, the Comprehensive Economic Development Strategy is an invaluable tool for decision-makers (public or private sector), investors, and the general public to use as a guide to understanding the regional economy and steps which might be taken to strengthen and improve it. The Crater Planning District Commission obtained designation as an Economic Development District in 1985, reflecting the growing emphasis upon approaching economic development/job creation “regionally”. Since that time the role that agriculture plays has declined, manufacturing has changed and now requires a higher-skilled workforce, the importance of logistics has come to the forefront, and Fort Lee’s prominence has strengthened dramatically. Today the level of understanding and appreciation for the “regional” economy and the myriad linkages that are necessary for success have brought about the successful regional collaborative effort that has produced this 2020 Comprehensive Economic Development Strategy Update for the Crater Planning District.

Overview of the Crater District The Crater Planning District is located in south-central Virginia and encompasses the Counties of Charles City, Dinwiddie, Greensville, Prince George, Surry and Sussex, the Cities of Colonial Heights, Emporia, Hopewell and Petersburg, and eight small incorporated towns, all with populations under 3,500: Claremont, Dendron and Surry in Surry County; Stony Creek, Wakefield and Waverly in Sussex County; McKenney in Dinwiddie County; and Jarratt, located partially in Greensville and Sussex Counties. Its 2,493 square miles are spread across urban, suburban and rural land areas. Much of the District (seven localities) comprises the southern portion of the Richmond MSA. The neighboring Hampton Roads MSA is directly east of the Crater District and includes Surry County. The City of Emporia and Greensville County, located along the Virginia-North Carolina boundary, are not part of an MSA. It should be pointed out, because it is unique, that in the Commonwealth of Virginia cities are independent local governments; they are not located within counties. The District’s strategic location in the U. S. Mid-Atlantic Region and transportation network are key assets. Interstates 95 and 85 run through the middle of the District, with I-295 running parallel to I-95 around Richmond and Petersburg. Both I-295 and Route 288 provide eastern and western linkages to I-64. In addition to I-64, Routes 460, 58 and 10 provide east/west linkages to the growing Port of Virginia. The widening of the Panama Canal has significantly expanded business at Virginia’s ports, which enhances the importance of the District’s location and transportation access. It is a major reason that this region is a center for logistics. Historically, transportation and access have played pivotal roles in the development of the Crater District. In earlier years the focus was on the rivers. Petersburg was a significant river port throughout the nineteenth century and was settled at the point where the Appomattox River crosses the Fall Line. Hopewell, located just downstream, is at the confluence of the Appomattox and James Rivers and was a thriving port city during the Civil War. Surry County, along the James, was settled concurrently with Jamestown, and Charles City County, also sits along the James where it meets the Chickahominy, and has a significant history dating to the Colonial period. Likewise, the Meherrin River was significant to the development of Greensville County, and Emporia was created in 1787 through the merger of the Town of Hicksford, on one side of the river and the Town of Belfield on the other side. Sussex County was formed in 1753 from that part of Surry County that was south of the Blackwater River. Excellent rail service has also played a significant role in the economy of the Crater District throughout its history and continues today. Norfolk Southern and CSX have lines running through the District and they merge in Petersburg at Collier yard. That intersection of two rail lines is a unique and significant asset.

Norfolk Southern’s Heartland Corridor Rail Project significantly enhanced the District’s transportation and distribution capabilities by shortening rail shipments from Norfolk to the Midwest. The project improved intermodal train operations by raising clearances on the railroad bridges and tunnels to enable double stacked rail freight along the route. The trip time and distance from Norfolk to Chicago, for example, has been reduced by 24 hours and over 200 miles. Another major rail project enhancing the Crater District’s long-haul freight capability is the CSX National Gateway Project. This was also a multi-state project that extended north-south from North Carolina to Ohio running parallel to Interstate-95 through Virginia and included a spur that connects to the Port of Virginia. The Heartland Corridor and the National Gateway intersect at Collier Yard in the City of Petersburg making the Crater District well suited to serve as an east coast hub for freight distribution. The map on the following page visually presents the District’s excellent mid-Atlantic location and its close proximity to major markets within 250, 500 and 750 miles. The Crater Planning District straddles the Fall Line, with the western portions of Dinwiddie and Greensville counties in the Piedmont Plateau and the remaining area in the Coastal Plain. Elevations range from 400 feet in the west to less than 100 feet above sea level in the east. Some of the low-lying sections are swampy. Having essentially flat to gently rolling topography with few areas of steep slopes, the District offers few restrictions to development. While the number of farms has not grown in the past 10 years, agricultural use is the most dominant land use in the District’s counties. The principal crops are soybeans, wheat, corn and cotton. There is also significant acreage in forest land. The District is very fortunate to have large open space areas for its citizens and for wildlife preservation/protection. One significant federal resource which provides valuable green space in an urban setting, as well as attracting hundreds of visitors to the Crater District, is Petersburg National Battlefield encompassing large properties in Petersburg, Prince George County, Hopewell and Dinwiddie County. The U. S. Fish & Wildlife Service owns the Harrison Lake National Fish Hatchery in Charles City County, which offers barrier free recreational fishing, as well as trails and wildlife areas. District citizens are provided easy access to two large state parks, Pocahontas (7,919 acres) in southern Chesterfield County, and Chippokes (1,946 acres) along the James River in Surry County. Additionally, 5,000+ acres have been acquired at the Chickahominy Wildlife Management Area in Charles City County, there are 3,908 acres at Hog Island Wildlife Management Area in Surry County, and also in Surry is the Charles Steirly Heron Rookery on the Blackwater River (19 acres). The Nature Conservancy owns 300-400 acres along the James River in Prince George County, which is an eagle protection area. A large open space and recreation area in Sussex County is the Southeastern 4-H Educational Center on Airfield Lake. Also, in Sussex County is a state-designated natural area, Chub Sandhill, along a segment of the Nottoway River-599 acres. Continuing to expand in Dinwiddie County is the privately-owned Pamplin

Historical Park and the National Museum of the Civil War Soldier, which includes interpretive and educational facilities, museums, a plantation home, and a system of trails. In recent years, the Appomattox River Regional Park opened along the Appomattox River in Prince George County; and the City of Hopewell opened phase I of its Riverwalk in Hopewell, linking downtown to the Hopewell Marina and enabling visitors to come by boat or car. There are five scenic river segments in the District including portions of the James, Appomattox, Chickahominy, and Nottoway Rivers. The confluence of the James and Appomattox Rivers at Hopewell serves as a gateway to the Lower Appomattox River Trail Greenway and Blueway, which traverses over 400 acres in six localities. This trail is currently under development and will be a 22-mile linkage of all recreational, cultural and natural features, and historic sites on both sides of the Appomattox River between Lake Chesdin in Dinwiddie County and City Point in Hopewell. This project is spear-headed by the Friends of the Lower Appomattox River. A huge new asset is the Capital Trail linking Richmond and Williamsburg, which passes through Charles City County along Route 5. The Tri-Cities Area MPO has examined options for linking to that trail via Hopewell and Prince George County from Route 10. The District wants to have a plan when the Virginia Department of Transportation decides to replace the Benjamin Harrison Bridge in the future. History of the Crater District Portions of the Crater Region were established as the country was being established. Surry County, along the James River, was settled concurrently with Jamestown, just across the river. City Point, the oldest part of Hopewell and located at the confluence of the James and Appomattox Rivers, was established by Sir Thomas Dale in 1613 and became part of the Charles City Shire, one of Virginia’s eight original shires in 1634. Petersburg was a major port city in the 1700s, located along the Appomattox River, a commercial center for processing cotton, tobacco and metal. By the early 1800s when Petersburg became a rail center also, it was the second largest city in Virginia with manufacturers producing tobacco products, cotton and flour mills, iron works, and it was a banking center. The Pocahontas Island community was the largest community of free blacks along the Mid-Atlantic. Prince George County was formed from Charles City County in 1703, Dinwiddie County was formed from Prince George County in 1752, and Sussex County was formed from Surry County in 1753. Moving south, the City of Emporia, located in the center of Greensville County was formed in 1787 when two towns along the Meherrin River were merged. The Crater District was heavily impacted by the Civil War. The ten-month Siege of Petersburg was the longest siege on American soil and was the campaign that resulted in the fall of Richmond and Petersburg and General Lee’s surrender at Appomattox Courthouse one week to the day after Petersburg fell. During the 1900s, the counties’ economies were agriculturally based; however, Petersburg and Hopewell were major centers of manufacturing and commerce.

Hopewell was developed by DuPont in 1914 as Hopewell Farm, an incorporated area (a company town) in Prince George County- it was incorporated as an independent city in 1916. DuPont first built a dynamite factory there and then during World War I switched it to a gun cotton plant. It was abandoned by DuPont after World War I; however, the Tubize Corporation established a plant there in 1923. Since that time to today it has been home to large chemical plants owned by Honeywell Corporation, DuPont, Alliance Group Rock Tenn, Goldschmidt and Hercules Chemical Corporation. Located along Route 36 between Hopewell and Petersburg, in Prince George County, is Fort Lee, originally Camp Lee. Construction on Camp Lee commenced in June, 1917. It was not active after World War I until October, 1940, when a second Camp Lee was constructed. It was re-designated in 1950 as Fort Lee and continues to grow, doubling in size as a result of Base Realignment & Closure (BRAC) decisions in 2005. Petersburg was a retail and industrial center until the mid-to-late 1980s, when Brown & Williamson Tobacco Corporation left the City transferring its operations to Macon, GA in 1985, and the Southpark Mall retail complex was opened in Colonial Heights in 1989, just across the Appomattox River from Petersburg. The period of the 1970s and 1980s was also a time of suburbanization in the counties adjacent to the District’s cities. Economic development/jobs generation/tax base expansion became a central focus in all of the District’s localities. A key example was the location in 1972 of the Dominion Virginia Power Surry Power Station, the company’s first nuclear station, in rural Surry County along the James River. It continues to be a major employment center and taxpayer in Surry County. Other examples are: the location of two Rolls-Royce plants in Prince George County; Georgia Pacific, Boars Head and Beach Mold & Tool plants in Greensville County; and Gerdau Ameristeel, and Amazon, Wal-Mart and Aldi distribution centers in Dinwiddie County. In early 2020, Amazon announced that it will add another distribution center in Prince George County. The local governments created the Appomattox Basin Industrial Development Corporation (now Virginia’s Gateway Region), the Emporia-Greensville Industrial Development Corporation (replaced by Virginia’s Growth Alliance), and the Crater Planning District was designated as an EDA Economic Development District in order to bring more focus to economic development in the District and to more effectively pursue economic development opportunities. Even with the addition of major manufacturing plants, the interstate access, the retail hubs, the tourism attractions, government employees comprise the largest segment of employed persons in the Crater District. The District sits just south of Virginia’s capital city, Richmond, on I-95. There are a variety of options for government employment in addition to Fort Lee. The Defense Supply Center Richmond is in Chesterfield County just north of Colonial Heights, Virginia State University and John Tyler Community College are in neighboring Chesterfield County and Richard Bland College of William and Mary sits along the Petersburg-Dinwiddie County-Prince George County boundary, there are state and federal correctional facilities in Prince George, Greensville and

Sussex Counties, and state behavioral health facilities in Dinwiddie County, as well as the ten local governments and nine public school divisions (Emporia and Greensville County have a joint school system). Employment Structure Fort Lee represents one-eighth of the Crater District’s economy. Following the conclusion of the 2005 Base Realignment & Closure (BRAC)-directed expansion at Fort Lee (the base essentially doubled in size), the Nathalie P. Voorhees Center at the Chicago campus of the University of Illinois conducted an economic impact analysis. The report, The Economic Impact of Fort Lee on the Petersburg Region, released in September, 2012, concluded that Fort Lee’s overall economic impact to the Crater District is $2.4 billion per year. This study was commissioned by the U. S. Office of Economic Adjustment within the Defense Department. The study delineated three categories of economic impact: direct; i.e. direct federal spending on personnel and procurement; indirect, i.e. contractors’ spending on materials and services; and induced, i.e. Fort Lee employees spending in the region’s marketplace. As of December, 2019, Fort Lee reported that there is a supported population on post of 28,580 people (military permanent party, students, civilian employees, contractors and active duty military dependents) and a supported population off post of 62,920 people (active duty military and dependents, reservists and dependents and retirees and dependents). A review of the District’s 30 largest employers (see Table _) reveals that 13 are government employers. A review of the top 50 employers reveals that 22 are government entities. The Quarterly Census of Employment and Wages for July-September, 2019, reports that of the 67,739 persons employed in the District, 24.7% are employed in the government sector. Employees are spread throughout other industry sectors, with only two showing a concentration of employment above 10%: Health Care and Social Assistance-14.8%, and Wholesale & Retail Trade-12.9 percent. The remaining sectors follow: Manufacturing – 9.9% Accommodations & Food Services – 9.9% Transportation & Warehousing – 6.8% Administrative Support & Waste Management – 4.8% Construction – 4.1% Other Services (except Public Administration) – 3.1% Utilities – 1.9% Professional, Scientific & Technical Services – 1.9% Finance & Insurance – 1.4% The remaining sectors have an employment concentration of less than one percent, and they are: Real Estate & Rental Leasing; Arts, Entertainment & Recreation; Management of Companies & Enterprises; Educational Services; Agriculture, Forestry, Fishing & Hunting; Mining, Quarrying & Oil & Gas Extraction, and Information. It should be noted that from the CEDS adopted last year to this one, 3,765 fewer people are in the workforce. On the positive side, Manufacturing employment was up 0.4%, as

was Construction Employment. Employment in Government fell by 1%. Transportation & Warehousing remained the same at 6.8%. Population According to estimates prepared by the Weldon Cooper Center for Public Service of the University of Virginia for July 1, 2019, the population of the Crater District is 179,382. As Table 2 illustrates, the rate of population growth for the District is declining, with seven of the ten localities having experienced a decline in population since 2010, the cities of Colonial Heights, Emporia and Petersburg, and Charles City, Greensville, Surry and Sussex Counties. The decrease in the District’s population was less than one percent from 2010 to 2019, while the increase in Virginia’s population during the same time period was 6.7 percent.
Table 2
Population Estimates for the Crater District Change since 2010 Census Numeric Change
Area July 1, 2019
Estimate April 1, 2010
Census Numeric Change
Percent Change
Charles City 7,016 7,256 -240 -3.3 Colonial Heights 17,194 17,411 -217 -1.2 Dinwiddie 28,667 28,001 666 2.4 Emporia 5,589 5,927 -338 -5.7 Greensville 11,408 12,243 -835 -6.8 Hopewell 22,718 22,591 127 0.6 Petersburg 31,430 32,420 -990 -3.1 Prince George 37,350 35,725 1,625 4.5 Surry 6,561 7,058 -497 -7.0 Sussex 11,449 12,087 -638 -5.3 Crater District 179,382 180,719 1,337 -0.7 Virginia 8,535,519 8,001,024 534,495 6.7 Source: Weldon Cooper Center For Public Service of the University of Virginia, “July
1, 2019 Population Estimates for Virginia, and its Counties & Cities”, January 27, 2020.
The District’s population increased by 3.8 percent from 2000-2010. A review of the population growth in Virginia’s 21 planning districts during the 2010-2019 period reveals that 12 of the 21 districts experienced population growth, with the greatest growth occurring in the Richmond, Fredericksburg and Northern Virginia regions.

Census data for 1980, 1990 and 2000 revealed that the District lost population during the 1980s, with the exception of Prince George and Surry Counties and the City of Emporia, which experienced population growth. The Crater District’s 3.5 percent loss in population was a stark contrast to the state’s increase of almost 16 percent. It was during that decade (1985) that the Planning District was designated as an EDA Economic Development District. The District experienced population growth of 6.9 percent during the 1990s and all localities grew except the cities of Hopewell and Petersburg. Growth during this period ranged from 2 percent in Emporia to 35.2 percent in Greensville County. A significant factor in Greensville County’s growth during that period was the location of a large state correctional facility during that time period. Growth; however, was sluggish when compared to Virginia’s population growth of 14.4 percent during the nineties. Between 2000 and 2010, the Census Bureau data reflects a slowing of growth, with the District growing at 3.8 percent, and Virginia growing at 13.0 percent. An examination of the entire 30 year period, 1980-2010, reveals growth in the District of 7.2 percent or 0.24 percent per year. By far, the locality in the District with the highest growth, according to the Census Bureau was Prince George County- 38.8 percent since 1980, or 1.3 percent per year. During the same 30-year timeframe, Virginia grew at a rate of 1.65 percent per year (see Table 3). Looking farther out, as presented on Table 4, the Weldon Cooper Center at the University of Virginia projects that by 2040, the District’s population will be 179,539, which reflects a decline of -0.2%, while Virginia’s average annual rate of growth will be 0.5%.

Table 4
Population Projections: 2030 & 2040
2010 Census
Population Projected
2030 Projected
2040 Charles City 7,256 6,941 6,816 Colonial Heights 17,411 17,766 17,680 Dinwiddie 28,001 30,473 31,857 Emporia 5,927 5,317 5,111 Greensville 12,243 11,144 10,817 Hopewell 22,591 22,781 22,433 Petersburg 32,420 30,166 28,328 Prince George 35,725 39,408 40,674 Surry 7,058 6,282 5,992 Sussex 12,087 10,657 9,831 Crater Planning District
180,719
180,935
179,539
Virginia 8,011,024 9,331,666 9,876,728 Source: U. S. Bureau of the Census, 2010; Weldon Cooper Center of the University of
Virginia, Total Population Projections for Virginia and its Localities, 2020-2040.
When reviewing population growth in the Crater District, there is a unique circumstance that must be considered (see Table 5). While 3.0 percent of Virginia’s 2010 population resides in Group Quarters, 8.1 percent of the population in the Crater District resides in Group Quarters. Even more striking are the percentages in Greensville, Sussex and Prince George Counties, which were 30.0 percent, 32.3 percent and 13.3 percent respectively. In addition to Fort Lee being located in Prince George County, a large federal correctional facility is there along with a large regional jail. Both Greensville and Sussex Counties have very large state correctional facilities, and Dinwiddie County has a state mental hospital, and the Richard Bland College dormitories. These institutions offer jobs for District residents and they generate economic impact; however, these populations cannot be counted as part of the District’s labor force. Three exceptions to that might be Fort Lee, as persons transition from military to civilian life some remain here for employment; Virginia State University, located in Chesterfield County along its boundary with Petersburg, from which some graduating students remain in the region for employment; and some of the graduating students from Richard Bland College of William & Mary who do not choose to continue their higher education remain here.

Table 5
Population in Group Quarters: 2009-2013
Total No. in Group Quarters
Charles City 0 Colonial Heights 194 Dinwiddie 881 Emporia 226 Greensville 3,676 Hopewell 208 Petersburg 844 Prince George 4,756 Surry 0 Sussex 3,908 Crater District 14,693 Virginia 241,331
Source: U. S. Department of Commerce, Bureau of the Census, 2009-2013 American
Community Survey. Table 6 reflects a far more rural population in the Crater District than would be found when looking at Virginia as a whole or at the United States. Actually, between 2000 and 2010, the percentage of the population in the Crater District that is rural increased from 41.8% to 42.7%, while the rural population in Virginia and the U. S. declined.
Table 6
Population-Urban & Rural-2010
Area % Urban % Rural Crater District 57.3% 42.7% Virginia 75.5% 24.5% United States 80.7% 19.3% Source: U. S. Bureau of Census, 2010. The data related to population density in Table 7 reflects the mix of urban and rural areas in the District.

Table 7
Population Density by Locality
Area
2010 Population Land Area (Sq. Miles)
Density (People/Sq. Mile)
Charles City 7,256 183 39.7 Colonial Heights 17,411 8 2,176.4 Dinwiddie 28,001 504 55.6 Emporia 5,927 7 846.7 Greensville 12,243 296 41.4 Hopewell 22,591 10 2,259.1 Petersburg 32,420 23 1,409.6 Prince George 35,725 266 134.3 Surry 7,058 279 25.3 Sussex 12,087 491 24.6 Crater District 180,719 2,067 87.4 Source: U. S. Bureau of the Census, 2010. Summary of Economic Development Conditions A current detailed summary of economic development-related conditions within the Crater District can be found in Appendix I. The Virginia Employment Commission, through its labor market information system, maintains a current community profile of regions within the Commonwealth of Virginia. The community profile centers on demographic, economic and education profiles of the Crater District. The Crater Planning District Commission has found the Virginia Employment Commission to be a great partner in maintaining the Crater District’s community profile of current relevant economic development-related information.

CLUSTER ANALYSIS A cluster is defined as a geographic concentration of interrelated industries or occupations. Industry clusters can form and grow because of a region’s competitive advantage- resources such as location, trained labor and education systems. The Location Quotient (LQ) is reflective of the size of the circle; the larger the circle, the larger the location quotient. A location quotient greater than 1.0 indicates that the region has a higher concentration of employment in a particular industry or occupation than the nation, while a location quotient less than 1.0 indicates the region has a lower concentration of employment in the cluster than the nation. If a regional industry group has a location quotient of 1.25 or higher, it is considered to possess a competitive advantage in that industry. Average wages are shown on the vertical axis. The higher the circle is shown on the chart, the higher the average wages in the cluster. The forecast growth rate for a cluster is the annual average percentage change in employment expected over the given period, shown along the horizontal axis. The farther to the right a cluster’s circle is shown, the greater the growth expected in that cluster. Key questions to be answered utilizing cluster analysis are:
• Are the largest concentrations of employment in my region in clusters that are expected to grow or decline?
• Which industry clusters can be supported in economic development efforts to
increase regional wages?
• Which clusters can be supported to support future employment growth? Chmura Economics & Analytics provided an analysis of the District’s industry clusters for the 4th quarter of 2018 (October-December) utilizing data from the U. S. Bureau of Labor Statistics. A review of Table 8 clearly illustrates that the industry most dominant in the District is the Chemical industry, which is an industry in which the District has a distinct competitive advantage, with a location quotient (LQ) of 2.40. It employs over 5,008 people and it is a high wage industry with average wages of $81,291; however, it is a declining industry with an average annual employment growth rate over the coming ten years showing a contraction of 1.0% per year. Other industry sectors in which the District enjoys a competitive advantage are: Utilities (LQ of 1.54), Public Administration (LQ of 1.46), Freight Transportation (LQ of 1.27), Construction (LQ of 1.25).

Current Initiatives The official opening of the U. S. Foreign Affairs Security Training Center (FASTC) at Fort Pickett took place on November 14, 2019. FASTC is the nation’s largest provider of foreign affairs security training and is located on a 1,350 acre site at Fort Pickett. The $440 million Center provides hard-skills security training annually to 10,000 Diplomatic Security Service special agents, security staff, other Department personnel and the foreign affairs community. The FASTC campus includes three high-speed driving tracks, off-road and improved tracks, explosive ranges, tactical structures to simulate risk of serious injury or death situations and two smokehouses for situations when fire is used as a weapon. Training also includes land navigation, capstone exercise (used to prepare for large scale emergencies), and scenarios involving a mock embassy compound. In addition, FASTC employs 400+ personnel and the Center’s economic impact spreads across Central Virginia. For more information, visit the State Department’s website at https://state.gov/FASTC. Richard Bland College of William & Mary received a GO Virginia grant to develop a business plan utilizing key partners in the development of an applied associate’s degree in Aeronautics with a stackable credential in Small Unmanned Aerial Systems (UAS). The drone portion of this proposal will include working with the Dinwiddie County Airport Authority. The Crater PDC and Petersburg Area Regional Tourism (PART) are working with Fort Lee to finalize the concept of forming a “Museum Enclave” which will allow visitors to the museums direct access from Route 36 without the requirement of going through a security checkpoint. Such access would be a big enhancement for the tourism program managed by PART, as visitors could go to the museums without delay. In September, 2019, Governor Northam released the 2018 Virginia Tourism economic impact data, which showed an overall increase in tourism expenditures statewide of 4.4% over 2017. The Crater Commission continues to administer Petersburg Area Regional Tourism, as well as support other jurisdictions pursuing initiatives to grow tourism. The 2018 report indicated that visitors in 2018 spent $395.4 million in the PART region, a 4.2% increase over 2017. The ten local governments within the Crater District collected over $31.8 million in local tax revenues. Tourism supports 4,400 jobs generating a payroll of $92.5 million within the Crater District. Thus, increased hospitality and tourism spending is an important contributor to this region’s economy. The “Friends of the Lower Appomattox River” (FOLAR) works to enhance access to the Appomattox River from Lake Chesdin to the confluence of the Appomattox and James Rivers in Hopewell. In the past decade, FOLAR has raised more than $2 million for use in building facilities which improve the quality of life of the region’s residents and promote tourism to the region. FOLAR is a great example of regional collaboration that can work if you have leadership and support by individuals who have a passion for a cause.

FOLAR completed the development of the Appomattox River Trail Plan (ART), as well as a wayfinding/signage effort, which provides the blueprint for completion of the trail system along the Appomattox River. FOLAR has turned to the implementation of projects that are recommended in the ART Plan. FOLAR received a $250,000 grant from The Cameron Foundation as well as a $100,000 challenge grant from the Mary Morton Parson Foundation to help complete the Appomattox River Trail. The Commission staff has agreed to help in the updating of the 2020 BUY FRESH BUY LOCAL Regional Guide for local foods, farms and farmers markets with the support of the South Centre Corridors RC&D. The new Guide will be ready for distribution during the Spring opening of the region’s farmers markets. Copies of the brochures will be available at the Commission office. There are economic development initiatives underway that reflect the District’s desire to: 1) plan on a longer-term basis, 2) seek opportunities for higher-wage, high-technology, 21st century jobs and 3) ensure that educational opportunities exist to support those efforts. The Commonwealth Center for Advanced Manufacturing (CCAM) is located on the Rolls-Royce campus in Prince George County. It is an applied research center that provides production-ready advanced manufacturing solutions to member companies across the globe. The research university partners are: Virginia State University, Virginia Tech, University of Virginia, Virginia Commonwealth University, and Old Dominion University, which work with and for 26 major global corporations that are CCAM members. In addition to its research, CCAM has a workforce development component, equally important to bringing higher-wage, advanced manufacturing jobs to the District. Its focus is to leverage CCAM’s resources and industry contacts to help regional partners establish an industry-centric, high performance workforce that makes southern Virginia the sites of choice for advanced manufacturing firms. In January, 2020, Richard Bland College of William & Mary (RBC) and the Commonwealth Center for Advanced Manufacturing (CCAM) signed a Memorandum of Understanding to jointly establish an Advanced Manufacturing Academy. The Academy will train students pursuing careers in the high-demand fields of robotics and automation. Programming will complement the Commonwealth’s tech talent pipeline by preparing graduates for high-paying technology-related jobs in fields that align with traded-sector growth opportunities. Students will gain access to cutting-edge, industry-driven curricula, which will collectively enhance the advanced manufacturing ecosystem. This innovative experiential learning program allows students to gain credentials and training in high-tech occupations through an earn-while-you-learn model that combines structured classroom and virtual instruction. Program development will offer stackable credentials from dual enrollment to industry certificates, career studies certification, associate degrees, and partnerships with 4-year universities for advanced degrees.

The curriculum incorporates apprenticeships, internships, job shadowing, and courses that will bridge the gap in soft-skill development. The RBC/CCAM Academy will be open to students, incumbent workers, and transitioning military personnel. GO Virginia announced a $100,000 grant to support this initiative. The Commonwealth Center for Advanced Logistics Systems (CCALS) is also a collaborative of business, government and universities with a mission to transform industry by improving the complex system of technological, mechanical and human factors that enable logistics. The District’s location along interstate highways with dual rail access and close proximity to the Port of Virginia, coupled with the Army’s “capital” for logistics- Fort Lee and the Army Logistics University, located here, compelled the collaboration and examination that brought CCALS into being. Its partners include: Virginia State University, Longwood University, University of Virginia, Virginia Commonwealth University, The Port of Virginia, Virginia Economic Development Partnership, LMI, Fort Lee and Old Dominion University. CCALS has a multi-year research partnership with the Port of Virginia. Three phases of the Southside Virginia Education Center are complete. This facility in Greensville County, operated by Southside Virginia Community College, is enabling District residents to further their education while continuing to work or while residing at home. It is a place to obtain a GED, or to earn an industrial certification- obtaining a higher level of skills to enhance opportunities for job advancement. Development work continues on the Mid-Atlantic Advanced Manufacturing Center site, a certified mega site of 1,545 acres located in Greensville County adjacent to I-95. It is a joint initiative of the County, City of Emporia and Mecklenburg County. The City completed a major upgrade of its water treatment plant, which will serve this site and Greensville County is undertaking an upgrade of its wastewater treatment facilities. In addition to its interstate access, the site has CSX main line rail access and a direct route to the Port of Virginia. GO Virginia announced a $2.2 million grant to Greensville County for enhancements to the Mid-Atlantic Advanced Manufacturing Center. In addition, Dominion Virginia Power built and opened a state-of-the-art natural gas-fired power station in Greensville County at a cost of $1.3 billion. The power plant brings major positive economic impacts to the region and can generate 1,588 megawatts of electricity. Virginia’s Gateway Region, a regional economic development organization located within the Crater District, received a $100,000 GO Virginia grant to evaluate and determine business site readiness of 21 sites located throughout the region. This is supportive of and compatible with Virginia’s Business Ready Sites Program that has assigned numerical tier status to Virginia’s certified business sites.

ECONOMIC DEVELOPMENT OPPORTUNITIES AND CHALLENGES Opportunities Department of Defense investments in the Crater District and in adjacent areas provide substantial job opportunities and help to drive the District’s economy. As the District moves forward, advanced manufacturing and logistics will drive the economy here, as well. Fort Lee/Military Assets – According to the Voorhees Center report, The Economic Impact of Fort Lee on the Petersburg Region, September 2012, Fort Lee represents one eighth of the District’s economy, with annual economic impact of $2.4 billion and generating more than $124 million in state and local tax revenue. Fort Lee essentially doubled in size as a result of the 2005 BRAC actions and is now the “Logistics Capital of the Army” and home to the Army Logistics University. During 2014 the District, working cooperatively with Fort Lee, completed the Fort Lee Joint Land Use Study. There were two working groups which oversaw this effort composed of a variety of stakeholders and an extensive public participation process was implemented. The purpose of the study was to proactively look at encroachment broadly interpreted, to include frequencies, air quality, air space, wastewater, as well as development around Fort Lee. The study found that most of Fort Lee’s operational impacts and hazards are contained within its existing boundary, it is primarily surrounded by natural and man-made boundary features, and Fort Lee and the region have a compatible growth pattern. The District, working with the adjacent six local governments and Fort Lee, have developed a regional geographic information system (GIS) database for monitoring land use changes in the region around Fort Lee, which was a key study recommendation. In terms of opportunities, the fact that Fort Lee and the region have undertaken this study gives it a positive asset should Fort Lee be considered in future base realignment and closure reviews or other military realignment/reorganization considerations. The District continues to be diligent in monitoring discussions at the federal level recognizing that Fort Lee could be a candidate for additional functions to relocate on post. Fort Lee recognizes that its two museums are very valuable assets and is embracing the idea of designing/facilitating a museum enclave by which visitors will be able to directly access the U. S. Army Quartermaster and Women’s Museums without passing through a security checkpoint. The Commission and Petersburg Area Regional Tourism have been encouraging this development and involved in the planning of it. There is a very large ordnance training facility that could open to the public in the future and all three buildings are located together and very close to Route 36 which bisects Fort Lee. A strong Fort Lee Civilian-Military Council, which meets quarterly, provides a positive mechanism for installation-community dialogue. There is broad representation from Fort Lee as well as the six neighboring jurisdictions and other regional partners. This
excellent communication continues to result in other opportunities, such as the large number of volunteer hours that Fort Lee provides to community projects, clean-ups, school activities. Also, as a result of federal budgetary issues, Fort Lee will be seeking to do even more via public-private partnerships, which offers opportunities for the District’s businesses. An additional Fort Lee asset that contributes toward strengthening the District’s available workforce is the opportunity to access soldiers transitioning out of the military. These people offer skills, discipline and work experience, all of which are valuable to area employers. There are two other military facilities that provide jobs/opportunity. The Defense Supply Center Richmond is located just north of the District in Chesterfield County, between the District and Richmond. A Virginia Employment Commission economic impact analysis recently reported that this facility has an annual impact of $375 million on the District’s economy and employs 3,000 persons (primarily civilian). On November 14, 2019, the U. S. Foreign Affairs Security Training Center (FASTC) opened on a 1,350-acre site at Fort Pickett (partially located in southwestern Dinwiddie County). This $440 million facility trains 10,000 Diplomatic Security Service personnel annually. Even throughout construction, hotels in the Crater Region housed personnel who were planning, building the facility which brought economic impact. Now that it is operational, the Crater Region is home to employees and hotels are housing trainees, as there is no lodging facility on Fort Pickett, and no hotels in its immediate area. Rolls-Royce Campus- There are two Rolls-Royce advanced manufacturing plants in Prince George County, one which manufactures engine discs and the second is an advanced airfoil machining facility. The County has provided broadband to the Rolls-Royce campus and there are “ready” building pads for Tier 1 suppliers to Rolls-Royce. The Rolls-Royce location has enlightened the Crater Economic Development District as to the needs of today’s advanced manufacturers. Rolls-Royce recently announced the addition of 100 new jobs and an investment of $40 million in new equipment at its Prince George County location. Research & Development Centers- Two highly innovative and collaborative centers of excellence have been established in the Crater District, the Commonwealth Center for Advanced Manufacturing (CCAM) and the Commonwealth Center for Advanced Logistics Systems (CCALS). The 2020 Virginia General Assembly approved legislation which creates the Commonwealth of Virginia Innovation Partnership Authority (VIPA), which will oversee and support research, development and commercialization, as well as related investment and seed-stage funding, in the Commonwealth. Both CCAM and CCALS will be brought under this authority. VIPA will be responsible for developing an Innovation Index for the Commonwealth. The Commonwealth Center for Advanced Manufacturing (CCAM) is located on the Rolls-Royce campus and is a partnership among five research universities: University of Virginia, Virginia State University, Virginia Tech, Virginia Commonwealth University and Old Dominion University, along with 26 global member corporations. CCAM accelerates the transition of research innovation from the laboratory to commercial use. Rolls-Royce was one of the eight CCAM organizing partners.

CCAM also has a workforce development component which was established to work with the CCAM members and regional partners to help establish an industry-centric, high performing workforce that makes southern Virginia the site of choice for advanced manufacturing firms. A next step occurred on January 16th, when Richard Bland College of William and Mary and CCAM signed a Memorandum of Understanding to establish the Advanced Manufacturing Academy. This Academy will train students pursuing careers in the high-demand field of Robotics and Automation. Programming will complement Virginia’s tech talent pipeline. The Commonwealth has agreed to fund $25 million toward the construction of the academy and the U. S. EDA announced a $3.15 million grant to help build it. The CCAM development director sits on the Crater District’s CEDS Committee. Establishment of The Commonwealth Center for Advanced Logistics Systems (CCALS) was an initiative of the Crater Planning District Commission in response to the District becoming the heart of an expanding logistics region within the Richmond Metropolitan Area and its connectivity to Hampton Roads, as evidenced by: its location within 750 miles of two-thirds of the U.S. population; accessibility to the growing deepwater Port of Virginia (drive of 2 hours or less via Routes 460 or 58), which becomes even more significant with the opening of the Panama Canal; the district’s excellent road and rail network – I-95, I-85, I-295, Routes 288, 460 & 58, intersection of CSX & Norfolk Southern lines at Collier Yard; Fort Lee’s logistics mission and home to the Army Logistics University; and locations of large distribution facilities, including Amazon, Wal-Mart, Food Lion, Aldi, Perdue & Boar’s Head Provisions in the District. CCALS is also a collaboration of public and private partners and universities, including: Fort Lee, Virginia State, Virginia Commonwealth and Longwood Universities, University of Virginia, Old Dominion University, Port of Virginia, Crater Planning District Commission, Virginia Economic Development Partnership, Virginia Chamber of Commerce and private logistics-related companies. It offers business and government agencies with significant logistics operations a unique, collaborative research and development method that promises to cut costs, accelerate new discoveries and deliver transformative results to the technology, transportation, human and other systems that enable logistics. Access, Transportation Network - The Crater District is very fortunate to have a number of attributes that make it attractive for investment and development, including its accessible mid-Atlantic location and its excellent transportation network. It sits within a two-hour drive to the nation’s capital, to the mountains and to the seashore. Its location on the mid-Atlantic seaboard is within a 500-mile radius of the major U. S. eastern markets.

Interstates 95 and 85 run through the middle of the District with I-295 running parallel to I-95 around Richmond and Petersburg. Both I-295 and Route 288 provide eastern and western linkages to I-64. Routes 460, 58 and 10 are major east west linkages to the growing Port of Virginia. Both Norfolk Southern and CSX serve the District and these two lines converge in Petersburg. While air service is primarily provided by Richmond International Airport, portions of the District are reasonably convenient to airports in Newport News and Norfolk. Additionally, there are three general aviation airports serving the Crater District, in Dinwiddie, Greensville and Sussex Counties. Deep water channels on the Appomattox and James Rivers provide important access to the Port of Richmond and the Port of Virginia. Megasites –While the District has a strong inventory of available sites and buildings available for development, two megasites, one in Greensville County and one in Sussex County, offer significant opportunities in the District for large employers. The Mid-Atlantic Advanced Manufacturing Center (MAAMC) is the region’s only certified megasite composed of 1, 545 acres along I-95 with CSX main line rail access and is a 90-minute drive to the Port of Virginia. It is a regional partnership involving Greensville and Mecklenburg Counties and the City of Emporia. The certification, announced in January, 2008, means that this site is suitable for automotive assembly operations and other major advanced manufacturing facilities. There are 1.9 million people residing within a 60-mile radius of the site including all of the Crater District. The Commonwealth’s GO Virginia initiative awarded MAAMC $2.2 million for utilities infrastructure upgrades. The Sussex County Megasite is located adjacent to U. S. Route 460 north of the Town of Waverly and 10 miles east of the I-295/Route 460 interchange. It encompasses 1,100 acres, with plans available to expand to 1,835 acres. It is served by Norfolk Southern and the drive time to the Port of Virginia is one hour. Tourism - Expanding the District’s economic base through tourism offers opportunities in every District locality. During 2018, travel expenditures in the District totaled $290.4 million, which generated $7.9 million in local tax receipts. Travel expenditures increased by 4.1 percent over 2017 expenditures, according to data compiled by the U. S. Travel Association for Virginia Tourism Corporation. Petersburg Area Regional Tourism (PART) markets Chesterfield, Dinwiddie and Prince George Counties and Colonial Heights, Hopewell and Petersburg through its website, https://bestpartva.org, television and print advertising, a regional visitor guide and trade show participation, as well as working collaboratively with the Virginia Tourism Corporation and local tourism staff. During 2019-2020, PART launched a new website, the first overhaul since PART was established in 2006. It is much more visual with significant technology upgrades. In spring, a new visitor guide was published, also more visual with less emphasis on copy. It also has a strong focus on the region’s dining options, its outdoor and entertainment options. A partnership with the local newspaper in Petersburg for printing enables it to be a very cost effective marketing piece.

The District is located along I-95, I-85 and I-295, so visitor access is easy. The cities are working on initiatives to revitalize interstate exits, and downtowns. All four cities sit on rivers also, which offers outdoor recreation opportunities. Two new hotels have been announced in Colonial Heights (I-95 Exit 53) and a developer in Petersburg is planning to restore the old Hotel Petersburg in the historic Old Towne neighborhood. A new outdoor facility, Tree Time Adventures opened in Prince George County. The Friends of the Lower Appomattox River (FOLAR) have adopted an Appomattox River Trail (ART) Plan that, when completed, will encompass a connected trail system along the Appomattox River through North Dinwiddie, Petersburg, Colonial Heights, Prince George, Chesterfield and end in Hopewell at the confluence with the James River. There are segments open in all of those jurisdictions. Surry County has a tourism visitor center and the County partnered with the cities of Suffolk and Franklin and Southampton, Isle of Wight, and Sussex Counties on a thematic driving tour, The Salty Southern Route. Currently, working with Petersburg Area Regional Tourism, Fort Lee is configuring a new entrance from Route 36 directly into the parking area for the museums in order to accommodate visitors who will not have to go through the security gates. This will encourage more visitation to the military museums. The District’s history, strategic location, rivers, urban/rural mix, growing downtowns all serve as attributes which will continue to draw visitors to the Crater District. There are also ongoing improvements along the Appomattox and James Rivers to enhance public access, provide park and natural areas and develop trails. Tourism is a major contributor to the District’s overall excellent quality of life. Those attributes, facilities, attractions that draw visitors to the District also provide opportunities to draw residents and economic investment here. Challenges Fiscal Stress - While the most recent Fort Lee expansion, research and development centers of excellence and Rolls-Royce development offer significant opportunities, along with the future development of major industrial properties, and growing visitor expenditures, the Crater District remains fiscally stressed. These constraints make it difficult for localities to make the necessary long-term investments, particularly in high cost infrastructure projects, without substantial federal and/or state assistance. For fiscal year 2017, the most recent reported data, the top three most fiscally stressed localities in Virginia were: No. 1- Emporia, No. 2- Petersburg, and No. 3- Hopewell. Sussex County (25th), Greensville County (29th), Colonial Heights (32nd), and Dinwiddie County (68th), were ranked as having an above-average level of fiscal stress. Prince George County (76th) and Charles City County (79th) were ranked in the below-average level of fiscal stress, and Surry County (123rd) was deemed to be a low fiscal stress locality. There are 133 counties and cities in Virginia. The state calculates fiscal stress through a summary statistic combining relative stress scores based on the revenue capacity per capita, revenue effort and median adjusted gross income.

This continuing level of fiscal stress is related to the low revenue capacity per capita, which is also calculated annually by the Virginia Commission on Local Government. In fiscal year 2017, the state’s average revenue capacity per capita was $2,105.18, and only the City of Colonial Heights and Charles City and Surry Counties exceeded that capacity; the eight remaining localities had less capacity than the state average. The Cities of Petersburg and Hopewell had the fourth and ninth lowest revenue capacity per capita in the state at $1,184.21 and $1,303.34 respectively. The real estate tax is the primary source of local revenue in Virginia. For FY 2019, the City of Petersburg imposed the third highest real estate tax rate in Virginia at $1.35/ $100 of assessed value. The rates for the cities of Colonial Heights, Hopewell and Emporia were $1.20, $1.13 and $0.90 respectively. This is evidence of those localities making a maximum level of local effort. Of Virginia’s 95 counties, Charles City, Dinwiddie, Prince George and Surry Counties imposed real estate tax rates higher than 55 of Virginia’s counties. Thus, within the Crater District, the localities are limited in terms of their flexibility to generate local revenue. Localities that are fiscally stressed are unable to give sufficient attention to long-term investments, often investments in infrastructure must be delayed, “image” and quality of life amenities are set aside as revenue must go toward mandated education requirements, public safety and direct human services. Lack of Infrastructure – The District has been successful in attracting private investment in recent years, thus some of its inventory of “ready”, fully-serviced sites and buildings has been acquired. There are greenfield sites in the District that are not zoned for development, some of which have not been cleared. Many available buildings are outdated and unsuitable for today’s needs of manufacturers. They have insufficient ceiling heights, and many lack an adequate power supply or do not have a redundant power supply. Improvements continue on the Mid-Atlantic Advanced Manufacturing Center, the only CSX-certified mega industrial site with interstate frontage (I-95) in Virginia. This regional project is a partnership of Greensville and Mecklenburg Counties and the City of Emporia. State funding from the Commonwealth’s GO Virginia initiative was approved in summer, 2018, to get the 24-inch sewer line to the 1,600-acre site, develop engineering plans for the necessary upgrades to the Wastewater Treatment Plant, and advance this site to Tier 4 on the Virginia Economic Development Partnership’s Business Ready Site Characterization Scale. The necessary upgrade to the City of Emporia’s water treatment plant should be completed in 2022. The Sussex County megasite is located on just off of Route 460 with convenient access to I-295, I-95 and I-85. It has 1,130 acres. It sits in the Richmond Metropolitan Area and convenient to the Hampton Roads Metropolitan Area, with a one hour drive to the Port of Virginia. There is a wastewater plant on site and an electric substation, and Mid-Atlantic Broadband Cooperative provides the internet infrastructure.

EDA support has been critical to development of both of these major industrial sites. Additional investment will be needed to successfully locate a major employer to either location and rural counties do not have the financial capacity to develop these projects without outside support. While progress is underway, internet service continues to be a big challenge in the Crater District. Surry County, with state support and support from Dominion Energy, has partnered with Prince George Electric Cooperative to expand broadband service to residents and businesses throughout the County, and this project is underway. Prince George County was also the recipient of state technology funding to substantially expand broadband service in Prince George County. Prince George was already partnering with Prince George Electric Cooperative. Dinwiddie County is partnering with neighboring Amelia County to expand broadband service throughout Dinwiddie County. This project is being funded by Virginia Tobacco Commission dollars that the two counties are matching, and they have contracted with River Street Networks in North Carolina. This major project is in the early stages. Charles City County was awarded a state grant of almost $4.0 million for broadband service throughout that rural county. This topic has come to the forefront this year when schools and colleges closed as a result of the COVID-19 Pandemic and many students did not have internet access to continue school work at home. Adults who were required to work at home and live in the rural portions of the Crater District also realized how essential broadband service is. With regard to water, wastewater treatment, natural gas, and electricity infrastructure, the degree to which these utilities are available varies according to location in the Crater District. Similar to the concern about broadband, many portions of the District are unable to access natural gas. The Appomattox River Water Authority, which serves Colonial Heights, Petersburg and portions of Dinwiddie and Prince George Counties, along with Chesterfield County, has commenced long-range planning to consider how it will meet needs for water in the future. The South Central Wastewater Authority, which is a regional plant in Petersburg serving the same localities as the Water Authority, has localities that are “bumping up against” their allocations for treatment capacity. Major rain events cause problems as there are serious infiltration and inflow problems associated with Petersburg’s collection system. The South Central Wastewater Treatment Facility is facing a huge financial hurdle as the Commonwealth proceeds to implement water quality standards promulgated by EPA to assist in the clean-up of the Chesapeake Bay. The financial ramifications of nutrient removal are daunting and along with those come fears that these stringent environmental regulations could place in jeopardy hundreds of manufacturing jobs in the District. On the heels of these requirements have come new state mandated stormwater management regulations that are resulting in the imposition of new fees on residents and businesses.

The South Central Wastewater Authority serves the City of Petersburg, the City of Colonial Heights, Chesterfield County, Dinwiddie County and Prince George County. South Central Wastewater Authority (SCWWA) is currently permitted and designed for a flow of 23 mgd. The initial percentage of plant allocations in 1996 were: City of Petersburg-52.5%, City of Colonial Heights-20.0%, Chesterfield County-10.0%, Dinwiddie County-10.0%, and Prince George County-8.5%. Based on the FY2018 five year average flow distribution, member facility flow allocations are: City of Petersburg-55.8%, City of Colonial Heights-20.2%, Chesterfield County- 8.5%, Dinwiddie County-8.5%, and Prince George County-6.9%. Based on projected growth in base domestic wastewater flows and assuming a reduction in excess wet weather flows in SCWWA’s member collection systems, the SCWWA Treatment Plant is not expected to exceed the current permitted capacity of 23 mgd over the next twenty years. Historic flows have averaged from approximately 11 to 14 mgd annually with peak flows exceeding 70 mgd. The SCWWA routinely meets all required monthly VPDES permit effluent limits and generally exceeds removal requirements on discharge permit conventional parameters. The SCWWA also holds a General Permit with permitted Total Nitrogen and Total Phosphorus annual wasteload effluent limits required to be met in relation to the Chesapeake Bay Watershed Implementation Plan target levels. The current permitted wasteload allocation for Total Nitrogen is 350,239 pounds per year and for Total Phosphorus is 28,404 pounds per year. The SCWWA has been purchasing Total Nitrogen nutrient credits in order to meet the annual Total Nitrogen wasteload allocation and meets the Total Phosphorus annual wasteload allocation by chemical addition removal. At the present facility flow rating of 23.0 mgd, the corresponding Total Nitrogen concentration is 5.0 mg/l at the permitted wasteload allocation. We can expect that the SCWWA will be facing lower Total Nitrogen annual wasteload limits as time progresses, possibly down to the 3.0 mg/l effluent concentration level. Estimated process improvement costs to reach this Total Nitrogen effluent level could be in the $40-50M range. Additionally, aging facility infrastructure improvements would also be needed and might be expected to cost in the $15-20M range along with wet weather improvements costing upwards of $17-23M. Total facility upgrade costs could be expected to be in the $72-93M range. The Commonwealth’s Water Quality Improvement Fund would be expected to provide grant funds towards approximately 20 to 30% of the nitrogen removal costs. The regulatory driven enhanced nitrogen removal facility upgrade project is expected to begin in year 2023.
Regional Water Supply The Appomattox River Water Authority (ARWA), which serves Colonial Heights, Petersburg and portions of Dinwiddie and Prince George Counties, along with Chesterfield County, continues long-range water resource planning and analysis to provide for how it will meet the needs of its members in the future. The table below provides a summary of the allocation of ARWA's treatment capacity of 96 mgd to each of the five jurisdictions.

ARWA Member Allocations
Member Percentage Allocated (%) Peak Day
(mgd) Prince George County 2.9 2.8
City of Colonial Heights 4.4 4.2 Dinwiddie County 6.8 6.5 City of Petersburg 16.7 16.0
Chesterfield County 69.3 66.5 Total 100% 96.0
The population for the region is anticipated to continue to grow steadily over the next fifty years. The projected growth of the region's population is based upon historical population growth trends and expected future land use conditions. Chesterfield County is one of Virginia's largest Counties and one of the Commonwealth's fastest growing communities. The table below provides the anticipated regional population growth trend. Note that the population growth projections are for the region, which encompasses more than just the area supplied by ARWA.
Regional Population Data and Projections Year Chesterfield
County
City of Colonial Heights
Dinwiddie County
City of Petersburg
Prince George County
2000 259,903 16,897 24,533 33,740 33,047 2005 291,000 17,567 25,800 31,300 36,900 2010 327,840 18,904 32,324 32,324 42,067 2020 398,300 20,541 34,376 34,576 51,920 2030 468,300 22,000 36,429 36,429 60,754 2040 583,300 22,000 38,481 38,481 71,132 2050 608,300 22,000 40,534 40,534 82,322
2060
678,300 22,000 42,534 42,586 97,643 (1) Population projections begin at Year 2010. (2) Population build-out capacity reached in 2030.
The Appomattox River Water Authority is continuously reviewing alternatives and options related to long term planning to increase the raw water supply and safe yield of the Chesdin Reservoir. Based upon the water treatment plant’s current capacity of 96 mgd, modeling analysis on the Chesdin Reservoir in January 2018 showed that the Reservoir is a very reliable raw water source at current system demand levels and that with demand growth projections, the reservoir will still be able to maintain all performance objectives for the next forty plus years. ARWA's projected water demands are summarized below.

Projected ARWA RawWater Demand 2005-2080
Higher-Skilled, Well-Trained Workforce – There is ongoing strong concern and focus on the Crater District being able to provide a highly skilled, motivated and well-trained workforce for the 21st century workplace. This is the issue that the CEDS Committee spent much of its time on in the preparation of the Five-Year Comprehensive Economic Development Strategy in 2019 and the issue that it will continue to concentrate on in the coming year. The impetus for the District’s focus on workforce development in the Crater District came out of involvement by the District’s participation and involvement in the development of Blueprint Virginia, 2025, an initiative of the Virginia Chamber of Commerce to develop a long-range economic development plan, which was presented to Virginia’s governor. Every four years an update of the Plan is presented to Virginia’s new incoming governor. One of the 2025 Plan’s six pillars is “Investing in a Well-Trained Talent Supply Pipeline”. The Plan points out that the availability of a well-trained and educated workforce remains the top concern for Virginia’s business community. According to data compiled by the Virginia Department of Education, in February, 2020, 1,779 students graduated from high school in the Crater District. Of that number, 1,259 (70.8%) went on to some form of continuing education - a two year college, a four-year college or university or some other continuing education program. For Virginia, the percentage of students continuing their education was 80.2 percent. The remaining Crater District graduates moved into military service (4.9%), immediately entered the workforce (25.1%) or had no plans (10 students). During that same 2018-2019 school year, 241 students in grades 7-12 dropped out of school in the Crater District.

Since 2015, there has been little change in the number of high school graduates (up by 43 students) and the number continuing their education is close to the same (drop from 71.0% to 70.8%); however, the number going directly into the workforce increased from 21.3% to 25.1%. The other significant change is in the number of dropouts- 2015- 165 students; 2019- 241. When examining how the District compares to Virginia, in 2019 80.2% of the graduates went on to continue their education almost 10% more than in the Crater District (70.8%). For the Crater District it was reported that 423 graduates (23.8%) went directly into the workforce, while for the state as a whole, that percentage was only 11.9%. In recent years research is revealing that jobs in the 21st century require education beyond high school, technical certifications, but do not require a 4-year bachelor’s degree. In 2019, 497 of the Crater District’s graduates went to two-year colleges, 27.9% of the graduates, which reflected a decrease from 2015- 31.9%. The percentage of Virginia’s 2019 high school graduates going to a two-year college was 26.7%. The high numbers of persons living in poverty in the Crater District, certainly impacts the ability of some students to pursue higher education immediately upon high school graduation. The high number of residents who reside in correctional facilities and behavioral health facilities also affects the number of workers available to employers. The District’s unemployment rate is in line with the U. S. unemployment rate. For March, 2020, the unemployment rate for the Crater District was 4.5 percent, as was the unemployment rate for the United States. The March unemployment rate for Virginia was 3.3 percent. Unemployment rates in the District ranged from a low of 3.4 percent in the City of Colonial Heights to 5.1 percent in the City of Emporia, 5.2 percent in Sussex County and 6.6 percent in the City of Petersburg. So in spite of a very strong Virginia economy in the past year, the Crater District lags behind. These numbers for March (the most current available from the Virginia Employment Commission) do not reflect the impacts of the Covid-19 pandemic that is upon us as this CEDS update is being written. According to U. S. Census Bureau American Community Survey data for 2011,2015, 18.4 percent of the District’s population over the age of 18 does not have a high school diploma or GED, and 36.9 percent of those 18 and older did not proceed to further education beyond high school or attainment of a GED. The Crater Regional Workforce Development Group’s Strategic Plan 2017-2020 (Vision 2020) aligns with articulated state goals, which are focused upon career pathways, outreach to the Virginia Workforce Network, business services, credential attainment and industry sector/pipeline expansion. The Crater District has resources for education beyond high school, including technical skills training and college degree programs. One is the Commonwealth Center for Advanced Manufacturing, working with the Tobacco Region Revitalization Commission on skills training for high demand advanced manufacturing jobs, and its recent announcement of collaboration with Richard Bland College of William & Mary.
John Tyler Community College has two campuses in adjacent Chesterfield County to the north and Southside Virginia Community College has a campus in adjacent Brunswick County to the south. Southside Virginia Community College also has a satellite facility in Greensville County, the Southside Virginia Education Center, which offers a variety of skills training programs. Virginia State University sits adjacent to downtown Petersburg. Students of all ages can easily access additional opportunities for continuing education or workforce skills/certification programs within or immediately adjacent to the District. A new initiative announced by the Virginia Tobacco Commission in January of this year was a second round of the Student Loan Repayment Talent Attraction Program, which was established to encourage recent college graduates to live in the tobacco region (Dinwiddie, Greensville, Sussex Counties and City of Emporia in the Crater District) during the 24-month period of employment in which the award is made and work in targeted hard-to-fill occupations in the Tobacco Region. It would provide up to $12,000 annually in student loan repayment with a two-year commitment and it may be renewed for another two years if eligible. The jobs include: hard-to-fill teaching positions such as STEM subjects or special education, industrial, electrical engineer, information security, network, computer systems analyst, physical or occupational therapist, speech language pathologist. The Commonwealth Center for Advanced Logistics Systems (CCALS) is also focused upon the employment needs of the growing logistics sector in the region with its five university members. There is a substantial shift toward modeling & simulation in the training of the health care workforce, which is in line with the efforts of CCALS. The Crater District has expressed formal support for development of the Advanced Manufacturing Academy at CCAM. This initiative was also identified and supported in the Virginia Chamber’s Blueprint Virginia 2025. Regional Cooperation - The CEDS Committee continues to identify regional cooperation as a challenge in the Crater District. There is always room for improvement in the intergovernmental cooperation arena. Virginia’s unique governmental structure of independent cities contributes to stresses that are inherent as local governments work together to identify issues and solve problems. In Virginia, cities are totally separate from counties; there is no tax/revenue sharing. It is a complicating factor when business representatives do not really identify local boundaries; they see labor market areas, but local governments are forced to recognize local boundaries because of revenue and cost implications of projects. Within the Crater District, Virginia’s Gateway Region provides regional economic development services for all of the localities except Emporia and Greensville, which are promoted by the Virginia’s Growth Alliance. Charles City County has a local economic development office. The Crater District supports and hosts Petersburg Area Regional Tourism, another regional approach which is charged to market six localities to bring visitors here: Chesterfield, Dinwiddie and Prince George counties and the cities of Colonial Heights, Hopewell and Petersburg. While the localities may have a local tourism function, it was decided that the marketing function could be more cost effectively implemented regionally as visitors do not recognize boundaries and go into and out of localities frequently as they explore.

Additionally, within the Crater District there are seven separate chambers of commerce. The overall “regional” message can be diluted by the multiplicity of chambers. The expansion of Fort Lee and the unanimity of commitment throughout the District to welcome that growth of new citizens and to meet the needs of Fort Lee has been an outstanding example to the District of how accomplishments can be achieved through regional cooperation. The challenge will be to address other regional issues with the same level of commitment. Poor Health Indicators – This year the Robert Wood Johnson Foundation released its annual County Health Rankings. The Foundation calculates each locality’s ranking by weighing the following: Health Behaviors (includes alcohol & drug use, tobacco use, diet & exercise, sexual activity) – 30 percent; Social & Economic Factors (includes education, employment, income family & social support, community safety) – 40 percent; Clinical Care (includes access & quality) – 20 percent; and Physical Environment (includes air & water quality, housing & transit) – 10 percent. The Crater District, with the exception of Prince George County (ranked 37), ranks poorly in terms of health factors, with two localities falling into the third quartile- Dinwiddie County ranked 73, and Surry County at 95. The remaining seven localities fall within the bottom quartile, with the City of Petersburg ranked last. The other jurisdictions’ rankings are: Colonial Heights (105), Charles City County (116), Greensville County (118), Sussex County (120), City of Emporia (126), and City of Hopewell (129). This data present an additional challenge to Crater District employers, as a workforce that is not healthy is certain to have an effect on the costs of doing business in the District.

VISION STATEMENT The Crater District is recognized as an excellent location in which to invest, live, work, learn and raise a family. It offers an innovative, highly skilled, healthy and motivated workforce. The District’s fully serviced sites and buildings, with technologically advanced infrastructure, result in higher wage employment opportunities, innovative products and processes and increased private investment. Visitors are attracted to its natural beauty, rich history and cultural enrichment opportunities, which support the District’s excellent quality of life.

IMPLEMENTATION PLAN The Crater Planning District Commission is the region’s facilitator, collaborating and cooperating with its growing regional network to address the challenges that hinder this District in its efforts to produce a highly skilled and motivated workforce, expand and diversify the regional economy by facilitating job growth in new technology sectors, strengthen and expand the District’s small business base, and assist in and support the provision of state-of-the-art public infrastructure. As a part of the Crater Planning District Commission’s economic development planning responsibility, the District subscribes to “Jobs EQ”, which was developed by Chmura Economics and Analytics in Richmond, Virginia. It is a web-based software system that provides current economic, demographic and educational statistics compiled for a locality or localities, or for particular regions, as defined by the user. Included are industry forecasts, entrepreneurial activity, labor inventory, employment trends, and workforce productivity. This resource can also be used to develop customized reports for business prospects. Access enables the District to remain current, while also examining trends and to provide very useful information to the member localities and to its numerous partners. This CEDS Update does not represent a shift in focus. The Crater District has been focused on its challenges, i.e. fiscal stress and the high level of poverty, aging infrastructure and infrastructure that does not meet current environmental requirements, as well as a lack of technology infrastructure, an aging workforce and a prospective workforce that does not have the skills and necessary certifications or education to qualify for jobs in the 21st century workplace and a population that has poor health indicators, at the same time working to engage its partners and expand its circle of partners to meet the identified goals and objectives in recent years. The GO Virginia Initiative is becoming a major impact program for the region. The Fort Lee expansion, development of Rolls-Royce and the Commonwealth Center for Advanced Manufacturing, and plans for the advanced manufacturing academy have been catalysts for renewed enthusiasm and a sense of optimism. This growth has caused a strengthened focus on the “regional” economy, it has caused more public dialogue, and the District’s regional network continues to grow. The collaboration of business and higher education at CCAM, along with Fort Lee’s expertise and concentration in logistics spawned the Commonwealth Center for Advanced Logistics Systems (CCALS) and highlighted for the region its logistical assets, many of which have always been here (proximity to the Port of Virginia, excellent mid-Atlantic location, excellent road and rail network); however, regional leaders had not really focused upon “connecting the dots” previously. The Mid-Atlantic Advanced Manufacturing Center in Greensville County is “ready” for a large employer and Sussex County has a megasite under development positioned between I-295 and the Port of Virginia. This regional network includes: Fort Lee, the two regional economic development organizations – Virginia’s Gateway Region and Virginia’s Growth Alliance, ten local governing bodies and local government staff, nine public school divisions, Crater Small Business Development Center of Longwood University, Crater Procurement Technical

Assistance Center, Crater Regional Workforce Development Group, the Tri-Cities Area Metropolitan Planning Organization, Commonwealth Center for Advanced Manufacturing, Commonwealth Center for Advanced Logistics Systems, Virginia Tobacco Region Revitalization Commission, VA Economic Development Partnership, Virginia Chamber of Commerce, local chambers of commerce, GO Virginia Region 4 Regional Council, The Cameron Foundation, The John Randolph Foundation, Petersburg Area Regional Tourism, public utilities, Virginia State University, Richard Bland College of William & Mary, John Tyler Community College, Southside Virginia Community College, Longwood University, Community College Workforce Alliance and Commonwealth of Virginia agencies. In addition to pursuit of funding for the grant projects presented, the District will partner with its network participants in the coming year to promote economic development and opportunity, foster effective transportation access, enhance and protect the environment, maximize opportunities for developing a highly skilled and motivated workforce, expand the District’s economy by facilitating job growth in advanced manufacturing and technology, entrepreneurship, small business expansion and tourism, support the agricultural community by growing the District’s “Buy Fresh Buy Local” initiative and identify funding to support critical new infrastructure, in particular technology-related infrastructure. While every goal and objective is important as we work to move the Crater District forward, the consensus appears to be that a workforce prepared for the 21st century workplace is where the District will continue to push forward. It will require much collaboration and coordination; however, business, government and education appear poised to move forward. The District is positioned geographically for high technology, higher- wage advanced manufacturing jobs and a nucleus of such employers has discovered this region. The “key” necessary element is a highly skilled and motivated workforce. A news release from the Commonwealth Center for Advanced Manufacturing said, “one of the biggest challenges in advanced manufacturing right now is access to qualified employees”. The goals and objectives which follow will only be achieved through the ongoing collaboration and cooperation that has become a hallmark of the Crater District. Strategies and decisions are evaluated and adjusted on a continuous basis as unknown and unexpected factors are encountered.

Goals and Objectives PRIORITY: A Highly Skilled and Motivated Workforce GOAL 1: Provide accessible workforce training programs for the development of
skills that match the needs of the region’s current and prospective 21st
century employers. Objectives: 1.1 Align the workforce with the needs of business and industry by providing a series
of connected education, training and support services (Crater Regional Workforce Development Board and Community College Workforce Alliance) to prepare participants for job placement, emphasizing three high-growth sectors:
Logistics Advanced Manufacturing Health Care
1.2 Support development of the Advanced Manufacturing Academy on the CCAM campus in Prince George County in conjunction with Richard Bland College of William & Mary.
1.3 Engage John Tyler Community College leadership with local school divisions,
higher education institutions and the business community to examine the potential for development of a regional Science, Technology, Engineering & Math (STEM) Initiative, which aligns with regional needs.
1.4 Engage the community colleges, Richard Bland College of William & Mary,
Virginia State University and other appropriate partners on expanding credentialing and certification pathways to ensure the availability of middle-skilled workers.
1.5 Support the establishment of the Academic Innovation Center at Richard Bland
College of William & Mary which will enable the College to expand its reach- add value to the Commonwealth by enhancing its capacity to develop and then offer flexible online programming, competency-based education, and other new technology-enhanced models for degree completion.
PRIORITY: An Expanded Use of Technology GOAL 2: Diversify the region’s economy and increase the number of higher-skilled
and higher-wage jobs by encouraging and facilitating job growth in advanced manufacturing, innovation, logistics and technology.
Objectives: 2.1 Support growth of private sector and public sector involvement in the
Commonwealth Center for Advanced Logistics Systems (CCALS) and utilize the
Center as a “magnet” for attracting logistics-related companies to the District working in conjunction with the Virginia Economic Development Partnership (VEDP).
2.2 Support expansion of the research and development programs at the
Commonwealth Center for Advanced Manufacturing (CCAM). 2.3 Support the Commonwealth of Virginia’s “Tech Talent” initiative to bring a
pipeline of employees to work in high-tech fields. PRIORITY: Strengthen and Grow the Small Business Base GOAL 3: Increase the number of jobs created by small businesses by strengthening the existing small business base, attracting new businesses and encouraging entrepreneurial start-ups and small business expansions through innovative commerce-based initiatives. Objectives: 3.1 Continue to assist and serve businesses to expand their market opportunities
through government contracting utilizing services of the Crater Procurement Technical Assistance Center.
3.2 Encourage military personnel exiting military service to remain in this region by
offering entrepreneurial training as a mechanism for generating additional potential employees and small business entrepreneurs in the District.
3.3 Continue to offer one-on-one counseling, workshops and loan packaging assistance
to small businesses and would-be entrepreneurs through the Crater Small Business Development Center of Longwood University.
3.4 Market and encourage the use of the Crater Planning District Commission’s EDA
Revolving Loan Fund program. 3.5 Support the availability of microloans to small businesses in the District through the
Crater Planning District Commission working cooperatively with the Crater Small Business Development Center of Longwood University.
3.6 Reach out to Crater District farmers and farmers markets and expand participation
in the District’s “Buy Fresh Buy Local” marketing initiative.

PRIORITY: Improve Underlying Infrastructure GOAL 4: Encourage and facilitate the provision of well-planned, state-of-the-art
public infrastructure that will attract higher-wage employers. Objectives: 4.1 Seek funding to extend information technology infrastructure (broadband, Wi-Fi
and fiber optic) to unserved portions of the District. 4.2 Coordinate with the Virginia Department of Transportation (VDOT) to make
improvements along the existing U. S. Route 460 corridor, a key linkage to the Port of Virginia, to enhance economic vitality and safety, as well as provide for viable emergency hurricane evacuation.
4.3 Support Greensville County in securing resources necessary to complete the Mid-
Atlantic Advanced Manufacturing Center, the only certified industrial megasite in the region.
4.4 Support Sussex County in efforts to secure the necessary resources to fully develop
a megasite north of the Town of Waverly along the U.S. Route 460 corridor. 4.5 Assist the District’s localities in pursuing revitalization of blighted areas, downtown
areas and redevelopment and re-use projects which offer a promising strategy for increasing employment and local revenues from tourism and retail trade.
4.6 Seek funding for water and sewer infrastructure upgrades throughout the Crater
District. 4.7 Coordinate with the Virginia Department of Transportation to make improvements
to the I-95/I-85 Interchange located in the City of Petersburg. 4.8 Coordinate with VDOT to make improvements to U. S. Route 58 in accordance
with the “Arterial Preservation Plan” and local government’s recommendations. 4.9 Coordinate with Fort Lee to bring the “Museum Enclave” Project to fruition. This
project will be a major public/private tourism partnership for the region. PRIORITY: GO Virginia Region 4 Programs GOAL 5: Support the development of programs of the GO Virginia Region 4
Regional Council to assist in the four major strategic priorities:
1. Accelerating Momentum on Workforce Development and Talent Attraction

2. Enhancing the Innovation/Information Technology Ecosystem
3. Increasing the Number of Ready-to-Go Business Sites
4. Supporting Potentially Transformative Projects in Emerging Clusters Related to IT and Bioscience
Objectives: 5.1 Support the VCU “Pharmacy on Demand” commercialization project which will
positively impact the AMPAC chemical plant located in the City of Petersburg. 5.2 Support the Mid-Atlantic Advanced Manufacturing Center’s GO Virginia proposals
to fund infrastructure to the mega-site located in Greensville County. 5.3 Actively engage with the CCAM Advanced Manufacturing Academy, which will be
a state-of-the-art training center that will deliver industry-driven workforce training leading to industry recognized certifications and high wage technician-level employment. Richard Bland College of William & Mary will be a key partner in this initiative.
5.4 Support the Virginia’s Gateway Region project to prioritize business/industrial sites
within the Crater region and move forward with the implementation phase. 5.5 Encourage new GO Virginia initiatives that will support the Crater Planning
District’s needs as identified in the CEDS as well as the GO Virginia strategic priorities such as the Rowanty Technical Center’s global logistics program for high school students.

PERFORMANCE MEASURES Performance measures are used to evaluate the level of successful development and implementation of the Crater Comprehensive Economic Development Strategy (CEDS). Performance measures are about identified outcomes and results. Thus, the Crater CEDS will be evaluated by the following: CCAM
• progress on establishment of the Advanced Manufacturing Academy and funding acquisition
• addition of corporate members CCALS
• progress on development as a “center of excellence” for logistics • progress on research for the Virginia Port Authority • addition of private sector partners
Workforce Development
• progress on development of regional initiatives for District STEM-H Programs • growth of students enrolled at Southside Virginia Education Center • progress of the region regarding the growth of credentialing and certification
programs Infrastructure Improvements
• progress on development of Mid-Atlantic Advanced Manufacturing Center and Sussex County Route 460 Megasite
• extension of broadband to underserved areas in District • acquisition of funding and progress on redevelopment of Exit 52 on I-95 (City of
Petersburg Gateway) • progress on making improvements to the I-95/I-85 Interchange located in the City
of Petersburg which is a Virginia corridor of statewide significance • progress on making improvements to the existing U. S. Route 460 which is partially
located within the Crater District. U. S. Route 460 is a Virginia corridor of statewide significance
• progress on making improvements to U. S. Route 58 in Emporia/Greensville County Area. U. S. Route 58 is a Virginia Corridor of statewide significance
Grow Small Business/Entrepreneurial Base
• track private investment/job creation resulting from work of Crater Procurement Technical Assistance Center and the Crater Small Business Development Center
• track private investment/job creation from new business locations/existing business expansions resulting from the efforts of the Virginia Economic Development Partnership, Virginia’s Gateway Region and Virginia’s Growth Alliance
• track participation in seminars, training programs, counseling for small business owners and would-be entrepreneurs

Tourism • track travel/tourism expenditure data provided by Virginia Tourism Corporation • track visitation numbers compiled by the National Park Service for battlefield
properties and other tourism assets in District • track inquiries received by Petersburg Area Regional Tourism • track Lodging, Sales and Meals Tax data by locality
GO Virginia
• Track the development of programs/projects that will go forward with the support of the GO Virginia Region 4 Regional Council.

SUPPORTING ECONOMIC RESILIENCY WITHIN THE CRATER DISTRICT The concept of resilience is not a new one. Resilience has been used in diverse academic and policy domains such as security, urban and regional planning, emergency preparedness, and disaster response. Resilience is about change, or to be more specific, adaptability to change. It is a concept concerned with how a system bounces back from an external shock or adjusts to a slow-moving internal challenge. When a local or regional economy falls on hard times and jobs are lost due to the decline of critical industries and foreign or domestic competition changes the competitive landscape, the natural reaction of community leaders is to work to replace the lost industry and associated jobs with like-for-like replacements that can return the employment base to normal. Economic developers are deployed with the task of replacing the lost companies and associated jobs while workforce development professionals often are called upon to develop job skill-building programs and other educational offerings designed to match the anticipated needs of replacement employers. Unfortunately, the external shock or internal system issues that led to the loss of employers and jobs in the first place can make it impossible to achieve this desired return to previous levels. The job creation and skill development measures enacted to create stability in the system may become ineffective when they are engaged to achieve an equilibrium end state that is no longer an option. Fostering resilience in a system becomes less about the return to a previous baseline and more about the ability of a system to handle the big swings and fluctuations brought on by changes in external conditions. Resilience is an adaptive process and a resilient system is one that continuously adapts and changes to respond to a new normal. Virginia is faced with the need to compete in a new economic environment where the competitive landscape has now shifted and a return to what worked in periods of previous economic strength may not be viable. Virginia is at a crossroads, facing critical issues that affect its economy. Virginia can no longer count on the federal government’s employment and spending contributions as in years past. Pre-recession, ever-increasing federal spending kept Virginia’s unemployment rate below the national average. But times have changed, and Virginia finds itself in a different position. Former Governor McAuliffe called for creation of The New Virginia Economy. The Virginia Economic Development Partnership’s key role in its construction is outlined in its Strategic Review 2015. It addresses each of The New Virginia Economy’s pillars, which are:
• Enhancing Our Infrastructure • Growing Our Strategic Industry Sectors • Promoting Our Competitive Business Climate • Nurturing a Sustainable Entrepreneurial Environment • Equipping Virginia’s Workforce with In-Demand Skill Sets
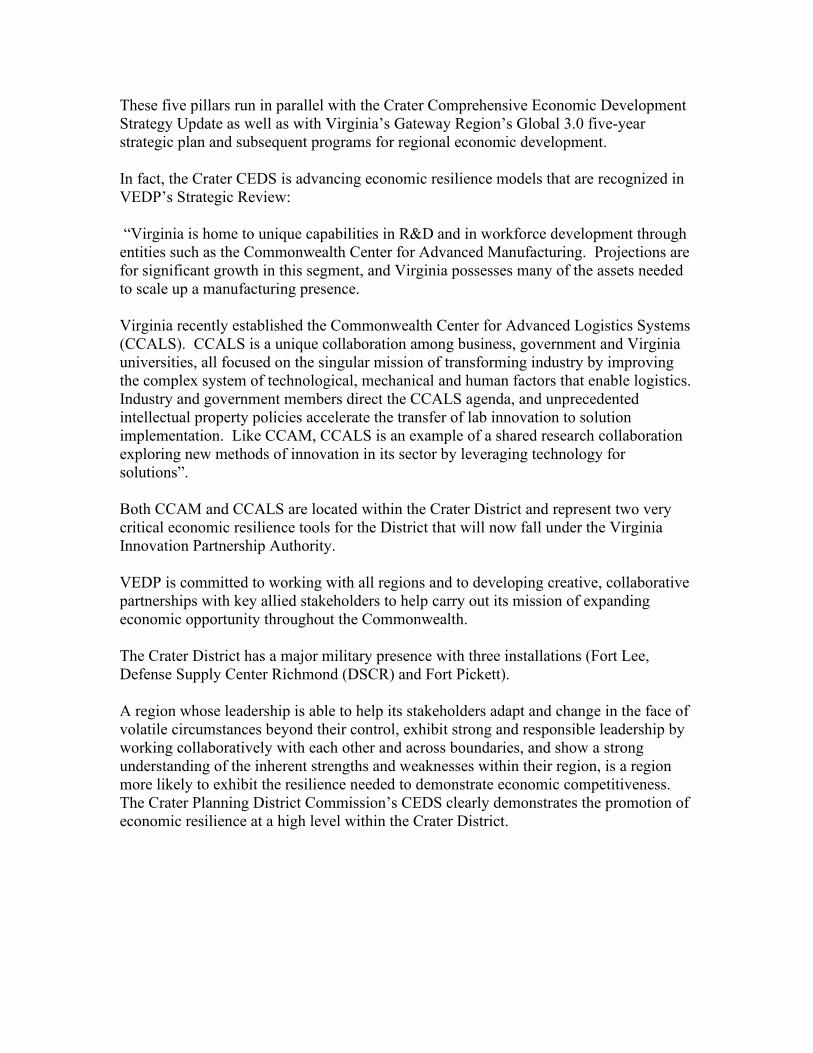
These five pillars run in parallel with the Crater Comprehensive Economic Development Strategy Update as well as with Virginia’s Gateway Region’s Global 3.0 five-year strategic plan and subsequent programs for regional economic development. In fact, the Crater CEDS is advancing economic resilience models that are recognized in VEDP’s Strategic Review: “Virginia is home to unique capabilities in R&D and in workforce development through entities such as the Commonwealth Center for Advanced Manufacturing. Projections are for significant growth in this segment, and Virginia possesses many of the assets needed to scale up a manufacturing presence. Virginia recently established the Commonwealth Center for Advanced Logistics Systems (CCALS). CCALS is a unique collaboration among business, government and Virginia universities, all focused on the singular mission of transforming industry by improving the complex system of technological, mechanical and human factors that enable logistics. Industry and government members direct the CCALS agenda, and unprecedented intellectual property policies accelerate the transfer of lab innovation to solution implementation. Like CCAM, CCALS is an example of a shared research collaboration exploring new methods of innovation in its sector by leveraging technology for solutions”. Both CCAM and CCALS are located within the Crater District and represent two very critical economic resilience tools for the District that will now fall under the Virginia Innovation Partnership Authority. VEDP is committed to working with all regions and to developing creative, collaborative partnerships with key allied stakeholders to help carry out its mission of expanding economic opportunity throughout the Commonwealth. The Crater District has a major military presence with three installations (Fort Lee, Defense Supply Center Richmond (DSCR) and Fort Pickett). A region whose leadership is able to help its stakeholders adapt and change in the face of volatile circumstances beyond their control, exhibit strong and responsible leadership by working collaboratively with each other and across boundaries, and show a strong understanding of the inherent strengths and weaknesses within their region, is a region more likely to exhibit the resilience needed to demonstrate economic competitiveness. The Crater Planning District Commission’s CEDS clearly demonstrates the promotion of economic resilience at a high level within the Crater District.

INTEGRATION WITH STATE PRIORITIES
Approximately one year before Virginia would elect its most recent governor, the Virginia Chamber of Commerce launched a statewide bottom – up effort to develop a long – range economic development strategic plan for Virginia, Blueprint Virginia 2025 - A Business Plan for the Commonwealth. The Plan was built through industry councils (8) and regional briefing sessions, including one in the Crater District. The six major priorities provide a focal point for the Plan: Investing in a Well-Trained Talent Supply Pipeline, Fostering a Competitive Pro-Business Climate, , Improving Infrastructure and Capacity for Business Leadership, Enabling Innovation & Entrepreneurship, Facilitating Regional Prosperity and Economic Development, and Creating a High Quality of Life and Place. It was presented to Virginia’s governor and has been embraced by his administration. The priorities indentified in the Crater District CEDS: Workforce, Technology, Infrastructure and Small Business are clearly articulated in “Blueprint”. The need to strengthen Virginia’s workforce is front and center in the State’s Plan as it is in the District’s CEDS. “Blueprint” speaks to STEM education and aligning it with regional needs, engaging the private sector, emphasizing collaboration (CCAM & CCALS), industry certifications, better utilizing veterans. These are all areas on which the Crater District intends to concentrate. The “Blueprint” document cites CCAM and CCALS, saying “replicate CCAM and CCALS approach for other industries”. The portion of “Blueprint” which addresses broadband urges expanding broadband coverage and establishing public- private partnerships to achieve optimal service. A section of “Blueprint” calls for additional small business financing, development of business incubators, promoting capabilities in federal contracting. The Crater District has a strong working relationship with the VA Economic Development Partnership, VA Department of Housing & Community Development and the VA Tourism Corporation, all of which are under Virginia’s Commerce and Trade secretariat. The Virginia Economic Development Partnership has indentified six target industry sectors and three are sectors in which the Crater District is strong: advanced manufacturing; transportation, distribution and logistics; and information technology. During its 2016 session, the Virginia General Assembly approved the Growth and Opportunity Act, known as GO Virginia, which provides a framework for strengthening the economy in each region of Virginia through enhanced collaboration by business, education, and local government encouraged and incentivized by the Commonwealth of Virginia.

An engaged business community in each region can provide leadership in cooperation with local government and educational officials to promote private-sector expansion in high-growth clusters, help small and large businesses find the qualified workers they need to grow, expand job opportunities for Virginians in the private sector, and make tax dollars go farther through greater efficiency and less duplication. To encourage this business-led collaboration in each of Virginia’s distinctive regions, GO Virginia provides financial and technical support from the Commonwealth that is matched by private, local, and other resources, providing a catalyst for projects that will encourage private-sector growth across a region or broader area rather than benefiting particular businesses. The Crater Planning District Commission and related partner entities are fully engaged in the implementation of the GO Virginia Initiative in Region 4 which is led by the GO Virginia Region 4 Regional Council.

APPENDIX I
SUMMARY OF ECONOMIC DEVELOPMENT CONDITIONS

Crater PDC
Virginia
703 East Main Street • Richmond, Virginia 23219Tel: (804) 786-8223 • www.VirginiaLMI.com
Virginia Employment Commission
Last updated: 4/18/2020 2:24:43 AM
Charles City County • Chesterfield County • Dinwiddie County • Greensville County • Prince George County • Surry County • Sussex County • Colonial Heights city • Emporia city • Hopewell city • Petersburg city

Table of Contents
I. Introduction
II. Demographic Profile
Population by Age Cohort
Population by Race/Ethnicity
Population by Gender
Population Change
Population Projections by Age and Gender
English Language Skills
Commuting Patterns
III. Economic ProfileUnemployment Rates
Employers by Size of Establishment
Employment by Size of Establishment
Employment by Industry
New Hires by Industry
Characteristics of the Insured Unemployed
50 Largest Employers
In-Commuting
Out-Commuting
Unemployment Insurance Payments
. . . . . . . . . . . . . . . . . . .
. . . . . . . . . . . . . . . . . . . . . . . . . . . . . . . . . . . . . . . . . . . . . . . . . . . . .
. . . . . . . . . . . . . . . . . . . . . . . . . . . . . . . . . . . . . . . . . . . .
. . . . . . . . . . . . . . . . . . . . . . . .
. . . . . . . . . . . . . . . . . . . . . . . . . . . . . . . . . . . . . .
. . . . . . . . . . . . . . . . . . . . . . . . . . . . . . . . . . . . . . . . . .
. . . . . . . . . . . . . . . . . . . . . . . . . . . . . . . . . . . . . . . . . . . . . .
. . . . . . . . . . . . . . . . . . . . . . . .
. . . . . . . . . . . . . . . . . . . . . . . . . . . . . . . . . . . . . . . . . . . . . . . . . . . . . . . . . . . . . . . . . . . . . .
. . . . . . . . . . . . . . . . . . . . . . . . . . . . . . . . . . . . . . . . . . . . . .
. . . . . . . . . . . . . . . . .
. . . . . . . . . . . . . . . . .
. . . . . . . . . . . . . . . . . .
. . . . . . . . . . . . . . . . . . . . . . . . . . . . . . . . . . . . . . . . . . . . . . . . . . . . . . . . . . . . . .
. . . . . . . . . . . .
. . . . . . . . . . . . . . . . . . . . . . . . . . . . . . . . . .
. . . . . . . . . . . . . . . . . . . . . . . . . . . . . . . . . . . . . . . .
. . . . . . . . . . . . . . . . . . . . . . . . . . . . . . . . . . . . . . . . . . . .
. . . . . . . . . . . . . . . . . . . . . . . . . . . . . . . . . . . . . . . . . . . .
. . . . . . . . . . . .
. . . . . . . . . . . .
. . . . . . . . . . . . . .
New Startup Firms . . . . . . . . . . . . . . . . . . . . . . . . . . . . . . . . . . . . . . . . . . . . . . . .
10
10
11
11
1213
20
20
22
24
15
21
18
23
6
7
7
8
9
4
5
Population Projections by Race/Ethnicity . . . . . . . . . . . . . . . . . .
9
Virginia Employment Commission Page 2 of 46
ContentsCrater PDC

Turnover by Industry
Average Weekly Wage by Industry
Age of Workers by Industry
Industry Employment and Projections
Occupation Employment and Projections
Growth Occupations
Declining Occupations
IV. Education ProfileEducational Attainment
Educational Attainment by Age
Educational Attainment by Gender
. . . . . . . . . . . . . . . . . . . . . . . . . . . . . . . . . . . . . . . . . . . . . .
. . . . . . . . . . . .
. . . . . . . . . . . . . . . . . . . . . . . . . . . . . . . . . . . . . . . . . . . . . .
. . . . . . . . . . . . . . . . . . . . . .
. . . . . . . . . . . . . . . . . . . . . . . . . . . . . . . . . . . . . . . . . . . . . .. . . . . . . . . . . . . . . . . . . . . . . . . . . . . . . . . . . . . . . . . . . .
. . . . . . . . . . . . . . . . . .
. . . . . . . . . . . . . . . . . .
. . . . . . . . . . . . . . . . . . . . . . . . . . . . . . . . . . . . . . . . . . . . . . . . . . . . . . . . . . . .
. . . . . . . . . . . . . . . . . . . . . . . . . . . . . . . .
. . . . . . . . . . . . .
. . . . . . . . . . . . .
Consumer Price Index (CPI) . . . . . . . . . . . . . . . . . . . . . . . . . . . . . . . . . . . .
Local Option Sales Tax . . . . . . . . . . . . . . . . . . . . . . . . . . . . . . . . . . . . . . . . . .
25
26
27
28
30
32
33
38
39
40
37
34
35
Educational Attainment by Race/Ethnicity
Graduate Data Trends
. . . . . . . . . . . . . . . .
. . . . . . . . . . . . . . . . . . . . . . . . . . . . . . . . . . . . . . . . . . . .
41
42
Training Providers . . . . . . . . . . . . . . . . . . . . . . . . . . . . . . . . . . . . . . . . . . . . . . . .
43
Virginia Employment Commission Page 3 of 46
ContentsCrater PDC

This report provides a community profile of Crater PDC. It is intended to complement the information found in our Virginia Workforce Connection application, which can be accessed online at:
www.VirginiaLMI.com
The report is divided into three major sections. The first contains a profile of regional demographic characteristics and trends, the second supplies similar information for the regional economy, and the third provides a profile of regional education characteristics.
I. Introduction
Virginia Employment Commission Page 4 of 46
IntroductionCrater PDC

II. Demographic Profile
This Demographic Profile provides an in-depth analysis of the population in Crater PDC. Most of the data is produced by the U.S. Census Bureau, and includes demographic characteristics such as age, race/ethnicity, and gender.
Related Terms and DefinitionsOverview
Ability to speak EnglishFor people who speak a language other than English at home, the response represents the person's own perception of his or her ability to speak English. Because census questionnaires are usually completed by one household member, the responses may represent the perception of another household member.
AgeThe age classification is based on the age of the person in complete years as of April 1, 2010. The age of the person usually was derived from their date of birth information. Their reported age was used only when date of birth information was unavailable.
GenderThe data on gender were derived from answers to a question that was asked of all people. Individuals were asked to mark either "male" or "female" to indicate their gender. For most cases in which gender was not reported, it was determined by the appropriate entry from the person's given (i.e., first) name and household relationship. Otherwise, gender was imputed according to the relationship to the householder and the age of the person.
RaceThe concept of race as used by the Census Bureau reflects self-identification by people according to the race or races with which they most closely identify. The categories are sociopolitical constructs and should not be interpreted as being scientific or anthropological in nature. Furthermore, the race categories include both racial and national-origin groups.
Please note: In the past, our population by race/ethnicity data has always excluded the Hispanic ethnicity from each race category. Starting in January 2013, each race category now includes all ethnicities.
Virginia Employment Commission Page 5 of 46
Demographic ProfileCrater PDC

Population by Age
PDC 19 Virginia United States
Under 5 years 30,356 509,625 20,201,362
5 to 9 years 33,414 511,849 20,348,657
10 to 14 years 35,053 511,246 20,677,194
15 to 19 years 36,686 550,965 22,040,343
20 to 24 years 29,584 572,091 21,585,999
25 to 29 years 30,375 564,342 21,101,849
30 to 34 years 30,861 526,077 19,962,099
35 to 39 years 33,557 540,063 20,179,642
40 to 44 years 36,625 568,865 20,890,964
45 to 49 years 40,304 621,155 22,708,591
50 to 54 years 38,557 592,845 22,298,125
55 to 59 years 33,943 512,595 19,664,805
60 to 64 years 28,967 442,369 16,817,924
65 to 69 years 20,096 320,302 12,435,263
70 to 74 years 13,730 229,502 9,278,166
75 to 79 years 10,346 173,929 7,317,795
80 to 84 years 7,747 130,801 5,743,327
85 years and over 6,754 122,403 5,493,433
496,955 8,001,024 308,745,538
Source: 2010 Census.
Virginia Employment Commission Page 6 of 46
Demographic ProfileCrater PDC

Population by Race/Ethnicity
PDC 19 Virginia United States
Total
Total Population 496,955 8,001,024 308,745,538
Race
White 305,746 5,486,852 223,553,265
Black or African American 150,658 1,551,399 38,929,319
American Indian or Alaska Native 2,360 29,225 2,932,248
Asian 12,160 439,890 14,674,252
Native Hawaiian/Pacific Islander 378 5,980 540,013
Other 13,582 254,278 19,107,368
Multiple Races 12,071 233,400 9,009,073
Ethnicity
Not Hispanic or Latino (of any race) 467,112 7,369,199 258,267,944
Hispanic or Latino (of any race) 29,843 631,825 50,477,594
Source: 2010 Census.
Population by Gender
PDC 19 Virginia United States
Male 243,862 3,925,983 151,781,326
Female 253,093 4,075,041 156,964,212
496,955 8,001,024 308,745,538
Source: 2010 Census.
Virginia Employment Commission Page 7 of 46
Demographic ProfileCrater PDC

Population Change
PDC 19 (% change)
Number Change Virginia (% change)
2000 433,958 7,079,030
2010 496,955 14.52 % 8,001,024 13.02 %
2020 532,223 7.10 % 8,744,273 9.29 %
2030 582,508 9.45 % 9,546,958 9.18 %
2040 623,730 7.08 % 10,201,530 6.86 %
Source: U.S. Census Bureau, Weldon Cooper Center for Public Service.
you can log on to our website today and see population counts from each Decennial Census all the way back to 1900? Looking for annual population estimates? We have those too, all the way back to the 1970s!
For this data and more, visit us on the web at:
www.VirginiaLMI.com
Did you know...
Virginia Employment Commission Page 8 of 46
Demographic ProfileCrater PDC

Number Change
Virginia Employment Commission Page 9 of 46
Demographic ProfileCrater PDC
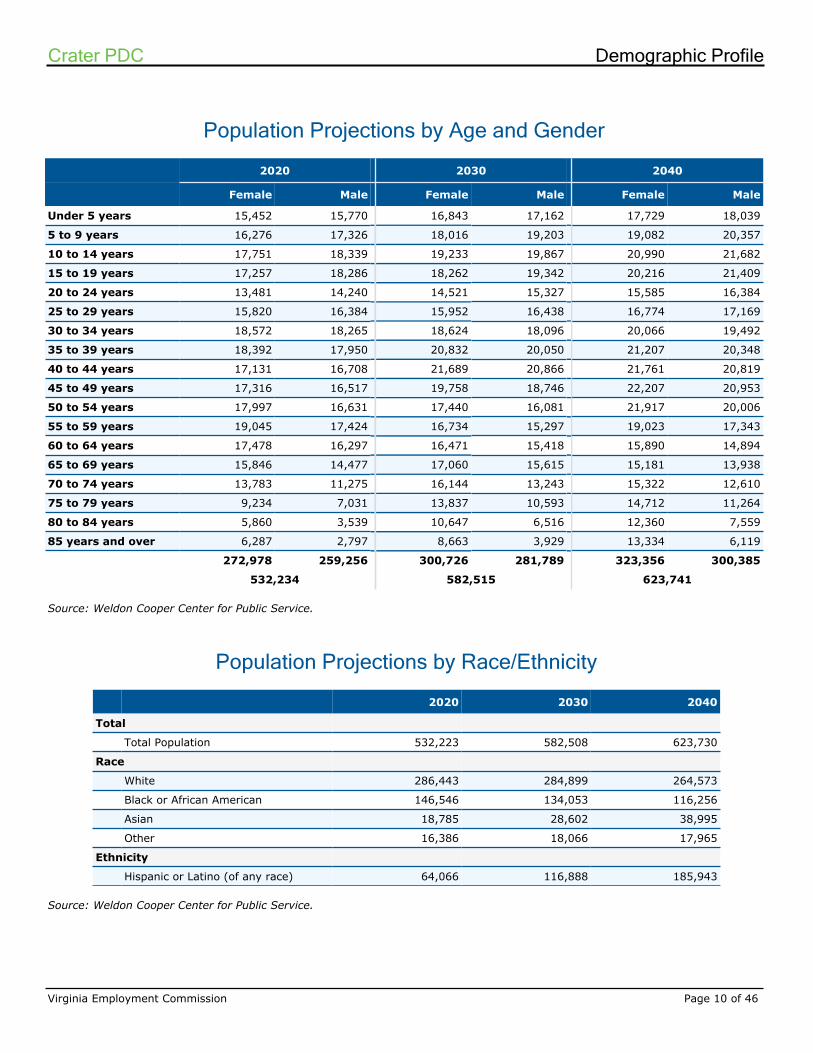
Population Projections by Age and Gender
2020 2030 2040
Female Male Female Male Female Male
Under 5 years 15,452 15,770 16,843 17,162 17,729 18,039
5 to 9 years 16,276 17,326 18,016 19,203 19,082 20,357
10 to 14 years 17,751 18,339 19,233 19,867 20,990 21,682
15 to 19 years 17,257 18,286 18,262 19,342 20,216 21,409
20 to 24 years 13,481 14,240 14,521 15,327 15,585 16,384
25 to 29 years 15,820 16,384 15,952 16,438 16,774 17,169
30 to 34 years 18,572 18,265 18,624 18,096 20,066 19,492
35 to 39 years 18,392 17,950 20,832 20,050 21,207 20,348
40 to 44 years 17,131 16,708 21,689 20,866 21,761 20,819
45 to 49 years 17,316 16,517 19,758 18,746 22,207 20,953
50 to 54 years 17,997 16,631 17,440 16,081 21,917 20,006
55 to 59 years 19,045 17,424 16,734 15,297 19,023 17,343
60 to 64 years 17,478 16,297 16,471 15,418 15,890 14,894
65 to 69 years 15,846 14,477 17,060 15,615 15,181 13,938
70 to 74 years 13,783 11,275 16,144 13,243 15,322 12,610
75 to 79 years 9,234 7,031 13,837 10,593 14,712 11,264
80 to 84 years 5,860 3,539 10,647 6,516 12,360 7,559
85 years and over 6,287 2,797 8,663 3,929 13,334 6,119
272,978 259,256 300,726 281,789 323,356 300,385
532,234 582,515 623,741
Source: Weldon Cooper Center for Public Service.
Population Projections by Race/Ethnicity
Source: Weldon Cooper Center for Public Service.
2020 2030 2040
Total
Total Population 532,223 582,508 623,730
Race
White 286,443 284,899 264,573
Black or African American 146,546 134,053 116,256
Asian 18,785 28,602 38,995
Other 16,386 18,066 17,965
Ethnicity
Hispanic or Latino (of any race) 64,066 116,888 185,943
Virginia Employment Commission Page 10 of 46
Demographic ProfileCrater PDC
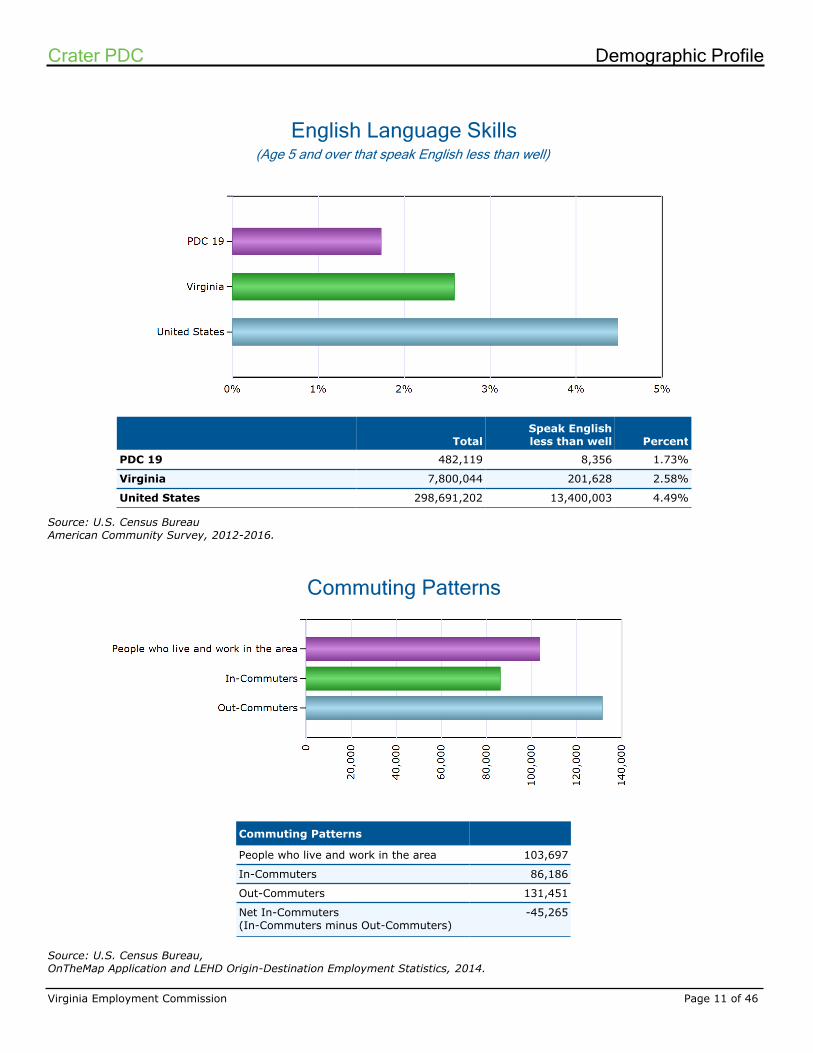
English Language Skills
TotalSpeak Englishless than well Percent
PDC 19 482,119 8,356 1.73%
Virginia 7,800,044 201,628 2.58%
United States 298,691,202 13,400,003 4.49%
Source: U.S. Census BureauAmerican Community Survey, 2012-2016.
(Age 5 and over that speak English less than well)
Commuting Patterns
Commuting Patterns
People who live and work in the area 103,697
In-Commuters 86,186
Out-Commuters 131,451
Net In-Commuters(In-Commuters minus Out-Commuters)
-45,265
Source: U.S. Census Bureau,OnTheMap Application and LEHD Origin-Destination Employment Statistics, 2014.
Virginia Employment Commission Page 11 of 46
Demographic ProfileCrater PDC

Top 10 Places Residents are Commuting To
Area Workers
Richmond city, VA 38,818
Henrico County, VA 35,320
Hanover County, VA 6,572
Fairfax County, VA 5,373
Goochland County, VA 3,335
Virginia Beach city, VA 2,595
Newport News city, VA 2,177
Chesapeake city, VA 1,814
Norfolk city, VA 1,804
Powhatan County, VA 1,557
Top 10 Places Workers are Commuting From
Area Workers
Henrico County, VA 17,225
Richmond city, VA 13,396
Hanover County, VA 4,922
Powhatan County, VA 3,373
Virginia Beach city, VA 2,155
Fairfax County, VA 1,803
Brunswick County, VA 1,554
Amelia County, VA 1,537
Prince William County, VA 1,483
Newport News city, VA 1,369
Source: U.S. Census Bureau,OnTheMap Application and LEHD Origin-Destination Employment Statistics, 2014.
Please Note: Commuting patterns data is no longer produced from the Decennial Census. As an alternative, we are providing commuting data from the U.S. Census Bureau's OnTheMap application and LEHD Origin-Destination Employment Statistics program. Since this data is produced from an entirely different data set, it is not advisable to compare the new data with previously released commuting patterns. For more information about the OnTheMap application or the LEHD program, please visit the following website:
http://lehd.ces.census.gov
Virginia Employment Commission Page 12 of 46
Economic ProfileCrater PDC

III. Economic Profile
The Economic Profile of Crater PDC consists primarily of data produced by the Virginia Employment Commission, U.S. Census Bureau, and the Bureau of Labor Statistics.
Related Terms and DefinitionsOverview
Average Weekly WageComputed as average quarterly wages divided by 13.
Consumer Price Index (CPI)The Consumer Price Index measures the average change over time in the prices paid by urban consumers for a representative market basket of consumer goods and services.
Local Employment Dynamics (LED)The Local Employment Dynamics Program at the Census Bureau, together with its state partners, provides employment information at the county, city, and Workforce Investment Area level. This information tracks workers in different industries by age and gender and provides statistics on job creation, separation, turnover, and wages.
Quarterly Census of Employment & Wages (QCEW)A federal/state cooperative program that collects and compiles employment and wage data for workers covered by state unemployment insurance (UI) laws and the federal civilian workers covered by Unemployment Compensation for Federal Employees (UCFE). These data are maintained at the state in micro and macro levels and also sent to BLS quarterly.
Unemployment Insurance (UI)Unemployment insurance is a program for the accumulation of funds paid by employers to be used for the payment of unemployment insurance to workers during periods of unemployment which are beyond the workers' control. Unemployment insurance replaces a part of the worker's wage loss if he becomes eligible for payments.
Unemployment RateThe number of unemployed people as a percentage of the labor force.
Virginia Employment Commission Page 13 of 46
Economic ProfileCrater PDC

Unemployment Rates
PDC 19 Virginia United States
2009 7.5% 6.7% 9.3%
2010 8.2% 7.1% 9.6%
2011 7.6% 6.6% 8.9%
2012 7.0% 6.1% 8.1%
2013 6.5% 5.7% 7.4%
2014 5.9% 5.2% 6.2%
2015 4.9% 4.5% 5.3%
2016 4.4% 4.1% 4.9%
2017 4.1% 3.7% 4.4%
2018 3.4% 3.0% 3.9%
2019 3.1% 2.8% 3.7%
Source: Virginia Employment Commission, Economic Information & Analytics, Local Area Unemployment Statistics.
Trends
Virginia Employment Commission Page 14 of 46
Economic ProfileCrater PDC
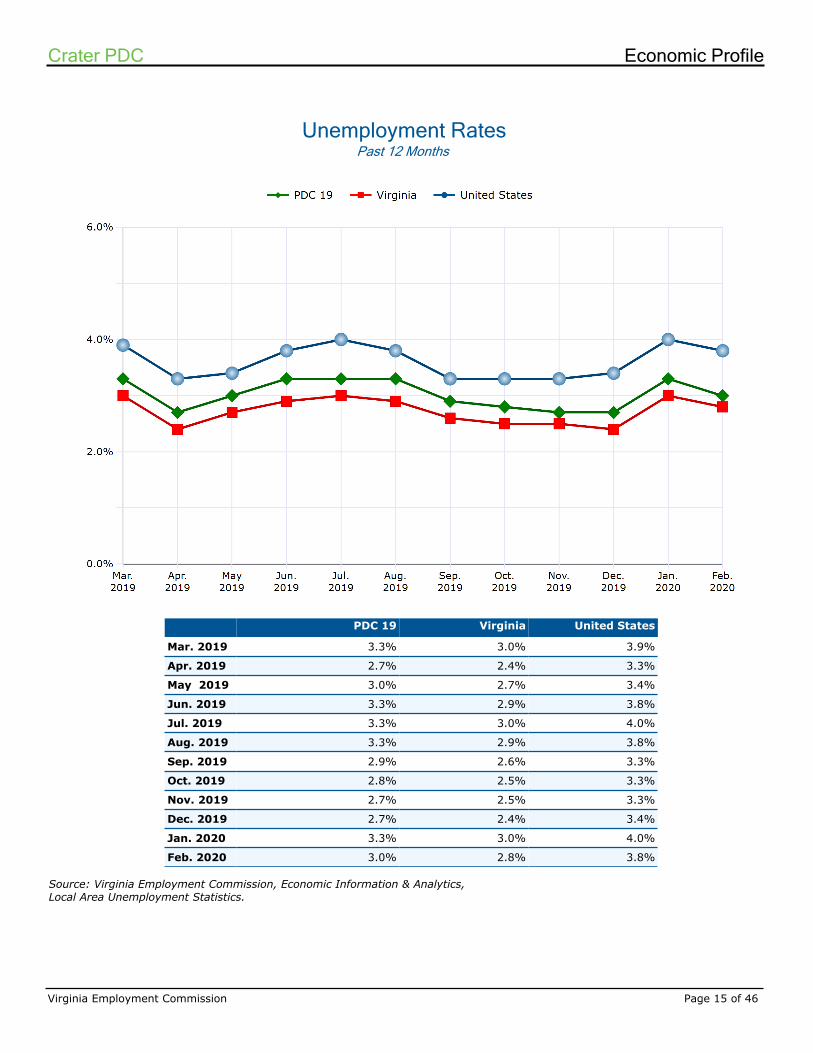
Unemployment Rates
PDC 19 Virginia United States
Mar. 2019 3.3% 3.0% 3.9%
Apr. 2019 2.7% 2.4% 3.3%
May 2019 3.0% 2.7% 3.4%
Jun. 2019 3.3% 2.9% 3.8%
Jul. 2019 3.3% 3.0% 4.0%
Aug. 2019 3.3% 2.9% 3.8%
Sep. 2019 2.9% 2.6% 3.3%
Oct. 2019 2.8% 2.5% 3.3%
Nov. 2019 2.7% 2.5% 3.3%
Dec. 2019 2.7% 2.4% 3.4%
Jan. 2020 3.3% 3.0% 4.0%
Feb. 2020 3.0% 2.8% 3.8%
Past 12 Months
Source: Virginia Employment Commission, Economic Information & Analytics, Local Area Unemployment Statistics.
Virginia Employment Commission Page 15 of 46
Economic ProfileCrater PDC

Characteristics of the Insured Unemployed
Age PDC 19 Virginia
Under 22 years 4 114
22 to 24 years 14 339
25 to 34 years 165 2,457
35 to 44 years 216 2,929
45 to 54 years 223 3,013
55 to 64 years 230 3,086
65 years and over 44 919
Unknown
Gender PDC 19 Virginia
Male 494 7,497
Female 402 5,360
Unspecified
Race PDC 19 Virginia
White 323 6,222
Black 504 5,331
American Native 1 66
Asian 5 260
Other 56 877
Hispanic or Latino 7 101
Education PDC 19 Virginia
8th Grade or Less 10 266
Some High School 49 888
High School Grad/GED 326 4,849
Some College/2-Yr Degree 191 2,617
Bachelor's Degree 109 1,536
Some Graduate School 6
Post Graduate Degree 58 654
Unknown 153 2,041
Crater PDC - (896 claimants)
Virginia - (12,857 claimants)
Source: Virginia Employment Commission, Economic Information & Analytics, Characteristics of the Insured Unemployed, March 2020.
Total number of claimants: 896
Virginia Employment Commission Page 16 of 46
Economic ProfileCrater PDC

Industry PDC 19 Virginia
Administrative and Support and Waste Management and Remediation Services
166 1,762
Construction 105 1,861
Health Care and Social Assistance 87 924
Professional, Scientific, and Technical Services 74 1,032
Unclassified 68 954
Accommodation and Food Services 44 708
Finance and Insurance 41 431
Retail Trade 38 581
Transportation and Warehousing 31 396
Wholesale Trade 27 338
Other Services (except Public Administration) 23 375
Manufacturing 19 257
Real Estate and Rental and Leasing 12 219
Information 9 197
Management of Companies and Enterprises 9 89
Educational Services 9 154
Arts, Entertainment, and Recreation 5 257
Agriculture, Forestry, Fishing and Hunting 2 120
Mining, Quarrying, and Oil and Gas Extraction 125
Utilities 11
(excludes unclassified)Top 5 Industries With Largest Number of Claimants in PDC 19
Source: Virginia Employment Commission, Economic Information & Analytics, Characteristics of the Insured Unemployed, March 2020.
Characteristics of the Insured Unemployed
Virginia Employment Commission Page 17 of 46
Economic ProfileCrater PDC

Characteristics of the Insured Unemployed
Occupation PDC 19 Virginia
Office and Administrative Support Occupations 156 1,707
Transportation and Material Moving Occupations 104 1,208
Unknown Occupation Code 99 1,580
Management Occupations 97 1,234
Production Occupations 78 1,209
Construction and Extraction Occupations 65 1,396
Sales and Related Occupations 46 598
Installation, Maintenance, and Repair Occupations 35 499
Business and Financial Operations Occupations 28 443
Computer and Mathematical Occupations 25 451
Building and Grounds Cleaning and Maintenance Occupations
22 495
Healthcare Practitioners and Technical Occupations 20 206
Healthcare Support Occupations 18 245
Arts, Design, Entertainment, Sports, and Media Occupations
17 205
Food Preparation and Serving Related Occupations 16 430
Life, Physical, and Social Science Occupations 14 98
Architecture and Engineering Occupations 12 148
Community and Social Service Occupations 11 122
Personal Care and Service Occupations 11 208
Protective Service Occupations 9 130
Education, Training, and Library Occupations 5 76
Military Specific Occupations 4 19
Legal Occupations 3 39
Farming, Fishing, and Forestry Occupations 1 111
(excludes unknown occupations)
Top 5 Occupation Groups With Largest Number of Claimants in PDC 19
Virginia Employment Commission Page 18 of 46
Economic ProfileCrater PDC

Source: Virginia Employment Commission, Economic Information & Analytics,Characteristics of the Insured Unemployed, March 2020.
Virginia Employment Commission Page 19 of 46
Economic ProfileCrater PDC

Unemployment Insurance Payments
Source: Virginia Employment Commission, Economic Information & Analytics,Unemployment Insurance Program.
Trends
PDC 19 Virginia
Weeks Paid Amount Paid Weeks Paid Amount Paid
2009 255,382 $74,446,180 3,782,630 $1,069,206,277
2010 170,631 $47,302,010 2,727,738 $748,174,724
2011 138,356 $37,816,203 2,242,341 $612,702,314
2012 127,484 $35,299,444 2,102,986 $592,044,339
2013 122,976 $33,685,579 1,999,039 $574,074,609
2014 105,713 $29,710,839 1,684,690 $490,522,709
2015 74,678 $21,222,358 1,198,476 $351,290,100
2016 77,322 $22,468,778 1,263,292 $379,622,081
2017 74,624 $22,173,420 1,114,650 $336,664,624
2018 65,371 $19,760,300 941,154 $286,468,017
2019 60,176 $18,617,249 867,371 $269,014,541
Virginia Employment Commission Page 20 of 46
Economic ProfileCrater PDC

Unemployment Insurance Payments
Source: Virginia Employment Commission,Unemployment Insurance Program.
Past 12 Months
PDC 19 Virginia
Weeks Paid Amount Paid Weeks Paid Amount Paid
Mar. 2019 4,904 $1,488,150 75,787 $23,424,325
Apr. 2019 5,437 $1,661,087 78,072 $24,364,992
May 2019 4,602 $1,415,415 63,383 $19,723,851
Jun. 2019 4,639 $1,420,623 65,011 $19,781,667
Jul. 2019 5,856 $1,805,729 81,698 $24,814,021
Aug. 2019 4,754 $1,482,897 65,182 $20,094,884
Sep. 2019 5,107 $1,612,703 66,517 $21,130,398
Oct. 2019 4,255 $1,371,585 58,600 $18,728,308
Nov. 2019 4,032 $1,282,229 55,763 $17,670,505
Dec. 2019 5,201 $1,626,750 78,153 $24,547,474
Jan. 2020 4,901 $1,533,899 78,288 $24,094,652
Feb. 2020 4,806 $1,506,693 76,910 $24,147,933
Mar. 2020 10,288 $2,969,902 164,592 $48,342,171
Virginia Employment Commission Page 21 of 46
Economic ProfileCrater PDC
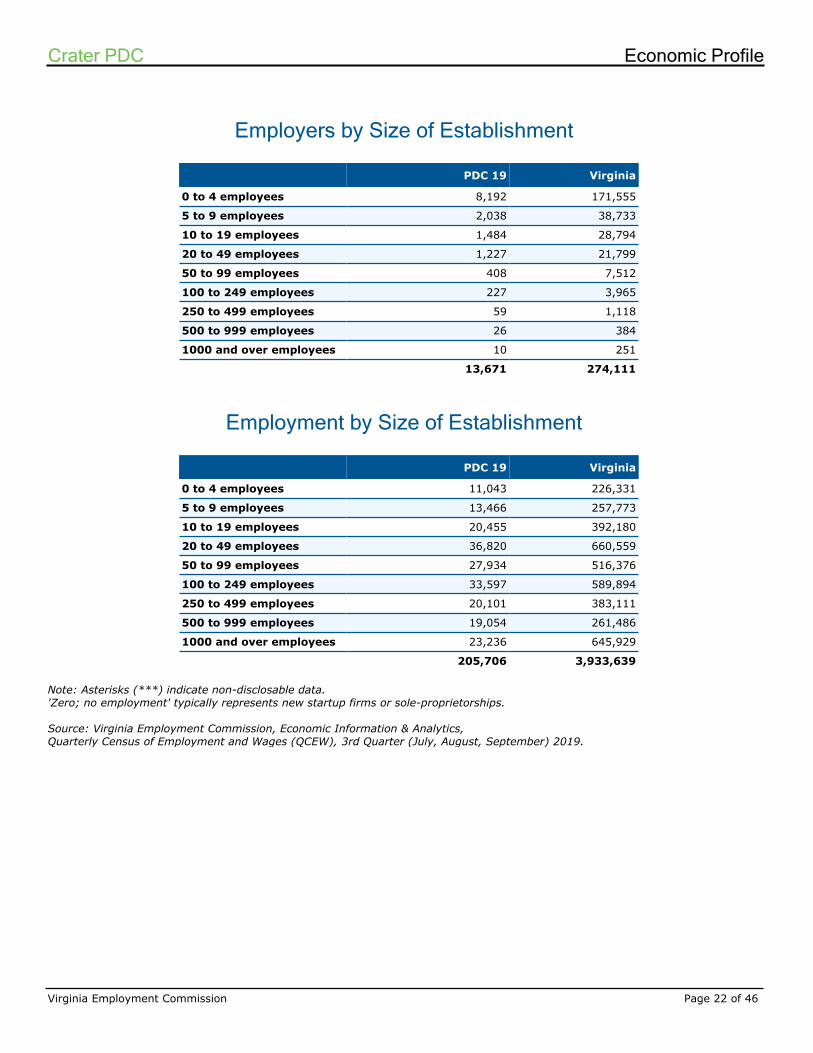
Employers by Size of Establishment
Employment by Size of Establishment
Note: Asterisks (***) indicate non-disclosable data.'Zero; no employment' typically represents new startup firms or sole-proprietorships.
Source: Virginia Employment Commission, Economic Information & Analytics,Quarterly Census of Employment and Wages (QCEW), 3rd Quarter (July, August, September) 2019.
PDC 19 Virginia
0 to 4 employees 8,192 171,555
5 to 9 employees 2,038 38,733
10 to 19 employees 1,484 28,794
20 to 49 employees 1,227 21,799
50 to 99 employees 408 7,512
100 to 249 employees 227 3,965
250 to 499 employees 59 1,118
500 to 999 employees 26 384
1000 and over employees 10 251
13,671 274,111
PDC 19 Virginia
0 to 4 employees 11,043 226,331
5 to 9 employees 13,466 257,773
10 to 19 employees 20,455 392,180
20 to 49 employees 36,820 660,559
50 to 99 employees 27,934 516,376
100 to 249 employees 33,597 589,894
250 to 499 employees 20,101 383,111
500 to 999 employees 19,054 261,486
1000 and over employees 23,236 645,929
205,706 3,933,639
Virginia Employment Commission Page 22 of 46
Economic ProfileCrater PDC
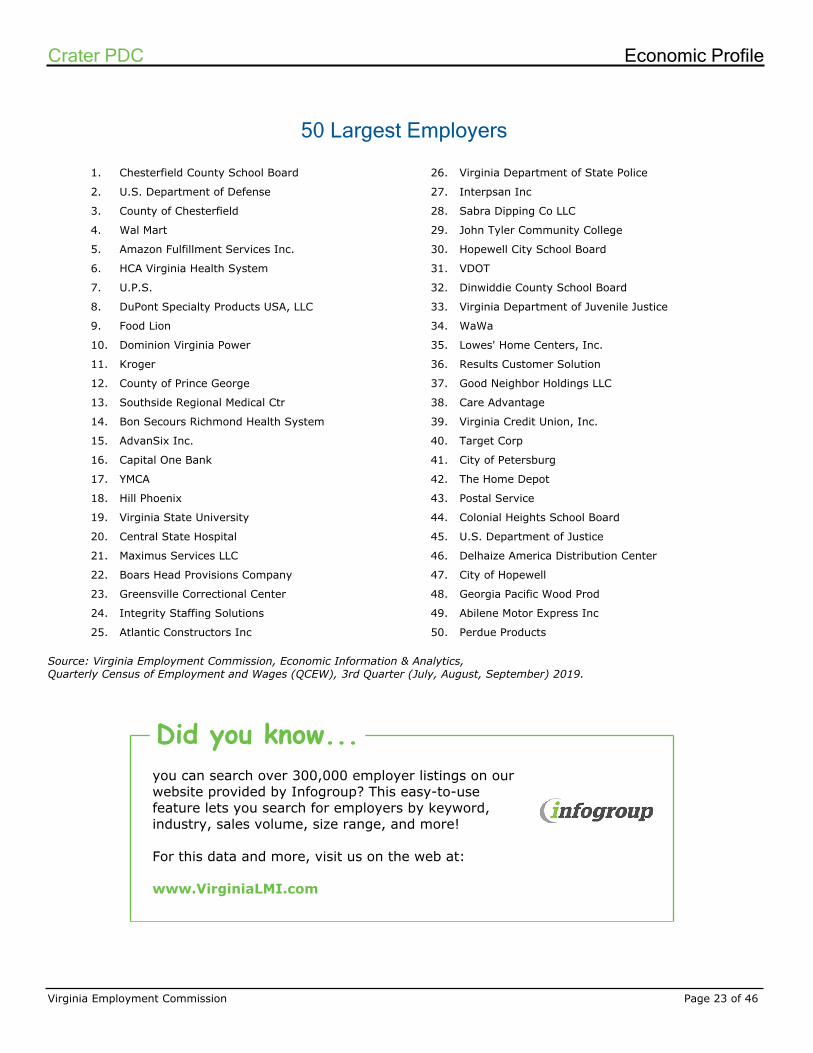
50 Largest Employers
1. Chesterfield County School Board
2. U.S. Department of Defense
3. County of Chesterfield
4. Wal Mart
5. Amazon Fulfillment Services Inc.
6. HCA Virginia Health System
7. U.P.S.
8. DuPont Specialty Products USA, LLC
9. Food Lion
10. Dominion Virginia Power
11. Kroger
12. County of Prince George
13. Southside Regional Medical Ctr
14. Bon Secours Richmond Health System
15. AdvanSix Inc.
16. Capital One Bank
17. YMCA
18. Hill Phoenix
19. Virginia State University
20. Central State Hospital
21. Maximus Services LLC
22. Boars Head Provisions Company
23. Greensville Correctional Center
24. Integrity Staffing Solutions
25. Atlantic Constructors Inc
26. Virginia Department of State Police
27. Interpsan Inc
28. Sabra Dipping Co LLC
29. John Tyler Community College
30. Hopewell City School Board
31. VDOT
32. Dinwiddie County School Board
33. Virginia Department of Juvenile Justice
34. WaWa
35. Lowes' Home Centers, Inc.
36. Results Customer Solution
37. Good Neighbor Holdings LLC
38. Care Advantage
39. Virginia Credit Union, Inc.
40. Target Corp
41. City of Petersburg
42. The Home Depot
43. Postal Service
44. Colonial Heights School Board
45. U.S. Department of Justice
46. Delhaize America Distribution Center
47. City of Hopewell
48. Georgia Pacific Wood Prod
49. Abilene Motor Express Inc
50. Perdue Products
Source: Virginia Employment Commission, Economic Information & Analytics,Quarterly Census of Employment and Wages (QCEW), 3rd Quarter (July, August, September) 2019.
you can search over 300,000 employer listings on our website provided by Infogroup? This easy-to-use feature lets you search for employers by keyword, industry, sales volume, size range, and more!
For this data and more, visit us on the web at:
www.VirginiaLMI.com
Did you know...
Virginia Employment Commission Page 23 of 46
Economic ProfileCrater PDC

Employment by Industry
Note: Asterisk (*) indicates non-disclosable data.
Source: Virginia Employment Commission, Economic Information & Analytics,Quarterly Census of Employment and Wages (QCEW), 3rd Quarter (July, August, September) 2019.
Total: 205,706
Virginia Employment Commission Page 24 of 46
Economic ProfileCrater PDC

New Startup Firms
PDC 19 Virginia
3rd Qtr. 2016 138 3,398
4th Qtr. 2016 160 3,426
1st Qtr. 2017 134 3,838
2nd Qtr. 2017 140 3,961
3rd Qtr. 2017 120 2,729
4th Qtr. 2017 121 3,058
1st Qtr. 2018 168 3,973
2nd Qtr. 2018 149 3,982
3rd Qtr. 2018 160 4,028
4th Qtr. 2018 154 3,641
1st Qtr. 2019 209 4,387
2nd Qtr. 2019 180 4,302
3rd Qtr. 2019 17 728
Note: The following criteria was used to define new startup firms:1.) Setup and liability date both occurred during 3rd Quarter (July, August, September) 20192.) Establishment had no predecessor UI Account Number3.) Private Ownership4.) Average employment is less than 2505.) For multi-unit establishments, the parent company must also meet the above criteria.
Source: Virginia Employment Commission, Economic Information & Analytics,Quarterly Census of Employment and Wages (QCEW), 3rd Quarter (July, August, September) 2019.
Virginia Employment Commission Page 25 of 46
Economic ProfileCrater PDC

New Hires by Industry
Data is for Virginia. No data available for Crater PDC.
Source: U.S. Census Bureau,Local Employment Dynamics (LED) Program, 2nd Quarter (April, May, June) 2019, all ownerships.
Total: 605,299
Virginia Employment Commission Page 26 of 46
Economic ProfileCrater PDC

Turnover by Industry
Data is for Virginia. No data available for Crater PDC.
Source: U.S. Census Bureau,Local Employment Dynamics (LED) Program, 1st Quarter (January, February, March) 2019, all ownerships.
Average: 8.2%
Virginia Employment Commission Page 27 of 46
Economic ProfileCrater PDC

Average Weekly Wage by Industry
Note: Asterisk (*) indicates non-disclosable data.
Source: Virginia Employment Commission, Economic Information & Analytics,Quarterly Census of Employment and Wages (QCEW), 3rd Quarter (July, August, September) 2019.
Virginia Employment Commission Page 28 of 46
Economic ProfileCrater PDC

Age of Workers by Industry
14—18 19—21 22—24 25—34 35—44 45—54 55—64 65+
Total, All Industries 77,750 151,928 207,319 822,670 792,040 789,668 666,397 245,340
Agriculture, Forestry, Fishing and Hunting
283 502 607 2,422 2,351 2,465 2,478 1,484
Mining, Quarrying, and Oil and Gas Extraction
13 112 195 1,093 1,481 1,493 1,278 309
Utilities 47 213 503 3,832 4,254 4,521 4,537 808
Construction 1,295 6,933 10,323 43,108 47,870 47,500 39,548 13,759
Manufacturing 1,111 5,831 10,560 48,939 50,124 60,718 58,163 13,107
Wholesale Trade 400 1,786 3,832 21,196 24,261 27,100 22,982 7,097
Retail Trade 16,777 38,654 34,297 89,812 68,781 68,196 63,821 29,590
Transportation and Warehousing 615 3,968 6,179 26,461 27,340 30,733 26,326 8,017
Information 1,092 1,746 3,058 16,136 17,647 18,272 12,237 3,457
Finance and Insurance 213 1,402 6,099 33,865 37,194 34,552 24,232 6,192
Real Estate and Rental and Leasing 367 1,257 2,696 12,186 11,936 12,184 10,978 4,756
Professional, Scientific, and Technical Servi
1,141 4,660 20,115 107,235 107,283 96,240 74,982 24,843
Management of Companies and Enterprises
602 1,540 3,434 18,406 19,727 20,000 16,563 4,349
Administrative and Support and Waste Manageme
1,760 9,399 15,594 62,564 54,433 50,864 40,029 16,629
Educational Services 2,502 5,701 12,548 66,732 82,146 93,214 82,247 35,343
Health Care and Social Assistance 3,166 13,126 25,294 116,704 110,488 104,956 89,230 31,764
Arts, Entertainment, and Recreation 5,379 5,053 5,167 14,331 10,943 10,256 8,797 4,791
Accommodation and Food Services 37,156 41,714 33,876 81,811 57,812 45,806 34,668 17,038
Other Services (except Public Administration)
3,042 6,348 8,274 30,488 28,175 28,849 25,451 12,026
Public Administration 789 1,984 4,667 25,348 27,795 31,750 27,850 9,979
Data is for Virginia. No data available for Crater PDC.
Source: U.S. Census Bureau,Local Employment Dynamics (LED) Program, 2nd Quarter (April, May, June) 2019, all ownerships.
Developed by the U.S. Census Bureau, the Local Employment Dynamics (LED) program merges Virginia's Unemployment Compensation wage and employer records with Census demographic data. Read more about LED on the following website:
http://lehd.did.census.gov/led/
What is LED?
Virginia Employment Commission Page 29 of 46
Economic ProfileCrater PDC

Industry Employment and Projections
Note: Asterisks (***) indicate non-disclosable data.Projections data is for Virginia. No data available for Crater PDC.
Source: Virginia Employment Commission, Economic Information & Analytics,Long Term Industry and Occupational Projections, 2014-2024.
Employment Percent
Estimated 2014
Projected 2024 Change Total Annual
Total, All Industries 3,977,869 4,345,923 368,054 9.25% .89%
Agriculture, Forestry, Fishing and Hunting 58,935 54,824 -4,111 -6.98% -.72%
Mining, Quarrying, and Oil and Gas Extraction
7,470 7,259 -211 -2.82% -.29%
Utilities 10,631 9,516 -1,115 -10.49% -1.1%
Construction 178,203 200,963 22,760 12.77% 1.21%
Manufacturing 231,497 219,778 -11,719 -5.06% -.52%
Wholesale Trade 110,804 114,430 3,626 3.27% .32%
Retail Trade 413,395 442,557 29,162 7.05% .68%
Transportation and Warehousing 107,989 113,524 5,535 5.13% .5%
Information 71,474 69,426 -2,048 -2.87% -.29%
Finance and Insurance 129,981 141,636 11,655 8.97% .86%
Real Estate and Rental and Leasing 51,535 53,346 1,811 3.51% .35%
Professional, Scientific, and Technical Servi 389,128 459,829 70,701 18.17% 1.68%
Management of Companies and Enterprises 74,283 77,075 2,792 3.76% .37%
Administrative and Support and Waste Manageme
214,758 234,450 19,692 9.17% .88%
Educational Services 352,778 395,156 42,378 12.01% 1.14%
Health Care and Social Assistance 418,602 515,689 97,087 23.19% 2.11%
Arts, Entertainment, and Recreation 49,367 55,167 5,800 11.75% 1.12%
Accommodation and Food Services 321,040 352,330 31,290 9.75% .93%
Other Services (except Public Administration)
131,382 143,824 12,442 9.47% .91%
Long Term
Virginia Employment Commission Page 30 of 46
Economic ProfileCrater PDC

Industry Employment and Projections
Note: Asterisks (***) indicate non-disclosable data.Projections data is for Virginia Statewide. No data available for Crater PDC.
Source: Virginia Employment Commission, Economic Information & Analytics,Short Term Industry and Occupational Projections, 2015-2017.
Employment Percent
Estimated 2015
Projected 2017 Change Total Annual
Total, All Industries 3,977,496 4,093,656 116,160 2.92% 1.45%
Agriculture, Forestry, Fishing and Hunting 4,210 4,433 223 5.3% 2.61%
Mining, Quarrying, and Oil and Gas Extraction
6,805 5,869 -936 -13.75% -7.13%
Utilities 10,717 10,695 -22 -.21% -.1%
Construction 185,026 195,598 10,572 5.71% 2.82%
Manufacturing 232,632 233,073 441 .19% .09%
Wholesale Trade 110,001 111,188 1,187 1.08% .54%
Retail Trade 412,345 421,889 9,544 2.31% 1.15%
Transportation and Warehousing 112,837 117,619 4,782 4.24% 2.1%
Information 69,554 68,654 -900 -1.29% -.65%
Finance and Insurance 131,712 136,266 4,554 3.46% 1.71%
Real Estate and Rental and Leasing 52,593 53,535 942 1.79% .89%
Professional, Scientific, and Technical Servi 394,584 409,625 15,041 3.81% 1.89%
Management of Companies and Enterprises 74,086 75,252 1,166 1.57% .78%
Administrative and Support and Waste Manageme
224,339 236,780 12,441 5.55% 2.74%
Educational Services 365,350 372,071 6,721 1.84% .92%
Health Care and Social Assistance 427,570 446,476 18,906 4.42% 2.19%
Arts, Entertainment, and Recreation 56,096 57,991 1,895 3.38% 1.68%
Accommodation and Food Services 334,516 349,857 15,341 4.59% 2.27%
Other Services (except Public Administration)
133,850 136,332 2,482 1.85% .92%
Short Term
Virginia Employment Commission Page 31 of 46
Economic ProfileCrater PDC

Occupation Employment and Projections
Note: Asterisks (***) indicate non-disclosable data.Projections data is for Virginia. No data available for Crater PDC.
Source: Virginia Employment Commission, Economic Information & Analytics,Long Term Industry and Occupational Projections, 2014-2024.
Employment Openings
Estimated 2014
Projected 2024 % Change Replace
-ments Growth Total
Total, All Occupations 3,977,869 4,345,923 9.25% 91,873 39,696 131,569
Management Occupations 245,713 260,353 5.96% 5,341 1,643 6,984
Business and Financial Operations Occupations
272,943 304,041 11.39% 5,310 3,135 8,445
Computer and Mathematical Occupations 199,588 234,513 17.5% 2,856 3,613 6,469
Architecture and Engineering Occupations 77,469 80,679 4.14% 1,898 382 2,280
Life, Physical, and Social Science Occupations 33,772 37,033 9.66% 869 331 1,200
Community and Social Service Occupations 52,465 60,234 14.81% 1,130 777 1,907
Legal Occupations 43,393 46,695 7.61% 785 356 1,141
Education, Training, and Library Occupations 235,652 265,508 12.67% 5,024 2,986 8,010
Arts, Design, Entertainment, Sports, and Media Occupations
60,392 65,726 8.83% 1,444 563 2,007
Healthcare Practitioners and Technical Occupations
202,439 239,735 18.42% 4,463 3,731 8,194
Healthcare Support Occupations 88,809 114,202 28.59% 1,946 2,539 4,485
Protective Service Occupations 104,345 116,523 11.67% 2,450 1,230 3,680
Food Preparation and Serving Related Occupations
314,694 349,577 11.08% 11,703 3,621 15,324
Building and Grounds Cleaning and Maintenance Occupations
146,794 157,362 7.2% 2,944 1,058 4,002
Personal Care and Service Occupations 148,432 171,914 15.82% 3,107 2,353 5,460
Sales and Related Occupations 421,043 447,037 6.17% 12,435 2,627 15,062
Office and Administrative Support Occupations
549,417 576,971 5.02% 11,542 3,762 15,304
Farming, Fishing, and Forestry Occupations 39,772 37,134 -6.63% 1,027 47 1,074
Construction and Extraction Occupations 183,368 201,618 9.95% 2,794 1,840 4,634
Installation, Maintenance, and Repair Occupations
151,233 163,586 8.17% 3,482 1,310 4,792
Production Occupations 179,752 175,957 -2.11% 3,946 438 4,384
Transportation and Material Moving Occupations
226,384 239,525 5.8% 5,378 1,351 6,729
Long Term
Virginia Employment Commission Page 32 of 46
Economic ProfileCrater PDC
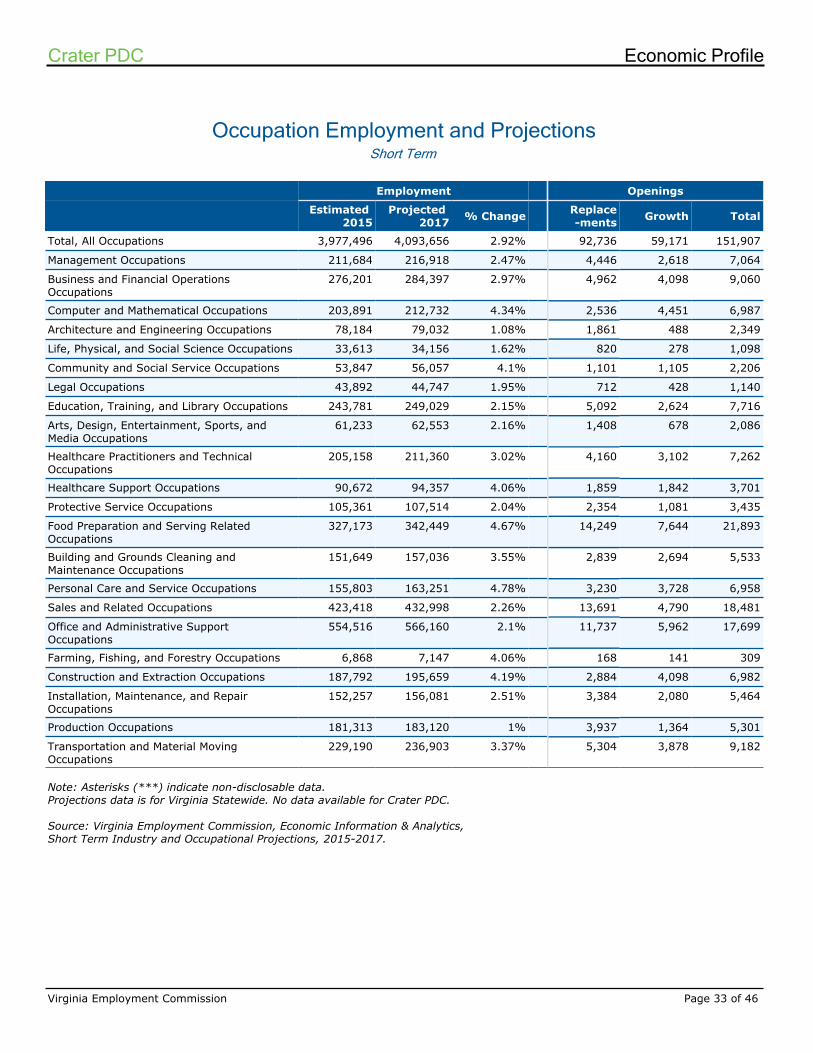
Occupation Employment and Projections
Note: Asterisks (***) indicate non-disclosable data.Projections data is for Virginia Statewide. No data available for Crater PDC.
Source: Virginia Employment Commission, Economic Information & Analytics,Short Term Industry and Occupational Projections, 2015-2017.
Employment Openings
Estimated 2015
Projected 2017 % Change Replace
-ments Growth Total
Total, All Occupations 3,977,496 4,093,656 2.92% 92,736 59,171 151,907
Management Occupations 211,684 216,918 2.47% 4,446 2,618 7,064
Business and Financial Operations Occupations
276,201 284,397 2.97% 4,962 4,098 9,060
Computer and Mathematical Occupations 203,891 212,732 4.34% 2,536 4,451 6,987
Architecture and Engineering Occupations 78,184 79,032 1.08% 1,861 488 2,349
Life, Physical, and Social Science Occupations 33,613 34,156 1.62% 820 278 1,098
Community and Social Service Occupations 53,847 56,057 4.1% 1,101 1,105 2,206
Legal Occupations 43,892 44,747 1.95% 712 428 1,140
Education, Training, and Library Occupations 243,781 249,029 2.15% 5,092 2,624 7,716
Arts, Design, Entertainment, Sports, and Media Occupations
61,233 62,553 2.16% 1,408 678 2,086
Healthcare Practitioners and Technical Occupations
205,158 211,360 3.02% 4,160 3,102 7,262
Healthcare Support Occupations 90,672 94,357 4.06% 1,859 1,842 3,701
Protective Service Occupations 105,361 107,514 2.04% 2,354 1,081 3,435
Food Preparation and Serving Related Occupations
327,173 342,449 4.67% 14,249 7,644 21,893
Building and Grounds Cleaning and Maintenance Occupations
151,649 157,036 3.55% 2,839 2,694 5,533
Personal Care and Service Occupations 155,803 163,251 4.78% 3,230 3,728 6,958
Sales and Related Occupations 423,418 432,998 2.26% 13,691 4,790 18,481
Office and Administrative Support Occupations
554,516 566,160 2.1% 11,737 5,962 17,699
Farming, Fishing, and Forestry Occupations 6,868 7,147 4.06% 168 141 309
Construction and Extraction Occupations 187,792 195,659 4.19% 2,884 4,098 6,982
Installation, Maintenance, and Repair Occupations
152,257 156,081 2.51% 3,384 2,080 5,464
Production Occupations 181,313 183,120 1% 3,937 1,364 5,301
Transportation and Material Moving Occupations
229,190 236,903 3.37% 5,304 3,878 9,182
Short Term
Virginia Employment Commission Page 33 of 46
Economic ProfileCrater PDC

Growth Occupations
Note: Asterisks (***) indicate non-disclosable data.Projections and OES wage data are for Virginia. No data available for Crater PDC.
Source: Virginia Employment Commission, Economic Information & Analytics,Long Term Industry and Occupational Projections, 2014-2024Occupational Employment Statistics (OES) Survey, 2018.
Employment Average Annual Openings
Estimated 2014
Projected 2024 % Change Replace
-ments Growth TotalAverage
Annual Salary
Occupational Therapy Assistants 795 1,217 53.08% 23 42 65 $68,366
Physical Therapist Aides 1,130 1,674 48.14% 33 54 87 $29,012
Home Health Aides 9,928 14,494 45.99% 224 457 681 $24,192
Personal Financial Advisors 5,568 8,021 44.06% 140 245 385 $123,599
Ambulance Drivers and Attendants, Except Emergency Medical Technicians
276 396 43.48% 5 12 17 $25,011
Nurse Practitioners 3,522 5,045 43.24% 83 152 235 $107,001
Physical Therapist Assistants 2,085 2,979 42.88% 60 89 149 $62,039
Hearing Aid Specialists 141 201 42.55% 1 6 7 $44,776
Audiologists 428 605 41.36% 10 18 28 $81,271
Physician Assistants 2,070 2,901 40.14% 46 83 129 $101,070
Interpreters and Translators 2,381 3,325 39.65% 38 94 132 $72,002
Nurse Midwives 119 166 39.5% 3 5 8 $91,435
Statisticians 945 1,313 38.94% 17 37 54 $89,227
Commercial Divers 165 229 38.79% 2 6 8 $51,607
Industrial-Organizational Psychologists
140 191 36.43% 3 5 8 $128,418
Physical Therapists 4,905 6,673 36.04% 131 177 308 $93,297
Operations Research Analysts 5,560 7,505 34.98% 99 194 293 $106,808
Forensic Science Technicians 656 885 34.91% 28 23 51 $71,514
Arbitrators, Mediators, and Conciliators
*** *** *** *** *** *** N/A
Phlebotomists 3,465 4,658 34.43% 72 119 191 $37,114
Virginia Employment Commission Page 34 of 46
Economic ProfileCrater PDC
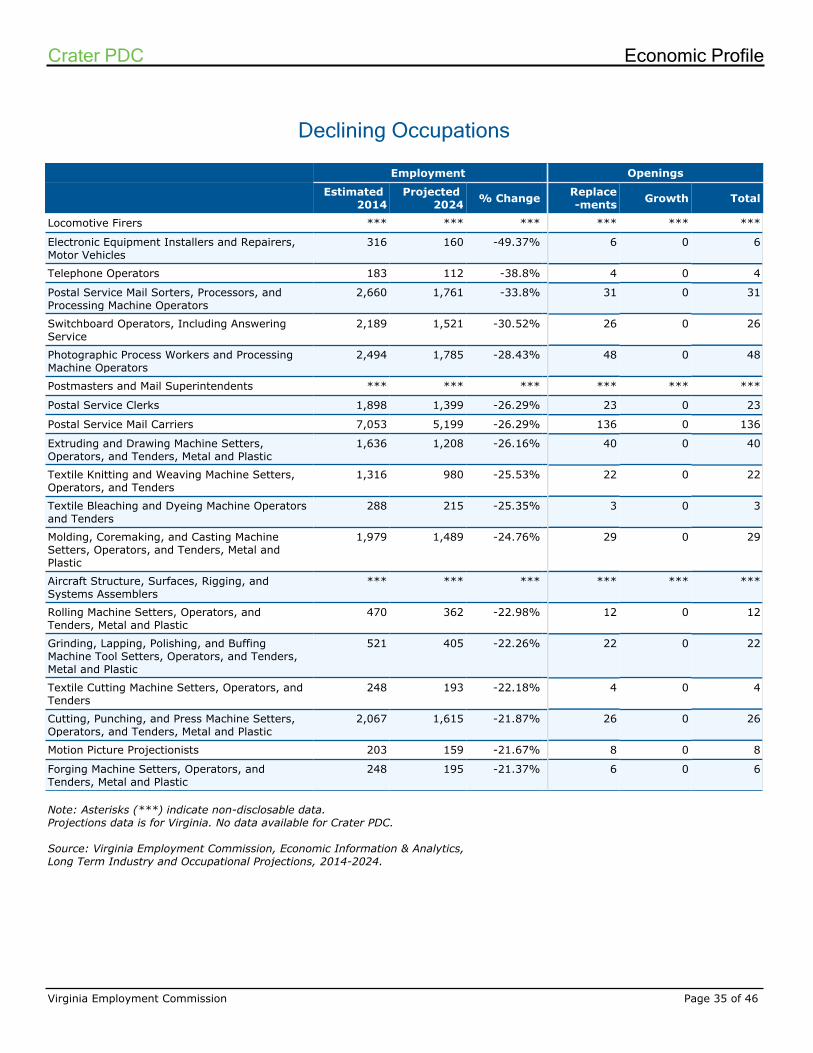
Declining Occupations
Note: Asterisks (***) indicate non-disclosable data.Projections data is for Virginia. No data available for Crater PDC.
Source: Virginia Employment Commission, Economic Information & Analytics,Long Term Industry and Occupational Projections, 2014-2024.
Employment Openings
Estimated 2014
Projected 2024 % Change Replace
-ments Growth Total
Locomotive Firers *** *** *** *** *** ***
Electronic Equipment Installers and Repairers, Motor Vehicles
316 160 -49.37% 6 0 6
Telephone Operators 183 112 -38.8% 4 0 4
Postal Service Mail Sorters, Processors, and Processing Machine Operators
2,660 1,761 -33.8% 31 0 31
Switchboard Operators, Including Answering Service
2,189 1,521 -30.52% 26 0 26
Photographic Process Workers and Processing Machine Operators
2,494 1,785 -28.43% 48 0 48
Postmasters and Mail Superintendents *** *** *** *** *** ***
Postal Service Clerks 1,898 1,399 -26.29% 23 0 23
Postal Service Mail Carriers 7,053 5,199 -26.29% 136 0 136
Extruding and Drawing Machine Setters, Operators, and Tenders, Metal and Plastic
1,636 1,208 -26.16% 40 0 40
Textile Knitting and Weaving Machine Setters, Operators, and Tenders
1,316 980 -25.53% 22 0 22
Textile Bleaching and Dyeing Machine Operators and Tenders
288 215 -25.35% 3 0 3
Molding, Coremaking, and Casting Machine Setters, Operators, and Tenders, Metal and Plastic
1,979 1,489 -24.76% 29 0 29
Aircraft Structure, Surfaces, Rigging, and Systems Assemblers
*** *** *** *** *** ***
Rolling Machine Setters, Operators, and Tenders, Metal and Plastic
470 362 -22.98% 12 0 12
Grinding, Lapping, Polishing, and Buffing Machine Tool Setters, Operators, and Tenders, Metal and Plastic
521 405 -22.26% 22 0 22
Textile Cutting Machine Setters, Operators, and Tenders
248 193 -22.18% 4 0 4
Cutting, Punching, and Press Machine Setters, Operators, and Tenders, Metal and Plastic
2,067 1,615 -21.87% 26 0 26
Motion Picture Projectionists 203 159 -21.67% 8 0 8
Forging Machine Setters, Operators, and Tenders, Metal and Plastic
248 195 -21.37% 6 0 6
Virginia Employment Commission Page 35 of 46
Economic ProfileCrater PDC

Consumer Price Index (CPI)
Note: CPI data is for the United States only. No data available for Crater PDC.
The CPI-U includes expenditures by urban wage earners and clerical workers, professional, managerial, and technical workers, the self-employed, short-term workers, the unemployed, retirees and others not in the labor force. The CPI-W only includes expenditures by those in hourly wage earning or clerical jobs.
Source: Bureau of Labor Statistics,Consumer Price Indexes (CPI) Program.
Jan. Feb. Mar. Apr. May Jun. Jul. Aug. Sep. Oct. Nov. Dec. Ann. % chg
2010 216.687 216.741 217.631 218.009 218.178 217.965 218.011 218.312 218.439 218.711 218.803 219.179 218.056 1.6
2011 220.223 221.309 223.467 224.906 225.964 225.722 225.922 226.545 226.889 226.421 226.230 225.672 224.939 3.2
2012 226.665 227.663 229.392 230.085 229.815 229.478 229.104 230.379 231.407 231.317 230.221 229.601 229.594 2.1
2013 230.280 232.166 232.773 232.531 232.945 233.504 233.596 233.877 234.149 233.546 233.069 233.049 232.957 1.5
2014 233.916 234.781 236.293 237.072 237.900 238.343 238.250 237.852 238.031 237.433 236.151 234.812 236.736 1.6
2015 233.707 234.722 236.119 236.599 237.805 238.638 238.654 238.316 237.945 237.838 237.336 236.525 237.017 0.1
2016 236.916 237.111 238.132 239.261 240.229 241.018 240.628 240.849 241.428 241.729 241.353 241.432 240.007 1.3
2017 242.839 243.603 243.801 244.524 244.733 244.955 244.786 245.519 246.819 246.663 246.669 246.524 245.120 2.1
2018 247.867 248.991 249.554 250.546 251.588 251.989 252.006 252.146 252.439 252.885 252.038 251.233 251.107 2.4
2019 251.712 252.776 254.202 255.548 256.092 256.143 256.571 256.558 256.759 257.346 257.208 256.974 255.657 1.8
2020 257.971 258.678 258.115
All Urban Consumers (CPI-U)
Urban Wage Earners and Clerical Workers (CPI-W)
Jan. Feb. Mar. Apr. May Jun. Jul. Aug. Sep. Oct. Nov. Dec. Ann. % chg
2010 212.568 212.544 213.525 213.958 214.124 213.839 213.898 214.205 214.306 214.623 214.750 215.262 213.967 2.1
2011 216.400 217.535 220.024 221.743 222.954 222.522 222.686 223.326 223.688 223.043 222.813 222.166 221.575 3.6
2012 223.216 224.317 226.304 227.012 226.600 226.036 225.568 227.056 228.184 227.974 226.595 225.889 226.229 2.1
2013 226.520 228.677 229.323 228.949 229.399 230.002 230.084 230.359 230.537 229.735 229.133 229.174 229.324 1.4
2014 230.040 230.871 232.560 233.443 234.216 234.702 234.525 234.030 234.170 233.229 231.551 229.909 232.771 1.5
2015 228.294 229.421 231.055 231.520 232.908 233.804 233.806 233.366 232.661 232.373 231.721 230.791 231.810 -0.4
2016 231.061 230.972 232.209 233.438 234.436 235.289 234.771 234.904 235.495 235.732 235.215 235.390 234.076 1.0
2017 236.854 237.477 237.656 238.432 238.609 238.813 238.617 239.448 240.939 240.573 240.666 240.526 239.051 2.1
2018 241.919 242.988 243.463 244.607 245.770 246.196 246.155 246.336 246.565 247.038 245.933 244.786 245.146 2.5
2019 245.133 246.218 247.768 249.332 249.871 249.747 250.236 250.112 250.251 250.894 250.644 250.452 249.222 1.7
2020 251.361 251.935 251.375
Virginia Employment Commission Page 36 of 46
Economic ProfileCrater PDC

Local Option Sales Tax
PDC 19 Virginia
2008 $59,187,992 $1,032,815,078
2009 $55,357,340 $979,594,664
2010 $57,718,525 $992,820,512
2011 $59,415,104 $1,035,981,229
2012 $62,243,432 $1,080,663,042
2013 $63,133,816 $1,093,292,668
2014 $66,422,987 $1,131,194,860
2015 $67,669,440 $1,179,611,271
2016 $70,893,023 $1,202,257,995
2017 $73,494,625 $1,232,981,515
2018 $76,096,500 $1,282,022,261
Note: This data is based on Virginia sales tax revenues deposited, rather than the actual taxable sales figures as reported on a dealer's return.
Source: Virginia Department of Taxation,Revenue Forecasting.
Trends
Virginia Employment Commission Page 37 of 46
Economic ProfileCrater PDC

Local Option Sales Tax
Note: This data is based on Virginia sales tax revenues deposited, rather than the actual taxable sales figures as reported on a dealer's return.
Source: Virginia Department of Taxation,Revenue Forecasting.
Past 12 Months
PDC 19 Virginia
Dec. 2017 $7,778,705 $123,193,863
Jan. 2018 $5,368,193 $90,794,207
Feb. 2018 $5,543,130 $90,576,093
Mar. 2018 $6,699,525 $107,834,402
Apr. 2018 $6,051,290 $102,372,977
May 2018 $6,493,157 $110,211,496
Jun. 2018 $6,578,028 $112,529,037
Jul. 2018 $6,268,486 $107,211,401
Aug. 2018 $6,444,315 $109,428,585
Sep. 2018 $6,296,080 $105,468,340
Oct. 2018 $6,392,824 $107,742,243
Nov. 2018 $6,575,746 $112,348,128
Dec. 2018 $7,385,726 $125,505,352
Virginia Employment Commission Page 38 of 46
Education ProfileCrater PDC

IV. Education Profile
The Education Profile for Crater PDC provides an assortment of data collected from the United States Census Bureau and the National Center for Education Statistics (NCES).
Related Terms and DefinitionsOverview
Associate's degreeAn award that normally requires at least two but less than four years of full-time equivalent college work.
Bachelor's degreeAn award that normally requires at least four but not more than five years of full-time equivalent college-level work.
Post-baccalaureate certificateAn award that requires completion of an organized program of study equivalent to 18 semester credit hours beyond the bachelor's. It is designed for persons who have completed a bachelor's degree, but do not meet the requirements of a master’s degree.
Master's degreeAn award that requires the successful completion of a program of study of at least the full-time equivalent of one but not more than two academic years of work beyond the bachelor's degree.
Post-master's certificateAn award that requires completion of an organized program of study equivalent to 24 semester credit hours beyond the master's degree, but does not meet the requirements of academic degrees at the doctor's level.
Doctor's degreeThe highest award a student can earn for graduate study.
First-professional degreeAn award that requires completion of a program that meets all of the following criteria: (1) completion of the academic requirements to begin practice in the profession; (2) at least two years of college work prior to entering the program; and (3) a total of at least six academic years of college work to complete the degree program, including prior required college work plus the length of the professional program itself.
Virginia Employment Commission Page 39 of 46
Education ProfileCrater PDC
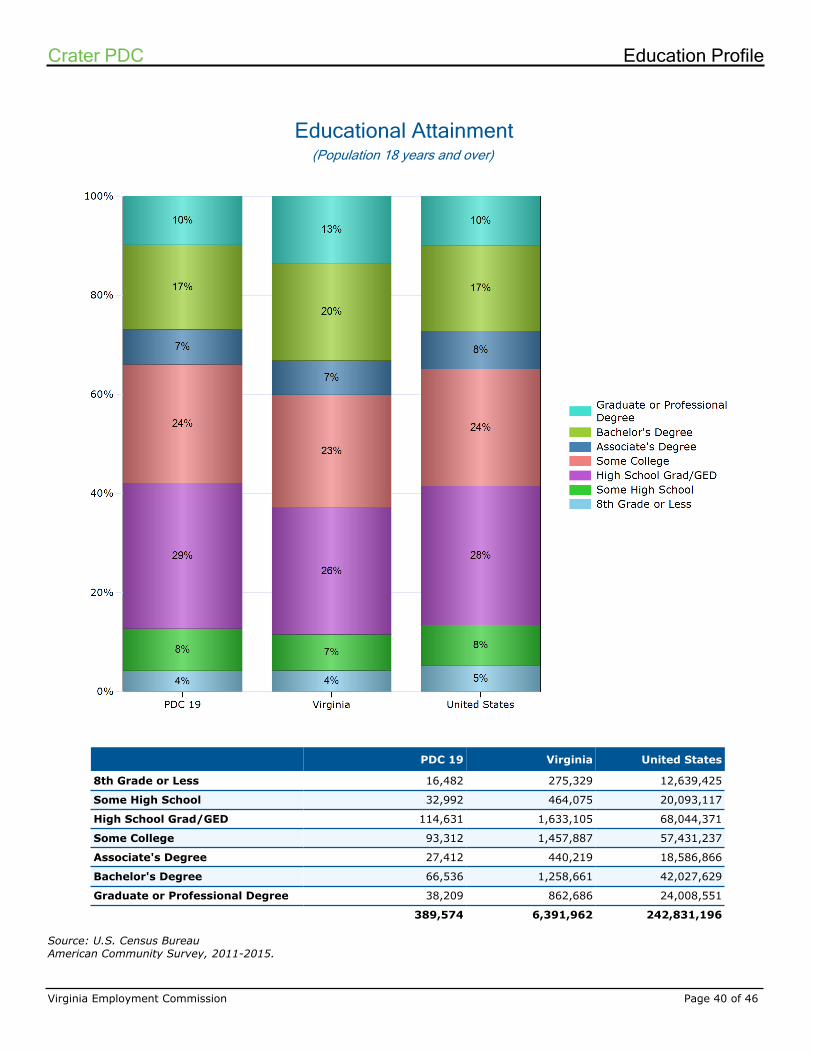
Educational Attainment
Source: U.S. Census BureauAmerican Community Survey, 2011-2015.
(Population 18 years and over)
PDC 19 Virginia United States
8th Grade or Less 16,482 275,329 12,639,425
Some High School 32,992 464,075 20,093,117
High School Grad/GED 114,631 1,633,105 68,044,371
Some College 93,312 1,457,887 57,431,237
Associate's Degree 27,412 440,219 18,586,866
Bachelor's Degree 66,536 1,258,661 42,027,629
Graduate or Professional Degree 38,209 862,686 24,008,551
389,574 6,391,962 242,831,196
Virginia Employment Commission Page 40 of 46
Education ProfileCrater PDC
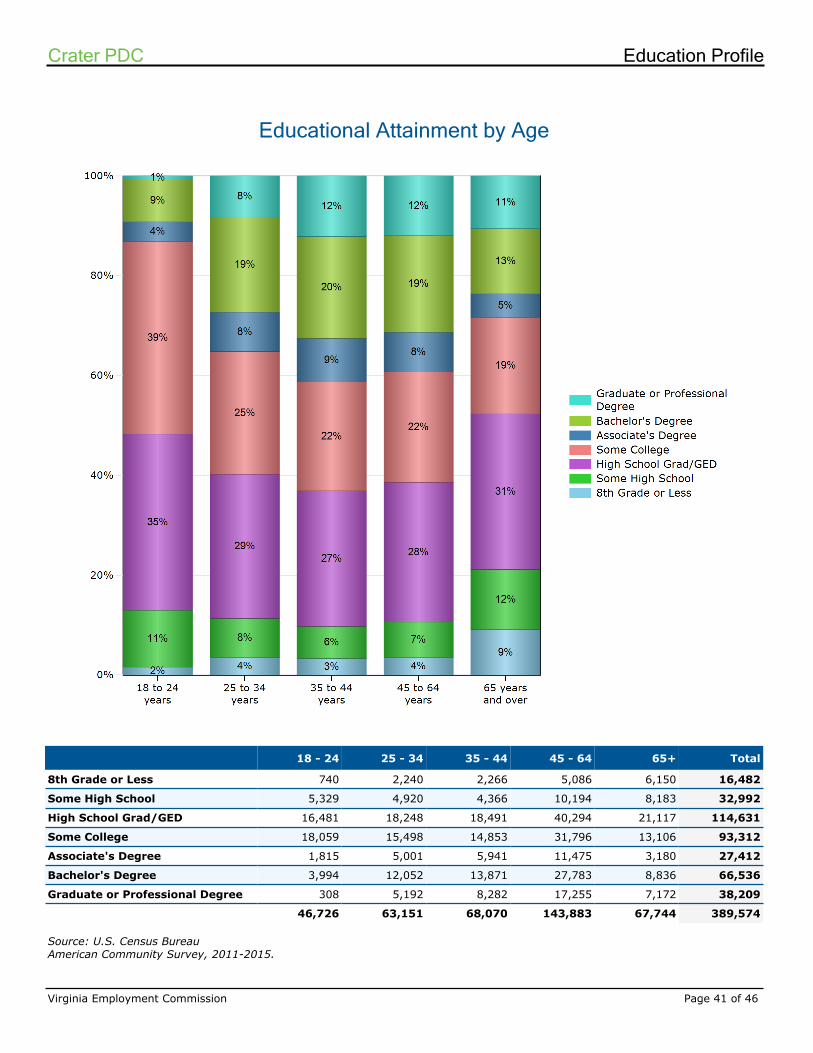
Educational Attainment by Age
18 - 24 25 - 34 35 - 44 45 - 64 65+ Total
8th Grade or Less 740 2,240 2,266 5,086 6,150 16,482
Some High School 5,329 4,920 4,366 10,194 8,183 32,992
High School Grad/GED 16,481 18,248 18,491 40,294 21,117 114,631
Some College 18,059 15,498 14,853 31,796 13,106 93,312
Associate's Degree 1,815 5,001 5,941 11,475 3,180 27,412
Bachelor's Degree 3,994 12,052 13,871 27,783 8,836 66,536
Graduate or Professional Degree 308 5,192 8,282 17,255 7,172 38,209
46,726 63,151 68,070 143,883 67,744 389,574
Source: U.S. Census BureauAmerican Community Survey, 2011-2015.
Virginia Employment Commission Page 41 of 46
Education ProfileCrater PDC

Educational Attainment by Gender
Source: U.S. Census BureauAmerican Community Survey, 2011-2015.
(Population 18 years and over)
Male Female Total
8th Grade or Less 8,930 7,552 16,482
Some High School 17,923 15,069 32,992
High School Grad/GED 60,608 54,023 114,631
Some College 43,053 50,259 93,312
Associate's Degree 11,029 16,383 27,412
Bachelor's Degree 30,484 36,052 66,536
Graduate or Professional Degree 17,611 20,598 38,209
189,638 199,936 389,574
Virginia Employment Commission Page 42 of 46
Education ProfileCrater PDC

Educational Attainment by Race/Ethnicity
Less than high school diploma
High school grad, GED, or
alternative
Some college or associate's
degree
Bachelor's degree or
higherTotal
Race
White 22,591 62,145 64,235 73,035 222,006
Black or African American 16,786 30,504 31,232 19,909 98,431
American Indian or Alaska Native 253 470 437 233 1,393
Asian 1,216 1,955 1,561 4,778 9,510
Native Hawaiian/Pacific Islander 6 13 90 92 201
Other 1,737 1,843 1,235 1,083 5,898
Multiple Races 816 1,220 2,060 1,313 5,409
Ethnicity
Hispanic or Latino (of any race) 5,889 4,778 4,348 3,278 18,293
49,294 102,928 105,198 103,721 361,141
(Population 25 years and over)
Source: U.S. Census BureauAmerican Community Survey, 2011-2015.
Virginia Employment Commission Page 43 of 46
Education ProfileCrater PDC

Graduate Data Trends
Cert. <1 yr.
Cert.1-2 yrs. Assoc.
Cert.2-4 yrs. BA
Cert.Post-BA MA
Cert.Post-MA Ph.D.
1stProf.
2006 184 177 1327 16 741 138
2007 181 59 1500 17 775 0 137 0 5
2008 220 58 544 12 599 99 9
2009 237 72 1246 705 95 7
2010 275 415 1347 776 8 102 6
2011 318 393 1248 774 1 148 6
2012 389 681 1496 914 7 135 3
2013 398 624 1583 1039 15 138 6
2016 454 678 1274 894 14 127 23
Source: U.S. Department of Education,Institute of Education Sciences (IES).
Crater PDC
Cert. <1 yr.
Cert.1-2 yrs. Assoc.
Cert.2-4 yrs. BA
Cert.Post-BA MA
Cert.Post-MA Ph.D.
1stProf.
2006 4,213 4,298 14,431 102 39,247 608 12,429 225 1,440 2,490
2007 4,478 3,686 15,519 116 40,381 650 12,781 252 1,516 2,626
2008 5,197 3,813 16,207 134 39,160 725 13,802 334 1,080 2,168
2009 6,259 4,587 17,179 85 40,233 756 15,445 300 925 2,064
2010 7,648 8,158 21,014 374 45,361 915 18,889 601 2,100 2,598
2011 6,972 12,557 24,306 473 49,109 1,055 20,697 727 2,329 2,658
2012 8,825 12,801 26,199 620 53,051 1,215 21,516 686 2,095 3,298
2013 8,153 12,179 25,854 484 54,778 1,067 22,782 706 2,230 2,963
2016 8,643 11,912 25,125 608 61,852 2,032 24,717 640 2,328 2,931
Virginia Statewide
Note: This table only reflects degrees completed from institutions within Crater PDC
you can search over 2,300 school listings online provided by the U.S. Department of Education?
For this data and more, visit us on the web at:
www.VirginiaLMI.com
Did you know...
Virginia Employment Commission Page 44 of 46
Education ProfileCrater PDC

Training Providers
John Tyler Community College
13101 Jefferson Davis Hwy
Chester, VA 23831
Phone: (804) 796-4000
http://www.jtcc.edu
Number of 2016 graduates: 1,610
Virginia State University
1 Hayden Drive
Petersburg, VA 23806
Phone: (804) 524-5000
http://www.vsu.edu
Number of 2016 graduates: 1,021
Richard Bland Col of the Col of William
11301 Johnson Rd.
South Prince George, VA 23805
Phone: (804) 862-6100
http://www.rbc.edu
Number of 2016 graduates: 211
Bryant and Stratton College-Richmond
8141 Hull St Rd
North Chesterfield, VA 23235
Phone: (804) 745-2444
http://www.bryantstratton.edu
Number of 2016 graduates: 137
Richmond School of Health and Technology
751 West Hundred Road
Chester, VA 23836
Phone: (804) 425-5797
http://chestercareercollege.edu/
Number of 2016 graduates: 63
Southside Regional Medical Center
430 Clairmont Court - Suite 200
Colonial Heights, VA 23834
Phone: (804) 765-5800
http://www.srmconline.com
Number of 2016 graduates: 56
Empire Beauty School-Midlothian
10807 Hull Street Rd
Midlothian, VA 23112
Phone: (800) 920-4593
http://www.empire.edu
Number of 2016 graduates: 46
ITT Technical Institute
300 Gateway Centre Pky
Richmond, VA 23235
Phone: (804) 330-4992
http://www.itt-tech.edu
Number of 2016 graduates:
Virginia Employment Commission Page 45 of 46
Education ProfileCrater PDC
Source: U.S. Department of Education,Institute of Education Sciences (IES), 2016.
Beta Tech
7914 Midlothian Turnpike
Richmond, VA 23235
Phone: (804) 330-0111
http://www.centuracollege.edu
Number of 2016 graduates: 125
Medical Careers Institute
800 Moorefield Park Drive
Richmond, VA 23236
Phone: (804) 521-0400
http://www.careers.edu
Number of 2016 graduates:
Virginia Employment Commission Page 46 of 46
Education ProfileCrater PDC