Embed Size (px)
Citation preview
Crater degradation in the Martian highlands: Morphometric analysis
of the Sinus Sabaeus region and simulation modeling suggest fluvial
processes
Nancy K. Forsberg-Taylor1 and Alan D. HowardDepartment of Environmental Sciences, University of Virginia, Charlottesville, Virginia, USA
Robert A. CraddockCenter for Earth and Planetary Sciences, National Air and Space Museum, Smithsonian Institution, Washington, D. C., USA
Received 26 January 2004; revised 17 March 2004; accepted 5 April 2004; published 12 May 2004.
[1] Results from simulation modeling of crater degradation by fluvial and eolianprocesses are compared with size-frequency and depth of infilling statistics for theheavily cratered Sinus Sabaeus quadrangle of Mars. The fractional degree of infillingof craters greater than 10 km in diameter in this region is bimodal, with a small populationof post-Noachian craters with little infilling, whereas most Noachian craters arestrongly infilled. This pattern is most consistent with fluvial erosion of craters, becausemodeling indicates that craters fill rapidly at first, but the rate of infilling diminishesthrough time as crater wall heights diminish and the area of deposition on the crater floorincreases. Simulated rates of crater infilling by eolian processes are more constant,which would be expected to produce craters equally distributed in degree of infilling,which is not observed. The small slope of the size-frequency distribution in the 10–30 kmsize range is also consistent with the more rapid fluvial erosion of smaller craters.The analysis also suggests that rates of crater production and of crater degradation were inrough balance during the Noachian epoch in the 10–30 km size range. INDEX TERMS:
5415 Planetology: Solid Surface Planets: Erosion and weathering; 5420 Planetology: Solid Surface Planets:
Impact phenomena (includes cratering); 6225 Planetology: Solar System Objects: Mars; 1824 Hydrology:
Geomorphology (1625); 1815 Hydrology: Erosion and sedimentation; KEYWORDS: craters, degradation
Citation: Forsberg-Taylor, N. K., A. D. Howard, and R. A. Craddock (2004), Crater degradation in the Martian highlands:
Morphometric analysis of the Sinus Sabaeus region and simulation modeling suggest fluvial processes, J. Geophys. Res., 109,
E05002, doi:10.1029/2004JE002242.
1. Introduction
[2] Since the first detailed pictures of the surface of Marswere returned by Mariner 4, the degraded nature of mostMartian highland craters has been apparent. With the excep-tion of relatively fresh post-Noachian craters, craters on thesouthern highlands generally demonstrate an absence ofrecognizable ejecta, low or missing crater rims, relativelyflat crater floors, and much shallower depth than fresh cratersof equivalent diameter. Avariety of processes may have beeninvolved in crater degradation, including superimposedimpacts, weathering, mass wasting, fluvial incision anddeposition, ice-related processes, lacustrine processes, lavainfilling, eolian saltation, and airfall deposition from 1) duststorms, 2) ash from volcanic eruptions, or 3) regionallydistributed ejecta from large impacts. Craters carry an im-portant record of geomorphic processes acting on planetary
surfaces because they are ubiquitous and, unless their rimsare breached, their interiors represent a closed sedimentarysystem (an exception is eolian deflation of fine-grainedsediments in a few impact craters [Malin and Edgett, 2000]).[3] The processes and history of crater degradation in the
Noachian is addressed in this paper by morphometricanalysis of crater morphology in a portion of the crateredhighlands coupled with simulation modeling of the twomost widespread degradation processes, eolian (saltationand airfall) modification and fluvial erosion and deposition.We use as our study site the heavily cratered Sinus SabaeusQuadrangle (0–30�S, 0–45�E) in which the dominantNoachian geomorphic processes were likely eolian modifi-cation (as broadly conceived to include both saltation andairfall) and fluvial erosion and deposition (including con-comitant weathering and mass-wasting). At equatorial lat-itudes post-Noachian sedimentation and modification byice-related processes [Soderblom et al., 1973; Mustard etal., 2001; Head et al., 2003; Kreslavsky and Head, 2003]has apparently been negligible.[4] Previous studies have argued for the predominance of
fluvial erosion in the degradation of craters during the
JOURNAL OF GEOPHYSICAL RESEARCH, VOL. 109, E05002, doi:10.1029/2004JE002242, 2004
1Now at Department of Earth and Planetary Sciences, WashingtonUniversity, St. Louis, Missouri, USA.
Copyright 2004 by the American Geophysical Union.0148-0227/04/2004JE002242$09.00
E05002 1 of 12
Noachian on the basis of channeling of the inner and outercrater rims, maintenance of a steep interior crater wallduring degradation, inward-sloping crater floors with gra-dients typical of fluvial fans, and preferential destructionof the raised crater rim [Craddock and Maxwell, 1993;Craddock et al., 1997; Craddock and Howard, 2002].Further evidence for fluvial erosion is offered here on thebasis of the frequency distribution of the amount of infillingof degraded craters and comparison with the results ofsimulation modeling.[5] We first introduce the simulation models of eolian and
fluvial crater degradation and investigate the temporalprogression of relative crater degradation and the effect ofinitial crater size on the rate of infilling. We then presentdata on the frequency distribution of relative crater degra-dation in a representative area of the Martian highlands. Onthe basis of these data and comparison with the results ofsimulation modeling we conclude that the production ofnew craters and their erosional destruction by fluvial pro-cesses were roughly balanced during the Noachian, at leastfor craters smaller than 30 km in diameter.
2. Simulation Modeling of Crater Degradation
[6] A computer simulation program has been developed[Howard, 1994, 1997; Craddock and Howard, 2002] thatsimulates crater degradation by the processes of airfalldeposition and by fluvial erosion and sedimentation. Thissimulation program is applied here to predict the temporalevolution of crater modification and the effects of crater sizeon modification rates. These predicted properties are thencompared with measured properties of degraded craters in aportion of the Martian highlands.
2.1. Fresh Crater Morphology
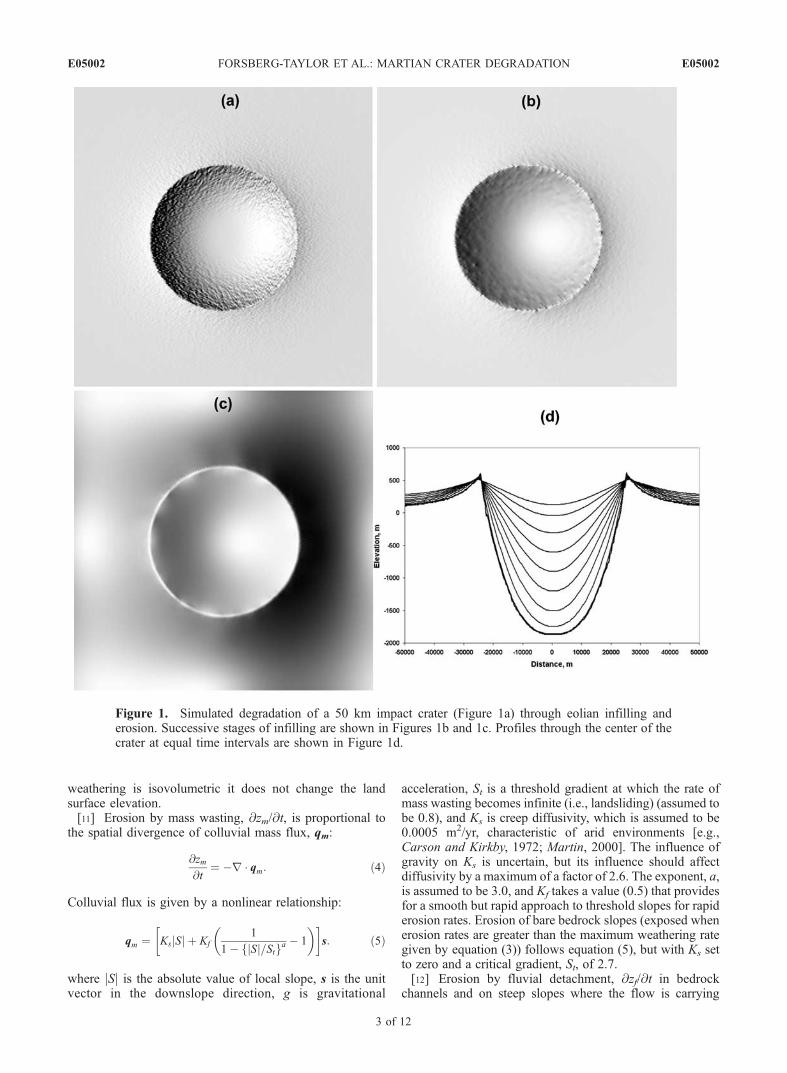
[7] The initial conditions for the simulations are a singlecrater of specified diameter superimposed on an otherwiseflat surface. Craters are generated by a routine that simulatesthe gross geometric properties of Martian craters on thebasis of published statistics on crater depth, rim height, andinterior wall gradient [Garvin et al., 2002, 2003]. Theprogram uses power functions of elevation versus distancefrom the crater center or rim to simulate the crater shape. Acertain level of random noise is superimposed on thisgeometric form, with the amount of noise going from zeroat the crater center to a maximum at the rim, and decliningbeyond the rim. The program does not simulate centralpeaks, multiring basins, or wall terracing. Simulated cratersranged from 1 km to 100 km in diameter, with thecorresponding cell size for the rectangular DEM rangingfrom 8 m to 800 m, so that the crater diameter was abouthalf the dimensions of the 256 � 256 simulation domain.The top and bottom boundaries are periodic, as are the leftand right boundaries. Figure 1a shows an example 50 kmsimulated crater, and Figure 2 shows example scaled pro-files through craters of varying diameter.
2.2. Eolian Modification
[8] Airfall and eolian degradation are modeled by aheuristic set of rules that model deposition and erosion asa function of the degree of exposure of a given location.Locations on or near ridges or isolated peaks (e.g., crater
rims) are either eroded by eolian stripping and abrasion orreceive diminished rates of sedimentation compared torelatively sheltered locations, such as crater floors and lowerwalls, which undergo net aggradation. The degree ofdeposition or erosion at any location within or outside ofa crater is a function of an ‘‘exposure index’’, Ie, which isbased on a weighted sum of the gradients, Si, between thelocal elevation, E, and that of surrounding locations, Ei:
Si ¼ Ei � Eð Þ=Dxi½ �; ð1Þ
where Dxi is the distance to the nearby point. The exposureindex, Iek, for points lying along a transect, k, extendingfrom the given location is given by
Iek ¼Xni¼1
Sie�hDxi
,Xni¼1
e�hDxi ; ð2Þ
where the parameter h governs the relative importance ofnearby versus distant points in determining the exposure. Incomputing equation (2) for a given location, transects nearthe crater rim include locations both within and outside ofthe rim. Points that are not visible from the location (lyingbehind a closer high point) are not included. For computa-tional efficiency exposure indices are calculated only alongthe eight cardinal and diagonal directions from a given pointand the net exposure index, Ie, is the average of the eight Iek.The rate of eolian erosion or deposition, @z/@tje is a functionof the exposure index (z is the vertical dimension). Thefunctional dependence of the erosion rate utilized here isshown in Figure 3.
2.3. Fluvial Erosion and Deposition
[9] The modeling of fluvial erosion of impact craters isbased on the model of Howard [1994, 1997] with compo-nents modeling physical or chemical weathering of rocks toform transportable colluvium, mass wasting by nonlinearcreep, fluvial detachment, and fluvial transport and deposi-tion. Parameters used for these simulations are based onterrestrial values in semi-arid or arid landscapes except forcorrecting for the difference in gravity between Mars andEarth.[10] It is assumed that the materials below the surface
(lava, sediments, ejecta, etc., collectively termed ‘‘bed-rock’’) may be indurated, but can be weathered at a finiterate by physical or chemical processes to form colluvium.The rate of bedrock weathering, @zb/@t, is assume todecrease exponentially with the thickness, H, of overlyingcolluvium:
@zb@t
¼ Kbe�cH ; ð3Þ
where Kb is the intrinsic maximum weathering rate (a jointfunction of rock properties and climate), and c governs therate of decay of weathering rate with colluvium thickness Inaccord with terrestrial observations [Heimsath et al., 1997,1999, 2000] in semi-arid landscapes c is set to 0.02 m�1,while Kb is a variable parameter in the range of 0.02 to0.0002 m/yr (Table 1). Conversion of bedrock to colluviumis assumed to be isovolumetric. Note that @zb/@t is the rateof lowering of the colluvial-bedrock contact, and when
E05002 FORSBERG-TAYLOR ET AL.: MARTIAN CRATER DEGRADATION
2 of 12
E05002
weathering is isovolumetric it does not change the landsurface elevation.[11] Erosion by mass wasting, @zm/@t, is proportional to
the spatial divergence of colluvial mass flux, qm:
@zm@t
¼ �r qm: ð4Þ
Colluvial flux is given by a nonlinear relationship:
qm ¼ Ks Sj j þ Kf
1
1� Sj j=Stf ga � 1
� �� �s: ð5Þ
where jSj is the absolute value of local slope, s is the unitvector in the downslope direction, g is gravitational
acceleration, St is a threshold gradient at which the rate ofmass wasting becomes infinite (i.e., landsliding) (assumed tobe 0.8), and Ks is creep diffusivity, which is assumed to be0.0005 m2/yr, characteristic of arid environments [e.g.,Carson and Kirkby, 1972; Martin, 2000]. The influence ofgravity on Ks is uncertain, but its influence should affectdiffusivity by a maximum of a factor of 2.6. The exponent, a,is assumed to be 3.0, and Kf takes a value (0.5) that providesfor a smooth but rapid approach to threshold slopes for rapiderosion rates. Erosion of bare bedrock slopes (exposed whenerosion rates are greater than the maximum weathering rategiven by equation (3)) follows equation (5), but with Ks setto zero and a critical gradient, St, of 2.7.[12] Erosion by fluvial detachment, @zf/@t in bedrock
channels and on steep slopes where the flow is carrying
Figure 1. Simulated degradation of a 50 km impact crater (Figure 1a) through eolian infilling anderosion. Successive stages of infilling are shown in Figures 1b and 1c. Profiles through the center of thecrater at equal time intervals are shown in Figure 1d.
E05002 FORSBERG-TAYLOR ET AL.: MARTIAN CRATER DEGRADATION
3 of 12
E05002
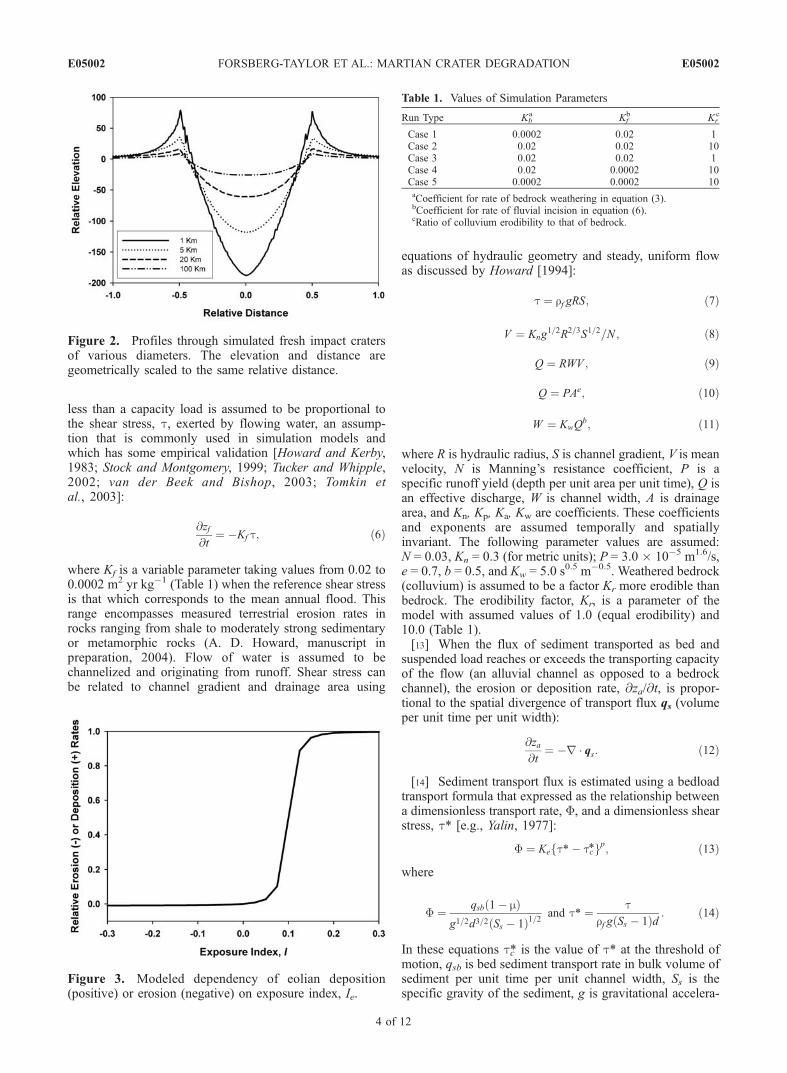
less than a capacity load is assumed to be proportional tothe shear stress, t, exerted by flowing water, an assump-tion that is commonly used in simulation models andwhich has some empirical validation [Howard and Kerby,1983; Stock and Montgomery, 1999; Tucker and Whipple,2002; van der Beek and Bishop, 2003; Tomkin etal., 2003]:
@zf@t
¼ �Kf t; ð6Þ
where Kf is a variable parameter taking values from 0.02 to0.0002 m2 yr kg�1 (Table 1) when the reference shear stressis that which corresponds to the mean annual flood. Thisrange encompasses measured terrestrial erosion rates inrocks ranging from shale to moderately strong sedimentaryor metamorphic rocks (A. D. Howard, manuscript inpreparation, 2004). Flow of water is assumed to bechannelized and originating from runoff. Shear stress canbe related to channel gradient and drainage area using
equations of hydraulic geometry and steady, uniform flowas discussed by Howard [1994]:
t ¼ rf gRS; ð7Þ
V ¼ Kng1=2R2=3S1=2=N ; ð8Þ
Q ¼ RWV ; ð9Þ
Q ¼ PAe; ð10Þ
W ¼ KwQb; ð11Þ
where R is hydraulic radius, S is channel gradient, V is meanvelocity, N is Manning’s resistance coefficient, P is aspecific runoff yield (depth per unit area per unit time), Q isan effective discharge, W is channel width, A is drainagearea, and Kn, Kp, Ka, Kw are coefficients. These coefficientsand exponents are assumed temporally and spatiallyinvariant. The following parameter values are assumed:N = 0.03, Kn = 0.3 (for metric units); P = 3.0 � 10�5 m1.6/s,e = 0.7, b = 0.5, and Kw = 5.0 s0.5 m�0.5. Weathered bedrock(colluvium) is assumed to be a factor Kr more erodible thanbedrock. The erodibility factor, Kr, is a parameter of themodel with assumed values of 1.0 (equal erodibility) and10.0 (Table 1).[13] When the flux of sediment transported as bed and
suspended load reaches or exceeds the transporting capacityof the flow (an alluvial channel as opposed to a bedrockchannel), the erosion or deposition rate, @za/@t, is propor-tional to the spatial divergence of transport flux qs (volumeper unit time per unit width):
@za@t
¼ �r qs: ð12Þ
[14] Sediment transport flux is estimated using a bedloadtransport formula that expressed as the relationship betweena dimensionless transport rate, F, and a dimensionless shearstress, t* [e.g., Yalin, 1977]:
F ¼ Ke t*� tc*f gp; ð13Þ
where
F ¼ qsb 1� mð Þg1=2d3=2 Ss � 1ð Þ1=2
and t* ¼ trf g Ss � 1ð Þd : ð14Þ
In these equations tc* is the value of t* at the threshold ofmotion, qsb is bed sediment transport rate in bulk volume ofsediment per unit time per unit channel width, Ss is thespecific gravity of the sediment, g is gravitational accelera-
Figure 2. Profiles through simulated fresh impact cratersof various diameters. The elevation and distance aregeometrically scaled to the same relative distance.
Figure 3. Modeled dependency of eolian deposition(positive) or erosion (negative) on exposure index, Ie.
Table 1. Values of Simulation Parameters
Run Type Kba Kf
b Krc
Case 1 0.0002 0.02 1Case 2 0.02 0.02 10Case 3 0.02 0.02 1Case 4 0.02 0.0002 10Case 5 0.0002 0.0002 10aCoefficient for rate of bedrock weathering in equation (3).bCoefficient for rate of fluvial incision in equation (6).cRatio of colluvium erodibility to that of bedrock.
E05002 FORSBERG-TAYLOR ET AL.: MARTIAN CRATER DEGRADATION
4 of 12
E05002
tion, rf is the fluid density, d is the sediment grain size, andm is alluvium porosity. A dominant bed grain size of 0.02 mis assumed, with Ke = 8.0, p = 1.5, tc* = 0.05, and Ss = 2.65.The shear stress is estimated from equations (7)–(11), withthe dominant discharge for sediment transport assumed tobe 0.6 of the mean annual flood, flowing 2% of the year.The bed sediment load is assumed to constitute 20% ofsediment eroded from slopes.[15] In bedrock channels the overall erosion rate, @z/@t, is
a weighted function of the rates of mass wasting and fluvialerosion, as discussed by Howard [1994, 1997]. Wherechannel gradients are low enough that channels transporta capacity bedload, erosion and deposition rates are gov-erned by equation (12). For the simulations reported here,the climate was assumed to be sufficiently arid that nostanding water was present for appreciable periods of timewithin the crater, and that runoff characteristics are typicalof terrestrial deserts or periglacial environments.[16] Making different assumptions about the values of
most of the simulation parameters will affect absoluteerosion rates and details of crater morphology, but willhave little effect on the issues most relevant to this study,that is, relative infilling rates of craters of different sizesand the temporal changes in infilling rates through time.The model parameters that most affect these properties arethe relative rates of rock weathering (Kb), rock fluvialerodibility (Kf), and relative colluvium erodibility (Kr). Aseries of simulations were conducted for fluvial and masswasting erosion on craters of different sizes with severalcombinations of these parameters (Table 1). For moreinformation on model details and scaling, see Howard[1994].
2.4. Simulation Results
[17] Although attempts have been made to characterizeabsolute rates of Martian crater modification by eolian andfluvial processes [Barlow, 1995; Golombek and Bridges,2000], the simulation results reported here are presented inrelative terms, either as amounts of modification throughtime assuming constancy of process rates or the relativerates of degradation for craters of different size. Both eolianand fluvial processes may have been highly variable both intime and location due to effects of gradual climate deteri-oration during the Noachian, quasiperiodic climate changeand, possibly, the effects of short-term increase of globaltemperatures and precipitation rates by large impactors[Segura et al., 2002].2.4.1. Eolian Degradation[18] The eolian model presented above is assumed to
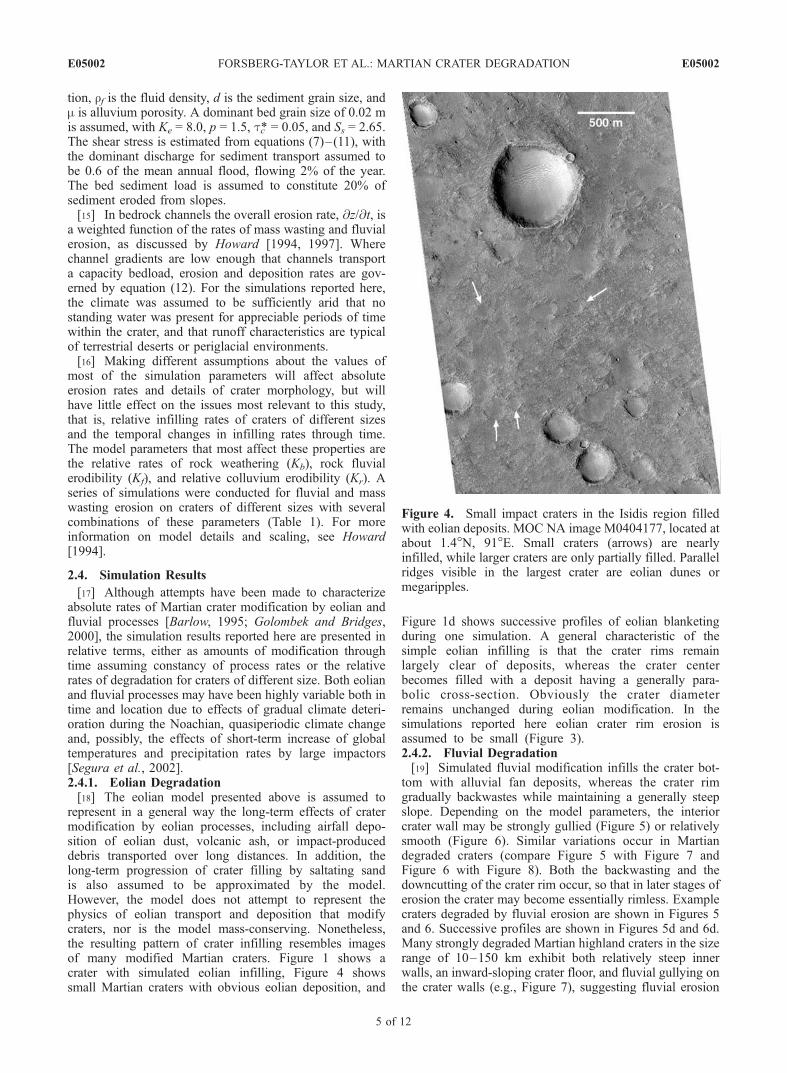
represent in a general way the long-term effects of cratermodification by eolian processes, including airfall depo-sition of eolian dust, volcanic ash, or impact-produceddebris transported over long distances. In addition, thelong-term progression of crater filling by saltating sandis also assumed to be approximated by the model.However, the model does not attempt to represent thephysics of eolian transport and deposition that modifycraters, nor is the model mass-conserving. Nonetheless,the resulting pattern of crater infilling resembles imagesof many modified Martian craters. Figure 1 shows acrater with simulated eolian infilling, Figure 4 showssmall Martian craters with obvious eolian deposition, and
Figure 1d shows successive profiles of eolian blanketingduring one simulation. A general characteristic of thesimple eolian infilling is that the crater rims remainlargely clear of deposits, whereas the crater centerbecomes filled with a deposit having a generally para-bolic cross-section. Obviously the crater diameterremains unchanged during eolian modification. In thesimulations reported here eolian crater rim erosion isassumed to be small (Figure 3).2.4.2. Fluvial Degradation[19] Simulated fluvial modification infills the crater bot-
tom with alluvial fan deposits, whereas the crater rimgradually backwastes while maintaining a generally steepslope. Depending on the model parameters, the interiorcrater wall may be strongly gullied (Figure 5) or relativelysmooth (Figure 6). Similar variations occur in Martiandegraded craters (compare Figure 5 with Figure 7 andFigure 6 with Figure 8). Both the backwasting and thedowncutting of the crater rim occur, so that in later stages oferosion the crater may become essentially rimless. Examplecraters degraded by fluvial erosion are shown in Figures 5and 6. Successive profiles are shown in Figures 5d and 6d.Many strongly degraded Martian highland craters in the sizerange of 10–150 km exhibit both relatively steep innerwalls, an inward-sloping crater floor, and fluvial gullying onthe crater walls (e.g., Figure 7), suggesting fluvial erosion
Figure 4. Small impact craters in the Isidis region filledwith eolian deposits. MOC NA image M0404177, located atabout 1.4�N, 91�E. Small craters (arrows) are nearlyinfilled, while larger craters are only partially filled. Parallelridges visible in the largest crater are eolian dunes ormegaripples.
E05002 FORSBERG-TAYLOR ET AL.: MARTIAN CRATER DEGRADATION
5 of 12
E05002
has been the dominant modifying process [Craddock andMaxwell, 1993; Craddock et al., 1997; Craddock andHoward, 2002].2.4.3. Crater Infilling Rates and Their DiameterDependency[20] A series of simulations were conducted with both the
fluvial and eolian degradation models to determine thetemporal progression of crater modification and the depen-dency of initial crater diameter on infilling rates. In thesesimulations the intrinsic rate constants for the modificationwere assumed to be temporally constant and to be the same
for initial craters of different size. The relative degree ofcrater modification was expressed as the ratio R,
R ¼ H � hð ÞH
; ð15Þ
where H is the initial fresh crater depth (measured fromthe average rim height to the lowest point of the craterfloor) and h is the crater depth at any subsequent time. Fora fresh crater this ratio is zero, and for a completelydegraded crater the ratio approaches unity. Note that a
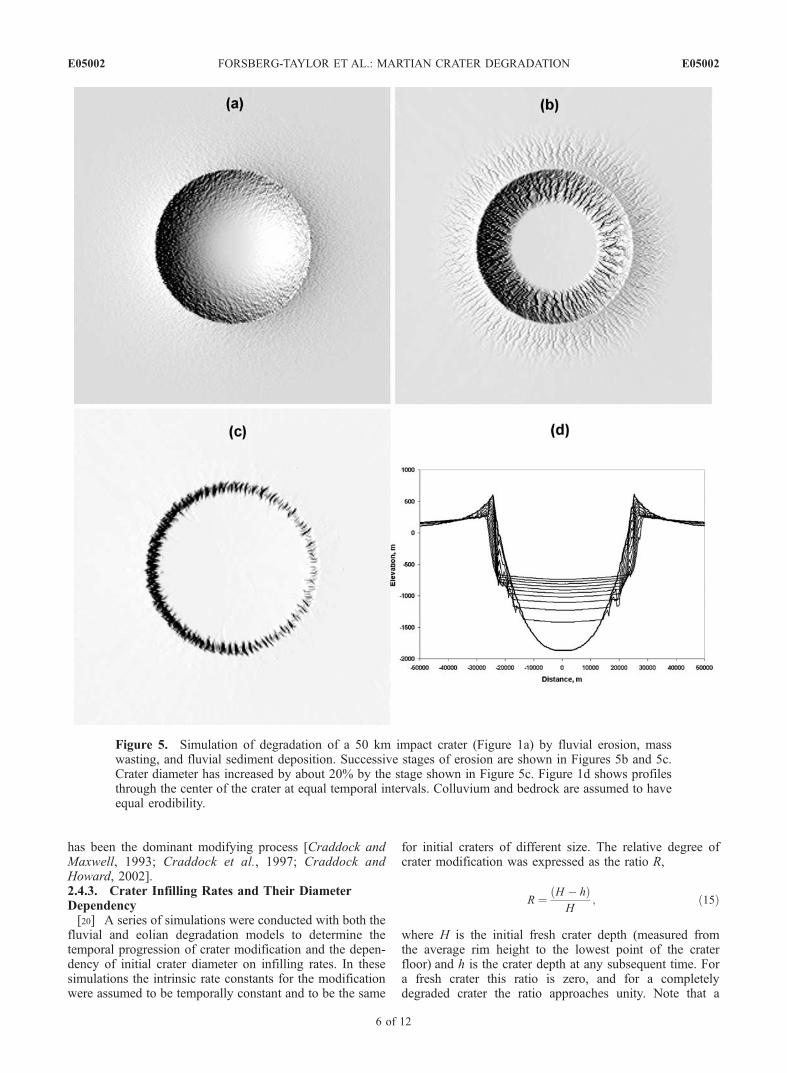
Figure 5. Simulation of degradation of a 50 km impact crater (Figure 1a) by fluvial erosion, masswasting, and fluvial sediment deposition. Successive stages of erosion are shown in Figures 5b and 5c.Crater diameter has increased by about 20% by the stage shown in Figure 5c. Figure 1d shows profilesthrough the center of the crater at equal temporal intervals. Colluvium and bedrock are assumed to haveequal erodibility.
E05002 FORSBERG-TAYLOR ET AL.: MARTIAN CRATER DEGRADATION
6 of 12
E05002
reduction in crater depth can occur both by infilling andby rim erosion, although the magnitude of the formerdominates for simulations of both fluvial and eoliandegradation.[21] For small craters the simulated eolian crater infilling
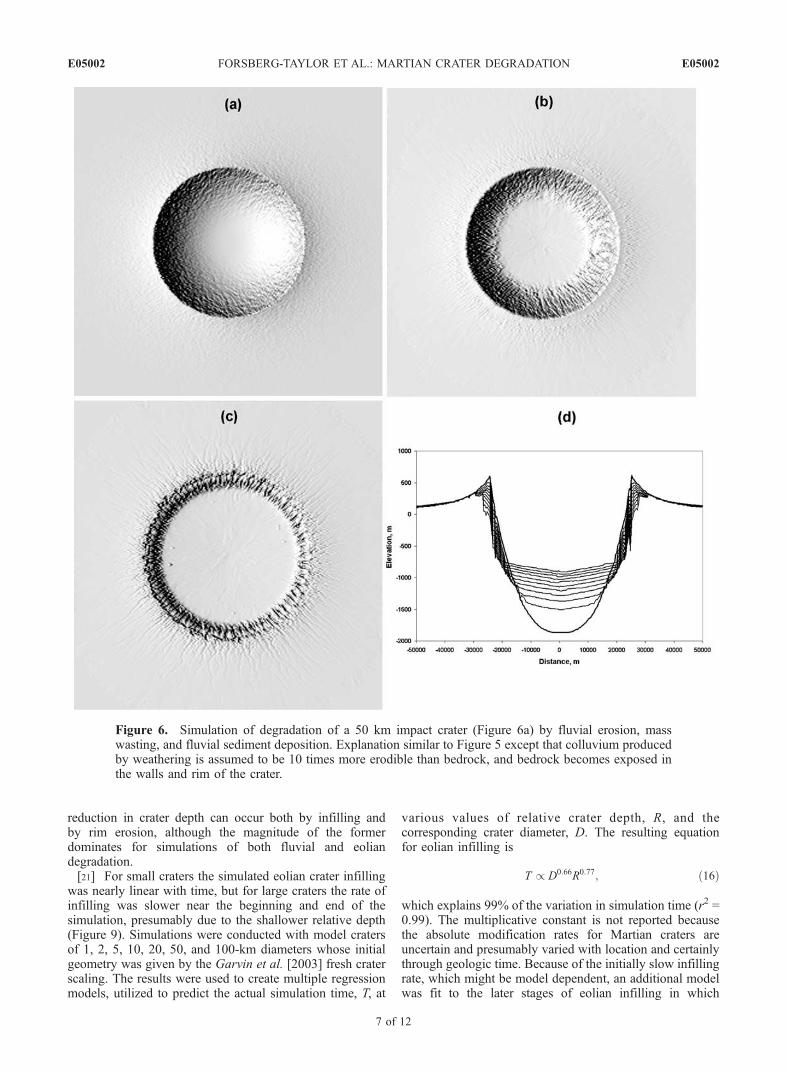
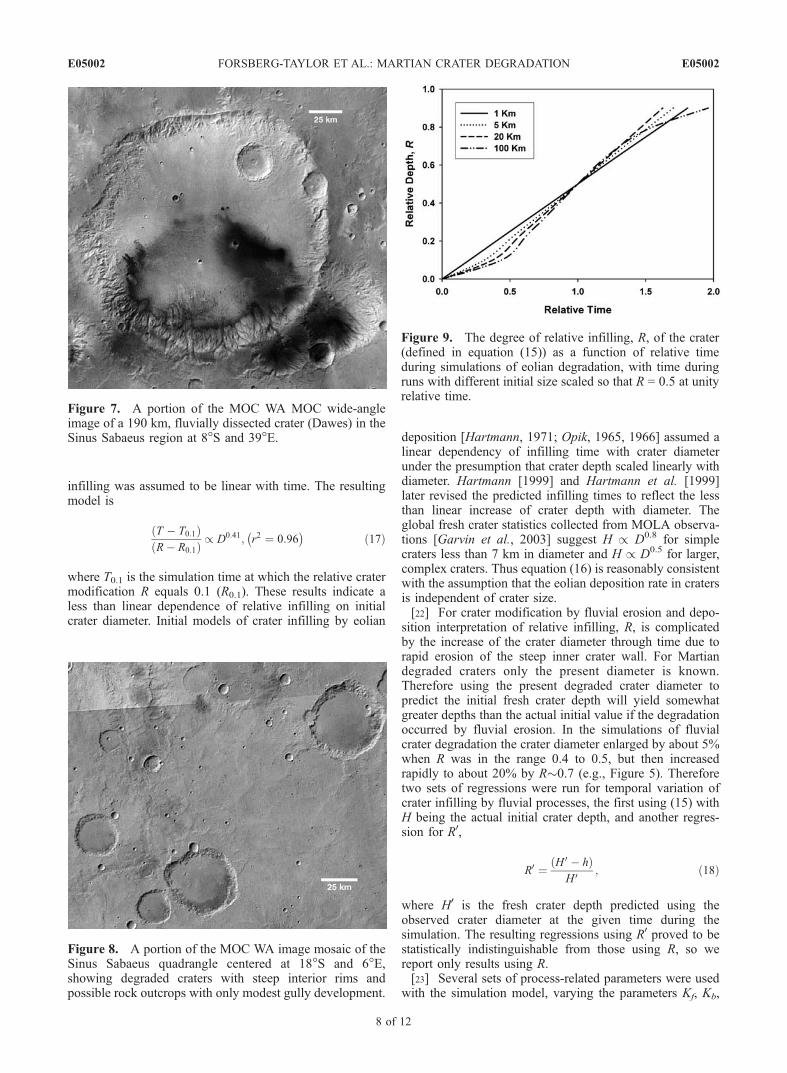
was nearly linear with time, but for large craters the rate ofinfilling was slower near the beginning and end of thesimulation, presumably due to the shallower relative depth(Figure 9). Simulations were conducted with model cratersof 1, 2, 5, 10, 20, 50, and 100-km diameters whose initialgeometry was given by the Garvin et al. [2003] fresh craterscaling. The results were used to create multiple regressionmodels, utilized to predict the actual simulation time, T, at
various values of relative crater depth, R, and thecorresponding crater diameter, D. The resulting equationfor eolian infilling is
T / D0:66R0:77; ð16Þ
which explains 99% of the variation in simulation time (r2 =0.99). The multiplicative constant is not reported becausethe absolute modification rates for Martian craters areuncertain and presumably varied with location and certainlythrough geologic time. Because of the initially slow infillingrate, which might be model dependent, an additional modelwas fit to the later stages of eolian infilling in which
Figure 6. Simulation of degradation of a 50 km impact crater (Figure 6a) by fluvial erosion, masswasting, and fluvial sediment deposition. Explanation similar to Figure 5 except that colluvium producedby weathering is assumed to be 10 times more erodible than bedrock, and bedrock becomes exposed inthe walls and rim of the crater.
E05002 FORSBERG-TAYLOR ET AL.: MARTIAN CRATER DEGRADATION
7 of 12
E05002
infilling was assumed to be linear with time. The resultingmodel is
T � T0:1ð ÞR� R0:1ð Þ / D0:41; r2 ¼ 0:96
� �ð17Þ
where T0.1 is the simulation time at which the relative cratermodification R equals 0.1 (R0.1). These results indicate aless than linear dependence of relative infilling on initialcrater diameter. Initial models of crater infilling by eolian
deposition [Hartmann, 1971; Opik, 1965, 1966] assumed alinear dependency of infilling time with crater diameterunder the presumption that crater depth scaled linearly withdiameter. Hartmann [1999] and Hartmann et al. [1999]later revised the predicted infilling times to reflect the lessthan linear increase of crater depth with diameter. Theglobal fresh crater statistics collected from MOLA observa-tions [Garvin et al., 2003] suggest H / D0.8 for simplecraters less than 7 km in diameter and H / D0.5 for larger,complex craters. Thus equation (16) is reasonably consistentwith the assumption that the eolian deposition rate in cratersis independent of crater size.[22] For crater modification by fluvial erosion and depo-
sition interpretation of relative infilling, R, is complicatedby the increase of the crater diameter through time due torapid erosion of the steep inner crater wall. For Martiandegraded craters only the present diameter is known.Therefore using the present degraded crater diameter topredict the initial fresh crater depth will yield somewhatgreater depths than the actual initial value if the degradationoccurred by fluvial erosion. In the simulations of fluvialcrater degradation the crater diameter enlarged by about 5%when R was in the range 0.4 to 0.5, but then increasedrapidly to about 20% by R�0.7 (e.g., Figure 5). Thereforetwo sets of regressions were run for temporal variation ofcrater infilling by fluvial processes, the first using (15) withH being the actual initial crater depth, and another regres-sion for R0,
R0 ¼ H 0 � hð ÞH 0 ; ð18Þ
where H0 is the fresh crater depth predicted using theobserved crater diameter at the given time during thesimulation. The resulting regressions using R0 proved to bestatistically indistinguishable from those using R, so wereport only results using R.[23] Several sets of process-related parameters were used
with the simulation model, varying the parameters Kf, Kb,
Figure 7. A portion of the MOC WA MOC wide-angleimage of a 190 km, fluvially dissected crater (Dawes) in theSinus Sabaeus region at 8�S and 39�E.
Figure 9. The degree of relative infilling, R, of the crater(defined in equation (15)) as a function of relative timeduring simulations of eolian degradation, with time duringruns with different initial size scaled so that R = 0.5 at unityrelative time.
Figure 8. A portion of the MOC WA image mosaic of theSinus Sabaeus quadrangle centered at 18�S and 6�E,showing degraded craters with steep interior rims andpossible rock outcrops with only modest gully development.
E05002 FORSBERG-TAYLOR ET AL.: MARTIAN CRATER DEGRADATION
8 of 12
E05002
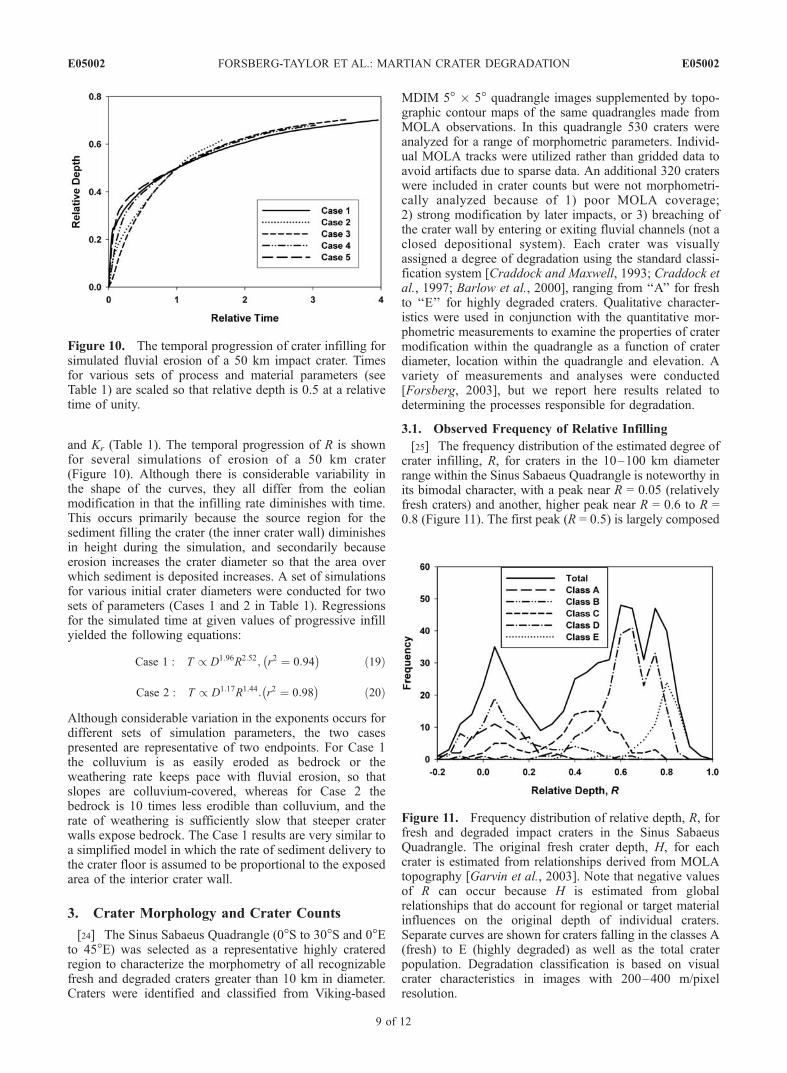
and Kr (Table 1). The temporal progression of R is shownfor several simulations of erosion of a 50 km crater(Figure 10). Although there is considerable variability inthe shape of the curves, they all differ from the eolianmodification in that the infilling rate diminishes with time.This occurs primarily because the source region for thesediment filling the crater (the inner crater wall) diminishesin height during the simulation, and secondarily becauseerosion increases the crater diameter so that the area overwhich sediment is deposited increases. A set of simulationsfor various initial crater diameters were conducted for twosets of parameters (Cases 1 and 2 in Table 1). Regressionsfor the simulated time at given values of progressive infillyielded the following equations:
Case 1 : T / D1:96R2:52; r2 ¼ 0:94� �
ð19Þ
Case 2 : T / D1:17R1:44: r2 ¼ 0:98� �
ð20Þ
Although considerable variation in the exponents occurs fordifferent sets of simulation parameters, the two casespresented are representative of two endpoints. For Case 1the colluvium is as easily eroded as bedrock or theweathering rate keeps pace with fluvial erosion, so thatslopes are colluvium-covered, whereas for Case 2 thebedrock is 10 times less erodible than colluvium, and therate of weathering is sufficiently slow that steeper craterwalls expose bedrock. The Case 1 results are very similar toa simplified model in which the rate of sediment delivery tothe crater floor is assumed to be proportional to the exposedarea of the interior crater wall.
3. Crater Morphology and Crater Counts
[24] The Sinus Sabaeus Quadrangle (0�S to 30�S and 0�Eto 45�E) was selected as a representative highly crateredregion to characterize the morphometry of all recognizablefresh and degraded craters greater than 10 km in diameter.Craters were identified and classified from Viking-based
MDIM 5� � 5� quadrangle images supplemented by topo-graphic contour maps of the same quadrangles made fromMOLA observations. In this quadrangle 530 craters wereanalyzed for a range of morphometric parameters. Individ-ual MOLA tracks were utilized rather than gridded data toavoid artifacts due to sparse data. An additional 320 craterswere included in crater counts but were not morphometri-cally analyzed because of 1) poor MOLA coverage;2) strong modification by later impacts, or 3) breaching ofthe crater wall by entering or exiting fluvial channels (not aclosed depositional system). Each crater was visuallyassigned a degree of degradation using the standard classi-fication system [Craddock and Maxwell, 1993; Craddock etal., 1997; Barlow et al., 2000], ranging from ‘‘A’’ for freshto ‘‘E’’ for highly degraded craters. Qualitative character-istics were used in conjunction with the quantitative mor-phometric measurements to examine the properties of cratermodification within the quadrangle as a function of craterdiameter, location within the quadrangle and elevation. Avariety of measurements and analyses were conducted[Forsberg, 2003], but we report here results related todetermining the processes responsible for degradation.
3.1. Observed Frequency of Relative Infilling
[25] The frequency distribution of the estimated degree ofcrater infilling, R, for craters in the 10–100 km diameterrange within the Sinus Sabaeus Quadrangle is noteworthy inits bimodal character, with a peak near R = 0.05 (relativelyfresh craters) and another, higher peak near R = 0.6 to R =0.8 (Figure 11). The first peak (R = 0.5) is largely composed
Figure 10. The temporal progression of crater infilling forsimulated fluvial erosion of a 50 km impact crater. Timesfor various sets of process and material parameters (seeTable 1) are scaled so that relative depth is 0.5 at a relativetime of unity.
Figure 11. Frequency distribution of relative depth, R, forfresh and degraded impact craters in the Sinus SabaeusQuadrangle. The original fresh crater depth, H, for eachcrater is estimated from relationships derived from MOLAtopography [Garvin et al., 2003]. Note that negative valuesof R can occur because H is estimated from globalrelationships that do account for regional or target materialinfluences on the original depth of individual craters.Separate curves are shown for craters falling in the classes A(fresh) to E (highly degraded) as well as the total craterpopulation. Degradation classification is based on visualcrater characteristics in images with 200–400 m/pixelresolution.
E05002 FORSBERG-TAYLOR ET AL.: MARTIAN CRATER DEGRADATION
9 of 12
E05002
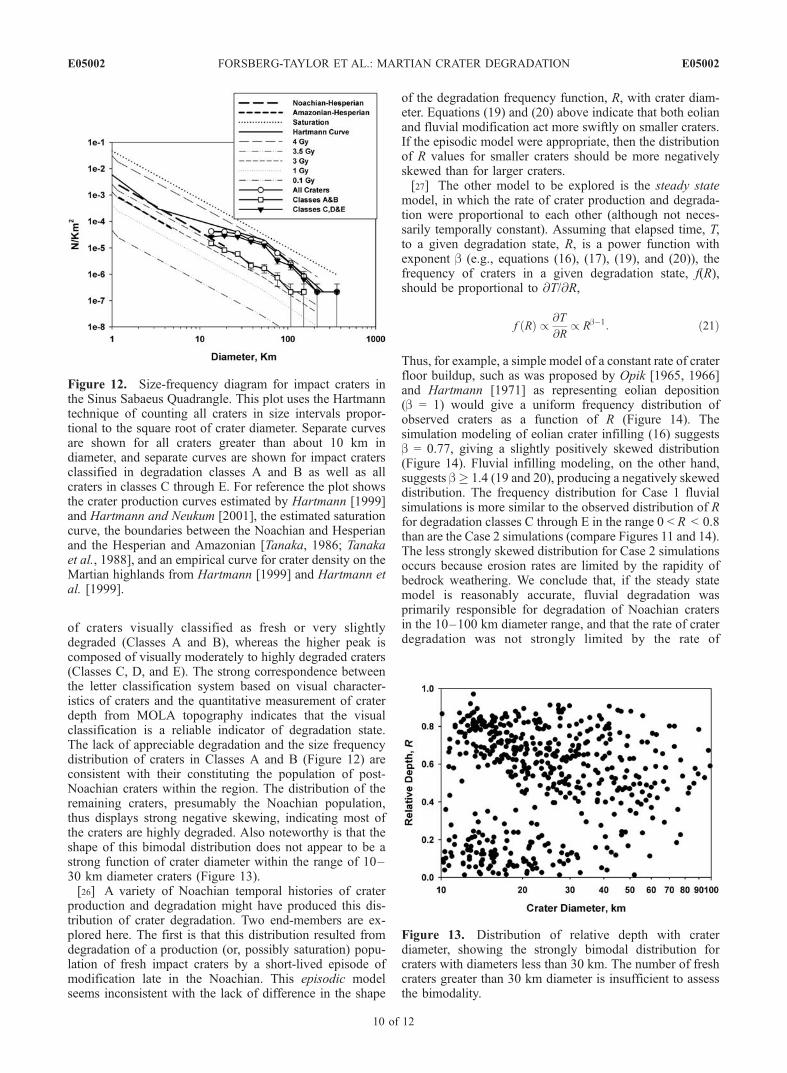
of craters visually classified as fresh or very slightlydegraded (Classes A and B), whereas the higher peak iscomposed of visually moderately to highly degraded craters(Classes C, D, and E). The strong correspondence betweenthe letter classification system based on visual character-istics of craters and the quantitative measurement of craterdepth from MOLA topography indicates that the visualclassification is a reliable indicator of degradation state.The lack of appreciable degradation and the size frequencydistribution of craters in Classes A and B (Figure 12) areconsistent with their constituting the population of post-Noachian craters within the region. The distribution of theremaining craters, presumably the Noachian population,thus displays strong negative skewing, indicating most ofthe craters are highly degraded. Also noteworthy is that theshape of this bimodal distribution does not appear to be astrong function of crater diameter within the range of 10–30 km diameter craters (Figure 13).[26] A variety of Noachian temporal histories of crater
production and degradation might have produced this dis-tribution of crater degradation. Two end-members are ex-plored here. The first is that this distribution resulted fromdegradation of a production (or, possibly saturation) popu-lation of fresh impact craters by a short-lived episode ofmodification late in the Noachian. This episodic modelseems inconsistent with the lack of difference in the shape
of the degradation frequency function, R, with crater diam-eter. Equations (19) and (20) above indicate that both eolianand fluvial modification act more swiftly on smaller craters.If the episodic model were appropriate, then the distributionof R values for smaller craters should be more negativelyskewed than for larger craters.[27] The other model to be explored is the steady state
model, in which the rate of crater production and degrada-tion were proportional to each other (although not neces-sarily temporally constant). Assuming that elapsed time, T,to a given degradation state, R, is a power function withexponent b (e.g., equations (16), (17), (19), and (20)), thefrequency of craters in a given degradation state, f(R),should be proportional to @T/@R,
f Rð Þ / @T
@R/ Rb�1: ð21Þ
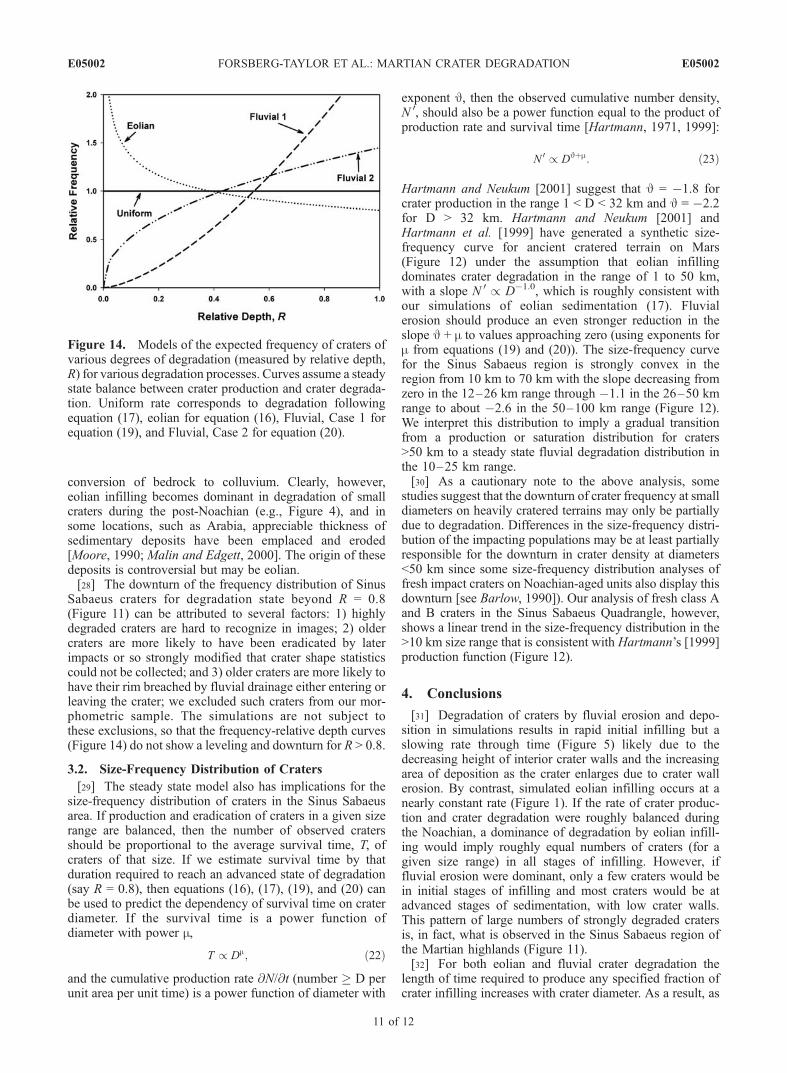
Thus, for example, a simple model of a constant rate of craterfloor buildup, such as was proposed by Opik [1965, 1966]and Hartmann [1971] as representing eolian deposition(b = 1) would give a uniform frequency distribution ofobserved craters as a function of R (Figure 14). Thesimulation modeling of eolian crater infilling (16) suggestsb = 0.77, giving a slightly positively skewed distribution(Figure 14). Fluvial infilling modeling, on the other hand,suggests b� 1.4 (19 and 20), producing a negatively skeweddistribution. The frequency distribution for Case 1 fluvialsimulations is more similar to the observed distribution of Rfor degradation classes C through E in the range 0 < R < 0.8than are the Case 2 simulations (compare Figures 11 and 14).The less strongly skewed distribution for Case 2 simulationsoccurs because erosion rates are limited by the rapidity ofbedrock weathering. We conclude that, if the steady statemodel is reasonably accurate, fluvial degradation wasprimarily responsible for degradation of Noachian cratersin the 10–100 km diameter range, and that the rate of craterdegradation was not strongly limited by the rate of
Figure 12. Size-frequency diagram for impact craters inthe Sinus Sabaeus Quadrangle. This plot uses the Hartmanntechnique of counting all craters in size intervals propor-tional to the square root of crater diameter. Separate curvesare shown for all craters greater than about 10 km indiameter, and separate curves are shown for impact cratersclassified in degradation classes A and B as well as allcraters in classes C through E. For reference the plot showsthe crater production curves estimated by Hartmann [1999]and Hartmann and Neukum [2001], the estimated saturationcurve, the boundaries between the Noachian and Hesperianand the Hesperian and Amazonian [Tanaka, 1986; Tanakaet al., 1988], and an empirical curve for crater density on theMartian highlands from Hartmann [1999] and Hartmann etal. [1999].
Figure 13. Distribution of relative depth with craterdiameter, showing the strongly bimodal distribution forcraters with diameters less than 30 km. The number of freshcraters greater than 30 km diameter is insufficient to assessthe bimodality.
E05002 FORSBERG-TAYLOR ET AL.: MARTIAN CRATER DEGRADATION
10 of 12
E05002
conversion of bedrock to colluvium. Clearly, however,eolian infilling becomes dominant in degradation of smallcraters during the post-Noachian (e.g., Figure 4), and insome locations, such as Arabia, appreciable thickness ofsedimentary deposits have been emplaced and eroded[Moore, 1990; Malin and Edgett, 2000]. The origin of thesedeposits is controversial but may be eolian.[28] The downturn of the frequency distribution of Sinus
Sabaeus craters for degradation state beyond R = 0.8(Figure 11) can be attributed to several factors: 1) highlydegraded craters are hard to recognize in images; 2) oldercraters are more likely to have been eradicated by laterimpacts or so strongly modified that crater shape statisticscould not be collected; and 3) older craters are more likely tohave their rim breached by fluvial drainage either entering orleaving the crater; we excluded such craters from our mor-phometric sample. The simulations are not subject tothese exclusions, so that the frequency-relative depth curves(Figure 14) do not show a leveling and downturn for R > 0.8.
3.2. Size-Frequency Distribution of Craters
[29] The steady state model also has implications for thesize-frequency distribution of craters in the Sinus Sabaeusarea. If production and eradication of craters in a given sizerange are balanced, then the number of observed cratersshould be proportional to the average survival time, T, ofcraters of that size. If we estimate survival time by thatduration required to reach an advanced state of degradation(say R = 0.8), then equations (16), (17), (19), and (20) canbe used to predict the dependency of survival time on craterdiameter. If the survival time is a power function ofdiameter with power m,
T / Dm; ð22Þ
and the cumulative production rate @N/@t (number � D perunit area per unit time) is a power function of diameter with
exponent J, then the observed cumulative number density,N 0, should also be a power function equal to the product ofproduction rate and survival time [Hartmann, 1971, 1999]:
N 0 / DJþm: ð23Þ
Hartmann and Neukum [2001] suggest that J = �1.8 forcrater production in the range 1 < D < 32 km and J = �2.2for D > 32 km. Hartmann and Neukum [2001] andHartmann et al. [1999] have generated a synthetic size-frequency curve for ancient cratered terrain on Mars(Figure 12) under the assumption that eolian infillingdominates crater degradation in the range of 1 to 50 km,with a slope N 0 / D�1.0, which is roughly consistent withour simulations of eolian sedimentation (17). Fluvialerosion should produce an even stronger reduction in theslope J + m to values approaching zero (using exponents form from equations (19) and (20)). The size-frequency curvefor the Sinus Sabaeus region is strongly convex in theregion from 10 km to 70 km with the slope decreasing fromzero in the 12–26 km range through �1.1 in the 26–50 kmrange to about �2.6 in the 50–100 km range (Figure 12).We interpret this distribution to imply a gradual transitionfrom a production or saturation distribution for craters>50 km to a steady state fluvial degradation distribution inthe 10–25 km range.[30] As a cautionary note to the above analysis, some
studies suggest that the downturn of crater frequency at smalldiameters on heavily cratered terrains may only be partiallydue to degradation. Differences in the size-frequency distri-bution of the impacting populations may be at least partiallyresponsible for the downturn in crater density at diameters<50 km since some size-frequency distribution analyses offresh impact craters on Noachian-aged units also display thisdownturn [see Barlow, 1990]). Our analysis of fresh class Aand B craters in the Sinus Sabaeus Quadrangle, however,shows a linear trend in the size-frequency distribution in the>10 km size range that is consistent with Hartmann’s [1999]production function (Figure 12).
4. Conclusions
[31] Degradation of craters by fluvial erosion and depo-sition in simulations results in rapid initial infilling but aslowing rate through time (Figure 5) likely due to thedecreasing height of interior crater walls and the increasingarea of deposition as the crater enlarges due to crater wallerosion. By contrast, simulated eolian infilling occurs at anearly constant rate (Figure 1). If the rate of crater produc-tion and crater degradation were roughly balanced duringthe Noachian, a dominance of degradation by eolian infill-ing would imply roughly equal numbers of craters (for agiven size range) in all stages of infilling. However, iffluvial erosion were dominant, only a few craters would bein initial stages of infilling and most craters would be atadvanced stages of sedimentation, with low crater walls.This pattern of large numbers of strongly degraded cratersis, in fact, what is observed in the Sinus Sabaeus region ofthe Martian highlands (Figure 11).[32] For both eolian and fluvial crater degradation the
length of time required to produce any specified fraction ofcrater infilling increases with crater diameter. As a result, as
Figure 14. Models of the expected frequency of craters ofvarious degrees of degradation (measured by relative depth,R) for various degradation processes. Curves assume a steadystate balance between crater production and crater degrada-tion. Uniform rate corresponds to degradation followingequation (17), eolian for equation (16), Fluvial, Case 1 forequation (19), and Fluvial, Case 2 for equation (20).
E05002 FORSBERG-TAYLOR ET AL.: MARTIAN CRATER DEGRADATION
11 of 12
E05002
suggested by Hartmann [1971, 1999], the steepness of size-frequency crater curves should be reduced in those diameterranges strongly affected by degradation. For the SinusSabaeus quadrangle the observed distribution of Noachiancraters (Classes C, D, and E in Figure 12) is consistent witha gradual transition from a production or saturation distri-bution for craters >50 km to a steady state fluvial degrada-tion distribution in the 10–25 km diameter range.[33] In summary, our analysis of statistics of relative
crater degradation and size-frequency distributions in theSinus Sabaeus quadrangle confirms earlier conclusions thatfluvial erosion was the dominant degradation process[Craddock and Maxwell, 1993; Craddock et al., 1997;Craddock and Howard, 2002] and also suggests that ratesof crater production and of crater degradation were in roughbalance during the Noachian epoch. If future studies findthat Noachian craters were significantly modified by otherprocesses, such as ice induced glacier-like flow or energeticmass wasting, then our conclusions would need to berevised.
[34] Acknowledgments. This research was supported by the NASAPlanetary Geology and Geophysics Program and the Mars Data AnalysisProgram.
ReferencesBarlow, N. G. (1990), Constraints on early events in Martian history asderived from the cratering record, J. Geophys. Res., 95, 14,191–14,201.
Barlow, N. G. (1995), The degradation of impact craters in Maja Valles andArabia, Mars, J. Geophys. Res., 100(E11), 23,307–23,316.
Barlow, N. G., J. B. Garvin, S. E. H. Sakimoto, R. O. Kuzmin, D. J. Roddy,L. A. Soderblom, J. M. Boyce, F. M. Costard, and R. A. Craddock(2000), Standardizing the nomenclature of Martian impact crater ejectamorphologies, J. Geophys. Res., 105(11), 26,733–26,738.
Carson, M. A., and M. J. Kirkby (1972), Hillslope Form and Process,475 pp., Cambridge Univ. Press, New York.
Craddock, R. A., and A. D. Howard (2002), The case for rainfall on awarm, wet early Mars, J. Geophys. Res., 107(E11), 5111, doi:10.1029/2001JE001505.
Craddock, R. A., and T. A. Maxwell (1993), Geomorphic evolution of theMartian highlands through ancient fluvial processes, J. Geophys. Res.,98(E2), 3453–3468.
Craddock, R. A., T. A. Maxwell, and A. D. Howard (1997), Crater mor-phometry and modification in the Sinus Sabaeus and Margaritifer Sinusregions of Mars, J. Geophys. Res., 102, 13,321–13,340.
Forsberg, N. K. (2003), Analyses of crater morphologies and modificationprocesses in the Sinus Sabaeus region of Mars, M. S. thesis, Univ. of Va.,Charlottesville.
Garvin, J. B., S. E. H. Sakimoto, J. J. Frawley, and C. Schnetzler (2002),Global geometric properties of Martian impact craters, Lunar Planet. Sci.,XXXIII, abstract 1255.
Garvin, J. B., S. Sakimoto, and J. J. Frawley (2003), Craters on Mars:Global geometric properties from gridded MOLA topography, paper pre-sented at Sixth International Conference on Mars, Calif. Inst. of Technol.,Pasadena, Calif.
Golombek, M. P., and N. T. Bridges (2000), Erosion rates on Mars andimplications for climate change: Constraints from the Pathfinder landingsite, J. Geophys. Res., 105, 1841–1854.
Hartmann, W. K. (1971), Martian cratering III: Theory of crater oblitera-tion, Icarus, 15, 410–428.
Hartmann, W. K. (1999), Martian cratering VI: Crater count isochrons andevidence for recent volcanism from Mars Global Surveyor, Meteorit.Planet. Sci., 34(2), 167–177.
Hartmann, W. K., and G. Neukum (2001), Cratering chronology and theevolution of Mars, Space Sci. Rev., 96, 165–194.
Hartmann, W. K., L. Soderblom, P. Thomas, E. Danielson, P. James,J. Veverka, M. Malin, A. McEwen, and M. Carr (1999), Evidence for
recent volcanism on Mars from crater counts, Nature, 397(6720),586–589.
Head, J. W., J. F. Mustard, M. A. Kreslavsky, R. E. Milliken, and D. R.Marchant (2003), Recent ice ages on Mars, Nature, 426, 797–802,doi:10.1038/nature02114.
Heimsath, A. M., W. E. Dietrich, K. Nishiizumi, and R. C. Finkel (1997),The soil production function and landscape equilibrium, Nature,388(6640), 358–361.
Heimsath, A. M., W. E. Dietrich, K. Nishiizumi, and R. C. Finkel (1999),Cosmogenic nuclides, topography, and the spatial variation of soil depth,Geomorphology, 27(1–2), 151–172.
Heimsath, A. M., J. Chappell, W. E. Dietrich, K. Nishiizumi, and R. C.Finkel (2000), Soil production on a retreating escarpment in southeasternAustralia, Geology, 28(9), 787–790.
Howard, A. D. (1994), A detachment-limited model of drainage-basin evo-lution, Water Resour. Res., 30(7), 2261–2285.
Howard, A. D. (1997), Badland morphology and evolution: Interpretationusing a simulation model, Earth Surf. Processes Landforms, 22(3), 211–227.
Howard, A. D., and G. Kerby (1983), Channel changes in badlands, Geol.Soc. Am. Bull., 94(6), 739–752.
Kreslavsky, M. A., and J. W. Head (2003), North-south topographic slopeasymmetry on Mars: Evidence for insolation-related erosion at high ob-liquity, Geophys. Res. Lett., 30(15), 1815, doi:10.1029/2003GL017795.
Malin, M. C., and K. S. Edgett (2000), Sedimentary rocks of early Mars,Science, 290, 1927–1937.
Martin, Y. (2000), Modelling hillslope evolution: Linear and nonlineartransport relations, Geomorphology, 34(1–2), 1–21.
Moore, J. M. (1990), Nature of the mantling deposit in the heavily crateredterrain of northeastern Arabia, Mars, J. Geophys. Res., 95, 14,279–14,289.
Mustard, J. F., C. D. Cooper, and M. K. Rifkin (2001), Evidence for recentclimate change on Mars from the identification of youthful near-surfaceground ice, Nature, 412, 4111–4114.
Opik, E. J. (1965), Mariner IV and craters on Mars, Irish Astron. J., 7, 92–104.
Opik, E. J. (1966), The Martian surface, Science, 153, 255–265.Segura, T. L., O. B. Toon, A. Colaprete, and K. Zahnle (2002), Environ-mental effects of large impacts on Mars, Science, 298(5600), 1977–1980.
Soderblom, L. A., T. J. Kreidler, and H. Masursky (1973), Latitudinaldistribution of a debris mantle on the Martian surface, J. Geophys.Res., 78(20), 4117–4122.
Stock, J. D., and D. R. Montgomery (1999), Geologic constraints on bed-rock river incision using the stream power law, J. Geophys. Res, 104(B3),4983–4993.
Tanaka, K. L. (1986), The stratigraphy of Mars, Proc. Lunar Planet. Sci.Conf. 17th, Part 1, J. Geophys. Res., 91, suppl, E139–E158.
Tanaka, K. L., N. K. Isbell, D. H. Scott, R. Greeley, and J. E. Guest (1988),The resurfacing history of Mars: A synthesis of digitized, Viking-basedgeology, Proc. Lunar Planet. Sci. Conf. 18th, 665–678.
Tomkin, J. H., M. T. Brandon, F. J. Pazzaglia, J. R. Barbour, and S. D.Willett (2003), Quantitative testing of bedrock incision models for theClearwater River, NW Washington State, J. Geophys. Res., 108(B6),2308, doi:10.1029/2001JB000862.
Tucker, G. E., and K. X. Whipple (2002), Topographic outcomes predictedby stream erosion models: Sensitivity analysis and intermodel compar-ison, J. Geophys. Res., 107(B9), 2179, doi:10.1029/2001JB000162.
van der Beek, P., and P. Bishop (2003), Cenozoic river profile developmentin the Upper Lachlan catchment (SE Australia) as a test of quantitativefluvial incision models, J. Geophys. Res., 108(B6), 2309, doi:10.1029/2002JB002125.
Yalin, M. S. (1977), Mechanics of Sediment Transport, 298 pp., Pergamon,New York.
�����������������������R. A. Craddock, Center for Earth and Planetary Sciences, National Air
and Space Museum, Smithsonian Institution, Washington, DC 20560, USA.([email protected])N. K. Forsberg-Taylor, Department of Earth and Planetary Sciences,
Washington University, St. Louis, MO 63130, USA. ([email protected])A. D. Howard, Department of Environmental Sciences, University of
Virginia, P.O. Box 400123, Charlottesville, VA 22904-4123, USA.([email protected])
E05002 FORSBERG-TAYLOR ET AL.: MARTIAN CRATER DEGRADATION
12 of 12
E05002