Embed Size (px)
Citation preview

Available online at www.sciencedirect.com
International Journal of Mechanical Sciences 45 (2003) 1645–1660
Crashworthiness assessment of front side members inan auto-body considering the fabrication histories
H. Huha ;∗, K.P. Kima, S.H. Kima, J.H. Songa, H.S. Kimb, S.K. Hongb
aDepartment of Mechanical Engineering, Korea Advanced Institute of Science and Technology, 373-1 Gusongdong,Science Town, Daejon 305-701, South Korea
bResearch and Development Division for Hyundai Motor Company and Kia Motors Corporation, Namyang-myun,Whasung-gun, Kyunggi-do 445-706, South Korea
Received 12 June 2003; received in revised form 29 September 2003; accepted 27 November 2003
Abstract
This paper is concerned with crash analysis of a front side member in an auto-body considering the e1ectof fabrication. The front side member is fabricated with sheet metal forming processes that induce forminghistories such as plastic work hardening and non-uniform thickness distribution. Numerical simulation is carriedout with LS-DYNA3D in order to identify the forming e1ect on the crashworthiness. The result shows that thecrash analysis of the front side member with considering the forming history leads to a di1erent result fromthat without considering the forming e1ect. The analysis calculated the crash mode, the reaction force and theenergy absorption for crashworthiness assessment with the forming e1ect. The analysis results demonstratethat the design of auto-body members should be carried out considering the forming history for accurateassessment of crashworthiness.? 2003 Elsevier Ltd. All rights reserved.
Keywords: Crashworthiness assessment; Crash analysis; Sheet forming analysis; Draw-bead analysis; Forming e1ect;Front side member
1. Introduction
The crashworthiness of a car has to be evaluated with the load-carrying capacity and the crashmode at the initial stage of auto-body design. Auto-body members such as a front side membershould be designed to e9ciently absorb the kinetic energy during the car crash in order to se-cure occupants from the impact and penetration. The estimation of the energy absorption e9ciencyof auto-body members requires the accurate crash analysis for the load-carrying capacity and the
∗ Corresponding author. Tel.: +82-42-869-3222; fax: +82-42-869-3210.E-mail address: [email protected] (H. Huh).
0020-7403/$ - see front matter ? 2003 Elsevier Ltd. All rights reserved.doi:10.1016/j.ijmecsci.2003.09.022

1646 H. Huh et al. / International Journal of Mechanical Sciences 45 (2003) 1645–1660
crash mode. In order to accomplish reliable crash simulation, crashworthiness of auto-body mem-bers should be evaluated considering the e1ect of stamping and forming as well as the dynamicproperties of materials. As most load-carrying members of an auto-body are fabricated from thesheet metal forming process, they could possess wrinkling and thinning induced from forming aswell as non-uniform distributions of the e1ective plastic strain and the thickness strain accordingto the forming condition and their Cnal shapes. Many crash analyses have been, however, carriedout neglecting the forming e1ect induced by stamping and forming processes for estimation of thecrashworthiness of an auto-body, providing erroneous results in the crash mode and the amount ofcrash. Recently, the crash analysis has been performed for auto-body members considering forminge1ect such as the strain hardening and the non-uniform thickness distribution [1–6]. These studiesinsisted that the crash analysis of auto-body structures should be carried out considering forminge1ects for the purpose of reliable assessment.
Dutton et al. evaluated the crashworthiness of the side-rail considering variations of thickness,plastic strain and residual stress obtained from the hydro-forming analysis [1,2]. Lee et al. carriedout the crash analyses of a sheet formed S-rail and a hydro-formed tube considering the e1ect of themesh conCguration as well as the thickness, the plastic strain and the residual stress [3]. Kim andHuh considered not only e1ects of the thickness variation and the e1ective plastic strain but alsothe e1ect of the Cnal formed shape in the collapse analysis of an S-rail structure using the Cniteelement limit analysis [4,5]. Mikami et al. carried out the frontal crash analysis of a car consideringthe thickness variation and the plastic strain for the front side member and the under frame [6].
In this paper, the forming histories of a front side member are obtained from simulation ofstamping and forming processes so that they can be considered in the estimation of its crashwor-thiness. Since front side members should play an important role in absorption of the kinetic energyduring the front crash, they are fabricated from sheet metals. Forming analysis of each panel ofthe front side member is carried out with an explicit elasto-plastic Cnite element analysis code,LS-DYNA3D. Non-uniform distributions of the e1ective plastic strain and the thickness strain informed panels are obtained as the forming history from simulation of sheet metal forming. As theCrst step, draw-bead analysis is performed for calculation of the restraining force of draw-beads withan implicit elasto-plastic Cnite element analysis code, ABAQUS/Standard. Secondly, the calculatedrestraining force is applied to forming simulation of each panel as the equivalent restraining forceon the Iange region. The thickness strain of the inner panel, frame-frt-in, is compared with thethickness strain in a real product for veriCcation of the analysis result.
Crash analysis of the front side member is carried out imposing the forming analysis result onthe initial condition. Numerical simulation is performed with LS-DYNA3D in order to evaluate thecrashworthiness of the front side member. In order to consider the non-uniform distributions of thee1ective plastic strain and the thickness as the condition for crash analysis, the forming historiesare mapped into the new Cnite element mesh system. The crash analysis results of the front sidemember considering the forming histories are compared with that without the forming e1ect. Theforming e1ect on the crashworthiness is investigated for non-uniform distribution of the thicknessand the e1ective plastic strain separately. The crash analysis results well demonstrate that theseforming histories greatly change the crash mode, the load-carrying capacity and the energy absorptione9ciency of the front side member. It is noted from the results that design of auto-body membersneeds to consider the forming e1ects for a proper and accurate evaluation of the crashworthiness ofa car with fabricated members.

H. Huh et al. / International Journal of Mechanical Sciences 45 (2003) 1645–1660 1647
2. Forming analysis of the front side member
A front side member is composed of seven panels as shown in Fig. 1: frame-frt-in; frame-frt-out-A;frame-frt-out-B; reinf-frt-frame-A; reinf-frt-frame-C; reinf-frt-frame-D; and hook-tie-down. The form-ing histories are calculated with the direct forming analysis for four panels that have great inIuenceon the behavior of the front crash. For the sake of the computational e9ciency, the restrainingforces of draw-beads in the dies are calculated with an implicit elasto-plastic Cnite element code,ABAQUS/Standard. The forming analysis is then carried out for four panels, imposing the calculatedrestraining forces as boundary conditions of the equivalent draw-bead [7–11]. The forming analysis,which is made up of the binder wrap process and the punch forming process, is performed withexplicit elasto-plastic Cnite element code, LS-DYNA3D. Calculated forming results are applied tothe crash simulation as the initial condition.
2.1. Draw-bead analysis
The punch and die proCles for the Cnite element analysis of the draw-bead forming process areextracted from the geometric data of the tool-set as shown in Fig. 2 for frame-frt-in. Draw-beads areemployed with di1erent shape and size according to each panel. The binder wrap analysis as well asthe drawing analysis of the draw-bead is performed to calculate the restraining force of draw-beadsfor accurate forming simulation. Calculated equivalent draw-bead forces are applied to the forminganalysis of the front side member. Fig. 3 explains geometric shapes of the circular and rectangulardraw-beads for the simulation. The dimensions of circular draw-beads employed in forming of four
Fig. 1. Finite element model of seven parts of a front side member.

1648 H. Huh et al. / International Journal of Mechanical Sciences 45 (2003) 1645–1660
Fig. 2. Location of draw-beads in the sheet metal forming die for a front frame.
Fig. 3. Geometric shapes of draw-beads in the front side member: (a) circular draw-bead; (b) rectangular draw-bead.
Table 1Dimensions of circular draw-beads in the front side member (unit = mm)
Part Bead type R r H
Frame-frt-in Circular bead 4.8 6.2 3.0Frame-frt-out-A Circular bead 4.0 5.2 6.0Reinf-frt-frame-A Circular bead 1 4.5 3.8 3.2
Circular bead 2 4.5 3.8 5.2Reinf-frt-frame-C Circular bead 1 6.5 4.7 3.0
Circular bead 2 6.5 4.7 5.0Circular bead 3 6.5 4.7 6.0
panels are explained in Table 1. The dimension of the rectangular draw-bead in the reinf-frt-frame-Ais H =6 mm, L=7:65 mm, r1 =2:18 mm and r2 =1:5 mm. Table 2 shows the initial sheet thicknessand material properties for forming simulation of four panels. The Cnite element model of an initialblank sheet has four layers of Cnite elements for accurate description of bending deformation.
Figs. 4 and 5 show deformed shapes during the bead formation process with a circular draw-beadin the frame-frt-in for the binder wrap process and for the drawing process, respectively, and Figs. 6and 7 show deformed shapes during the bead formation process with a rectangular draw-bead in thereinf-frt-frame-A for the binder wrap process and for the drawing process, respectively. The straindistribution during the bead formation process and the drawing process is very complicated and wellexplained in the previous work [9]. Although it is not shown in this paper, the strain distribution witha circular draw-bead is quite di1erent from that with a rectangular draw-bead. Draw-bead analysesof other panels are simulated with the same procedures.

H. Huh et al. / International Journal of Mechanical Sciences 45 (2003) 1645–1660 1649
Table 2Material properties and initial thickness of panels in the front side member
Part (Material) Sheet thickness and Iow stress curve
Frame-frt-in Initial sheet thickness: 1:6 mm(SPRC40) M� = 734:7(0:01 + M�)0:245 (MPa)Frame-frt-out-A Initial sheet thickness: 1:2 mm(SPRC40) M� = 734:7(0:01 + M�)0:245 (MPa)Reinf-frt-frame-A Initial sheet thickness: 0:9 mm(SAPH38) M� = 768:5(0:023 + M�)0:285 (MPa)Reinf-frt-frame-C Initial sheet thickness: 2:0 mm(SPRC45) M� = 823:8(0:012 + M�)0:229 (MPa)
Fig. 4. Deformed shapes of the blank during the bead formation process with a circular draw-bead in frame-frt-in.
Fig. 5. Deformed shapes of the blank during the drawing process with a circular draw-bead in frame-frt-in.

1650 H. Huh et al. / International Journal of Mechanical Sciences 45 (2003) 1645–1660
Fig. 6. Deformed shapes of the blank during the bead formation process with a rectangular draw-bead in Reinf-frt-frame-A.
Fig. 7. Deformed shapes of the blank during the drawing process with a rectangular draw-bead in Reinf-frt-frame-A.
Fig. 8 shows the calculated restraining force with respect to the drawing length for the circularand rectangular draw-beads. Since the rectangular draw-bead restrains the draw-in of sheet metalmore than the circular draw-bead, the restraining force with the rectangular draw-bead graduallyincreases with the drawing length while the restraining force with the circular draw-bead reaches tothe steady-state value.
Table 3 shows the restraining forces that are obtained at the steady state for each draw-bead asthe equivalent force in forming simulation. A rectangular draw-bead is employed in forming thereinf-frt-frame-A in order to control the material Iow the sheet with less draw-in with the largerestraining force.

H. Huh et al. / International Journal of Mechanical Sciences 45 (2003) 1645–1660 1651
0 2 4 6 8 100
50
100
150
200
250
300R
estr
aini
ng F
orce
(N/m
m)
0 2 4 6 8 100
50
100
150
200
250
300
Res
trai
ning
For
ce(N
/mm
)
0 2 4 6 8 100
50
100
150
200
250
300
350
Circular 1 Circular 2 Rectangular
Res
trai
ning
For
ce(N
/mm
)
0 2 4 6 8 100
50
100
150
200
250
300
350
Circular 1 Circular 2 Circular 3R
estr
aini
ng F
orce
(N/m
m)
Drawing Length (mm) Drawing Length (mm)
Drawing Length (mm) Drawing Length (mm)
(a) (b)
(c) (d)
Fig. 8. Restraining force with respect to the drawing length: (a) frame-frt-in; (b)frame-frt-in; (c) reinf-frt-frame-A ;(d) reinf-frt-frame-C.
Table 3Restraining forces of draw-beads in the front side member
Part Bead type Restraining force (N/mm)
Frame-frt-in Circular bead 226Frame-frt-out-A Circular bead 243Reinf-frt-frame-A Circular bead 1 246
Circular bead 2 271Rectangular bead 294
Reinf-frt-frame-C Circular bead 1 217Circular bead 2 235Circular bead 3 278
2.2. Forming analysis
Direct forming analyses have been carried out for four panels of the front side member. A com-mercial explicit Cnite element code, LS-DYNA3D is employed in forming simulation for compu-tational e9ciency since it requires tremendous calculation time to simulate forming processes with

1652 H. Huh et al. / International Journal of Mechanical Sciences 45 (2003) 1645–1660
Fig. 9. Initial setting of tools and the blank for the numerical analysis of the frame-frt-in in the front side member.
Fig. 10. Final forming results of the frame-frt-in: (a) distribution of the e1ective plastic strain; (b) distribution of thethickness strain.
the implicit Cnite element method. The initial sheet thickness and material properties are shown inTable 2. The coulomb friction coe9cient is 0.15 between the sheet and tools. The blank holdingforce of 100 kN are applied to the blank holder. The binder wrap analysis and the punch forminganalysis are carried out with calculated equivalent draw-bead forces listed in Table 3 as boundaryconditions.
The die, the punch and the blank holder are modeled with Cnite element patches for formingsimulation of each panel. Fig. 9 shows the tooling system for the analysis of the frame-frt-in.Draw-beads are expressed with curved lines and attached to the blank holder as shown in Fig. 2.An r-type adaptive mesh system is adopted for the precise description of the formed shape. Fig. 10shows the e1ective plastic strain distribution and the thickness distribution in the frame-frt-in afterforming simulation. The thickness distribution calculated has been compared with that in the real partfor the frame-frt-in. Fig. 11 shows the quantitative comparison of the thickness variation along thedesignated line between the real product and the Cnite element simulation result. The Cgures showvery close coincidence between the measured results and the calculated results. The comparison fullydemonstrates that the result from Cnite element forming simulation of the front frame member ishighly reliable and its result of the e1ective plastic strain distribution and the thickness distribution

H. Huh et al. / International Journal of Mechanical Sciences 45 (2003) 1645–1660 1653
Fig. 11. Comparison of thickness distribution of the frame-frt-in: (a) measured section; (b) section A–A′; (c) sectionB–B′; (d) section C–C′.
can be applied to the crash analysis as the initial condition for better description of the real crashbehavior.
Forming analyses of other panels were also carried out with the same procedures in order to obtainthe e1ective plastic strain distribution and the thickness distribution as the forming histories that areto be considered as forming e1ects in the crash simulation. Distributions of the e1ective plasticstrain and the thickness were mapped into new Cnite element mesh systems for the crash simulation.Fig. 12 shows the e1ective plastic strain distribution and the thickness distribution mapped from thesimulation results for each part.
3. Crash analysis of the front side member
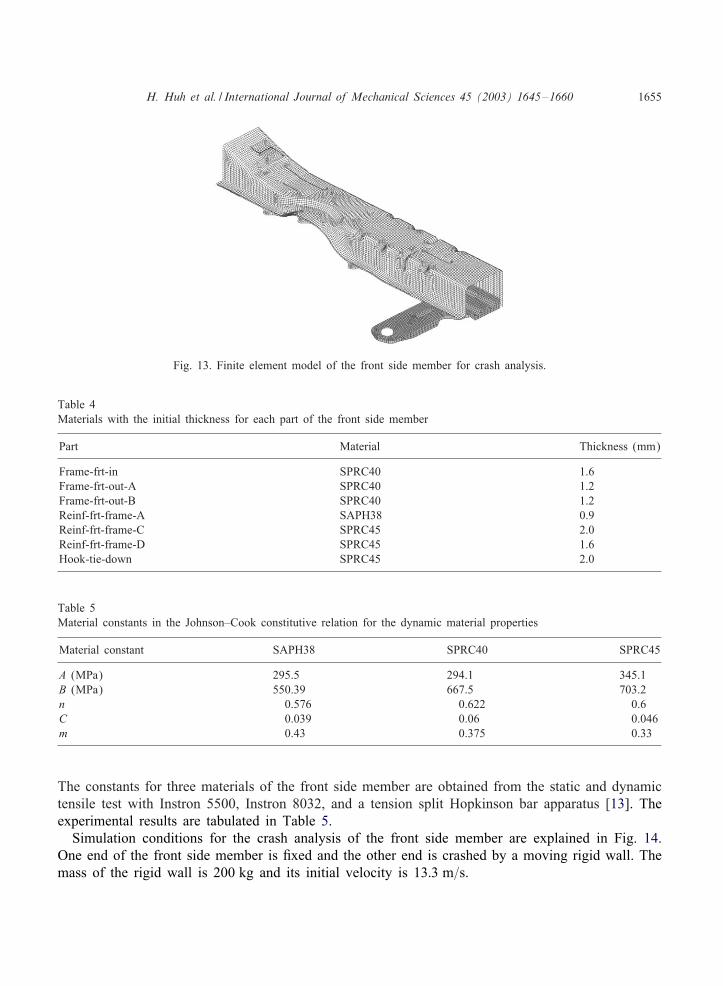
A Cnite element model of the assembled front side member for the crash analysis is shown inFig. 13. The total mesh system consists of 29842 four-node shell elements and 30788 nodal points.The welding points for assembling seven parts are 93 points that are also modeled in simulation. Fi-nite element models of seven panels that compose the front side member are illustrated in Fig. 1 withthe number of nodes and elements speciCed for each panel. The panels are obtained from the formedones by trimming. Forming histories obtained from the forming analysis in the previous section areutilized as the initial condition of the crash analysis for accurate assessment of crashworthiness.
The material speciCcation and the thickness for seven panels of the front side member are shownin Table 4. The dynamic behavior of materials is described with the Johnson–Cook constitutive

1654 H. Huh et al. / International Journal of Mechanical Sciences 45 (2003) 1645–1660
Fig. 12. Distribution of the e1ective plastic strain and the thickness, respectively in parts of the front side member:(a) frame-frt-in; (b) frame-frt-out-A; (c) reinf-frt-frame-A; (d) reinf-frt-frame-C.
relation as shown in Eq. (1) which has Cve material constants: A; B; n; C and m [12,13].
M� = [A+ B M�n][1 + C ln
M�M�0
][1− T ∗m]; (1)
where
T ∗ =T − TroomTmelt − Troom ;
M�0 = 1=s: (2)
H. Huh et al. / International Journal of Mechanical Sciences 45 (2003) 1645–1660 1655
Fig. 13. Finite element model of the front side member for crash analysis.
Table 4Materials with the initial thickness for each part of the front side member
Part Material Thickness (mm)
Frame-frt-in SPRC40 1.6Frame-frt-out-A SPRC40 1.2Frame-frt-out-B SPRC40 1.2Reinf-frt-frame-A SAPH38 0.9Reinf-frt-frame-C SPRC45 2.0Reinf-frt-frame-D SPRC45 1.6Hook-tie-down SPRC45 2.0
Table 5Material constants in the Johnson–Cook constitutive relation for the dynamic material properties
Material constant SAPH38 SPRC40 SPRC45
A (MPa) 295.5 294.1 345.1B (MPa) 550.39 667.5 703.2n 0.576 0.622 0.6C 0.039 0.06 0.046m 0.43 0.375 0.33
The constants for three materials of the front side member are obtained from the static and dynamictensile test with Instron 5500, Instron 8032, and a tension split Hopkinson bar apparatus [13]. Theexperimental results are tabulated in Table 5.
Simulation conditions for the crash analysis of the front side member are explained in Fig. 14.One end of the front side member is Cxed and the other end is crashed by a moving rigid wall. Themass of the rigid wall is 200 kg and its initial velocity is 13:3 m=s.

1656 H. Huh et al. / International Journal of Mechanical Sciences 45 (2003) 1645–1660
Fig. 14. Schematic diagram for crash analysis of the front side member.
Fig. 15. Deformed shapes of the front side member at 30 ms: (a) without forming histories; (b) with the thicknessdistribution; (c) with the e1ective plastic strain distribution; (d) with all forming histories.
Crash analysis of the front side member is carried out considering the forming histories obtainedfrom the forming analysis. The crash analysis has been carried out for 30 ms. The analysis resultis compared with the one without considering forming e1ects. The thickness distribution and thee1ective plastic strain distribution are considered separately or all together as the initial condition ofthe crash analysis of the front side member.
Fig. 15 shows deformed shapes of the front side member in four di1erent cases of simulation: TheCrst one is without considering the forming e1ect; the second one is with considering the thickness

H. Huh et al. / International Journal of Mechanical Sciences 45 (2003) 1645–1660 1657
Fig. 16. Comparison of deformed shapes of the front side member: (a) without forming histories; (b) with all forminghistories.
distribution; the third one is with considering the e1ective plastic strain distribution; and the fourthone is with considering all forming histories. The deformation proceeds from the struck end since theend region has several grooves to induce axial folding. After the front region is crushed with folding,the deformation proceeds to the rear region absorbing more kinetic energy. The results show that theCrst and second ones deform more than the third and forth ones and the third one with consideringthe e1ective plastic strain distribution is the strongest while the second one with considering thethickness distribution is the weakest. It is because the e1ective plastic strain distribution plays a rolein crash as reinforcements with the increased Iow stress and the thickness distribution plays a rolein crash as defects stemming from thinning due to stamping. When the e1ective plastic strain isconsidered as the forming history, the deformation proceeds less and slower than others. When thethickness is considered, deformation is concentrated on dimples in the grooved region and thus theenergy is absorbed less than others.
Fig. 16 demonstrates that the deformed shape with all forming histories considered is di1erentfrom the one of the designed front side member that did not consider any forming e1ect. Theregion with dimples undergoes severer deformation when the forming e1ect is not considered thanwhen the forming histories are considered. The middle region undergoes more remarkable bendingwhen the forming e1ect is not considered than the one with all forming histories considered. It isbecause the bending in the middle region is delayed when the e1ective plastic strain distributionis considered as the forming histories. These results show that the deformation mode is greatlychanged when forming histories are considered in the crash analysis. The most inIuencing factoris the non-uniform distributions of the e1ective plastic strain and the thickness. The comparisonfully demonstrates that the forming histories have to be considered in the crash analysis for accurateassessment of crashworthiness.
The reaction forces normal to the wall are plotted with respect to the crushing distance inFig. 17. The curves were obtained by Cltering the original curves from the crash analysis with

1658 H. Huh et al. / International Journal of Mechanical Sciences 45 (2003) 1645–1660
0 50 100 150 200 250 3000
30
60
90
120
150
180
Rea
ctio
n fo
rce
(kN
)
Displacement (mm)
without forming effects with only thickness distribution with only strain distribution with all forming effects
Fig. 17. Reaction force during the crash of the front side member.
0 50 100 150 200 250 3000
4
8
12
16
Inte
rnal
ene
rgy
(kJ)
Displacement (mm)
without forming effects with only thickness distribution with only strain distribution with all forming effects
Fig. 18. Comparison of the energy absorption with respect to the displacement in the front side member during the crashfor 30 ms.
the SAE600 Clter. The initial peak load is 138:3 kN when the forming e1ect is not considered and155:6 kN when all forming histories are considered. The initial peak load increases by 13% whenonly the e1ective plastic strain is considered and decreases slightly when only the non-uniformthickness is considered compared to the one without the forming e1ect. The reaction force tends toincrease more with deformation in the case of the analysis considering the e1ective plastic strainthan without considering the e1ective plastic strain. The results explain that the strain hardeningwith the e1ective plastic strain from forming processes makes the maximum load increase and thenon-uniform thickness distribution with the thinned region can be considered as the initial defect ofthe front side member.
The absorbed energy during deformation is plotted in Fig. 18. The Cgure also demonstrates thatenergy absorption increases remarkably when the e1ective plastic strain is considered and decreasesslightly when the non-uniform thickness distribution is considered. The energy absorption of the frontside member has a larger value when all forming e1ects are considered than the one without forming

H. Huh et al. / International Journal of Mechanical Sciences 45 (2003) 1645–1660 1659
e1ect. The di1erence is 5.3% at the crushing distance of 100 mm, 10.2% when the crushing distanceis 200 mm, and 17.3% when the crushing distance is 250 mm. The most important phenomenonis that the energy absorption rate increases with deformation when the e1ective plastic strain isconsidered in the analysis, while the energy absorption rate decreases with deformation when thee1ective plastic strain is not considered. It is because the deformation is delayed with the sti1enedbody when the e1ective plastic strain is considered. The Cgure shows that the displacement after30 ms is 275:8 mm when the forming e1ect is not considered and 262:1 mm when all forminghistories are considered. These results demonstrate that the strain hardening resulted from formingprocesses is dominant in calculation of the reaction force and energy absorption. It is noted fromthe results that the crash analysis of the front side member has to be carried out considering theforming e1ect, especially, the e1ective plastic strain, for accurate assessment of crashworthiness.
4. Conclusion
Crash analysis of a front side member has been carried out in order to evaluate the crashworthinessaccurately considering the forming history. The analysis investigated the di1erence of the crash mode,the reaction force and the energy absorption between the results with considering the forming historyand without considering the forming e1ect. Forming analyses of parts of the front side member havebeen carried out to obtain the distribution of the thickness and the e1ective plastic strain as theforming history that were considered as the initial condition in the crash analysis. Forming analysisincludes draw-bead formation and drawing analysis as the equivalent condition in the binder wrapprocess and the punch forming process. The crash analysis results considering the forming historywere compared with that without the forming e1ect. The comparison explains that the e1ectiveplastic strain is dominant in the calculation of the crash mode, the reaction force and the energyabsorption due to strain hardening. The analysis results fully demonstrated that the forming historyshould be considered for accurate assessment of crashworthiness at the design stage of auto-bodymembers.
References
[1] Dutton T, Iregbu S, Sturt R, Kellicut A, Cowell B, Kavikondala K. The e1ect of forming on the crashworthinessof vehicles with hydroformed frame siderails. SAE paper 1999-01-3208, 1999.
[2] Kellicut A, Cowell B, Kavikondala K, Dutton T, Iregbu S, Sturt R. Application of the results of forming simulationin crash models. Proceedings of NUMISHEET’99, BesanScon, France, 1999. p. 509–14.
[3] Lee S-H, Han C-S, Oh S-I, Wriggers P. Comparative crash simulations incorporating the results of sheet forminganalyses. Engineering Computations 2001;18(5/6):744–58.
[4] Kim KP, Huh H. Collapse analysis of an auto-body structure by a Cnite element limit method. Proceedings of theSixth USNCCM, Dearborn, USA, 2003. p. 737–42.
[5] Kim KP, Huh H. Collapse analysis of auto-body structures considering the e1ect of fabrication. Key EngineeringMaterials 2003;233–236:737–42.
[6] Mikami H, Suzuki H, Ishizawa M, Matsuoka Y. Crash simulation considered inIuence of stamping. Proceedings ofHANPAM’99, Seoul, Korea, 1999. p. 187–200.
[7] Huh H, Han SS. Numerical simulation of rectangular cup drawing process with draw-beads. Proceedings ofNUMIFORM’95, Ithaca, USA, 1995. p. 723–8.

1660 H. Huh et al. / International Journal of Mechanical Sciences 45 (2003) 1645–1660
[8] Cao J, Boyce MC. Drawbead penetration as a control element of material Iow. SAE paper 930517, Detroit, USA,1993.
[9] Choi TH, Huh H, Chun BK, Lee JH. Draw-bead simulation by an elasto-plastic Cnite element method with directionalreduced integration. Journal of Materials Processing Technology 1997;63:666–71.
[10] Meinders T, Geijselasers HJM, HuTetink J. Equivalent drawbead performance in deep drawing simulations. Proceedingsof NUMISHEET’ 99, Besancon, France, 1999. p. 243–8.
[11] Sunaga H, Kawa M, Makinouchi A. Drawbeads-simulation models and experimental veriCcation in sheet metalforming processes. Proceedings of NUMIFORM’98, Enschede, Netherlands, 1998. p. 917–23.
[12] Johnson GR, Cook WH. A constitutive model and data for metals subjected to large strains, high strain rates andhigh temperatures. Proceedings of the Seventh International Symposium on Ballistics, Hague, Netherlands, 1983.p. 541–7.
[13] Kang WJ, Huh H. VeriCcation of tension split Hopkinson bar to identify the dynamic behavior of sheet metals.Experimental Mechanics 2002;42(1):8–17.