Embed Size (px)
Citation preview

1
CR
ASH
CO
UR
SE 2020
CRASH COURSE
20
20
IT’S TIME
®
CCC Information Services Inc.222 Merchandise Mart Plaza, Suite 900Chicago, IL 60654
(800) 621.8070
®
© 2020 CCC Information Services Inc. All Rights Reserved. The information and opinions in this publication are for general information only, are subject to change and are not intended to provide specifi c recommendations for any individual or entity. Although information contained herein has been obtained from sources believed to be reliable, CCC does not guarantee its accuracy and it may be incomplete or condensed. CCC is not liable for any typographical errors, incorrect data and/or any actions taken in reliance on the information and opinions contained in this publication. Note: Where CCC Information Services Inc. is cited as source, the data provided is an aggregation of industry data related to electronic appraisals communicated via CCC’s electronic network or from total loss valuations processed by CCC. Where Auto Injury Solutions (AIS), a CCC Company is cited as a source, the data provided is an aggregation of industry data collected from claims data communicated via Auto Injury Solutions, Inc.’s electronic network.
Facebook.com/cccis
@cccinfoservices
Youtube.com/CCCInfoServices
cccis.com/LinkedIn
25Years
Prep
ared b
y Susanna G
otsch
20
20
CR
AS
H C
OU
RS
E | IT
’S T
IME
®
Prepared by Susanna Gotsch

3© 2020 CCC INFORMATION SERVICES INC. ALL RIGHTS RESERVED.
TO THE 25TH ANNIVERSARY OF CRASH COURSE.
WELCOMEAnniversaries, in my view, are not a measure of time. Anniversaries measure commitment. I’m proud of the 25-year commitment CCC has made to the industry through the publication of Crash Course.
The 2020 IT’S TIME edition provides insights about where we’ve been and about the key drivers shaping our future — AI, ADAS, driverless vehicles, data access, digital consumers, quality repairs, and more. Without question, the data clearly shows we are entering the most exciting time in our history.
I think back 25 years to 1995. Netscape, Windows 95 and Internet Explorer were being introduced, setting the foundation for the future of digital connections and communications. At the same time, CCC was launching a new digital platform to connect our industry in new and exciting ways. A byproduct of this digital transformation was the creation of roughly 10 times more data, providing more granularity and the foundation of deeper insight.
This transformation marked one of several key milestones in our company’s history. At that time, CCC decided to harness the power of, and invest in, data with the explicit purpose of advancing the industry and our customers. We organized around establishing clear practices and procedures to provide trustworthy and actionable information to customers, helping to improve operations and maintain differentiation in ways that had not been possible before.
This effort has been ongoing for 25 years, resulting in three core principles:
• Insights we deliver must be worthy of trust, predictable, and actionable.
• Great care is taken to be as free of confirmation bias as possible.
• Feedback from these insights is used to continuously improve the products and services we deliver to our customers.
Over the years, the depth and breadth of information has expanded, enabling the delivery of sufficiently high-confidence predictions, including driving data, mobile usage patterns, estimatics, parts, demographic data, total loss valuations, estimate audits and reviews, medical, and supply chain. Today, tens of millions of claims are routed based on a predictive view of the likely outcome in real time at first notice of loss and countless repairs are expedited through real-time connections and data flow. The time it takes to make decisions is shrinking.
At the same time, the possibilities of AI are increasing. Over the last five years, we have worked extensively to establish hundreds of models. AI at its core requires a massive amount of information to inform models, and its power can only be unleashed once integrated into real-time processes. Today, after years of investment, AI guides the front-line people who manage claims, conduct repairs, or interact with customers. By reducing time required to manage routine operations, people now have more time to deliver high-touch experiences that exceed customer expectations.
Our theme for Crash Course 2020 is ‘IT’S TIME,’ intended to draw attention to what is today uniquely possible by connecting various parts of the process and applying data-driven insights from upstream and downstream steps. It is also a testament to the people at CCC and our ongoing commitment to serve and connect our customers — insurers, repairers, OEMs, parts providers, fleets, rental companies, and more.
From our team of data scientists to our customer-care teams, to individuals like Susanna Gotsch — who has been at the helm of sharing insights through Crash Course for 25 years — CCC remains steadfast in our commitment to thoughtfully connect the industry and to empower what comes next.
We are proud to move forward with you and deeply appreciate the tremendous trust you place in us.
Githesh Ramamurthy is Chairman & Chief Executive Officer of CCC.

5
CR
ASH
CO
UR
SE 2020
SEC 1: TIME IS MONEY Reconsidering Personal Mobility
SEC 2: TIME TO INVEST Modernizing Repair Capabilities
SEC 3: TIME FOR SERVICE Humanizing the Experience
SEC 4: TIME FOR EFFICIENCY Simplifying the Complex
SEC 5: TIME FOR DATA Informing and Inciting Action
SEC 6: TIME TO PREPARE Embracing the Next Wave of Tech
07
55
97
109
121
155
CONTENTSTABLE OF

7
CR
ASH
CO
UR
SE 2020 | TIME IS M
ON
EYTIME IS
MONEYRECONSIDERING PERSONAL MOBILITY01Talk of the end of the auto industry as we know it continues, even as automakers produce products of unprecedented diversity in terms of body styles, engine propulsion, safety and comfort features.
We no longer talk just about automobiles; it’s all about personal mobility — whether that is by walking, biking, using a scooter, ride-share service, public transportation, or flying car. Change has come to how consumers purchase and use vehicles, and more change is coming.

9
CR
ASH
CO
UR
SE 2020 | TIME IS M
ON
EY
© 2020 CCC INFORMATION SERVICES INC. ALL RIGHTS RESERVED.
U.S. New and Used Vehicle Sales CY1998 to CY2019 (in millions) (FIGURE 1)
SOURCE: WWW.AUTONEWS.COM, COX AUTOMOTIVE, WWW.EDMUNDS.COM.
New Sales Used Sales
CY2000
CY2001
CY2002
CY2003
CY2004
CY2005
CY2006
CY2007
CY2008
CY2009
CY2010
CY2011
CY2012
CY2013
CY2014
CY2015
CY2016
CY2017
CY2018
CY2019
E
CY1999
CY1998
0.00
10.00
20.00
30.00
40.00
50.00
60.00
70.00
Average New Vehicle MSRP and Average Used Vehicle Transaction Price CY2005-CY2019 (FIGURE 2) | SOURCES: NADA DATA AND EDMUND.COM USED VEHICLE MARKET REPORTS 2014, 2018, 2019.
CY2005
CY2006
CY2007
CY2008
CY2009
CY2010
CY2011
CY2012
CY2013
CY2014
CY2015
CY2016
CY2017
CY2018
CY2019
E
$0.0
$5.0
$10.0
$15.0
$20.0
$25.0
$30.0
$35.0
$35.0
NADA Average Selling Price of New Vehicles Sold Edmunds.com Avg Used Tranx Price
With more consumers opting for alternative modes of mobility, the auto industry is facing a need to reinvent itself or face shrinking revenues. The cost to own and operate a vehicle, as well as the cost of wasted time, are some of the reasons why consumers are looking for alternatives. And today, more than ever, time is money. Time spent looking for a parking space, driving in bumper-to-bumper traffic, or driving a truck thousands of miles to transport goods is time that could be repurposed in the future. In this section of Crash Course, “Time is Money,” we will explore where we are on this continuum.
U.S. Auto Sales Slow, but Growth in Vehicles in Operation Continues
CY 2019 was the fifth consecutive year that U.S. new vehicle sales surpassed 17 million. Used vehicle sales were also strong, closing out the year with an estimated 40 million units sold (see Figure 1). CY 2019 new sales were down over one percent for the year, coming in at 17.1 million versus 17.3 million in CY 2018, and 17.5 million in CY 2016.1
Most analysts predict slower auto sales in the coming years, as slower job growth and consumer spending, pent-up demand and higher new vehicle prices are forcing consumers to forgo a vehicle purchase or purchase a used vehicle versus new. The growing popularity of larger, more expensive vehicles and new vehicle technology drove up the average new vehicle MSRP to over $35,000 in CY 2019, and many consumers opted for longer loan term lengths to afford a new vehicle.
Higher used-vehicle demand and larger volumes of clean late-model used vehicles also lifted the average used vehicle transaction price (see Figure 2). Through the first nine months of CY 2019, prices on vehicles aged eight years and newer were up 1.7 percent versus the same period in 2018.2 Analysts forecast used vehicle prices for vehicles aged eight years and newer will rise between 1 and 1.5 percent in 2020.3
Fewer passenger vehicle miles driven, as well as better-built vehicles, mean vehicles last longer than ever before; data from IHS Automotive reveals the average age of vehicles on the road in the U.S. was 11.8 years in CY 2019 (see Figure 3).4 The aging vehicle fleet over the last decade was driven largely by the addition of new vehicles that did not displace old vehicles that remain in the fleet despite being driven less (see Figure 4).5 The normal displacement of older cars by newer cars was slowed further during the Great Recession, leading to a larger number of older cars in use today.

11
CR
ASH
CO
UR
SE 2020 | TIME IS M
ON
EY
© 2020 CCC INFORMATION SERVICES INC. ALL RIGHTS RESERVED.
IHS Automotive Passenger Cars and Light Trucks in Operation in the U.S., Annual Growth Rate and Percent Scrappage CY2002-CY2019 (FIGURE 5) | SOURCE: IHS AUTOMOTIVE
CY2003
CY2004
CY2005
CY2006
CY2007
CY2008
CY2009
CY2010
CY2011
CY2012
CY2013
CY2014
CY2015
CY2016
CY20117
CY2018
CY2019
210
220
230
240
250
260
270
280
290
-1.0%
-2.0%
0.0%
1.0%
2.0%
3.0%
4.0%
5.0%
6.0%
7.0%
Perc
ent
Cha
nge
in V
IO a
nd S
crap
page
Per
cent
of V
IO
Tota
l Pas
seng
er C
ar a
nd L
ight
Tru
cks
(GV
W 1-
3 on
ly)
in U
se a
s of
Jan
1 of
CY
(in
mill
ions
)
Total Passenger Car and Light Trucks (GVW 1-3 only) in Use as of Jan 1 of CY (in millions)
Percent increase in vehicles in use from prior year
Scrappage % of Passenger Vehicles in Use Starts of CY
Headwinds for Industry "ACES" in 2020 and Beyond
Looking to CY 2020 and beyond, the auto industry is facing some headwinds. Much uncertainty remains in place regarding tariffs and regulations — and uncertainty about the outcome of the 2020 presidential election certainly doesn’t help. Shifting demographics and consumer expectations require companies to be nimbler than ever, not only in product development, but also in the concepts brought to market and how they are marketed. As vehicles become more expensive but last longer than ever, new vehicle sales will slow, and automakers will explore new revenue streams in order to recreate themselves as personal mobility companies as opposed to simply car companies.
In their efforts to do so, automakers continue to invest huge amounts of money in the four megatrends "ACES" — autonomy, connected car, electrification and shared. Growing acceptance of just how hard it is to develop a fully autonomous vehicle and the economic feasibility of operating a shared vehicle fleet have resulted in many automakers increasing their focus on electrification and connected car.
With auto sales trending about 17 million annually, the overall vehicle fleet continues to grow at about 2 percent annually (see Figure 5). As overall vehicle quality improved, vehicle scrappage rates remained low, leading to a slow turnover of the overall U.S. vehicle fleet and older fleet. Growth in overall vehicles in operation is a key driver of steady growth in the collision repair industry, countering more recent slowdown in auto claim frequency.
IHS Automotive Average Age of Vehicles in Operation in the U.S. CY2002-CY2019 (FIGURE 3 ) | SOURCE: IHS AUTOMOTIVE
CY2005
CY2006
CY2007
CY2008
CY2009
CY2010
CY2011
CY2012
CY2013
CY2014
CY2015
CY2016
CY2017
CY2018
CY2019
E
CY2017
CY2018
CY2019
E0.00
2.00
4.00
6.00
8.00
10.00
12.00
14.00
Average Age Car Average Age Light Truck Average Age Total
Average Annual VMT for 1-Year-Old, 10-Year-Old, and 20-Year-Old Vehicles in CY2017 (FIGURE 4) | SOURCE: SAFE ANALYSIS BASED ON DATA FROM 2017 NHTS. HTTP://ENERGYFUSE.ORG/ARE-AMERICANS-DRIVING-OLDER-CARS-
OR-JUST-LEAVING-THEM-IN-THE-DRIVEWAY/
1-Year Old 10-Year Old 20-Year Old
14,000
12,000
8,000

13
CR
ASH
CO
UR
SE 2020 | TIME IS M
ON
EY
© 2020 CCC INFORMATION SERVICES INC. ALL RIGHTS RESERVED.
(FIGURE 6) | SOURCE: WWW.WSJ.COM
0.8%
1.4%
2.8%
EU
U.S.
China
Connected Vehicle Counts Grow
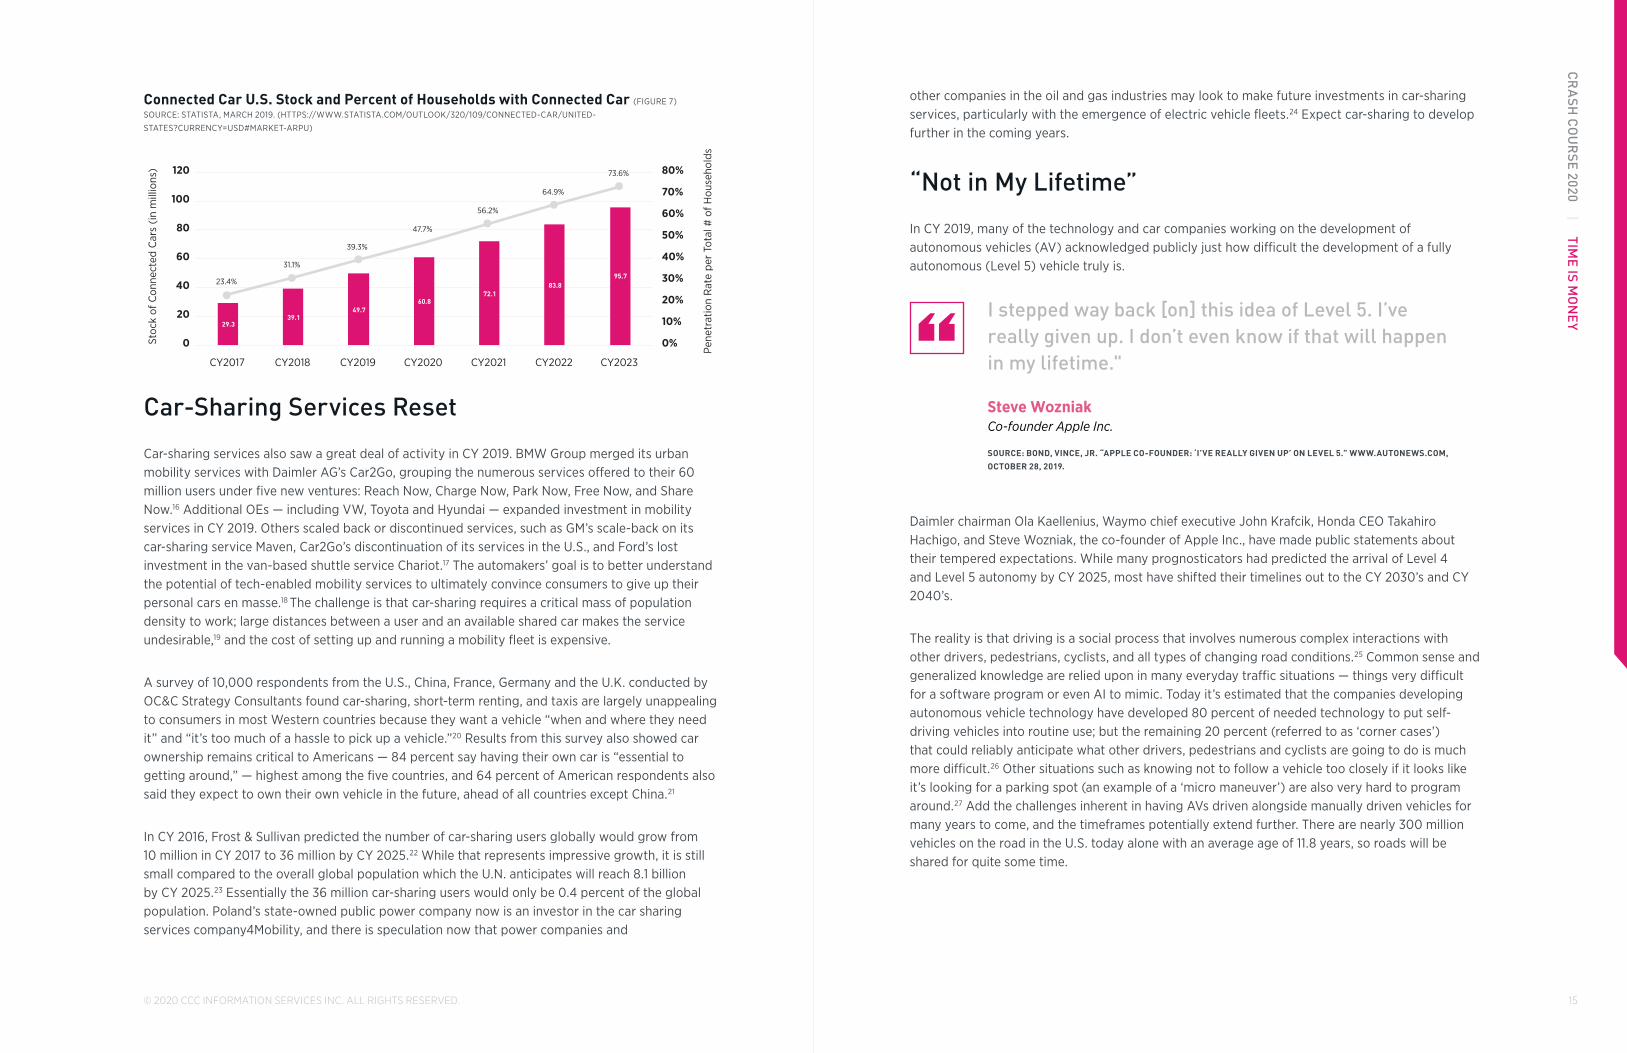
Demand for greater digital capability and wireless connectivity in the vehicle itself has led many automakers to introduce connected vehicle technology into their fleets. Through vehicle connectivity, or telematics, vehicle performance data is shared over the air to assess vehicle health; navigation and driving data can be used to assess vehicle acceleration, braking patterns, location and route history; data is shared for vehicle-to-vehicle and vehicle-to-infrastructure communication; emergency alerts can be generated in the case of an accident or emergency; and numerous services are streamed directly into the vehicle.13 Ford uses connected vehicle technology to help identify a vehicle’s features that passengers do not interact with, and subsequently removes those features in later models to help improve overall vehicle affordability.14 Telematics can be either a factory/OEM embedded system, a consumer electronics device such as a smartphone, an aftermarket telematics control unit (dongle that plugs into the on-board diagnostics port), or a hybrid device that includes an embedded telematics control unit and a consumer electronics device.15 Today, connectivity via a smartphone accounts for approximately 50 percent of the market, but embedded systems are rapidly being brought to market. According to March CY 2019 data from Statista, there were 49.7 million connected cars with embedded systems in the U.S. in CY 2019, up from 29.3 million in CY 2017 (see Figure 7).
Automakers face greater uncertainty now than they have in more than 100 years.
This is an industry that has seen a lot. A couple of world wars. The Great Depression. The Great Recession. Labor strife. Oil embargoes. But now it faces technological changes that threaten to obsolete all the infrastructure and intellectual property they’ve invested in."
John McElroy
SOURCE: “WE ARE EMBARKING ON A DANGEROUS DECADE.” WWW.WARDSAUTO.COM , JAN 2, 2020.
“
Electric Vehicles Charge Ahead
Demand for electric vehicles is driven largely by regulations to curb emissions in China and the EU. LMC Automotive projects sales of battery-powered vehicles will quadruple by CY 2025 and account for 4.8 percent of the U.S. auto market versus just 1.3 percent today.6 And while electric vehicle sales have grown, they still represent a small percent of sales (see Figure 6). It wasn’t until mid-2018 that the U.S. market achieved the 1 million EV-mark, where each sale included at least $7,500 in tax incentives.7 The cost of electric vehicles remains a challenge for automakers: Battery costs remain high, and the build-out of a widespread charging infrastructure must occur. A recent report from the MIT Energy Initiative warned that electric vehicles’ reliance on lithium-ion batteries might prevent them from ever achieving the same sticker price as conventional gasoline-powered vehicles. While the cost of lithium-ion batteries has declined steadily, that decline is expected to slow over the next several years as they approach limits set by the cost of the raw materials.8 With battery costs accounting for about one-third of their total cost, an electric vehicle’s sticker price is expected to remain thousands of dollars more than a comparable gas-fueled vehicle — a tough proposition for consumers despite potential for lower lifetime cost of ownership.9 Despite these challenges, automakers are forging ahead with new models at various price points. LMC Automotive predicts 110 models available for sale in the U.S. market alone by CY 2025.10 AlixPartners LP projects automakers will spend $225 billion to develop new electric-vehicle models over the next several years.11 Many are creating closer ties with battery companies to lower costs and secure future battery supplies — for example, GM with LG Chem; and Toyota with Panasonic.12
Battery-electric vehicles as a share of region’s CY2018 light vehicle sales volume
15
CR
ASH
CO
UR
SE 2020 | TIME IS M
ON
EY
© 2020 CCC INFORMATION SERVICES INC. ALL RIGHTS RESERVED.
other companies in the oil and gas industries may look to make future investments in car-sharing services, particularly with the emergence of electric vehicle fleets.24 Expect car-sharing to develop further in the coming years.
“Not in My Lifetime”
In CY 2019, many of the technology and car companies working on the development of autonomous vehicles (AV) acknowledged publicly just how difficult the development of a fully autonomous (Level 5) vehicle truly is.
I stepped way back [on] this idea of Level 5. I’ve really given up. I don’t even know if that will happen in my lifetime."
Steve Wozniak Co-founder Apple Inc.
SOURCE: BOND, VINCE, JR. “APPLE CO-FOUNDER: ‘I’VE REALLY GIVEN UP’ ON LEVEL 5.” WWW.AUTONEWS.COM,
OCTOBER 28, 2019.
“
Daimler chairman Ola Kaellenius, Waymo chief executive John Krafcik, Honda CEO Takahiro Hachigo, and Steve Wozniak, the co-founder of Apple Inc., have made public statements about their tempered expectations. While many prognosticators had predicted the arrival of Level 4 and Level 5 autonomy by CY 2025, most have shifted their timelines out to the CY 2030’s and CY 2040’s.
The reality is that driving is a social process that involves numerous complex interactions with other drivers, pedestrians, cyclists, and all types of changing road conditions.25 Common sense and generalized knowledge are relied upon in many everyday traffic situations — things very difficult for a software program or even AI to mimic. Today it’s estimated that the companies developing autonomous vehicle technology have developed 80 percent of needed technology to put self-driving vehicles into routine use; but the remaining 20 percent (referred to as ‘corner cases’) that could reliably anticipate what other drivers, pedestrians and cyclists are going to do is much more difficult.26 Other situations such as knowing not to follow a vehicle too closely if it looks like it’s looking for a parking spot (an example of a ‘micro maneuver’) are also very hard to program around.27 Add the challenges inherent in having AVs driven alongside manually driven vehicles for many years to come, and the timeframes potentially extend further. There are nearly 300 million vehicles on the road in the U.S. today alone with an average age of 11.8 years, so roads will be shared for quite some time.
Connected Car U.S. Stock and Percent of Households with Connected Car (FIGURE 7)
SOURCE: STATISTA, MARCH 2019. (HTTPS://WWW.STATISTA.COM/OUTLOOK/320/109/CONNECTED-CAR/UNITED-
STATES?CURRENCY=USD#MARKET-ARPU)
29.339.1
49.760.8
72.183.8
95.723.4%
31.1%
39.3%
47.7%
56.2%
64.9%
73.6%
CY2017 CY2018 CY2019 CY2020 CY2021 CY2022 CY2023
Pene
trat
ion
Rat
e pe
r To
tal #
of H
ouse
hold
s
Stoc
k of
Con
nect
ed C
ars
(in
mill
ions
)
10%
0%
20%
30%
40%
50%
60%
70%
80%
20
0
40
60
80
100
120
Car-Sharing Services Reset
Car-sharing services also saw a great deal of activity in CY 2019. BMW Group merged its urban mobility services with Daimler AG’s Car2Go, grouping the numerous services offered to their 60 million users under five new ventures: Reach Now, Charge Now, Park Now, Free Now, and Share Now.16 Additional OEs — including VW, Toyota and Hyundai — expanded investment in mobility services in CY 2019. Others scaled back or discontinued services, such as GM’s scale-back on its car-sharing service Maven, Car2Go’s discontinuation of its services in the U.S., and Ford’s lost investment in the van-based shuttle service Chariot.17 The automakers’ goal is to better understand the potential of tech-enabled mobility services to ultimately convince consumers to give up their personal cars en masse.18 The challenge is that car-sharing requires a critical mass of population density to work; large distances between a user and an available shared car makes the service undesirable,19 and the cost of setting up and running a mobility fleet is expensive.
A survey of 10,000 respondents from the U.S., China, France, Germany and the U.K. conducted by OC&C Strategy Consultants found car-sharing, short-term renting, and taxis are largely unappealing to consumers in most Western countries because they want a vehicle “when and where they need it” and “it’s too much of a hassle to pick up a vehicle.”20 Results from this survey also showed car ownership remains critical to Americans — 84 percent say having their own car is “essential to getting around,” — highest among the five countries, and 64 percent of American respondents also said they expect to own their own vehicle in the future, ahead of all countries except China.21
In CY 2016, Frost & Sullivan predicted the number of car-sharing users globally would grow from 10 million in CY 2017 to 36 million by CY 2025.22 While that represents impressive growth, it is still small compared to the overall global population which the U.N. anticipates will reach 8.1 billion by CY 2025.23 Essentially the 36 million car-sharing users would only be 0.4 percent of the global population. Poland’s state-owned public power company now is an investor in the car sharing services company4Mobility, and there is speculation now that power companies and
17
CR
ASH
CO
UR
SE 2020 | TIME IS M
ON
EY
© 2020 CCC INFORMATION SERVICES INC. ALL RIGHTS RESERVED.
Yet more money and effort continue to be invested in AVs. More companies announced partnerships around autonomous vehicle development, in part to offset the billions of dollars being spent on AV research and development, but also to pool resources: VW and Ford invested jointly in Argo AI; Honda invested in Cruise, GM’s autonomous vehicle operations; Mercedes and BMW agreed to work together; FCA and JLR are working with Waymo; and Toyota and Volvo are working with Uber.34 Autonomous logistics focus on the ‘last-mile’ has seen increased investment, with FedEx, Ford and Domino’s, Kroger and others looking to solve the challenge of delivering goods at the last mile, which is estimated to be nearly a third of an item’s total delivery cost.35
While the timeline has been pushed out, the advances being made in sensor, camera, lidar, radar, AI, software, infrared cameras and sensors, cybersecurity and other technologies continue, suggesting AVs are inevitable — it’s just a question of when.
And while fully autonomous vehicles are presented as the best way to get to zero road fatalities and accidents, they’re unlikely to be the only way to get us there. Research from the Casualty Actuarial Society of the National Motor Vehicle Crash Causation Survey concluded that driverless vehicles would potentially address only 78 percent (not 93 percent) of accidents if they could not overcome weather, vehicle errors and inoperable traffic control devices.36 So far, the best ADAS system developed for hail is the garage.
Despite New Mobility Alternatives People Still Drive
Among the numerous indicators that prognosticators pointed to when arguing that the era of personal vehicle ownership was coming to an end was a decline in the share of individuals getting their license, buying a vehicle, and a decline in overall miles driven. All of these declines did happen, but the reasons why may be more nuanced than originally thought.
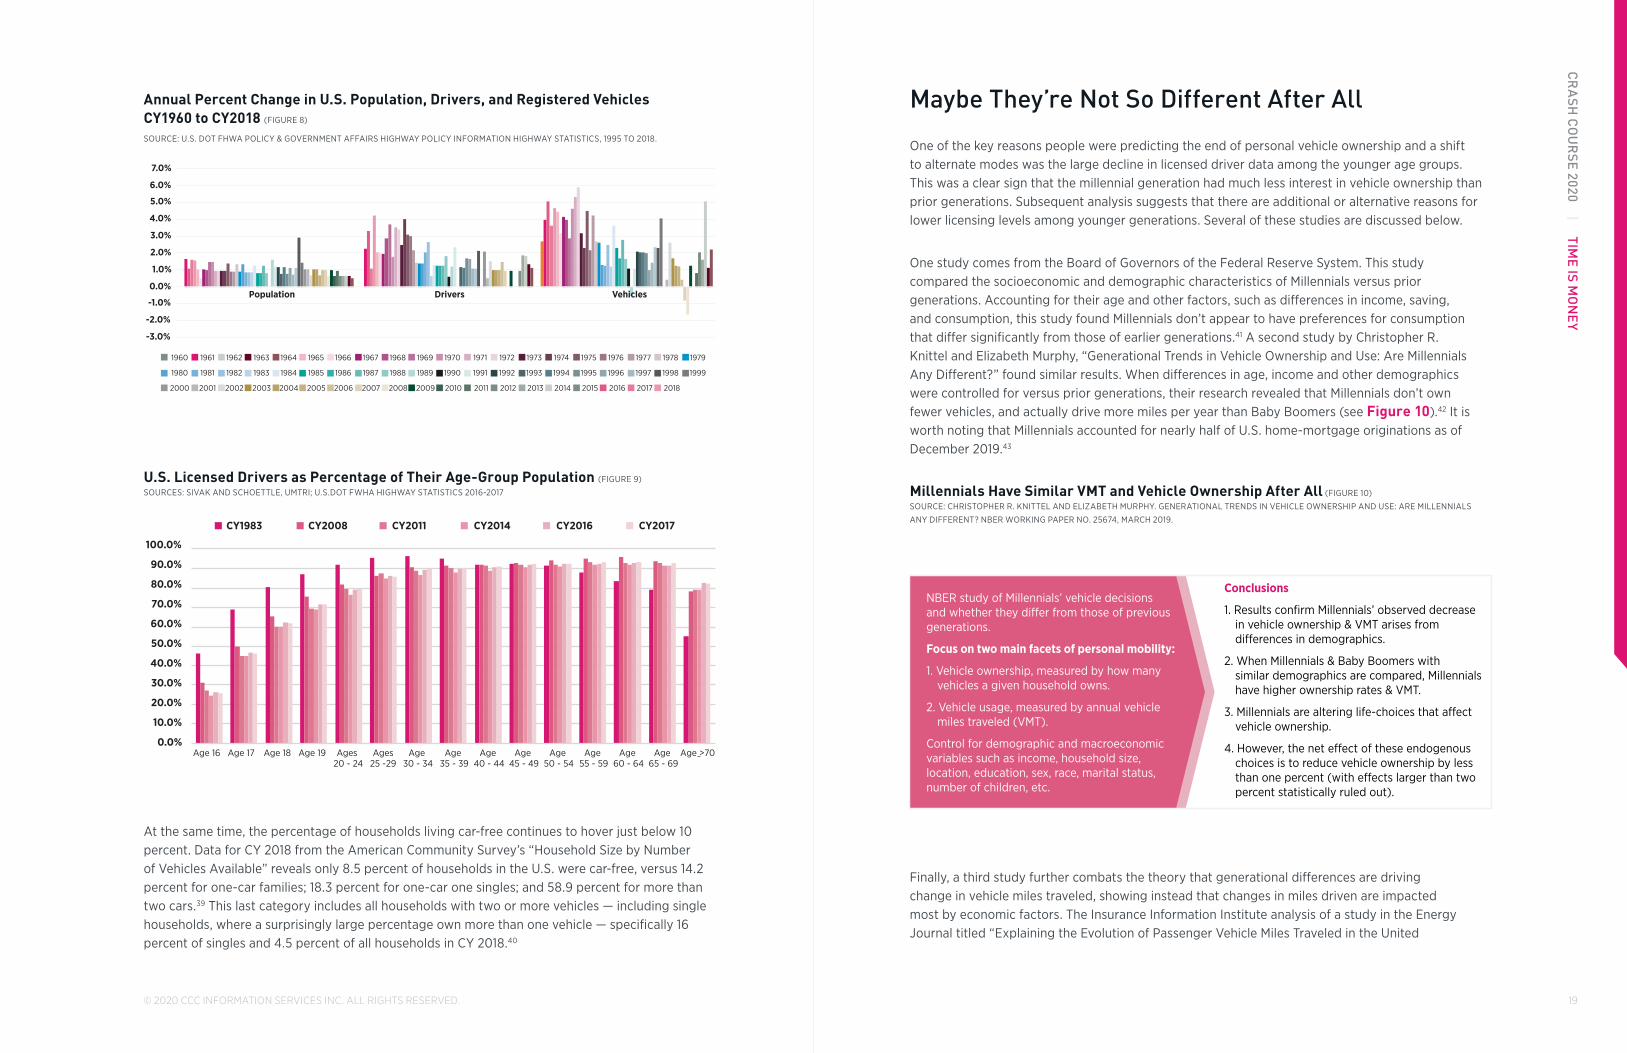
Licensed drivers as a percent of the total population fell during the Great Recession and several years after, but the two latest years of data suggest a reversal of that trend. Data from the U.S. DOT Federal Highway Administrations’ 2017 Highway Statistics reveals growth in drivers and vehicles has outpaced growth in population since CY 2015 (see Figure 8).37 The ratio of drivers to population as of CY 2017 was 69 percent up from the recent low of 66.9 percent in CY 2013. And while there was an increase in the percent of licensed drivers to overall population for all age groups between CY 2014 and CY 2016, in the next two years drivers ages 16-18 and those ages 25-29 experienced a slight decline of less than 1 percentage point. Drivers ages 65-69, 55-59, 30-34, and 60-64 saw the largest increases (see Figure 9). Recent research from the auto analyst firm Benchmark reveals millennials are getting licensed to drive at the highest rate in 40 years and predicts licensed drivers will grow another 12.5 million in the U.S. over the next five years.38
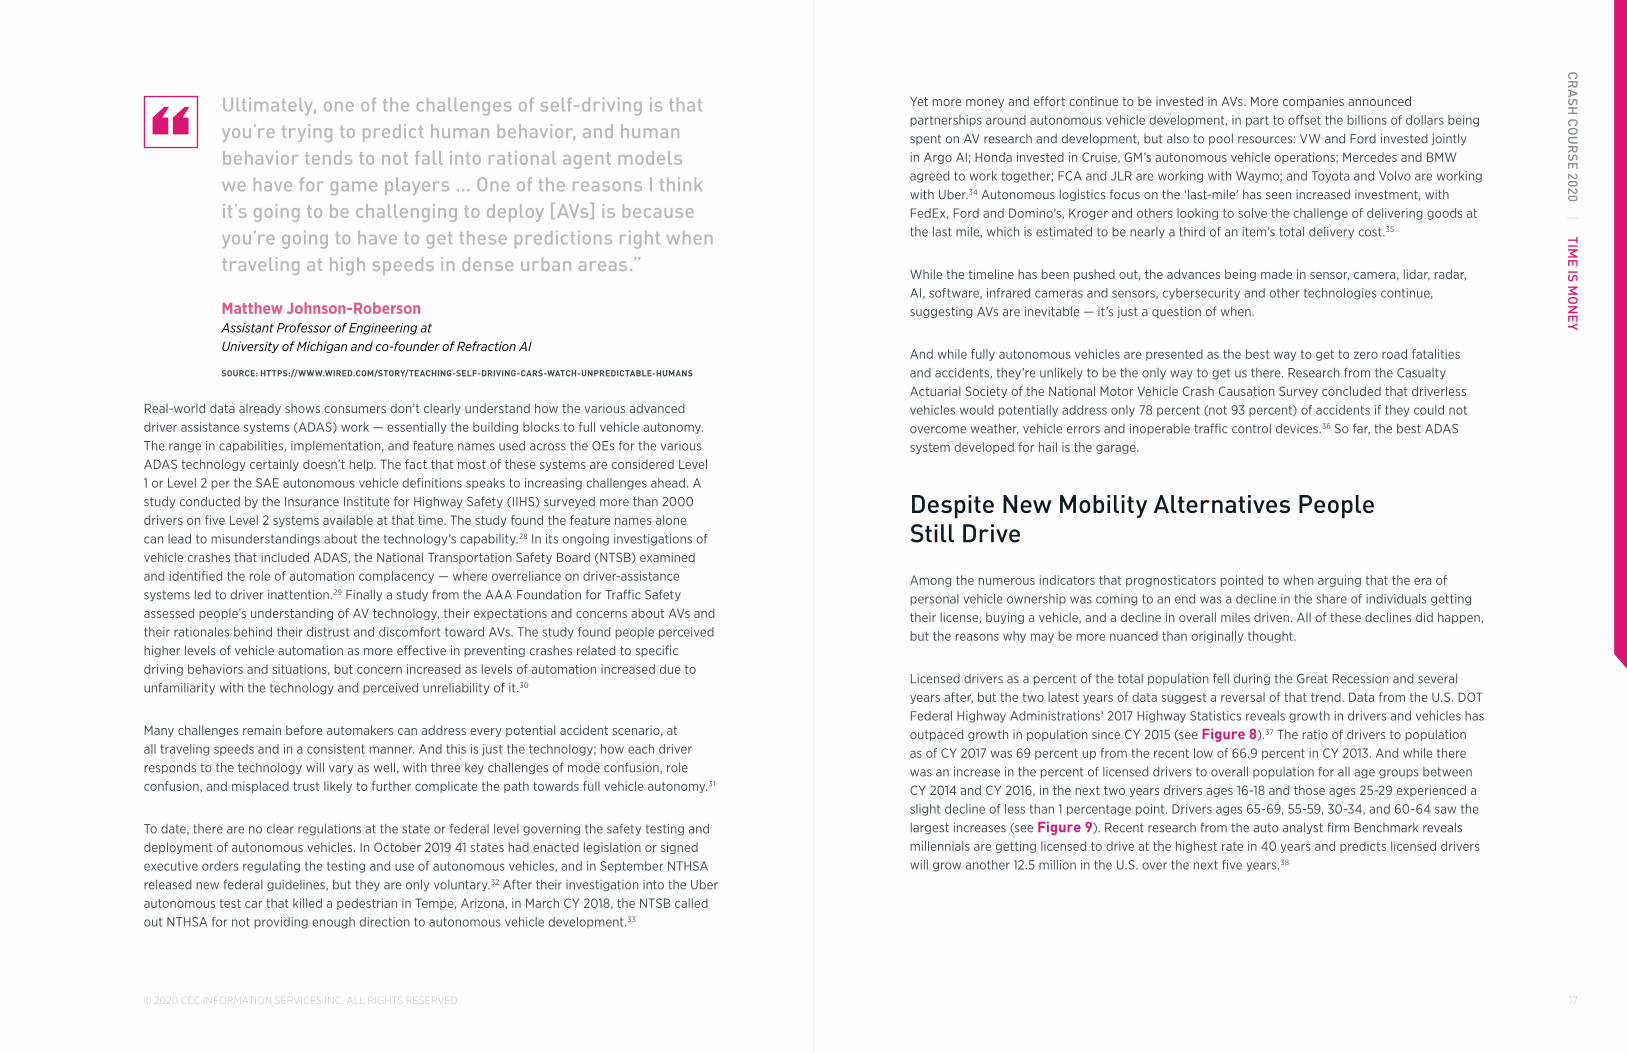
Ultimately, one of the challenges of self-driving is that you’re trying to predict human behavior, and human behavior tends to not fall into rational agent models we have for game players … One of the reasons I think it’s going to be challenging to deploy [AVs] is because you’re going to have to get these predictions right when traveling at high speeds in dense urban areas.”
Matthew Johnson-Roberson Assistant Professor of Engineering at University of Michigan and co-founder of Refraction AI
SOURCE: HTTPS://WWW.WIRED.COM/STORY/TEACHING-SELF-DRIVING-CARS-WATCH-UNPREDICTABLE-HUMANS
“
Real-world data already shows consumers don’t clearly understand how the various advanced driver assistance systems (ADAS) work — essentially the building blocks to full vehicle autonomy. The range in capabilities, implementation, and feature names used across the OEs for the various ADAS technology certainly doesn’t help. The fact that most of these systems are considered Level 1 or Level 2 per the SAE autonomous vehicle definitions speaks to increasing challenges ahead. A study conducted by the Insurance Institute for Highway Safety (IIHS) surveyed more than 2000 drivers on five Level 2 systems available at that time. The study found the feature names alone can lead to misunderstandings about the technology’s capability.28 In its ongoing investigations of vehicle crashes that included ADAS, the National Transportation Safety Board (NTSB) examined and identified the role of automation complacency — where overreliance on driver-assistance systems led to driver inattention.29 Finally a study from the AAA Foundation for Traffic Safety assessed people’s understanding of AV technology, their expectations and concerns about AVs and their rationales behind their distrust and discomfort toward AVs. The study found people perceived higher levels of vehicle automation as more effective in preventing crashes related to specific driving behaviors and situations, but concern increased as levels of automation increased due to unfamiliarity with the technology and perceived unreliability of it.30
Many challenges remain before automakers can address every potential accident scenario, at all traveling speeds and in a consistent manner. And this is just the technology; how each driver responds to the technology will vary as well, with three key challenges of mode confusion, role confusion, and misplaced trust likely to further complicate the path towards full vehicle autonomy.31
To date, there are no clear regulations at the state or federal level governing the safety testing and deployment of autonomous vehicles. In October 2019 41 states had enacted legislation or signed executive orders regulating the testing and use of autonomous vehicles, and in September NTHSA released new federal guidelines, but they are only voluntary.32 After their investigation into the Uber autonomous test car that killed a pedestrian in Tempe, Arizona, in March CY 2018, the NTSB called out NTHSA for not providing enough direction to autonomous vehicle development.33
19
CR
ASH
CO
UR
SE 2020 | TIME IS M
ON
EY
© 2020 CCC INFORMATION SERVICES INC. ALL RIGHTS RESERVED.
Maybe They’re Not So Different After All
One of the key reasons people were predicting the end of personal vehicle ownership and a shift to alternate modes was the large decline in licensed driver data among the younger age groups. This was a clear sign that the millennial generation had much less interest in vehicle ownership than prior generations. Subsequent analysis suggests that there are additional or alternative reasons for lower licensing levels among younger generations. Several of these studies are discussed below.
One study comes from the Board of Governors of the Federal Reserve System. This study compared the socioeconomic and demographic characteristics of Millennials versus prior generations. Accounting for their age and other factors, such as differences in income, saving, and consumption, this study found Millennials don’t appear to have preferences for consumption that differ significantly from those of earlier generations.41 A second study by Christopher R. Knittel and Elizabeth Murphy, “Generational Trends in Vehicle Ownership and Use: Are Millennials Any Different?” found similar results. When differences in age, income and other demographics were controlled for versus prior generations, their research revealed that Millennials don’t own fewer vehicles, and actually drive more miles per year than Baby Boomers (see Figure 10).42 It is worth noting that Millennials accounted for nearly half of U.S. home-mortgage originations as of December 2019.43
Millennials Have Similar VMT and Vehicle Ownership After All (FIGURE 10)
SOURCE: CHRISTOPHER R. KNITTEL AND ELIZABETH MURPHY. GENERATIONAL TRENDS IN VEHICLE OWNERSHIP AND USE: ARE MILLENNIALS
ANY DIFFERENT? NBER WORKING PAPER NO. 25674, MARCH 2019.
NBER study of Millennials’ vehicle decisions and whether they di�er from those of previous generations.
Focus on two main facets of personal mobility:
1. Vehicle ownership, measured by how many vehicles a given household owns.
2. Vehicle usage, measured by annual vehicle miles traveled (VMT).
Control for demographic and macroeconomic variables such as income, household size, location, education, sex, race, marital status, number of children, etc.
Conclusions
1. Results confirm Millennials’ observed decrease in vehicle ownership & VMT arises from di�erences in demographics.
2. When Millennials & Baby Boomers with similar demographics are compared, Millennials have higher ownership rates & VMT.
3. Millennials are altering life-choices that a�ect vehicle ownership.
4. However, the net e�ect of these endogenous choices is to reduce vehicle ownership by less than one percent (with e�ects larger than two percent statistically ruled out).
Finally, a third study further combats the theory that generational differences are driving change in vehicle miles traveled, showing instead that changes in miles driven are impacted most by economic factors. The Insurance Information Institute analysis of a study in the Energy Journal titled “Explaining the Evolution of Passenger Vehicle Miles Traveled in the United
Annual Percent Change in U.S. Population, Drivers, and Registered Vehicles CY1960 to CY2018 (FIGURE 8)
SOURCE: U.S. DOT FHWA POLICY & GOVERNMENT AFFAIRS HIGHWAY POLICY INFORMATION HIGHWAY STATISTICS, 1995 TO 2018.
-3.0%
-2.0%
-1.0%
0.0%
1.0%
2.0%
3.0%
4.0%
5.0%
6.0%
7.0%
Population Drivers Vehicles
1960 1961 1962 1963 1964 1965 1966 1967 1968 1969 1970 1971 1972 1973 1974 1975 1976 1977 1978 1979
1980 1981 1982 1983 1984 1985 1986 1987 1988 1989 1990 1991 1992 1993 1994 1995 1996 1997 1998 1999
2000 2001 2002 2003 2004 2005 2006 2007 2008 2009 2010 2011 2012 2013 2014 2015 2016 2017 2018
U.S. Licensed Drivers as Percentage of Their Age-Group Population (FIGURE 9) SOURCES: SIVAK AND SCHOETTLE, UMTRI; U.S.DOT FWHA HIGHWAY STATISTICS 2016-2017
Age 16 Age 17 Age 18 Age 19 Ages 20 - 24
Ages25 -29
Age 30 - 34
Age 35 - 39
Age 40 - 44
Age 45 - 49
Age 50 - 54
Age 55 - 59
Age 60 - 64
Age 65 - 69
Age >70
CY1983 CY2008 CY2011 CY2014 CY2016 CY2017
0.0%
10.0%
20.0%
30.0%
40.0%
50.0%
60.0%
70.0%
80.0%
90.0%
100.0%
At the same time, the percentage of households living car-free continues to hover just below 10 percent. Data for CY 2018 from the American Community Survey’s “Household Size by Number of Vehicles Available” reveals only 8.5 percent of households in the U.S. were car-free, versus 14.2 percent for one-car families; 18.3 percent for one-car one singles; and 58.9 percent for more than two cars.39 This last category includes all households with two or more vehicles — including single households, where a surprisingly large percentage own more than one vehicle — specifically 16 percent of singles and 4.5 percent of all households in CY 2018.40

21
CR
ASH
CO
UR
SE 2020 | TIME IS M
ON
EY
© 2020 CCC INFORMATION SERVICES INC. ALL RIGHTS RESERVED.
Percent Change in Miles Driven CY2019 through November versus Same Period Prior Year by State (FIGURE 12) SOURCE: USDOT OHPI FHWA
>-1%
-1% to -0.5%
-0.4% to 0%
-0.1% to 0.9%
1% to 2%
2% to 4%
Projected Growth: Census 2010-Census 2020 (FIGURE 13)
SOURCE: WILLIAM H FREY ANALYSIS OF CENSUS BUREAU POPULATION ESTIMATES, RELEASED DEC 30, 2019 | NOTE: APRIL 1 2020 POPULATION
IS CALCUATED BY ASSUMING THAT THE GROWTH RATE FROM JULY 1, 2018 TO JULY 1, 2019, REPORTED IN CENSUS ESTIMATES, CONTINUES
THROUGH APRIL 1, 2020
AK, 2.6%
AL, 2.8%AR, 3.7%AZ, 15.3%
CA, 6.2% CO, 15.5%
FL,...
GA, 10.4%
IA, 3.7%
ID, 15.7%
IL, -1.5%IN, 4.3%
KS, 2.2%KY, 3.1%
LA, 2.4%
ME,...
MI, 1.1%
MN, 6.8%
MO, 2.7%
MS, 0.2%
MT, 8.6%
NC, 10.8%
ND, 13.7%
NE, 6.3%
N..
NM, 2.0%
NV, 15.5%
NY, 0.1%
OH, 1.4%
OK, 5.8%
OR, 10.8%
PA, 0.8%
SC, 12.4%
SD, 9.2%
TN, 8.3%
TX, 16.4%
UT, 17.4%
VA, 7.0%
V..
WA, 14.3%
WI, 2.6%
WV,...
WY, 2.8%
-3.8%
17.8%
% Change
States” highlighted the study’s conclusion that it was changes in demographics and economic characteristics, rather than changes in household driving habits that largely explain changes in VMT [vehicle miles traveled] between CY 1995 and CY 2015.44 The study also predicts the average annual VMT growth rate from CY 2015 to CY 2025 would be 0.9 percent, based on the opposing factors of rising income (which increases VMT) and aging population (which decreases VMT).
Overall miles driven in the U.S. continued to grow in CY 2019. For the rolling 12-month period ending October CY 2019, miles driven are up 1.0 percent versus the prior period, versus only 0.4 percent for full year CY 2018 (see Figure 11). Fewer than a third of individual states saw a decline in miles driven between CY 2018 and CY 2019 (see Figure 12), and most of those states saw lower rates of population growth over the last decade (see Figure 13).
Annual Vehicle-Distance Traveled — Moving 12-Month Total on All Roads (Million Miles) and Percent Change from Prior Year Jan ‘91 — Nov ‘19 (FIGURE 11)
SOURCE: FRED® MOVING 12-MONTH TOTAL VEHICLE MILES TRAVELED, WWW.RESEARCH.STLOUISFED.ORG
-3.0%
-2.9%
-1.0%
0.0%
1.0%
2.0%
3.0%
4.0%
5.0%
0
500
1,000
1,500
2,000
2,500
3,000
3,500
Jan-
92
Nov
-92
Sep-
93
Jul-
94
May
-95
Mar
-96
Jan-
97
Nov
-97
Sep-
98
Jul-
99
May
-00
Mar
-01
Jan-
02
Nov
-02
Sep-
03
Jul-
04
May
-05
Mar
-06
Jan-
07
Nov
-07
Sep-
08
Jul-
09
May
-10
Mar
-11
Jan-
12
Nov
-12
Sep-
13
Jul-
14
May
-15
Mar
-16
Jan-
17
Nov
-17
Sep-
18
Jul-
19
%CH
AN
GE
IN M
ILES
DRI
VEN
VS
SAM
EPE
RIO
D P
RIO
R YR
MIL
ES D
RIV
EN, I
N B
ILLI
ON
S
Miles Driven (in billions) %Chg Same Period Prior Yr
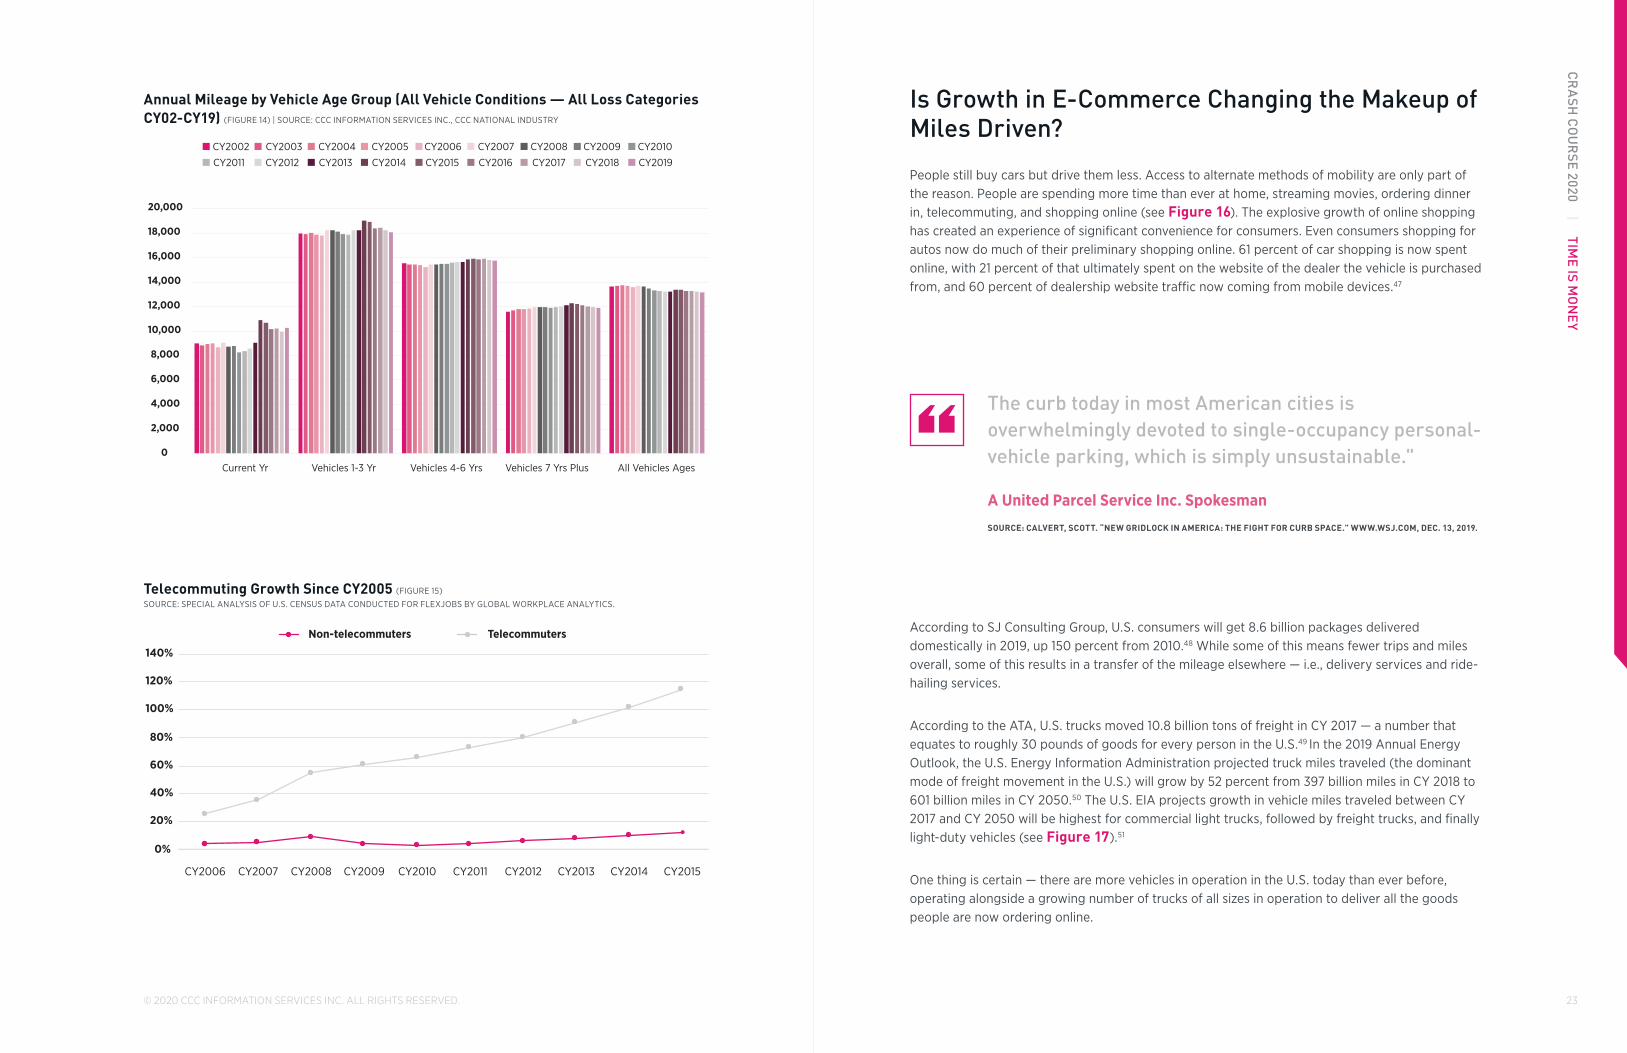
Yet a key proxy for vehicle accident exposure is how many miles an individual vehicle drives per year. Analysis of claims data shows the average annual miles per loss vehicle (as measured by the odometer of the loss vehicle divided by the vehicle age) continues to trend downward, except for the newest model year vehicles, after experiencing a big jump between CY 2013 and CY 2014 (see Figure 14). A higher share of individuals who work at home also is likely a culprit — the number of workers aged 16 years or older whose primary means of transportation to work was ‘worked at home’ grew from 3.6 percent in CY 2005 to 5.1 percent in CY 2017.45 Nearly 4 million U.S. employees worked from home at least half the time in 2015 — roughly 3 percent of the U.S. workforce, and a number that grew 115 percent between CY 2005 and CY 2015, and grew nearly 10 times faster than the rest of the workforce according to a study by Global Workforce Analytics and Flexjobs (see Figure 15).46
23
CR
ASH
CO
UR
SE 2020 | TIME IS M
ON
EY
© 2020 CCC INFORMATION SERVICES INC. ALL RIGHTS RESERVED.
Is Growth in E-Commerce Changing the Makeup of Miles Driven?
People still buy cars but drive them less. Access to alternate methods of mobility are only part of the reason. People are spending more time than ever at home, streaming movies, ordering dinner in, telecommuting, and shopping online (see Figure 16). The explosive growth of online shopping has created an experience of significant convenience for consumers. Even consumers shopping for autos now do much of their preliminary shopping online. 61 percent of car shopping is now spent online, with 21 percent of that ultimately spent on the website of the dealer the vehicle is purchased from, and 60 percent of dealership website traffic now coming from mobile devices.47
The curb today in most American cities is overwhelmingly devoted to single-occupancy personal-vehicle parking, which is simply unsustainable."
A United Parcel Service Inc. SpokesmanSOURCE: CALVERT, SCOTT. “NEW GRIDLOCK IN AMERICA: THE FIGHT FOR CURB SPACE.” WWW.WSJ.COM, DEC. 13, 2019.
“According to SJ Consulting Group, U.S. consumers will get 8.6 billion packages delivered domestically in 2019, up 150 percent from 2010.48 While some of this means fewer trips and miles overall, some of this results in a transfer of the mileage elsewhere — i.e., delivery services and ride-hailing services.
According to the ATA, U.S. trucks moved 10.8 billion tons of freight in CY 2017 — a number that equates to roughly 30 pounds of goods for every person in the U.S.49 In the 2019 Annual Energy Outlook, the U.S. Energy Information Administration projected truck miles traveled (the dominant mode of freight movement in the U.S.) will grow by 52 percent from 397 billion miles in CY 2018 to 601 billion miles in CY 2050.50 The U.S. EIA projects growth in vehicle miles traveled between CY 2017 and CY 2050 will be highest for commercial light trucks, followed by freight trucks, and finally light-duty vehicles (see Figure 17).51
One thing is certain — there are more vehicles in operation in the U.S. today than ever before, operating alongside a growing number of trucks of all sizes in operation to deliver all the goods people are now ordering online.
Annual Mileage by Vehicle Age Group (All Vehicle Conditions — All Loss Categories CY02-CY19) (FIGURE 14) | SOURCE: CCC INFORMATION SERVICES INC., CCC NATIONAL INDUSTRY
0
2,000
4,000
6,000
8,000
10,000
12,000
14,000
16,000
18,000
20,000
Current Yr Vehicles 1-3 Yr Vehicles 4-6 Yrs Vehicles 7 Yrs Plus All Vehicles Ages
CY2002 CY2003 CY2004 CY2005 CY2006 CY2007 CY2008 CY2009 CY2010
CY2011 CY2012 CY2013 CY2014 CY2015 CY2016 CY2017 CY2018 CY2019
Telecommuting Growth Since CY2005 (FIGURE 15) SOURCE: SPECIAL ANALYSIS OF U.S. CENSUS DATA CONDUCTED FOR FLEXJOBS BY GLOBAL WORKPLACE ANALYTICS.
0%
20%
40%
60%
80%
100%
120%
140%
CY2006 CY2007 CY2008 CY2009 CY2010 CY2011 CY2012 CY2013 CY2014 CY2015
Non-telecommuters Telecommuters

25
CR
ASH
CO
UR
SE 2020 | TIME IS M
ON
EY
© 2020 CCC INFORMATION SERVICES INC. ALL RIGHTS RESERVED.
Share of U.S. Cumulative Miles Driven by Road Type CY2004-CY2019 (FIGURE 18)
SOURCE: HTTPS://WWW.FHWA.DOT.GOV/POLICYINFORMATION/TRAVEL_MONITORING/TVT.CFM
37.7%
34.7%
34.4%
34.2%
33.9%
33.6%
33.1%
33.1%
33.1%
33.1%
31.7%
30.5%
30.1%
30.2%
30.1%
30.4%
62.3%
65.3%
65.6%
65.8%
66.1%
66.4%
66.9%
66.9%
66.9%
66.9%
68.3%
69.5%
69.9%
69.8%
69.9%
69.6%
CY2004
CY2005
CY2006
CY2007
CY2008
CY2009
CY2010
CY2011
CY2012
CY2013
CY2014
CY2015
CY2016
CY2017
CY2018
CY2019
Total Rural Total Urban
Percent Change in Miles Driven per Road Type Versus Prior Year CY2004-CY2019 (FIGURE 19) | SOURCE: HTTPS://WWW.FHWA.DOT.GOV/POLICYINFORMATION/TRAVEL_MONITORING/TVT.CFM
-0.08
-0.06
-0.04
-0.02
0
0.02
0.04
0.06
0.08
0.1
Rural Interstate Rural OtherArterial
Other Rural Urban Interstate Urban OtherArterial
Other Urban All Systems
CY2004 CY2005 CY2006 CY2007 CY2008 CY2009 CY2010 CY2011
CY2012 CY2013 CY2014 CY2015 CY2016 CY2017 CY2018 CY2019
Online Shopping Grows in Popularity (FIGURE 16) SOURCE: “FHWA NTSA BRIEF: CHANGES IN ONLINE SHOPPING TRENDS, 2017 NATIONAL HOUSEHOLD TRAVEL SURVEY.” AUGUST 2018. HTTPS://
NHTS.ORNL.GOV.
2009 NHTS 2017 NHTS
Made at least one online purchase in the last 30 days 43% 55%
Urban respondents 43% 56%
Rural respondents 42% 51%
Average number of online purchases made in last 30 days 3 5
U.S. Vehicle Travel Projections (Reference case) — in billions of vehicle miles traveled (FIGURE 17) SOURCE: U.S. ENERGY INFORMATION ADMINISTRATION ANNUAL ENERGY OUTLOOK 2019 — TRANSPORTATION SECTOR KEY
INDICATORS
0
500
1000
1500
2000
2500
3000
3500
4000
CY20
17CY
2018
CY20
19CY
2020
CY20
21CY
2022
CY20
23CY
2024
CY20
25CY
2026
CY20
27CY
2028
CY20
29CY
2030
CY20
31CY
2032
CY20
33CY
2034
CY20
35CY
2036
CY20
37CY
2038
CY20
39CY
2040
CY20
41CY
2042
CY20
43CY
2044
CY20
45CY
2046
CY20
47CY
2048
CY20
49CY
2050
Light-Duty Vehicles<=8,500 Ibs Commercial Light Trucks Freight Trucks >10,000 Ibs.
Growth (2018-2050) = 0.6%
Growth (2018-2050) = 1.3%
Growth (2018-2050) = 1.4%
Growing Congestion is Costly
Congestion is a major problem in the U.S., especially in urban areas, where share of overall miles driven continues to grow (see Figures 18 and 19). Nearly 90 percent of individuals aged 16 years and older in the U.S. use a private passenger vehicle to get to work. Today the average private car in the U.S. carries only 1.6 people, and 95 percent of the time the car is parked and not being driven at all.52 When it is driven, increased congestion often means driving is a frustrating experience — in CY 2018 nearly every major U.S. city recorded a downtown last-mile travel speed below 20 mph.53

27
CR
ASH
CO
UR
SE 2020 | TIME IS M
ON
EY
© 2020 CCC INFORMATION SERVICES INC. ALL RIGHTS RESERVED.
U.S. Primary Means of Transportation to Work by Selected Characteristics (FIGURE 21)
SOURCE: U.S. CENSUS BUREAU, 2017 AMERICAN COMMUNITY SURVEY 1-YEAR ESTIMATES
CY2005 CY2006 CY2007 CY2008 CY2009 CY2010 CY2011 CY2012 CY2013 CY2014 CY2015 CY2016 CY2017
Car, truck, or van total 87.7% 87.2% 87.0% 86.7% 86.7% 86.8% 86.6% 86.5% 86.3% 86.2% 86.1% 85.9% 85.8%
Car, truck, or van 77.0% 76.5% 76.6% 76.1% 76.6% 77.1% 76.9% 76.8% 77.0% 77.0% 77.0% 76.8% 76.9% - drove alone
Car, truck, or van 10.7% 10.7% 10.4% 10.7% 10.0% 9.7% 9.7% 9.7% 9.4% 9.3% 9.0% 9.0% 8.9%- carpooled
Public transportation 4.7% 4.8% 4.9% 5.0% 5.0% 4.9% 5.0% 5.0% 5.1% 5.2% 5.2% 5.1% 5.0%(excluding taxicab)
Walked 2.5% 2.5% 2.5% 2.5% 2.5% 2.4% 2.4% 2.5% 2.4% 2.4% 2.4% 2.3% 2.3%
Taxicab, motorcycle, 1.6% 1.7% 1.7% 1.8% 1.7% 1.7% 1.7% 1.8% 1.9% 1.8% 1.8% 1.8% 1.8% bicycle, or other means
Worked at home 3.6% 3.8% 3.9% 3.9% 4.1% 4.2% 4.2% 4.2% 4.2% 4.3% 4.5% 5.0% 5.1%
Workers by Commute Time and Vehicles Available, CY2005, CY2009, CY2013, CY2017 (FIGURE 22) SOURCE: AMERICAN COMMUNITY SURVEY TABLE S0802 (HTTPS://FACTFINDER.CENSUS.GOV/FACES/TABLESERVICES/JSF/
PAGES/PRODUCTVIEW.XHTML?PID=ACS_17_1YR_S0802&PRODTYPE=TABLE)
Travel Time to Work CY2005 CY2009 CY2013 CY2017
Less than 10 minutes 14.7% 14.0% 13.1% 12.2%
10 to 14 minutes 14.3% 14.6% 14.0% 13.3%
15 to 19 minutes 15.5% 15.7% 15.5% 15.1%
20 to 24 minutes 14.5% 14.7% 14.8% 14.4%
25 to 29 minutes 6.1% 6.1% 6.3% 6.5%
30 to 34 minutes 13.2% 13.5% 13.6% 13.8%
35 to 44 minutes 6.4% 6.3% 6.6% 7.0%
45 to 59 minutes 7.5% 7.4% 7.8% 8.3%
60 or more minutes 7.9% 7.8% 8.4% 9.3%
Mean travel time 25.1 25.1 25.8 26.9to work (minutes)
Vehicles Available CY2005 CY2009 CY2013 CY2017
No Vehicle Available 4.1% 4.3% 4.5% 4.2%
1 vehicle available 20.9% 21.4% 21.6% 20.3%
2 vehicles available 43.2% 42.1% 41.6% 40.5%
3 or more vehicles available 31.8% 32.2% 32.3% 34.9%
A growing number of hours and dollars for fuel are wasted, with the average commuter in CY 2017 spending an extra 54 hours (more than a week of vacation) traveling, wasting over 21 gallons of fuel — a week’s worth of fuel for the average driver (see Figure 20).54 The American Trucking Research Institute estimates congestion costs for the trucking industry alone are $74.5 billion annually from 1.2 billion lost hours of productivity, a number equivalent to 425,533 truck drivers sitting idle for an entire year.55
National Congestion Measures CY1982-CY2017 (FIGURE 20)
SOURCE: TEXAS A&M TRANSPORTATION INSTITUTE AND ATRI. URBAN MOBILITY REPORT 2019. AUGUST 2019. P. 2
$-
$20
$40
$60
$80
$100
$120
$140
$160
$180
0
10
20
30
40
50
60
CY
1982
CY
1983
CY
1984
CY
1985
CY
1986
CY
1987
CY
1988
CY
1989
CY
1990
CY
1991
CY
1992
CY
1993
CY
1994
CY
1995
CY
1996
CY
1997
CY
1998
CY
1999
CY
200
0C
Y20
01
CY
200
2C
Y20
03
CY
200
4C
Y20
05
CY
200
6C
Y20
07
CY
200
8C
Y20
09
CY
2010
CY
2011
CY
2012
CY
2013
CY
2014
CY
2015
CY
2016
CY
2017
Tota
l Cos
t (B
illio
ns o
f 20
17 D
olla
rs)
Del
ay p
er C
omm
unte
r (H
ours
per
Yr)
Delay per Commuter (Hours per Yr) Total Cost (Billions of 2017 Dollars).
According to data from the U.S. Census Bureau’s American Community Survey, 86 percent of people in the U.S. use a personal vehicle to commute to work each day (see Figure 21), a number that has fluctuated only moderately since CY 2005. The time many spend commuting to work has also grown (see Figures 22 and 23), and among the fifty largest cities in the U.S., fewer than 12 percent of jobs are reachable within 30 minutes (see Figure 24).56 Compare to data showing where population growth is highest, and you can see the congestion is likely to get worse (see Figure 13). The United Nations Department of Economic and Social Affairs estimates that by CY 2050, two of every three people are likely to be living in cities and other urban centers, an additional 2.5 billion people.57
Factor in U.S. Department of Transportation estimates that 58 percent of U.S. roads are in less than good condition and 23 percent of bridges need significant repair or can’t handle today’s traffic,58 and the cost of driving gets even worse.
According to research from the Insurance Information Institute, PCIAA and CAS, collision frequency in the United States is strongly and positively related to various measures of congestion. To distinguish among the variables and find the ones which best predict collision frequency, a random forest was constructed to compare the importance of each variable to the model. Variables with more importance have the best predictive ability. As Figures 25 and 26 illustrate, five variables stand out: Drivers per Lane Mile (Licensed drivers/lane miles total), Urban Average Commute Time, Rural Average Commute Time, Tort System, and Urban VMT.59

29
CR
ASH
CO
UR
SE 2020 | TIME IS M
ON
EY
© 2020 CCC INFORMATION SERVICES INC. ALL RIGHTS RESERVED.
Frequency vs. Driver per Lane Mile (Q4 CY2015) (FIGURE 25) SOURCE: AUTO LOSS COST TREND REPORT, JANUARY 2018. | NOTE: RANKED BY INCNODEPURITY (CHANGE IN PREDICTIONS WHEN A VARIABLE
IS RANDOMLY PERMUTED THROUGH RANDOM DECISION FOREST). *ADJUSTED FOR MILES DRIVEN.
140
120
100
80
60
40
20
-
Driv
ers
per L
ane
Mile
Vehicle per Lane Mile
R2 = 0.7509
On-Level Frequency*
0.00 0.05 0.10 0.15 0.20
Variable Importance to Collision Frequency (FIGURE 26) SOURCE: AUTO LOSS COST TREND REPORT, JANUARY 2018. | NOTE: RANKED BY INCNODEPURITY (CHANGE IN PREDICTIONS WHEN A VARIABLE
IS RANDOMLY PERMUTED THROUGH RANDOM DECISION FOREST). *ADJUSTED FOR MILES DRIVEN.
Drivers/Lane Mile
Urban Avg Commute
Rural Avg Commute
Tort System
% Urban VMT
Rainy Area
% Rural VMT
Lane Miles
Lawyers per Million
Avg Miles/Driver
Rural VMT/Lane
DUI’s
Urban VMT/Lane
PIP
Average Travel Time to Work in the U.S. by Metro Area, CY2017 (FIGURE 23) SOURCE: AMERICAN COMMUNITY SURVEY TABLE S0802 (HTTPS://FACTFINDER.CENSUS.GOV/FACES/TABLESERVICES/JSF/PAGES/
PRODUCTVIEW.XHTML?PID=ACS_17_1YR_S0802&PRODTYPE=TABLE)
32.0 minutes or greater
28.0 to 31.9 minutes
24.0 to 27.9 minutes
20.0 to 23.9 minutes
Less than 20.0 minutes
U.S. Average is 27.1 minutes
Travel Time to Work
Percent of Jobs Reachable by Number of Minutes, CY2016 (FIGURE 24)
SOURCE: ANDREW OWEN, BRENDAN MURPHY, ACCESSABILITY OBSERVATORY, CENTER FOR TRANSPORTATION STUDIES, UNIVERSITY OF
MINNESOTA. DAVID LEVINSON, SCHOOL OF CIVIL ENGINEERING, UNIVERSITY OF SYDNEY. ACCESS ACROSS AMERICA: TRANSIT 2016. CTS 17-07.
Las
Vega
sPh
oeni
xSa
n Jo
seSa
lt La
ke C
ityD
etro
itSa
n A
nton
ioA
tlant
aLo
s A
ngel
esD
alla
sM
inne
apol
isSt
. Lou
isCl
evel
and
San
Die
goO
rland
oH
oust
onD
enve
rM
iam
iR
iver
side
Jack
sonv
ille
Ral
eigh
Port
land
Milw
auke
eA
ustin
Was
hing
ton
Char
lott
eLo
uisv
ille
Indi
anap
olis
Kans
as C
itySa
cram
ento
Cinc
inna
tiCo
lum
bus
Okl
ahom
a Ci
tySe
attle
Chic
ago
Virg
inia
Bea
chTa
mpa
Pitt
sbur
ghB
altim
ore
Bos
ton
Bu�
alo
Nas
hvill
eB
irmin
gham
New
Yor
kH
artf
ord
Phila
delp
hia
San
Fran
cisc
oPr
ovid
ence
Ric
hmon
dN
ew O
rlean
s12.0%
10.0%
8.0%
6.0%
4.0%
2.0%
0.0%

31
CR
ASH
CO
UR
SE 2020 | TIME IS M
ON
EY
© 2020 CCC INFORMATION SERVICES INC. ALL RIGHTS RESERVED.
impact of ride-hailing on urban mobility found 70 percent of Uber and Lyft trips were made in nine large, densely-populated metros: New York City, Boston, Chicago, Los Angeles, Miami, Philadelphia, San Francisco, Seattle, and Washington D.C.62 The data also found private ride TNC services put 2.8 new TNC miles on the road for each individual mile of personal driving removed, resulting in a 180 percent increase in driving on city streets.63 Several other reports released in CY 2019 concluded many consumers are using ride-hailing trips instead of walking or public transportation at peak commute times. In April of CY 2019, the city of Chicago published anonymized trip data from ride-hailing companies in operation in Chicago. This data showed the most common ride-hailing trip made during the two-month period of November and December CY 2018 was a 1.1 mile trip from River North West to the Loop, with 80 percent of them occurring between 7:00 am and 7:59 pm, and 84 percent occurring during weekdays.64 In Seattle, nearly half of all ride-hailing trips originated in four neighborhoods that are some of the city’s most walkable and transit-friendly areas.65 And, a study from the Booth School at the University of Chicago found cities with high adoption of Uber and Lyft had 3 percent more total miles driven daily on average than cities with low adoption, and had higher new vehicle registrations.66
A common theme among most of these studies is that where these services are available, consumers are using them, and using them a lot. They are willing to pay to do so, even when walking or public transport would be a cheaper alternative. In fact, a working paper from the National Bureau of Economic Research found a consumer surplus of about $6.8 billion for all CY 2015 in the U.S. for Uber. This was based on data from nearly 50 million UberX consumer sessions from the first 24 weeks in CY 2015 from Uber’s four biggest markets that showed Uber customers may have been willing to pay more than they actually did (consumer surplus is defined as the difference between the amount consumers are willing and able to pay for a service versus what they actually pay).67
TNCs may also lead to a potential decline in public transit. A CY 2019 study by the University of Kentucky’s Department of Civil Engineering of 22 large U.S. cities revealed that for each year after TNCs enter a market, heavy rail ridership can be expected to decrease by 1.3 percent and bus ridership can be expected to decrease by 1.7 percent.68 Finally, a study from three economists at the University of Louisville and George State University found an increase in self-reported alcohol consumption compared with the year before Uber launches in a city. This study compared data on Uber availability with health surveys from America’s Centers for Disease Control and found on average alcohol consumption rose by 3 percent, binge drinking increased by 8 percent, and heavy drinking surged by 9 percent within a couple of years of a ride-hailing company coming to town.69 The bright side, of course, is at least these people are not driving drunk.
Not surprisingly as lawmakers try to adapt to the changes being brought by ride-hailing services, many are looking to impose new fees and taxes, and re-classify drivers as employees rather than independent contractors. A study by New York University’s Rudin Center for Transportation Policy recently looked at 13 large major markets including London, San Francisco, New York City and others to understand how cities are rewriting the rules for ride-hailing and found a range of responses, including new regulation around provision of trip data, congestion taxes, strict emission standards and restrictions in congestion zones, and driver pay.70
Is Ride-Hailing Adding to Congestion?
Ride-hailing’s share of overall miles driven in the U.S. remains small but has seen significant growth. According to data from the National Household Travel Survey, for-hire vehicle use doubled between CY 2009 and CY 2017, a trend believed to be primarily driven by the advent of ride-hailing.60 The CY 2018 study from Conway, Salon, & King reveals 0.19 percent (±0.04) of person-trips utilized for-hire vehicles in the CY 2009; by CY 2017, that number had increased to 0.50 percent (±0.10).61 NHTS shows total household vehicle trips (or vehicle miles traveled “VMT”) accounted for 60 percent of all person miles traveled (PMT) in CY 2009 but fell to 53 percent by CY 2017 (see Figure 27). Applying for-hire vehicle use person-trip growth to PMT share of VMT in 2009 and 2017 suggests ride-hailing grew from 0.1 percent of all vehicle miles traveled in CY 2009 to 0.3 percent by CY 2017. But while the share of overall miles traveled remains small, the concentration of ride-hailing geographically has resulted in outsized impact elsewhere.
U.S. National Household Travel Survey Person Trips and Household Vehicle Trips CY1969-CY2017 (FIGURE 27)
SOURCE: 2017 NATIONAL HOUSEHOLD TRAVEL SURVEY, P.8 AND P.13, TABLES 1A AND 3B. HTTPS://NHTS.ORNL.GOV/ASSETS/2017_NHTS
SUMMARY_TRAVEL_TRENDS.PDF.
1969 2.02 9.67 775,940 1,404,137
1977 2.92 8.87 907,603 1,879,215
1983 2.89 8.68 1,002,139 1,946,662
1990 (adj) 3.76 9.47 1,695,290 2,829,936
1995 4.3 9.13 2,068,368 3,411,122
2001 4.09 10.04 2,274,769 3,783,979
2009 3.79 9.75 2,245,111 3,732,791
2017 3.37 10.7 2,105,882 3,970,287
2017 (adj) n/a 11.57 2,321,820 4,291,150
NHTS Survey Year
Daily Person Trips per Person
Average Person Trip Length (miles)
Household Vehicle Trips (VMT in millions)
Person Miles of Travel (PMT in millions)
As usage of ride-hailing or transportation network companies (TNCs) — such as Uber and Lyft — have grown, there is growing debate about whether they add to problems of growing congestion in many cities. Numerous studies published in the last several years look at how TNCs have impacted consumer travel behavior. Schaller Consulting published two studies — its second report on the

33
CR
ASH
CO
UR
SE 2020 | TIME IS M
ON
EY
© 2020 CCC INFORMATION SERVICES INC. ALL RIGHTS RESERVED.
Many scooter rental operators struggle to make money due to significant expenses such as depreciation of the e-scooters, the cost to run warehouses that repair and help to position the scooters, and development costs related to the development more durable hardware.72 Lime, the world’s biggest scooter operator had 120,000 scooters on the road globally during the summer of CY 2019, but scooters put on the road in the preceding spring lasted only a median of five months.73 Vandalism is also a problem, thanks perhaps to Instagram sites like Bird Graveyard which celebrate e-scooter stunts and destruction; the growing number of injuries is another major concern.
There are numerous other challenges for e-scooter companies, including regulation and permitting, parking, age requirements, safety equipment requirements, maintenance, and liability when someone is injured.74 Late in CY 2019, the National Conference of Insurance Legislators (NCOIL) met to review a draft of legislation setting insurance requirements for electric scooters. The legislation is modeled after the group’s model for transportation network companies (TNCs) to ensure there is liability insurance coverage in place during any rental period for the scooter company, the rider, and any independent contractors servicing the scooters.75
Trip Data Grows Ever More Valuable
One of the greatest potential benefits of ride-hailing and micro-mobility solutions is the ability to capture trip-level data and use it to understand traffic patterns and infrastructure needs. Uber recently introduced dockless bike and scooter services, added third party services to its app including Lime, and launched new capabilities with the City of Denver to add transit directions and eventually support the ability to buy transit passes through the Uber app. While Uber gets a cut of each ride taken through its app, it also expands the amount of data it now collects on where people are going and how they’re getting there.76
Eventually, highways will have embedded sensors that monitor wear-and-tear and traffic patterns. The state of Colorado is testing this smart road technology. Over the next five years, a half-mile stretch of U.S. Highway 285, southwest of Denver, will be covered with concrete slabs that include Wi-Fi connectivity and embedded fiberoptic cables acting as pressure sensors. The technology will enable connection to motorists’ cellphones to provide real-time alerts about traffic and road hazards.77 Another electric road system project began in November 2019, with the island of Gotland in Sweden installing a proof of concept wireless charging road for trucks/buses in an effort to decarbonize the transport sector.78
As more metro areas struggle with growing congestion, understanding where, when, why and how people are traveling is critical. It is no surprise that automakers are also looking to capitalize on data that is now available with the connected vehicle.
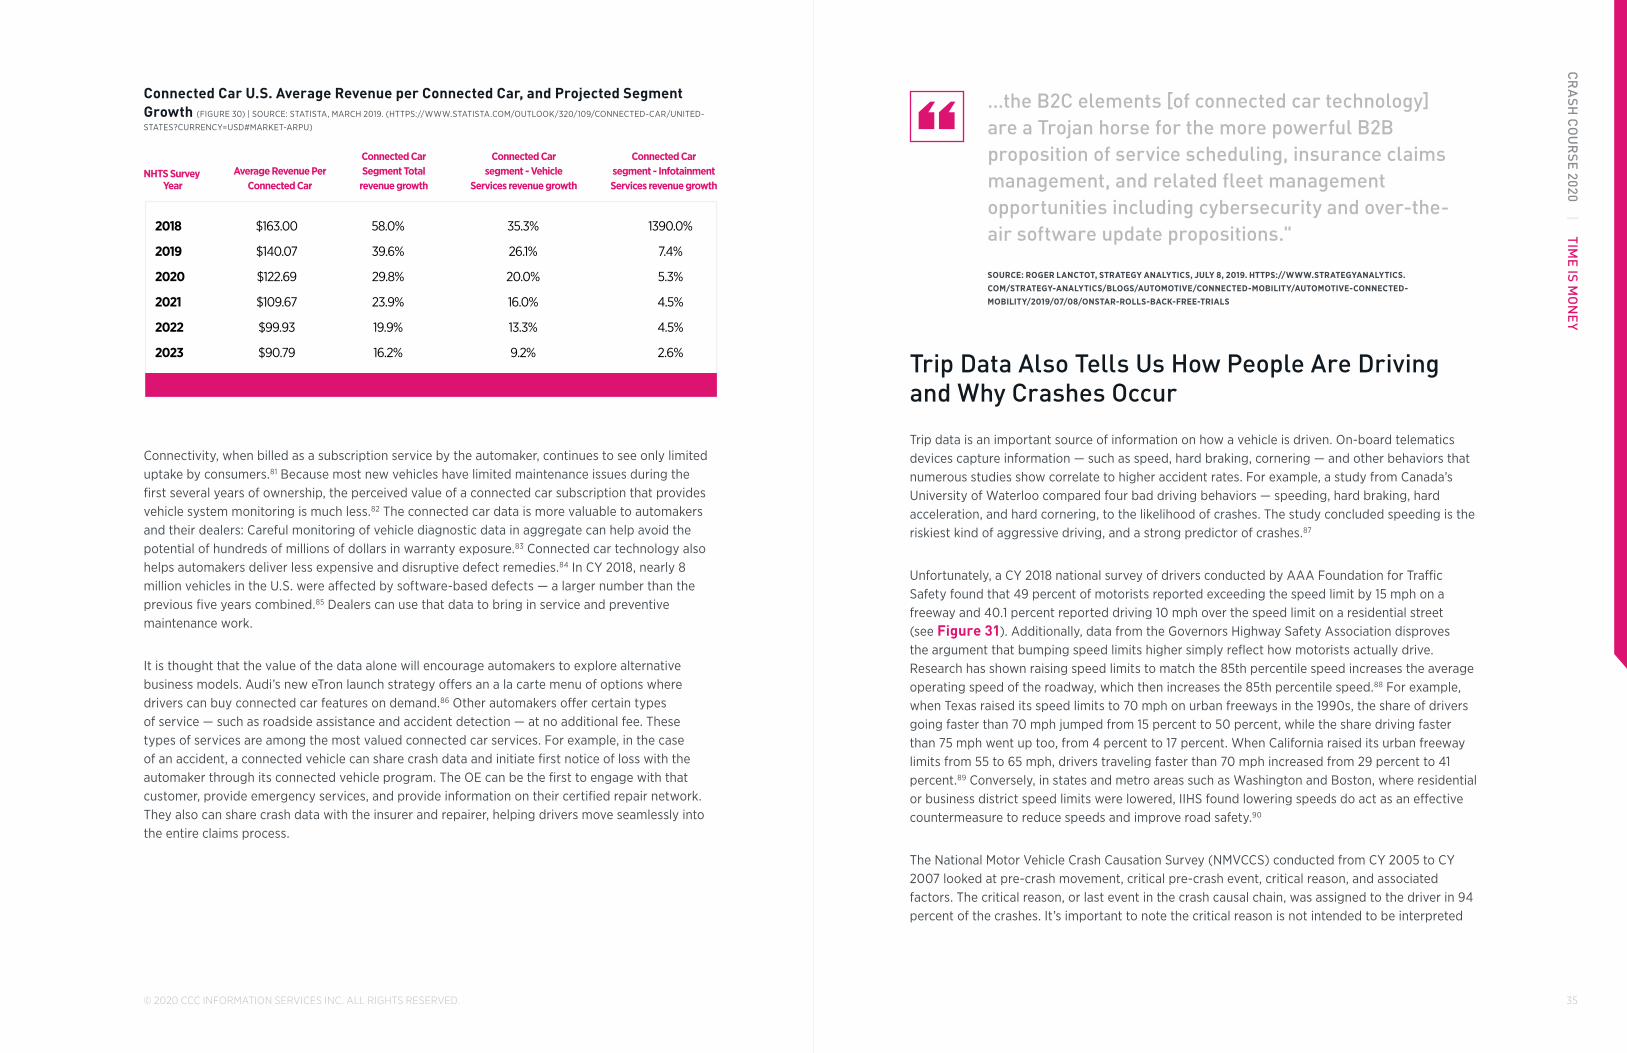
Access to the data sets generated by the numerous electronic control modules throughout the vehicle helps automakers understand how their vehicles are performing. It also gives them new access to how, when and where their customers are driving — creating an opportunity to develop new products and services.79 March CY 2019 data from Statista indicates overall revenue from the connected car segment is expected to grow, but average revenue per connected car has fallen (see Figure 30).80
It is unknown whether cars will remain the transportation mode of choice. As more alternatives come online and become viable, fewer consumers will see vehicle ownership as critical. In their 2018 Evolution of Mobility Study, Cox Automotive found the percent of individuals that felt owning a vehicle was necessary fell with each generation (see Figure 28).
Cox Automotive 2018 Evolution of Mobility Study: “Having Transportation is Necessary, But Owning a Vehicle is Not (% Agree)” (FIGURE 28) SOURCE: HTTPS://WWW.COXAUTOINC.COM, FEBURARY 5, 2019.
Gen Z
Millennials
Gen X
Boomers
55%
45%
34%
28%
Emergence of Micro-Mobility
As cities struggle to manage congestion related to cars, many are forging ahead with the expansion of dedicated bicycle lanes and the introduction of micro-mobility solutions, including shared bikes, e-bikes, and e-scooters. In CY 2018, a total of 84 million trips were taken in the U.S. (45.5 million on shared bikes and 38.5 million on e-scooters), double the number taken in CY 2017.71 These types of solutions are believed to be best suited for a large proportion of trips taken in most metro areas, where nearly half of the trips are less than three miles, based on data collected and analyzed by Inrix of more than 50 million car trips taken during the month of October CY 2018 in the top 25 most congested U.S. metro areas (see Figure 29).
Inrix U.S. Cities by Micromobility Potential — Percent of All Trips by Car Trip Distance (FIGURE 29) | SOURCE: INRIX 2018 GLOBAL TRAFFIC SCORECARD, “MICROMOBILITY POTENTIAL IN THE U.S., UK AND GERMANY” SEPTEMBER 2019.
U.S. City
Ave
rages
Honolulu
New O
rlean
s
Nashv
ille
Chicago
Charlotte
New Yo
rk
Portlan
d
Pittsb
urgh
Los A
ngeles
San Fran
cisco
Boston
Seattl
e
Denve
r
Miami
Tampa
Philadelp
hia
Was
hington
Houston
Dallas
Atlant
a
Austin
Orlando
Phoenix
Baltim
ore
Minneapolis
0%
10%
20%
30%
40%
50%
60%
70%
80%
90%
100%
52% 44% 49% 49% 49% 49% 50% 49% 49% 50% 51% 51% 52% 52% 52% 54% 54% 54% 54% 54% 56% 55% 56% 57% 57% 58%
0-1 Mile 1-2 Miles 2-3 Miles Other
35
CR
ASH
CO
UR
SE 2020 | TIME IS M
ON
EY
© 2020 CCC INFORMATION SERVICES INC. ALL RIGHTS RESERVED.
Connected Car U.S. Average Revenue per Connected Car, and Projected Segment Growth (FIGURE 30) | SOURCE: STATISTA, MARCH 2019. (HTTPS://WWW.STATISTA.COM/OUTLOOK/320/109/CONNECTED-CAR/UNITED-
STATES?CURRENCY=USD#MARKET-ARPU)
2018 $163.00 58.0% 35.3% 1390.0%
2019 $140.07 39.6% 26.1% 7.4%
2020 $122.69 29.8% 20.0% 5.3%
2021 $109.67 23.9% 16.0% 4.5%
2022 $99.93 19.9% 13.3% 4.5%
2023 $90.79 16.2% 9.2% 2.6%
NHTS Survey Year
Average Revenue PerConnected Car
Connected CarSegment Total
revenue growth
Connected Carsegment - Vehicle
Services revenue growth
Connected Carsegment - InfotainmentServices revenue growth
Connectivity, when billed as a subscription service by the automaker, continues to see only limited uptake by consumers.81 Because most new vehicles have limited maintenance issues during the first several years of ownership, the perceived value of a connected car subscription that provides vehicle system monitoring is much less.82 The connected car data is more valuable to automakers and their dealers: Careful monitoring of vehicle diagnostic data in aggregate can help avoid the potential of hundreds of millions of dollars in warranty exposure.83 Connected car technology also helps automakers deliver less expensive and disruptive defect remedies.84 In CY 2018, nearly 8 million vehicles in the U.S. were affected by software-based defects — a larger number than the previous five years combined.85 Dealers can use that data to bring in service and preventive maintenance work.
It is thought that the value of the data alone will encourage automakers to explore alternative business models. Audi’s new eTron launch strategy offers an a la carte menu of options where drivers can buy connected car features on demand.86 Other automakers offer certain types of service — such as roadside assistance and accident detection — at no additional fee. These types of services are among the most valued connected car services. For example, in the case of an accident, a connected vehicle can share crash data and initiate first notice of loss with the automaker through its connected vehicle program. The OE can be the first to engage with that customer, provide emergency services, and provide information on their certified repair network. They also can share crash data with the insurer and repairer, helping drivers move seamlessly into the entire claims process.
…the B2C elements [of connected car technology] are a Trojan horse for the more powerful B2B proposition of service scheduling, insurance claims management, and related fleet management opportunities including cybersecurity and over-the-air software update propositions."
SOURCE: ROGER LANCTOT, STRATEGY ANALYTICS, JULY 8, 2019. HTTPS://WWW.STRATEGYANALYTICS.COM/STRATEGY-ANALYTICS/BLOGS/AUTOMOTIVE/CONNECTED-MOBILITY/AUTOMOTIVE-CONNECTED-MOBILITY/2019/07/08/ONSTAR-ROLLS-BACK-FREE-TRIALS
“
Trip Data Also Tells Us How People Are Driving and Why Crashes Occur
Trip data is an important source of information on how a vehicle is driven. On-board telematics devices capture information — such as speed, hard braking, cornering — and other behaviors that numerous studies show correlate to higher accident rates. For example, a study from Canada’s University of Waterloo compared four bad driving behaviors — speeding, hard braking, hard acceleration, and hard cornering, to the likelihood of crashes. The study concluded speeding is the riskiest kind of aggressive driving, and a strong predictor of crashes.87
Unfortunately, a CY 2018 national survey of drivers conducted by AAA Foundation for Traffic Safety found that 49 percent of motorists reported exceeding the speed limit by 15 mph on a freeway and 40.1 percent reported driving 10 mph over the speed limit on a residential street (see Figure 31). Additionally, data from the Governors Highway Safety Association disproves the argument that bumping speed limits higher simply reflect how motorists actually drive. Research has shown raising speed limits to match the 85th percentile speed increases the average operating speed of the roadway, which then increases the 85th percentile speed.88 For example, when Texas raised its speed limits to 70 mph on urban freeways in the 1990s, the share of drivers going faster than 70 mph jumped from 15 percent to 50 percent, while the share driving faster than 75 mph went up too, from 4 percent to 17 percent. When California raised its urban freeway limits from 55 to 65 mph, drivers traveling faster than 70 mph increased from 29 percent to 41 percent.89 Conversely, in states and metro areas such as Washington and Boston, where residential or business district speed limits were lowered, IIHS found lowering speeds do act as an effective countermeasure to reduce speeds and improve road safety.90
The National Motor Vehicle Crash Causation Survey (NMVCCS) conducted from CY 2005 to CY 2007 looked at pre-crash movement, critical pre-crash event, critical reason, and associated factors. The critical reason, or last event in the crash causal chain, was assigned to the driver in 94 percent of the crashes. It’s important to note the critical reason is not intended to be interpreted
37
CR
ASH
CO
UR
SE 2020 | TIME IS M
ON
EY
© 2020 CCC INFORMATION SERVICES INC. ALL RIGHTS RESERVED.
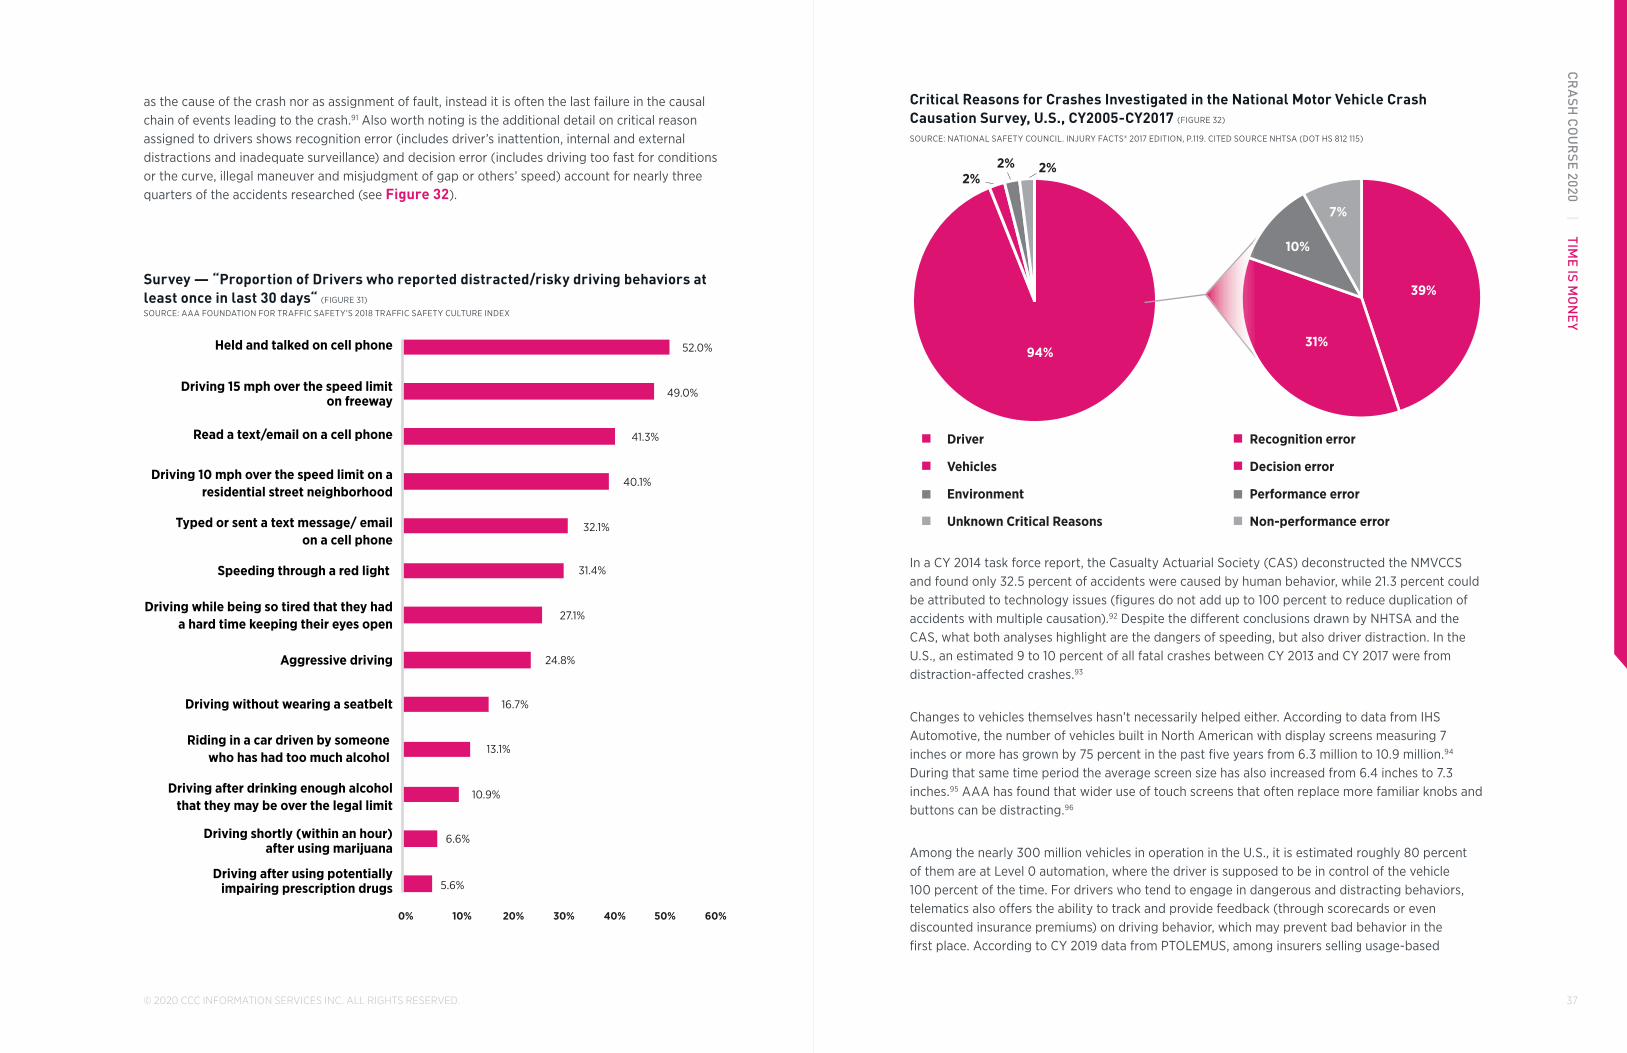
Critical Reasons for Crashes Investigated in the National Motor Vehicle Crash Causation Survey, U.S., CY2005-CY2017 (FIGURE 32)
SOURCE: NATIONAL SAFETY COUNCIL. INJURY FACTS® 2017 EDITION, P.119. CITED SOURCE NHTSA (DOT HS 812 115)
Recognition error
Decision error
Performance error
Non-performance error
94%
2%2% 2%
Driver
Vehicles
Environment
Unknown Critical Reasons
39%
31%
10%
7%
In a CY 2014 task force report, the Casualty Actuarial Society (CAS) deconstructed the NMVCCS and found only 32.5 percent of accidents were caused by human behavior, while 21.3 percent could be attributed to technology issues (figures do not add up to 100 percent to reduce duplication of accidents with multiple causation).92 Despite the different conclusions drawn by NHTSA and the CAS, what both analyses highlight are the dangers of speeding, but also driver distraction. In the U.S., an estimated 9 to 10 percent of all fatal crashes between CY 2013 and CY 2017 were from distraction-affected crashes.93
Changes to vehicles themselves hasn’t necessarily helped either. According to data from IHS Automotive, the number of vehicles built in North American with display screens measuring 7 inches or more has grown by 75 percent in the past five years from 6.3 million to 10.9 million.94 During that same time period the average screen size has also increased from 6.4 inches to 7.3 inches.95 AAA has found that wider use of touch screens that often replace more familiar knobs and buttons can be distracting.96
Among the nearly 300 million vehicles in operation in the U.S., it is estimated roughly 80 percent of them are at Level 0 automation, where the driver is supposed to be in control of the vehicle 100 percent of the time. For drivers who tend to engage in dangerous and distracting behaviors, telematics also offers the ability to track and provide feedback (through scorecards or even discounted insurance premiums) on driving behavior, which may prevent bad behavior in the first place. According to CY 2019 data from PTOLEMUS, among insurers selling usage-based
as the cause of the crash nor as assignment of fault, instead it is often the last failure in the causal chain of events leading to the crash.91 Also worth noting is the additional detail on critical reason assigned to drivers shows recognition error (includes driver’s inattention, internal and external distractions and inadequate surveillance) and decision error (includes driving too fast for conditions or the curve, illegal maneuver and misjudgment of gap or others’ speed) account for nearly three quarters of the accidents researched (see Figure 32).
Survey — “Proportion of Drivers who reported distracted/risky driving behaviors at least once in last 30 days“ (FIGURE 31)
SOURCE: AAA FOUNDATION FOR TRAFFIC SAFETY’S 2018 TRAFFIC SAFETY CULTURE INDEX
5.6%
6.6%
10.9%
13.1%
16.7%
24.8%
27.1%
31.4%
32.1%
40.1%
41.3%
49.0%
52.0%
0% 10% 20% 30% 40% 50% 60%
Held and talked on cell phone
Driving 15 mph over the speed limiton freeway
Read a text/email on a cell phone
Driving 10 mph over the speed limit on aresidential street neighborhood
Typed or sent a text message/ emailon a cell phone
Speeding through a red light
Driving while being so tired that they hada hard time keeping their eyes open
Aggressive driving
Driving without wearing a seatbelt
Riding in a car driven by someone who has had too much alcohol
Driving after drinking enough alcoholthat they may be over the legal limit
Driving shortly (within an hour)after using marijuana
Driving after using potentiallyimpairing prescription drugs

39
CR
ASH
CO
UR
SE 2020 | TIME IS M
ON
EY
© 2020 CCC INFORMATION SERVICES INC. ALL RIGHTS RESERVED.
What is Monitored with Telematics Among Commercial Fleets Today (FIGURE 33) SOURCE: TELETRAC NAVAMAN. 2019 TELEMATICS BENCHMARK REPORT — U.S. EDITION.
3%
4%
26%
29%
30%
32%33%
37%
42%
52%
61%
66%
74%
0% 10% 20% 30% 40% 50% 60% 70% 80%
Vehicle/equipment tracking
Hours of service/driver hours
Speed
Distance Driven
Driver Performance
Idling
Harsh Braking
Maintenance
Fuel Usage
Engine Hours
Proof of Service/Jobs Completed
Lone Workers
Other
Challenges Abound for Commercial Auto Insurance
Commercial Auto Insurance continues to experience difficult results. The combination of these factors drives commercial auto frequency and severity trends: the growth of e-commerce driving demand for more vehicles, miles driven; difficulty finding experienced drivers; higher tort costs; deteriorating roads; increasing driver distraction; increases in medical inflation; increased rate of high-speed survival with significant rehabilitation costs; and higher loss costs due to vehicle technology.103 Since CY 2011, the direct combined ratio for commercial auto has exceeded 100 percent (see Figure 34), although the industry did see some modest improvement in its profitability with the incurred loss ratio improving to 69.1 percent in CY 2018 from 70.2 percent in CY 2017.
Commercial Auto Combined Ratio (before reinsurance) (FIGURE 34)
SOURCE: ASSURED RESEARCH, LLC
0%
20%
40%
60%
80%
100%
120%
CY2000
CY2001
CY2002
CY2003
CY2004
CY2005
CY2006
CY2007
CY2008
CY2009
CY2010
CY2011
CY2012
CY2013
CY2014
CY2015
CY2016
CY2017
CY2018
CY2019
E
insurance, 70 percent track harsh braking, 65 percent track speeding, and 61 percent track rapid acceleration.97 Among the insurance company programs they analyzed that were smartphone-centric they found 80 percent use rapid acceleration and harsh braking; 57 percent use cornering; 50 percent consider night time driving or peak time driving; and 27 percent use contextual data sets such as road type and traffic data.98
Early data from telematics providers revealed one of the major benefits of telematics was supported by the self-selection theory that those drivers that opted in were less accident prone due to being lower mileage drivers. More recent data also suggests that telematics can help reduce distracted driving, which, when accidents do occur, do so at lower speeds, leading to a lower cost of claim.99
Ensuring the driver is aware of the risk he/she is taking behind the wheel has been shown to lead them to practice safer habits. This is particularly true within the commercial insurance sector.
Telematics’ Opportunity to Help Commercial Auto Insurance
The adoption of telematics among commercial fleets is advancing even faster than among personally owned vehicles. Commercial auto is best poised to use data such as driver behavior, driver routes and route densities, weather, and other connected vehicle data to improve the accuracy of risk assessment and product pricing. With the significant growth in e-commerce, fleet traffic and demand for commercial auto insurance has increased, and the ‘last mile’ challenge has led to greater diversity among commercial fleets in terms of who is actually driving, when and where they are driving, and what they are driving.
Telematics adoption within the commercial fleet has grown dramatically, with an estimated 20 million units expected in the next three years, up from 13 million today. A survey conducted by Teletrac Navman in its CY 2019 U.S. edition of Telematics Benchmark Report revealed vehicle tracking and driver hours are monitored most today with telematics (see Figure 33).100 In fact, much of the growth in telematics adoption was driven by a federal mandate for incorporation of Electronic Logging Devices (ELDs) and Automatic On-Board Recording Devices (AOBRDs). Future growth is anticipated to come from products such as asset monitoring of trailers, shipping containers, and driver behavior management systems.101 More commercial fleets are adopting telematics solutions with video and artificial intelligence integrated, which help to provide additional context, promote safer driving behavior among drivers, and potentially lower accident frequency/severity and lower insurance premiums.
It’s estimated that the annual accident rate for commercial fleets is around 20 percent, and the average loss related to fleet vehicle accidents is approximately $70,000.102 It’s no wonder with increased fleet miles in the U.S. that commercial auto has seen higher frequency and loss cost trends over the last several years.

41
CR
ASH
CO
UR
SE 2020 | TIME IS M
ON
EY
© 2020 CCC INFORMATION SERVICES INC. ALL RIGHTS RESERVED.
Fast Track Paid Claim Frequency by Calendar Year, Rolling 4 Quarters ending Q4 Each Year (FIGURE 35)
SOURCE: ISS FAST TRACK PLUS™ PERSONAL AUTO, AS OF JUNE 30, 2019 | NOTE: CY2019 ROLLING 4 QUARTERS ENDING Q2 2019
0.0%
1.0%
2.0%
3.0%
4.0%
5.0%
6.0%
7.0%8.0%
9.0%
10.0%
CY
1980
CY
1981
CY
1982
CY
1983
CY
1984
CY
1985
CY
1986
CY
1987
CY
1988
CY
1989
CY
1990
CY
1991
CY
1992
CY
1993
CY
1994
CY
1995
CY
1996
CY
1997
CY
1998
CY
1999
CY
200
0
CY
200
1
CY
200
2
CY
200
3
CY
200
4
CY
200
5
CY
200
6
CY
200
7
CY
200
8
CY
200
9
CY
2010
CY
2011
CY
2012
CY
2013
CY
2014
CY
2015
CY
2016
CY
2017
CY
2018
CY
2019
PD Liability Collision PD Liability CY2007 Collision CY2007
Percent Change in Claim Frequency & Severity from Quarter One Year Prior (each quarter represents rolling 4 quarters data ending that quarter) (FIGURES 36-38) SOURCE: ISS FAST TRACK PLUS™ PERSONAL AUTO, AS OF SEPTEMBER 30, 2019
FIGURE 36
COLLISION
-3.0%
-2.0%
-1.0%
0.0%
1.0%
2.0%
3.0%
4.0%
5.0%
6.0%
7.0%
2012
-Q4
2013
-Q1
2013
-Q2
2013
-Q3
2013
-Q4
2014
-Q1
2014
-Q2
2014
-Q3
2014
-Q4
2015
-Q1
2015
-Q2
2015
-Q3
2015
-Q4
2016
-Q1
2016
-Q2
2016
-Q3
2016
-Q4
2017-
Q1
2017-
Q2
2017-
Q3
2017-
Q4
2018
-Q1
2018
-Q2
2018
-Q3
2018
-Q4
2019
-Q1
2019
-Q2
2019
-Q3
2019
-Q4
Frequency Severity
In response, carriers raised prices, with price increases near or above double digits for 10 consecutive quarters as of Q4 CY 2019. Data from the American Transportation Research Institute shows the average annual cost per mile for truck insurance premiums rose 42 percent between CY2010 and CY2018, from $0.06 per mile to $0.08.104 In the Commercial Property & Casualty Market Outlook Q4 2019-2020, USI predicts rates for primary auto liability with fleet lower than 200 and good loss history will increase 10 to 15 percent, while those same fleets with poor loss history will see rates increased between 15 and 25 percent. Fleets in excess of 200 could see rates up between 15 and 30 percent.105 And while technology such as ADAS features and telematics will eventually help improve frequency, for now benefits are small.
Many fleet service vehicles tend to use the lowest base trim level package on trucks, and often don’t have the option to order ADAS features, or often find the cost-benefit hard to prove.106 There is also concern that the ADAS features may create a false sense of security among drivers — for example relying on backup cameras versus walking around the vehicle prior to backup up or looking over their shoulders. For fleets that do purchase vehicles with the ADAS features, rising repair costs is also a concern.
Looking forward to CY 2020, there is some hope the industry will see better results. Despite rising freight volumes, the cost of freight (measured as door-to-door spot rate index) fell sharply in CY 2019, driving the portion of the trucking industry closely tied to the factory sector into a recession. In the first half of CY 2019, around 640 trucking companies went bankrupt, and U.S. jobs data shows 5,100 trucking payrolls were slashed in August and another 4,200 were cut in September.107 Demand for freight services had weakened in part from ongoing trade policy disputes. While this is not great news for the trucking industry as a whole, it could result in improved frequency and loss costs for the commercial auto insurance sector, which continues to trail the private passenger auto sector. Data from FMCSA for CY 2019 through July suggests there was a decline in crashes involving large trucks and buses for the first time in five years (3.2 percent drop versus 6.5 percent increase in CY 2018).109
Reduced Accident Frequency, but Rising Costs Likely for Personal Auto in 2020
Private passenger auto claim frequency has followed a downward trend since the early 1980’s. While there has been fluctuation as the economy improved or slid into recession, recent increases in CY 2015 and CY 2016 are beginning to reverse; paid claim frequency for both collision and property damage liability is at or below the levels from CY 2007 (see Figure 35).110 According to the ISS Fast Track Plus™ reports, private passenger auto collision frequency closed out CY 2018 down 1.5 percent versus CY 2017, and the four quarters ending Q3 CY 2019 show collision frequency down -1.8 percent from one year prior (see Figure 36).111 Private passenger auto property damage liability frequency also declined 3.9 percent in CY 2018 from CY 2017, and the four quarters ending Q3 CY 2019 show liability frequency down another -3.8 percent (see Figure 37).112 Devastating wildfires, hurricanes, and thunderstorm events (includes tornadoes, hail, and straight-line winds) in numerous parts of the U.S. in CY 2019 resulted in comprehensive loss frequency up 3.0 percent for the four quarters ending Q3 2019 versus a decline of -2.1 percent in CY2018 (see Figure 38).113

43
CR
ASH
CO
UR
SE 2020 | TIME IS M
ON
EY
© 2020 CCC INFORMATION SERVICES INC. ALL RIGHTS RESERVED.
from CCC customers reveals repairable claim counts fell just over 1 percent in 2019, but when total loss claim counts were included, claim counts were essentially flat for the full year (see Figure 39).
Overall Claim Counts — Percent Change from Prior Period CY2019 vs CY2018 (FIGURE 39) SOURCE: CCC INFORMATION SERVICES INC., CCC NATIONAL INDUSTRY
-1.50%
-1.0%
-0.50%
0.00%
0.50%
1.00%
1.50%
2.00%
1st Qtr 2019 2nd Qtr 2019 3rd Qtr 2019 4th Qtr 2019 Full Yr 2019
Collision/Liability Only All Loss Categories
Police-reported crashes tracked by NHTSA (crashes in excess of a pre-determined dollar amount) provide a mixed picture of overall motor-vehicle accident counts in the U.S. (see Figure 40). Between CY 2011 and CY 2015, police-reported accident counts in the U.S. were increasing. However, in 2016 NHTSA replaced the National Automotive Sampling System General Estimates Systems (NASS GES) with the modernized Crash Report Sampling System (CRSS),114 which made year-over-year changes from CY 2015 more difficult to understand. For the updated 2016, 2017 and 2018 reporting, NHTSA implemented a change in how injury estimates are derived. Today, they are based on people injured in fatal crashes from FARS, and estimated people injured in non-fatal injury crashes from CRSS or NASS GESS. Previously NHTSA estimated people injured solely on information from CRSS or NASS GES.
A change was also made to how property-only-damage (PDO) crashes were reported in 2018. Previously at 6 of the 60 CRSS sampled data collection sites, police officers could report the PDO costs as “unknown.”115 Updates to the State’s reporting criteria for these sites removed “unknown” as an option, converting many PDO crashes with unknown property damage costs into reportable crashes in 2018. Previously these were considered non-reportable crashes. Subsequently the 4.4 percent increase measured in crashes overall for NHTSA — while statistically significant per NHTSA — is primarily related to those changes. Hopefully, as data from CY 2019 becomes available, a clearer picture will emerge from the NHTSA data on the trend in motor vehicle crashes in the U.S.
FIGURE 37
PROPERTY DAMAGE/ LIABILITYFrequency Severity
-6.0%
-4.0%
-2.0%
0.0%
2.0%
4.0%
6.0%
8.0%
2012
-Q4
2013
-Q1
2013
-Q2
2013
-Q3
2013
-Q4
2014
-Q1
2014
-Q2
2014
-Q3
2014
-Q4
2015
-Q1
2015
-Q2
2015
-Q3
2015
-Q4
2016
-Q1
2016
-Q2
2016
-Q3
2016
-Q4
2017
-Q1
2017
-Q2
2017
-Q3
2017
-Q4
2018
-Q1
2018
-Q2
2018
-Q3
2018
-Q4
2019
-Q1
2019
-Q2
2019
-Q3
2019
-Q4
FIGURE 38
COMPREHENSIVEFrequency Severity
-20%
-15%
-10%
-5%
0%
5%
10%
15%
20%
25%
2012
-Q4
2013
-Q1
2013
-Q2
2013
-Q3
2013
-Q4
2014
-Q1
2014
-Q2
2014
-Q3
2014
-Q4
2015
-Q1
2015
-Q2
2015
-Q3
2015
-Q4
2016
-Q1
2016
-Q2
2016
-Q3
2016
-Q4
2017
-Q1
2017
-Q2
2017
-Q3
2017
-Q4
2018
-Q1
2018
-Q2
2018
-Q3
2018
-Q4
2019
-Q1
2019
-Q2
2019
-Q3
2019
-Q4
What remains to be seen is whether overall growth in the vehicles in operation in the U.S. — from both new vehicle registrations and slower scrappage growth — will counter declining auto claim frequency, and still result in growth in the actual number of vehicles in accidents. Data collected
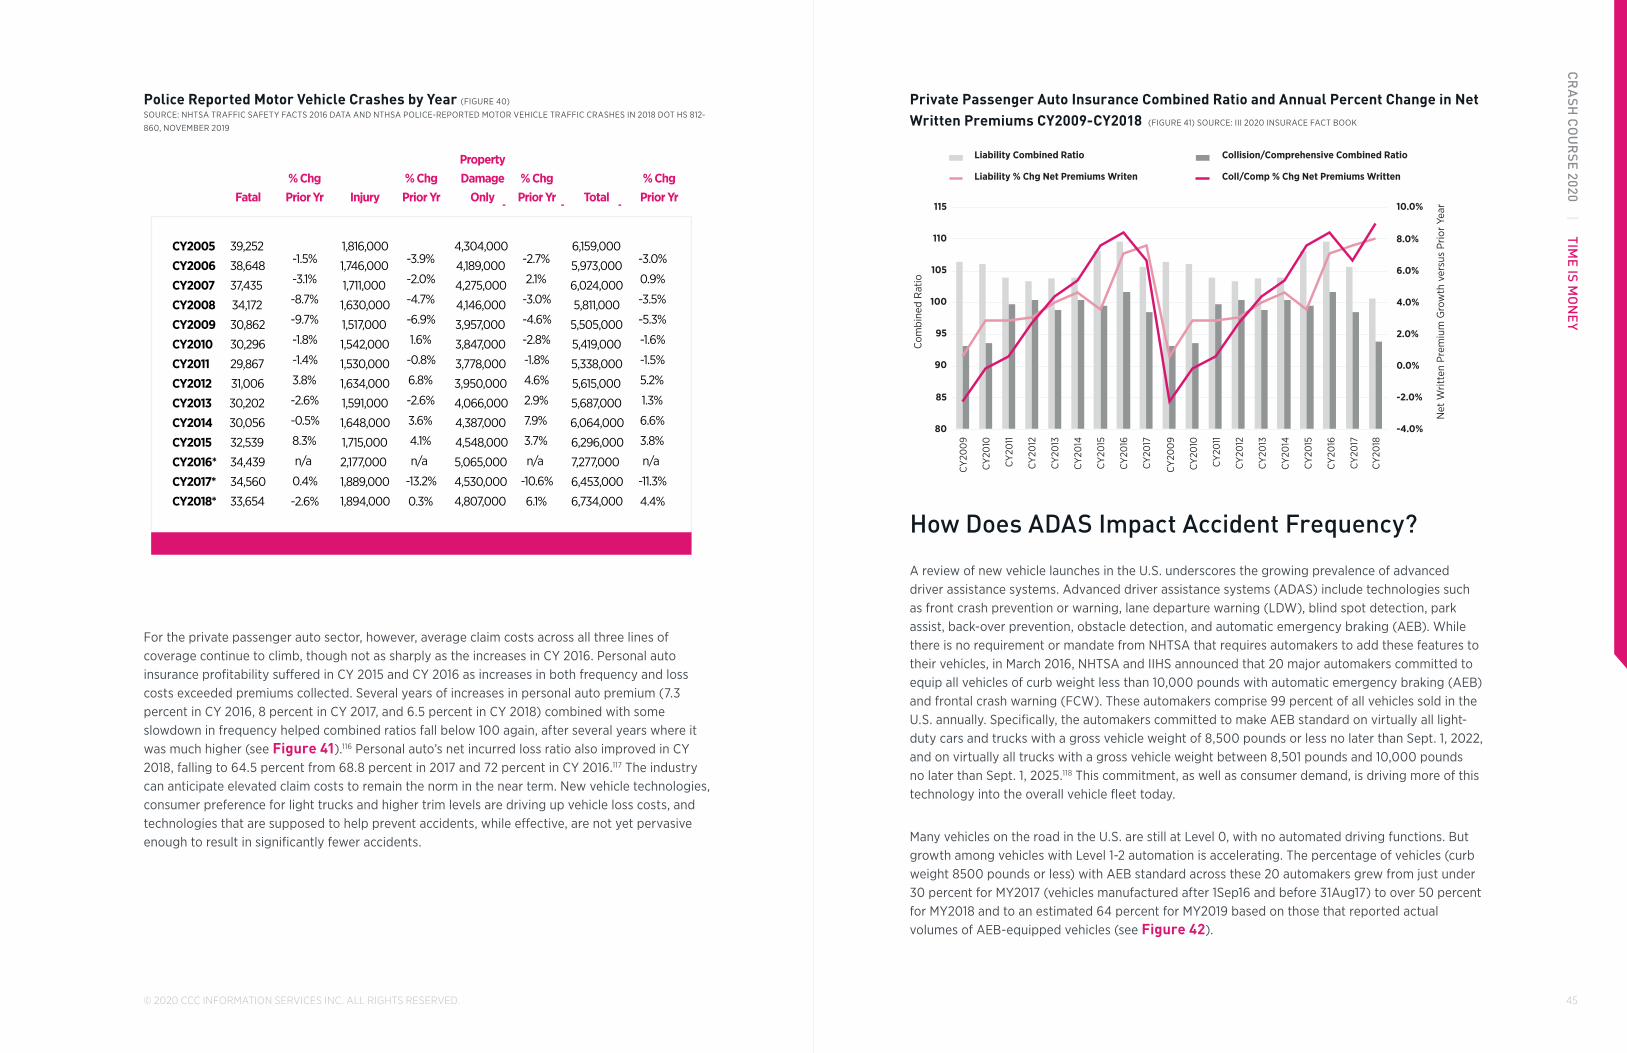
45
CR
ASH
CO
UR
SE 2020 | TIME IS M
ON
EY
© 2020 CCC INFORMATION SERVICES INC. ALL RIGHTS RESERVED.
Private Passenger Auto Insurance Combined Ratio and Annual Percent Change in Net Written Premiums CY2009-CY2018 (FIGURE 41) SOURCE: III 2020 INSURACE FACT BOOK
-4.0%
-2.0%
0.0%
2.0%
4.0%
6.0%
8.0%
10.0%
80
85
90
95
100
105
110
115
CY
200
9
CY
2010
CY
2011
CY
2012
CY
2013
CY
2014
CY
2015
CY
2016
CY
2017
CY
200
9
CY
2010
CY
2011
CY
2012
CY
2013
CY
2014
CY
2015
CY
2016
CY
2017
CY
2018
Net
Writ
ten
Prem
ium
Gro
wth
ver
sus
Prio
r Ye
ar
Com
bine
d R
atio
Liability Combined Ratio Collision/Comprehensive Combined Ratio
Liability % Chg Net Premiums Writen Coll/Comp % Chg Net Premiums Written
How Does ADAS Impact Accident Frequency?
A review of new vehicle launches in the U.S. underscores the growing prevalence of advanced driver assistance systems. Advanced driver assistance systems (ADAS) include technologies such as front crash prevention or warning, lane departure warning (LDW), blind spot detection, park assist, back-over prevention, obstacle detection, and automatic emergency braking (AEB). While there is no requirement or mandate from NHTSA that requires automakers to add these features to their vehicles, in March 2016, NHTSA and IIHS announced that 20 major automakers committed to equip all vehicles of curb weight less than 10,000 pounds with automatic emergency braking (AEB) and frontal crash warning (FCW). These automakers comprise 99 percent of all vehicles sold in the U.S. annually. Specifically, the automakers committed to make AEB standard on virtually all light-duty cars and trucks with a gross vehicle weight of 8,500 pounds or less no later than Sept. 1, 2022, and on virtually all trucks with a gross vehicle weight between 8,501 pounds and 10,000 pounds no later than Sept. 1, 2025.118 This commitment, as well as consumer demand, is driving more of this technology into the overall vehicle fleet today.
Many vehicles on the road in the U.S. are still at Level 0, with no automated driving functions. But growth among vehicles with Level 1-2 automation is accelerating. The percentage of vehicles (curb weight 8500 pounds or less) with AEB standard across these 20 automakers grew from just under 30 percent for MY2017 (vehicles manufactured after 1Sep16 and before 31Aug17) to over 50 percent for MY2018 and to an estimated 64 percent for MY2019 based on those that reported actual volumes of AEB-equipped vehicles (see Figure 42).
Police Reported Motor Vehicle Crashes by Year (FIGURE 40)
SOURCE: NHTSA TRAFFIC SAFETY FACTS 2016 DATA AND NTHSA POLICE-REPORTED MOTOR VEHICLE TRAFFIC CRASHES IN 2018 DOT HS 812-
860, NOVEMBER 2019
% ChgPrior Yr
CY2005 39,252 1,816,000 4,304,000 6,159,000
CY2006 38,648 -1.5% 1,746,000 -3.9% 4,189,000 -2.7% 5,973,000 -3.0%
CY2007 37,435 -3.1% 1,711,000 -2.0% 4,275,000 2.1% 6,024,000 0.9%
CY2008 34,172 -8.7% 1,630,000 -4.7% 4,146,000 -3.0% 5,811,000 -3.5%
CY2009 30,862 -9.7% 1,517,000 -6.9% 3,957,000 -4.6% 5,505,000 -5.3%
CY2010 30,296 -1.8% 1,542,000 1.6% 3,847,000 -2.8% 5,419,000 -1.6%
CY2011 29,867 -1.4% 1,530,000 -0.8% 3,778,000 -1.8% 5,338,000 -1.5%
CY2012 31,006 3.8% 1,634,000 6.8% 3,950,000 4.6% 5,615,000 5.2%
CY2013 30,202 -2.6% 1,591,000 -2.6% 4,066,000 2.9% 5,687,000 1.3%
CY2014 30,056 -0.5% 1,648,000 3.6% 4,387,000 7.9% 6,064,000 6.6%
CY2015 32,539 8.3% 1,715,000 4.1% 4,548,000 3.7% 6,296,000 3.8%
CY2016* 34,439 n/a 2,177,000 n/a 5,065,000 n/a 7,277,000 n/a
CY2017* 34,560 0.4% 1,889,000 -13.2% 4,530,000 -10.6% 6,453,000 -11.3%
CY2018* 33,654 -2.6% 1,894,000 0.3% 4,807,000 6.1% 6,734,000 4.4%
Total% ChgPrior Yr
PropertyDamage
Only% ChgPrior YrInjury
% ChgPrior YrFatal
For the private passenger auto sector, however, average claim costs across all three lines of coverage continue to climb, though not as sharply as the increases in CY 2016. Personal auto insurance profitability suffered in CY 2015 and CY 2016 as increases in both frequency and loss costs exceeded premiums collected. Several years of increases in personal auto premium (7.3 percent in CY 2016, 8 percent in CY 2017, and 6.5 percent in CY 2018) combined with some slowdown in frequency helped combined ratios fall below 100 again, after several years where it was much higher (see Figure 41).116 Personal auto’s net incurred loss ratio also improved in CY 2018, falling to 64.5 percent from 68.8 percent in 2017 and 72 percent in CY 2016.117 The industry can anticipate elevated claim costs to remain the norm in the near term. New vehicle technologies, consumer preference for light trucks and higher trim levels are driving up vehicle loss costs, and technologies that are supposed to help prevent accidents, while effective, are not yet pervasive enough to result in significantly fewer accidents.
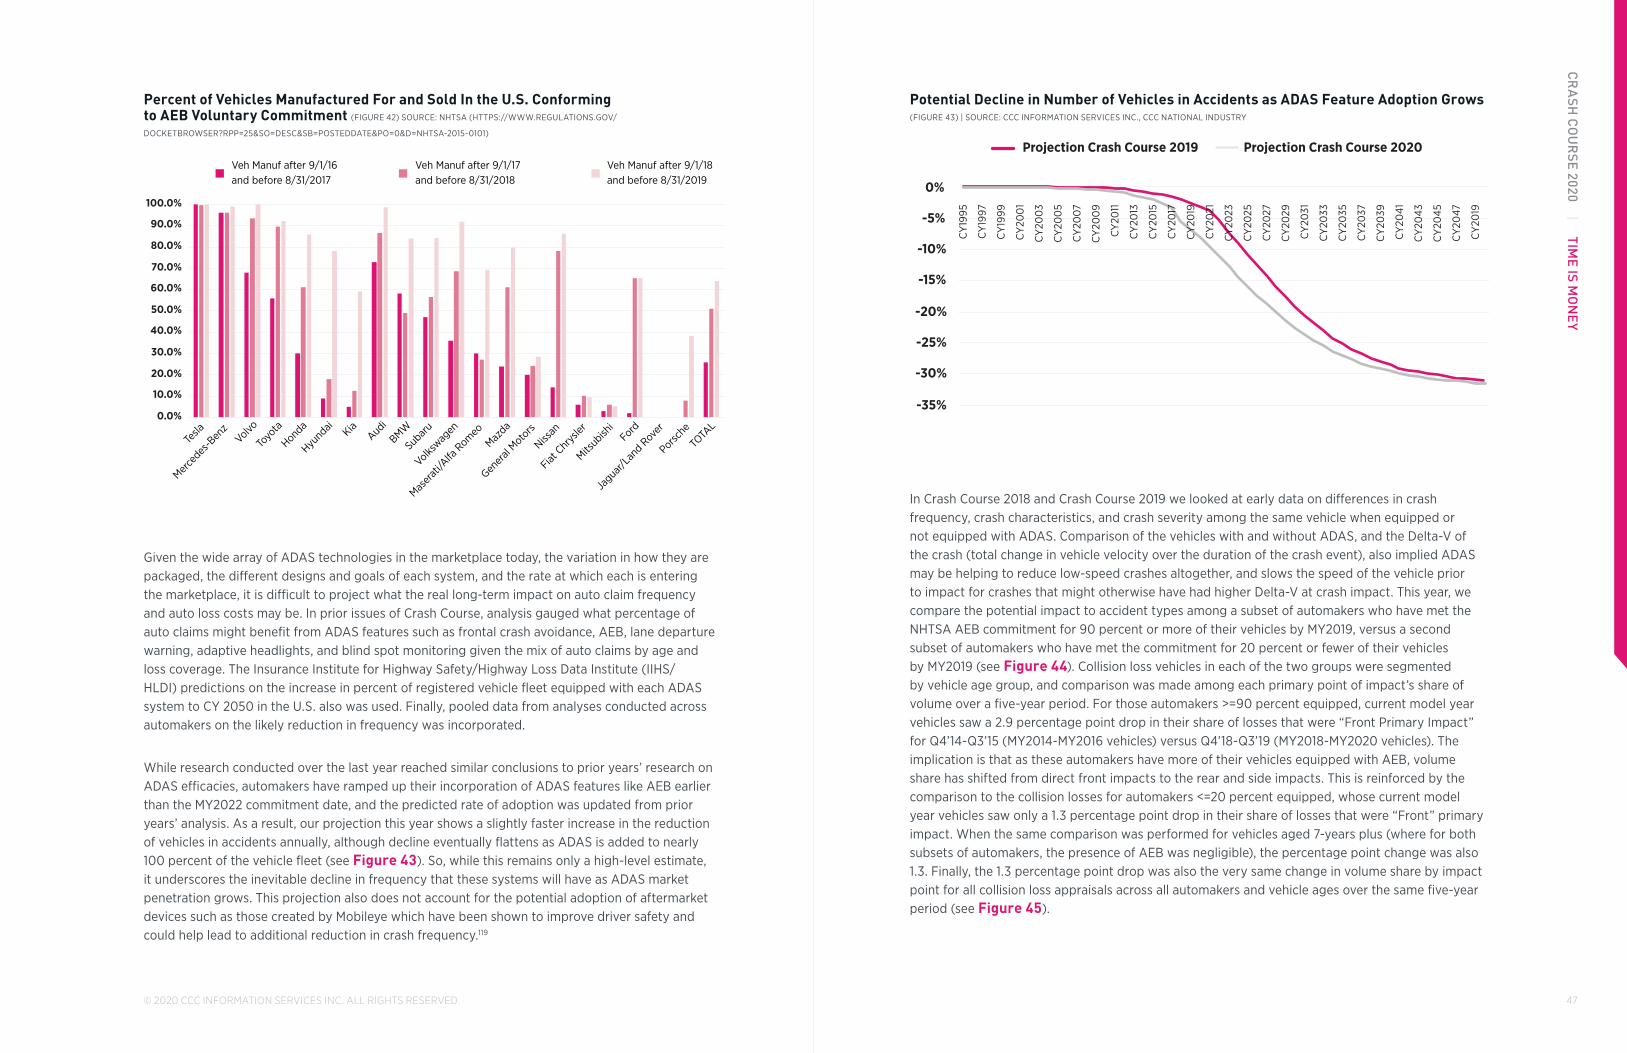
47
CR
ASH
CO
UR
SE 2020 | TIME IS M
ON
EY
© 2020 CCC INFORMATION SERVICES INC. ALL RIGHTS RESERVED.
Potential Decline in Number of Vehicles in Accidents as ADAS Feature Adoption Grows (FIGURE 43) | SOURCE: CCC INFORMATION SERVICES INC., CCC NATIONAL INDUSTRY
-35%
-30%
-25%
-20%
-15%
-10%
-5%
0%
CY
1995
CY
1997
CY
1999
CY
200
1
CY
200
3
CY
200
5
CY
200
7
CY
200
9
CY
2011
CY
2013
CY
2015
CY
2017
CY
2019
CY
2021
CY
2023
CY
2025
CY
2027
CY
2029
CY
2031
CY
2033
CY
2035
CY
2037
CY
2039
CY
2041
CY
2043
CY
2045
CY
2047
CY
2019
Projection Crash Course 2019 Projection Crash Course 2020
In Crash Course 2018 and Crash Course 2019 we looked at early data on differences in crash frequency, crash characteristics, and crash severity among the same vehicle when equipped or not equipped with ADAS. Comparison of the vehicles with and without ADAS, and the Delta-V of the crash (total change in vehicle velocity over the duration of the crash event), also implied ADAS may be helping to reduce low-speed crashes altogether, and slows the speed of the vehicle prior to impact for crashes that might otherwise have had higher Delta-V at crash impact. This year, we compare the potential impact to accident types among a subset of automakers who have met the NHTSA AEB commitment for 90 percent or more of their vehicles by MY2019, versus a second subset of automakers who have met the commitment for 20 percent or fewer of their vehicles by MY2019 (see Figure 44). Collision loss vehicles in each of the two groups were segmented by vehicle age group, and comparison was made among each primary point of impact’s share of volume over a five-year period. For those automakers >=90 percent equipped, current model year vehicles saw a 2.9 percentage point drop in their share of losses that were “Front Primary Impact” for Q4’14-Q3’15 (MY2014-MY2016 vehicles) versus Q4’18-Q3’19 (MY2018-MY2020 vehicles). The implication is that as these automakers have more of their vehicles equipped with AEB, volume share has shifted from direct front impacts to the rear and side impacts. This is reinforced by the comparison to the collision losses for automakers <=20 percent equipped, whose current model year vehicles saw only a 1.3 percentage point drop in their share of losses that were “Front” primary impact. When the same comparison was performed for vehicles aged 7-years plus (where for both subsets of automakers, the presence of AEB was negligible), the percentage point change was also 1.3. Finally, the 1.3 percentage point drop was also the very same change in volume share by impact point for all collision loss appraisals across all automakers and vehicle ages over the same five-year period (see Figure 45).
Percent of Vehicles Manufactured For and Sold In the U.S. Conforming to AEB Voluntary Commitment (FIGURE 42) SOURCE: NHTSA (HTTPS://WWW.REGULATIONS.GOV/
DOCKETBROWSER?RPP=25&SO=DESC&SB=POSTEDDATE&PO=0&D=NHTSA-2015-0101)
0.0%
10.0%
20.0%
30.0%
40.0%
50.0%
60.0%
70.0%
80.0%
90.0%
100.0%
Tesla
Merce
des-B
enz
Volvo
Toyo
ta
Honda
Hyund
ai KiaAud
i
BMW
Subar
u
Volkswag
en
Maser
ati/A
lfa R
omeo
Mazda
Gener
al Moto
rs
Nissan
Fiat C
hrys
ler
Mitsub
ishi
Ford
Jagua
r/Lan
d Rov
er
Porsche
TOTA
L
Veh Manuf after 9/1/16and before 8/31/2017
Veh Manuf after 9/1/17and before 8/31/2018
Veh Manuf after 9/1/18and before 8/31/2019
Given the wide array of ADAS technologies in the marketplace today, the variation in how they are packaged, the different designs and goals of each system, and the rate at which each is entering the marketplace, it is difficult to project what the real long-term impact on auto claim frequency and auto loss costs may be. In prior issues of Crash Course, analysis gauged what percentage of auto claims might benefit from ADAS features such as frontal crash avoidance, AEB, lane departure warning, adaptive headlights, and blind spot monitoring given the mix of auto claims by age and loss coverage. The Insurance Institute for Highway Safety/Highway Loss Data Institute (IIHS/HLDI) predictions on the increase in percent of registered vehicle fleet equipped with each ADAS system to CY 2050 in the U.S. also was used. Finally, pooled data from analyses conducted across automakers on the likely reduction in frequency was incorporated.
While research conducted over the last year reached similar conclusions to prior years’ research on ADAS efficacies, automakers have ramped up their incorporation of ADAS features like AEB earlier than the MY2022 commitment date, and the predicted rate of adoption was updated from prior years’ analysis. As a result, our projection this year shows a slightly faster increase in the reduction of vehicles in accidents annually, although decline eventually flattens as ADAS is added to nearly 100 percent of the vehicle fleet (see Figure 43). So, while this remains only a high-level estimate, it underscores the inevitable decline in frequency that these systems will have as ADAS market penetration grows. This projection also does not account for the potential adoption of aftermarket devices such as those created by Mobileye which have been shown to improve driver safety and could help lead to additional reduction in crash frequency.119

49
CR
ASH
CO
UR
SE 2020 | TIME IS M
ON
EY
© 2020 CCC INFORMATION SERVICES INC. ALL RIGHTS RESERVED.
Share of Claim Count by Primary Impact — Collision and Liability Losses Q4’14-Q3’15 versus Q4’18-Q3’19 (FIGURE 45) | SOURCE: CCC INFORMATION SERVICES INC., CCC NATIONAL INDUSTRY
Q4'14-Q3'15
Q4'18-Q3'19
Pct Point
Change
Q4'14-Q3'15
Q4'18-Q3'19
Pct Point
Change
Front 27.3% 26.0% -1.3% Front 12.5% 12.2% -0.3%Left Front 10.1% 10.1% -0.1% Left Front 7.6% 7.3% -0.3%Left Front Pillar 3.1% 3.4% 0.3% Left Front Pillar 2.7% 2.9% 0.2%Left Qtr Post 2.7% 3.1% 0.4% Left Qtr Post 3.7% 4.1% 0.4%Left Rear 6.3% 6.0% -0.3% Left Rear 7.9% 7.9% 0.0%Left T-bone 4.3% 4.4% 0.0% Left T-bone 5.2% 5.1% -0.1%Rear 18.3% 18.1% -0.2% Rear 39.6% 39.1% -0.5%Right Front 10.8% 10.9% 0.1% Right Front 6.2% 6.1% -0.1%Right Front Pillar 2.9% 3.4% 0.4% Right Front Pillar 2.1% 2.4% 0.2%Right Qtr Post 3.2% 3.7% 0.5% Right Qtr Post 2.8% 3.2% 0.4%Right Rear 5.5% 5.1% -0.4%
4.6% 4.8% -0.2%
Right Rear 5.4% 5.1% -0.2%Right T-bone Right T-bone 4.0% 4.0% 0.1%
COLLISION LOSS CATEGORY LIABILITY LOSS CATEGORY
In February 2019, IIHS/HLDI published results of research conducted on police crash-report data from 23 states during 2009-2016 for striking passenger vehicles with and without autobrake among models on which the system was optional. They wanted to identify the types of rear-end crashes in which vehicles with autobrake are involved to help identify where autobrake could be improved to address a broader set of accident scenarios.120 The research found more than two-thirds of the crashes occurred when the road surface was dry, the striking vehicle was moving straight, or the struck vehicle was slowing or stopped. Of the remaining one third of crashes, the crash-involved vehicles with autobrake were turning, struck a vehicle that was turning or changing lanes, struck a non-passenger vehicle, were driving on a snowy or icy road, or were driving on a road with a 70 mph or higher speed limit. This data helps underscore why AEB equipped vehicles may be seeing a larger drop in collision front impacts.
There is hope that advances in vehicle technology such as ADAS will, over time, lead to fewer accidents, and subsequently fewer people and vehicles to fix. In the near term however, vehicles have many more sensors, cameras, radar, lidar, etc. and complex material construction than ever before. The wide variation in technologies used among the OEs is leading to challenges for repairers, where the importance of understanding each and every individual vehicle has become critical. These changes also mean the industry is making major investments in tooling, training, and data to ensure it is equipped to properly return vehicles to pre-accident condition. Near-term challenges abound, and certainly ADAS seems to be another factor driving the trend of fewer but more expensive claims.
Shift Among Accident Impacts for ADAS Equipped Vehicles (FIGURE 44)
SOURCE: CCC INFORMATION SERVICES INC., CCC NATIONAL INDUSTRY
Front Left Front Left Front Pillar Right Front
Right Front Pillar Rear Side Other
Vehicles 90% Equipped with ADAS as of MY2019 -Percent of Collision Repairable Claim Count per Primary Impact - Current Model Year Vehicles
Vehicles Minimally Equipped (<20%) with ADAS as of MY2018 -Percent of Collision Repairable Claim Count per Primary Impact - Current Model Year Vehicles
0%
10%
20%
30%
40%
50%
60%
70%
80%
90%
100%
MY14-MY16
Q4'14-Q3'15
-2.9% drop in
Front Impacts
MY18-MY20
Q4'18-Q3'19
MY14-MY16
Q4'14-Q3'15
MY18-MY20
Q4'18-Q3'19
Front Left Front Left Front Pillar Right Front
Right Front Pillar Rear Side Other
0%
10%
20%
30%
40%
50%
60%
70%
80%
90%
100%
-1.3% drop in
Front Impacts

51
CR
ASH
CO
UR
SE 2020 | TIME IS M
ON
EY
“
Heart-pounding music has long been the backdrop to the sleek silhouette of vehicles gliding flawlessly down the road in automotive advertising. And while the easy handling and beauty of new vehicles remains important, automakers today are highlighting much more — safety and simplicity. Think about it: Honda’s “What If” advertising campaign, which debuted in late 2019, features a new kind of heart-pounding moment when a man (a coworker, a father, a husband) is
OEMs are now companions on the driver’s journey, providing relief and comfort along the way."
by Manjaree Harwood
BEYOND THE VEHICLE: OEM TECHNOLOGY DRIVES ENHANCED CONSUMER EXPERIENCE
Manjaree Harwood Senior Director, OEM Market Development, CCC
ABOUT THE AUTHOR
repair experience. With Accident Advisor, OEMs can:
• Guide drivers to quickly and safely document the accident scene and initiate the claims process with their insurance provider through a singular experience.
• Connect more seamlessly with repair facilities. Diagnostic scans inform repair facilities while performing a thorough repair of vehicles.
• Help drivers replace vehicles following an accident. Today, about 20 percent of accidents result in a total loss, and some consumers may decide to replace their vehicles after an accident.
Providing drivers with support during a confusing and stressful time can help OEMs distinguish themselves with unique services that drive customer satisfaction and brand loyalty.
Through telematics, OEMs can be a gateway to insurers to round-out the vehicle ownership experience. With driver consent, CCC® VIN Connect connects vehicles from the OEM point of purchase to CCC to support insurers who may offer personalized insurance rates or reward good behaviors. CCC® VIN Connect Safety also provides insurers with a clear view of vehicle ADAS features, which is designed to help underwriters factor in vehicle technology and accident-avoidance features when calculating rates.
Vehicle technology provides a platform for expanded relationships. By helping automakers connect with drivers beyond the initial purchase and — more importantly — after an accident, CCC can help OEMs build deeper relationships with their customers.
1SHEPARD, MADDIE, “13 SURPRISING BRAND LOYALTY
STATISTICS.” HTTPS://WWW.FUNDERA.COM/RESOURCES
BRAND-LOYALTY-STATISTICS. JULY 23, 2019
nearly hit. The vehicle’s collision-mitigating braking system prevents the accident. Viewers exhale.
Volkswagen, Subaru, and Volvo capture our attention by highlighting advanced driver-assisted systems (ADAS) in commercials, encouraging consumers to expect more from their vehicles. Expectations that expand beyond safety to include technology-aided assistance, prominently featured in Hyundai’s “ghost car” ad, debuting in the OEM’s 2020 Super Bowl spot. The self-parking and “unparking” features work to extend consumer expectations of vehicle assistance.
What these ads, and the OEMs we speak with, want to make clear is that their relationship with drivers is changing. OEMs are now companions on the driver’s journey, providing relief and comfort along the way. And, this seems to be good for business.
A 2019 survey by Fundera noted that 80 percent of U.S. drivers would pay more for a vehicle if it was accompanied by a better experience.¹ ADAS and telematics are the driving forces behind the driving experiences of the future.
However, the picture isn’t entirely rosy; these same features increase the cost of vehicle repair. And, even with more new technologies, not all accidents can be avoided. But, with the assistance of CCC, OEMs can help drivers navigate and recover from unplanned events.
Connecting OEMs and Drivers
The relationship between OEMs and drivers no longer stops at the point of purchase; it now extends beyond the vehicle itself. CCC® Accident Advisor keeps OEMs connected to drivers post-accident, providing a medium to guide consumers through the claims and

53
CCC INSIGHTC
RA
SH C
OU
RSE 2020 | TIM
E IS MO
NE
Y
Auto sales in the U.S. remained strong in 2019 with 17.1 million new vehicles and nearly 40 million used vehicles sold. Analysts are predicting sales will slow in the coming years, but with vehicles lasting longer than ever before, scrappage rates low, and a decline in miles driven per vehicle annually, there will be many vehicles on the road in the U.S. for quite some time.
Analysis of the demographics of age suggest that the anticipated drop in auto sales and auto claim frequency from Millennials staying put in urban areas and using only ride-hailing instead of purchasing their own vehicle may be much smaller than anticipated. Numerous studies reveal that it is primarily differences in economics not preferences that have led to the delay in life choices by Millennials versus prior generations. The question ultimately becomes how new factors such as more online shopping, greater digital capabilities enabling more work-from-home, an aging population, and higher rates of migration to the West and South will drive auto claim frequency in the future.
Unfortunately, drivers face more congestion and potential for distraction, so despite lower per vehicle exposure to accidents from people driving their vehicles less, the overall count of motor vehicle accidents in the U.S. may not see any meaningful decline for some time. ADAS technology has been shown to be very effective at reducing crashes in the scenarios in which they are best designed to work, but most vehicles on the road are still not ADAS-equipped, and the technology doesn’t address every type of accident scenario. As we’ll discuss later, the ADAS technology is among the new features of vehicles that add to repair complexity, ultimately driving up claim costs for the industry in the near-term.
Automakers and other technology companies continue to make large investments in "ACES," but full-blown Level 5 autonomy will likely take longer than earlier predicted. Billions of dollars are being spent to gear up for electric vehicles, but sales remain tepid. Of the four key megatrends, it is perhaps the connected car that offers the most immediate benefits, particularly as automakers look for ways to remain top of mind among vehicle owners throughout the vehicle life cycle. Using data collected from the vehicle may be the best way yet to understand what customers really use among the numerous technologies now being added to vehicles, helping automakers potentially reduce the cost of unused features but also enable all industry players to better understand their customers.
Of the four key megatrends, it is perhaps the connected car that offers the most immediate benefits, particularly as automakers look for ways to remain top of mind among vehicle owners throughout the vehicle life cycle.

55
CR
ASH
CO
UR
SE 2020 | TIME TO
INVE
ST02 TIME TO
INVESTMODERNIZING REPAIR CAPABILITIES
Today’s vehicles are very different than vehicles manufactured even 10 or 20 years ago.
Automakers made numerous changes and enhancements to vehicle construction, material types, content and more to improve vehicle crash worthiness, crash avoidance, and vehicle emissions, and to offer new types of capabilities like telematics, adaptive cruise control, and over-the-air updates.

57
CR
ASH
CO
UR
SE 2020 | TIME TO
INVE
ST
© 2020 CCC INFORMATION SERVICES INC. ALL RIGHTS RESERVED.
the industry can expect to see similar volatility in claim count and makeup in the coming years. These losses are unlikely to benefit from the ADAS technology being added to vehicles; if anything, it will drive the replacement and repair costs of these vehicle claims up further.
Average Total Cost of Repairs by Loss Category, Repairable Appraisal Statistics (FIGURE 47) | SOURCE: CCC INFORMATION SERVICES INC., CCC NATIONAL INDUSTRY
Total Collision Comprehensive Liability
$1,500
$2,000
$2,500
$3,000
$3,500
$4,000
CY2010 CY2011 CY2012 CY2013 CY2014 CY2015 CY2016 CY2017 CY2018 CY2049
CY2019 Share of Overall Claim Count with Primary Impact of Hail/Water (FIGURE 48) | SOURCE: CCC INFORMATION SERVICES INC., CCC NATIONAL INDUSTRY
% of ClaimCount
18.6%
0.1%
All these modifications changed not only the how and what the vehicle is made of, but also resulted in the addition of numerous new vehicle components. Figure 46 illustrates the growing share of electronics and software to vehicle costs over the last two decades. Changing consumer preference resulted in many more light trucks versus cars, and more consumers opting for higher trim levels than ever before.
With the increase in vehicle complexity, repair complexity has also grown. Consumers increasingly rely on new features such as ADAS, and all industry participants need to be invested in having repairs deliver the vehicle back to pre-accident condition. Today that means making access to training, tooling, and data available, and using them to provide the best repair outcomes.
In this section of Crash Course 2020 we discuss how the industry is investing in capabilities to repair the vehicles of today and tomorrow, and what that means to repair cycle time and repair costs.
Software and Electronics Share of Vehicle Cost to Exceed Value of Mechanical Components by 2020 (FIGURE 46) | SOURCE: ETI/MARTEC
77%
55%
40%
18%
30%
30%
5%
15%
30%
2000
2010
2020
Mechanical Electronics Software
Repair Costs Accelerate
In CY 2019, the industry experienced a ramp-up in the annual rate of change in repairable claim costs from prior years. The average total cost of repairs overall for all repairable appraisals was $3,225, up 4.9 percent from CY 2018. By comparison, overall inflation for All items not seasonally adjusted increased 1.8 percent in CY2019. Comprehensive and liability losses saw the largest increase in average costs over the last several years, followed by collision losses (see Figure 47). Severe weather in numerous parts of the country over the last several years led to significant swings in volume share of comprehensive losses related to hail and flooding (see Figure 48), as well as to vehicle age of comprehensive losses and the share of which were repairable versus total loss claims (see Figure 49). For example, in Q4’16-Q3’17, Hurricane Harvey struck Texas, flooding large volumes of vehicles, driving the age of comprehensive losses younger than in other periods, and resulting in higher total loss costs. With the severity of storms growing due to climate change,

59
CR
ASH
CO
UR
SE 2020 | TIME TO
INVE
ST
© 2020 CCC INFORMATION SERVICES INC. ALL RIGHTS RESERVED.
Repairable Vehicle Damage Appraisals — Vehicle Mix Statistics by Calendar Year (FIGURE 50) | SOURCE: CCC INFORMATION SERVICES INC., CCC NATIONAL INDUSTRY
Avg Repair Cost $2,425 $2,497 $2,551 $2,597 $2,689 $2,752 $2,870 $2,941 $3,074 $3,225
% Chg from prior calendar year 1.1% 2.9% 2.2% 1.8% 3.5% 2.3% 4.3% 2.5% 4.5% 4.9%
Non-Driveable % 22.6% 21.9% 21.8% 21.1% 20.6% 20.6% 20.3% 20.5% 20.8% 20.5%
% of Claims with Suppl(s) 47.1% 46.9% 47.2% 46.1% 46.5% 48.0% 49.2% 51.4% 51.2% 55.6%
Suppl % of Total Repair Cost 10.4% 10.7% 11.2% 12.1% 12.6% 13.3% 14.4% 16.1% 16.5% 18.1%
Avg Vehicle Age 5.79 5.99 6.11 6.19 6.10 6.00 5.90 5.90 5.90 5.94
Avg CCC Regional Value Amt
80,412
$13,133 $14,280 $14,996 $15,022 $15,324
80,098
$15,790 $16,071 $16,488
Avg Odometer
13,899
82,634 83,875 82,712 83,696 82,206
13,576
79,677 79,507 79,551
Avg Mileage per Vehicle Year
38.2%
13,792 13,726 13,372 13,615 13,620
39.8%
13,505 13,476 13,392
Parts % Total Repair Cost
7.9
37.7% 38.2% 38.9% 39.3% 40.1%
9.4
39.7% 39.9% 40.2%
Avg # Parts Repl per Claim
$12,851
8.0 8.3 8.7 9.0 9.3
$15,275
9.6 9.9 10.5
OEM % of Total Part Amt 63.4% 63.3% 63.1% 62.8% 64.0% 63.7% 62.9% 62.6% 61.7% 61.8%
Labor % Total Repair Cost 42.6% 42.8% 42.3% 41.9% 41.7% 40.9% 41.2% 41.0% 40.4% 39.6%
Avg Labor Hrs per Claim 22.3 22.3 22.4 22.5 22.7 22.8 23.1 23.2 23.3 23.6
Avg Hourly Body Rate $44.61 $45.01 $45.50 $46.13 $46.67 $47.27 $47.82 $48.87 $50.27 $51.45
% Chg from prior calendar year 1.7% 0.9% 1.1% 1.4% 1.2% 1.3% 1.2% 2.2% 2.9% 2.3%
Repair % Total Labor Amt 40.8% 42.2% 41.8% 41.3% 41.3% 40.7% 42.2% 41.8% 40.7% 39.8%
Total Loss % Vol 15.0% 14.7% 15.1% 14.0% 14.1% 15.4% 16.7% 17.9% 18.4% 19.2%
Collision Losses % Vol 52.8% 51.8% 52.2% 53.5% 53.9% 54.5% 53.3% 53.3% 53.9% 53.8%
Comprehensive Losses % Vol 16.2% 18.4% 17.5% 15.9% 15.9% 14.8% 16.5% 16.8% 16.0% 16.1%
Liability Losses % Vol 31.0% 29.8% 30.3% 30.6% 30.2% 30.7% 30.2% 29.9% 30.1% 30.0%
Vehicles 7 Years & Older % Vol 36.5% 38.8% 40.7% 42.2% 42.8% 41.8% 38.3% 36.5% 35.4% 35.0%
Light Truck % Vol 42.6% 42.6% 42.9% 43.1% 43.4% 44.2% 45.9% 48.1% 50.1% 52.4%
Asian Vehicles % Vol 43.8% 45.0% 46.3% 47.5% 48.3% 49.0% 49.6% 50.1% 50.5% 50.8%
Domestic Vehicles % Vol 47.7% 46.2% 44.5% 43.1% 42.2% 41.4% 40.8% 40.5% 40.1% 39.6%
European Vehicles % Vol 8.5% 8.8% 9.2% 9.4% 9.5% 9.6% 9.5% 9.5% 9.5% 9.6%
Luxury % Vol 15.7% 15.7% 15.9% 15.8% 15.6% 15.5% 15.5% 15.5% 15.4% 15.6%
CY2010 CY2011 CY2012 CY2013 CY2014 CY2015 CY2016 CY2017 CY2018 CY2019
Analysis of Comprehensive Claims by Vehicle Age and Total Loss versus Repairable (FIGURE 49) | SOURCE: CCC INFORMATION SERVICES INC., CCC NATIONAL INDUSTRY
Q4'14-Q3'15 13.3% $8,752 $2,818 1.7% 9.8% 11.1% 77.3%
Q4'15-Q3'16 16.8% $9,107 $3,069 1.8% 12.3% 13.8% 72.2%
Q4'16-Q3'17 20.3% $10,008 $3,124 2.5% 14.8% 16.6% 66.2%
Q4'17-Q3'18 18.8% $9,479 $3,280 1.9% 12.7% 17.1% 68.3%
Q4'18-Q3'19 19.2% $9,878 $3,475 1.7% 12.6% 18.6% 67.0%
PercentFlagged
TotalLoss
Average Total Loss Adjusted
Vehicle ValutionAmt
Average Total Cost of Repairs
Current Yr or Newer Group
% Overall Comp Claim
Cnt
1-3 Years Old % Overall
Comp Claim Cnt
4-6 Years Old % Overall
Comp Claim Cnt
7 Years and Older % of
Overall Comp Claim Cnt
To better understand the dynamics behind the change in average appraisal cost, consider the primary components contributing to overall repair costs: parts and labor, and an analysis of the changes within the population of repaired vehicles in terms of vehicle age, manufacturer and type (see Figure 50). Growth in the average number of parts replaced per claim as well as more labor hours per claim largely account for the rise in repair costs. Increasing vehicle complexity — both in terms of the materials used in the construction of the vehicles, as well as an increased number of standard options, are helping to lift costs.
Parts and Labor Drive Repair Costs
The distribution of repair cost dollars has changed little over the last 15+ years, the timeframe in which CCC tracked this information. The most significant change is the increase in both the share of overall dollars spent on replacement parts and sublet/miscellaneous operations (see Figure 51). Replacement parts make up about 40.2 percent of overall repair dollars, but the distribution of overall parts dollars by part type has shifted towards greater non-OE utilization.
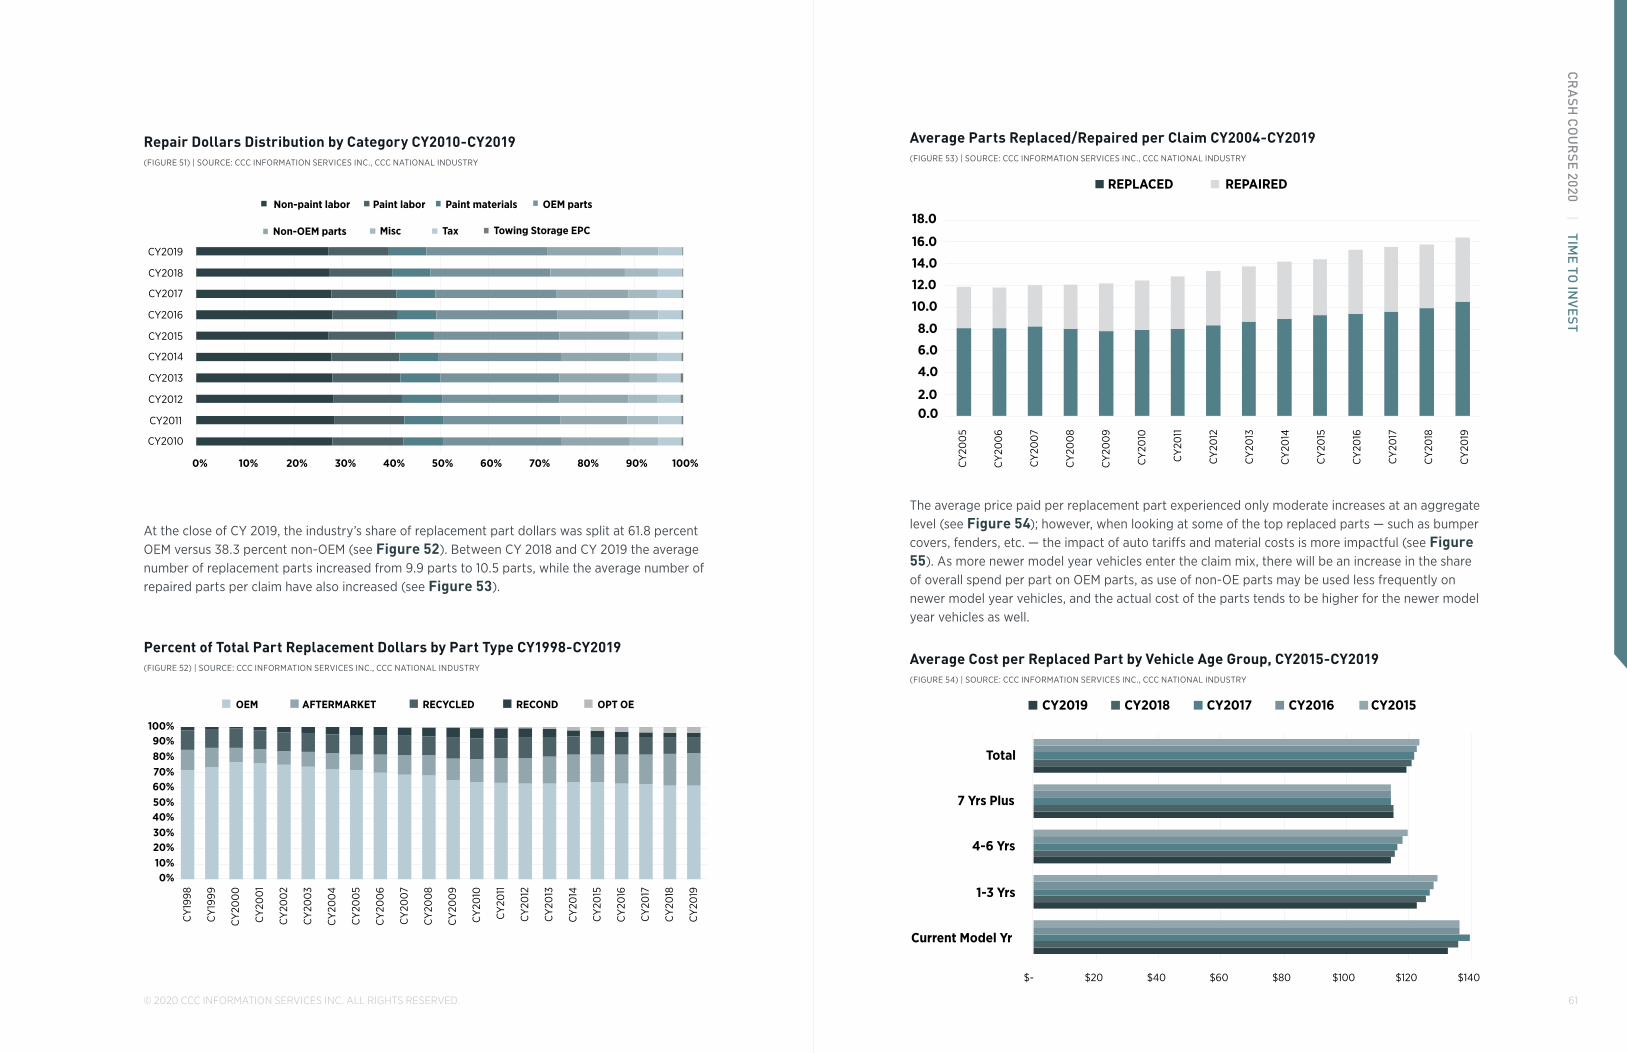
61
CR
ASH
CO
UR
SE 2020 | TIME TO
INVE
ST
© 2020 CCC INFORMATION SERVICES INC. ALL RIGHTS RESERVED.
Average Parts Replaced/Repaired per Claim CY2004-CY2019 (FIGURE 53) | SOURCE: CCC INFORMATION SERVICES INC., CCC NATIONAL INDUSTRY
REPLACED REPAIRED
CY
200
5
CY
200
6
CY
200
7
CY
200
8
CY
200
9
CY
2010
CY
2011
CY
2012
CY
2013
CY
2014
CY
2015
CY
2016
CY
2017
CY
2018
CY
2019
0.02.0
4.0
6.0
8.0
10.0
12.0
14.0
16.0
18.0
The average price paid per replacement part experienced only moderate increases at an aggregate level (see Figure 54); however, when looking at some of the top replaced parts — such as bumper covers, fenders, etc. — the impact of auto tariffs and material costs is more impactful (see Figure 55). As more newer model year vehicles enter the claim mix, there will be an increase in the share of overall spend per part on OEM parts, as use of non-OE parts may be used less frequently on newer model year vehicles, and the actual cost of the parts tends to be higher for the newer model year vehicles as well.
Average Cost per Replaced Part by Vehicle Age Group, CY2015-CY2019 (FIGURE 54) | SOURCE: CCC INFORMATION SERVICES INC., CCC NATIONAL INDUSTRY
$- $20 $40 $60 $80 $100 $120 $140
Current Model Yr
1-3 Yrs
4-6 Yrs
7 Yrs Plus
Total
CY2019 CY2018 CY2017 CY2016 CY2015
Repair Dollars Distribution by Category CY2010-CY2019 (FIGURE 51) | SOURCE: CCC INFORMATION SERVICES INC., CCC NATIONAL INDUSTRY
0% 10% 20% 30% 40% 50% 60% 70% 80% 90% 100%
CY2010
CY2011
CY2012
CY2013
CY2014
CY2015
CY2016
CY2017
CY2018
CY2019
Non-paint labor Paint labor Paint materials OEM parts
Non-OEM parts Misc Tax Towing Storage EPC
At the close of CY 2019, the industry’s share of replacement part dollars was split at 61.8 percent OEM versus 38.3 percent non-OEM (see Figure 52). Between CY 2018 and CY 2019 the average number of replacement parts increased from 9.9 parts to 10.5 parts, while the average number of repaired parts per claim have also increased (see Figure 53).
Percent of Total Part Replacement Dollars by Part Type CY1998-CY2019 (FIGURE 52) | SOURCE: CCC INFORMATION SERVICES INC., CCC NATIONAL INDUSTRY
OEM AFTERMARKET RECYCLED RECOND OPT OE
0%10%20%30%40%50%60%70%80%90%
100%
CY
1998
CY
1999
CY
200
0
CY
200
1
CY
200
2
CY
200
3
CY
200
4
CY
200
5
CY
200
6
CY
200
7
CY
200
8
CY
200
9
CY
2010
CY
2011
CY
2012
CY
2013
CY
2014
CY
2015
CY
2016
CY
2017
CY
2018
CY
2019

63
CR
ASH
CO
UR
SE 2020 | TIME TO
INVE
ST
© 2020 CCC INFORMATION SERVICES INC. ALL RIGHTS RESERVED.
Finding and keeping collision repair technicians remains a primary concern for the industry. According to the CREF/I-CAR Snapshot of the Collision Repair Industry 2019, 56.4 percent of the survey’s respondents reported hiring at least one entry-level technician during the previous 12 months, and the largest source of all technician hiring was hiring from another shop, followed by hired from a non-automotive industry or as first job, and hired from a related automotive industry (see Figure 57).121 Even auto dealers are facing a critical shortage of service technicians — only about 37,000 auto mechanics are graduating from U.S. technical colleges and training programs per year — barely fulfilling half of the roughly 76,000 technicians needed annually to keep pace with retirements and new jobs in the sector.122 This is particularly concerning given the need for more vehicles to potentially require service at a dealership to complete some of the more complex scan and/or calibration procedures, where a shortage of technicians with the needed skills leads to longer overall cycle times.
Source of Technicians Hired at Collision Repair Facilities (FIGURE 57)
SOURCE: CREF I-CAR SNAPSHOT OF THE COLLISION REPAIR INDUSTRY SURVEY 2019
0%
10%
20%
30%
40%
50%
60%
Hired from another shop Hired from non-automotive industry or as first job
Hired from related automotive industry
Other
CY2016 Survey CY2019 Survey
Materially Different
To improve vehicle crashworthiness and occupant safety, automakers designed vehicles with more energy transfer built into the vehicle design.123 Combine that with numerous materials, and vehicles are performing differently and handling crash energy differently.124 Stronger materials are being used in the front structure or in the upper and lower rails to reduce crush in the occupant compartment, often creating challenges when identifying where the energy from a crash traveled through a vehicle, and where that vehicle might be damaged. The materials used in vehicle construction also are changing. As automakers race to meet the ever-stricter corporate average fuel economy standards, they increasingly use lighter-weight materials such as aluminum, boron, ultra-high strength steel, and magnesium to reduce the overall weight of the vehicles themselves. As technology reduces the cost and speed of vehicle development through advances in electronic
Focused Parts Analysis Excluding Attachments Such as Clips, Hinges, Bolts, etc. Show Cost of Major Parts Still Increasing (FIGURE 55)
SOURCE: CCC INFORMATION SERVICES INC., CCC NATIONAL INDUSTRY
$0$50
$100$150
$200$250$300$350
All Par
t Gro
ups
Air Cond
itione
r & H
eate
r
Fend
er
Front
Bum
per
Front
Lam
psGrill
eHood
Lift G
ate
Pick U
p Box
Quarte
r Pan
el
Radiat
or Sup
port
Rear B
umper
Rear L
amps
Trunk
Lid
Wind
shiel
d
CY2015 CY2018 CY2019
The average number of labor hours per appraisal uploaded to CCC on behalf of insurance companies in CY 2019 was up by one-tenth of an hour. These same appraisals showed moderate increases in the average hourly labor rate nationally. Combined, these factors help explain the increase in average repair costs overall. The hourly labor rates saw moderate increases year-over-year during the recession, closing out CY 2019 up over 2 percent (see Figure 56).
Average Labor Rates per Labor Category CY2015-CY2019 (FIGURE 56)
SOURCE: CCC INFORMATION SERVICES INC., CCC NATIONAL INDUSTRY
FrameLabor
Body(SheetMetal)Labor
Body(SheetMetal)Labor
CalendarYear
PaintMaterial
PaintLabor
MechanicalLabor
FrameLabor
MechanicalLabor
PaintLabor
PaintMaterial
CY2015 $47.27 $54.15 $80.47 $47.21 $27.78 1.3% 1.6% 2.9% 1.3% 2.5%
CY2016 $47.82 $55.20 $82.07 $47.79 $28.31 1.2% 1.9% 2.0% 1.2% 1.9%
CY2017 $48.87 $56.54 $84.98 $48.68 $29.07 2.2% 2.4% 3.6% 1.9% 2.7%
CY2018 $50.30 $58.32 $87.34 $49.89 $29.92 2.9% 3.0% 2.6% 2.4% 3.0%
CY2019 $51.45 $59.78 $89.91 $50.96 $30.70 2.3% 2.5% 2.9% 2.1% 2.6%
AVERAGE HOURLY RATE (WEIGHTED AVERAGE) % CHANGE FROM PRIOR YEAR

65
CR
ASH
CO
UR
SE 2020 | TIME TO
INVE
ST
© 2020 CCC INFORMATION SERVICES INC. ALL RIGHTS RESERVED.
Most vehicle repairs today now recommend completion of a pre-repair scan, post-repair scan, and often an in-process scan to get a comprehensive understanding of what is damaged and to verify proper repair. Additionally, repairers must identify what electronic systems the vehicle has, which of them has been damaged, and which components need to be removed, replaced, R&I’d, disconnected, and/or refinished.125 Diagnostic trouble codes (DTC’s) triggered by the scan also need to be researched, as OE repair procedures are updated frequently.
In CY 2015, numerous OEs released position statements underscoring the critical nature of performing these vehicle scans. As a result, industry awareness and the practice of scans has grown. In first quarter CY 2016, less than a half-percent of appraisals included an entry denoting a “scan/diagnosis/health check/astech” operation (see Figure 59). By Q4 CY 2019 that percentage grew to 49.5 percent. Note that the absence of a scan entry in the appraisal does not necessarily mean that the scan was not performed — just not recorded in the appraisal itself. As the completion of the scan(s) now is a standard part of most repairs, the industry has adapted, and the average fee per scan fell from $110 per scan in Q1 CY 2016 to just $68 per scan by Q4 CY 2019.
Percent of Repairable Appraisals by Vehicle Age Group with Appraisal Line for “Scan/Health/asTech/Diagnose” (FIGURE 59) | SOURCE: CCC INFORMATION SERVICES INC., CCC NATIONAL INDUSTRY
NOTE: QUERY TO PULL DATA UPDATED FOR CRASH COURSE 2020 AND DATA MAY DIFFER FROM PREVIOUSLY PUBLISHED DATA.
0%
10%
20%
30%
40%
50%
60%
70%
Current Year or Newer Group
1 - 3 Years Old 4 - 6 Years Old 7 Years and Older Total
2016-Q1 2016-Q2 2016-Q3 2016-Q4 2017-Q1 2017-Q2 2017-Q3 2017-Q4
2018-Q1 2018-Q2 2018-Q3 2018-Q4 2019-Q1 2019-Q2 2019-Q3 2019-Q4
As the number of connected cars grows, the opportunity to capture data — such as a vehicle health scan that includes diagnostic trouble codes — facilitates the ability for all parties involved in the repair to understand the nature of the vehicle damage. In early January 2020 CCC and American Honda Motor Co. announced plans to integrate Honda’s scanning cloud technology into the CCC™ X data exchange. CCC® Diagnostics is designed to enable repair facilities to request and receive scan data, clear codes, and rescan directly from within the system they use every day, minimizing hardware and software requirements and eliminating the need for manual entry of scan report data. Finally, the ability to integrate the data into the overall repair file provides documentation about the scans, should questions arise later.
modeling and CAD systems, manufacturers can select different materials and joining methods within a single vehicle body structure. The result is a potential combination of materials all used in a single vehicle structure. Figure 58 illustrates the growth in the percent of annual overall appraisal volume where the vehicle itself was known to include at least one component comprised of a light-weight material such as aluminum, boron, magnesium, high-strength steel, ultra-high-strength steel, hydroformed steel, or sandwiched steel. In CY 2007, only 13.4 percent of all the vehicles for which an appraisal was generated included one or more of these lightweight vehicles in its construction; by CY 2019 that number grew to 78.6 percent.
Percent of Overall Vehicle Appraisal Count for Vehicles with One or More Lightweight Material Part (FIGURE 58) | SOURCE: CCC INFORMATION SERVICES INC., CCC NATIONAL INDUSTRY
NOTE: APPRAISAL MAY OR MAY NOT HAVE INCLUDED REPAIR/REPLACEMENT/ETC. OF A LIGHTWEIGHT MATERIAL PART.
0.0%
10.0%
20.0%
30.0%
40.0%
50.0%
60.0%
70.0%
80.0%
90.0%
100.0%
CY2007 CY2011 CY2015 CY2016 CY2017 CY2018 CY2019
Current Model Yr & Newer 1-3 Yrs 4-6 Yrs 7 Yrs Plus Total
With a greater number and variety of high-tech materials used in the construction of their vehicles, automakers are releasing studies and bulletins that underscore the criticality of following the recommended repair procedures and methods so the vehicle is repaired safely and will perform as designed in any subsequent collisions. Growth in electronic vehicle content — items added to address vehicle safety or convenience — adds to the overall cost and complexity of repair and the need to understand recommended repair procedures.
Electronics and Software Growth Drives Need for Additional Skills and Tooling
Consumer demand for ADAS to help avoid or mitigate an accident has grown dramatically. These technologies are driving the rapid addition of microprocessors, sensors, cameras, radar and other technologies into vehicles, and numerous software programs to connect to this broad array of sensors and cameras.

67
CR
ASH
CO
UR
SE 2020 | TIME TO
INVE
ST
© 2020 CCC INFORMATION SERVICES INC. ALL RIGHTS RESERVED.
Percent of Repairable Appraisals by Vehicle Age Group with Appraisal Line for “Calibration/Reprogram/Flash” (FIGURE 60) | SOURCE: CCC INFORMATION SERVICES INC., CCC NATIONAL INDUSTRY
0% 1% 2% 3% 4% 5% 6% 7% 8%
Current Yr orNewer Group
1 - 3 Years Old
4 - 6 Years Old
7 Years and Older
Total
2019-Q4 2019-Q3 2019-Q2 2019-Q1 2018-Q4 2018-Q3
2018-Q2 2018-Q1 2017-Q4 2017-Q3 2017-Q2 2017-Q1
Calibration Entries — Average Cost, Maximum Fee Identified, and Standard Deviation of Fees (FIGURE 61) | SOURCE: CCC INFORMATION SERVICES INC., CCC NATIONAL INDUSTRY
Maximum fee on single appraisal Std Dev of Fees
2017-Q1 $168 $4826 ”Window/Module reprogram” $197
2017-Q2 $172 $6250 “Reprogram Headlamps at dealer” $214
2017-Q3 $177 $4341 “Replace and Recalibrate Lane Ad” $229
2017-Q4 $182 $4149 “calibrate and repair” $223
2018-Q1 $182 $4270 “recalibrate windshield, clear” $226
2018-Q2 $189 $7791 “complete install/tune/calibrat” $233
2018-Q3 $196 $5852 “SRS system recalibration and S” $236
2018-Q4 $210 $8941 “Replace and programm occupant” $257
2019-Q1 $217 $6094 “dealer install and calibrate f” $254
2019-Q2 $219 $5316 “Dealer Distance Sensor Reprogr” $236
2019-Q3 $250 $6610 “RR DIFF CHANGE AND CALIBRATE” $281
2019-Q4 $232 $8564 "Re-calibrate distance sensor -" $264
Average fee for calibration entry(Includes flat fees and labor)
According to MOTOR’s Guide to Estimating, the reset of an electronic module (of any kind) is not included in the replacement time for that module. Rather, the reset time is separate, and can vary widely due to wide variation among individual vehicles and system complexity. Similarly, computer module re-learn and electronic memory functions reset (after battery disconnect) are also not included with any labor operation. Many of the vehicles equipped with ADAS require “zero-point calibration” following replacement of system parts and sensors.
Calibration essentially tells a vehicle’s internal computers to readjust the cameras, sensors and other technology to function according to the vehicle’s OE specifications.126 A dynamic calibration may require the vehicle be test driven at certain speeds for a specified period — and that it be driven on certain types of roads with specific types of lane markings all while plugged into a scan tool.127 A static calibration often requires OE specific targets and equipment, such as heating devices, lasers, jigs, cameras and Doppler devices.128 Conducting a calibration can vary by manufacturer, and requires OEM service information as well as scan tools. The time to recalibrate these sensors and cameras may vary depending on the complexity of the systems, and differs from a scan, which is done to identify problems within a system. Perhaps most concerning is the fact that there is no indicator — like a DTC or dash light — to inform the repairer that the system is not calibrated, or the sensors are not aimed correctly. Following the vehicle-specific procedures and requirements, and documenting they have been completed properly, is critical to being able to demonstrate accurate calibration has occurred.
When a part such as a distance sensor is replaced, additional database labor time of 0.2 to 0.6 hours is commonly added as an entry such as “FRONT BUMPER Add for distance sensor.” In addition to this, some repairs include separate manual entries for calibration, depending on the components damaged or the vehicle repair requirements. The specific parts requiring calibration are not always identified clearly or at all. Unsurprisingly, the majority of calibration line entries in appraisals identify a specific ADAS feature such as blind-spot monitoring sensor, distance sensor, camera, parking sensor, lane departure, adaptive cruise control, as well as mechanical parts such as occupant sensors, steering angle sensors and tire pressure monitoring sensors, and finally parts such as headlamps.
In Q4 CY 2019, 2.6 percent of all appraisals included an additional entry for “calibration,” “re-program,” “flash,” etc., up from 0.9 percent in Q1 CY 2017 (see Figure 60). As additional supplements come in for repairs from Q4 CY 2019, the percentage likely will climb to meet or exceed the 2.8 percent of Q3 CY 2019. There is, however, a wide range in these types of fees, with certain entries including not just the cost of calibration, or a fee to “Drive to and from calibration,” but the cost of additional components that may have been found to need replacement during the calibration. Figure 61 illustrates the average fees per calibration estimate line (includes manual and database lines), and the maximum fee per quarter from Q1 CY 2017 to Q4 CY 2019.

69
CR
ASH
CO
UR
SE 2020 | TIME TO
INVE
ST
© 2020 CCC INFORMATION SERVICES INC. ALL RIGHTS RESERVED.
OEMs are increasingly focused on encouraging the repairer community to review the OEM repair procedures prior to repairing a vehicle.
Over the last several decades, repairers have faced numerous challenges from changing vehicle technology. The pace of change among vehicles today is accelerating, driving up the costs of operating a professional facility. Not surprisingly, the collision repair industry also is transforming. Between CY 2007 and CY 2013, nearly 4,000 collision repair facilities in the U.S. went out of business, with just over 41,000 in operation as of CY 2018 (see Figure 63).131 In recent years, the number of independent body shops has grown nearly 3 percent annually as economic recovery, miles driven, extreme winter weather, and improved new vehicle sales began to support increases in auto accident frequency. Overall, however, growth within the segment over the last 15 years has seen a compound annual growth rate of -0.5 percent.132 These independent repairers and dealer body shops will do an estimated $41 billion in collision repair work in 2019, a number anticipated to grow further over the next several years.133 The Romans Group estimates 89 percent of the overall collision repair revenue is insurance paid, while 11 percent is consumer paid.134
U.S. Shops Specializing in Collision Repair CY2002-CY2018 (FIGURE 63) | SOURCE: AUTO CARE ASSOCIATION. AUTO CARE FACTBOOK 2020.
37,00038,00039,00040,00041,00042,00043,00044,00045,00046,00047,000
CY2002
CY2003
CY2004
CY2005
CY2006
CY2007
CY2008
CY2009
CY2010
CY2011
CY2012
CY2013
CY2014
CY2015
CY2016
CY2017
CY2018
Analysis of the auto claims processed by CCC on behalf of its insurance and collision repair customers reveals the percent of appraisals generated at a shop on behalf of an insurance company was 47.1 percent for CY 2019, after peaking at 49.7 percent in CY 2017 (see Figure 64). DRP share of repairable appraisal volume was 39.9 percent for CY 2019, down from 40 percent in CY 2016 and CY 2017 as more carriers shifted volume for customers among various methods of inspection options such as photo/virtual estimating.
Analysis of repairable DRP volume reveals national MSOs continue to see significant growth in share. Between CY 2000 and CY 2019 the share of overall repairable DRP appraisal count going to national MSO’s quadrupled, growing from 5.8 percent to 39.1 percent (see Figure 65). Share of DRP appraisal volume going to dealers was 3.3 percent in CY 2019. According to Supplement Advisory, dealerships share of the overall U.S. collision market dollars was just below 20 percent as of Q1 2019, trailing chain and franchise shops at 26.6 percent, and independent stores at 54.1
Completing the proper diagnostics, determining which components are included in the repair that might require calibration, and reviewing the OEM repair procedures can help a repairer incorporate the calibration into the repair plan up front. These steps could potentially help avoid added costs and repair time identified later in supplements, that can also lead to lower customer satisfaction with the repair. Analysis of calibration entries included in appraisals between CY 2017 and CY 2019 suggest the industry has room for improvement here — less than 40 percent were included in the original estimate of record, and of those calibration with fees of $1000 or more, only 9 percent were included on the original E01 (see Figure 62).
Manual Calibration Entries Included in CY2017-CY2019 Appraisals — Percent Included per Estimate Version (FIGURE 62) | SOURCE: CCC INFORMATION SERVICES INC., CCC NATIONAL INDUSTRY
NOTE: ESTIMATE OF RECORD (E01); 1ST SUPPLEMENT (S01); 2ND SUPPLEMENT (S02); 3RD OR MORE SUPPLEMENT (S03-S99)
37.6% 36.7%
16.4%
9.3%9.0%
37.3%
31.7%
22.0%
E01 S01 S02 S03-S99
All Manual Calibration Entries Manual Calibration Entries >=$1000
Driving Change for Collision Repairers
Changes to both the material composition of the vehicle and the added procedures to account for repairs of new software and electronic components also mean repairers must make significant investments in added tooling and training and staff for their locations. Purchasing the tools and software specified by each individual OEM results in multiple software license fees, multiple welders, rivet guns, scan tools, calibration targets and more. As shops struggle to keep up with the necessary investments, they face the reality that they may not be able to repair every vehicle from every OEM in the future. This is just one of many major decisions that must be made by repairers today. Others include whether to participate in insurers’ direct repair programs, whether to expand, sell or join a franchise or banner group, and whether to become an OEM certified shop, and if so, which OEM(s).
Many more OEMs are developing their own OEM certified repair programs that require varying levels of ASE certification, I-CAR training, I-CAR welding certification, and specific tool and equipment.129 The programs are designed to help drive brand recognition, customer satisfaction with service and repair, keep OEM warranties in place, and ensure eligible trade-ins and lease returns meet requirements for certified pre-owned programs.130 As vehicle complexity grows,

71
CR
ASH
CO
UR
SE 2020 | TIME TO
INVE
ST
© 2020 CCC INFORMATION SERVICES INC. ALL RIGHTS RESERVED.
DRP Repair Cycle Times Continue to Grow While Repairer Productivity Slows
When an insurance vehicle claim is made, insurance carriers often have limited visibility into whether their customer gets the vehicle repaired or not, and if so, where. The exception to this is claims where the vehicle is repaired at a collision repair facility that is part of that carrier’s direct repair program (DRP). Through updates provided by the repairer to the insurer, data on repair cycle times, and repair satisfaction is available.
The percent of DRP appraisals written that convert to repairs tends to be higher as the repair cost rises (see Figure 66). For the period of Q4’18-Q3’19, 70.3 percent of all repairable DRP appraisals converted to repairs. Separate analysis of the capture rate (estimates written to repair orders captured) for repairers’ walk-in business reveals just over 50 percent of walk-in business converts to repairs, and the average cost per walk-in repair order averaged nearly 30 percent less than DRP repairs.
Between Q4’16-Q3’17 and Q4’18-Q3’19, the average DRP repair cost rose from 8.3 percent from just over $3,000 to $3,251. A comparison of repairs by repair cost dollar range shows the shift toward the higher dollar ranges over the same period (see Figure 67). Over the same two-year period, the average number of days from vehicle drop-off to vehicle pickup, or ‘keys-to-keys’ has increased from 9.7 days to 10.2 days (see Figure 68). Consistent with prior analysis, the vehicle in to repair started days average and the repair complete to vehicle out days average have improved or stayed steady — the increase has occurred within the repair time itself.
DRP Appraisals Q4’18-Q3’19 — Percent Appraisals Written Converted to Repairs (‘capture rate’) (FIGURE 66) | SOURCE: CCC INFORMATION SERVICES INC., CCC NATIONAL INDUSTRY
53.6%
60.5%
70.0%
74.1%
74.8%
74.6%
72.0%
59.0%
70.3%
$0.01-$500.00
$500.01 to $1,000.00
$1,000.01 to $2,000.00
$2,000.01 to $3,000.00
$3,000.01 to $4,000.00
$4,000.01 to $5,000.00
$5,000.01-$10,000
$10,000.01 & Up
Total Repair Cost Ranges
percent.135 With OEMs increasingly pursuing growth of their own certified collision repair networks, dealer share of volume may grow.
Share of CCC National Industry Repairable Appraisal Volume where Appraisal Generated at the Shop on Behalf of the Carrier as DRP, Open Shop or Service Center (FIGURE 64) | SOURCE: CCC INFORMATION SERVICES INC., CCC NATIONAL INDUSTRY
0.0%
10.0%
20.0%
30.0%
40.0%
50.0%
60.0%
CY2013 CY2014 CY2015 CY2016 CY2017 CY2018 CY2019
DRP Svc Ctr Open Shop
Share of Annual DRP Appraisal Volume per Shop Type (FIGURE 65)
SOURCE: CCC INFORMATION SERVICES INC., CCC NATIONAL INDUSTRY
NOTE: NATIONAL MSOS INCLUDE FRANCHISE; INDEPENDENTS INCLUDES 2&3-LOC MSOS. REGIONAL MSOS ARE REPAIRERS WITH 4-PLUS
LOCATIONS IN A SINGLE STATE.
0%10%20%30%40%50%60%70%80%90%
100%
CY2000
CY2001
CY2002
CY2003
CY2004
CY2005
CY2006
CY2007
CY2008
CY2009
CY2010
CY2011
CY2012
CY2013
CY2014
CY2015
CY2016
CY2017
CY2018
CY2019
DEALERSHIP INDEPENDENT NATIONAL MSO REGIONAL MSO
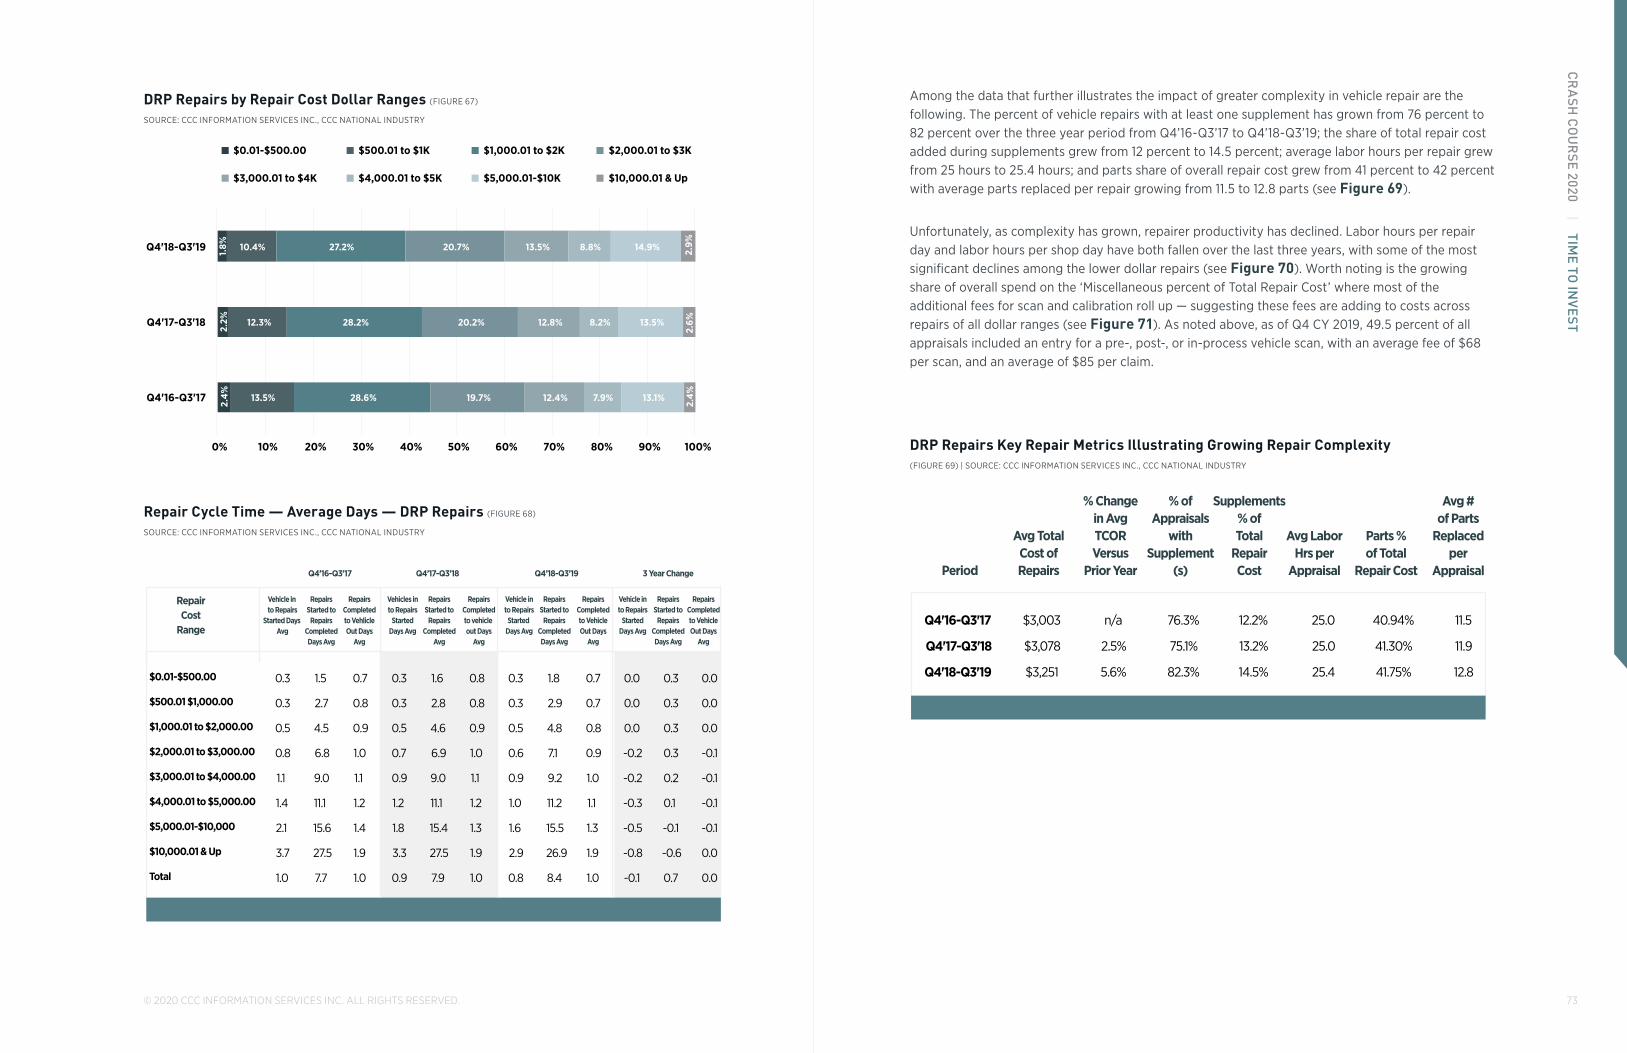
73
CR
ASH
CO
UR
SE 2020 | TIME TO
INVE
ST
© 2020 CCC INFORMATION SERVICES INC. ALL RIGHTS RESERVED.
Among the data that further illustrates the impact of greater complexity in vehicle repair are the following. The percent of vehicle repairs with at least one supplement has grown from 76 percent to 82 percent over the three year period from Q4’16-Q3’17 to Q4’18-Q3’19; the share of total repair cost added during supplements grew from 12 percent to 14.5 percent; average labor hours per repair grew from 25 hours to 25.4 hours; and parts share of overall repair cost grew from 41 percent to 42 percent with average parts replaced per repair growing from 11.5 to 12.8 parts (see Figure 69).
Unfortunately, as complexity has grown, repairer productivity has declined. Labor hours per repair day and labor hours per shop day have both fallen over the last three years, with some of the most significant declines among the lower dollar repairs (see Figure 70). Worth noting is the growing share of overall spend on the ‘Miscellaneous percent of Total Repair Cost’ where most of the additional fees for scan and calibration roll up — suggesting these fees are adding to costs across repairs of all dollar ranges (see Figure 71). As noted above, as of Q4 CY 2019, 49.5 percent of all appraisals included an entry for a pre-, post-, or in-process vehicle scan, with an average fee of $68 per scan, and an average of $85 per claim.
DRP Repairs Key Repair Metrics Illustrating Growing Repair Complexity (FIGURE 69) | SOURCE: CCC INFORMATION SERVICES INC., CCC NATIONAL INDUSTRY
Period
Avg TotalCost ofRepairs
% Changein AvgTCORVersus
Prior Year
% ofAppraisals
withSupplement
(s)
Supplements% ofTotal
RepairCost
Avg LaborHrs per
Appraisal
Parts %of Total
Repair Cost
Avg #of Parts
Replacedper
Appraisal
Q4'16-Q3'17 $3,003 n/a 76.3% 12.2% 25.0 40.94% 11.5
Q4'17-Q3'18 $3,078 2.5% 75.1% 13.2% 25.0 41.30% 11.9
Q4'18-Q3'19 $3,251 5.6% 82.3% 14.5% 25.4 41.75% 12.8
DRP Repairs by Repair Cost Dollar Ranges (FIGURE 67)
SOURCE: CCC INFORMATION SERVICES INC., CCC NATIONAL INDUSTRY
2.4%
2.2%
1.8%
13.5%
12.3%
10.4%
28.6%
28.2%
27.2%
19.7%
20.2%
20.7%
12.4%
12.8%
13.5%
7.9%
8.2%
8.8%
13.1%
13.5%
14.9%
2.4%
2.6%
2.9%
0% 10% 20% 30% 40% 50% 60% 70% 80% 90% 100%
Q4'16-Q3'17
Q4'17-Q3'18
Q4'18-Q3'19
$0.01-$500.00 $500.01 to $1K $1,000.01 to $2K $2,000.01 to $3K
$3,000.01 to $4K $4,000.01 to $5K $5,000.01-$10K $10,000.01 & Up
Repair Cycle Time — Average Days — DRP Repairs (FIGURE 68)
SOURCE: CCC INFORMATION SERVICES INC., CCC NATIONAL INDUSTRY
Vehicle in to Repairs
Started Days Avg
RepairsStarted to
RepairsCompletedDays Avg
RepairsCompletedto VehlicleOut Days
Avg
Vehicles into Repairs
StartedDays Avg
RepairsStarted to
RepairsCompleted
Avg
RepairsCompletedto vehicle out Days
Avg
Vehicle into RepairsStarted
Days Avg
RepairsStarted to
RepairsCompletedDays Avg
RepairsCompletedto VehicleOut Days
Avg
Vehicle into Repairs
StartedDays Avg
RepairsStarted to
RepairsCompletedDays Avg
RepairsCompletedto VehicleOut Days
Avg
$0.01-$500.00 0.3 1.5 0.7 0.3 1.6 0.8 0.3 1.8 0.7 0.0 0.3 0.0
$500.01 $1,000.00 0.3 2.7 0.8 0.3 2.8 0.8 0.3 2.9 0.7 0.0 0.3 0.0
$1,000.01 to $2,000.00 0.5 4.5 0.9 0.5 4.6 0.9 0.5 4.8 0.8 0.0 0.3 0.0
$2,000.01 to $3,000.00 0.8 6.8 1.0 0.7 6.9 1.0 0.6 7.1 0.9 -0.2 0.3 -0.1
$3,000.01 to $4,000.00 1.1 9.0 1.1 0.9 9.0 1.1 0.9 9.2 1.0 -0.2 0.2 -0.1
$4,000.01 to $5,000.00 1.4 11.1 1.2 1.2 11.1 1.2 1.0 11.2 1.1 -0.3 0.1 -0.1
$5,000.01-$10,000 2.1 15.6 1.4 1.8 15.4 1.3 1.6 15.5 1.3 -0.5 -0.1 -0.1
$10,000.01 & Up 3.7 27.5 1.9 3.3 27.5 1.9 2.9 26.9 1.9 -0.8 -0.6 0.0
Total 1.0 7.7 1.0 0.9 7.9 1.0 0.8 8.4 1.0 -0.1 0.7 0.0
RepairCost
Range
Q4’16-Q3’17 Q4’17-Q3’18 Q4’18-Q3’19 3 Year Change

75
CR
ASH
CO
UR
SE 2020 | TIME TO
INVE
ST
© 2020 CCC INFORMATION SERVICES INC. ALL RIGHTS RESERVED.
Miscellaneous Percent of Total Repair Cost per Repair Cost Dollar Range (FIGURE 71) | SOURCE: CCC INFORMATION SERVICES INC., CCC NATIONAL INDUSTRY
0.0% 1.0% 2.0% 3.0% 4.0% 5.0% 6.0% 7.0% 8.0%
$0.01-$500.00
$500.01 to $1K
$1,000.01 to $2K
$2,000.01 to $3K
$3,000.01 to $4K
$4,000.01 to $5K
$5,000.01-$10K
$10,000.01 & Up
Total
Q4'18-Q3'19 Q4'17-Q3'18 Q4'16-Q3'17
As more repairs include additional steps previously included infrequently or not at all, the importance of clear processes to ensure these steps are completed properly and thoroughly, and clearly documented, grows. Blueprinting the repair, identifying up front what types of electronic components such as ADAS may require calibration, completing scans, etc. have all become more important up front to understand as much about the likely repair cost and repair time for each individual vehicle. As repair costs rise, supplement frequency and return rates rise, while on-time delivery rates fall. Creating and following a standard set of procedures up front to remind estimators and repair technicians to check for items such as ADAS features may help combat the inevitable increases in each of these as repair costs continue to rise (see Figure 72).
Q4’18-Q3’19 DRP Repairs per Repair Cost Range -As Repair Costs Rise, On Time Repairs and Delivery Fall; Supplement Frequency and Return Rates Rise (FIGURE 72) | SOURCE: CCC INFORMATION SERVICES INC., CCC NATIONAL INDUSTRY
0.00%
10.00%
20.00%
30.00%
40.00%
50.00%
60.00%
70.00%
80.00%
90.00%
100.00%
% of On Time Delivery % of On Time Repairs % of Repairs withSupplement(s)
% Vehicles Returned Post-Delivery
$0.01-$500.00 $500.01 to $1K $1,000.01 to $2K $2,000.01 to $3K $3,000.01 to $4K
$4,000.01 to $5K $5,000.01-$10K $10,000.01 & Up Total
Repairer Productivity Declines as Repair Complexity Grows (FIGURE 70) | SOURCE: CCC INFORMATION SERVICES INC., CCC NATIONAL INDUSTRY
0.00.51.0
1.52.02.53.03.54.0
$0.01-$
500.00
$500.01 t
o $1K
$1,000.01 t
o $2K
$2,000.01 t
o $3K
$3,000.01 t
o $4K
$4,000.01 t
o $5K
$5,000.01-$
10K
$10,000.01 &
Up
Tota
l
Labor Hours per Shop Day
Q4'16-Q3'17 Q4'17-Q3'18 Q4'18-Q3'19
Q4'16-Q3'17 Q4'17-Q3'18 Q4'18-Q3'19
0.0
0.5
1.0
1.5
2.0
2.5
3.0
$0.01-$
500.00
$500.01 t
o $1K
$1,000.01 t
o $2K
$2,000.01 t
o $3K
$3,000.01 t
o $4K
$4,000.01 t
o $5K
$5,000.01-$
10K
$10,000.01 &
Up
Tota
l
Labor Hours per Repair Day

77
CR
ASH
CO
UR
SE 2020 | TIME TO
INVE
ST
© 2020 CCC INFORMATION SERVICES INC. ALL RIGHTS RESERVED.
With younger vehicles experiencing some of the largest growth in total loss frequency, the average age of total loss vehicles has started to decline. The younger mix, as well as continued shifts towards more expensive vehicles such as light trucks and non-domestic vehicles, drove up the average total loss adjusted vehicle value in CY 2019 (see Figure 75). Total Loss Valuations — Vehicle Mix Statistics by Calendar Year (FIGURE 75)
SOURCE: CCC INFORMATION SERVICES INC., CCC NATIONAL INDUSTRY
CY 2015 CY 2016 CY 2017
CY 2017 less
Harvey CY2018 CY2019
Final Valuation Amt Avg $8,867 $8,943 $9,272 $9,125 $9,500 $9,861
% Chg from prior year 1.7% 0.9% 3.7% 2.0% 4.1% 3.8%
Avg Vehicle Age 10.01 9.87 9.64 9.73 9.66 9.60
Avg Odometer 119,079 116,839 113,965 114,768 114,196 113,566
Avg Mileage per Vehicle Year 11,894 11,834 11,817 11,800 11,822 11,833
Light Trucks % Vol 36.3% 36.6% 37.7% 37.5% 38.7% 40.0%
SUV's % Vol 19.9% 20.7% 22.2% 22.0% 23.3% 24.9%
Car Final Val Amt Avg $8,129 $8,042 $8,143 $8,041 $8,231 $8,437
% Chg from prior year 0.6% -1.1% 1.3% 0.0% 2.4% 2.5%
Truck Final Val Amt Avg $10,164 $10,506 $11,133 $10,925 $11,508 $11,986
% Chg from prior year 3.3% 3.4% 6.0% 4.0% 5.3% 4.2%
Collision % 62.9% 61.0% 59.9% 61.3% 62.8% 63.3%
Comprehensive % 25.9% 24.5% 16.7% 14.8% 14.1% 13.8%
Liability % 11.2% 14.5% 23.4% 23.9% 23.0% 22.9%
Collision Adj Vehicle Value Avg $9,817 $9,806 $10,000 $10,000 $10,399 $10,771
Comprehensive Adj Vehicle Value Avg $8,833 $9,080 $10,116 $9,357 $9,576 $9,916
Liability Adj Vehicle Value Avg $5,874 $5,906 $6,067 $6,067 $6,316 $6,584
Asian Vehicles % Vol 45.4% 47.2% 48.4% 48.5% 49.5% 50.1%
Domestic Vehicles % Vol 46.2% 44.1% 42.7% 42.6% 41.6% 40.7%
European Vehicles % Vol 8.4% 8.7% 8.9% 8.9% 8.9% 9.2%
Asian Veh Final Val Amt Avg $9,028 $8,941 $9,051 $8,943 $9,202 $9,438
% Chg from prior year -0.2% -1.0% 1.2% 0.0% 2.9% 2.6%
Domestic Veh Final Val Amt Avg $8,038 $8,270 $8,769 $8,608 $9,118 $9,590
% Chg from prior year 3.2% 2.9% 6.0% 4.1% 5.9% 5.2%
European Veh Final Val Amt Avg $12,175 $12,162 $12,944 $12,580 $12,879 $13,273
% Chg from prior year 1.5% -0.1% 6.4% 3.4% 2.3% 3.1%
Theft % Vol 1.4% 1.4% 1.3% 1.4% 1.3% 1.3%
Vehicles Current Yr & Newer % 2.4% 2.5% 2.6% 2.5% 2.2% 2.1%
Vehicles 1-3 Years % 11.8% 13.2% 14.4% 14.1% 14.6% 14.3%
Vehicles 4-6 Years % 12.2% 14.0% 16.2% 16.0% 17.8% 19.2%
Vehicles 7 Years & Older % 73.6% 70.3% 66.8% 67.4% 65.4% 64.3%
Luxury % Vol 13.7% 14.1% 14.5% 14.5% 14.4% 14.7%
As Repair Costs Have Risen, So Too Has Total Loss Frequency
Higher vehicle repair costs and longer-lasting vehicles are key factors behind the continued increase in vehicle total loss frequency. The percent of vehicle appraisals flagged total loss has grown from 14 percent in CY 2013 to 19.2 percent in CY 2019 (see Figure 73). Total loss frequency for non-comprehensive losses has risen nearly 5 full percentage points during that same period, with vehicles four years and younger seeing the largest growth rate over the last five years (see Figure 74).
Percent of Vehicle Appraisals Flagged Total Loss CY2013-CY2019 (FIGURE 73)
SOURCE: CCC INFORMATION SERVICES INC., CCC NATIONAL INDUSTRY
0.0%
5.0%
10.0%
15.0%
20.0%
25.0%
CY2013 CY2014 CY2015 CY2016 CY2017 CY2018 CY2019
Non-Comprehensive Losses All Loss Categories
Percent of Non-Comprehensive Repairable Appraisals Flagged Total Loss by Vehicle Age (FIGURE 74) | SOURCE: CCC INFORMATION SERVICES INC.
0.0%5.0%
10.0%15.0%
20.0%25.0%30.0%35.0%40.0%45.0%50.0%
CurrentYear orNewer
1YearOld
2YearsOld
3YearsOld
4YearsOld
5YearsOld
6YearsOld
7YearsOld
8YearsOld
9YearsOld
10YearsOld
11YearsOld
12YearsOld
13YearsOld
14YearsOld
15YearsOld
16YearsOld
TOTALPlus
CY2015 CY2016 CY2017 CY2018 CY2019
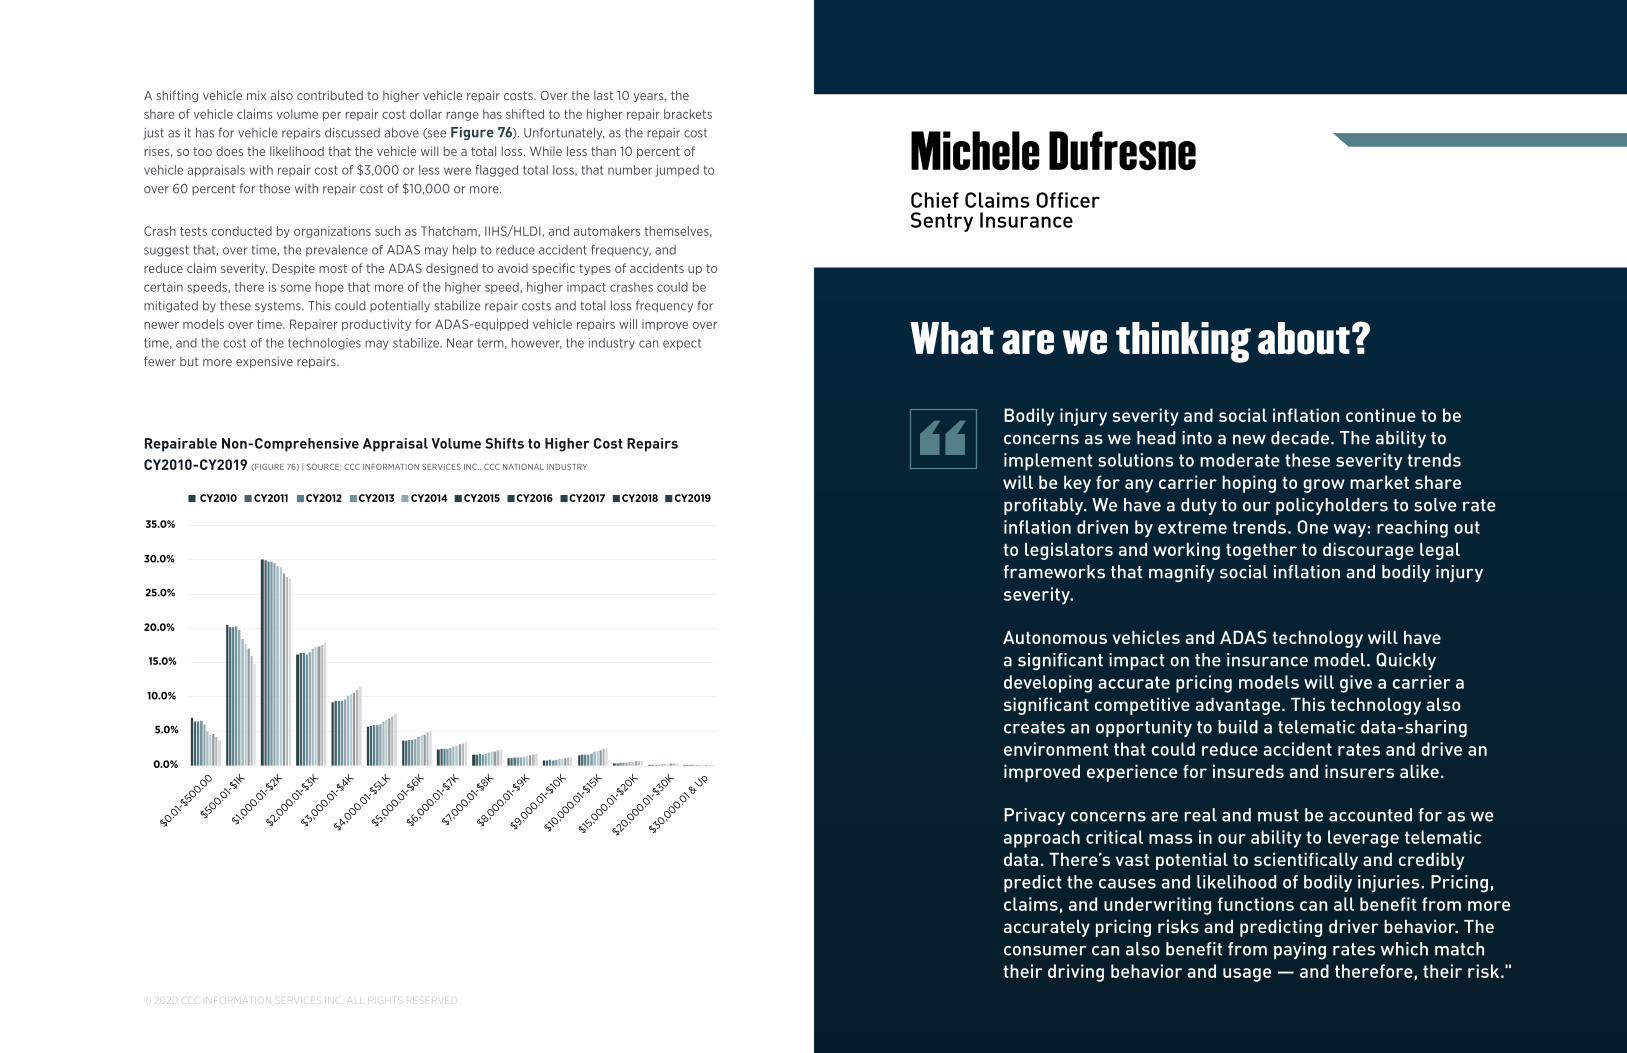
79
CR
ASH
CO
UR
SE 2020 | TIME TO
INVE
ST
© 2020 CCC INFORMATION SERVICES INC. ALL RIGHTS RESERVED.
A shifting vehicle mix also contributed to higher vehicle repair costs. Over the last 10 years, the share of vehicle claims volume per repair cost dollar range has shifted to the higher repair brackets just as it has for vehicle repairs discussed above (see Figure 76). Unfortunately, as the repair cost rises, so too does the likelihood that the vehicle will be a total loss. While less than 10 percent of vehicle appraisals with repair cost of $3,000 or less were flagged total loss, that number jumped to over 60 percent for those with repair cost of $10,000 or more.
Crash tests conducted by organizations such as Thatcham, IIHS/HLDI, and automakers themselves, suggest that, over time, the prevalence of ADAS may help to reduce accident frequency, and reduce claim severity. Despite most of the ADAS designed to avoid specific types of accidents up to certain speeds, there is some hope that more of the higher speed, higher impact crashes could be mitigated by these systems. This could potentially stabilize repair costs and total loss frequency for newer models over time. Repairer productivity for ADAS-equipped vehicle repairs will improve over time, and the cost of the technologies may stabilize. Near term, however, the industry can expect fewer but more expensive repairs.
Repairable Non-Comprehensive Appraisal Volume Shifts to Higher Cost Repairs CY2010-CY2019 (FIGURE 76) | SOURCE: CCC INFORMATION SERVICES INC., CCC NATIONAL INDUSTRY
0.0%
5.0%
10.0%
15.0%
20.0%
25.0%
30.0%
35.0%
$0.01-$
500.00
$500.01-$
1K
$1,000.01-$
2K
$2,000.01-$
3K
$3,000.01-$
4K
$4,000.01-$
5LK
$5,000.01-$
6K
$6,000.01-$
7K
$7,000.01-$
8K
$8,000.01-$
9K
$9,000.01-$
10K
$10,000.01-$
15K
$15,0
00.01-$20
K
$20,000.01-$
30K
$30,000.01 &
Up
CY2010 CY2011 CY2012 CY2013 CY2014 CY2015 CY2016 CY2017 CY2018 CY2019 “Bodily injury severity and social inflation continue to be concerns as we head into a new decade. The ability to implement solutions to moderate these severity trends will be key for any carrier hoping to grow market share profitably. We have a duty to our policyholders to solve rate inflation driven by extreme trends. One way: reaching out to legislators and working together to discourage legal frameworks that magnify social inflation and bodily injury severity.
Autonomous vehicles and ADAS technology will have a significant impact on the insurance model. Quickly developing accurate pricing models will give a carrier a significant competitive advantage. This technology also creates an opportunity to build a telematic data-sharing environment that could reduce accident rates and drive an improved experience for insureds and insurers alike.
Privacy concerns are real and must be accounted for as we approach critical mass in our ability to leverage telematic data. There’s vast potential to scientifically and credibly predict the causes and likelihood of bodily injuries. Pricing, claims, and underwriting functions can all benefit from more accurately pricing risks and predicting driver behavior. The consumer can also benefit from paying rates which match their driving behavior and usage — and therefore, their risk."
What are we thinking about?
Michele DufresneChief Claims OfficerSentry Insurance

81
CR
ASH
CO
UR
SE 2020 | TIME TO
INVE
ST
“ When I was hired by CCC as the Vice President of Quality Repair and Market Development, the position did not previously exist. The company decided to create a role within the organization signifying the importance and CCC’s commitment to support customers’ desire for consistent, quality repairs. What role can an information provider play in repair quality? The obvious and easy answer is information, but the more complex answer is delivering solutions that assist industry stakeholders — repairers, insurers, independent appraisers, OEMs, and part suppliers — throughout the process. It starts with the first notice of accident (FNOA) and continues through repair planning, repairing the vehicle and finishing with the delivery of the vehicle to the owner. Why was this role created? Our customers’ needs have changed as vehicle technology has rapidly evolved. Today’s car isn’t the 1983 Oldsmobile 88 that
During the repair plan process, it is critical to identify the advanced driver assistance systems (ADAS) adversely impacted and repair procedures for the damaged parts, while simultaneously documenting these steps for repair quality and consistency."
by Dan Risley
A NEW ROLE
it arrives on their premises. Conversely, the insurance carrier could assess if the vehicle was likely a total loss based upon the images captured at the accident scene. These are just a few examples as to how technology is helping to deliver a quality repair and better customer experience.
Once the vehicle arrives at the shop, the various touch points impacting the quality of the repair grow exponentially. During the repair plan process, it is critical to identify the advanced driver assistance systems (ADAS) adversely impacted and repair procedures for the damaged parts, while simultaneously documenting these steps for repair quality and consistency. The use of products such as Repair Methods provides the user with repair procedures once the decision to make a repair or replace a part has been made.
Throughout the repair process, it has become an essential part of every repair to document the 5 Ws (who, what, when, where and why).
Who performed repairs on the vehicle?
• Identify the technician who performed the scanning and calibrations.
• Identify the technician who performed the sectioning and welds.
What repairs were completed?
• Capture images of all the work performed throughout the repair process.
• Document quality control procedures and identification as to who verified the quality.
When were the repairs completed?
• Document when or if pre- and post-repair scanning was performed.
• Document dates and time stamps of the repair.
I repaired in my dad’s shop 30 years ago. In the 80’s, the industry wasn’t as advanced and most of us were satisfied with the advent of computers and electronic estimating. Remember when EzEst was the next big thing? We have come a long way since those days.
When you hear the words “repair quality” it is logical to automatically default to thinking of the vehicle repair at the collision repair facility. I am going to challenge that thinking and conditioned response. Repair quality doesn’t start when the technician disassembles the vehicle. Repair quality starts before the vehicle arrives at the collision repair facility.
When a vehicle is in an accident, the first notice of loss (FNOL) historically involves the insured notifying their insurance agent and filing a claim. Today, the technology in many vehicles is changing that paradigm: FNOL is now the FNOA. CCC’s announcement regarding our partnership with Volvo Cars is a great example of this shift. In these situations, the car manufacturer is the first entity notified of an incident. This is the beginning of the “repair quality” chain and a philosophical change to the claims handling process. The industry was accustomed to being reactionary, waiting for the customer to notify the insurance company. Today, technology is enabling the car manufacturer to immediately reach out to the vehicle owner, verify if the occupant(s) are OK, and provide CCC products which capture pertinent information at the scene of the accident and allow the vehicle owner to notify their insurance carrier of their accident and schedule an appointment to begin repairs. All of this can be completed before the vehicle owner leaves the scene of the accident. In theory, the collision repairer could order the parts for this vehicle before
Dan Risley Vice President, Quality Repair and Market Development, CCC
ABOUT THE AUTHOR

83
Continued
A NEW ROLEshop an opportunity to audit repairs and an opportunity to coach their technicians in real time.
We recognize the need for collision repairers to have documentation that supports the entirety of the repair. This documentation is necessary at the time of the repair, and it may be even more important after their customer leaves the repair facility.
Remember, repairers, insurers, independent appraisers, OEMs, and part suppliers all help in providing a seamless experience in repairing vehicles. CCC remains committed to building, enhancing and delivering products that meet the needs of the industry today with a watchful eye to the future.
Where were the repairs completed?
• Identify the location of the sectioning performed
• Identify welds, welding and/or bonding procedures locations.
Why were specific repairs completed or not performed?
• Document the decision-making process including unrelated damage that was not repaired.
To assist repairers in documenting the 5 Ws, we offer a product called CCC® Checklist. In my opinion, every shop in the country should be using a product like Checklist. It gives the shop owner information when questions arise regarding a repair and provides the “
At Liberty Mutual, we spend a lot of our time thinking about innovation and how we can transform our customers’ experience with us. Consumer expectations for service and personal transportation are changing and along with that, we’re changing to modernize what we can deliver and how we deliver it."
How do you/your company spend your time?
Scott KohlVice President & Manager, APD Field Operations, Global Retail MarketsLiberty Mutual Insurance

85
CCC INSIGHTC
RA
SH C
OU
RSE 2020 | TIM
E TO IN
VES
T
With new vehicle sales exceeding 17 million each year for the past five years, many more insurance claims and vehicle repairs are for newer model year vehicles. As of CY 2019, vehicles of model years 2016 through 2020 accounted for 34.4 percent of all appraisals generated (including those flagged total loss), and for 42.7 percent of those repaired (see Figure 77). Many of these vehicles include options such as automatic braking, crash warning or avoidance systems, parking assist, lane departure warning, and more. Unfortunately, when a vehicle is equipped with these features, additional repair requirements related to them may also be driving up repair costs and subsequently total loss frequency.
More than ever before it is essential for the automotive claims and collision repair industries to stay current on new technologies, tooling, and training. Ensuring the vehicle repair is completed in a manner that follows recommended repair procedures can also head off any potential unplanned returns of the vehicle and leave the ever-more demanding customer with a more expensive and longer repair time than anticipated.
Repairing a vehicle and ensuring it is returned to its owner in pre-accident condition has never been easy. As more computers, sensors, substrate metals, new welding and joining techniques, and more are added to vehicles, the repair process has become even more challenging. Each vehicle accident is different and has its own unique characteristics. Repairers must subsequently develop a unique set of steps or repair plan for each individual repair. With additional requirements based on the construction and electronic content of the vehicle itself, the insurance company, OE certified program, and/or any regulatory requirements for documentation, there could be potentially millions of combinations of process steps required to properly complete a repair. Ensuring processes exist to check-off and document the specific steps required for each type of repair has become more important than ever — not only to complete a proper repair, but to also have the documentation to prove it.
CY2019 Vehicle Claim and Repair Volumes by Vehicle Age Group (FIGURE 77)
SOURCE: CCC INFORMATION SERVICES INC., CCC NATIONAL INDUSTRY
0%10%20%30%40%50%60%70%80%90%
100%
All VehicleAppraisals
Repairable VehicleAppraisals
Repaired Vehicles Total Loss Vehicles
Current Yr or Newer Group 1 - 3 Years Old 4 - 6 Years Old 7 Years and Older
The sharp drop-off in new vehicle sales that occurred with the last recession slowed the pace at which new automotive technology hit the street.

87
CR
ASH
CO
UR
SE 2020 | TIME FO
R SE
RVIC
E03 TIME FORSERVICEHUMANIZING THE EXPERIENCE
Rising repair costs, higher total loss frequency and costs, and longer repair times have added more pressure to an industry struggling to keep up with growing consumer demand to turn an unpleasant, disruptive experience into a satisfying one.
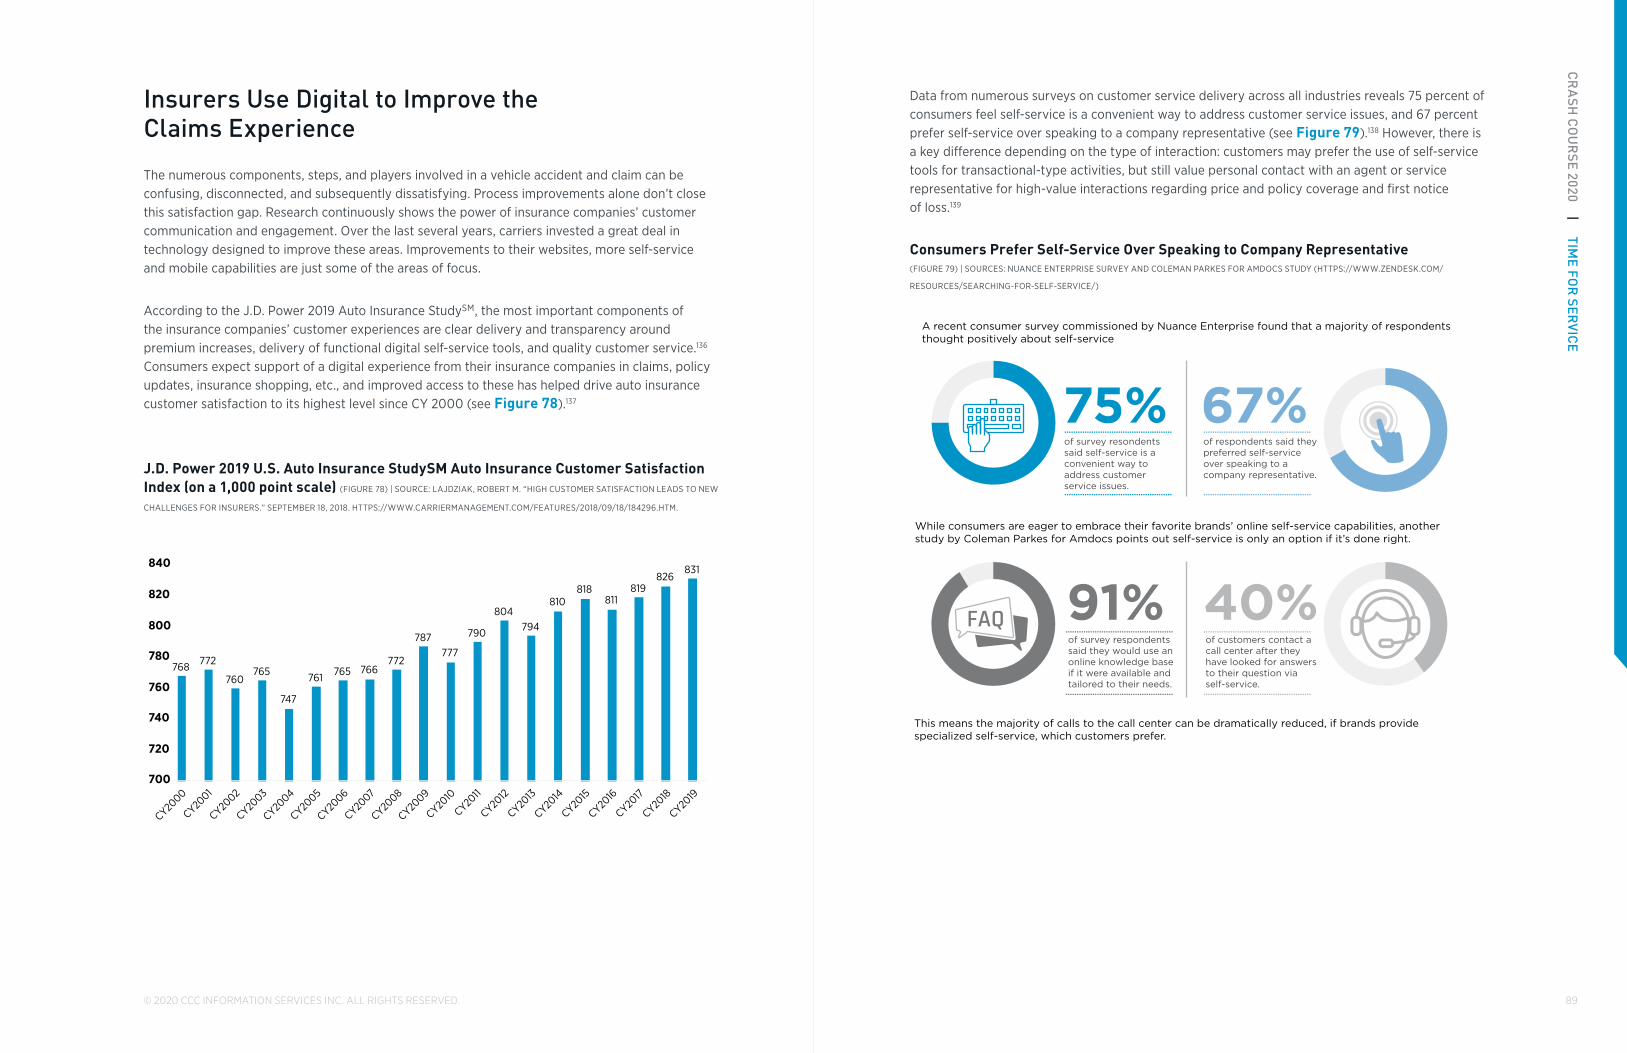
89
CR
ASH
CO
UR
SE 2020 | TIME FO
R SE
RVIC
E
© 2020 CCC INFORMATION SERVICES INC. ALL RIGHTS RESERVED.
Data from numerous surveys on customer service delivery across all industries reveals 75 percent of consumers feel self-service is a convenient way to address customer service issues, and 67 percent prefer self-service over speaking to a company representative (see Figure 79).138 However, there is a key difference depending on the type of interaction: customers may prefer the use of self-service tools for transactional-type activities, but still value personal contact with an agent or service representative for high-value interactions regarding price and policy coverage and first notice of loss.139
Consumers Prefer Self-Service Over Speaking to Company Representative (FIGURE 79) | SOURCES: NUANCE ENTERPRISE SURVEY AND COLEMAN PARKES FOR AMDOCS STUDY (HTTPS://WWW.ZENDESK.COM/
RESOURCES/SEARCHING-FOR-SELF-SERVICE/)
While consumers are eager to embrace their favorite brands’ online self-service capabilities, another study by Coleman Parkes for Amdocs points out self-service is only an option if it’s done right.
This means the majority of calls to the call center can be dramatically reduced, if brands provide specialized self-service, which customers prefer.
A recent consumer survey commissioned by Nuance Enterprise found that a majority of respondents thought positively about self-service
of survey resondents said self-service is a convenient way to address customer service issues.
of respondents said they preferred self-service over speaking to a company representative.
of survey respondents said they would use an online knowledge base if it were available and tailored to their needs.
of customers contact a call center after they have looked for answers to their question via self-service.
75% 67%
91% 40%
Insurers Use Digital to Improve the Claims Experience
The numerous components, steps, and players involved in a vehicle accident and claim can be confusing, disconnected, and subsequently dissatisfying. Process improvements alone don’t close this satisfaction gap. Research continuously shows the power of insurance companies’ customer communication and engagement. Over the last several years, carriers invested a great deal in technology designed to improve these areas. Improvements to their websites, more self-service and mobile capabilities are just some of the areas of focus.
According to the J.D. Power 2019 Auto Insurance StudySM, the most important components of the insurance companies’ customer experiences are clear delivery and transparency around premium increases, delivery of functional digital self-service tools, and quality customer service.136 Consumers expect support of a digital experience from their insurance companies in claims, policy updates, insurance shopping, etc., and improved access to these has helped drive auto insurance customer satisfaction to its highest level since CY 2000 (see Figure 78).137
J.D. Power 2019 U.S. Auto Insurance StudySM Auto Insurance Customer Satisfaction Index (on a 1,000 point scale) (FIGURE 78) | SOURCE: LAJDZIAK, ROBERT M. “HIGH CUSTOMER SATISFACTION LEADS TO NEW
CHALLENGES FOR INSURERS.” SEPTEMBER 18, 2018. HTTPS://WWW.CARRIERMANAGEMENT.COM/FEATURES/2018/09/18/184296.HTM.
768 772
760765
747
761 765 766772
787777
790
804794
810818
811819
826831
700
720
740
760
780
800
820
840
CY2000
CY2001
CY2002
CY2003
CY2004
CY2005
CY2006
CY2007
CY2008
CY2009
CY2010
CY2011
CY2012
CY2013
CY2014
CY2015
CY2016
CY2017
CY2018
CY2019
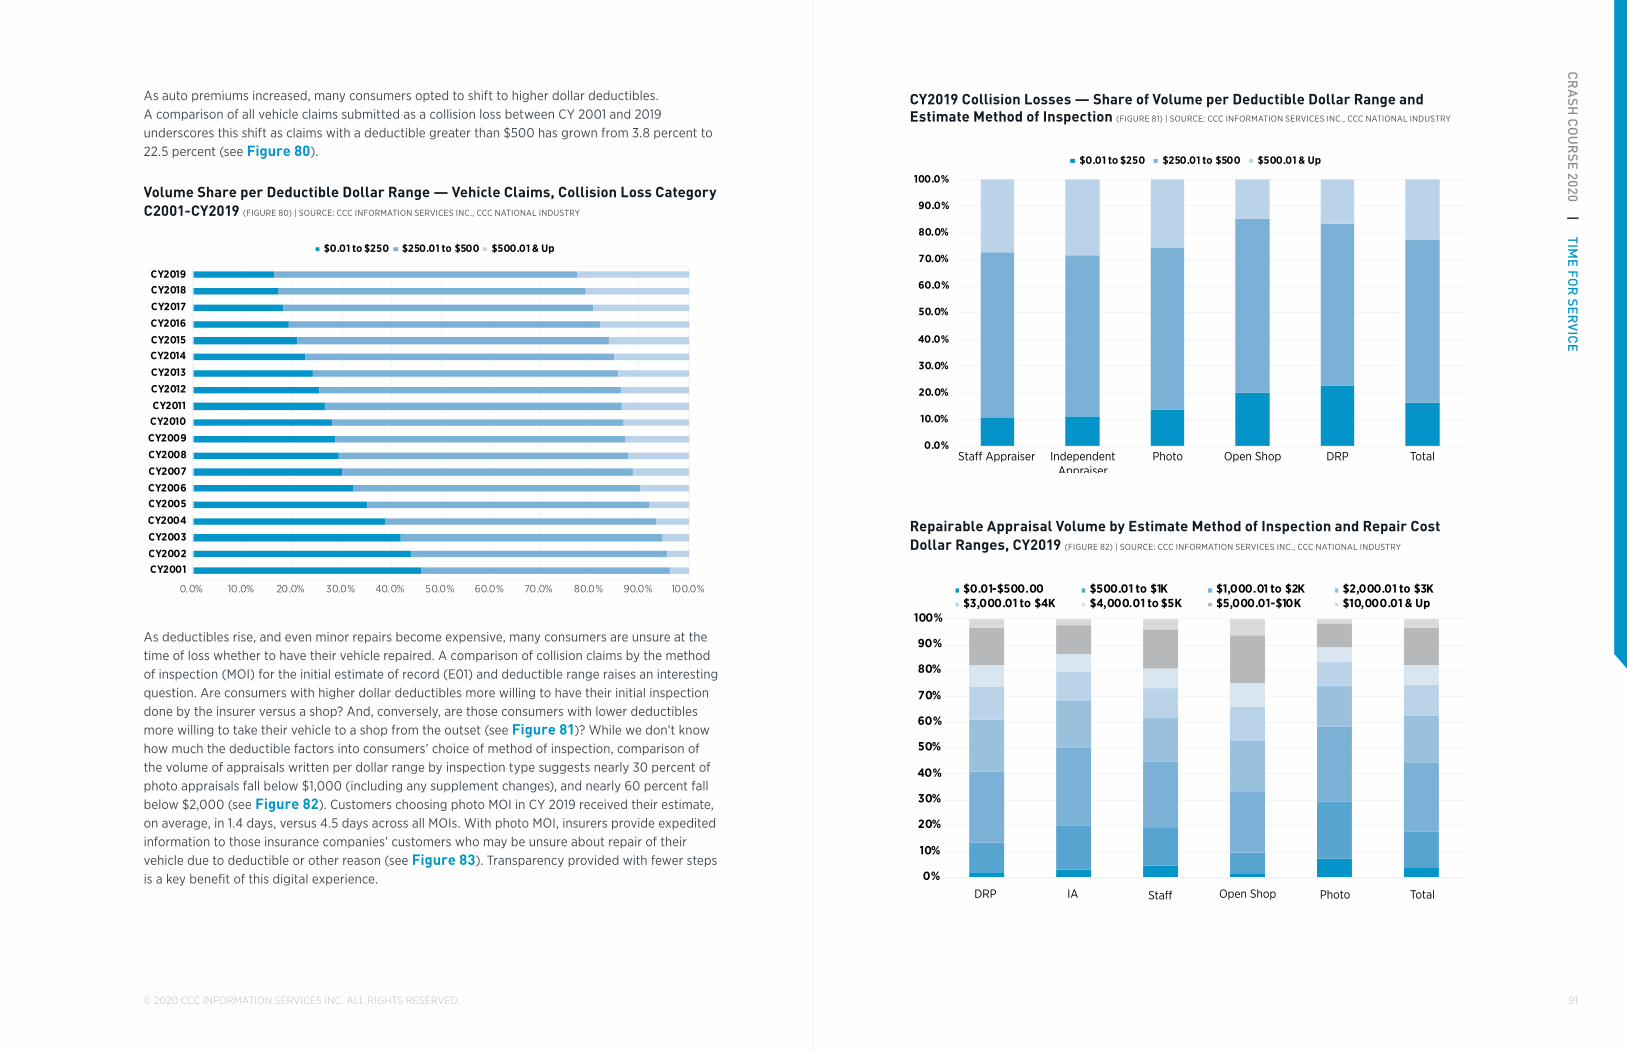
91
CR
ASH
CO
UR
SE 2020 | TIME FO
R SE
RVIC
E
© 2020 CCC INFORMATION SERVICES INC. ALL RIGHTS RESERVED.
CY2019 Collision Losses — Share of Volume per Deductible Dollar Range and Estimate Method of Inspection (FIGURE 81) | SOURCE: CCC INFORMATION SERVICES INC., CCC NATIONAL INDUSTRY
0.0%
10.0%
20.0%
30.0%
40.0%
50.0%
60.0%
70.0%
80.0%
90.0%
100.0%
$0.01 to $250 $250.01 to $500 $500.01 & Up
Sta� Appraiser IndependentAppraiser
Photo Open Shop DRP Total
Repairable Appraisal Volume by Estimate Method of Inspection and Repair Cost Dollar Ranges, CY2019 (FIGURE 82) | SOURCE: CCC INFORMATION SERVICES INC., CCC NATIONAL INDUSTRY
0%
10%
20%
30%
40%
50%
60%
70%
80%
90%
100%
$0.01-$500.00 $500.01 to $1K $1,000.01 to $2K $2,000.01 to $3K$3,000.01 to $4K $4,000.01 to $5K $5,000.01-$10K $10,000.01 & Up
DRP IA Sta� Open Shop Photo Total
As auto premiums increased, many consumers opted to shift to higher dollar deductibles. A comparison of all vehicle claims submitted as a collision loss between CY 2001 and 2019 underscores this shift as claims with a deductible greater than $500 has grown from 3.8 percent to 22.5 percent (see Figure 80).
Volume Share per Deductible Dollar Range — Vehicle Claims, Collision Loss Category C2001-CY2019 (FIGURE 80) | SOURCE: CCC INFORMATION SERVICES INC., CCC NATIONAL INDUSTRY
0.0% 10.0% 20.0% 30.0% 40.0% 50.0% 60.0% 70.0% 80.0% 90.0% 100.0%
CY2001CY2002CY2003CY2004CY2005CY2006CY2007CY2008CY2009CY2010CY2011CY2012CY2013CY2014CY2015CY2016CY2017CY2018CY2019
$0.01 to $250 $250.01 to $500 $500.01 & Up
As deductibles rise, and even minor repairs become expensive, many consumers are unsure at the time of loss whether to have their vehicle repaired. A comparison of collision claims by the method of inspection (MOI) for the initial estimate of record (E01) and deductible range raises an interesting question. Are consumers with higher dollar deductibles more willing to have their initial inspection done by the insurer versus a shop? And, conversely, are those consumers with lower deductibles more willing to take their vehicle to a shop from the outset (see Figure 81)? While we don’t know how much the deductible factors into consumers’ choice of method of inspection, comparison of the volume of appraisals written per dollar range by inspection type suggests nearly 30 percent of photo appraisals fall below $1,000 (including any supplement changes), and nearly 60 percent fall below $2,000 (see Figure 82). Customers choosing photo MOI in CY 2019 received their estimate, on average, in 1.4 days, versus 4.5 days across all MOIs. With photo MOI, insurers provide expedited information to those insurance companies’ customers who may be unsure about repair of their vehicle due to deductible or other reason (see Figure 83). Transparency provided with fewer steps is a key benefit of this digital experience.

93
CR
ASH
CO
UR
SE 2020 | TIME FO
R SE
RVIC
E
© 2020 CCC INFORMATION SERVICES INC. ALL RIGHTS RESERVED.
Growth within the hyper-competitive private passenger auto insurance market remains a challenge. Market share continues to shift to the top 10 carriers (see Figure 85), and data prepared by CB Insights reveals the number of property & casualty insurance filers between 2008 and 2018 fell nearly 10 percent (see Figure 86), and only 71 carriers have net written premiums of more than $1 billion.142
Share of Private Passenger Auto Direct Premiums Written (FIGURE 85)
SOURCE: NAIC, AUTO INSURANCE REPORT
0.0%
10.0%
20.0%
30.0%
40.0%
50.0%
60.0%
70.0%
80.0%
90.0%
100.0%
Total Share Top 5 Total Share Top 10 Total Share Top 15 Total Share Top 25
CY2000 CY2013 CY2014 CY2015 CY2016 CY2017 CY2018
Number of property & casualty insurance filers, CY2008-CY2018 (FIGURE 86)
SOURCE: NAIC, A.M. BEST (CB INSIGHTS “FUTURE OF INSURANCE”)
2,842 2,831
2,794 2,769
2,743
2,706
2,666 2,639
2,620 2,606 2,600
CY2008 CY2009 CY2010 CY2011 CY2012 CY2013 CY2014 CY2015 CY2016 CY2017 CY2018
CY2019 Percent of CCC Repairable Appraisals where Last Estimate Assignment Sent to Estimate Upload Within Specified Hour Range and Overall Average Days Last Estimate Assignment Sent to Estimate Upload (FIGURE 83) | SOURCE: CCC INFORMATION SERVICES INC., CCC NATIONAL INDUSTRY
11.5%
8.4%
22.7%
18.1%
52.0%
20.9%
24.4%
25.1%
47.8%
25.9%
32.6%
34.4%
22.8%
31.7%
20.7%
22.8%
8.7%
20.8%
41.3%
34.8%
8.7%
33.2%
6.8%
23.9%
0% 10% 20% 30% 40% 50% 60% 70% 80% 90% 100%
DRP
IA
STAFF
OPEN SHOP
PHOTO
Total
% <= 12 Hrs % 12-48 Hrs % 48-120 Hrs % > 120 Hrs
7.8
4.8
2.0
6.2
1.4
4.5
DRP
IA
STAFF
OPEN SHOP
PHOTO
Total
Overall Last Estimate
Assignment Sent to
Estimate Sent Days Avg
Customer retention is a huge benefit gained from improving digital channel experiences, yet there are additional benefits that help insurance carriers with their loss adjustment expenses. Data from J.D. Power 2019 U.S. Auto Claims Satisfaction Survey reveals that insurers improved or remained consistent on all factors that comprise the total claim satisfaction score: first notice of loss, claim servicing, estimation process, repair process, rental experience, and settlement.140 Faster cycle time across the entire claim — from making the second contact after first notice of loss, making the initial estimate, sending the vehicle to the repair facility, informing the customer of a settlement offer, and making the initial payment.141 From the 2017 and 2018 studies, J.D. Power found satisfaction with the estimation process rose from 859 to 871 if insurers used the photos or videos provided by the customer, but if the carrier still had to send out an adjuster, satisfaction fell to 839 (see Figure 84).
J.D. Power Auto Claims Satisfaction by MOI (2017 + 2018) (FIGURE 84)
SOURCE: SCHMITT, KYLE. “WHY CARRIERS STRUGGLE TO DIFFERENTIATE WITH DIGITAL AND END UP PAYING A PENALTY.” WWW.JDPOWER.
COM, MAY 31, 2019.
869 867871
880
871 870867
862
869
859
866
853858
863
841
851
839
861
852
837834
Index FNOL Estimation Body Shop Rental Car Claim Servicing Settlement
Photo Estimate Only Traditional MOI Tried Photo Estimate, but needed traditional MOI

95
CR
ASH
CO
UR
SE 2020 | TIME FO
R SE
RVIC
E
© 2020 CCC INFORMATION SERVICES INC. ALL RIGHTS RESERVED.
Digital experiences infused with photo and AI can help insurers at first notice of loss better identify whether the vehicle is likely repairable or not, and identify what is the most appropriate MOI based, in part, on their customer and vehicle characteristics. For example, CCC Smart Total Loss™ solution can help insurers more accurately predict if a vehicle is likely repairable or a total loss with a single photo. And, the CCC® Smart Estimate solution applies CCC’s estimating logic and AI to vehicle collision photos to predict repair requirements and suggest estimate lines — including parts likely required to complete the repair — for human estimators to review, edit, and advance. As vehicles become more connected, the data from the vehicle itself may supplement digital technology such as photos, and AI, to enhance decision-making precision and further streamlined claims processes. Insurers want and need to make things simple for their customers but have limited opportunities given the nature of the product they are selling. Claims is a key opportunity — but the challenge is there are numerous entities that must be relied on to deliver a quality experience — whether that is the repairer, the rental car company, the parts supplier, etc.
Understanding which technologies to implement and how to implement to help with the handoff between parties and to manage the performance of those business partners is a challenge. Enabling processes to support those handoffs becomes critical as insurance companies’ consumers expect the claims experience to be as seamless as ordering something on Amazon. The key difference is that the accident was not an experience the consumer chose. Technology helps reduce the time spent by claims processors on the mundane, administrative nature of claims, frees them up and enables them to spend more time on the human-touch, customer-service-oriented aspects of claims processing that technology can’t yet (and may never) replace. Providing the human support and empathy at the right points while facilitating the digital experience remains job one.
Transparency of RepairRepairers are central to delivering consumer claim satisfaction and continue to embrace tools and processes to meet expectations. With National Safety Council data reporting accident frequency per driver in the U.S. at 11 percent in 2017,143 very few consumers have regular or repeated experience with a vehicle accident and subsequent repair. Among the top reasons that a consumer selects a collision repairer per data from IMR Inc.’s are ‘Good Prior Experience’ (32.6 percent), ‘Recommendation’ (13.1 percent), and ‘Convenient Location’ (12.4 percent).144 Compare this to broader consumer survey data showing who internet users trust for recommendations and what becomes clear is repairers must rely more than ever on good reviews from prior repairers’ customers by word of mouth or via online reviews (see Figure 87). Analysis of customer satisfaction data conducted by CCC shows quality repairs and few returns lead to higher scores; yet, if the shop wants positive customer recommendations, it needs to make sure the service is great and customers are kept informed. In other words, quality is table stakes — service gets repeat business.
In order to better understand whether there are characteristics of repairs where the customer returns the vehicle for additional work post repair pickup, CCC completed analysis of collision loss front impact DRP repairs from Q1 CY 2019 (time period selected to allow for customers to have time to use vehicles post vehicle pick-up). Figure 88 provides a comparison of metrics that illustrate several differences among the 10.6 percent of the repairs returned to the repairer after the vehicle...
Transparency of Repair is continued on page 99
“Who Do U.S. Internet Users Trust for Recommendations When Shopping?” (% of respondents, by generation, February 2019) (FIGURE 87)
SOURCE: ORACLE, “ONE SIZE DOESN’T FIT ALL,” JULY 30, 2019. WWW.EMARKETER.COM.
0%
10%
20%
30%
40%
50%
60%
70%
80%
90%
100%
Friends, family, colleagues Employee in a store Fellow consumers online Influencer
Gen Z (18-24) Millennials (25-39) Gen X (40-54) Baby Boomers (55-75)
Comparison of Repair KPIs for Vehicles Returned Post Vehicle Pick-up versus Vehicles Not Returned (FIGURE 88) | SOURCE: CCC INFORMATION SERVICES INC., CCC NATIONAL INDUSTRY
NOTE: COMPARISON CONDUCTED OF Q1 CY2019 DRP REPAIRS WITH COLLISION FRONT IMPACT RETURNED/NOT RETURNED
Ave Total Cost of Repairs $3,835 $5,260
% of Appraisals with Supplement(s) 88.2% 93.1%
Supplement % of Total Repair Cost 19.0% 22.9%
Labor % of Total Repair Cost 34.6% 32.2%
Avg Labor Hrs per Appraisal 25.8 32.6
Repair % of Total Labor Amt 35.5% 34.2%
Parts % of Total Repair Cost 48.7% 50.4%
Ave # of Parts Replaced per Appraisal 19 24.6
Non-OEM % of Part Amt 41.8% 38.0%
Misc % of Total Repair Cost 5.5% 7.0%
Vehicle In To Repairs Started Days Avg 0.7 1.0
Repairs Started to Repairs Completed Days Avg 9.0 12.6
Repairs Completed to Vehicle Out Days Avg 0.8 1.3
Vehicle In To Vehicle Out Days Avg 10.5 14.9
Labor Hrs per Repair Day 2.9 2.6
Labor Hrs per Shop Day 2.5 2.2
% of On Time Delivery 32.8% 29.5%
Not Returned Returned

97
CR
ASH
CO
UR
SE 2020 | TIME FO
R SE
RVIC
E
“In 2010, Gartner reported that 36 percent of companies competed primarily on the basis of customer experience. In 2020, that number is 90 percent. Nine of ten companies compete on the experience they deliver to a customer every day. This means that how you deliver on your customer’s expectations is what matters, and it’s more important than the price you charge.
In the aftermath of a vehicle accident, the idea of customer experience resonates. Consumers want and expect the claims vehicle repair or settlement process to be empowering, seamless, convenient, transparent, trustworthy, and responsive. So, what do collision market stakeholders need to be thinking about to deliver a great consumer experience
The (Magid) study found that ‘trust’ was ranked as the most important element in selecting a repair facility, and the element of trust also carried through to the repair and return of the vehicle."
by Michael Kolb
CUSTOMER EXPERIENCE TAKES CENTER STAGE
It’s easy to understand why trust is such an overwhelming component of satisfaction in collision repair. First, repair is a personal experience. For 90 percent of repairs, the vehicle is the primary vehicle in the household, 75 percent are owned (not leased), and 70 percent of consumers are using a shop for the first time. It’s disruptive and inconvenient, and with new cars costing more than $35,000 and being the second most expensive household expense, getting it repaired right is important.
Time needs to be taken with each repair to help the owner/consumer understand:
• What does the consumer know about today’s repair process and claims process? The consumer experience should build knowledge and confidence. Accidents and repair happen once every seven years for a vehicle. Taking time to help an inexperienced consumer understand the process will benefit the repair by setting proper expectations.
• What is damaged, how it will be repaired, and why is that important? The consumer experience needs to deliver transparency. Providing an estimate is the first step but explaining the estimate and answering every question a consumer has is critical. An experienced estimator can proactively answer questions and take the time to ensure the customer understands the severity and complexity of repair — and the intricacies of restoration.
• Why is the shop qualified to do the repair and who will be repairing it? The consumer experience needs to integrate authenticity and familiarity. Shops spend a lot of time training technicians, securing certifications, and investing in equipment to perform high-quality repairs. It’s worth it to take time to explain what the relevant plaques on the
and to be differentiated in the marketplace? Several things, including:
• Being customer-centric and evaluating the effectiveness of every touchpoint– online, on phone, and in-store.
• Having a mobile-first (digital) approach to engagement that seamlessly connects to in-store and on phone engagements.
• Collecting and analyzing customer feedback and integrating processes to close the gaps on failed engagements and continually reinforce good behavior.
• Developing ways for consumers to help themselves, meeting the 67 percent of consumers who prefer self-service over speaking to a company representative.
• Focusing on outcomes that result in quality, trust, transparency, and convenience.
And, in this day of mobile, digital, AI-infused engagement, this last element often means a human touch. As much as customers appreciate a seamless, connected, digital experience — they want it personal and curated and they want to have a human accessible in the event things break down
Establishing Trust
In 2019, CCC partnered with Magid, a consumer experience research firm, to perform a benchmark study on the state of collision repair. This study included 2,000 primary decision makers who experienced a collision repair in the previous 24 months and was representative of the U.S. population. From the study, there was one attribute that floated to the top in terms of importance in creating a satisfying consumer experience — Trust. The study found that ‘trust’ was ranked as the most important element in selecting a repair facility, and the element of trust also carried through to the repair and return of the vehicle.
Michael Kolb Vice President, Consumer Product Management, CCC
ABOUT THE AUTHOR

99
CR
ASH
CO
UR
SE 2020 | TIME FO
R SE
RVIC
E
© 2020 CCC INFORMATION SERVICES INC. ALL RIGHTS RESERVED.
Continued
CUSTOMER EXPERIENCE TAKES CENTER STAGE
• Integrating the proper technology that complements the people and process and enables the organization to achieve desired outcomes. The latest trends are systems and applications that connect seamlessly. As first notice of loss becomes a claim, and a claim becomes a repair, and repair becomes a restored vehicle, how are all of those activities and touchpoints between insurer, repair facility, and OEM handled? How is the consumer empowered and connected across the journey?
An industry executive once told me that successful digital transformation to evolve the consumer experience is like trying to change all four tires on a car that’s rolling down the highway at 65 miles an hour. There are lots of moving parts and you can’t pause your business to make the changes. You are trying to align your people, evolve your processes, and integrate your technology — all while innovation throws new things at you at an ever-increasing pace.
An area of focus at CCC is to help our customers keep the arrow aimed at their customers experiencing a collision repair. By using research to better understand the consumer mindset, we can help our repair customers implement technologies and best-in-class processes to deliver their desired consumer journey.
wall for their vehicle means and maybe even talk with a technician who has repaired a similar make or model.
• When it will be repaired and is the repair on-track? The consumer experience needs to be proactive and timely with communications, notifications, and messaging. We live on our phones, yet consumers today rarely make or accept phone calls. Find ways with intelligent texting and notifications to inform your customers about the repair, status, payment, and enable them to review your business post-repair.
Delivering on a customer experience that checks all of these boxes requires a customer experience strategy that simultaneously improves your business in three areas.
• Hiring and developing the right people at all levels of the organization. Your people are the lifeblood of your organization. Create a culture of trust and accountability and empower them to fulfil their role.
• Creating and rigorously following the right processes to deliver a consistent experience whether you are one location or hundreds of locations. Every business has its secret sauce for how it operates to deliver exceptional experiences. Scaling process to deliver consistent experiences may be difficult as location numbers increase, acquisitions happen, and employee turnover occurs.
Transparency of Repair continued...was picked up by the customer, versus those repairs that were not. For repairs returned, higher average repair cost, higher supplement frequency, higher parts replacements, longer overall cycle time, and lower shop productivity suggest these were more complex repairs than those repairs not returned. Not surprisingly, distribution of repairs returned by dollar range skewed towards the higher dollar repairs (see Figure 89).
Share of Repair Volume per Repair Cost Ranges: Vehicles Returned Post Vehicle Pick-up versus Vehicles Not Returned (FIGURE 89) | SOURCE: CCC INFORMATION SERVICES INC., CCC NATIONAL INDUSTRY
NOTE: COMPARISON CONDUCTED OF Q1 CY2019 DRP REPAIRS WITH COLLISION FRONT IMPACT RETURNED/NOT RETURNED
0.0% 5.0% 10.0% 15.0% 20.0% 25.0%
$0.01 to $500.00
$500.01 to $1,000.00
$1,000.01 to $2,000.00
$2,000.01 to $3,000.00
$3,000.01 to $4,000.00
$4,000.01 to $5,000.00
$5,000.01 to $6,000.00
$6,000.01 to $7,000.00
$7,000.01 to $8,000.00
$8,000.01 to $9,000.00
$9,000.01 to $10,000.00
$10,000.01 to $15,000.00
$15,000.01 to $20,000.00
$20,000.01 to $30,000.00
$30,000.01 & Higher
Returned Repaired Cnt Not Returned Repaired Cnt
Interestingly, the average vehicle model year for vehicles returned was 2013.8 versus 2013.7 for those not returned, and distribution by vehicle age group was also nearly identical. Roughly 39 percent of repairs for both vehicles returned and not returned were for model years 2016-2019. A pre-, in process-, and/or post-repair scan was included in 50 percent of the vehicle repairs not returned, versus 53 percent for those returned. A calibration was included 4.5 percent for those vehicles not returned versus 8.5 percent for vehicles returned. And while the specific details prompting each return were not available for analysis, a comparison of where in the appraisal process the calibration occurred helps underscore the overall vehicle and repair complexity that are potentially driving up return rates. Figure 90 compares the frequency which calibration was added in the orirignal estimate of record versus later supplements, and also shows what percent of the calibrations per estimate version included ‘dealer’ in their description: 16.7 percent of calibration entries were added in the third or higher supplement for vehicles returned post pick-up, 84 percent higher than the 9.1 percent added at the same time for vehicles not returned. Additionally, of the 16.7 percent added in the supplement S03-S99, 20.6 percent of those included ‘dealer’ in the line description. While the vehicles returned may not have been returned for reasons related to an electronic system that needed calibration, the data does minimally suggest that repairs returned tend to have a higher repair cost and include more specialized repair tasks than those not returned.
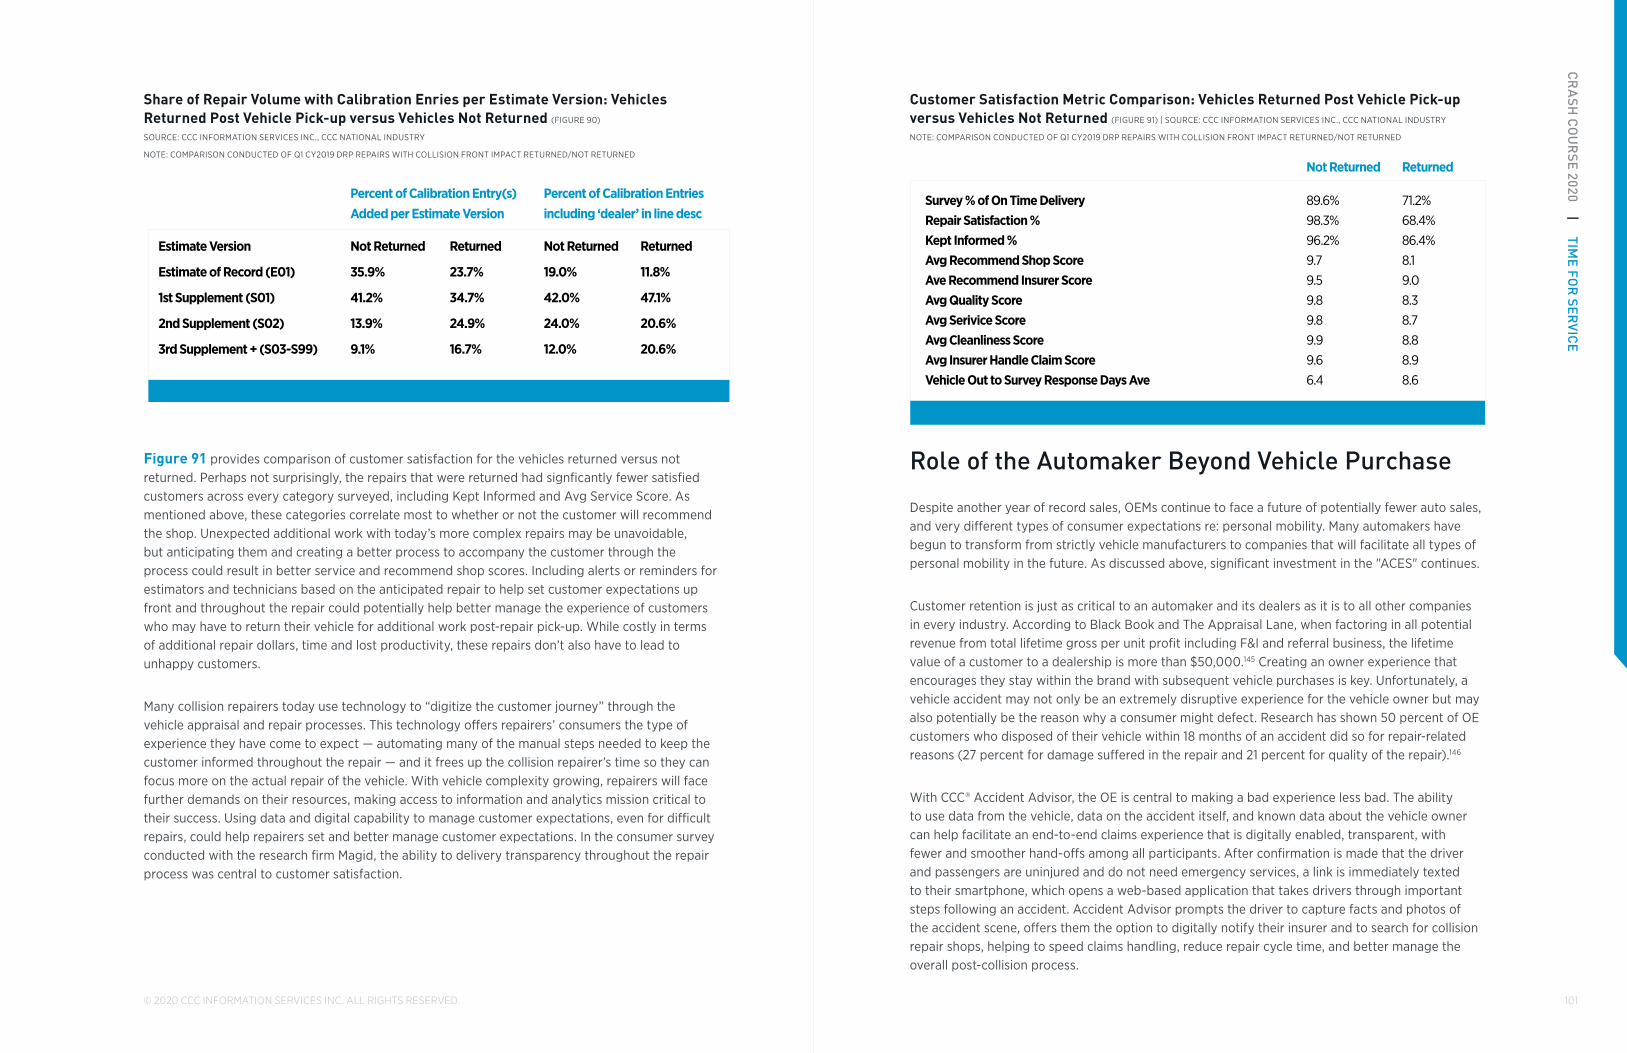
101
CR
ASH
CO
UR
SE 2020 | TIME FO
R SE
RVIC
E
© 2020 CCC INFORMATION SERVICES INC. ALL RIGHTS RESERVED.
Customer Satisfaction Metric Comparison: Vehicles Returned Post Vehicle Pick-up versus Vehicles Not Returned (FIGURE 91) | SOURCE: CCC INFORMATION SERVICES INC., CCC NATIONAL INDUSTRY
NOTE: COMPARISON CONDUCTED OF Q1 CY2019 DRP REPAIRS WITH COLLISION FRONT IMPACT RETURNED/NOT RETURNED
Survey % of On Time DeliveryRepair Satisfaction %Kept Informed %Avg Recommend Shop ScoreAve Recommend Insurer ScoreAvg Quality ScoreAvg Serivice ScoreAvg Cleanliness ScoreAvg Insurer Handle Claim ScoreVehicle Out to Survey Response Days Ave
89.6%98.3%96.2%9.79.59.89.89.99.66.4
71.2%68.4%86.4%8.19.08.38.78.88.98.6
ReturnedNot Returned
Role of the Automaker Beyond Vehicle Purchase
Despite another year of record sales, OEMs continue to face a future of potentially fewer auto sales, and very different types of consumer expectations re: personal mobility. Many automakers have begun to transform from strictly vehicle manufacturers to companies that will facilitate all types of personal mobility in the future. As discussed above, significant investment in the "ACES" continues.
Customer retention is just as critical to an automaker and its dealers as it is to all other companies in every industry. According to Black Book and The Appraisal Lane, when factoring in all potential revenue from total lifetime gross per unit profit including F&I and referral business, the lifetime value of a customer to a dealership is more than $50,000.145 Creating an owner experience that encourages they stay within the brand with subsequent vehicle purchases is key. Unfortunately, a vehicle accident may not only be an extremely disruptive experience for the vehicle owner but may also potentially be the reason why a consumer might defect. Research has shown 50 percent of OE customers who disposed of their vehicle within 18 months of an accident did so for repair-related reasons (27 percent for damage suffered in the repair and 21 percent for quality of the repair).146
With CCC® Accident Advisor, the OE is central to making a bad experience less bad. The ability to use data from the vehicle, data on the accident itself, and known data about the vehicle owner can help facilitate an end-to-end claims experience that is digitally enabled, transparent, with fewer and smoother hand-offs among all participants. After confirmation is made that the driver and passengers are uninjured and do not need emergency services, a link is immediately texted to their smartphone, which opens a web-based application that takes drivers through important steps following an accident. Accident Advisor prompts the driver to capture facts and photos of the accident scene, offers them the option to digitally notify their insurer and to search for collision repair shops, helping to speed claims handling, reduce repair cycle time, and better manage the overall post-collision process.
Share of Repair Volume with Calibration Enries per Estimate Version: Vehicles Returned Post Vehicle Pick-up versus Vehicles Not Returned (FIGURE 90)
SOURCE: CCC INFORMATION SERVICES INC., CCC NATIONAL INDUSTRY
NOTE: COMPARISON CONDUCTED OF Q1 CY2019 DRP REPAIRS WITH COLLISION FRONT IMPACT RETURNED/NOT RETURNED
Estimate Version
Estimate of Record (E01)
1st Supplement (S01)
2nd Supplement (S02)
3rd Supplement + (S03-S99)
Not Returned
35.9%
41.2%
13.9%
9.1%
Returned
23.7%
34.7%
24.9%
16.7%
Not Returned
19.0%
42.0%
24.0%
12.0%
Returned
11.8%
47.1%
20.6%
20.6%
Percent of Calibration Entry(s)Added per Estimate Version
Percent of Calibration Entriesincluding ‘dealer’ in line desc
Figure 91 provides comparison of customer satisfaction for the vehicles returned versus not returned. Perhaps not surprisingly, the repairs that were returned had signficantly fewer satisfied customers across every category surveyed, including Kept Informed and Avg Service Score. As mentioned above, these categories correlate most to whether or not the customer will recommend the shop. Unexpected additional work with today’s more complex repairs may be unavoidable, but anticipating them and creating a better process to accompany the customer through the process could result in better service and recommend shop scores. Including alerts or reminders for estimators and technicians based on the anticipated repair to help set customer expectations up front and throughout the repair could potentially help better manage the experience of customers who may have to return their vehicle for additional work post-repair pick-up. While costly in terms of additional repair dollars, time and lost productivity, these repairs don’t also have to lead to unhappy customers.
Many collision repairers today use technology to “digitize the customer journey” through the vehicle appraisal and repair processes. This technology offers repairers’ consumers the type of experience they have come to expect — automating many of the manual steps needed to keep the customer informed throughout the repair — and it frees up the collision repairer’s time so they can focus more on the actual repair of the vehicle. With vehicle complexity growing, repairers will face further demands on their resources, making access to information and analytics mission critical to their success. Using data and digital capability to manage customer expectations, even for difficult repairs, could help repairers set and better manage customer expectations. In the consumer survey conducted with the research firm Magid, the ability to delivery transparency throughout the repair process was central to customer satisfaction.

103
CR
ASH
CO
UR
SE 2020 | TIME FO
R SE
RVIC
E
“For thousands of consumers with light vehicle damage from driveway bumps and parking lot taps, the process for getting a repair estimate can be cumbersome. It’s also wildly different than the digital experiences they enjoy in other areas of their lives. Every day, many of us use our smartphones to pre-order and pay for our morning coffee at Starbucks®, book restaurant reservations through OpenTable®, and order just about anything through mass online retailers. Think about the process for getting an estimate from a body shop. It’s a multi-step, multi-day process, including:
1. Doing research
2. Reading reviews
When shops leverage photo estimating, several steps can be eliminated, and consumers get the added value of convenience — requesting and receiving estimates from anywhere, any time of day or night, while building a trusting relationship with the shop virtually."
by Bart Mazurek
PHOTO ESTIMATES CAN BUILD TRUST VIRTUALLY
or forgo the repair altogether. This last option is a reality for all shops, but that’s where customer service comes in.
What Repair Customers Say
Last year, CCC commissioned Magid, a consumer-centered research firm, to survey consumers about the repair experience. The results reveal that body shops should consider investing in soft skill development for the front of the shop. Magid’s mystery shopping research found that most auto shop employees are missing key opportunities to earn trust from their customers, including:
• Not calling customers by name
• Not reliably returning communication (online specifically)
• Not asking consumers if they have questions or concerns
• [Providing] little guidance regarding next steps
In order to build trust, the front office employees need to think more like service providers and less like technical experts. Customers will respond better if they are guided through the process. Staff should assume that customers do have questions, since they are out of their comfort zone in a repair facility, but they may not feel empowered to ask them. According to Magid, “providing consumers with answers to questions they didn’t even know they needed to ask will help build trust aspect and increase their confidence in the process.”
Technology Helps to Automate Smaller Repairs
A poor experience with the virtual interaction diminishes the likelihood of converting
3. Identifying a shop
4. Waiting for the shop to open
5. Calling the shop to schedule an appointment
6. Waiting for appointment day/time
7. Driving to shop
8. Waiting for estimate to be delivered
When shops leverage photo estimating, several steps can be eliminated, and consumers get the added value of convenience — requesting and receiving estimates from anywhere, any time of day or night, while building a trusting relationship with the shop virtually.
The entire process can take hours instead of days.
Are Consumers Ready?
For several years, my colleagues at CCC have been tracking photo-estimating usage and adoption. Our data shows that for Q3 2019, 14.9 percent of all insurance vehicle appraisals were written using a virtual or photo method of inspection, up from basically 0 percent in 2016. An even stronger example of the trend toward photo estimating is that some early adopters of the technology are using the photo channel for up to 70 percent of the auto estimates.
For shops, photo estimating holds a different value proposition: photo estimating can be a powerful lead generation tool. It works during and after-hours. Several steps are automated, including requesting an online estimate and sharing damage photos digitally. This keeps the process moving for eager consumers who want to quickly gauge the damage to their vehicle so they can decide if they want to make a claim, self-pay
Bart Mazurek Vice President, ASG Consulting, CCC
ABOUT THE AUTHOR
105© 2020 CCC INFORMATION SERVICES INC. ALL RIGHTS RESERVED.
Continued
PHOTO ESTIMATES CAN BUILD TRUST VIRTUALLY
generation of photo estimates in a timely and consistent manner. For example, have estimators write the photo-based estimates during known down times and reply to the customer in 24 hours (or less). Include a standard letter that answers the most common customer questions such as how to schedule a repair appointment and the shop’s hours. It’s possible that shops will have fewer low dollar appointments in the shop, but more overall low dollar estimates due to the online channel. Be prepared to handle the volume effectively. According to JD Power, “Expectation setting and clearly articulating next steps are the two most important factors in making the customer feel at ease.”¹
Photo estimating is an inevitability — consumers will come to expect the convenience and control it provides. Preparation is required for shops to embrace it and realize meaningful benefits from it. Estimating and customer interaction processes will need to be reviewed for professionalism and thoroughness. Photo-based estimates should be turned around quickly with a focus on customer service. Today’s digital consumers have high expectations, and the shop must be prepared to provide a solid, informative customer experience or face the consequences of a negative review, which they will be willing to write.
1JD POWER, WHY CARRIERS STRUGGLE TO DIFFERENTIATE WITH
DIGITAL AND END UP PAYING A PENALTY,
KYLE SCHMIDTT, MAY 31, 2019.
it to a scheduled repair. But a thorough, professional approach to virtual estimates can increase overall shop revenue (and build trust with the consumer). While it is possible that a shop could see an increase in the number of overall estimates being written, the total time spent with vehicle owners will be greatly reduced.
Photo estimating makes the process virtual and leaves the estimators more time to interact with live customers, guiding them through the repair process, answering questions, nurturing leads, and focusing on more complex, high-dollar repairs. Many shops take the trust-building to a new level by leveraging digital checklists to ensure that quality repairs procedures were followed throughout the repair process. Read more about Checklists in my colleague Dan Risley’s article on page 80.
Preparing Your Operations
Introducing a new technology or process requires planning to help make your shop operationally ready to leverage the capability. Photo estimating may lead to an increase in the volume of requested estimates, and processes should be structured to incorporate the new tools to reach high customer satisfaction levels.
The key is to have your standard operating procedures structured to support the
“In a rapidly evolving industry such as ours, we’re keeping close to the data and trends that will help inform how we grow and change to meet the needs of tomorrow’s drivers. For American Honda, investments in enabling technologies that can drive efficiencies and help our business partners — collision repairers, dealers, etc. — make better, safer decisions is paramount."
How do you/your company spend your time?
Kevin PrettnerAVP Service Operations American Honda Motor Co.

107
CCC INSIGHTC
RA
SH C
OU
RSE 2020 | TIM
E FOR
SER
VICE
Technology within the vehicle provides our industry with new opportunities and challenges. Vehicles involved in an accident are more difficult to repair and may often require a customer to return the vehicle after delivery for additional work. Analytics can help anticipate those and provide insurers and repairers with the needed information to set proper expectations with the customer. AI and photos can help identify whether the vehicle is likely repairable or a total loss, and if likely repairable help carriers recommend the best method of inspection for that customer based on a carrier’s criteria. Data from the vehicle itself may offer the capability to engage with the vehicle owner at the time of the loss and provide critical support and can also help inform the repair. Finding the right balance of technology and human touch on a per-customer basis helps the industry provide their customers with the best possible experience.
Data from the vehicle itself may offer the capability to engage with the vehicle owner at the time of the loss and provide critical support and can also help inform the repair.
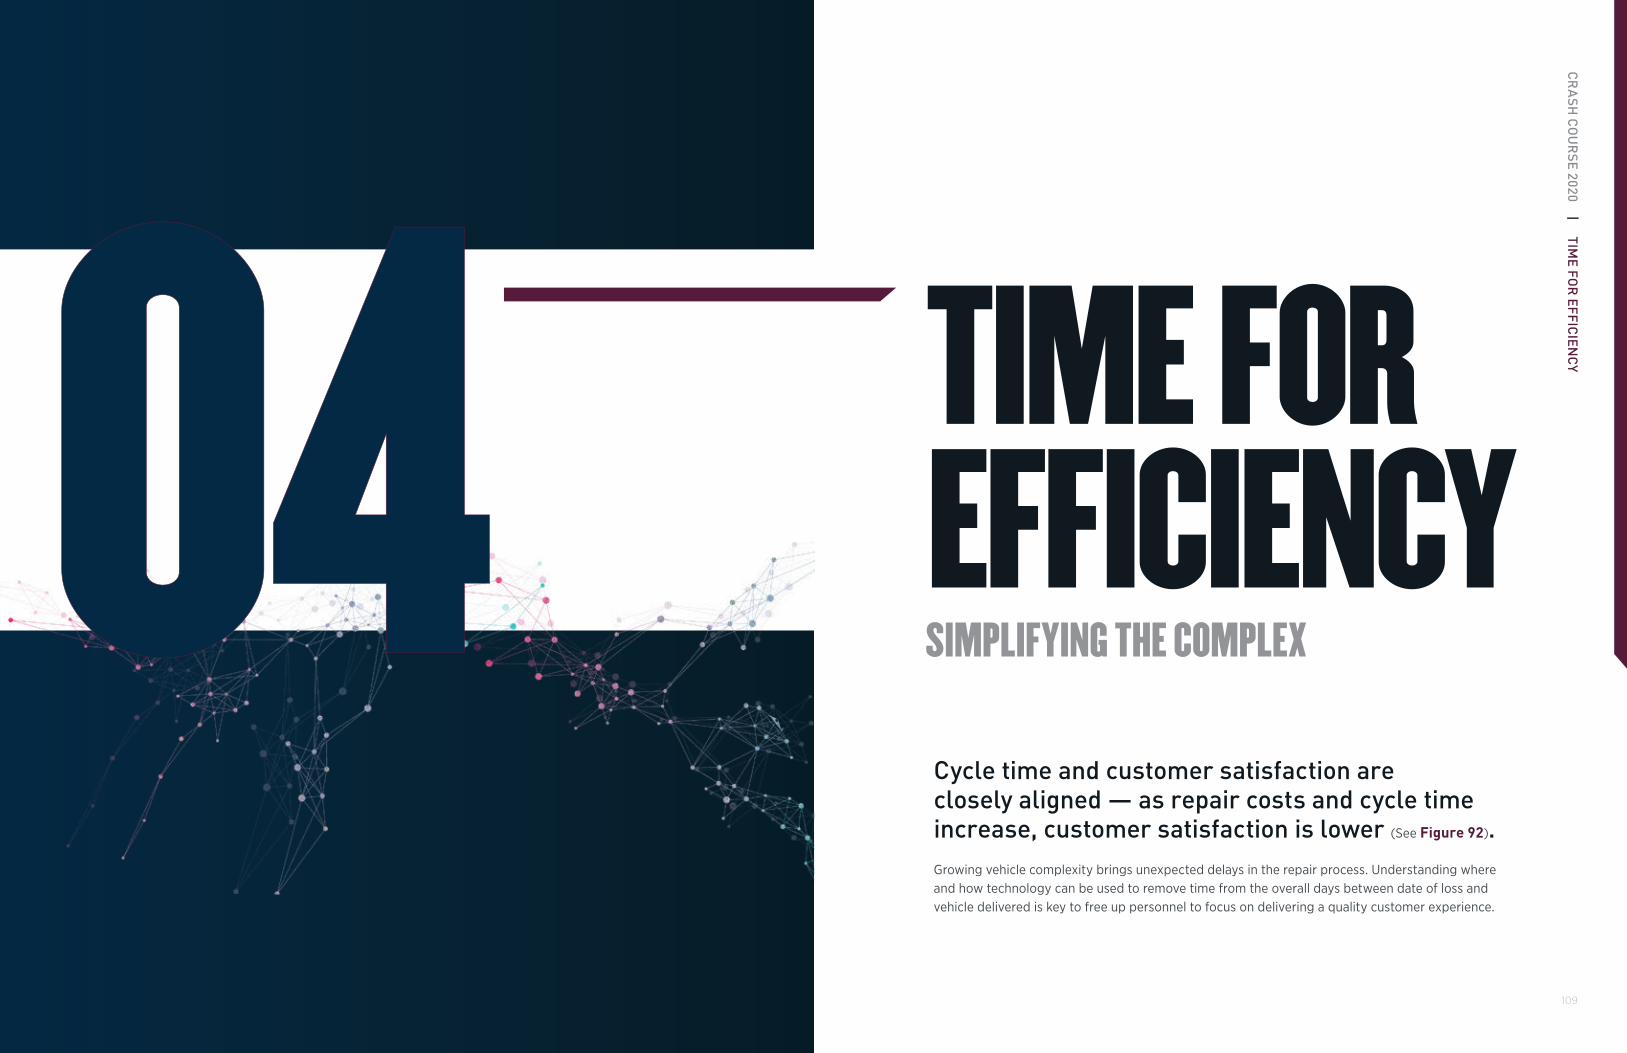
109
CR
ASH
CO
UR
SE 2020 | TIME FO
R E
FFICIE
NC
Y04 TIME FOR EFFICIENCYSIMPLIFYING THE COMPLEX
Cycle time and customer satisfaction are closely aligned — as repair costs and cycle time increase, customer satisfaction is lower (See Figure 92).Growing vehicle complexity brings unexpected delays in the repair process. Understanding where and how technology can be used to remove time from the overall days between date of loss and vehicle delivered is key to free up personnel to focus on delivering a quality customer experience.
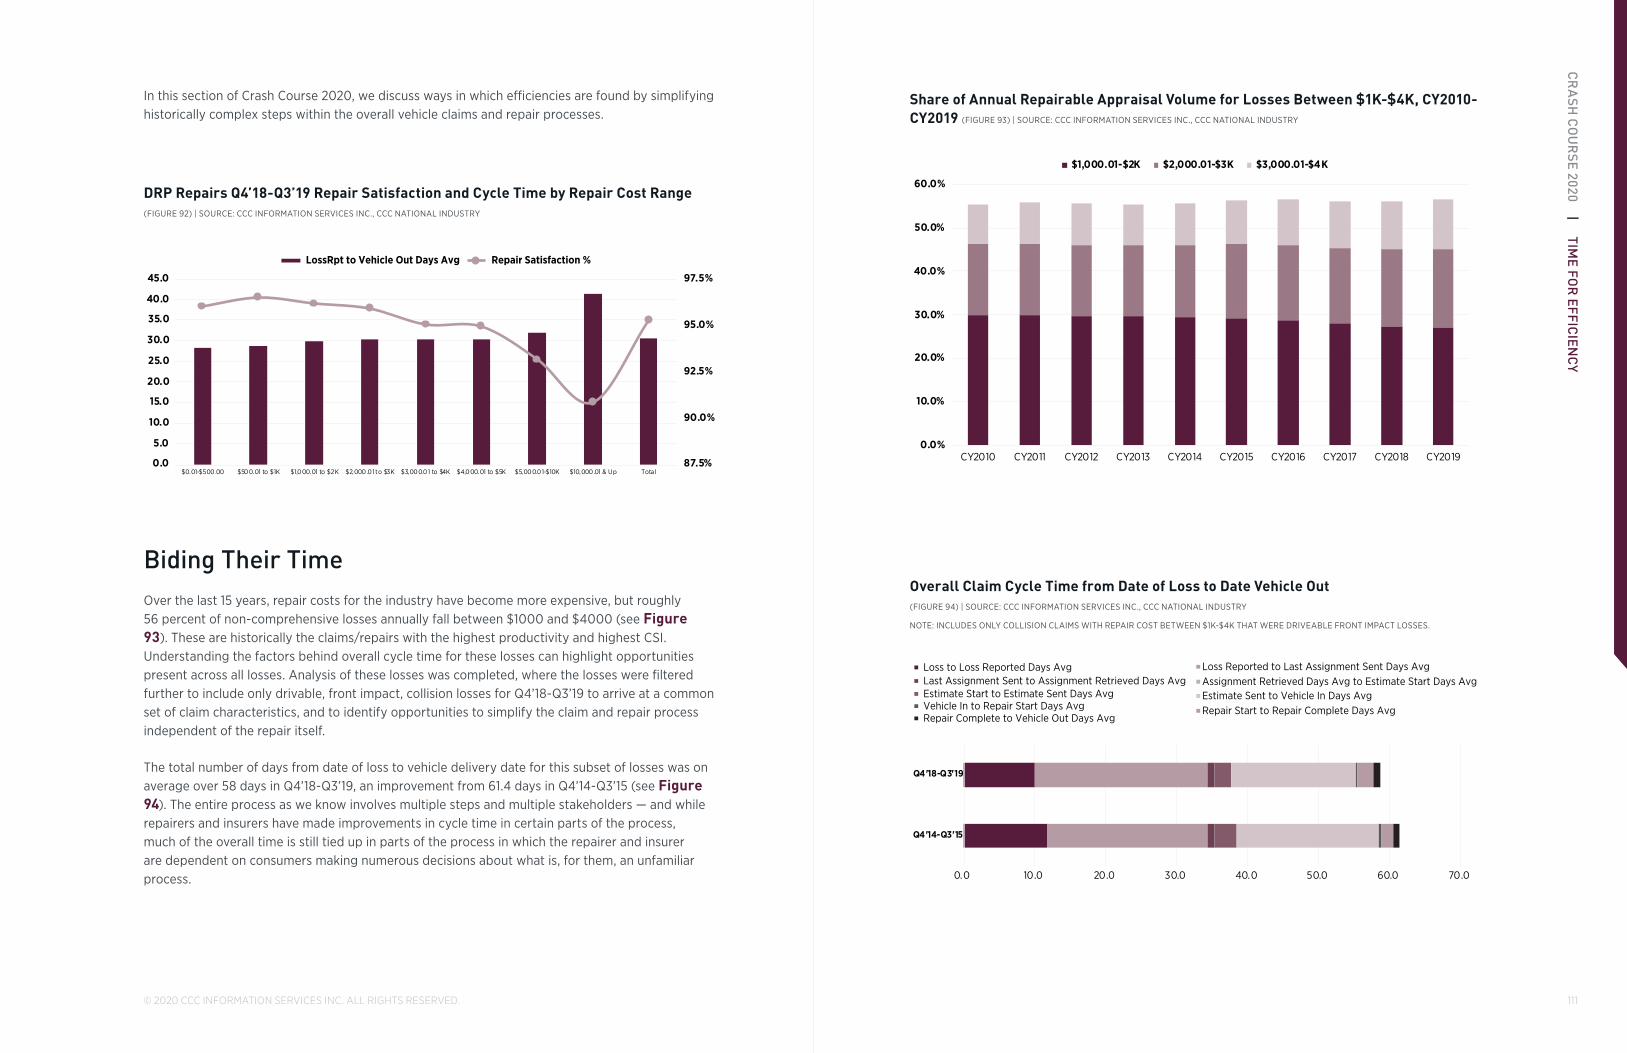
111
CR
ASH
CO
UR
SE 2020 | TIME FO
R E
FFICIE
NC
Y
© 2020 CCC INFORMATION SERVICES INC. ALL RIGHTS RESERVED.
Share of Annual Repairable Appraisal Volume for Losses Between $1K-$4K, CY2010-CY2019 (FIGURE 93) | SOURCE: CCC INFORMATION SERVICES INC., CCC NATIONAL INDUSTRY
0.0%
10.0%
20.0%
30.0%
40.0%
50.0%
60.0%
CY2010 CY2011 CY2012 CY2013 CY2014 CY2015 CY2016 CY2017 CY2018 CY2019
$1,000.01-$2K $2,000.01-$3K $3,000.01-$4K
Overall Claim Cycle Time from Date of Loss to Date Vehicle Out (FIGURE 94) | SOURCE: CCC INFORMATION SERVICES INC., CCC NATIONAL INDUSTRY
NOTE: INCLUDES ONLY COLLISION CLAIMS WITH REPAIR COST BETWEEN $1K-$4K THAT WERE DRIVEABLE FRONT IMPACT LOSSES.
0.0 10.0 20.0 30.0 40.0 50.0 60.0 70.0
Q4'14-Q3'15
Q4'18-Q3'19
Loss to Loss Reported Days Avg Loss Reported to Last Assignment Sent Days AvgLast Assignment Sent to Assignment Retrieved Days Avg Assignment Retrieved Days Avg to Estimate Start Days AvgEstimate Start to Estimate Sent Days Avg Estimate Sent to Vehicle In Days AvgVehicle In to Repair Start Days Avg Repair Start to Repair Complete Days AvgRepair Complete to Vehicle Out Days Avg
In this section of Crash Course 2020, we discuss ways in which efficiencies are found by simplifying historically complex steps within the overall vehicle claims and repair processes.
DRP Repairs Q4’18-Q3’19 Repair Satisfaction and Cycle Time by Repair Cost Range (FIGURE 92) | SOURCE: CCC INFORMATION SERVICES INC., CCC NATIONAL INDUSTRY
87.5%
90.0%
92.5%
95.0%
97.5%
0.0
5.0
10.0
15.0
20.0
25.0
30.0
35.0
40.0
45.0
$0.01-$500.00 $500.01 to $1K $1,000.01 to $2K $2,000.01 to $3K $3,000.01 to $4K $4,000.01 to $5K $5,000.01-$10K $10,000.01 & Up Total
LossRpt to Vehicle Out Days Avg Repair Satisfaction %
Biding Their TimeOver the last 15 years, repair costs for the industry have become more expensive, but roughly 56 percent of non-comprehensive losses annually fall between $1000 and $4000 (see Figure 93). These are historically the claims/repairs with the highest productivity and highest CSI. Understanding the factors behind overall cycle time for these losses can highlight opportunities present across all losses. Analysis of these losses was completed, where the losses were filtered further to include only drivable, front impact, collision losses for Q4’18-Q3’19 to arrive at a common set of claim characteristics, and to identify opportunities to simplify the claim and repair process independent of the repair itself.
The total number of days from date of loss to vehicle delivery date for this subset of losses was on average over 58 days in Q4’18-Q3’19, an improvement from 61.4 days in Q4’14-Q3’15 (see Figure 94). The entire process as we know involves multiple steps and multiple stakeholders — and while repairers and insurers have made improvements in cycle time in certain parts of the process, much of the overall time is still tied up in parts of the process in which the repairer and insurer are dependent on consumers making numerous decisions about what is, for them, an unfamiliar process.

113
CR
ASH
CO
UR
SE 2020 | TIME FO
R E
FFICIE
NC
Y
© 2020 CCC INFORMATION SERVICES INC. ALL RIGHTS RESERVED.
Potential Cycle Time Improvements With Digital Capabilities Implemented (FIGURE 95) | SOURCE: CCC INFORMATION SERVICES INC., CCC NATIONAL INDUSTRY
NOTE: INCLUDES ONLY COLLISION CLAIMS WITH REPAIR COST BETWEEN $1K-$4K THAT WERE DRIVEABLE FRONT IMPACT LOSSES.
0.0
10.0
20.0
30.0
40.0
50.0
60.0
70.0
ORIGINAL WITH CYCLE TIME IMPROVEMENTS
Loss to Loss Reported Days Avg Loss Reported to Last Assignment Sent Days Avg
Last Assignment Sent to Estimate Sent Days Avg Estimate Sent to Vehicle In Days Avg
Vehicle In to Repair Start Days Avg Repair Start to Repair Complete Days Avg
Repair Complete to Vehicle Out Days Avg
Part of the SolutionHistorically, the process of identifying the best part, from the best supplier and delivery times, ordering those parts, matching up orders once delivered, keying in invoices, and finally paying suppliers was extremely cumbersome and time consuming. Insurance appraisers, shop estimators, and parts personnel made numerous phone calls, identifying whether catalogued inventory was available, and matching up orders and invoices upon receipt. When a part didn’t work, the part return process was even more cumbersome. Suppliers such as OEM dealers struggled with high call volumes, and ensuring their current inventory was being accessed by the largest possible audience.
With CCC® Parts, repairers are electronically connected with parts suppliers, whose live inventories, pricing and delivery times are displayed while creating the estimate. By moving parts purchase upstream to the estimating/repair planner, and to delivery availability and margin visibility, moves the point of decision upstream in the repair process. Analysis of repairers utilizing the system shows improvements in supplement rate and labor hours per shop day and labor hours per repair day from improved efficiencies. Supplier preferences are automatically applied to parts quotes and orders and, once orders are confirmed, invoices flow back through the system, reducing the need to manually key invoice information. Removing redundant non-value tasks such as manual purchase orders and invoices frees personnel up to focus on those orders that may require additional focus.
Industry analysts project online parts sales reached $12 billion in 2019, and are growing at a rate of about 12 percent annually.147 A survey conducted by JDJS Consulting found that dealers who use online platforms that provide real-time pricing and procurement data report a ‘win’ rate of 55 percent on their quotes compared to 41 percent who stick with fixed prices.148 Finally, with
Some examples of how the overall cycle time for this subset of claims was reduced:
• The average days between date of loss and date loss reported fell from 11.7 days in Q4’14-Q3’15 to 10.1 days in Q4’18-Q3’19. As more consumers select UBI auto policies, or buy connected cars, the ability to identify the accident immediately and contact the customer is more prevalent. A comparison of claims where CCC’s telematics-enabled claim solution detected the crash versus the non-telematics enable repairable losses conducted by CCC in CY 2019 revealed significant reduction in time from date of loss to loss reported for the telematics-enabled claims. The number of days from loss to loss report was nearly 90 percent lower, for telematics-enabled claims. As connected car volumes grow, and more OEMs and insurers take advantage of this technology to drive customer engagement, this metric will likely see further reduction in the future.
• Figure 83 provided a comparison of the time to produce the estimate during the initial estimate inspection, a key step in the process needed to help the consumer make the next decision about their vehicles. The average days from last assignment sent to estimate complete/sent was 0.6 days for those losses among the $1,000-$4,000 sample that used photo MOI versus all others at 5.1 days — a nearly 90 percent reduction.
• Previous analysis of claims data conducted by CCC revealed the overall time between when the insurance company’s customer has an estimate to when they schedule their vehicle in for repair is less for those claims where the consumer has scheduled their appointment online themselves. For consumers equipped with information about the shop and its schedule, the number of days between when the consumer receives their estimate to the date they schedule their vehicle in for repair was also nearly 11 percent lower. Access to key information on the repair shop such as proximity, DRP program participation, on-line reviews, customer referrals, or availability of OE certification all within the same platform may be helping consumers choose their repair shop quicker. And, perhaps more important, our repair experience survey revealed an easier scheduling process is a key variable driving overall customer satisfaction with the repair experience.
These are just several ways we see the industry using technology to improve and simplify the overall customer experience, where the results are meaningful reductions in cycle time and subsequently improvements in overall customer engagement. By providing digital capabilities to the consumer in key parts of an unfamiliar process in a way that provide clear easy-to-understand information, where they can use their smartphone to review that information and make decisions regarding their claim and repair, the overall cycle time industry-wide could potentially see a 12-day improvement (see Figure 95). As vehicle complexity increases, repair costs and repair cycle times are expected to rise further. The ability to integrate technologies into the process to help the consumer make better, more informed and faster decisions can help reduce the overall time from loss to vehicle out, potentially providing a significant counterweight to growing repair times and lift to overall customer engagement.

115
CR
ASH
CO
UR
SE 2020 | TIME FO
R E
FFICIE
NC
Y
© 2020 CCC INFORMATION SERVICES INC. ALL RIGHTS RESERVED.
When the Vehicle is Not Repairable, How Can Complexity in the Process Be Streamlined?Another area where new car dealerships have seen their revenues grow is within the F&I segment of their business. As of CY 2018 dealership F&I penetration for new car sales was 89.6 percent, and 73.2 percent for used vehicle sales.155 F&I income as a percent of new vehicle sales was 2.9 percent for new-vehicle sales and 3.8 percent for used in CY 2018, up from 2.8 percent and 3.4 percent in CY 2014.156 With the average price of a new vehicle now over $35,000 — up nearly 30 percent since CY 2005 — more buyers purchase a new or used vehicle today with financing (see Figure 97). According to Experian, as of Q3 CY 2019, the U.S. had a $1.220 billion open automotive loan balance up from $968 billion in Q3 CY 2015.157 Loan balances have grown as both vehicles sold, and amount financed have grown. 31 percent of all new vehicle loans and 30 percent of used vehicle loans had a loan term of 73-84 months, up from 27.5 percent for new and 16.2 percent for used five years prior (see Figure 98).158
Experian Percentage of New and Used Vehicles with Financing by Quarter CY2010-CY2019 (FIGURE 97) | SOURCE: EXPERIAN “STATE OF AUTOMOTIVE FINANCE MARKET”
35.0%
45.0%
55.0%
65.0%
75.0%
85.0%
95.0%
Q1 2010
Q3 2010
Q1 2011
Q3 2011
Q1 2012
Q3 2012
Q1 2013
Q3 2013
Q1 2014
Q3 2014
Q1 2015
Q3 2015
Q1 2016
Q3 2016
Q1 2017
Q3 2017
Q1 2018
Q3 2018
Q1 2019
Q3 2019
NEW USED
New and Used Vehicle Financing Distribution of Volume by Loan Term (FIGURE 98) | SOURCE: EXPERIAN “STATE OF THE AUTO FINANCING MARKET” Q3 2015 AND Q3 2019
0.0%5.0%
10.0%15.0%
20.0%
25.0%30.0%35.0%40.0%45.0%50.0%
New Q3 2015 New Q3 2019 Used Q3 2015 Used Q3 2019
49-60 Mos 61-72 mos 73-84 mos
electronic purchase orders (ePOs), repairers see greater efficiencies, and 15-20 percent fewer returns. Repairers and suppliers are freed up to focus time on more complex orders, quality control, and customer service.
Today’s repairs include more part replacements than ever before — 12.8 parts were replaced per repair in Q4’18-Q3’19, up 1.3 parts in two years. With replacement parts accounting for a growing share of the overall repair cost, and share of labor time, the ability to identify the most appropriate parts up front, to know that they are available, and to be able to place the order seamlessly can help counter increases in overall cycle time from more complex repairs.
As auto dealerships look toward a future with fewer new vehicle sales, they will rely more on other areas of their business such as parts and service. In CY 2018, data from NADA reveals U.S. new car dealership’s total parts sales were $68.61 billion, of which $18.33 billion of which was wholesale.149 Parts & Service as a percent of the average U.S. new car dealership’s sales was 12.8 percent as of June CY 2019 — up from 11.4 percent in CY 2000 (see Figure 96).150 In CY 2009 with auto sales at record lows, parts and service accounted for an even higher share of total sales. According to a survey of 650 franchised dealers conducted by Kerrigan Advisors, sales of service and parts, as well as used vehicles, remain the key drivers of profitability. Service and parts sales were up 27 percent since 2015 and continue to contribute most to the dealers’ overall gross profits.151
NADA Parts & Service Percent of Total Sales — U.S. New Car Dealers CY2000-CY2019 (FIGURE 96) | SOURCE: NADA DATA
0.0%
2.0%
4.0%
6.0%
8.0%
10.0%
12.0%
14.0%
16.0%
18.0%
CY2000
CY2001
CY2002
CY2003
CY2004
CY2005
CY2006
CY2007
CY2008
CY2009
CY2010
CY2011
CY2012
CY2013
CY2014
CY2015
CY2016
CY2017
CY2018
CY2019
to Ju
ne
Finally, companies within the aftermarket and recycler segments are looking to expand their markets via digital. According to studies on e-tailing and other trends conducted by the Auto Care Association, the e-tailing channel in 2014 was roughly $6 billion or roughly 6 percent of the replacement parts market.152 By 2017, the association’s data showed e-tailing had reached $22 billion, with a CAGR of 15 percent.153 And while that CAGR is expected to slow to 8 percent through 2020, the association anticipates the industry will continue to change — integrating online and offline shopping/purchasing experiences.154

117© 2020 CCC INFORMATION SERVICES INC. ALL RIGHTS RESERVED.
With loan term lengths extended, more customers end up owing more for their vehicle than it’s worth. According to Edmunds, an estimated 33 percent of individuals who traded in cars to buy new ones in the first nine months of CY 2019 had negative equity, compared to 28 percent five years ago, and 19 percent a decade ago.159 Unfortunately, this also means that when a customer has a total loss vehicle, the likelihood that he/she still has an outstanding vehicle loan increases.
Figure 74 illustrated the growth in total loss frequency across all vehicle ages and showed how over the last five years the largest percent increase occurred among vehicles ages current year to four years of age. Many of these vehicles likely still have outstanding loan balances, given the average loan term length as of Q3 2019 per Experian was 69 months. The percent of vehicle claims that result in a total loss has risen over the last several years and is anticipated to grow further in the near future given the older vehicle fleet and higher vehicle repair costs. Given the growing share of consumers with longer loan term length, more total loss claims than ever require engagement of the lien holder, which can result in longer overall cycle time from loss to final settlement and salvage lot closed. Among confirmed total loss claims in CY 2019, the average days from the date of loss to the date salvage lot closed was 73.7 days, with only 11.6 days of those from date of loss to date of last vehicle valuation.
While heavily damaged vehicles or older model year vehicles may be more easily identifiable as likely total loss claims, an estimated 2-5 percent of claims are borderline losses, where the total loss determination is less obvious. CCC customers who enabled the suite of tools CCC® Quick Estimate -> CCC Smart Total Loss -> CCC® Quick Valuation have seen improvements in their ability to identify borderline total losses that went through the photo estimating channel. In these instances, consumers used Quick Estimate to take photos of their damaged vehicle, and when uploaded, Smart Total Loss is automatically run. Consumers are then, using Quick Valuation, prompted to confirm options and take additional photos to document things like vehicle condition and mileage. This helps process claims more quickly, and significantly faster than via a physical inspection (see Figure 99).
With increased share of claims non-repairable, the ability to more accurately and quickly identify whether a loss vehicle is a total loss earlier in the process, and to process the claim through settlement will become more important to help counter the growing dissatisfaction among insurance companies’ consumers as more owe more on their vehicle than it may be worth at time of loss.
Total Loss Cycle Time Comparison by Inspection Method CY2019 (FIGURE 99) | SOURCE: CCC INFORMATION SERVICES INC., CCC NATIONAL INDUSTRY
Photo Estimate 12.6 17.3
Initial VehicleInspection Method
Loss Report to LastValuation Days Avg
Customers using CCC’s QuickEstimate -> CCC’s Smart
Total Loss -> CCC’s Quick Valuation Total Industry
“Today’s technology in vehicles — our overriding concern is the cost and reparability of newer cars. The fact that enhanced technology is now not only in high-end vehicles, but also in more affordable vehicles, brings a whole new level of complexity and cost to repairing these vehicles. As vehicle technology continues to evolve, it will challenge shops’ ability to assess and repair this technology, which will result in needing to take an entirely different approach to pricing and the claim repair process."
What is one thing you/your company spend time thinking about?
Ellen TierneyVice President, Chief Claims OfficerMetLife Auto and Home

119
CR
ASH
CO
UR
SE 2020 | TIME FO
R E
FFICIE
NC
Y
“The total loss process exemplifies the definition of complex: “… consisting of many different and connected parts.” The numerous steps in the total loss claim life cycle (notification of loss, method of inspection, total loss determination, valuation, settlement, salvage, etc.) can extend across multiple participants: insurance carrier, lender, salvage yard, gap insurance provider, and others. Each participant has specific requirements, workflows, documentation, and customer touch points that can result in inefficiencies, long cycle times, and lost productivity. Many of the participants still have paper-intensive processes that are slowly being digitized. Additionally, given the number of stakeholders involved, the customer and insurance claims adjuster often have to jump between numerous touchpoints and applications, re-entering the same information many times. The process can take weeks if not months to complete and can lead to a less than optimal customer journey.
...a vehicle is often the second most costly investment a consumer makes, the stakes are high when an unplanned and disruptive experience, like a vehicle accident, leaves them feeling anxious and confused."
by Heidi Ford
ADDRESSING TOTAL LOSS CLAIM PROCESS COMPLEXITY
artificial intelligence (AI) innovations, such as CCC Smart Total Loss™, which assists carrier in making near-instant predictions as to whether a vehicle is likely a total loss or repairable using a single photo, which may help inform whether the vehicle should be sent to a repair shop or salvage yard. Next, we introduced CCC® Quick Valuation to enable a vehicle owner to capture additional photos and input options as requested by an insurance carrier for the insurer’s total loss claims processing. The combined AI and digital experience have been shown to result in a 20 percent reduction in cycle time from first notice of loss to settlement.
Now, we’re taking the next step in total loss transformation to address the complexities of lien release and title paperwork with the introduction of CCC® Total Loss Care. Total Loss Care mitigates and simplifies the cumbersome, manually intensive tasks associated with these processes for the insurance carriers and auto finance lenders.
By extending CCC platform capabilities for insurance carriers to new market segments such as auto finance lenders, CCC’s solutions can help reduce wait time on needed information for lien pay-off information from days to seconds. This single platform approach provides visibility for insurers and lien holders to their role within the total loss claim life cycle, reducing manual tasks and providing analytics that unlock actionable insights to drive continued improvements.
Total Loss Care also enables insurance carriers to simplify and enhance the vehicle owner journey through provision of proactive digital status updates and process guidance, providing clarity and comfort during a potentially worrisome event. Powering simplification of insurance claims through adoption of digital innovations…the time is now.
1. HTTPS://WWW.VALUEPENGUIN.COM/AUTO-INSURANCE/CAR-
OWNERSHIP-STATISTICS#NATIONAL.
2. HTTPS://WWW.CNBC.COM/2019/10/22/CAR-PRICES-ARE-RAPIDLY-
INCREASING-HERES-WHY-THATS-BAD-FOR-AMERICANS.HTML.
3. WWW.BLS.ORG.
4. HTTPS://WWW.MARKETWATCH.COM/STORY/MORE-BORROWERS-
ARE-GOING-UNDERWATER-ON-CAR-LOANS-2019-11-09-111032935.
5. HTTPS://WWW.MARKETWATCH.COM/STORY/MORE-BORROWERS-
ARE-GOING-UNDERWATER-ON-CAR-LOANS-2019-11-09-111032935.
This reality runs counter to consumer expectations for how an insurance claim would be handled, which today means consumer-led and digitally enabled — the same way nearly every other transaction is managed in their daily life. And, because a vehicle is often the second most costly investment a consumer makes, the stakes are high when an unplanned and disruptive experience, like a vehicle accident, leaves them feeling anxious and confused.
Total Losses on Active LoansAccording to 2018 U.S. census figures, 93 percent of households reported having access to at least one vehicle.¹ Vehicle ownership is woven into the fabric of our lives but comes at a higher price. Over the last 10 years the average MSRP of a new vehicle has increased from $23,900 to $29,000, and the cost of consumer selected options increased from $6,500 to $10,000.² Over this 10-year period, vehicle prices have surged 34 percent, outpacing the mean wage increase of 4 percent.³
Consumers are paying more for their vehicles, and taking longer to pay them off — if they are able to do so at all.⁴ Edmunds reports that through the end of Q3 2019, 33 percent of consumers trading in vehicles on a new purchase had negative equity, compared with 19 percent a decade ago.⁵ On average the consumer owed $5,000 after trading in their vehicle, before taking on a new loan.
Subsequently, more consumers than ever before with a total loss claim still have an outstanding vehicle loan balance. The process of settling the total loss with the lien holder may be manual or somewhat automated but often involve other companies who have historically been very paper intensive. Acquisition of the vehicle title for title transfer also involves numerous steps, some of which are automated and support e-signature and electronic forms, but most do not.
CCC is applying its 40 years of experience to improve, simplify and streamline the process for participants. CCC brought to market digital and
Heidi Ford Senior Director, Product Management, CCC
ABOUT THE AUTHOR

121
CR
ASH
CO
UR
SE 2020 | TIME FO
R D
ATA05 TIME FOR DATAINFORMING AND INCITING ACTION
Despite advancements in technology in vehicle design, crash worthiness, crash avoidance, millions of people in the U.S. each year are injured in motor vehicle accidents, and tens of thousands are killed. The economic costs of providing the necessary medical care for these individuals continues to grow, as inflation in medical cost grows. In this section of Crash Course 2020 we will discuss the state of motor vehicle safety and insurance casualty claims.
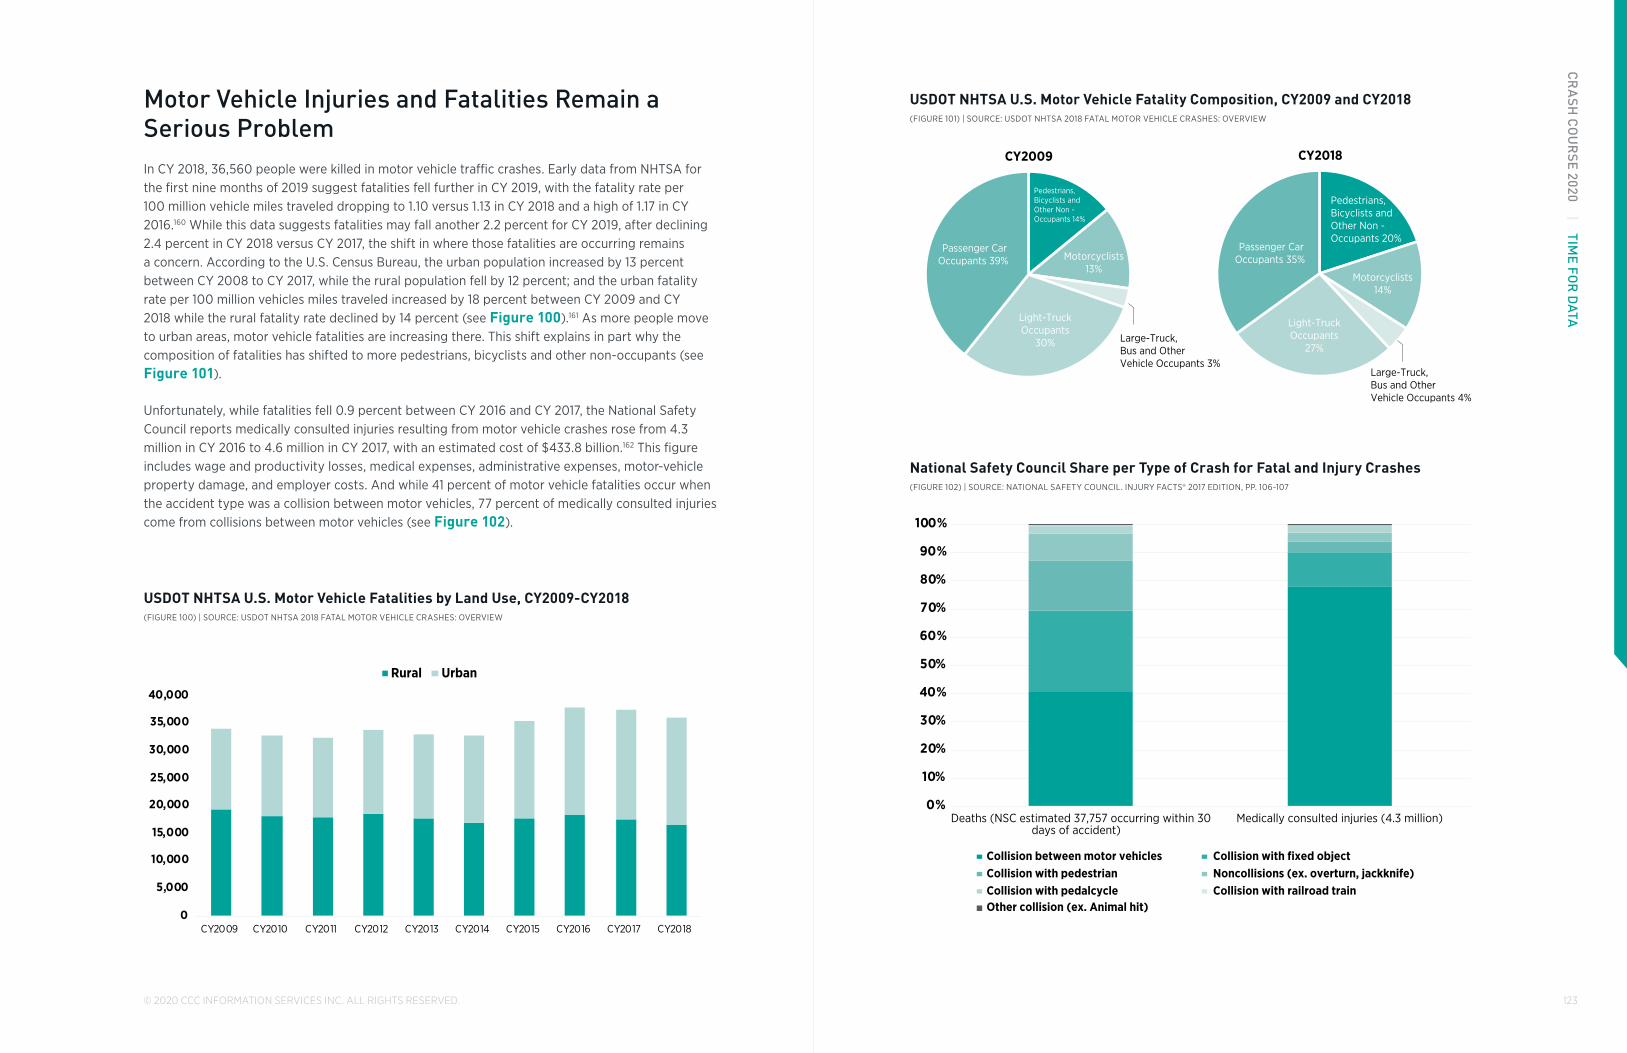
123
CR
ASH
CO
UR
SE 2020 | TIME FO
R D
ATA
© 2020 CCC INFORMATION SERVICES INC. ALL RIGHTS RESERVED.
USDOT NHTSA U.S. Motor Vehicle Fatality Composition, CY2009 and CY2018 (FIGURE 101) | SOURCE: USDOT NHTSA 2018 FATAL MOTOR VEHICLE CRASHES: OVERVIEW
,
CY2009
Pedestrians, Bicyclists andOther Non - Occupants 20%
Pedestrians, Bicyclists andOther Non - Occupants 14%
Motorcyclists14%
Motorcyclists13%
Large-Truck, Bus and OtherVehicle Occupants 4%
Large-Truck, Bus and OtherVehicle Occupants 3%
Light-TruckOccupants
27%
Light-TruckOccupants
30%
Passenger CarOccupants 35%
Passenger CarOccupants 39%
CY2018
National Safety Council Share per Type of Crash for Fatal and Injury Crashes (FIGURE 102) | SOURCE: NATIONAL SAFETY COUNCIL. INJURY FACTS® 2017 EDITION, PP. 106-107
0%
10%
20%
30%
40%
50%
60%
70%
80%
90%
100%
Deaths (NSC estimated 37,757 occurring within 30days of accident)
Medically consulted injuries (4.3 million)
Collision between motor vehicles Collision with fixed objectCollision with pedestrian Noncollisions (ex. overturn, jackknife)Collision with pedalcycle Collision with railroad trainOther collision (ex. Animal hit)
Motor Vehicle Injuries and Fatalities Remain a Serious ProblemIn CY 2018, 36,560 people were killed in motor vehicle traffic crashes. Early data from NHTSA for the first nine months of 2019 suggest fatalities fell further in CY 2019, with the fatality rate per 100 million vehicle miles traveled dropping to 1.10 versus 1.13 in CY 2018 and a high of 1.17 in CY 2016.160 While this data suggests fatalities may fall another 2.2 percent for CY 2019, after declining 2.4 percent in CY 2018 versus CY 2017, the shift in where those fatalities are occurring remains a concern. According to the U.S. Census Bureau, the urban population increased by 13 percent between CY 2008 to CY 2017, while the rural population fell by 12 percent; and the urban fatality rate per 100 million vehicles miles traveled increased by 18 percent between CY 2009 and CY 2018 while the rural fatality rate declined by 14 percent (see Figure 100).161 As more people move to urban areas, motor vehicle fatalities are increasing there. This shift explains in part why the composition of fatalities has shifted to more pedestrians, bicyclists and other non-occupants (see Figure 101).
Unfortunately, while fatalities fell 0.9 percent between CY 2016 and CY 2017, the National Safety Council reports medically consulted injuries resulting from motor vehicle crashes rose from 4.3 million in CY 2016 to 4.6 million in CY 2017, with an estimated cost of $433.8 billion.162 This figure includes wage and productivity losses, medical expenses, administrative expenses, motor-vehicle property damage, and employer costs. And while 41 percent of motor vehicle fatalities occur when the accident type was a collision between motor vehicles, 77 percent of medically consulted injuries come from collisions between motor vehicles (see Figure 102).
USDOT NHTSA U.S. Motor Vehicle Fatalities by Land Use, CY2009-CY2018 (FIGURE 100) | SOURCE: USDOT NHTSA 2018 FATAL MOTOR VEHICLE CRASHES: OVERVIEW
0
5,000
10,000
15,000
20,000
25,000
30,000
35,000
40,000
CY2009 CY2010 CY2011 CY2012 CY2013 CY2014 CY2015 CY2016 CY2017 CY2018
Rural Urban
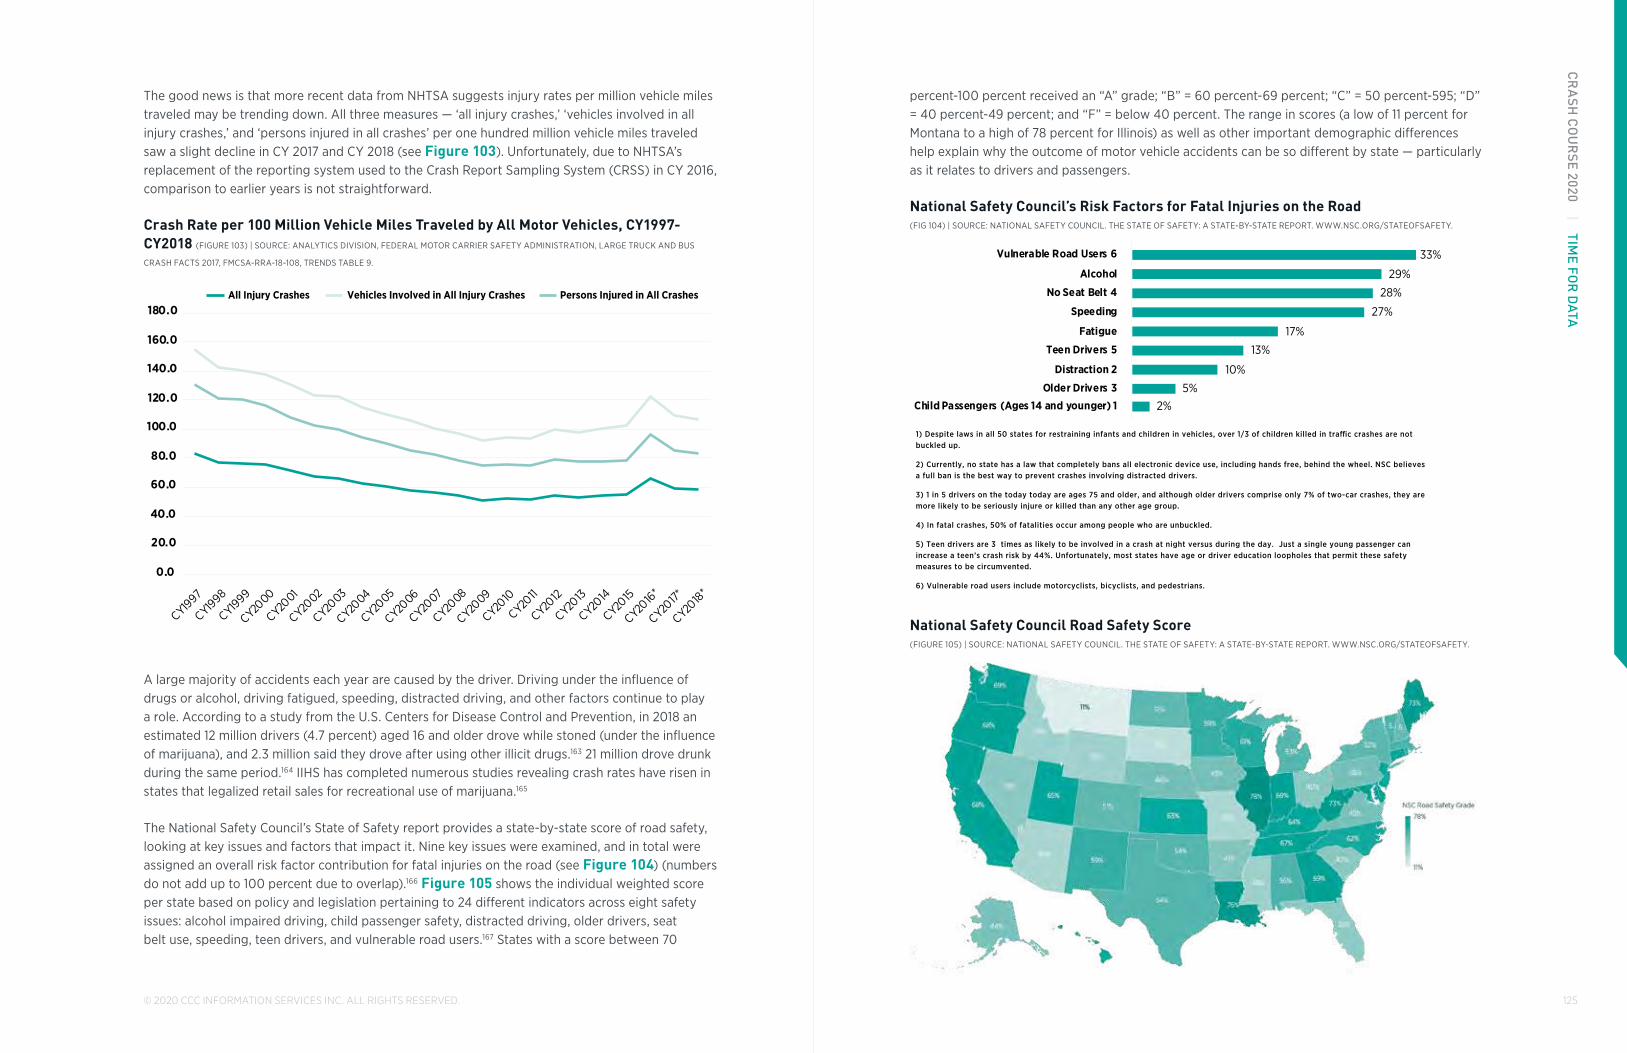
125
CR
ASH
CO
UR
SE 2020 | TIME FO
R D
ATA
© 2020 CCC INFORMATION SERVICES INC. ALL RIGHTS RESERVED.
percent-100 percent received an “A” grade; “B” = 60 percent-69 percent; “C” = 50 percent-595; “D” = 40 percent-49 percent; and “F” = below 40 percent. The range in scores (a low of 11 percent for Montana to a high of 78 percent for Illinois) as well as other important demographic differences help explain why the outcome of motor vehicle accidents can be so different by state — particularly as it relates to drivers and passengers.
National Safety Council’s Risk Factors for Fatal Injuries on the Road (FIG 104) | SOURCE: NATIONAL SAFETY COUNCIL. THE STATE OF SAFETY: A STATE-BY-STATE REPORT. WWW.NSC.ORG/STATEOFSAFETY.
2%5%
10%
13%
17%
27%
28%
29%
33%
Child Passengers (Ages 14 and younger) 1
Older Drivers 3
Distraction 2
Teen Drivers 5
Fatigue
Speeding
No Seat Belt 4
Alcohol
Vulnerable Road Users 6
1) Despite laws in all 50 states for restraining infants and children in vehicles, over 1/3 of children killed in tra�c crashes are not buckled up.
2) Currently, no state has a law that completely bans all electronic device use, including hands free, behind the wheel. NSC believes a full ban is the best way to prevent crashes involving distracted drivers.
3) 1 in 5 drivers on the today today are ages 75 and older, and although older drivers comprise only 7% of two-car crashes, they are more likely to be seriously injure or killed than any other age group.
4) In fatal crashes, 50% of fatalities occur among people who are unbuckled.
5) Teen drivers are 3 times as likely to be involved in a crash at night versus during the day. Just a single young passenger can increase a teen’s crash risk by 44%. Unfortunately, most states have age or driver education loopholes that permit these safety measures to be circumvented.
6) Vulnerable road users include motorcyclists, bicyclists, and pedestrians.
National Safety Council Road Safety Score (FIGURE 105) | SOURCE: NATIONAL SAFETY COUNCIL. THE STATE OF SAFETY: A STATE-BY-STATE REPORT. WWW.NSC.ORG/STATEOFSAFETY.
The good news is that more recent data from NHTSA suggests injury rates per million vehicle miles traveled may be trending down. All three measures — ‘all injury crashes,’ ‘vehicles involved in all injury crashes,’ and ‘persons injured in all crashes’ per one hundred million vehicle miles traveled saw a slight decline in CY 2017 and CY 2018 (see Figure 103). Unfortunately, due to NHTSA’s replacement of the reporting system used to the Crash Report Sampling System (CRSS) in CY 2016, comparison to earlier years is not straightforward.
Crash Rate per 100 Million Vehicle Miles Traveled by All Motor Vehicles, CY1997-CY2018 (FIGURE 103) | SOURCE: ANALYTICS DIVISION, FEDERAL MOTOR CARRIER SAFETY ADMINISTRATION, LARGE TRUCK AND BUS
CRASH FACTS 2017, FMCSA-RRA-18-108, TRENDS TABLE 9.
0.0
20.0
40.0
60.0
80.0
100.0
120.0
140.0
160.0
180.0
CY1997
CY1998
CY1999
CY2000
CY2001
CY2002
CY2003
CY2004
CY2005
CY2006
CY2007
CY2008
CY2009
CY2010
CY2011
CY2012
CY2013
CY2014
CY2015
CY2016
*
CY2017*
CY2018
*
All Injury Crashes Vehicles Involved in All Injury Crashes Persons Injured in All Crashes
A large majority of accidents each year are caused by the driver. Driving under the influence of drugs or alcohol, driving fatigued, speeding, distracted driving, and other factors continue to play a role. According to a study from the U.S. Centers for Disease Control and Prevention, in 2018 an estimated 12 million drivers (4.7 percent) aged 16 and older drove while stoned (under the influence of marijuana), and 2.3 million said they drove after using other illicit drugs.163 21 million drove drunk during the same period.164 IIHS has completed numerous studies revealing crash rates have risen in states that legalized retail sales for recreational use of marijuana.165
The National Safety Council’s State of Safety report provides a state-by-state score of road safety, looking at key issues and factors that impact it. Nine key issues were examined, and in total were assigned an overall risk factor contribution for fatal injuries on the road (see Figure 104) (numbers do not add up to 100 percent due to overlap).166 Figure 105 shows the individual weighted score per state based on policy and legislation pertaining to 24 different indicators across eight safety issues: alcohol impaired driving, child passenger safety, distracted driving, older drivers, seat belt use, speeding, teen drivers, and vulnerable road users.167 States with a score between 70

127
CR
ASH
CO
UR
SE 2020 | TIME FO
R D
ATA
© 2020 CCC INFORMATION SERVICES INC. ALL RIGHTS RESERVED.
A comparison of the Bureau of Labor’s CPI data reveals the medical care index since CY 2001 show some of the fastest growth in the last decade occurred in CY 2016, and costs for CY 2019 are increasing faster than overall CPI (see Figure 107). The indices for hospital services, prescription drugs, and services by other medical professionals have seen larger increases over the last several years than overall inflation (see Figure 108).
Annual Percent Change, CPI — Medical (FIGURE 107) | SOURCE: INSURANCE INFORMATION INSTITUTE, BLS CPI
4.6% 4.7%
4.0%4.4%
4.2%4.0%
4.4%
3.7%
3.2%3.4%
3.0%
3.7%
2.5% 2.4%2.6%
3.8%
2.5%
2.0%
2.8%
CY
200
1
CY
200
2
CY
200
3
CY
200
4
CY
200
5
CY
200
6
CY
200
7
CY
200
8
CY
200
9
CY
2010
CY
2011
CY
2012
CY
2013
CY
2014
CY
2015
CY
2016
CY
2017
CY
2018
CY
2019
Healthcare Costs Continue to Rise Faster Than Inflation — BLS CPI Price Level Change Annual CPI Percent Change from Prior year — U.S. city average, all urban customers, not seasonally adjusted (FIGURE 108) | SOURCE: WWW.BLS.GOV
-6.0%
-4.0%
-2.0%
0.0%
2.0%
4.0%
6.0%
8.0%
10.0%
12.0%
14.0%
16.0%
AllItems
All ItemsLess Food
and Energy
MedicalCare
Physicians'Services
Services byOther
MedicalProfessionals
HospitalServices
PrescriptionDrugs
Medical careservices
Hospital andrelatedservices
HealthInsurance
CY2008 CY2009 CY2010 CY2011 CY2012 CY2013 CY2014 CY2015 CY2016 CY2017 CY2018 CY2019
State of the Union... is continued on page 132
As more vehicles are equipped with ADAS, early data suggests we will start to see a reduction in auto crash rates, and resultant injuries and fatalities, because the vehicle speed and subsequent impact are slowed by ADAS features, even if the accident is not avoided altogether. For example, IIHS/HLDI studies of the efficacy of various ADAS features in reducing claim frequency and costs found FCW without autobrake reduced bodily injury claim frequency by 15 percent; adding AEB pushed the reduction up to 19 percent.168 Most of the benefits of these safety systems come to vehicle occupants. Unfortunately, tests conducted by IIHS and AAA indicate that many of the pedestrian crash prevention systems are lacking, particularly when a vehicle is taking a right-hand turn, driving at night, or driving at speeds of 30 mph.169 In order to promote development of better pedestrian crash prevention, IIHS has announced tougher new requirements for its 2020 Top Safety Pick and Top Safety Pick+ designations. Automakers must achieve good or acceptable ratings for the IIHS tests of pedestrian crash prevention system test, headlight evaluations, and passenger-side small overlap crash worthiness in order to achieve the designations.170
Improved vehicle safety and availability of ADAS may help to reduce fatalities and injuries of vehicle occupants, but until features such as pedestrian airbags are standard and pedestrian detection systems improve, the non-occupants’ share of motor vehicle crashes may continue to trend higher.
State of the Union — U.S. Medical Costs Continue to RiseU.S. spending on health care rose to $3.65 trillion in CY 2018, rising above $11,000 per person for the first time (see Figure 106).171 Growth in per capita spending increased 4 percent in CY 2018, up from 3.5 percent in CY 2017, as faster growth in medical prices more than offset slower growth in the use and intensity of health care goods and services.172 Higher medical prices accounted for 2.1 percent of the overall 4 percent per capita increase in CY 2018; growth in the residual use and intensity of health care goods and services accounted for 1.3 percentage points, and the changing age and sex mix of the population accounted for 0.6 percentage points.173 Overall, spending rose 4.6 percent in CY 2018 versus 4.2 percent in CY 2017 even as the number of Americans without health coverage rose to 30.7 million individuals, up 1 million for the second consecutive year.174 A slight increase in generic drugs helped drop the price of retail prescription drug prices by 1 percent — the first drop since CY 1973, but total spending on prescription drugs rose 2.5 percent to $335.175
U.S. Health Care Spending in CY2018 (FIGURE 106) | SOURCE: HEALTH AFFAIRS 39, NO. 1 (2020)
National Health Expenditures, in billions
Annual Growth
U.S. Census Bureau U.S. Population(in millions)
Annual Growth
U.S. GDP per capita
Annual Growth
NHE per capita
Annual Growth
CY2012 CY2013 CY2014 CY2015 CY2016 CY2017 CY2018
$2,791.1
4.0%
313.3
0.7%
$51,695
3.4%
$8,908
3.3%
$2,875.0
3.0%
315.5
0.7%
$53,200
2.9%
$9,113
2.3%
$3,025.4
5.2%
317.9
0.7%
$55,143
3.7%
$9,518
4.5%
$3,199.6
5.8%
320.1
0.7%
$56,932
3.2%
$9,995
5.0%
$3,347.4
4.6%
322.5
0.8%
$58,025
1.9%
$10,379
3.8%
$3,487.3
4.2%
324.6
0.7%
$60,128
3.6%
$10,742
3.5%
$3,649.4
4.6%
326.6
0.6%
$63,004
4.8%
$11,172
4.0%

129
CR
ASH
CO
UR
SE 2020 | TIME FO
R D
ATA
“If we can measure acceleration in a collision, we can more precisely determine the collision force or severity and gain better insights into auto damage and the potential for occupant injury." by Scott Palmer
VEHICLE DATA OFFERS THE NEXT FRONTIER TO MITIGATE ACCIDENT INJURIES AND IMPROVE CASUALTY CLAIM RESPONSES
2. Increasing the severity of an impact, also in terms of impact force, increases the risk of injury to the vehicle’s occupants.
Please refer to the Physics Insight breakout section in this article for more information about the relationship of accident forces and accident outcomes.
If we can measure acceleration in a collision, we can more precisely determine the collision force or severity and gain better insights into auto damage and the potential for occupant injury. A few auto manufacturers now offer what is commonly referred to as Advanced Automated Collision Notification Systems (AACN) in the U.S. These systems use data from on-board sensors that measure collision accelerations to detect accidents and other on-board data elements. These data elements are transmitted via telematics and AI is used to predict the severity of injury outcomes in near real time.
Over a decade ago, the Centers for Disease Control and Prevention (CDC) published forward looking recommendations from an expert panel on AACN and the triage of the injured patient. The expert panel found that AACN systems showed promise in improving outcomes in severely injured crash patients. Using AACN, severe, life threatening injuries can be predicted almost immediately from vehicle data using telematics and AI. Armed with these injury predictions, first responders with the appropriate level of training can be deployed to the accident scene, the location of which is also provided by the vehicle. Additionally, when severe injuries are predicted and are not easily observable by first responders (e.g., internal injuries), injured occupants should be directed to Level 1 trauma centers rather than local hospital emergency rooms. A study published in the New England Journal of Medicine showed that if someone is severely injured in an accident and they are transported to a Level 1 trauma center, their chances for survival increase by 25 percent.¹
1. Prevent auto accidents; or
2. Protect occupants from injury when in an auto accident; or
3. Facilitate better medical care to an injured occupant after an accident.
Today, vehicle manufacturers offer a variety of technologies within each of these categories. For example, Automated Driver Assistance Systems (ADAS) such as Forward Collision Warning, Automatic Emergency Braking, and Blind Spot Detection are designed to prevent accidents. Occupant protection systems such as airbags, seat belts, and collapsible steering columns are designed to prevent injury when an accident occurs. Lastly, today’s telematics systems connect the car to telematics service providers who can use data from the vehicle to improve emergency medical responses to the accident scene. Virtually all of these technologies benefit from robust vehicle data capture and artificial intelligence. Interestingly, data captured for accident prevention and occupant protection technologies can be used to improve medical care to injured parties after an accident. We will explore the use of this data and how it can also benefit casualty claim processes.
Impact of Telematics Systems and Vehicle Data on Injury Outcomes
Let’s start with a review of some important background to understand why and how vehicle data is important for understanding injury outcomes. The professional disciplines of accident reconstruction and injury causation have clearly established axioms. All other factors being equal, the following are true:
1. Increasing the severity of an impact, in terms of impact force, increases the amount of damage to a vehicle, and
Logically, for automakers there are three types of technology strategies to reduce serious injury and related consequences in auto accidents. These three strategies are designed to either:
Scott Palmer Vice President, Product Management, CCC
ABOUT THE AUTHOR

131
CR
ASH
CO
UR
SE 2020 | TIME FO
R D
ATA
© 2020 CCC INFORMATION SERVICES INC. ALL RIGHTS RESERVED.
Continued
VEHICLE DATA OFFERS THE NEXT FRONTIER...
and likely more accessible from the vehicle through telematics.
It should also be noted that an initial AI model designed to predict severe injury based on vehicle data was published over 20 years ago. And in 2015, an AACN system started operation in Japan. The point of these observations is that the new frontier of injury prediction from vehicle data is a more advanced capability than most appreciate.
What are the Implications to Auto Casualty Claims?
It stands to reason that if real time vehicle crash data is predictive of injury outcomes for early responders to accident scenes, it should also be predictive of the nature and extent of ensuing casualty claims.
For insurers, what are the potential benefits of a detailed understanding of expected injuries immediately after an accident when vehicle crash data is available? For starters, the following casualty claim questions can be better informed:
1. What are the likely diagnoses and treatments?
2. Will the injury claim costs likely exceed policy limits?
The expert participating in the aforementioned CDC study identified a variety of vehicle-based data points that would be helpful in predicting serious injury. Two helpful data elements are not surprising: 1) acceleration, and 2) seat belt use.
Interestingly, NHTSA requires that all passenger vehicles and pick-up trucks and other lightweight vehicles manufactured on or after September 1, 2013 capture and record the following information: longitudinal acceleration data during a collision event that exceeds a 5 mph speed change in about 1/7th of a second and driver seat belt usage immediately preceding the collision. Additionally, under certain circumstances, NHTSA requires the capture of lateral acceleration data during a collision event, and front-seat passenger seat belt usage immediately preceding the collision.² Interestingly, the capture of this type of vehicle crash data began in the early 1990’s and one of the likely purposes for the use of this data was to evaluate the performance of occupant protection systems.
The major takeaways here are: 1) auto manufacturers already have sensors and other technologies in place that capture the important data elements identified by the CDC’s expert panel to predict injury outcomes, and 2) as vehicle safety technologies become more advanced, these data elements will become more utilized
Add the earlier stated benefits of improving accident scene responses and saving lives, valuable vehicle data such as acceleration and seat belt use promise to drive significant changes in the accident response and casualty claims landscape. Today’s AI initiatives at CCC aim to leverage real time vehicle crash data to inform process improvements for casualty claims. And, these improvements will be about time.
1 MACKENZIE, E., ET AL. “A NATIONAL EVALUATION OF THE
EFFECT OF TRUAMA-CENTER CARE ON MORTALITY.” THE NEW
ENGLAND JOURNAL OF MEDICINE 2006 JAN 26;354(4):366-78.
2 NHTSA. 49 C.F.R. § 563
3. Are there any injury claims that are inconsistent with the vehicle data?
4. Is the developing treatment path consistent with the expected injury?
Armed with these insights, insurers can accurately segment casualty claims based on their complexity and straight through process the claims that experience shows will not benefit from increased human touches. The end result? Significant time savings, elimination of related process expense, and improved customer service.
Physics Insight — Breaking Down Accident Force and Its Relationship to Outcomes
As we may remember from our high school physics class, force is equal to the mass of an object times its acceleration. Physics also tells us that the mass of an object can be derived from its weight and the gravitational pull of the planet. So, in an auto collision, the weight of the vehicle, and accordingly, its mass can be easily estimated (published curb weight can be adjusted for varying fuel levels, occupants and cargo). However, acceleration in an auto collision, is the more elusive variable which must be measured or estimated to determine the impact force of any collision. Acceleration is defined as the change in velocity of an object with respect to time. Both acceleration and velocity are vector quantities which means both must be defined in terms of magnitude and direction.
Let’s examine a couple of examples of these relationships. A high speed (the magnitude), frontal (the direction) collision that causes the accident vehicle to completely stop very quickly (e.g., within 1/7th of a second — which is the time element) would be classified as a high severity (and high acceleration) frontal impact and likely cause significant auto damage and serious injuries to occupants. Conversely, a low speed frontal collision involving a vehicle of the same weight that causes the accident vehicle to completely stop over the same time frame would be described as a low severity (and low acceleration) frontal impact, causing much less auto damage and far less serious injuries, if any, to occupants.
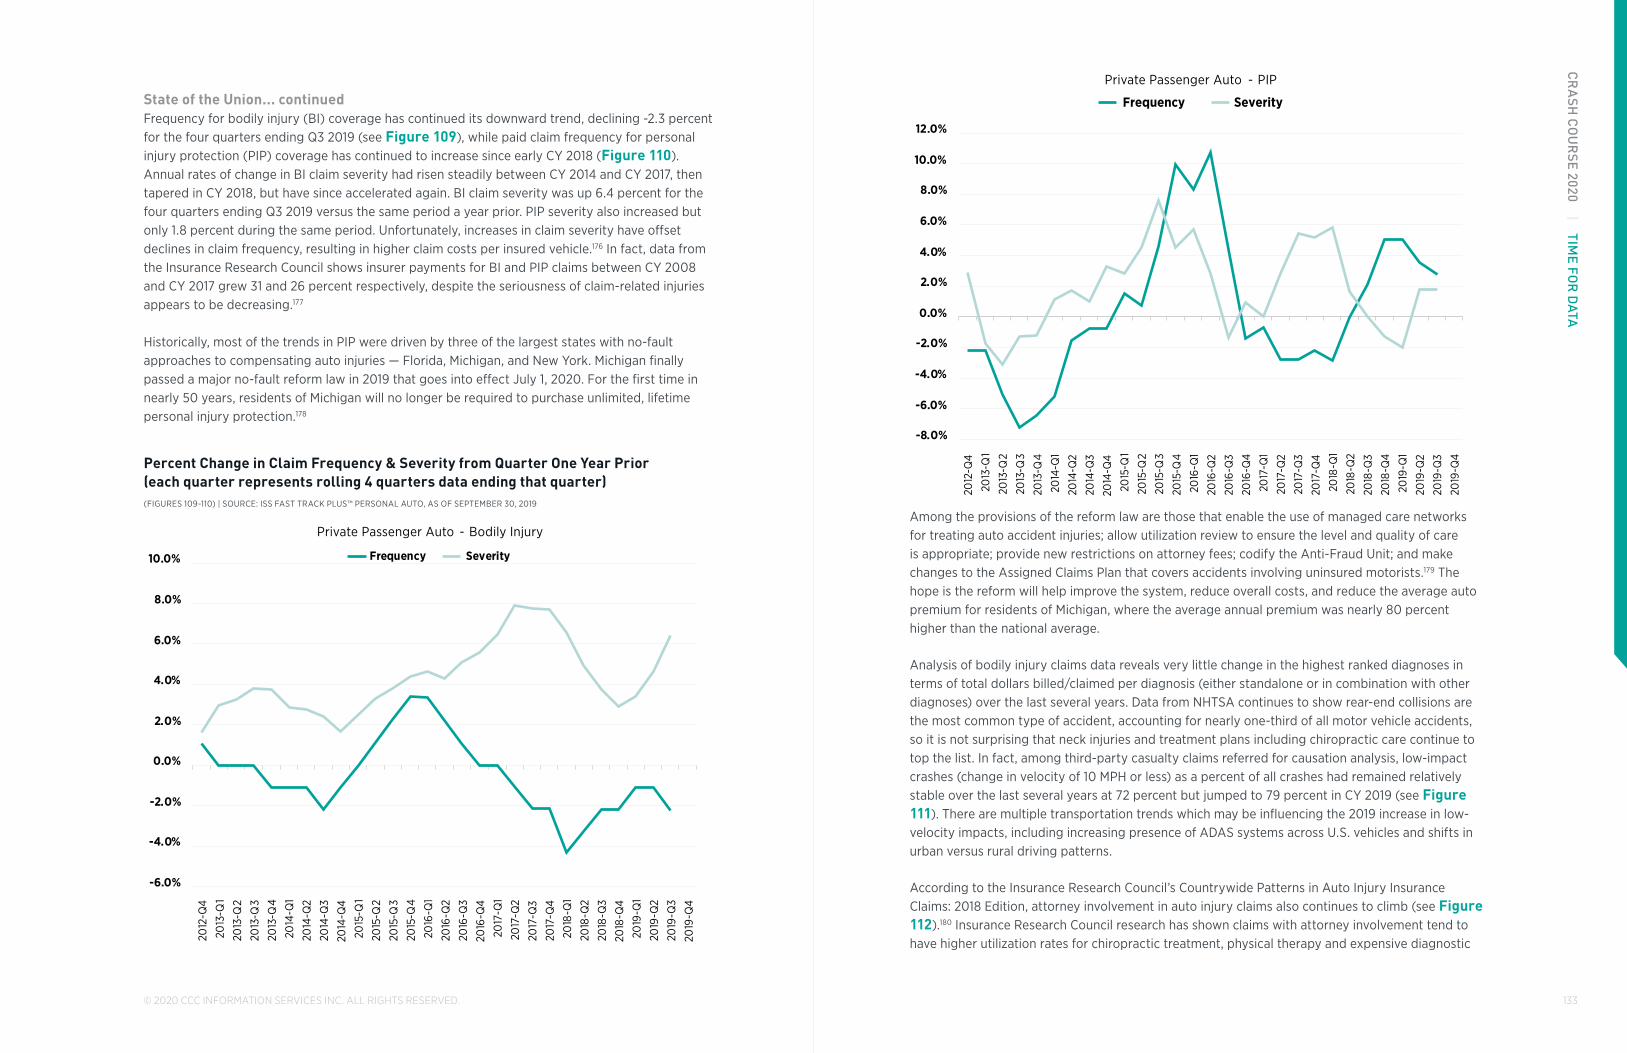
133
CR
ASH
CO
UR
SE 2020 | TIME FO
R D
ATA
© 2020 CCC INFORMATION SERVICES INC. ALL RIGHTS RESERVED.
-8.0%
-6.0%
-4.0%
-2.0%
0.0%
2.0%
4.0%
6.0%
8.0%
10.0%
12.0%
2012
-Q4
2013
-Q1
2013
-Q2
2013
-Q3
2013
-Q4
2014
-Q1
2014
-Q2
2014
-Q3
2014
-Q4
2015
-Q1
2015
-Q2
2015
-Q3
2015
-Q4
2016
-Q1
2016
-Q2
2016
-Q3
2016
-Q4
2017
-Q1
2017
-Q2
2017
-Q3
2017
-Q4
2018
-Q1
2018
-Q2
2018
-Q3
2018
-Q4
2019
-Q1
2019
-Q2
2019
-Q3
2019
-Q4
Private Passenger Auto - PIP
Frequency Severity
Among the provisions of the reform law are those that enable the use of managed care networks for treating auto accident injuries; allow utilization review to ensure the level and quality of care is appropriate; provide new restrictions on attorney fees; codify the Anti-Fraud Unit; and make changes to the Assigned Claims Plan that covers accidents involving uninsured motorists.179 The hope is the reform will help improve the system, reduce overall costs, and reduce the average auto premium for residents of Michigan, where the average annual premium was nearly 80 percent higher than the national average.
Analysis of bodily injury claims data reveals very little change in the highest ranked diagnoses in terms of total dollars billed/claimed per diagnosis (either standalone or in combination with other diagnoses) over the last several years. Data from NHTSA continues to show rear-end collisions are the most common type of accident, accounting for nearly one-third of all motor vehicle accidents, so it is not surprising that neck injuries and treatment plans including chiropractic care continue to top the list. In fact, among third-party casualty claims referred for causation analysis, low-impact crashes (change in velocity of 10 MPH or less) as a percent of all crashes had remained relatively stable over the last several years at 72 percent but jumped to 79 percent in CY 2019 (see Figure 111). There are multiple transportation trends which may be influencing the 2019 increase in low-velocity impacts, including increasing presence of ADAS systems across U.S. vehicles and shifts in urban versus rural driving patterns.
According to the Insurance Research Council’s Countrywide Patterns in Auto Injury Insurance Claims: 2018 Edition, attorney involvement in auto injury claims also continues to climb (see Figure 112).180 Insurance Research Council research has shown claims with attorney involvement tend to have higher utilization rates for chiropractic treatment, physical therapy and expensive diagnostic
State of the Union... continuedFrequency for bodily injury (BI) coverage has continued its downward trend, declining -2.3 percent for the four quarters ending Q3 2019 (see Figure 109), while paid claim frequency for personal injury protection (PIP) coverage has continued to increase since early CY 2018 (Figure 110). Annual rates of change in BI claim severity had risen steadily between CY 2014 and CY 2017, then tapered in CY 2018, but have since accelerated again. BI claim severity was up 6.4 percent for the four quarters ending Q3 2019 versus the same period a year prior. PIP severity also increased but only 1.8 percent during the same period. Unfortunately, increases in claim severity have offset declines in claim frequency, resulting in higher claim costs per insured vehicle.176 In fact, data from the Insurance Research Council shows insurer payments for BI and PIP claims between CY 2008 and CY 2017 grew 31 and 26 percent respectively, despite the seriousness of claim-related injuries appears to be decreasing.177
Historically, most of the trends in PIP were driven by three of the largest states with no-fault approaches to compensating auto injuries — Florida, Michigan, and New York. Michigan finally passed a major no-fault reform law in 2019 that goes into effect July 1, 2020. For the first time in nearly 50 years, residents of Michigan will no longer be required to purchase unlimited, lifetime personal injury protection.178
Percent Change in Claim Frequency & Severity from Quarter One Year Prior (each quarter represents rolling 4 quarters data ending that quarter) (FIGURES 109-110) | SOURCE: ISS FAST TRACK PLUS™ PERSONAL AUTO, AS OF SEPTEMBER 30, 2019
-6.0%
-4.0%
-2.0%
0.0%
2.0%
4.0%
6.0%
8.0%
10.0%
2012
-Q4
2013
-Q1
2013
-Q2
2013
-Q3
2013
-Q4
2014
-Q1
2014
-Q2
2014
-Q3
2014
-Q4
2015
-Q1
2015
-Q2
2015
-Q3
2015
-Q4
2016
-Q1
2016
-Q2
2016
-Q3
2016
-Q4
2017
-Q1
2017
-Q2
2017
-Q3
2017
-Q4
2018
-Q1
2018
-Q2
2018
-Q3
2018
-Q4
2019
-Q1
2019
-Q2
2019
-Q3
2019
-Q4
Private Passenger Auto - Bodily Injury
Frequency Severity

135
CR
ASH
CO
UR
SE 2020 | TIME FO
R D
ATA
© 2020 CCC INFORMATION SERVICES INC. ALL RIGHTS RESERVED.
Medical inflation is in large part being driven by a number of key variables.
StateDi�erences
HigherSpeeds
USHealthcare
Insurers
Age &Clinical
CareTreatmentComplexity
Age &Driving
SafetySystems
DiagnosticIntensity
AlcoholMarijuana
OpioidEpidemic
UnsafeBehavior
Evidence-Based
Medicine
CLAIMSEVERITY
To understand some of the key factors driving the above trends in auto BI and PIP claim frequency and loss costs, Auto Injury Solutions, Inc. (AIS), a CCC company, completed an analysis of over 4 million auto BI and PIP /Medpay claims processed through CCC’s casualty products for the period CY 2015-CY 2019. The results of this analysis are outlined below.
Bodily-Injury Claims ReviewFor the period of study (CY 2015 to CY 2019), the top diagnoses for bodily injury claims in terms of overall dollars charged have remained consistent, with neck pain (Cervicalgia) and neck sprain and strain among the top one or two positions in the last four years (see Figure 113). Subsequently, there were only moderate changes in both the procedure utilization by category (see Figure 114), and the medical procedures billed for treatment of bodily injury claims (see Figure 115), underscoring the consistency in the types of injuries, diagnoses, and treatment over that period. Worth noting is a comparison of the top diagnoses based on dollars billed versus the top procedures based on dollars billed underscore the fact that the highest frequency diagnoses are not directly related to the highest cost procedures. In other words, the majority of injuries from high frequency lower speed accidents involve treatments with lower overall costs, while lower frequency high-speed accidents involve treatments with higher overall costs. A noteworthy change in ranking procedures based on dollars-billed is the increase in the ranking for emergency department visits and the appearance of “CT head/brain w/o contrast material” among the top 10 procedures billed in the last five years. There is some debate that greater public awareness of traumatic brain injuries among athletes who have sustained numerous concussive head injuries has led to more individuals injured in vehicle crashes concerned about similar injuries, subsequently leading to more claims with related medical procedures. According to data from the Centers for Disease Control and Prevention, TBI-related emergency visits, hospitalizations and deaths increased 53 percent between CY 2007 and CY 2014.184
procedures such as MRIs and CTs, even when comparing claimants with similar injuries.181 Growing use of ‘lien-doctors’ (typically referred to injured by plaintiffs’ attorneys) that agree to provide medical treatment for the injured and get paid after the litigation is resolved is also believed to be a factor driving up litigation costs overall as well. In fact, there is growing belief that increases in casualty claims severity exceeding the CPI medical inflation rate can be attributed to increasing attorney representation fees.183
Low Impact (change in velocity of 10 MPH or less) as a Percent of All Crashes for Third Party Casualty Claims Referred for Causation Analysis, CY2012- CY2019 (FIGURE 111) | SOURCE: CCC INFORMATION SERVICES INC., AIS
71%75% 72% 74% 72% 72% 72%
79%
CY2012 CY2013 CY2014 CY2015 CY2016 CY2017 CY2018 CY2019
Attorney Involvement in Auto Injury Claims (FIGURE 112) | SOURCE: INSURANCE RESEARCH COUNCIL, “COUNTRYWIDE PATTERNS IN AUTO INJURY INSURANCE CLAIMS: 2018 EDITION.
49%
32%
50%
36%
52%
39%
BI Claims
PIP Claims
CY2017 CY2012 CY2007
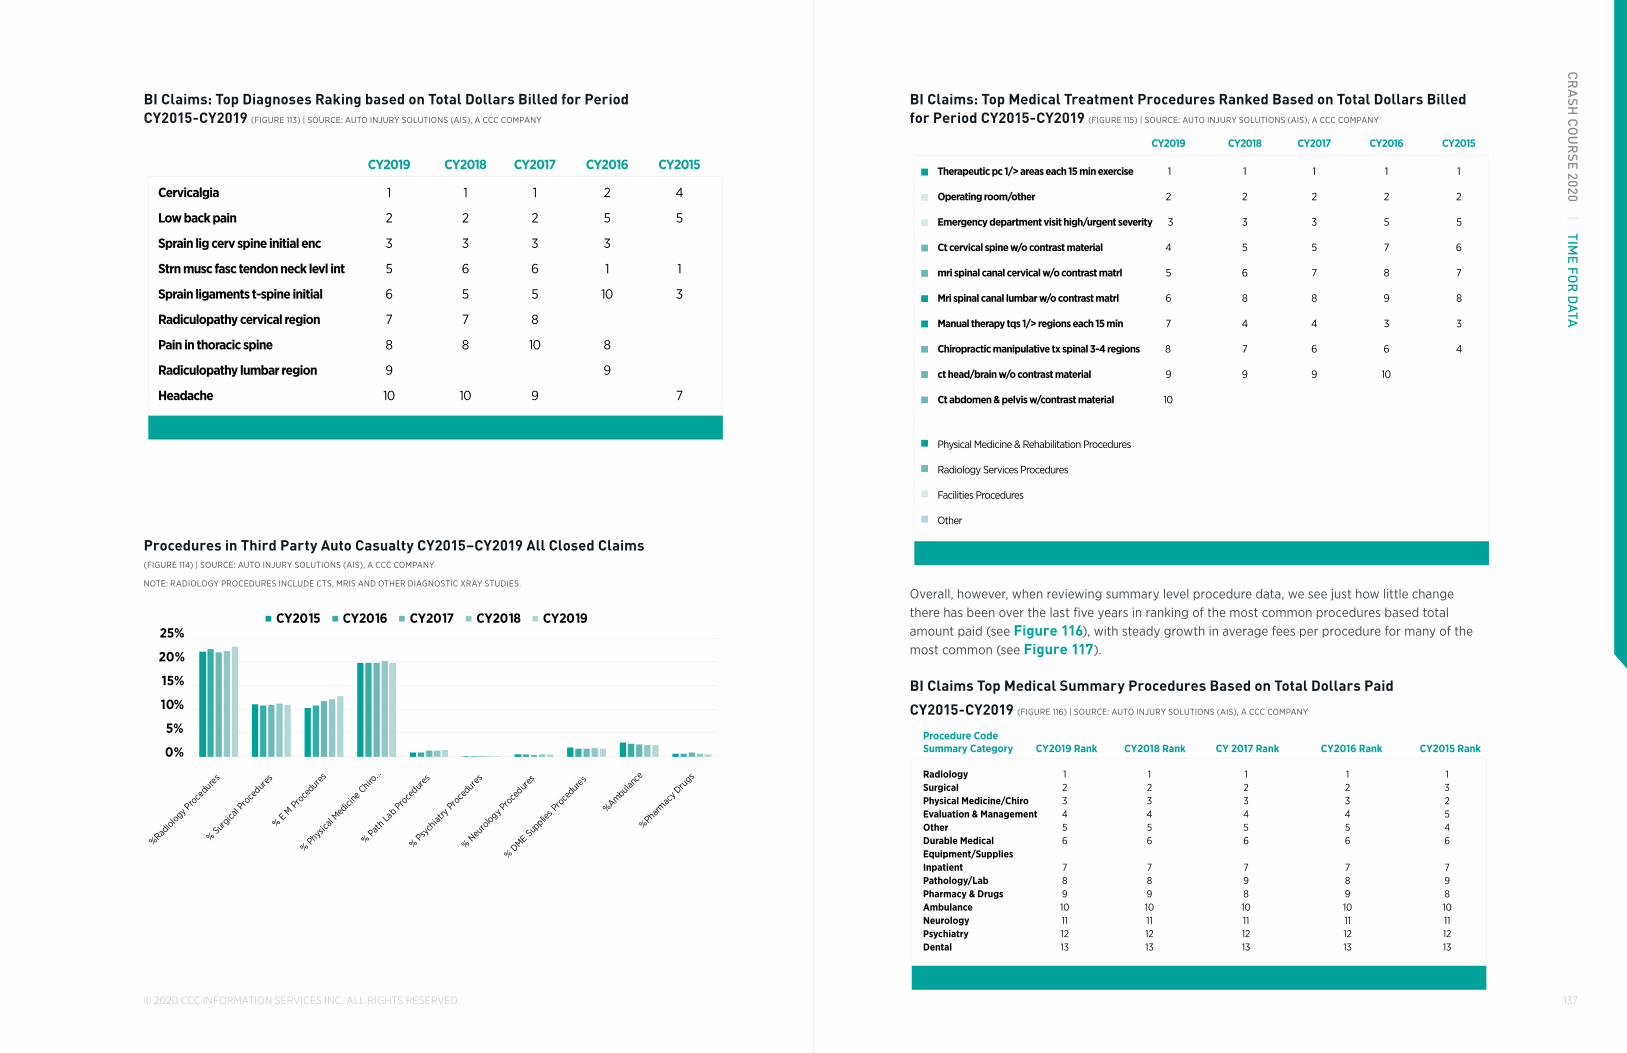
137
CR
ASH
CO
UR
SE 2020 | TIME FO
R D
ATA
© 2020 CCC INFORMATION SERVICES INC. ALL RIGHTS RESERVED.
BI Claims: Top Medical Treatment Procedures Ranked Based on Total Dollars Billed for Period CY2015-CY2019 (FIGURE 115) | SOURCE: AUTO INJURY SOLUTIONS (AIS), A CCC COMPANY
CY2019 CY2018 CY2017 CY2016 CY2015
Therapeutic pc 1/> areas each 15 min exercise 1 1 1 1 1
Operating room/other 2 2 2 2 2
Emergency department visit high/urgent severity 3 3 3 5 5
Ct cervical spine w/o contrast material 4 5 5 7 6
mri spinal canal cervical w/o contrast matrl 5 6 7 8 7
Mri spinal canal lumbar w/o contrast matrl 6 8 8 9 8
Manual therapy tqs 1/> regions each 15 min 7 4 4 3 3
Chiropractic manipulative tx spinal 3-4 regions 8 7 6 6 4
ct head/brain w/o contrast material 9 9 9 10
Ct abdomen & pelvis w/contrast material 10
Physical Medicine & Rehabilitation Procedures
Radiology Services Procedures
Facilities Procedures
Other
Overall, however, when reviewing summary level procedure data, we see just how little change there has been over the last five years in ranking of the most common procedures based total amount paid (see Figure 116), with steady growth in average fees per procedure for many of the most common (see Figure 117).
BI Claims Top Medical Summary Procedures Based on Total Dollars Paid
CY2015-CY2019 (FIGURE 116) | SOURCE: AUTO INJURY SOLUTIONS (AIS), A CCC COMPANY
Radiology 1 1 1 1 1Surgical 2 2 2 2 3Physical Medicine/Chiro 3 3 3 3 2Evaluation & Management 4 4 4 4 5Other 5 5 5 5 4Durable Medical 6 6 6 6 6Equipment/SuppliesInpatient 7 7 7 7 7Pathology/Lab 8 8 9 8 9Pharmacy & Drugs 9 9 8 9 8Ambulance 10 10 10 10 10Neurology 11 11 11 11 11Psychiatry 12 12 12 12 12Dental 13 13 13 13 13
Procedure Code Summary Category CY2019 Rank CY2018 Rank CY 2017 Rank CY2016 Rank CY2015 Rank
BI Claims: Top Diagnoses Raking based on Total Dollars Billed for Period CY2015-CY2019 (FIGURE 113) | SOURCE: AUTO INJURY SOLUTIONS (AIS), A CCC COMPANY
CY2019 CY2018 CY2017 CY2016 CY2015
Cervicalgia 1 1 1 2 4
Low back pain 2 2 2 5 5
Sprain lig cerv spine initial enc 3 3 3 3
Strn musc fasc tendon neck levl int 5 6 6 1 1
Sprain ligaments t-spine initial 6 5 5 10 3
Radiculopathy cervical region 7 7 8
Pain in thoracic spine 8 8 10 8
Radiculopathy lumbar region 9 9
Headache 10 10 9 7
Procedures in Third Party Auto Casualty CY2015–CY2019 All Closed Claims (FIGURE 114) | SOURCE: AUTO INJURY SOLUTIONS (AIS), A CCC COMPANY
NOTE: RADIOLOGY PROCEDURES INCLUDE CTS, MRIS AND OTHER DIAGNOSTIC XRAY STUDIES.
0%
5%
10%
15%
20%
25%
%Radiology P
roce
dures
% Surgica
l Pro
cedur
es
% E M Pro
cedure
s
% Physica
l Med
icine
Chiro…
% Path La
b Proce
dures
% Psych
iatry
Proce
dures
% Neu
rology P
roce
dures
% DME
Supplie
s Pro
cedure
s
%Ambulance
%Pharmac
y Dru
gs
CY2015 CY2016 CY2017 CY2018 CY2019

139
CR
ASH
CO
UR
SE 2020 | TIME FO
R D
ATA
© 2020 CCC INFORMATION SERVICES INC. ALL RIGHTS RESERVED.
So why are third-party medical costs increasing? The newer drivers of rising cost are twofold: a) the same types of injuries are being treated with more expensive treatment approaches (e.g., emergency room and hospital related treatments); and b) cost-increases in these more expensive care modalities are increasing at a much faster rate than traditional modalities such as chiropractic and physical therapy related procedures.
PIP/Medpay Claims ReviewPIP/Medpay claims analyzed from CY 2015 to CY 2019 reveal very little change in the diagnoses of injuries: neck pain (Cervicalgia) or neck sprain and strain held the top spots in four out of the last five years, while low back pain or lumbar sprain and strain was typically in second place (see Figure 118). Medical procedures for PIP/Medpay claims — both in terms of frequency (see Figure 119) and when ranked in terms of dollars billed (see Figure 120) — saw greater use of emergency room and neurology procedures.
PIP/Medpay Claims: Highest Ranked Diagnoses in Terms of Dollars Billed/Claimed for Period CY2015-CY2019 (FIGURE 118) | SOURCE: AUTO INJURY SOLUTIONS (AIS), A CCC COMPANY
CY2019 CY2018 CY2017 CY2016 CY2015
Cervicalgia 1 1 2 4 2
Sprain lig cerv spine initial enc 2 2 1 3
Strn musc fasc tendon neck levl int 3 3 4 6 4
Low back pain 4 4 6 9 3
Radiculopathy cervical region 5 5 9
Neck sprain and strain 6 9 5 1 1
Car occ injured head initial enc 7 7 8
Radiculopathy lumbar region 8 8 7
Oth iv disc displacement lumbar rgn 9 9 5
Ct abdomen & pelvis w/contrast material 10 10
DIAGNOSIS RANKING BASED ON DOLLARS CHARGED
Average Billed Amount per Procedure for Common Third Party Procedures
CY2015-CY2019 (FIGURE 117) | SOURCE: AUTO INJURY SOLUTIONS (AIS), A CCC COMPANY
$0 $500 $1,000 $1,500 $2,000 $2,500 $3,000 $3,500 $4,000 $4,500 $5,000
Ambulance Air Lift
Ambulance Supplies
Emergency Advanced Life Support
Emergency Basic Life Support
Non Emergency Advanced Life Support
Non Emergency Basic Life Support
Dental
Durable Medical Equipment/Supplies
High Level E&M
Low Level E&M
Moderate Level E&M
Inpatient Procedure Codes
Electromyography/Nerve Conduction
Drug Testing
Anxiolytics/Sedatives
Nonsteroidal Anti-inflammatory
Opioid
Active Physical Medicine/Chiro
Passive Physical Medicine/Chiro
Psychiatry
Computerized Tomography
Magnetic Resonance Imaging
Ultrasound
X-Ray
Anesthesia
Arthroscopy
Spinal Injections Cervical/Thoracic
Spinal Injections Lumbar/Sacral
CY2015 CY2016 CY2017 CY2018 CY2019
What has seen significant change is the average number of days between the first treatment date of service to the last treatment date of service, which grew from 140 days in CY 2015 to 211 days in CY 2019, while the median number of days grew from 85 days to 91 days over the same period.
Historically, increases in utilization were a principal cause for the rising costs in medical dollars for BI claims. However, for the observation period from CY 2015 to CY 2019, the number of unique procedures has essentially been flat (21 across all five years), as has the average number of procedures: 175 in CY 2015, 172 in CY 2016, 168 in CY 2017, 172 in CY 2018 and 174 in CY 2019.

141
CR
ASH
CO
UR
SE 2020 | TIME FO
R D
ATA
© 2020 CCC INFORMATION SERVICES INC. ALL RIGHTS RESERVED.
This also underscores a trend to monitor — ADAS may be helping reduce the frequency of low speed crashes with less severe injuries, leaving carriers with more crashes with higher velocity collisions where injuries are more severe. Additionally, rising costs are coming with more costly procedures, higher costs per procedure and rising number of visits. Figure 121 shows how the average number of unique procedures for first-party claims was unchanged at 10 procedures throughout the period analyzed, but the average number of procedures grew from 98 to 119 between CY 2015 and CY 2019.
Finally, a comparison of the average charge-per-claim and the average charge-per-claim excluding duplicates reveals the increase in medical inflation, where the same types of treatments and procedures are simply being billed at higher rates (see Figure 122).
First Party Casualty — Average Total Number of Procedures Increasing While Average Number of Unique Procedures Remains Flat All Closed Claims CY2015-CY2019 (FIGURE 121) | SOURCE: AUTO INJURY SOLUTIONS (AIS), A CCC COMPANY
10 10 10 10 10
98 101 105 108119
CY2015 CY2016 CY2017 CY2018 CY2019
Avg # of unique Procedures Avg # of Procedures
PIP/Medpay Increasing Average Charges per Claim CY2015-CY2019 (FIGURE 122) | SOURCE: AUTO INJURY SOLUTIONS (AIS), A CCC COMPANY
$0$2,000
$4,000$6,000$8,000
$10,000$12,000$14,000
$16,000
$18,000$20,000
CY2015 CY2016 CY2017 CY2018 CY2019
Avg Charge per Claim Avg Charge per Claim (excl. dups)
Procedures in PIP/Medpay Auto Casualty CY2015–CY2019 All Closed Claims (FIGURE 119) | SOURCE: AUTO INJURY SOLUTIONS (AIS), A CCC COMPANY
0%5%
10%15%
20%25%30%
%Radiology P
roce
dures
% Surgica
l Pro
cedur
es
% E M Pro
cedure
s
% Physica
l Med
icine
Chiro…
% Path La
b Proce
dures
% Psych
iatry
Proce
dures
% Neu
rology P
roce
dures
% DME
Supplie
s Pro
cedure
s
%Ambulance
%Pharmac
y Dru
gs
CY2015 CY2016 CY2017 CY2018 CY2019
PIP/Medpay Claims: Top Medical Procedures in Terms of Dollars Billed/Claimed for Period CY2015-CY2019 (FIGURE 120) | SOURCE: AUTO INJURY SOLUTIONS (AIS), A CCC COMPANY
CY2019 CY2018 CY2017 CY2016 CY2015
Therapeutic pc 1/> areas each 15 min exercise 1 1 1 1 1
Emergency department visit high/urgent severity 2 2 2 2 6
Manual therapy tqs 1/> regions each 15 min 3 4 4 4 3
Ct cervical spine w/o contrast material 4 3 3 3 2
Chiropractic manipulative tx spinal 3-4 regions 5 5 5 5 5
ct head/brain w/o contrast material 6 6 6 6 4
Mri spinal canal cervical w/o contrast matrl 7 7 8 8 9
Mri spinal canal lumbar w/o contrast matrl 8 8 9 9 10
Operating room/other 9 9 7 7 8
Emergency dept visit high severity&threat funcj 10 10 10
Physical Medicine & Rehabilitation Procedures
Radiology Services Procedures
Facilities Procedures
DIAGNOSIS RANKING BASED ON DOLLARS CHARGED
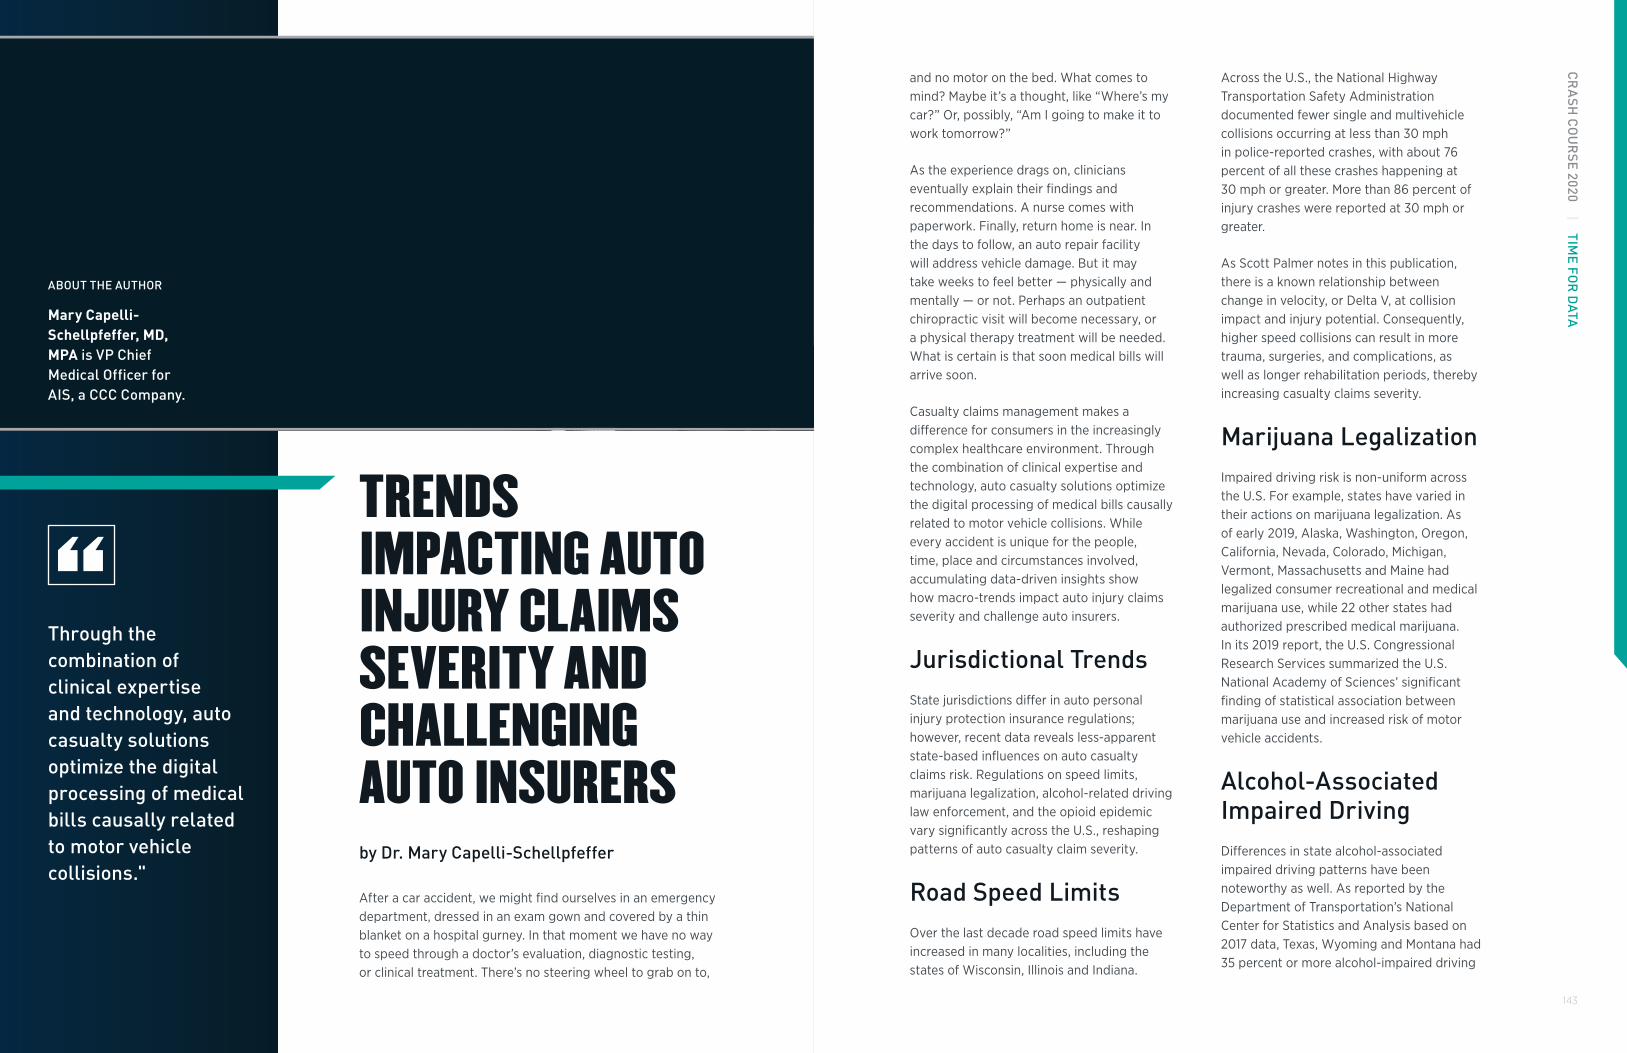
143
CR
ASH
CO
UR
SE 2020 | TIME FO
R D
ATA
“
After a car accident, we might find ourselves in an emergency department, dressed in an exam gown and covered by a thin blanket on a hospital gurney. In that moment we have no way to speed through a doctor’s evaluation, diagnostic testing, or clinical treatment. There’s no steering wheel to grab on to,
Through the combination of clinical expertise and technology, auto casualty solutions optimize the digital processing of medical bills causally related to motor vehicle collisions."
by Dr. Mary Capelli-Schellpfeffer
TRENDS IMPACTING AUTO INJURY CLAIMS SEVERITY AND CHALLENGING AUTO INSURERS
Across the U.S., the National Highway Transportation Safety Administration documented fewer single and multivehicle collisions occurring at less than 30 mph in police-reported crashes, with about 76 percent of all these crashes happening at 30 mph or greater. More than 86 percent of injury crashes were reported at 30 mph or greater.
As Scott Palmer notes in this publication, there is a known relationship between change in velocity, or Delta V, at collision impact and injury potential. Consequently, higher speed collisions can result in more trauma, surgeries, and complications, as well as longer rehabilitation periods, thereby increasing casualty claims severity.
Marijuana LegalizationImpaired driving risk is non-uniform across the U.S. For example, states have varied in their actions on marijuana legalization. As of early 2019, Alaska, Washington, Oregon, California, Nevada, Colorado, Michigan, Vermont, Massachusetts and Maine had legalized consumer recreational and medical marijuana use, while 22 other states had authorized prescribed medical marijuana. In its 2019 report, the U.S. Congressional Research Services summarized the U.S. National Academy of Sciences’ significant finding of statistical association between marijuana use and increased risk of motor vehicle accidents.
Alcohol-Associated Impaired DrivingDifferences in state alcohol-associated impaired driving patterns have been noteworthy as well. As reported by the Department of Transportation’s National Center for Statistics and Analysis based on 2017 data, Texas, Wyoming and Montana had 35 percent or more alcohol-impaired driving
and no motor on the bed. What comes to mind? Maybe it’s a thought, like “Where’s my car?” Or, possibly, “Am I going to make it to work tomorrow?”
As the experience drags on, clinicians eventually explain their findings and recommendations. A nurse comes with paperwork. Finally, return home is near. In the days to follow, an auto repair facility will address vehicle damage. But it may take weeks to feel better — physically and mentally — or not. Perhaps an outpatient chiropractic visit will become necessary, or a physical therapy treatment will be needed. What is certain is that soon medical bills will arrive soon.
Casualty claims management makes a difference for consumers in the increasingly complex healthcare environment. Through the combination of clinical expertise and technology, auto casualty solutions optimize the digital processing of medical bills causally related to motor vehicle collisions. While every accident is unique for the people, time, place and circumstances involved, accumulating data-driven insights show how macro-trends impact auto injury claims severity and challenge auto insurers.
Jurisdictional TrendsState jurisdictions differ in auto personal injury protection insurance regulations; however, recent data reveals less-apparent state-based influences on auto casualty claims risk. Regulations on speed limits, marijuana legalization, alcohol-related driving law enforcement, and the opioid epidemic vary significantly across the U.S., reshaping patterns of auto casualty claim severity.
Road Speed LimitsOver the last decade road speed limits have increased in many localities, including the states of Wisconsin, Illinois and Indiana.
Mary Capelli-Schellpfeffer, MD, MPA is VP Chief Medical Officer for AIS, a CCC Company.
ABOUT THE AUTHOR

145
CR
ASH
CO
UR
SE 2020 | TIME FO
R D
ATA
© 2020 CCC INFORMATION SERVICES INC. ALL RIGHTS RESERVED.
Continued
TRENDS IMPACTING AUTO INJURY CLAIMS...
drivers (20.5 percent) was aged 65 years or older. Of these, 3.4 percent were accountable for 50,807 of Michigan’s total number of 314,921 crashes in 2017, suggesting a highly disproportionate risk of collision for senior drivers.
Substantiating the recognition of age-related driving risk for seniors, a published 2017 national report of age-related differences in fatal intersection crashes shows teens and drivers aged 55 years and older were “over-involved” in fatal intersection crashes, while drivers aged 20 to 54 years were “under-involved. Remarkably, the study showed that the fatal intersection driving risk across all driver age groups was doubled by age 85.
Treatment ComplexityThe third major trend related to auto casualty claims severity is greater treatment complexity. Treatment complexity in auto casualty reflects broader healthcare initiatives related to evidence-based medicine (EBM) guidelines, diagnostic intensity, and aging-related care considerations.
• EBM guidelines, protocols, and recommended practices influence clinical evaluation, treatment and rehabilitation nationally, by jurisdictional and on a specialty basis. As electronic medical record systems penetrate large health system operations, EBM’s incorporation into patient evaluation protocols, prescribing systems, diagnostic testing algorithms and care paths is more routine. For example, the consistent and expanded use of diagnostic imaging with suspected head injury or blunt abdominal
neighborhood and socioeconomic group, law enforcement and healthcare providers continue to struggle to meet the escalating epidemic’s fallout. There is little documented indication that the opioid epidemic has abated, suggesting continued driving risk associated with prescribed and illicit opioid use.
Aging PopulationsA second macro trend shifting U.S. auto casualty claims severity is seen with the growth of aging U.S. populations. A key data insight is that the generational transition with the maturing of “Baby Boomers” has not been distributed evenly across all states. Between 2007 and 2016, the number of people aged 65 years or older in the United States increased by 30 percent (males by 35 percent and females by 26 percent), with the total population across all age groups increased by 7 percent. States most recently affected by this demographic shift include Texas, California, Florida, Georgia, North Carolina, Washington and Arizona.
As generational aging has impacted state populations, the distribution of licensed drivers has trended older as well. For example, of Michigan’s 2017 population, 72.3 percent were reported as licensed drivers. In 2017, one out of five Michigan licensed
fatalities, while Rhode Island’s experience was at 41 percent, Connecticut at 43 percent and Washington D.C. at 51 percent.
Alcohol-impaired driving fatalities are an indicator of the prevalence of driving under the influence in the state of record, as coroner involvement and death certificate data are rigorously addressed. These fatalities have been understood as the “tip of the iceberg” when it comes to the scale of each state’s challenge to combat drunken driving behaviors.
Opioid Associated Driving FatalitiesImpaired driving attributable to use of opioids also intensified across the last decade. For the U.S., the percentage of fatally injured drivers who tested positive for prescription opioids rose seven-fold from 1 percent in 1995 to over 7 percent in 2015. According to the U.S. Centers for Disease Control and Prevention, between 2016 and 2017, Oregon, Arizona, Minnesota, and North Carolina experienced significantly increased numbers of opioid deaths, signaling epidemic crises in those areas
While public awareness has increased about the opioid use prevalence in every
trauma (BAT) has been in part due to generally accepted EBM guidelines.
• Attention to diagnoses commonly associated with motor vehicle accidents has increased. For example, heightened monitoring of traumatic brain injury diagnoses has evolved in many states in tandem with state emergency medical systems (EMS) and state trauma registries. As a result, there is wider awareness the association between motor vehicle accidents and the occurrence of clinical conditions such as headaches, concussion, and traumatic brain injury or TBI. First responders and emergency clinical providers are trained to evaluate for these conditions in auto accidents, just as today team coaches are expected to manage player risk of concussion in sports situations across all age groups.
• Age-related treatment complexity, for pediatric and senior populations, is now widely recognized. In this regard, the American College of Surgeons and the Pediatric Trauma Society’s guidelines have been influential, as these are the basis for EMS protocols in most states. Clinically relevant concerns include medical frailty, eligibility for certain types of care, or difficulty with post-injury rehabilitation protocols. Regarding seniors, data show that in injury treatment scenarios, older patients are likely to have more than one pre-existing medical condition, take multiple medications, and be at risk for complications even with simple procedures.

147
CR
ASH
CO
UR
SE 2020 | TIME FO
R D
ATA
© 2020 CCC INFORMATION SERVICES INC. ALL RIGHTS RESERVED.
SummaryJurisdictional differences, aging populations and increasing treatment complexity are impacting auto casualty risk and claims management. These trends are likely to continue into 2020 and beyond. The good news is that technology solutions can assist carriers in managing locational, generational and healthcare-related changes in auto casualty claims severity.
Moreover, by aligning deep medical insights about how auto crashes might result in injuries, along with state-specific automated processing of healthcare transactions, medical bill payments can be addressed
more efficiently. Efficiency gains rely on the use of artificial intelligence, machine learning, and data analytics to advance digital claims management.
These three key innovations link the sciences of engineering and medicine. As a result, the time-in-process for resolving the reimbursed relationships in an auto casualty claim between providers, healthcare facilities, and allied health resources can be reduced. Furthermore, the consumer can benefit from the knowledge that their insurer is addressing their claim with expert processing relying on the facts and details personal to their accident.
“We continue to focus on our future through the lens of an ecosystem, which revolves around our customers and employees. The digital realities of artificial intelligence, machine learning, robotic processing, telematics and digital process mapping are all escalating the rate of change. This has also increased the possibilities of connectivity and new joint ventures within the industry. As a company, we’re continually evaluating how we evolve the skills of our employees so they can more easily embrace the changing environment; the industry collaborators we work with to help create the change, and ability for all of it to be seamless for the customer."
How do you/your company spend your time?
Frank CarniHead of Auto ClaimsFarmers Insurance
Continued
TRENDS IMPACTING AUTO INJURY CLAIMS...
149
CCC INSIGHTC
RA
SH C
OU
RSE 2020 | TIM
E FOR
DATA
The types of auto-related BI and PIP/Medpay diagnoses most frequently seen in the last three years have remained relatively unchanged and are predominately by nature soft tissue neck and back injuries. Despite the prevalence of improved head restraint systems, seat backs and other related occupant safety features, treatment has become more complex and the overall cost of treating these same injuries has increased.
At the same time, the average age of the claimant continues to increase in both BI and PIP claims. According to Pew Research, 29 percent of Baby Boomers aged 65-72 years older were still employed or looking for work in CY 2018, a higher share than for the Silent Generation or Greatest Generation when they were the same age.185 With employment high among an age group traditionally retired, it also means more individuals are on the roads during peak commuting hours. Data from the 2014-2018 American Community Survey (ACS) shows labor force participation rates among those ages 65 to 74 years increased to 25.7 percent from 25.2 percent in the 2009-2013 ACS and increased from 5.9 percent to 6.6 percent for those ages 75 years and older.186 Continued increases in this metric over the longer-term point to higher medical costs per patient as the treatment of older patients, all things considered equal, can become more complex and thus more costly relative to their younger counterparts. With advanced age, individuals may appear during crash triage with inter-current health conditions, more use of medications, and physical or psycho-social vulnerabilities in the setting of acute trauma, thereby
Despite the prevalence of improved head restraint systems, seat backs and other related occupant safety features, treatment has become more complex and the overall cost of treating these same injuries has increased.

151
CR
ASH
CO
UR
SE 2020 | TIME FO
R D
ATA
© 2020 CCC INFORMATION SERVICES INC. ALL RIGHTS RESERVED.
CCC INSIGHT CONT.
complicating their initial clinical evaluation and management (E&M) and requiring more initial medical, surgical or diagnostic procedures. According to the U.S. Census Bureau projections, by CY 2030, all Baby Boomers will be older than age 65 — meaning one in every five residents in the U.S. will be of retirement age.187
Recent data from Gallup’s annual Health and Healthcare survey reveals 43 percent of U.S. households have at least one member in the family with a “long-term medical condition, illness or disease that would be considered a ‘preexisting’ condition by a health insurance company,” down slightly from 46 percent from the survey one year prior.188 Preexisting conditions among adults aged 65 and older and aged 50-64 report are reported at a rate twice as high as the rate reported by young adults aged 18-29 (see Figure 123).189
Americans’ Reports of Preexisting Medical Conditions in Their Household, 2018-2019 (FIGURE 123) | SOURCE: MCCARTHY, JUSTIN. “43% OF U.S. HOUSEHOLDS REPORT PREEXISTING CONDITIONS.” WWW.GALLUP.COM, DECEMBER
6, 2019.
16%
23%
31%
33%
38%
40%
49%
50%
18-29 years old
30-49 years old
50-64 years old
65+ years old
Respondent or family member Respondent personally
Do you, personally, or does anyther member of your family livingwith you, have a long-term medical condition, illness or disease thatwould be considered a “pre-existing condition” by a healthinsurance company?
Additionally, many of the top BI and PIP/Medpay treatment procedures have ranges to be considered when being billed. These ranges include the level of service selected or the number of units that are employed. The percentage of claims that include these types of medical services has grown; in fact, the Insurance Research Council recently published research that showed medical utilization rates exceeding national norms were a primary contributor to high claim costs in eight of the 12 least affordable auto insurance systems.190 Other factors included: High injury claim frequency rates, excessive attorney involvement, and high rates of claim abuse.
As more people move to high-deductible insurance plans or plans with co-insurance provisions that mean higher out-of-pocket expenses, the temptation to find a way to have that covered elsewhere grows.191 Results of a survey conducted by the Kaiser Family Foundation and the L.A. Times reveal annual deductibles in employer-based health plans nearly quadrupled in the last decade, averaging about $1300.192 Yet, more than 40 percent of workers in the high-deductible plans lacked the savings to cover such an expense, choosing instead to cut back on household spending, delaying or skipping needed medical care.193 And the growing number of people who work within the gig economy means fewer covered under group health insurance plans.
Since CY 2016, numerous efforts by the Republican-controlled U.S. government to repeal the ACA have resulted in several changes that weaken the bill. Among these changes were the following. In December 2017, Congress reduced the individual mandate penalty to $0 effective in 2019.194 In 2018, new rules were announced that allow more loosely regulated plans. Additional changes expanded the use of health reimbursement arrangements (HRAs) which let employers use tax-exempt funds to help workers pay for medical plans in entirety, essentially subsidizing workers buying entire health plans on the individual market instead of offering a group plan.195 These changes may enable healthy people to find lower cost coverage, but that coverage may be less comprehensive, and can exclude some pre-existing conditions.196 Finally, in mid-December 2019, Congress passed a repeal of three taxes meant to help pay for the Affordable Care Act, and the 5th U.S. Circuit Court of Appeals ruled that the individual mandate is unconstitutional and unlawful under federal taxation rules. While this ruling weakens the bill, California is appealing the case to the Supreme Court.197
A January CY 2019 report by the Kaiser Family Foundation reported the number of uninsured in the U.S. rose in 2017 for the first time since the implementation of the ACA to 10.2 percent of the nonelderly population (see Figure 124).198 As a result, there are higher numbers of uninsured Americans, which will add to the pressure to reduce healthcare expense, particularly by Medicaid.199 Subsequently, with less money available in the system, the P/C insurance industry might become an even bigger target of cost-shifting in the future.
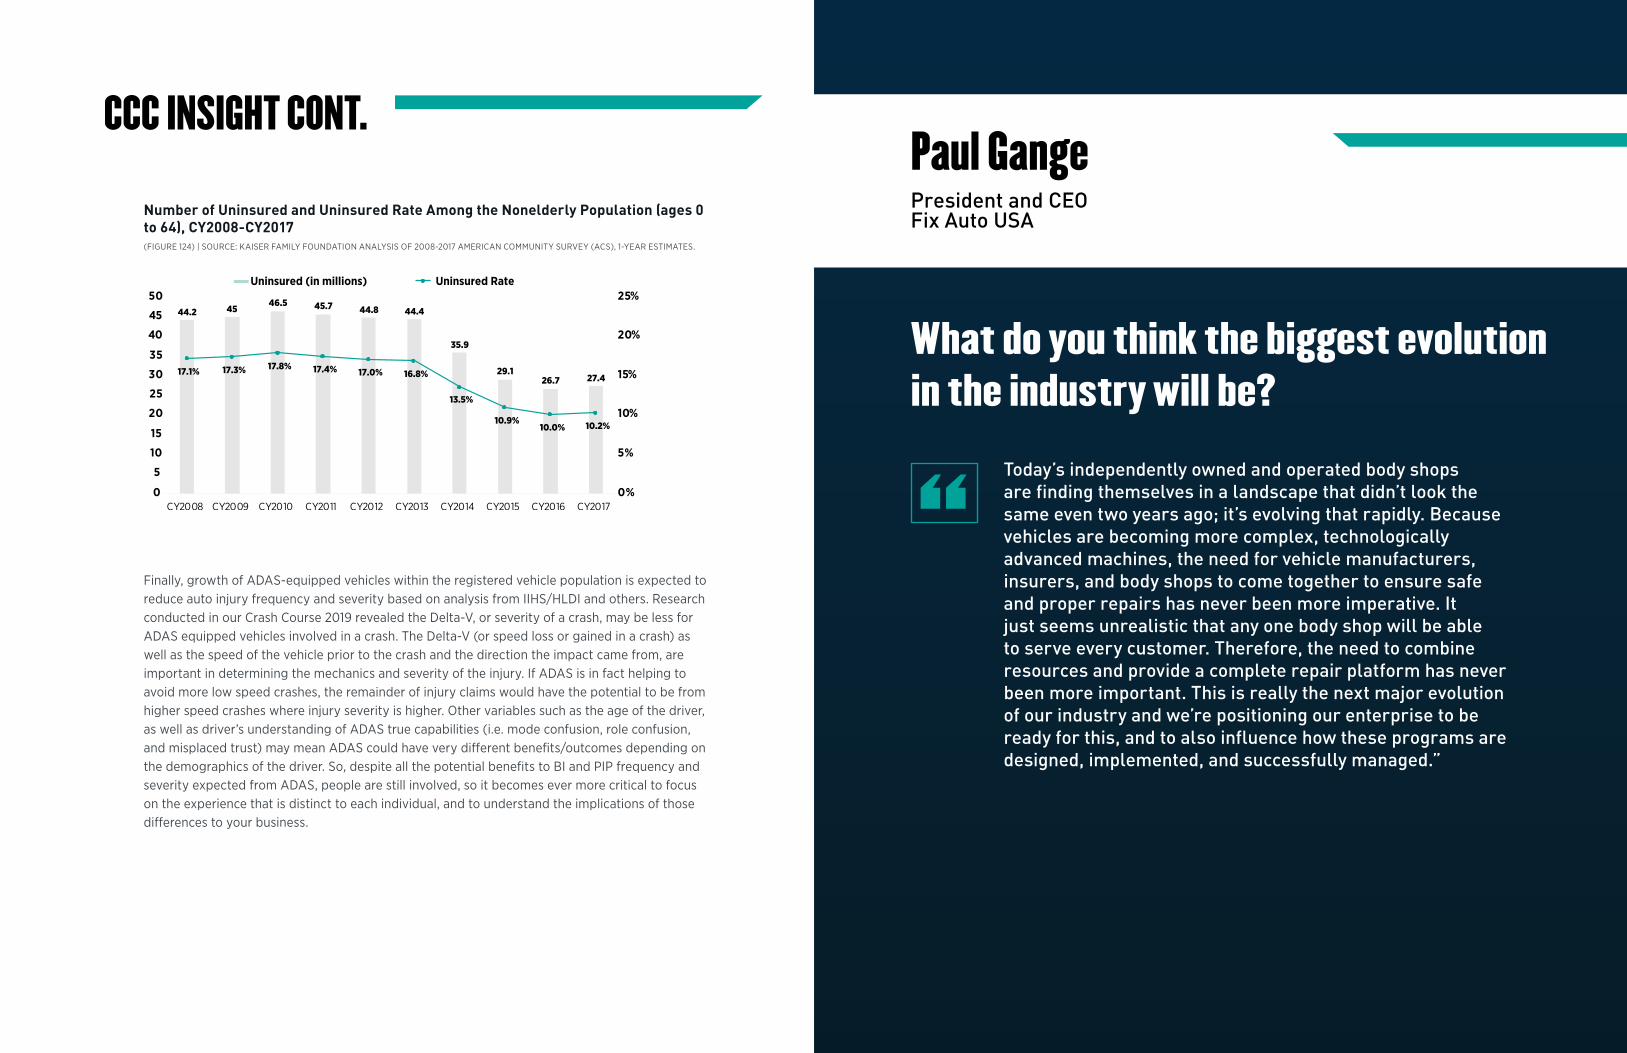
CCC INSIGHT CONT.
Number of Uninsured and Uninsured Rate Among the Nonelderly Population (ages 0 to 64), CY2008-CY2017 (FIGURE 124) | SOURCE: KAISER FAMILY FOUNDATION ANALYSIS OF 2008-2017 AMERICAN COMMUNITY SURVEY (ACS), 1-YEAR ESTIMATES.
44.2 4546.5 45.7 44.8 44.4
35.9
29.126.7 27.4
17.1% 17.3% 17.8% 17.4% 17.0% 16.8%
13.5%
10.9%10.0% 10.2%
0%
5%
10%
15%
20%
25%
0
5
10
15
20
25
30
35
40
45
50
CY2008 CY2009 CY2010 CY2011 CY2012 CY2013 CY2014 CY2015 CY2016 CY2017
Uninsured (in millions) Uninsured Rate
Finally, growth of ADAS-equipped vehicles within the registered vehicle population is expected to reduce auto injury frequency and severity based on analysis from IIHS/HLDI and others. Research conducted in our Crash Course 2019 revealed the Delta-V, or severity of a crash, may be less for ADAS equipped vehicles involved in a crash. The Delta-V (or speed loss or gained in a crash) as well as the speed of the vehicle prior to the crash and the direction the impact came from, are important in determining the mechanics and severity of the injury. If ADAS is in fact helping to avoid more low speed crashes, the remainder of injury claims would have the potential to be from higher speed crashes where injury severity is higher. Other variables such as the age of the driver, as well as driver’s understanding of ADAS true capabilities (i.e. mode confusion, role confusion, and misplaced trust) may mean ADAS could have very different benefits/outcomes depending on the demographics of the driver. So, despite all the potential benefits to BI and PIP frequency and severity expected from ADAS, people are still involved, so it becomes ever more critical to focus on the experience that is distinct to each individual, and to understand the implications of those differences to your business.
“Today’s independently owned and operated body shops are finding themselves in a landscape that didn’t look the same even two years ago; it’s evolving that rapidly. Because vehicles are becoming more complex, technologically advanced machines, the need for vehicle manufacturers, insurers, and body shops to come together to ensure safe and proper repairs has never been more imperative. It just seems unrealistic that any one body shop will be able to serve every customer. Therefore, the need to combine resources and provide a complete repair platform has never been more important. This is really the next major evolution of our industry and we’re positioning our enterprise to be ready for this, and to also influence how these programs are designed, implemented, and successfully managed.”
What do you think the biggest evolution in the industry will be?
Paul GangePresident and CEOFix Auto USA

155
CR
ASH
CO
UR
SE 2020 | TIME TO
PR
EPA
RE06 TIME TO
PREPAREEMBRACING THE NEXT WAVE OF TECH
Until now, the utilization of mobile, AI, and IoT were part of the strategy for pioneers and leaders within our industry.
So, what is next? As we look to 2020 and beyond, it’s important to remember that while we cannot predict the future, we can prepare for it. In this final section of Crash Course 2020, we look at some of the biggest challenges facing the industry, and what opportunities technology of today and the future may offer.

157
CR
ASH
CO
UR
SE 2020 | TIME TO
PR
EPA
RE
© 2020 CCC INFORMATION SERVICES INC. ALL RIGHTS RESERVED.
Moving forward, those same technologies will play a transformative role and will become building blocks to the other technologies such as autonomous vehicles, voice technology, IoT hardware, 5G connectivity, intelligent automation, industrial software, robotics, semiconductors, extended reality, and quantum computing.204
We have moved into the post-digital world — which Accenture writes now means that “… digital technologies are now so integrated into people’s lives that they have become part of consumers’ identities … technology identities are part of an emerging feedback loop ... resulting [in] ‘snapshots’ of insight into customer needs and goals to deliver personalized products and services … [and now] individualized experiences.”205
Transformation of Risk ManagementThe insurance of tomorrow will continue to pay claims but may provide more technology to avoid claims altogether. Already carriers offer customers IoT and sensor technologies to do things like monitor leakage from washing machines and hot water heaters, smart fire detectors that alert emergency services, and health and fitness trackers. As the digital ecosystem becomes more intelligent and understands more about each person’s background, preferences, interests, and intentions, digital experiences will become ever more personalized.
While continuing to be a payer, the insurer of the future will take a holistic approach to customer risk management by evolving to become both a partner and a preventer."
SOURCE: CAPGEMINI AND EFMA. 2019 WORLD INSURANCE REPORT.
“In the future, technology such as location detection, smart sensors and augmented reality will do more than simply collect and deliver information. In CY 2017, researchers used Google Street View images to study the distribution of car types in the U.S. and then used that data to determine the demographic makeup of the country — including things like income level, education, occupation, and even the way you vote in elections.206 More recently, researchers at Stanford and the University of Warsaw in Poland used Street View images of people’s houses to determine how likely they are to be involved in a car accident. Their research found that features visible on a picture of a house were predictive of car accident risk, independent of variables such as driver age or zip code.207 While numerous issues would need to be resolved, the wealth of data available to potentially collect, analyze and utilize will continue to grow rapidly in the future.
Many of the most impactful new technologies developed over the last several decades came from the consumer world.200 The invention of the smartphone released a wave of new mobile technologies that enabled consumers to connect whenever and to whomever they wanted or needed, through new social channels that never existed before. According to data from Pew Research, smartphone adoption grew from 35 percent of U.S. adults in CY 2011 to 81 percent by CY 2019, with nearly 50 percent of all U.S. adults saying they mostly go online using their smartphone.201
Many of the biggest ideas in technology over the past decade have centered on how people communicate, consume, transact and travel. Over the next decade, however, the most profound innovations — and investment opportunities — could be on factory floors, in operating rooms, at mining sites and energy facilities."
Morgan Stanley SOURCE: “THE SECOND MACHINE AGE HITS THE TIPPING POINT.” AUGUST 5, 2019.
“
The addition of sensors in devices like activity trackers, smartphones, smart speakers, vehicles, and more enable companies to provide their customers what they needed with greater convenience and personalization. The number of IoT devices has exploded, outnumbering individual human beings by nearly 400 percent (see Figure 125).202 According to Deloitte, smart home devices alone are expected to see compound annual growth rates of 60 percent, which translates to 600 million smart home devices by 2021.203
IoT Devices Outnumber Human Brains (FIGURE 125) | SOURCE: THE ECONOMIST, UNITED NATIONS (AUTONOMOUS RESEARCH REPORT, APRIL 2018).
13.1
16.3
19.2
22.2
25.2
28.1
7.3 7.4 7.5 7.5 7.6 7.7
2015 2016 2017 2018 2019 2020
IoT Devices (in billions) Humans (in billions)

159
CR
ASH
CO
UR
SE 2020 | TIME TO
PR
EPA
RE
© 2020 CCC INFORMATION SERVICES INC. ALL RIGHTS RESERVED.
Climate Change is CostlyThe University of Cambridge Centre for Risk Studies’ Global Risk Index predicts as much as $584 billion, or 1.55 percent of 2020 global GDP could be erased from the global economy by catastrophic events in 2020 — an increase of 3 percent from the prior year.210 Key to how the world manages its exposure and its recovery are insurance, reinsurance, and insurance-linked securities (ILS) capital.211 Allianz SE estimates fighting climate change will cost companies worldwide nearly $2.5 trillion over the next ten years.212
Significant storms and catastrophic events continued to batter the U.S. in CY 2019. In early July, the meteorological phenomenon ‘Ring of Fire’ hit numerous parts of the Planes, Midwest and Northeast. Several days after baseball-sized hail hit Denver and Fort Collins, as well as other part of WY, NE and SD. In total, these storms as well as others in July alone led to an estimated $2 billion in damage.213 In total, the U.S. experienced three billion-dollar events related to convective storms — economic losses for the first half of the year in the U.S. was 14 percent above the 21st century average.214 Hurricane Dorian slammed into the Bahamas in early September as a Category 5 hurricane with 185 mph winds — one of the strongest cyclones ever recorded in the Atlantic Ocean.215 Also in September, Tropical Storm Imelda dumped more than 40 inches of rain in areas east of Houston into Louisiana, resulting in over 10,000 vehicle flood claims.216 As of late October, CY 2019, California wildfires had caused $25 billion of damage to properties.217 On a single day — October 20, 2019 — nine tornadoes were confirmed to have touched down around Dallas county resulting in losses of around $2 billion — the costliest tornado outbreak in Texas history.218
Changes to the environment bring significant challenges to all — the ability to underwrite the risk, cover the losses, and reduce the exposure from business interruption and property loss will require transformation of traditional insurance models. There is some hope that technology can help address some of these risks. For example, there are several companies (Descartes Labs, Planet Labs, and Jupiter Intelligence) that use data from satellite imagery and sensors, integrate with other data on the weather, terrain, vegetation, humidity, wind, etc. to provide real-time data to firefighters and even model potential dangers from one hour to 50 years out.219
As the number and magnitude of risks grow, insurers’ success is dependent on the ability to use data and technology to deeply understand the risks, to help mitigate losses, to expand coverage and offer extreme personalization. As vehicle, personal tracking devices, and home technologies develop, the ability to use the data collected and data available from numerous other sources will be central to risk management.
For insurance company customers with claims, the integration of numerous new data sets with artificial intelligence and machine learning will help inform recommended course of action.208 In many cases that may mean a claim gets created and routed automatically to the appropriate channel, essentially ‘touchless.’ For the smaller share of claims that fall outside the norm or appear to be a situation where a human interaction would be beneficial, the claim is routed to a human with the appropriate skills and most importantly, the empathy needed for that particular claim. Repetitive tasks like providing status updates and monitoring treatment schedules for injured claimants can be automated — yet personalized, and free up people’s time to focus on the issues that benefit most from the human touch or expertise.
In the 2019 World Insurance Report, Capgemini’s research shows insurance company customers are increasingly interested in new insurance models that could help cover new risk scenarios stemming from changing macro trends such as technology, demographics, and the environment (see Figure 126).209
Capgemini 2019 World Insurance Report — “Customers’ interest in new insurance models, individual and business customers (%), 2019” (FIGURE 126) | SOURCE: CAPGEMINI FINANCIAL SERVICES ANALYSIS, 2019; CAPGEMINI VOICE OF THE CUSTOMER SURVEY, 2019.
35.0%
28.8%
21.1%
15.5%
14.9%
15.4%
46.7%
44.2%
40.9%
34.3%
34.8%
34.0%
Usage-based insurance
On-demand insurance
Proactive value-added services
Parametric insurance
Peer-to-peer insurance
Microinsurance
Business customers Individual customers

161
CR
ASH
CO
UR
SE 2020 | TIME TO
PR
EPA
RE
© 2020 CCC INFORMATION SERVICES INC. ALL RIGHTS RESERVED.
Level 5 — How Far Off?As we discussed at the start of this publication, automakers and other technology companies continue to make huge investments in the "ACES" — autonomy, connected car, electrification, and shared vehicles.
The testing and development of technologies to support a fully autonomous vehicle for personal use, last-mile delivery, and numerous other scenarios continues to ramp up, despite timelines for mass-market delivery pushed out by at least a decade. In 2020, Waymo will expand its pilots of autonomous vehicles across numerous cities, and expand its testing of Waymo One, its commercial driverless taxi fleet. In China, Baidu’s Apollo Robotaxi goes live with its fleet of robo-taxis operating at Level 4 autonomy in Changsha, Hunan province and in North China’s Hebei province. As China looks to become a global leader in autonomous and connected car technology, it has ramped up autonomous vehicle trials on dedicated roads and test centers.220
In 2019, global private AI investment was over $70 billion, with investment in AI startups growing from $1.3 billion in CY 2010 to over $40.4 billion in 2018.221 The Artificial Intelligence Index Report 2019 showed the largest share of global investment in 2019 went to Autonomous Vehicles ($7.7 billion or 9.9 percent of the total), followed by Drug, Cancer and Therapy ($4.7 billion, 6.1 percent), Facial Recognition ($4.7 billion, 6.0 percent), Video Content ($3.6 billion, 4.5 percent) and Fraud Detection and Finance ($3.1 billion, 3.9 percent).222
The autonomous vehicle of the future will be a platform integrating numerous types of technology and software from numerous providers. With people increasingly removed from the task of driving, the variables used to determine risk and appropriate coverage will change dramatically. Access to the information generated by the vehicle, by infrastructure, by other vehicles, and more will be critical to inform risk and liability. Who has access to that information may also change who is underwriting that risk in the future.
As automakers, technology companies, insurers and others look to the future of transportation, anticipating which technologies will be most impactful is perhaps the biggest challenge. Creating an environment where new technology can be understood, studied, and tested for various applications will be central to an organization’s readiness for the future.
“Having spent almost four decades in the personal lines insurance industry, I’ve had the benefit of seeing many changes during my career. Artificial Intelligence (AI) adapted for insurance claims will be the biggest evolutionary change, perhaps even revolutionary change, in our industry. Much of the claims resolution process involves a consistent process of gathering key bits of data to determine coverage, liability and damages. Artificial Intelligence tools have shown to be easily adapted to assist with the process. I do not know how it works, but I know how it helps. From completing rudimentary tasks to damage assessment to automatic payments, AI is streamlining the claims process as never before. Artificial Intelligence applied to facts, damages, and GPS quadrants have shown to be able to replicate real events removing some of the guess work of claim resolution.
How insurance carriers adapt to AI will determine their ability to compete in the coming years both in service and financially. The key will be for AI to augment the claims professional’s skills rather than replace the claims professional. We have become a very connected society. Gathering, filtering and effectively using all this data for the benefit of consumers will require confidence and a little blind faith."
What do you think the biggest evolution in the industry will be?
Bob CretelClaims Group ManagerAuto Club of California

163
CR
ASH
CO
UR
SE 2020 | TIME TO
PR
EPA
RE
“The computer and communication industry is facing the largest technology inflection point seen in the last 30 years. Technological advances like artificial intelligence (AI), advances in mobile computing, Natural Language Processing/Understanding (NLP), Internet of Things (IOT), and cloud computing are greatly influencing and driving change within every sector, including the industries served by CCC and our customers.
In order to proactively address and embrace these and other advanced and enabling technologies, CCC has been hard at work in our own research and solutions incubation facility. The main driver for such an initiative? There are several:
More than 60 insurance customers have embraced our mobile platform and we’re moving toward a similar tipping point with AI-powered solutions, achieving a level of maturity that supports streamlined incorporation into the workflow and delivering immediate benefits."
by Reza Rooholamini
AN INCUBATION FACILITY WITHIN CCC: WHY?
Key Fundamental Pillars of Innovation at CCC
The success of any innovation facility is measured ultimately by one major factor: How quickly and successfully have we delivered operational solutions to our customers that substantially improve their service and operations? Focused on success and value delivery, we’ve organized around five core pillars:
• Talent: we have staffed the operation with highly technical people with diverse technical foundations. Over 90 percent of our technical staff have advanced degrees (Master and Ph.D.) in a variety of disciplines such as computer vision, computer science, operation research, mathematics, statistics, and quantum physics. This enables our innovators to analyze problems from many different perspectives.
1. We are passionate and committed to technological advancement as a way to deliver services to our customers that benefit from these new technologies. To be successful, we must understand and explore numerous hypotheses related to the embodiment of these technologies into our products and services.
2. It is essential that we work closely with customers as we navigate together this maze of new technologies. To do so, we need dedicated facilities (our lab), resources, and processes.
3. To evolve and deliver the best of the best solutions and services, we need to be agile, proactive, and focused on the core business and evolving peripheral markets.
4. We must invest in our most valuable assets — our people, who need to continue to evolve their knowledge of technology and the market.
CONTINUOUS RESEARCH & EXPERIMENT
DATA TALENT STRONG CONNECTION TO THE CORE
DIRECT CUSTOMER
INVOLVEMENT
ELEMENTS OF FRUITFUL INNOVATION
Reza Rooholamini Vice President, Chief Architect, CCC
ABOUT THE AUTHOR

165
CR
ASH
CO
UR
SE 2020 | TIME TO
PR
EPA
RE
© 2020 CCC INFORMATION SERVICES INC. ALL RIGHTS RESERVED.
Continued
AN INCUBATION FACILITY WITHIN CCC: WHY?
models that can detect with high level of accuracy the likely damaged parts from a few photo images. The system also recommends replacement or repair of the damage parts based on the inputs provided. This technology has been integrated with CCC’s estimating platform. Other examples of use of these models include a predicted range of total cost of repair from photos, or given an estimate of the repair, models flag estimates that need to be re-examined. We have also developed models to examine the quality of the input images from a damaged car and detecting the angle from which the image was taken; for example, left-front, right-front, left-rear, etc.
• Telematics based Accident Detection: From the signals received from the car, via intelligent analysis we can detect occurrences of several events including an accident. This capability enables a series of potential proactive services including informing emergency services and insurance company engagement.
What have we accomplished so far?
In the three years since opening the doors to the CCC Innovation Foundry we have produced and introduced significant solutions and industry advancements, of which we are extremely proud, including:
• Mobile Platform-based APD Claim Processing: The end-to-end digital claim processing starts with the smart mobile device. We have developed and delivered a consumer-led experience capturing damage related images via a mobile phone. The ingested data feeds the insurance appraisers’ mobile platform work area for assessing the damage. This has dramatically increased accuracy and efficiency of estimation and overall claim processing.
• Incorporation of Artificial Intelligence in CCC’s Estimating Platform and Workflow: We have developed hundreds of AI models for integration within the customer’s workflows. For example, we have developed an ensemble of
• Continuous experimentation: At any given time, our staff is conducting dozens of parallel experiments. These experiments are designed with defined scope and timelines. The results are either followed into a full developed product or valued for their contributions as learning opportunities.
• Data: We have developed a data analytics and science platform to host and enable transformation of data in potentially new ways.
• Tight coupling with the core business: The innovation foundry operates within the financial and operational framework that governs the core and growth businesses of CCC, making the activities of the innovation foundry are planned and correlated.
• Direct customer involvement: Customer feedback in the innovation process has resulted in an extremely practical and purposeful environment. The foundry often has several experiments and research being conducted by a CCC team soliciting feedback from customers
Ahead in 2020
The solutions delivered from our work in the Innovation Foundry have been vetted in 2019 and have demonstrated substantial gains towards smart, digital, and efficient claim processing. More than 60 insurance customers have embraced our mobile platform and we’re moving toward a similar tipping point with AI-powered solutions, achieving a level of maturity that supports streamlined incorporation into the workflow and delivering immediate benefits.
In 2020, CCC’s Innovation Foundry will continue to deliver on its promise and charter. The activities will continue to support digital APD and claim processing. Our mobile platform will continue to evolve both from a computational perspective and as a platform for information ingestion. Our research also remains focused on further digitization and automation of auto casualty claim processing. Telematics-based data captured at the time of the accident provides opportunity to further enhance Straight Through Processing (STP) of casualty claims.

167
CR
ASH
CO
UR
SE 2020
© 2020 CCC INFORMATION SERVICES INC. ALL RIGHTS RESERVED.
Earlier in Crash Course 2020, we discussed the impact of ride-hailing, car-sharing, vehicle connectivity, and incorporation of the building blocks to full vehicle autonomy on today’s vehicle repair. As the number of connected vehicles grows, capabilities to capture and analyze data collected from the growing number of sensors and software modules will help to avoid accidents altogether, or where unavoidable, provide critical information regarding damages to both the vehicle and its occupants.
That information could be used to identify which parts are damaged, the extent of the damage, pre-order the parts, and route to the repairer that best meets the unique criteria set for that consumer. Repairers must respond to a new environment of ultra-personalization and specialization. As automakers and technology companies work to craft their own ‘special sauce’ for the "ACES," the challenges to keep up with training and tooling will grow. Having an effective plan in place to train and retain staff will be critical. Segmenting market opportunities based on potential profit, volume, business partners, and opportunity to provide world class service will become more challenging but increasingly important. How a shop is chosen for a certain repair is likely to change, but how a world-class experience is delivered remains dependent on high quality of repair and ability to provide transparency and service throughout.
At the start of a new decade, we stand poised for immense change and opportunity.
Over the last 10 years, technology like mobile, IoT, and AI has brought dramatic change to the who, how, why and when of customer engagement. Companies across all industries have worked over the last several years to develop digital platforms that provide a unified platform experience that some now expect, where parties are connected, to ultimately deliver both transparency and saved time. And perhaps most important for our industry, these technologies have freed up talent to provide a personalized, high-touch experience, providing emotional support to those in a highly traumatic situation.
Looking forward, as new mobility options such as car-sharing, ride-sharing, bike-sharing, and autonomous vehicle technology mature, the one-vehicle to one-person model is expected to change. Traditional roles played by automakers, insurers, repairers, and other players in our ecosystem will continue to blur, and collaboration will be paramount to provide a seamless and streamlined experience. Personalized experiences are the expected norm.
While there remains much uncertainty for the future, and the ability to predict the future is perhaps more difficult than ever, understanding how to prepare for the future is paramount.
IT'S TIME.
ROAD AHEADTHE

169
CR
ASH
CO
UR
SE 2020 | SOU
RC
ES
© 2020 CCC INFORMATION SERVICES INC. ALL RIGHTS RESERVED.
SOURCES37. U.S. DOT FHWA Policy & Government Affairs Highway Policy
Information Highway Statistics, 1995 to 2016. “Licensed Drivers, Vehicle Registrations and Resident Population (in Millions).” https://www.fhwa.dot.gov/policyinformation/statistics/2016/dv1c.cfm.
38. https://www.bloomberg.com/news/articles/2020-01-13/millennials-could-end-up-being-a-boon-to-the-u-s-auto-market.
39. https://medium.com/@sjpeterson/are-car-free-and-car-lite-lifestyles-on-the-rebound-58f67f470a09
40. Ibid.
41. Kurz, Christopher, Geng Li, and Daniel J. Vine (2018). “Are Millennials Different?” Finance and Economics Discussion Series 2018-080. Washington: Board of Governors of the Federal Reserve System, https://doi.org/10.17016/FEDS.2018.080.
42. Christopher R. Knittel and Elizabeth Murphy. “Generational Trends in Vehicle Ownership and Use: Are Millennials Any Different?” MIT Center for Energy and Environmental Policy Research. CEEPR WP 2019-006. April 2019
43. https://www.wsj.com/articles/u-s-existing-home-sales-decreased-1-7-in-november-11576767884.
44. III Quarterly PC Industry Snapshot, Published April 12, 2019.
45. U.S. Census Bureau, 2017 American Community Survey 1-Year Estimates. https://factfinder.census.gov/faces/tableservices/jsf/pages/productview.xhtml?pid=ACS_17_1YR_B08141&prodType=table. B08141 “Means of Transportation to Work by Vehicles Available. Universe: Workers 16 Years and over in households.”
46. Global Workplace Analytics and Flexjobs. “2017 State of Telecommuting in the U.S. Employee Workforce.” P. 7.
47. https://www.wardsauto.com/dealers/auto-dealers-get-personal-digital-retailing.
48. https://www.wsj.com/articles/in-cities-across-america-the-fight-for-curb-space-heats-up-during-the-holidays-11576238403?mod=djemlogistics_h
49. Trucking by the Numbers 2019: Overview. www.fleetowner.com
50. U.S. EIA. 2019 Annual Energy Outlook, www.eia.gov/aeo, January 24, 2019. P. 120.
51. Ibid.
52. https://usa.streetsblog.org/2016/03/10/its-true-the-typical-car-is-parked-95-percent-of-the-time/.
53. INRIX defines inner city last-mile speed as “the speed at which a driver can expect to travel one mile into the central business district during peak hours.” “INRIX 2018 Global Traffic Scorecard,” INRIX, February 2019, http://inrix.com/scorecard/.
54. Texas A&M Transportation Institute and ATRI. Urban Mobility Report 2019. August 2019. P. 5.
55. American Trucking Research Institute. “The Nation’s Top Truck Bottlenecks 2019.” www.truckingresearch.org.
56. Andrew Owen, Brendan Murphy, Accessability Observatory, Center for Transportation Studies, University of Minnesota. David Levinson, School of Civil Engineering, University of Sydney. Access Across America: Transit 2016. CTS 17-07.
57. https://www.un.org/development/desa/en/news/population/2018-world-urbanization-prospects.html.
58. Trucking by the Numbers 2019: Traffic. www.fleetowner.com
59. Auto Loss Cost Trend Report, January 2018 (Casualty Actuarial Society, Property Casualty Insurers Association of America, Society of Actuaries). Insurance Information Institute, Loss Cost Presentation given 3/21/2018 Casualty Actuarial Society’s
Ratemaking, Product and Modeling Seminar.
60. 2017 National Household Travel Survey, p.8 and p.13, Tables 1a and 3b. https://nhts.ornl.gov/assets/2017_nhts_summary_travel_trends.pdf.
61. Conway, Salon, and King. “Trends in Taxi Use and the Advent of Ridehailing 1995-2017: Evidence form the U.S. Household Travel Survey.” Urban Science, 2018, 2, 79.
62. Schaller Consulting, “The New Automobility: Lyft, Uber and the Future of American Cities.” July 25, 2018.
63. Ibid.
64. Steven Vance and John Greenfield. “The Most Common Chicago Ride-Hailing Trip Is a 1-Mile Hop From River North to the Loop.” https://chi.streetsblog.org/2019/04/18/the-most-common-chicago-ride-hailing-trip-is-a-1-mile-hop-from-river-north-to-loop/.
65. https://www.seattletimes.com/seattle-news/transportation/how-popular-are-uber-and-lyft-in-seattle-ridership-numbers-kept-secret-until-recently-give-us-a-clue/?amp=1.
66. John M. Barrios, Yael V. Hochberg and Livia Hanyi Yi. Stigler Center for the Study of the Economy and the State. University of Chicago Booth School of Business. “The Cost of Convenience: Ridesharing and Traffic Fatalities.” October 2018. https://research.chicagobooth.edu/-/media/research/stigler/pdfs/workingpapers/27thecostofconvenience.pdf?la=en&hash=A15B1513F98D7A17B9 E37F78DD2EBDC4C6338BFA.
67. https://www.nber.org/papers/w22627.pdf. https://www.strategyanalytics.com/strategy-analytics/ blogs/ automotive/connected-mobility/automotive-connected-mobility/ 2019/08/20/alto-taps-uber’s-consumer-surplus.
68. Michael Graehler, Jr. Richard Alexander Mucci. Gregory D. Erhardt (corresponding author). Department of Civil Engineering, University of Kentucky. “Understanding the Recent Transit Ridership Decline in Major U.S. Cities: Service Cuts or Emerging Modes?” 98th Annual Meeting of the Transportation Research Board. Submitted: August 1, 2018 and Revised and re-submitted November 14, 2018.
69. “After Uber arrives, heavy drinking increases.” https://www.economist.com/graphic-detail/2019/11/19/after-uber-arrives-heavy-drinking-increases, November 19, 2019.
70. Meera Joshi, Nicholas Cowan, Olivia Limone, Kelsey McGuinness, and Rohan Rao. NYU Wagner Rudin Center for Transportation. “E-Hail Regulation in Global Cities.” November 2019. https://wagner.nyu.edu/files/faculty/publications/RUDIN_EHAIL_REPORT.pdf.
71. National Association of City Transportation Officials. Guidelines for Regulating Shared Micromobility: Version 2. www.nacto.org, September 2019.
72. Weinberg, Cory. “Lime’s Loss to Top $300 Million in 2019.” www.theinformation.com, October 21, 2019.
73. Ibid.
74. American Association of Motor Vehicle Administrators. “Electric Dockless Scooters Whitepaper.” www.aamva.org, 2019.
75. APCIA Bulletin. “Electric Scooter Insurance Model Act Proposed at NCOIL.” Thursday November 14, 2019.
76. https://medium.com/radical-urbanist/dont-be-fooled-uber-doesn-t-care-about-transit-e89880d375b0.
77. Cox, David. “Smart road technology could turn highways into crash-sensing ‘touchpads’.” June 25, 2018. https://www.nbcnews.com/mach/science/can-smart-roads-save-lives-new-test-may-provide-answer-ncna885816.
78. https://insideevs.com/news/382664/gotland-installation-dynamic-wireless-charging/
1. www.autonews.com, January 6, 2019.
2. J.D. Power. “Used Car and Light Truck Guidelines: October 2019 Industry Review.” www.nada.com/b2b. P. 2.
3. Ibid, P. 4.
4. IHS Automotive Registered Vehicle and Scrappage Report through January 1, 2019.
5. http://energyfuse.org/are-americans-driving-older-cars-or-just-leaving-them-in-the-driveway/
6. Naughton, Keith. “Ford Unveils Electric Mustang SUV to Challenge Tesla Dominance.” www.bloomberg.com, November 18, 2019.
7. https://www.wsj.com/articles/car-makers-rushing-to-copy-tesla-lack-one-thing-buyers-11575647982
8. Temple, James. “Why the electric-car revolution may take a lot longer than expected.” MIT Technology Review, November 19, 2019.
9. Ibid.
10. Naughton, Keith. “Ford Unveils Electric Mustang SUV to Challenge Tesla Dominance.” www.bloomberg.com, November 18, 2019.
11. https://www.wsj.com/articles/gm-lg-to-spend-2-3-billion-on-venture-to-make-electric-car-batteries-11575554432?mod=djemlogistics_h
12. Ibid.
13. Lawson, Philippa“The Connected Car: Who is in the driver’s seat? A study on privacy and onboard vehicle telematics technology.” Office of the Privacy Commissioner of Canada.
14. Charniga, Jackie. “Ford CEO: Decontenting boosts vehicle affordability.” www.autonews.com, December 4, 2019.
15. Ibid.
16. Els, Peter. “Part One: Shared mobility is a game changer, but is it viable.” www.automotiveiq.com, 10/29/2019.
17. Ibid.
18. https://justauto.nridigital.com/just-auto_magazine_dec19/shared_mobility_and_mobility_as_a_service_maas.
19. Ibid.
20. https://www.autoconnectedcar.com/2019/12/evs-more-popular-for-chinese-french-car-buyers-than-americans/
21. Ibid.
22. https://store.frost.com/future-of-carsharing-market-to-2025.html
23. https://www.usatoday.com/story/news/world/2013/06/13/un-world-population-81-billion-2025/2420989/
24. https://www.futuremind.com/blog/car-sharing-and-transportation-trends.
25. Intellias Automotive. “Five Boldest Automotive Tech Trends in 2019.” www.intellias.com, November 13, 2018.
26. Boudette, Neal E. “Despite High Hopes, Self-Driving Cars Are ‘Way in the Future’.” www.nytimes.com, July 17, 2019.
27. Ibid.
28. https://www.iihs.org/news/detail/new-studies-highlight-driver-confusion-about-automated-systems
29. https://www.autonews.com/mobility-report/ntsb-scrutinizes-automation-complacency-after-uber-crash.
30. Kim, W., Kelley-Baker, T., Sener, I., Zmud, J., Graham, M. & Kolek, S. (2019). Users’ Understanding of Automated Vehicles and Perception to Improve Traffic Safety –Results from a National Survey. AAA Foundation for Traffic Safety.
31. Els, Peter. “5 Setbacks to the future of mobility following the fatal Uber accident.” www.Automotive-iQ.com, 04/03/2018.
32. Kolodny, Lora. “Self-driving cars were supposed to be here already -here’s why they aren’t and when they should arrive.” www.cnbc.com, Sat Nov 30, 2019.
33. “Road-safety regulator rapped over regulating autonomous cars.” Claims Journal, November 22, 2019. https://www.claimsjournal.com/news/national/2019/11/22/294242.htm.
34. Martinez, Michael. “Automakers exploring autonomous tech find safety in numbers.” www.autonews.com, March 2, 2019.
35. CB Insights. What’s Next in AI? Artificial Intelligence Trends 2019. www.cbinsights.com, p. 72.
36. Annmarie Geddes Baribeau. “Driverless Utopia.” Casualty Actuarial Society Review, May 4, 2018.

171
CR
ASH
CO
UR
SE 2020 | SOU
RC
ES
© 2020 CCC INFORMATION SERVICES INC. ALL RIGHTS RESERVED.
134. Vincent Romans. “Advancing Our Insights Into The Collision Repair Marketplace.” MSO Symposium presentation, Las Vegas, NV, November 4, 2019
135. https://www.autonews.com/fixed-ops-journal/dealers-battle-behind-body-shop-work.
136. Lajdziak, Robert M. “Customer experience: The auto insurance x-factor.” Aug 19, 2019. https://www.propertycasualty360.com.
137. Lajdziak, Robert M. “High Customer Satisfaction Leads to New Challenges for Insurers.” September 18, 2018. https://www.carriermanagement.com/features/2018/09/18/184296.htm.
138. https://www.zendesk.com/resources/searching-for-self-service/
139. Lajdziak, Robert M. “Customer experience: The auto insurance x-factor.” Aug 19, 2019. https://www.propertycasualty360.com.
140. Auto Insurance Report, Vol.27#7/1256. November 4, 2019.
141. Ibid.
142. CB Insights. “The Future of Insurance Keynote.” www.cbinsights.com.
143. National Safety Council. Injury Facts 2017.
144. Auto Care Association. Auto Care Factbook 2019, p. 57. IMR Inc. (www.AutomotiveResearch.com) Continuing Consumer Auto Maintenance Tracking Study. Copyright 2018, IMR Inc.
145. “Total customer lifetime value for dealers estimated at more than $50K.” www.autoremarketing.co, Dec. 4, 2019.
146. Huetter, John. “Pega: Independent repairers part of ‘moments that matter’ for OEM brand.” www.repairerdrivennews.com, January 2, 2019.
147. Gerardi, Ryan. “Trends Affecting Car Dealership Fixed Ops.” www.wardsauto.com, Jan 02, 2020.
148. Finlay, Steven. “Most Polled Auto Dealers Say They Fluctuate Parts Pricing.” www.wardsauto.com, Dec 04, 2019.
149. NADA DATA 2018. “Average Light-Vehicle Dealership Profile”.
150. NADA DATA Mid-Year 2019. “Average Light-Vehicle Dealership Profile”.
151. Overby, Joe. “Parts & service, along with used cars, helps push franchised dealer profits, optimistic valuations.” www.autoremarketing.com, December 1-14, 2019, p. 26.
152. McNamara, K. “E-commerce is shaping the aftermarket supply chain.” www.searchautoparts.com, 04/09/2019.
153. Ibid.
154. Ibid.
155. NADA DATA 2018. “Average Light-Vehicle Dealership Profile”.
156. Ibid.
157. Experian. “State of the Automotive Finance Market Q3 2019 and Q3 2015.”
158. Ibid.
159. AnnaMaria Andriotis and Ben Eisen. “A $45,000 Loan for a $27,000 Ride: More Borrowers Are Going Underwater on Car Loans.” www.wsj.com, November 9, 2019.
160. U.S. DOT NHTSA Traffic Safety Facts. “Early Estimate of Motor Vehicle Traffic Fatalities for the First 9 Months (Jan-Sep) of 2019.” DOT HS 812 874, December 2019.
161. U.S. DOT NHTSA Traffic Safety Facts. “2018 Fatal Motor Vehicle Crashes: Overview.” DOT HS 812 826, October 2018.
162. https://injuryfacts.nsc.org/motor-vehicle/overview/introduction/
163. https://consumer.healthday.com/public-health-information-30/marijuana-news-759/12-million-americans-drove-while-stoned-last-year-753236.html.
164. Ibid.
165. https://www.iihs.org/topics/alcohol-and-drugs.
166. National Safety Council. The State of Safety: A State-by-State Report. www.nsc.org/stateofsafety, pp. 10-11.
167. Ibid, p. 7.
168. Based on IIHS/HLDI Studies completed by April 3, 2016, IIHS presentation at Lifesavers Conference 2017.
169. https://www.aaa.com/AAA/common/aar/files/Research-Report-Pedestrian-Detection.pdf
170. https://www.autoblog.com/2019/12/12/iihs-top-safety-pick-pedestrian-crash-avoidance-headlights/
171. Micah Hartman, Anne B. Martin, Joseph Benson, Aaron Catlin and The National Health Expenditure Accounts Team. “National Health Care Spending in 2018: Growth Driven By Accelerations in Medicare and Private Insurance Spending.” DOI: 10.1377/hlthaff.2019.01451 HEALTH AFFAIRS 39, NO. 1 (2020): –©2020 Project HOPE—The People-to-People HealthFoundation, Inc.
172. Ibid.
173. Ibid.
174. Ibid.
175. Ibid.
176. The Institutes and Insurance Research Council. Trends in Auto Injury Claims, 2019 Edition. February 2019, p. 7.
177. Ibid., p. 2.
178. Auto Insurance Report, Vol.26#38/1239. June 17, 2019.
179. Ibid.
180. “IRC: Auto Injury Claims Costs Outpace Inflation, Lawyer Involvement Increases.” April 23, 2018. https://www.claimsjournal.com/news/national/2018/04/23/284266.htm.
181. Ibid.
182. https://www.wsj.com/articles/who-wins-in-a-personal-injury-lawsuit-it-can-be-the-doctor-11578479400.
183. Credit Suisse Equity Research, 14 January 2020. “Social Inflation Is Getting Personal – Tort Inflation Isn’t Only Impacting Comm’l Lines.”
184. Auto Insurance Report, Vol.26#6/1255. October 28, 2019.
185. Zender, Mathew. “The aging workforce and workers’ compensation.” www.propertycasualty360.com, October 15, 2019.
186. U.S. Census Bureau. “Census Bureau News: American Community Survey 2014-2018 5-Year Estimates Now Available.” Release CB19-196. Dec. 19, 2019.
187. Zender, Mathew. “The aging workforce and workers’ compensation.” www.propertycasualty360.com, October 15, 2019.
188. https://news.gallup.com/poll/269003/households-report-preexisting-conditions.aspx?version=print
189. Ibid.
190. Insurance Research Council. “Affordability in Auto Injury Insurance: Cost Drivers in Twelve Jurisdictions.” June 21, 2016. http://
79. “Automakers Seek Control in Connected Car Software.” https://tu-auto.com, 8th October 2019.
80. Statista, March 2019. (https://www.statista.com/outlook/320/109/connected-car/united-states?currency=usd#market-arpu).
81. https://www.strategyanalytics.com/strategy-analytics/blogs/automotive/infotainment-telematics/infotainment-telematics/2018/10/25/connected-cars-high-tech-low-demand.
82. https://www.strategyanalytics.com/strategy-analytics/blogs/automotive/connected-mobility/automotive-connected-mobility/2019/07/08/onstar-rolls-back-free-trials.
83. Ibid.
84. “Stout Automotive Defect & Recall Report.” www.stout.com.
85. Ibid.
86. Singh, Sarwant. Frost & Sullivan’s Global Automotive Outlook, 2019. “Top Automotive Trends in 2019: A Year of Wows and Woes.”
87. “Among Bad Driving Behaviors, Speeding is Strongest Predictor of Crashes.” www.insurancejournal.com, August 22, 2019.
88. Governors Highway Safety Association. Speeding Away from Zero: Rethinking a Forgotten Traffic Safety Challenge. www.ghsa.org, January 2019. P. 20.
89. Ibid.
90. Ibid.
91. U.S.DOT NHTSA Traffic Safety Facts. “Critical Reasons for Crashes Investigated in the National Motor Vehicle Crash Causation Survey.” DOT HS 812 115, February 2015.
92. Annmarie Geddes Baribeau. “Driverless Utopia.” Casualty Actuarial Society Review, May 4, 2018.
93. USDOT NHTSA Traffic Safety Facts. “Distracted Driving in Fatal Crashes, 2017.” DOT HS 812 700, April 2019.
94. https://www.wsj.com/articles/car-makers-wager-on-bigger-screens-to-lure-buyers-11574677804?mod=hp_lead_pos11.
95. Ibid.
96. Ibid.
97. Chirag Ramesh Kalose. “Unveiled: the most common scoring factors for Usage-based Insurance.” Thursday, July 25, 2019. https://www.ptolemus.com/insights.
98. Ibid.
99. CreditSuisse Equity Research, Property & Casualty Insurance. 22 July 2019.
100. Webinar held by Bryce Wilson, Teletrac Navaman. 2019 Telematics Benchmark Report – U.S. Edition.
101. Clinton, Paul. “Telematics Market Expected to See Explosive Near-Term Growth.” www.automotive-fleet.com, January 23, 2019.
102. https://www.automotive-fleet.com/303123/fleet-safety-metrics-reverse-negatively-accidents-increase
103. Insights from USI National Practice Leaders. Commercial Property & Casualty Market Outlook Q4 2019-2020 Update. P.7.
104. https://www.wsj.com/articles/surging-truck-insurance-rates-hit-freight-operators-11578934834?mod=djemlogistics_h.
105. Ibid. P.2.
106. https://www.automotive-fleet.com/303123/fleet-safety-metrics-reverse-negatively-accidents-increase
107. https://www.businessinsider.com/trucking-truck-drivers-job-loss-
september-2019-10.
108. https://www.fleetowner.com/equipment/economic-forecast-trucking-gloomy-chance-recession
109. Zaremski, Michael and Lederer, Charles. Credit Suisse. “Property & Casualty Insurance. Reserves Update: Moderating Loss-Expense Inflation on Newly Written Comm’l Auto Biz.” 23 December 2019.
110. ISS Fast Track Plus™ Personal Auto, As of June 30, 2019.
111. Ibid.
112. Ibid.
113. Ibid.
114. USDOT NHTSA. “Police-Reported Motor Vehicle Traffic Crashes in 2018.” DOT HTS 812 860, November 2019.
115. Ibid, p. 8.
116. “What’s Happening and What Lies Ahead for P/C Insurance Pricing: Moody’s.” https://www.insurancejournal.com/news/2018/10/30/506028.htm.
117. Auto Insurance Report, Vol.26#38/1239. June 24, 2019.
118. Moore, Alan, P.E. “Tesla Autopilot, Self-Driving Vehicles and Driver Assistance Systems; Who Caused The Accident?” Presentation at the Symposium on Traffic Safety, May 21-24, 2018.
119. Reagan, Ian J. “Effects of an Aftermarket Crash Avoidance System on Warning Rates and Driver Acceptance in Urban and Rural Environments.” Springer International Publishing AG, part of Springer Nature 2019 N. Stanton (Ed.): AHFE 2018, AISC 786, pp. 776–787, 2019. https://doi.org/10.1007/978-3-319-93885-1_71.
120. Jessica Cicchino. “Autobrake is good, but it could be better.” IIHS/HDLI Status Report, Vol. 54, No. 2. February 21, 2019. www.iihs.org.
121. CREF I-CAR Snapshot of the Collision Repair Industry: Executive Summary of the 2019 Survey.
122. Finlay, Steve. “Car Dealers Amp Up Efforts to Recruit Young Mechanics.” www.wardsauto.com, Oct 24, 2019.
123. “Repair myths and misinformation.” 03/23/2016 -13:24. www.searchautoparts.com.
124. http://www.bodyshopbusiness.com/cover-story-the-importance-of-oem-data.
125. Becker, Mitch. “Electronic blueprinting a necessary step in repairing today’s vehicles.” www.bodyshopbusiness.com, December 2, 2019.
126. Huetter, John. “With new technology in cars, calibration becomes vital with changes.” www.repairerdrivennews.com, November 17, 2015.
127. Yoswick, John. “ADAS Calibrations Latest Challenge Facing Collision Repairers.” www.autobodynews.com.
128. Ibid.
129. “Preparing for advanced material repairs with certification, training, and equipment.” www.searchautoparts.com, 12/15/2016 – 08:49.
130. Ibid.
131. Auto Care Association. Auto Care Factbook 2020. “U.S. Shops Specializing in Collision Repair CY 2003-CY 2018.
132. Auto Care Association. “Auto Care Factbook 2020.” Page 55. Bethesda, MD: 2020.
133. Ibid.

173© 2020 CCC INFORMATION SERVICES INC. ALL RIGHTS RESERVED.
www.insurance-research.org/sites/default/files/downloads/NRcostdrivers2016.pdf.
191. Insurance Research Council. “The Affordable Care Act and Property-Casualty Insurance.” Copyright 2014. www.theinstitutes.org, p. 5.
192. Yural Rosenberg and Michael Rainey. “Why So Many Americans Can’t Afford Health Care.” www.thefiscaltimes.com, May 2, 2019.
193. Ibid.
194. Rachel Garfield and Kendal Orgera, Kaiser Family Foundation. The Uninsured and the ACA: A Primer, January 2019, p. 5-6.
195. “How Trump is Remaking Health Insurance Without Repealing Obamacare.” www.insurancejournal.com, June 17, 2019.
196. Ibid.
197. https://www.ozy.com/presidential-daily-brief/pdb-258080/stricken-258601/.
198. Rachel Garfield and Kendal Orgera, Kaiser Family Foundation. The Uninsured and the ACA: A Primer, January 2019, p. 7.
199. Schramski, Tom. “7 Ways TrumpCare Will Change the Healthcare Industry in 2017.” www.axial.net, January 11, 2017.
200. Morgan Stanley, “The Second Machine Age Hits the Tipping Point.” August 5, 2019.
201. https://www.pewresearch.org/fact-tank/2019/12/20/10-tech-related-trends-that-shaped-the-decade/.
202. Autonomous Research LLP, “Autonomous Next: #Machine Intelligence & Augmented Finance.” http://next.autonomous.com, April 2018.
203. https://www.propertycasualty360.com/2019/2019/01/16/four-trends-shaping-insurancein-2019/
204. Morgan Stanley, “The Second Machine Age Hits the Tipping Point.” August 5, 2019.
205. Accenture. “The Post-Digital Era Is Upon Us: Get Ready for What’s Next in Insurance.” Technology Vision for Insurance 2019, www.accenture.com, p. 20.
206. https://www.technologyreview.com/s/613432/how-a-google-street-view-image-of-your-house-predicts-your-risk-of-a-car-accident/.
207. Ref: arxiv.org/abs/1904.05270: Google Street View Image of a House Predicts Car Accident Risk of Its Resident.
208. Lyons, Daniel. “Insurance 4.0: Six winning strategies in the fourth industrial revolution.” www.dig-in.com, November 14, 2019.
209. Capgemini and Efma. World Insurance Report 2019. www.worldinsurancereport.com, P. 18.
210. https://www.artemis.bm/news/as-exposure-rises-insurance-capital-central-to-global-recovery-research/.
211. Ibid.
212. “Insurer Estimates $2.5 Trillion Price Tag for 10-Year Fight Against Climate Change.” December 4, 2019. https://www.insurancejournal.com/news/national/2019/12/04/550266.htm.
213. www.artemis.bm/news/u-s-severe-storms-in-july-cost-2bn-insurers-to-take-majority-aon./ August 8, 2019.
214. Aon plc 2019. Global Catastrophe Recap: September 2019.
215. Aon plc 2019. Global Catastrophe Recap: First Half of 2019. July 2019.
216. Taylor, Brittany. “More than 10,000 vehicles damaged during Tropical Storm Imelda, insurance companies say.” September 23, 2019. https://www.click2houston.com/news.
217. www.Artemis.bm/news/California-wildfire-damage-said-25bn-spread-continues-fire-weather-forecast-worsens/. October 29, 2019.
218. www.Artemis.bm/news/dallas-tornado-insured-loss-said-2bn-costliest-ever-texas-outbreak/. October 25, 2019.
219. Wayne Allen, CEO. “Some Hope in the Face of the Wildfire Threat.” Blog.insurancethoughtleadership.com, April 30, 2019.
220. https://justauto.nridigital.com/just-auto_magazine_dec19/adas_to_avs_-_more_progress_in_2020_but_with_added_reality_check
221. Raymond Perrault, Yoav Shoham, Erik Brynjolfsson, Jack Clark, John Etchemendy, Barbara Grosz, Terah Lyons, James Manyika, Saurabh Mishra, and Juan Carlos Niebles, “The AI Index 2019 Annual Report”, AI Index Steering Committee, Human-Centered AI Institute, Stanford University, Stanford, CA, December 2019. P. 6.
222. Ibid.
Susanna Gotsch is Director, Industry Analyst at CCC Information Services Inc. She has been with CCC since July of 1992.
She has authored Crash Course, CCC’s annual publication on trends impacting collision repair and total loss costs since 1995. This publication has become a key resource for the industry in understanding how broader trends within the economy, new and used vehicle market places, and collision industry are impacting auto claim frequency and costs. Ms. Gotsch also consults with the on-going development of CCC’s industry-leading data warehouse and reporting products.
Ms. Gotsch has presented her research at numerous industry meetings and symposiums. In 2011, Ms. Gotsch was awarded the annual industry honorarium Most Influential Women in the Collision Repair Industry established by AkzoNobel Automotive & Aerospace Coatings America (A&AC).
SUSANNA GOTSCHPREPARED BY
DIRECTOR, INDUSTRY ANALYST, CCC

© 2020 CCC INFORMATION SERVICES INC. ALL RIGHTS RESERVED.
CRASH COURSE
20
20
IT’S TIME
®
CCC Information Services Inc.222 Merchandise Mart Plaza, Suite 900Chicago, IL 60654
(800) 621.8070
®
© 2020 CCC Information Services Inc. All Rights Reserved. The information and opinions in this publication are for general information only, are subject to change and are not intended to provide specifi c recommendations for any individual or entity. Although information contained herein has been obtained from sources believed to be reliable, CCC does not guarantee its accuracy and it may be incomplete or condensed. CCC is not liable for any typographical errors, incorrect data and/or any actions taken in reliance on the information and opinions contained in this publication. Note: Where CCC Information Services Inc. is cited as source, the data provided is an aggregation of industry data related to electronic appraisals communicated via CCC’s electronic network or from total loss valuations processed by CCC. Where Auto Injury Solutions (AIS), a CCC Company is cited as a source, the data provided is an aggregation of industry data collected from claims data communicated via Auto Injury Solutions, Inc.’s electronic network.
Facebook.com/cccis
@cccinfoservices
Youtube.com/CCCInfoServices
cccis.com/LinkedIn
25Years
Prep
ared b
y Susanna G
otsch
20
20
CR
AS
H C
OU
RS
E | IT
’S T
IME
®
Prepared by Susanna Gotsch