Embed Size (px)
Citation preview

Cranfield University
Li Wei
More Electric Landing Gear Actuation Study
School of Engineering
MSc by Research Thesis
i

Cranfield University
School of Engineering
MSc by Research Thesis
January 2009
Li Wei
More Electric Landing Gear Actuation Study
Supervisor: Prof. John P. Fielding
Academic Year 2008 to 2009
This thesis is submitted in fulfilment of the requirements for the
degree of MSc
© Cranfield University, 2009. All rights reserved. No part of this publication may be reproduced
without the written permission of the copyright holder.
ii

ABSTRACT
This report addresses the problem of landing gear actuation system design on more-electric aircraft (MEA). Firstly, information about more-electric aircraft and more-electric actuators was gathered and sorted. Current more-electric landing actuation system applications and researches were also summarized. Then several possible more-electric landing gear actuation concepts were identified. To evaluate these concepts, the case study method has been used. A concept aircraft “MRT7-T”, which has similar maximum takeoff weight to that of Boeing 787, has been chosen as the design case. Systems of different configurations and architectures were designed for this aircraft. In the end of this study, a comparison between different more-electric landing gear actuation systems, and also with traditional central hydraulic system was made. The best concept was proposed. More-electric actuation technology has made considerable progress in the last two decades. However, most of the applications and researches have focused on flight control actuation and brakes. Using more-electric drives for landing gear actuation has been well known to be difficult, for the reason of massive power needs and difficulties in achieving redundancy levels. Famous more-electric research projects like POA and Power-By-Wire only gave recommendation of using electro-hydrostatic actuators (EHA) in landing gear actuation. And no further information is available to the public. In this study, DHS (distributed hydraulic system), EHA (electro-hydrostatic actuator) and EMA (electro-mechanical actuator) were identified as candidate solutions. Design requirements such as retraction time, load and redundancy levels were derived through analysis. As a unique feature, landing gear kinematics concepts were also subject to optimization. Various kinematics concepts were proposed and analyzed in detail, to provide favorable loading and geometrical conditions for the systems. Kinematics design guidelines were built through discussion. Different motors such as AC induction motor, BDCM (brushless DC motor) and PMSM (permanent magnetic synchronous motor) were evaluated for use. Different system architectures were also explored. The multi-discipline optimization method has been extensively used in the design process of the systems. Firstly, each node of the actuation systems was optimized. Then optimizations were made to the systems. Performances of each system were analyzed in several aspects such as weight, power, reliability and maintenance. Comparison of different systems was made through scoring method. The results suggested that DHS, EHA and EMA are all applicable for landing gear actuation. And isolated EHA is the best.
iii

ACKNOWLEDGEMENTS
The author wishes to express thanks to all the people who have helped him in this
unforgettable year.
Special thanks to his supervisor Pro John. P. Fielding for all the guidance and support.
As a hopeless aircraft enthusiast, the author has been greatly inspired by professor
Fielding. The life with him has been busy but extremely fruitful. All the staff
members of College of Aeronautics are thanked for their help and advice. Dr Craig
Lawson has offered great help during the preparation of this thesis.
The author would like to thank his boss AVIC and the Chinese government for the
sponsorship. His colleagues and friends also have to be thanked for their hard working
and warm help.
The author would like to express thanks to his wife and other family members, for the
endurance of all the hardship during this year.
iv

TABLE OF CONTENTS Abstract...........................................................................................................................iiiAcknowledgement .......................................................................................................... iv Table of Contents ............................................................................................................ v Table of Figures.............................................................................................................. ix Table of Tables ..............................................................................................................xii Notation.........................................................................................................................xiv Acronyms.....................................................................................................................xvii 1 Introduction............................................................................................................. 1
1.1 General.............................................................................................................. 1 1.2 More-Electric Landing Gear Actuation ............................................................ 1 1.3 Project Objectives ............................................................................................. 2 1.4 Project Description and Methodologies............................................................ 2
2 Group Design Project Activities ............................................................................ 3 3 Literature Review ................................................................................................... 5
3.1 Introduction....................................................................................................... 5 3.2 More-Electric Aircraft Survey .......................................................................... 5
3.2.1 Major Research Projects ........................................................................... 6 3.2.2 More-Electric System Features................................................................. 6
3.3 More-Electric Landing Gear Survey................................................................. 7 3.4 More-Electric Actuation Summary................................................................... 8
3.4.1 More-Electric Actuators............................................................................ 9 3.4.2 Electrical Power Source.......................................................................... 11 3.4.3 Motors ..................................................................................................... 11
3.5 Summary ......................................................................................................... 13 4 Case Study Introduction and Design Requirements.......................................... 14
4.1 Introduction..................................................................................................... 14 4.2 Case Study Aims, Limitations and Assumptions............................................ 14 4.3 Aircraft Selection ............................................................................................ 15
4.3.1 Aircraft Selection .................................................................................... 15 4.3.2 Aircraft Description ................................................................................ 16
4.4 Main Landing Gear of “MTR7-T”.................................................................. 16 4.5 Landing Gear Actuation Loading Calculation................................................ 17 4.6 Design Requirements ...................................................................................... 18
4.6.1 Redundancy Level .................................................................................. 19 4.6.2 Actuation Time Requirement.................................................................. 20 4.6.3 Heat and Power Dissipation.................................................................... 21 4.6.4 Installation and Working Environment................................................... 21
4.7 Summary ......................................................................................................... 22 5 System Analysis and Optimization Methodologies............................................ 23
5.1 Introduction..................................................................................................... 23 5.2 System Modelling ........................................................................................... 23
5.2.1 Reducer Equations .................................................................................. 24
v

5.2.2 Kinematics Equations ............................................................................. 27 5.2.3 Transmission Integration ........................................................................ 28 5.2.4 Dynamic Equations................................................................................. 28
5.3 System Optimization Philosophies ................................................................. 31 5.3.1 Energy Optimization............................................................................... 31 5.3.2 EHA Optimization .................................................................................. 32 5.3.3 EMA Optimization.................................................................................. 34
5.4 Motors ............................................................................................................. 34 5.4.1 ACMP ..................................................................................................... 35 5.4.2 BDCM..................................................................................................... 37 5.4.3 PMSM..................................................................................................... 38
5.5 Landing Gear Kinematics Concepts ............................................................... 39 5.5.1 Kinematics Concepts .............................................................................. 40 5.5.2 Kinematics for Hydraulic Solutions........................................................ 41 5.5.3 Kinematics for EMA............................................................................... 41 5.5.4 Optimized Kinematics ............................................................................ 42
5.6 Central Hydraulic System Analysis ................................................................ 43 5.7 Summary ......................................................................................................... 47
6 Distributed Hydraulic System Design................................................................. 48 6.1 Introduction..................................................................................................... 48 6.2 DHS System Diagram..................................................................................... 48 6.3 System Parametric Study ................................................................................ 49 6.4 Dynamic Performance .................................................................................... 51 6.5 Power Requirements ....................................................................................... 54
6.5.1 Landing Gear Retraction Power Requirement........................................ 54 6.5.2 Landing Gear Extension Power Requirement......................................... 55
6.6 Components and Weight................................................................................. 55 6.7 Safety, Reliability and Maintainability ........................................................... 57 6.8 Summary ......................................................................................................... 58
7 EHA System Design .............................................................................................. 59 7.1 Introduction..................................................................................................... 59 7.2 EHA System Diagrams ................................................................................... 59
7.2.1 EHA Diagram 1-Isolated EHA ............................................................... 59 7.2.2 EHA Diagram 2-Interconnected EHA.................................................... 60
7.3 Motor and Kinematics Selection..................................................................... 61 7.4 System Parametric Study ................................................................................ 63 7.5 Dynamic Performance .................................................................................... 64 7.6 Power Requirements ....................................................................................... 66
7.6.1 Landing Gear Retraction Power Requirement........................................ 66 7.6.2 Landing Gear Extension Power Requirement......................................... 67
7.7 Components and Weight................................................................................. 67 7.8 Safety, Reliability and Maintainability ........................................................... 68 7.9 Summary ......................................................................................................... 71
8 EMA System Design ............................................................................................. 72
vi

8.1 Introduction..................................................................................................... 72 8.2 EMA System Diagram.................................................................................... 72 8.3 Motor and Kinematics Selection..................................................................... 72
8.3.1 EMA with BDCM................................................................................... 73 8.3.2 EMA with PMSM................................................................................... 73 8.3.3 Optimization Results............................................................................... 74
8.4 System Parametric Study ................................................................................ 75 8.5 Dynamic Performance .................................................................................... 76 8.6 Power Requirements ....................................................................................... 79
8.6.1 Landing Gear Retraction Power Requirement........................................ 79 8.6.2 Landing Gear Extension Power Requirement......................................... 80
8.7 Components and Weight................................................................................. 80 8.8 Safety, Reliability and Maintainability ........................................................... 81 8.9 Summary ......................................................................................................... 83
9 Results .................................................................................................................... 84 9.1 Introduction..................................................................................................... 84 9.2 Dynamic Performance and Functions............................................................. 84 9.3 Weight and Geometry ..................................................................................... 85 9.4 Power Requirements ....................................................................................... 85 9.5 Reliability and Maintenance ........................................................................... 86 9.6 Airworthiness.................................................................................................. 87 9.7 Other issues..................................................................................................... 87 9.8 Summary ......................................................................................................... 88
10 Discussion............................................................................................................... 89 10.1 Introduction..................................................................................................... 89 10.2 Weighting of Factors....................................................................................... 89 10.3 Comparison and Selection .............................................................................. 90 10.4 Case Study Limitations ................................................................................... 90
11 Conclusions............................................................................................................ 92 12 Recommendations For Future Work.................................................................. 94 References...................................................................................................................... 95 List of Appendices....................................................................................................... 101 Appendix A: GDP Aircraft Conceptual Design ....................................................... 102
A.1 GDP Introduction.......................................................................................... 102 A.2 GDP Phase One Activities ............................................................................ 103 A.3 GDP Phase Two Activities ........................................................................... 104 A.4 GDP Phase Three Activities ......................................................................... 111 A.5 GDP Phase Four Activities ........................................................................... 111 A.6 GDP Summary .............................................................................................. 115
Appendix B: GDP Landing Gear Conceptual Design ............................................. 116 B.1 Introduction................................................................................................... 116 B.2 Landing Gear Configuration Selection ......................................................... 116 B.3 Landing Gear Disposition ............................................................................. 117
vii

B.4 Loading ......................................................................................................... 121 B.5 Tires and Brakes ........................................................................................... 121 B.6 Shock Absorber Design ................................................................................ 123 B.7 Landing Gear Weight Estimation ................................................................. 126 B.8 Aircraft Floatation Analysis.......................................................................... 126 B.9 Ground Operation Characteristics................................................................. 127 B.10 GDP Landing Gear Design Summary........................................................... 130
Appendix C: Landing Gear Loading Calculation ................................................... 131 C.1 Load by Gravitation ...................................................................................... 131 C.2 Load by Aerodynamic Force ........................................................................ 132 C.3 Load by Friction Force.................................................................................. 136 C.4 Total Static Loading Moment ....................................................................... 137 C.5 Dynamic Loading Moment Estimation......................................................... 138
Appendix D: Landing Gear Actuation Time Calculation....................................... 140 D.1 Method 1-Existing Requirements Summary................................................. 140 D.2 Method 2-Aircraft Performance Requirements ............................................ 141 D.3 Summary ....................................................................................................... 142
Appendix E: Landing Gear Kinematics Optimization............................................ 143 E.1 Landing Gear Bay Envelope......................................................................... 143 E.2 Landing Gear Kinematics Selection Criteria ................................................ 143 E.3 Landing Gear Kinematics Concept 1............................................................ 144 E.4 Landing Gear Kinematics Concept 2............................................................ 149 E.5 Landing Gear Kinematics Concept 3............................................................ 153 E.6 Landing Gear Kinematics Concept 4............................................................ 156 E.7 Landing Gear Kinematics Optimization Summary....................................... 159
Appendix F: Hydraulic Components design ............................................................ 160 F.1 ACMP Sizing ................................................................................................ 160 F.2 Cylinder Design ............................................................................................ 160 F.3 Reservoir and Fluid Design .......................................................................... 165
Appendix G: EMA Components design.................................................................... 168 G.1 Roller Screw Design ..................................................................................... 168 G.2 Gear Pairs Design ......................................................................................... 170 G.3 Shaft Design.................................................................................................. 172 G.4 Weight........................................................................................................... 172
viii

TABLE OF FIGURES Figure 3-1: Boeing 787 hydraulic system architecture ..................................................... 8Figure 3-2: More-electric actuator technology ................................................................. 9Figure 3-3: Planetary roller screw................................................................................... 11 Figure 3-4: Ball screw..................................................................................................... 11 Figure 3-5: A380 AC motor pump.................................................................................. 13 Figure 4-1: “MRT7-T” main landing gear...................................................................... 16 Figure 4-2: Boeing 787 main landing gear ..................................................................... 17 Figure 4-3: A330-200 main landing gear........................................................................ 17 Figure 4-4: “MRT7-T” main landing gear actuation static loads ................................... 18 Figure 5-1: Simplified landing gear actuation model ..................................................... 23 Figure 5-2: Comparison of rated flow between 3000psi and 5000psi systems .............. 32 Figure 5-3: ACMP characteristics .................................................................................. 36 Figure 5-4: Simplified ACMP characteristics................................................................. 36 Figure 5-5: BDCM speed-torque and speed-power curves............................................. 38 Figure 5-6: Example of PMSM motor performance curves ........................................... 38 Figure 5-7: Simplified PMSM motor performance curves ............................................. 39 Figure 5-8: Kinematics 1 and 2 actuator static load curves ............................................ 43 Figure 5-9: Equivalent pump P-Q and P-W curves ........................................................ 44 Figure 5-10: Actuator speed-force curves....................................................................... 44 Figure 5-11: Landing gear swing performance (central hydraulic system).................... 45 Figure 5-12: Actuator performance (central hydraulic system)...................................... 45 Figure 5-13: Force and torque performance (central hydraulic system)......................... 46 Figure 5-14: Cylinder input power performance (central hydraulic system) ................. 46 Figure 6-1: DHS diagram................................................................................................ 48 Figure 6-2: ACMP P-Q curve and P-W curves .............................................................. 50 Figure 6-3: DHS actuator speed to force curves............................................................. 51 Figure 6-4: DHS landing gear swing dynamics.............................................................. 51 Figure 6-5: DHS actuator parameters ............................................................................. 52 Figure 6-6: DHS force and torque dynamics .................................................................. 53 Figure 6-7: DHS output power ....................................................................................... 54 Figure 6-8: DHS cylinder installation-landing gear lowered.......................................... 56 Figure 6-9: DHS cylinder installation-landing gear retracted......................................... 56 Figure 6-10: DHS landing gear extension fault tree analysis ......................................... 51 Figure 7-1: EHA diagram 1-Isolated EHA ..................................................................... 59 Figure 7-2: EHA diagram 2-Interconnected EHA.......................................................... 60 Figure 7-3: EHA PMSM motor characteristics .............................................................. 63 Figure 7-4: EHA landing gear swing dynamics.............................................................. 64 Figure 7-5: EHA actuator dynamics ............................................................................... 65 Figure 7-6: EHA force and torque dynamics.................................................................. 65 Figure 7-7: Motor dynamic performance........................................................................ 66 Figure 7-8: Main landing gear extension fault tree analysis-EHA diagram 1 ................ 69 Figure 7-9: Main landing gear extension fault tree analysis-EHA diagram 2 ................ 69
ix
Figure 8-1: EMA diagram............................................................................................... 72 Figure 8-2: EMA Motor speed-torque and speed-power curves .................................... 76 Figure 8-3: EMA landing gear swing dynamics ............................................................. 77 Figure 8-4: EMA actuator dynamics............................................................................... 77 Figure 8-5: EMA force and torque dynamics ................................................................. 78 Figure 8-6: EMA motor dynamics.................................................................................. 79 Figure 8-7: EMA installation-landing gear lowered....................................................... 80 Figure 8-8: EMA installation-landing gear lowered....................................................... 81 Figure 8-9: EMA main landing gear extension fault tree analysis ................................. 82 Figure A-1: Proceeding of the GDP project ................................................................. 102 Figure A-2: The author’s work in GDP project ............................................................ 103 Figure A-3: Over-wing mounted engine and canard configuration.............................. 105 Figure A-4: Over-wing mounted engine and T-tail configuration layout..................... 107 Figure A-5: Over-wing engine aircraft parametric study ............................................. 108 Figure A-6: Plan view of “flying crane”....................................................................... 112 Figure A-7: Side view of “flying crane”....................................................................... 112 Figure A-8: Front view of “flying crane” ..................................................................... 113 Figure A-9: Fuselage geometry of “flying crane” ........................................................ 113 Figure A-10: Wing geometry of “flying crane”............................................................ 114 Figure A-11: Tail geometry of “flying crane” .............................................................. 114 Figure A-12: Fin geometry of “flying crane” ............................................................... 115 Figure A-13: Nacelle installation of “flying crane”...................................................... 115 Figure B-1: “flying crane” main landing gear 3D model ............................................. 117 Figure B-2: “flying crane” nose landing gear 3D model .............................................. 117 Figure B-3: “flying crane” landing gear foot print ....................................................... 118 Figure B-4: “flying crane” landing gear tail-down angle ............................................. 118 Figure B-5: “flying crane” landing gear turnover angle ............................................... 119 Figure B-6: “flying crane” main landing gear structural compatibility........................ 120 Figure B-7: “flying crane” main landing gear stowage 3D model ............................... 120 Figure B-8: “flying crane” nose landing gear stowage 3D model ................................ 120 Figure B-9: “flying crane” main landing gear load-stroke curve ................................. 124 Figure B-10: “flying crane” nose landing gear load-stroke curve ................................ 125 Figure B-11: “flying crane” ACN on rigid pavements, CBR=C class ......................... 126 Figure B-12: “flying crane” ACN on flexible pavements, CBR=C class..................... 126 Figure B-13: “flying crane” ground turning radii ......................................................... 128 Figure B-14: “flying crane” ground clearance, side view............................................. 129 Figure B-15: “flying crane” ground clearance, front view ........................................... 129 Figure B-16: “flying crane” tail strike angle after potential stretch.............................. 130 Figure C-1: Pivot torque by gravity force..................................................................... 132 Figure C-2: Pivot torque by aerodynamics ................................................................... 135 Figure C-3: Friction moment calculation...................................................................... 137 Figure C-4: Friction force calculation variables ........................................................... 137 Figure C-5: Landing gear loading moment-distributed ................................................ 138
x
Figure C-6: Landing gear loading moment on pivot .................................................... 138 Figure D-1: Retraction time requirement of existing aircraft ....................................... 140 Figure D-2: Aircraft fast acceleration simulation ......................................................... 141 Figure E-1: Landing gear bay envelope........................................................................ 144 Figure E-2: Kinematics concept 1................................................................................. 145 Figure E-3: Kinematics 1 force to stroke curves with different parameters ................. 146
Figure E-4: Kinematics 1 characteristics-Changing 0α ................................................ 146
Figure E-5: Kinematics 1 characteristics-Changing L1................................................ 146 Figure E-6: Kinematics 1 characteristics-Changing L2................................................ 147 Figure E-7: Kinematics 1 geometry for hydraulic actuator .......................................... 148 Figure E-8: Kinematics 1 geometry for mechanical actuator ....................................... 148 Figure E-9: Kinematics concept 2................................................................................. 149 Figure E-10: Kinematics 2 force to stroke curves with different parameters ............... 150
Figure E-11: Kinematics 2 characteristics-Changing 0α .............................................. 151
Figure E-12: Kinematics 2 characteristics-Changing L1.............................................. 151 Figure E-13: Kinematics 2 characteristics-Changing L2.............................................. 152 Figure E-14: Kinematics 2 geometry for hydraulic actuator ........................................ 153 Figure E-15: Kinematics concept 3............................................................................... 153 Figure E-16: Kinematics 3 performance - changing L1 ............................................... 155 Figure E-17: Kinematics 3 performance....................................................................... 156 Figure E-18: Kinematics concept 4............................................................................... 157 Figure E-19: Kinematics 4 motor shaft moment to landing gear swing angle ............. 158 Figure E-20: Kinematics 4 maximum motor shaft moment to gear ratio ..................... 158 Figure F-1: Kinematics 1 cylinder ................................................................................ 164 Figure F-2: Kinematics 2 cylinder ................................................................................ 165 Figure F-3: Reservoir for kinematics 1 and isolated actuator....................................... 166 Figure F-4: Reservoir for kinematics 2 and isolated actuator....................................... 167 Figure F-5: Reservoir for kinematics 1 and connected actuator ................................... 167 Figure F-6: Reservoir for kinematics 2 and connected actuator ................................... 167 Figure G-1: EMA cross section view............................................................................ 168 Figure G-2: Roller screw geometry .............................................................................. 170 Figure G-3: Gear 1 geometry........................................................................................ 171 Figure G-4: Gear 2 and gear 3 geometry ...................................................................... 171 Figure G-5: EMA shaft geometry ................................................................................. 172
xi
TABLE OF TABLES Table 3-1: Comparison of centralised system and distributed system ............................. 8Table 4-1: Comparison between “MRT7-T” and its competitors................................... 16Table 4-2: Existing aircraft power source availability survey ........................................ 19Table 5-1: Possible prime movers, reducers and kinematics.......................................... 24Table 5-2: Reducer speed and force reduction ratio equations....................................... 25Table 5-3: Kinematics speed and force reduction ratio equations.................................. 27Table 5-4: Transmission speed and force equations ....................................................... 28Table 5-5: Dynamic equations ........................................................................................ 29Table 5-6: BDCM parameters......................................................................................... 37Table 5-7: Kinematics concepts...................................................................................... 40Table 5-8: Optimized kinematics concepts parameters .................................................. 42Table 5-9: Solution synergies ......................................................................................... 47Table 6-1: DHS list of components ................................................................................ 49Table 6-2: AC motor pump parameters .......................................................................... 50Table 6-3: DHS dynamic performance summary ........................................................... 53Table 6-4: DHS power related parameters summary...................................................... 54Table 6-5: DHS Component parameters......................................................................... 56Table 7-1: Isolated EHA-list of components .................................................................. 60Table 7-2: Interconnected EHA-list of components ....................................................... 61Table 7-3: EHA synergies performance comparison...................................................... 62Table 7-4: EHA with PMSM design parameters ............................................................ 63Table 7-5: EHA dynamic performance........................................................................... 65Table 7-6: EHA power consumption .............................................................................. 67Table 7-7: EHA component parameters ......................................................................... 68Table 8-1: EMA diagram-list of components ................................................................. 72Table 8-2: Different gear ratio for EMA with BDCM.................................................... 73 Table 8-3: EMA synergies performance comparison ..................................................... 74 Table 8-4: Torque effects of EMA with kinematics 1 .................................................... 75 Table 8-5: EMA parameters............................................................................................ 76 Table 8-6: EMA dynamic performance .......................................................................... 78 Table 8-7: EMA power consumption ............................................................................. 79 Table 8-8: EMA component parameters......................................................................... 81 Table 9-1: Dynamic performance and functions ............................................................ 85 Table 9-2: Weight and geometry .................................................................................... 85 Table 9-3: Power requirements....................................................................................... 86 Table 9-4: Reliability and maintenance .......................................................................... 87 Table 9-5: Airworthiness ................................................................................................ 87 Table 10-1: Factor weight calculation ............................................................................ 90 Table 10-2: System comparison...................................................................................... 90 Table A-1: Input data of over-wing engine aircraft parametric study .......................... 107
xii
Table A-2: Over-wing engine aircraft design results datasheet.................................... 108 Table B-1: Landing gear turnover angle comparison ................................................... 119 Table B-2: “flying crane” landing gear loading datasheet............................................ 121 Table B-3: “flying crane” tire selection datasheet ........................................................ 121 Table B-4: “flying crane” steel brakes heat sink calculation........................................ 122 Table B-5: “flying crane” carbon brakes heat sink calculation .................................... 123 Table B-6: “flying crane” brake installation space check............................................. 123 Table B-7: “flying crane” main landing gear shock absorber design datasheet ........... 123 Table B-8: “flying crane” nose landing gear shock absorber design datasheet............ 124 Table B-9: “flying crane” landing gear weight estimation ........................................... 126 Table B-10: “flying crane” ground turning radii .......................................................... 128 Table B-11: “flying crane” ground clearance ............................................................... 129 Table C-1: Aerodynamic effects................................................................................... 133 Table D-1: Retraction time requirement of existing aircraft ........................................ 140 Table E-1: Kinematics concept 1 parameters ............................................................... 148 Table E-2: Kinematics concept 2 parameters ............................................................... 152 Table F-1: Existing ACMP summary ........................................................................... 160 Table F-2: Material comparison.................................................................................... 161 Table F-3: Cylinder design parameters......................................................................... 164 Table F-4: Reservoir and system fluid volume design ................................................. 166 Table G-1: Gear pairs design ........................................................................................ 171 Table G-1: Weight of EMA transmission components................................................. 172
xiii

Notation
effectiveA cylinder effective area panelarm arm of force on panel
wheelarm arm of force on wheel C buckling coefficient
maxLC lift coefficient actuatorD hydraulic motor displacement
cylinderD cylinder bored diameter cylinderd cylinder rod diameter
pumpD pump displacement shaftd EMA shaft inside diameter
shaftD EMA shaft outside diameter screwrodd screw rod inside diameter
screwrodD screw rod outside diameter 0d screw nominal diameter
reservoirD reservoir bored diameter E modulus of elasticity
actuatorF actuator output force dragF actuator drag force
udinalaerolongitF aerodynamic force in lateral direction on the panel
maxF actuator maximum output force
alpanellaterF aerodynamic force in lateral direction acting on the panel
tudinalpanellongiF aerodynamic force in longitudinal direction acting on the panel
pivotaxialF axial force on pivot lpivotradiaF radial force on pivot
alwheellaterF aerodynamic force in lateral direction acting on the wheel units
g acceleration of gravity gJ landing gear inertia
mJ motor inertia )(θK linkage speed reduction ratio
eK motor constant 1L landing gear linkage length
cgL height of landing gear centre of gravity to pivot axial
2L landing gear linkage length 3L actuator length
rodL rod length actuatorm actuator inertia
xiv
N load factor loadN load factor
safteyN safety factor backP back pressure rate
burstP burst pressure hP gearbox screw pitch
maxP zero flow pressure tmotoroutpuP motor output power
ratedP rated pressure rate R electrical resistance
fR transmission force reduction ratio factR reducer force reduction ratio
flinkR linkage force reduction ratio gearR gearbox rotary reduction ratio
vR transmission speed reduction ratio vactR reducer speed reduction ratio
vlinkR linkage speed reduction ratio S actuator stroke length
panelS panel area wingS wing area
alwheellaterS effective area of the wheel units in the lateral direction
tudinalwheellongiS longitudinal effective area of the wheel unit and leg
actuatorT actuator output torque cylindert cylinder wall thickness
laerolateraT lateral torque produced by aerodynamic force
emT motor electromagnetic torque frictionT pivot friction torque
gearT torque transmitted by gear geart gear wall thickness
motorT motor output torque maxmotorT motor maximum output torque
pivotT driving torque on pivot staticT pivot axial static torque load
rodt rod wall thickness reservoirt reservoir wall thickness
aV motor terminal voltage actuatorν actuator output speed
fluidV fluid volume lateralV aircraft lateral speed
placardV landing gear placard speed sV aircraft stall speed
xv

α angle formed by and 1L 2L 0α initial value of α
β angle formed by and 2L 3L γ panel incline angle
pη screw efficiency ontransmissiη transmission total efficiency
mη mechanical efficiency vη pump volumetric efficiency
ν Poisson’s ratio motorω motor speed
actuatorω actuator rotary speed pivotω landing gear swing speed
θ landing gear swing angle ρ air density
nsileultimateteσ ultimate tensile strength
mpressionultimatecoσ ultimate compression strength
xvi

Acronyms ACMP AC motor driven pump AC Alternating current ACN Aircraft classification number ADP Air driven pump AEA All-Electric aircraft AVD Air vehicle design AVIC Aviation Industry Corporation of China BDCM Brushless DC motor CBR California bearing ratio CG Centre of gravity DC Direct current DHS Distributed hydraulic system DOC Direct operational cost DRESS Distributed and Redundant Electrical nose gear Steering System EBHA Electrical backup hydrostatic actuator EDP Engine driven pump EHA Electro-hydrostatic actuator EMA Electro-mechanical actuator EMP Electrical motor pump EU European Union GDP Group design project IAP Integrated actuation power system LRU Line replacement unit MEA More-Electric aircraft MLG Main landing gear MOET More Open Electrical MRT-7 Multi Role Transport Aircraft-7 MTOW Maximum take-off weight NASA National Aeronautics and Space Administration NLG Nose landing gear PMSM Permanent magnetic synchronous motor PCN Pavement classification number POA Power Optimized Aircraft P-Q Pressure to flow RAT Ram air turbine SRM Switched reluctance motor SSPC Solid state power controllers
xvii
1 Introduction
1.1 General
This report addresses the problem of landing gear actuation system design for future more-electric or all-electric aircraft. Case study and multi-domain optimization methods have been used in the study. The study discusses the landing gear actuation system together with landing gear kinematics. Several synergies containing actuation systems and landing gear linkages were identified. And through discussion, the best solution has been targeted. A brief introduction of the study context is given in this chapter. Then project objectives are established. After that the project definition and methodologies are presented.
1.2 More-Electric Landing Gear Actuation
The movement towards more-electric or all-electric aircraft has been the biggest trend in the domain of aircraft systems in recent years. It tries to unify the existing three types of secondary power into one, namely electrical power. Various studies have asserted that moving toward more-electric and eventually all-electric has great potential of weight reduction, power saving, and logistic simplification. These all contribute to a much lower DOC when compared with existing aircraft. Despite the great benefits, aircraft manufactures have been reluctant to move radically. To date, there is no major transport aircraft claiming to be “all-electric”. However, the new generation aircraft such as Boeing 787, Airbus 380, A400, F-22, and F-35 all feature more-electric to some extent. It can be foreseen that most of the future onboard systems will be driven by electricity, rather than hydraulic or pneumatic power. Electrically driven actuation systems, such as EHA, EBHA and EMA have been extensively researched and tested for the purpose of flight control actuation. EHA and EBHA have already been used on A380 and Boeing 787 as backup flight control actuators. Various project reports suggest that aerospace manufacturers have been studying possible more-electric landing gear actuation solutions for years. But unfortunately, the information is unavailable to the public because of confidentiality. In other words, no concrete consensus exists on what kind of more-electric landing gear actuation solution will be used in future. This report tries to answer this question and to present the readers with more information about this problem.

2
1.3 Project Objectives
Several objectives were established initially for this study. During the research, new aspects were identified, and the objectives have been revised. The main objectives of this study are listed below:
a) To demonstrate the feasibility of using more-electric actuators as landing gear actuation drives.
b) To explore different actuator configurations, and to find out the best solution.
c) To identify technological difficulties and problems in realising more-electric landing gear actuation.
d) To derive a set of requirements for more-electric landing gear actuation.
1.4 Project Description and Methodologies
In this study, a preliminary design aircraft concept has been used as study case to simulate the problem. Design requirements were generated. Then more-electric landing gear actuation systems were designed for this aircraft. Several possible solutions were identified. System design, modelling, sizing and analysis were conducted to find out possible problems. Then a comparison was made among these systems to find out the best solution. To scale down the problem, only main landing gear was chosen as study object. The knowledge and techniques used by the author in this study were accumulated especially in the GDP (group design project) activities. The GDP activities gave the author background and preliminary experience of aircraft and landing gear design. Chapter 2 describes the GDP project in general. Appendix A documents the author’s contribution in GDP aircraft conceptual design. In Appendix B, the landing gear conceptual design accomplished by the author is described briefly. In order to increase readability, logical orders were followed to clarify the structures in the study project and the report. The project has been divided into the following steps. Problems and methodologies in each step are presented accordingly. a) Literature Review A broad scale literature survey was conducted. The results are presented in chapter 3. Possible systems and components were identified. Massive information and data was obtained. The information was sorted and analyzed, to make sure that it fitted with the state of the art technology level. b) Case Study Definition and Design Requirements Design background and requirements are established in chapter 4. Requirements for more-electric landing gear actuation were derived through summarization and calculation. In order to provide the study with a strong implementing background, a

3
previous aircraft design model “MRT7-T” has been used. The aircraft selection procedure and an introduction to the case study prototype aircraft are given. Emphasis is given to the main landing gear and its related components like the landing gear bay. Loading calculation of main landing gear actuation is presented in this chapter. Case study assumptions together with their reasons are also presented. c) Design Analysis and Optimization In chapter 5, the more-electric landing gear actuation system is analyzed in system level. The system was simplified and mathematic models were built. Uniform mathematic equations were derived to discover systems similarities and differences. Dynamic equations were also derived. Simulations based on these equations were extensively used throughout this study. It was followed by discussion of possible actuation solutions. After that, design optimization philosophies were identified. Moving towards more-electric actuation means thorough innovation for the systems design. As a result, taking the landing gear itself into consideration is necessary. Landing gear kinematics concepts were identified and analyzed together with actuation systems. At the end of this phase, synergies of actuation systems together with their favorable kinematics linkages were identified. Old style central hydraulic systems with the chosen kinematics parameters were designed and analyzed. They were used as comparison baselines. d) Systems Design In chapter 6 to 8, possible system synergies are discussed. Three forms of systems: DHS (distributed hydraulic system), EHA (electro-hydrostatic actuator) and EMA (electro-mechanical actuator) have been designed. Different motors, kinematics, and system architectures have been evaluated for use in each system design. After that, design and sizing of systems were conducted. Results such as dynamic performance, weight, size and power requirements were obtained through simulations. For each system, landing gear extension safety analysis, dispatch reliability and potential problems were discussed. System designs were sufficiently detailed for evaluation. e) Results Summarization, Discussion and Conclusion In chapter 9, results are summarized and compared in various aspects. Scores were given to each system in aspect. In chapter 10, the importance of these aspects is discussed. Weight of each aspect was decided based on their importance. After that, weighting of aspects and scores of systems were combined. Final scores were given to each system. Final comparisons and conclusions were made according to the scores. The limitations of this study were discussed later on. Further works which were considered to be worthy by the author are given in the recommendations for future work chapter.

4
2 Group Design Project Activities The aim of the group design project was to design a 130-seat civil transport aircraft. The design team used 6 months to finish its conceptual design. The final accomplishment of the GDP project was the “flying crane” aircraft. The process of the conceptual design project was consisted of the following phases:
a) Phase one: Requirement derivation b) Phase two: Parametric analysis, four configurations c) Phase three: Design analysis, two aircraft competition. d) Phase four: Final conceptual design, flying crane e) Summary and presentation
The work of the author in each of the phases is listed below:
a) Phase one: Data collection and performance requirement b) Phase two: Golden team aircraft configuration and wing design c) Phase three: Amber team aircraft landing gear design d) Phase four: Flying crane aircraft geometry and landing gear design e) Phase five: Presentation of geometry and landing gear design
The author made contribution in the design team mainly in the following aspects:
a) Aircraft configuration design (please refer to Appendix A) b) Aircraft geometry design (please refer to Appendix A) c) Landing gear conceptual design (please refer to Appendix B)

5
3 Literature Review
3.1 Introduction
This chapter summarizes the information concerning more-electric landing gear actuation. Information of more-electric aircraft is summarized at first, followed by more-electric landing gear survey. Then, more-electric actuation technology is analyzed. Technology which could be used on more-electric landing gear actuation is derived from the analysis.
3.2 More-Electric Aircraft Survey
More-electric aircraft is not new for the aerospace industry. Before hydraulic systems were used on aircraft, electrical motors were used to drive the moving components. The British “Vulcan”, “Victor” and “Vickers” bombers are of this kind [5]. In those days, the electrical drives were heavy and inefficient. So they were soon replaced by hydraulic systems which had much higher power density. On modern aircraft, there are typically three different types of secondary power, namely hydraulic, pneumatic, and electric power. These three kinds of secondary power have their unique features and implementations. They are so different, that each of them requires a set of support equipments and service personnel. In order to fulfil the safety requirements, each of the three power systems has a certain level of redundancy [1]. For example, a typical civil transport aircraft normally has three onboard hydraulic systems, and three electrical systems and two environmental control systems. This approach results in considerable aircraft level mass penalty and power waste. What is even worse, the aircraft systems are extremely complex, resulting in intensive maintenance work. Recent improvements in the domains of motor and power electronics give a chance to change that situation. Aircraft manufacturers and researchers have researched for decades, to unify the three different kinds of secondary power into one, namely electrical power. In a more-electric aircraft (or all-electric aircraft), most of the secondary power users will be driven by electrical motors. This will dramatically reduce system complexity, and thus operational and acquisition cost. More over, researches have predicted that possible weight reduction could be expected. And because of elimination of engine bleeding, the engine performance can be improved significantly. All these are contributing to a lower aircraft DOC. Researches have shown that all-electric aircraft is not economical and applicable in the near future [5]. Radical movement towards all-electric aircraft is unlikely to happen. Most recent researches focus on more-electric aircraft. Road maps have been made to substitute the traditional onboard systems with more-electrical systems step

6
by step [2].
3.2.1 Major Research Projects The most famous and important more-electric researches would be POA (Power Optimized Aircraft) [1], MOET (More Open Electrical) and Power-By-Wire. The first two projects were sponsored by the European Union. The last one was supported by NASA in United States [8]. Various other research projects were also conducted throughout the world. Reference [78] and [79] document the flight test results of using EHA and EMA as aileron actuator. The objectives of the above projects were to validate the secondary power and fuel consumption savings provided by the more-electric architectures. Also, total equipment weight and maintenance cost was expected. The current level of reliability, safety, and costs were maintained. The projects asserted that more-electric equipments could be used on new aircraft, and also on retrofitting old aircraft [1]. The results of the projects show a weight increase rather than saving. The weight increase are caused mainly by the heavy power electronics and heavy drives, both of which are absent in a conventional aircraft. This is the price paid for the greatly reduced maintenance needs. These have been proved by the development of Boeing 787 [22]. Current results of the virtual iron bird simulation show that large power savings can be achieved with an MEA [1].
3.2.2 More-Electric System Features Through summarizing the available information, the features of more-electric systems are listed below. Weight: Currently, more-electric systems are heavier in system level then their traditional counterparts. This has been proven by most of the research activities [5] [22]. Efficiency: More-electric systems are inherently more efficient. Firstly, power losses in electricity generation and transmission are far less then that in hydraulic or pneumatic systems. Secondly, an electrical actuator can be designed to work only when it is needed. By contrast, on current aircraft, high hydraulic pressure is maintained from engine start to engine shut down, resulting in great power losses. Moreover, electrically driven systems have a “power on demand” feature. They can deliver the exact amount of power as needed by the load, so they waste less energy [1]. Reliability: Both POA and Power-By-Wire projects have proven that electrical systems are more reliable. “POA studies of landing gear show that further simplification of MEA systems is achievable and leads to higher reliability.” [1]. One reason is that, multiple electrical power sources can be linked to a single actuator

7
without seriously interfering with each other. This increases the power availability of the systems. Another reason is that it is far easier to implement automatic fault detection and isolation in electrical systems than in hydraulic or pneumatic systems. Logistics: The big benefits in logistics by using more-electric systems are envisaged. By reducing the system types from three to one, large changes will happen in maintenance activities. Firstly, costs on training and employing service personnel can be reduced largely, because only one kind of system is needed to cater for. Secondly, service equipments can be reduced. Thirdly, total aircraft system components can be greatly reduced. Also, state of the art fault detection devices can reduce the time and resource on trouble shooting to the minimal. This will greatly reduce the service hours and shorten the aircraft turnover time. Last but not least, faulty hydraulic and pneumatic parts are very difficult to remove, so is system recovery. By contrast, electric parts provide more flexibility on maintenance [4] [6]. When taking into consideration of the large investment needed in shifting from traditional systems to more-electric systems, it is easy to get the idea that the gain of more-electric systems is not worth the investments. However, traditional systems like hydraulic and pneumatic systems have improved little in the last several decades. By contrast, more-electric systems have far greater potential for improvement in the future than conventional systems [1]. Previous researches have shown that simply electrifying the traditional systems would not yield enough benefits. To achieve greater benefits, the problem must be solved at the aircraft level.
3.3 More-Electric Landing Gear Survey
Landing gear is the largest short period power user of hydraulic system on civil transport aircraft. In the context that flight control system is shifting from central hydraulic power to electrical power, landing gear actuation has no reason to insist on central hydraulic power supply. In landing gear domain, more-electric actuators have already been used on brakes and locks. The Boeing 787 has used electrical mechanical actuators to drive the brakes. On both Boeing 787 and Airbus A380, electrical driven actuators are used on landing gear locks. On Airbus A380, a local electro-hydraulic generation system (LEHGS) is utilized in backup mode for nose and main landing gear steering system [15]. The Boeing 787 landing gear actuation is driven by two 270V DC driven EMP in normal operation, and a RAT in emergency (figure 3-5). No EDP power is used at anytime for landing gear operation. So, Boeing 787 is actually the first wide body civil jet which features “more-electric landing gear actuation”, although it still has conventional system configuration.

8
Figure 3-1: Boeing 787 hydraulic system architecture (picture from [16])
As for research projects, both POA and Power-By-Wire projects use EHA for landing gear actuation purpose [1] [8] [59]. Messier-Dowty is currently evaluating electrical solutions of landing gear retraction [13] [14]. Messier-Bugatti is leading an EU research project named DRESS (Distributed and Redundant Electrical nose gear Steering System) [15]. The information of these researches is still not known to the public.
3.4 More-Electric Actuation Survey
On current aircraft, low power users such as door actuation, tail trimming and flap actuation have a long history of using electrically driven actuators. The central hydraulic systems have served on heavy loading conditions. In safety critical areas such as flight control and landing gear actuation, central hydraulic systems have been exclusively used. Hydraulic technology has been proven to be robust and competent. However, its maintenance intensive property has been disputed ever since it was firstly used on the aircraft. The recent advances on electrical driven distributed actuation systems like EHA and EMA, are all aiming to reduce or hopefully eliminate the usage of central hydraulic systems. This happens especially in the field of flight control system. Moving towards more-electric mainly involves replacing centralized hydraulic systems with localized actuation systems. The properties of centralised systems and distributed systems are compared in the following table. The information is summarized from reference [1] to [13].
Table 3-1: Comparison of central hydraulic system and distributed actuation system
Central hydraulic system Distributed actuation system
Power source EDP pumps, supplemented by EMP pumps,
ADP pumps, and RAT.
Motors, EMP pumps.
System
configuration
At least two systems. Each system powers a
number of actuators. Actuators for the same
Each actuator drives a specific load.
Each actuator can have multiple

9
load are powered by different systems for
redundancy.
motors and get power from multiple
electrical buses for redundancy.
System
disposition
Parts and tubing of each system are located
through out the aircraft.
The actuation system is located near
the load.
Weight Actuators are light.
The overall mass is considerable.
Actuators are heavy.
The overall mass depends on the
number of actuators.
Power
consumption
Inefficient because of the constant high
pressure and leakage.
Efficient because it provides power
only when needed.
Reliability and
Maintainability
Poor reliability and maintainability
Difficult to locate and remove faulty parts
Difficult to recover system
Good reliability
Easy to maintain
Easy fault detection and segregation
Safety Reasonable Safety level
Prone to tubing failure
Reasonable safety level
Maturity high maturity level low maturity level
From the above table, distributed actuation systems are considered superior mainly because of clear interfaces and relaxed maintenance.
3.4.1 More-Electric Actuators Up to date, the available more-electric actuation methods for landing gear actuation are distributed hydraulic system, EHA, IAP and EMA [7]. The last three actuators are illustrated by the following figure:
Figure 3-2: More-electric actuator technology (picture from [7])
a) Distributed hydraulic system(DHS) Distributed hydraulic system uses AC induction motors to drive a localised hydraulic system. Apart from the use of electrical motor, it has no big difference with central hydraulic system on system architecture. As a result, distributed hydraulic system has the highest technology maturity. Current off-the-shelf products could be modified to use. However, it also inherits most of the drawbacks of central hydraulic system.
10
b) Electro-hydrostatic actuation system(EHA) EHA system also contains an electrical driven hydraulic pump. The output flow is modulated by changing the motor speed and direction, rather than by pump modulation. So fixed displacement hydraulic pumps are used. The hydraulic circuit of EHA is simpler than that of distributed hydraulic system [7]. c) Integrated actuation power system(IAP) IAP system is almost identical to the EHA system. The difference is on output flow rate control method. In IAP system, a variable pump is used, with the pump displacement controlled by a proportional control motor. IAP is not applicable for landing gear actuation, as its output flow controllability is of no practical use in landing gear actuation [7] [9]. d) Electro-mechanical actuation system(EMA) EMA system is believed to have the biggest potential. It works in a similar philosophy as EHA. The speed of EMA is also controlled by modulating the motor speed. The difference is that in EMA, a mechanical gearbox is used as transmission rather than hydraulic circuit. As a result, no leakage or fire hazard as that of EHA will happen on EMA. Also, the maintenance of EMA could be much simpler than that of EHA. However, up until now, EMA is disputed for its tendency of jamming. This potentially unsafe failure mode has limited its usage in safety critical applications. Also, the power density of EMA is still not comparable to that of EHA. Large investment has been made worldwide to make the EMA technology safer and more powerful [7] [9]. There are also several new kinds of actuation system in development. However, these actuators are not mature enough to be considered yet.
a) Piezo-composite actuator b) Shape-memory-alloy actuator
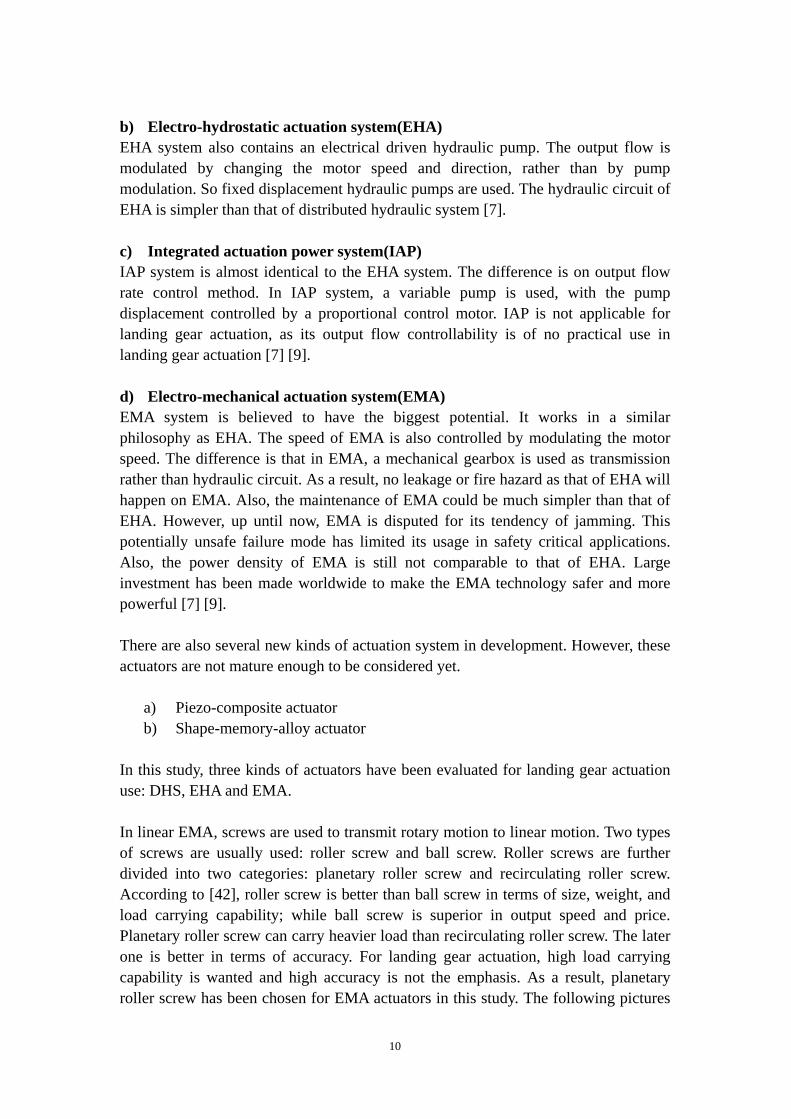
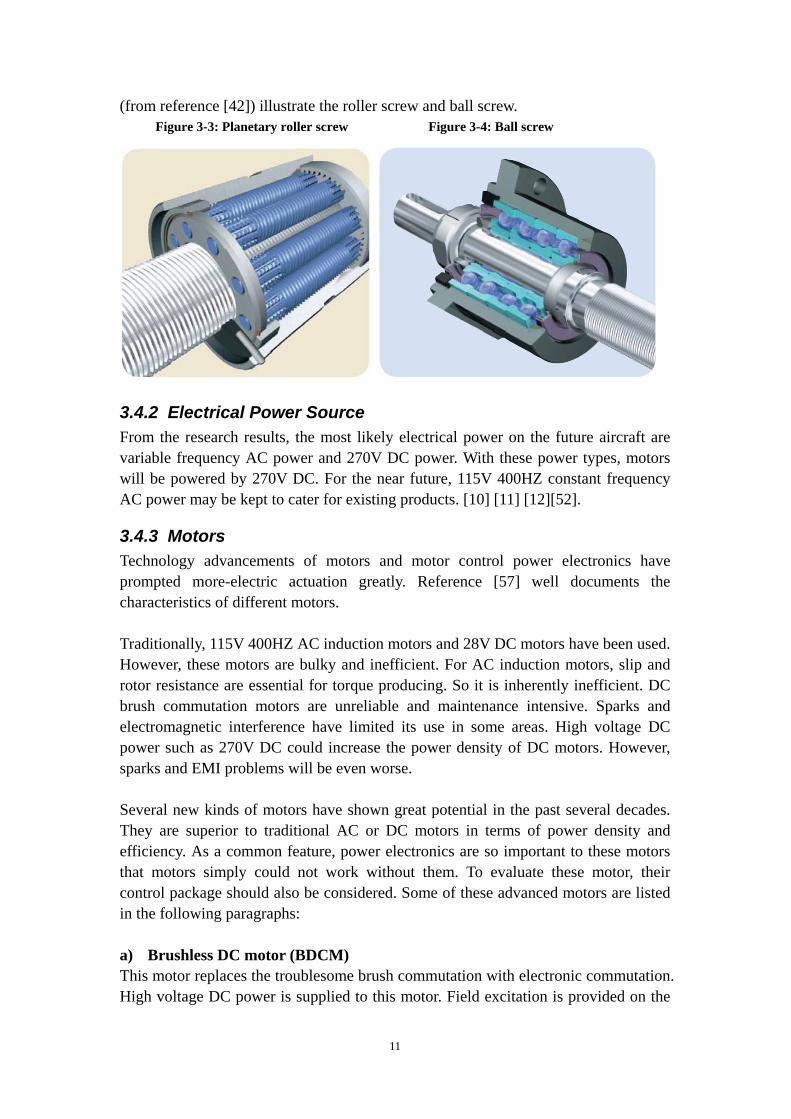
In this study, three kinds of actuators have been evaluated for landing gear actuation use: DHS, EHA and EMA. In linear EMA, screws are used to transmit rotary motion to linear motion. Two types of screws are usually used: roller screw and ball screw. Roller screws are further divided into two categories: planetary roller screw and recirculating roller screw. According to [42], roller screw is better than ball screw in terms of size, weight, and load carrying capability; while ball screw is superior in output speed and price. Planetary roller screw can carry heavier load than recirculating roller screw. The later one is better in terms of accuracy. For landing gear actuation, high load carrying capability is wanted and high accuracy is not the emphasis. As a result, planetary roller screw has been chosen for EMA actuators in this study. The following pictures
11
(from reference [42]) illustrate the roller screw and ball screw. Figure 3-3: Planetary roller screw Figure 3-4: Ball screw
3.4.2 Electrical Power Source From the research results, the most likely electrical power on the future aircraft are variable frequency AC power and 270V DC power. With these power types, motors will be powered by 270V DC. For the near future, 115V 400HZ constant frequency AC power may be kept to cater for existing products. [10] [11] [12][52].
3.4.3 Motors Technology advancements of motors and motor control power electronics have prompted more-electric actuation greatly. Reference [57] well documents the characteristics of different motors. Traditionally, 115V 400HZ AC induction motors and 28V DC motors have been used. However, these motors are bulky and inefficient. For AC induction motors, slip and rotor resistance are essential for torque producing. So it is inherently inefficient. DC brush commutation motors are unreliable and maintenance intensive. Sparks and electromagnetic interference have limited its use in some areas. High voltage DC power such as 270V DC could increase the power density of DC motors. However, sparks and EMI problems will be even worse. Several new kinds of motors have shown great potential in the past several decades. They are superior to traditional AC or DC motors in terms of power density and efficiency. As a common feature, power electronics are so important to these motors that motors simply could not work without them. To evaluate these motor, their control package should also be considered. Some of these advanced motors are listed in the following paragraphs: a) Brushless DC motor (BDCM) This motor replaces the troublesome brush commutation with electronic commutation. High voltage DC power is supplied to this motor. Field excitation is provided on the

12
rotor by rare earth permanent magnets. And windings are mounted on the stator. So heat rejection and power supply is more convenient. Power electronics are used to provide commutation. So a sensor must be used to obtain rotor position. b) Permanent magnet synchronous motor (PMSM) This kind of motor is some times called Brushless AC motor. Its construction is almost the same with that of brushless DC motor. The difference lies in their control methods. In BDCM, the power supply to the motor is of trapezoidal wave form; while in PMSM, it is sinusoidal form [39]. As a result, an absolute position sensor must be used in PMSM to align the motor position and flux phase. PMSM has better performance than BDCM in terms of cogged torque, power density and so on. Its power electronics are more complex and expensive than that of BDCM. c) Switched reluctance motor (SRM) Switched reluctance motor is also a synchronous motor. It resembles reluctant stepper motors, while it runs continuously. It has a simple motor construction. So it can provide better manufacture and maintenance attributes than BDCM and PMSM. This motor has received attention especially in UK. Cogged torque and high noise level are disadvantages of this kind of motor. SRM has the potential of replacing BDCM and PMSM. The main benefit is its simplicity in motor construction. So potentially it could be cheaper, and more reliable. However, it also needs absolute position sensor and complex power electronics. Also, its power density is slightly lower than that of BDCM and PMSM [39]. These factors compromise its benefits. d) Advanced induction motor This kind of motor utilizes very high frequency input power, for example 20kHZ. US air force and NASA have conducted a series of researches to validate its availability [58]. Several control methods, such as “field-orientation control” and “vector control” are researched to improve its performance. This motor inherits the advantages of AC motors. It is rugged, and easy to manufacture and maintain. However, it is operated by specially designed and fabricated power electronics. Running at extremely high frequency and high voltage, the inverters are pushed to the limits. So it is the control power electronics, not the motor which is not reliable. Most of the more-electric actuators are designed for applications such as primary flight control and brakes. For landing gear actuation, the motors are needed to drive the landing gear from one position to the other, which is, from lowered to retracted, or vice versa. So, there is actually no need for motor speed adjustment or servo control. In light of this, very complex motors are not favourable. Because of the complexity of power electronics, SRM and high frequency AC induction motor are not considered in this study. BDCM and PMSM have received most of the emphasis in researches due to their high efficiencies and power densities. They have been widely used in EHA and
13
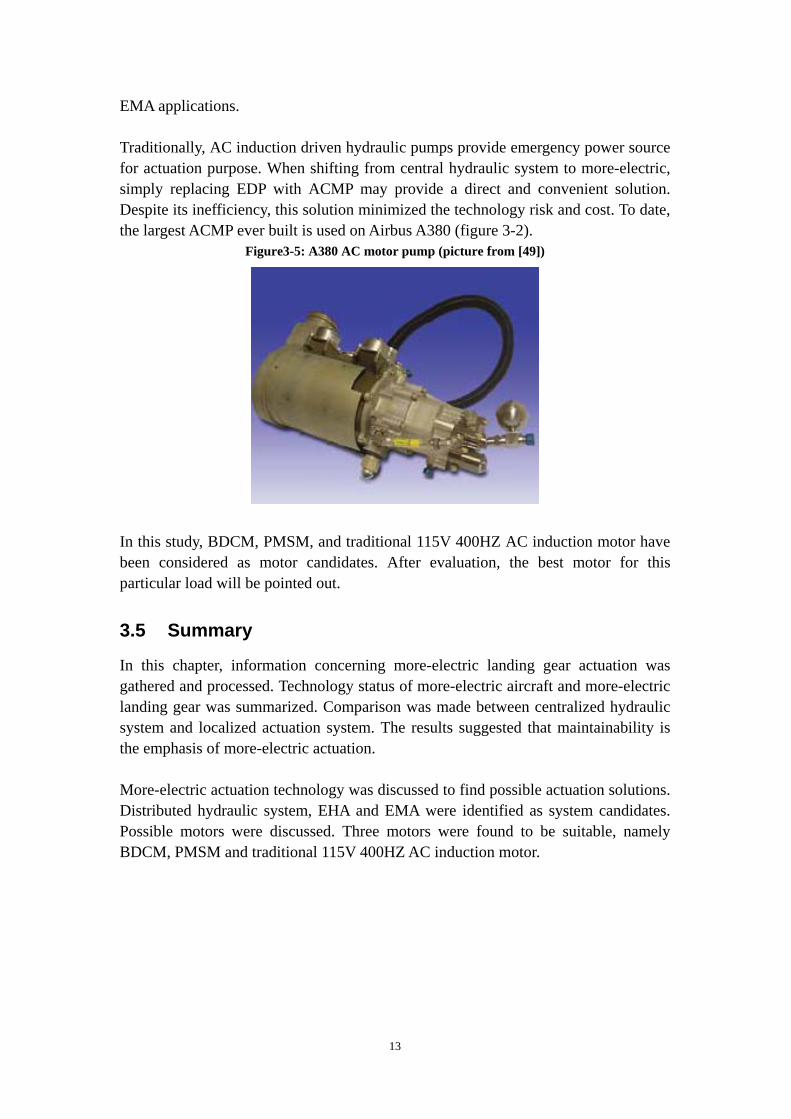
EMA applications. Traditionally, AC induction driven hydraulic pumps provide emergency power source for actuation purpose. When shifting from central hydraulic system to more-electric, simply replacing EDP with ACMP may provide a direct and convenient solution. Despite its inefficiency, this solution minimized the technology risk and cost. To date, the largest ACMP ever built is used on Airbus A380 (figure 3-2).
Figure3-5: A380 AC motor pump (picture from [49])
In this study, BDCM, PMSM, and traditional 115V 400HZ AC induction motor have been considered as motor candidates. After evaluation, the best motor for this particular load will be pointed out.
3.5 Summary
In this chapter, information concerning more-electric landing gear actuation was gathered and processed. Technology status of more-electric aircraft and more-electric landing gear was summarized. Comparison was made between centralized hydraulic system and localized actuation system. The results suggested that maintainability is the emphasis of more-electric actuation. More-electric actuation technology was discussed to find possible actuation solutions. Distributed hydraulic system, EHA and EMA were identified as system candidates. Possible motors were discussed. Three motors were found to be suitable, namely BDCM, PMSM and traditional 115V 400HZ AC induction motor.
14
4 Case Study Introduction and Design
Requirements
4.1 Introduction
In this chapter, the study background is discussed in detail. Firstly, the case study aims and scope are settled. Limitations and assumptions are established to simplify the problem. Then the case study aircraft is chosen through discussion. Information about the aircraft and the main landing gear is presented. Landing gear actuation loads are calculated. Design requirements such as redundancy level and retraction time are generated.
4.2 Case Study Aims, Limitations and Assumptions
The aim of this study is to discuss the issues concerning more-electric landing gear actuation, and to find out the possible solutions. The following system characteristics were considered to be important.
a) System weight b) Size and compatibility c) Operational safety d) Reliability and maintainability e) Power efficiency
Because of the diversified aircraft types, the requirements for landing gear actuation may vary considerably. Certain limitations were made to scale down the problem: a) Civil transport aircraft Civil transport aircraft was chosen for the reason of easier information acquisition. Also the operational conditions of this kind of aircraft are relatively simple. So, their requirements are relatively uniform. b) Main landing gear To further simplify the problem, only the main landing gear was selected to be the actuation subject. With more-electric solution, the nose gear actuation system would be entirely isolated from the main landing gear actuation system. So the main gears and nose gears could be treated separately. Also, nose gear actuation system has the same requirements as main gear actuation systems. The problems are more severe on the main gears than on the nose gears, because they are much heavier. So the solutions for main landing gear actuation should be also suitable for the nose gears. c) Landing gear actuation system Only the landing gear extension/retraction system was selected. This system has to

15
deal with the large force and stroke, and also rigorous safety requirements. Other types of actuation in landing gear domain such as braking and steering cause less problems implementing more-electric concept. In fact, electrical brakes have already been use on Boeing 787 and Bombardier new Challengers. The steering system is less difficult because of its relatively smaller force and stroke requirements. d) Conceptual stage study Because of the time and resource limitation, the study was confined in system conceptual design stage.
4.3 Aircraft Selection
4.3.1 Aircraft Selection Having in mind the nature of this study, some rules were set in aircraft selection. Firstly, the aircraft design must be reasonable and successful. Without it, the results would not be correct. Secondly, enough information must be available to the author. The author had three options: a) Existing aircraft
Using existing aircraft as design basis provides the maximum credibility. However, there was not an aircraft which could provide enough public information for this study.
b) “Flying Crane” The “Flying Crane” is a GDP design outcome. The author was deeply involved in the design of this aircraft. Actually, the author was responsible for its landing gear design. In this sense, this aircraft could provide maximum benefits in terms of familiarity and data acquisition. However, the aircraft was still in the end phase of conceptual design, and very little emphasis was put on the structure design. As a result, the “Flying Crane” was also considered to be unsuitable for this study.
c) “MRT-7” The “MRT-7(Multi Role Transport Aircraft)” is also a GDP design outcome, which was designed by the designed by the 2007-2008 AVD students in Department of Aerospace Engineering in Cranfield University. Much different from the previous one, it had already finished the preliminary design. So it could provide much detailed information for this study. Thanks to the support of Department of Aerospace Engineering, the author had the permission to get hold of the information and make use of it.
Based on the above analysis, the author decided to choose the “MTR-7” as the design case aircraft.

16
4.3.2 Aircraft Description The aim of “MRT7” was to “design an aircraft that will replace the fleet of outdated KC-135s and KC-10s and will be able to complete with current solutions like the KC-767 and Airbus A330 Future Strategic Tanker Aircraft.” [20]. The MRT7 project contains four variants, namely MRT7-T, MRT7-8, MRT7-8F, and MRT7-3/3R. The first three variants share the same MTOW, which is considerably larger than the MRT7-3/3R. The MRT7-T represents the original design. The author chose MRT7-T as the case study aircraft. The following table summarizes the comparison between MRT7-T and its close competitors:
Table 4-1: Comparison between “MRT7-T” and its competitors MTR7-T [20] A330-200 [30] Boeing 787 [29]
Maximum Take-off Weight, T 238.112 233 219.539
Maximum Landing Weight, T 180.3 182 167.829
Operating Empty Weight, T 118.699 117.041 114.532
As shown in the above table, the “MTR7-T” is close to the A330-200 and Boeing 787 in terms of maximum take off weight. Then, it can be safely predicted that their landing gears are also close to each other in terms of weight and actuation power. In this case, it benefits in two ways: firstly, the results can to some extent be cross-checked with data of these competitor aircraft; secondly, the results will have more credit in representing the reality.
4.4 Main Landing Gear of “MTR7-T”
According to reference [20], each of the two main landing gear units of MRT7-T weights 3767kg. When in the lowered and locked position, the landing gear is in the upright direction. It swings proximately 75degrees into the landing gear bay. The following figures show the landing gears geometry of “MTR7-T” and its competitors.
Figure 4-1: “MRT7-T” main landing gear [From 3D models]

17
Figure 4-2: Boeing 787 main landing gear [16] Figure 4-3: A330-200 main landing gear [30]
4.5 Landing Gear Actuation Loading Calculation
The landing gear has two working modes: retraction and extension. When retracting, actuator delivers power to raise the landing gear. When extending, actuator works as decelerator. Retracting mode has more severe power requirements for the actuator. As a result, analysis in this report will focus on landing gear retraction. Extension mode will be analyzed quantitatively. During landing gear actuation, various loads are effective. Reference [45] specifies those ones which should be considered. Major load are of the following four kinds. There are also other forms of loads, such as brake torque loads and gyroscopic loads. These loads are very small when compared with the above ones. As a result, they were not considered in this study.
a) Load by gravity force; b) Load by aerodynamic force, c) Load by friction force, d) Dynamic load.
These loads can be divided into two forms: static load and dynamic load. a) Static load Static loads dominate in landing gear actuation. Actuation power used to counteract these loads is converted into other forms. The energy used to counteract aerodynamic force and friction force is dissipated as heat. And the energy used to lift the weight of the landing gear turns into potential energy. b) Dynamic load In order to swing into allocated position within time limits, the landing gear has to gain a reasonable speed and hence dynamic energy. The dynamic energy will be dissipated in the end of actuation by punching into landing gear locks. For better efficiency and shock alleviation, landing gear retraction end phase swing speed

18
should be as small as possible. For ease of computation, all loads were calculated in the form of torque moment on landing gear pivot axial. These loads were calculated in Appendix C. The following figure shows the results of static load torque
Figure 4-4: “MRT7-T” main landing gear actuation static loads
0 10 20 30 40 50 60 70 80-0.5
0
0.5
1
1.5
2
2.5x 10⁵
SWING ANGLE, deg
MO
ME
NT,
Nm
PIVOT MOMENT
TOTAL MOMENT
PIVOT MOMENT BY GRAVITATION
PIVOT MOMENT BY AERODYNAMICS
PIVOT MOMENT BY FRICTION
The resultant total load torque is a function of landing gear swing angle. )(θfTstatic = .
The landing gear inertia measured with respect to pivot axial is: 36719=gJ
From the above figure, load caused by gravitation dominates. Analysis in Appendix C shows that energy stored in landing gear inertia is very small when compared with the energy counteracting static loads. It implies that static load is far larger than dynamic load. Because of this, the total static load, rather than the sum of static load and dynamic load, was used in sizing components in this study.
4.6 Design Requirements
The design requirements of landing gear actuation are diversified. High reliability and safety, low cost, minimum weight, high integrity, and good maintainability are all highly demanded. These requirements are conflicting in several aspects. However, certain priorities exist. Because of the serious failure consequences, safety

19
requirements prevail in the landing gear actuation system design.
4.6.1 Redundancy Level If not all the landing gears are lowered and locked prior to touch down, a gear-up landing is unavoidable. In that case, injuries or even loss of human lives are likely to happen. The aircraft itself is due to be damaged on landing. To obtain reasonable safety, a minimum redundancy level must be ensured. Redundancy also benefits on increasing dispatch reliability. A more-electric actuation system can be divided into two main parts, actuator and electrical power source. The electrical power redundancy was not discussed, because it should not be a big problem on a more-electric aircraft. In this study, electrical power reliability was regarded to be infinitely high. Due to the installation space constraints, it is always extremely hard, if not impossible, to allocate redundant actuators for landing gear actuation purpose. Using tandem actuators as normally do in flight control system is also not applicable. So, landing gear actuators are typically non-redundant. Normally, one landing gear leg has a single driving actuator. In one actuator, power conversion devices such as hydraulic pumps and electrical motors are normally redundant. In fact, these devices are the most important but also the most unreliable components in an actuator. These components should have enough redundancy level. In actual aircraft design activities, the redundancy level is decided through reliability study. However, in this study this approach was difficult to perform because of time restriction and lack of reliability data. The author used another way to tackle this problem. In the following table, the hydraulic power source (hydraulic pump) availabilities on existing civil aircraft were listed. This availability stands for how many pumps deliver power to a single main landing gear cylinder. From this information, a reasonable power conversion device redundancy level could be derived. The information came from reference [32]. In the following table, a PTU means available hydraulic power from more than one pump in another system.
Table 4-2: Existing aircraft power source availability survey
Wide Body Civil Jets Narrow Body Civil Jets
Aircraft Type Main Gear Drive Aircraft Type Main Gear Drive
A300B 2EDP+2ACMP CONCORDE 2EDP+RAT+ACMP
A300-600 2EDP+2ACMP A319/320/321 EDP+PTU
A310-200/300 2EDP+2ACMP BAE 111-500 EDP+ACMP
A330-200/300 2EDP+RAT+ACMP B707-120/320/420 2EDP
A340-200/300 2EDP+RAT+ACMP B727-100/200 2EDP
EDP+ADP(nose and body) B737-100/200 2EDP B747-100/200/300
EDP+ADP+ACMP(wing) B737-300/400/500 EDP+ACMP

20
EDP+ADP(wing and body) B757-200 EDP+ACMP+PTU B747-400
EDP+ADP+ACMP(wing) MD-81/82/83/87/88 EDP+ACMP+PTU
B767-200/300 2ACMP+ADP MD-90-30 EDP+ACMP+PTU
B777-200/300 2EDP+2ACMP
B787 2EMP+RAT
MD-11 2EDP+2ACMP+PTU
L1011-1/100/200/500 EDP+ADP+ACMP
DC-10-10/30/40 2EDP+2ACMP+PTU
As depicted by the table above, the number of landing gear hydraulic power sources are normally large. The Boeing 787 has the least power source redundancy level in wide body aircraft. The Boeing 787 landing gear actuation is driven by two 270V DC driven EMP in normal operation, and a RAT in emergency. The Boeing 787 central hydraulic system still has conventional architecture which extensively uses hydraulic tubing. This to some extent reduces the power source safety. From the above analysis, the author concluded that a least mechanical power source redundancy level of 2 should be enough for safety. This redundancy level should provide enough credit to satisfy the airworthiness authorities.
4.6.2 Actuation Time Requirement The landing gear actuation time requirement is of different importance towards central hydraulic system and distributed more-electric actuation systems. In central hydraulic system design, the system rated flow rate is designed to accommodate multiple actuation functions. So for each actuator, the system is over powered. Actuation time is not a very demanding parameter towards system capacity design. In fact, measures are usually taken to limit the actuator speed for safety considerations. More-electric actuators are dedicated to certain functions. Landing gear actuation is only needed immediately after taking-off and prior to touching-down. And it is restricted from use in other flight segments. So, unnecessarily tight actuation time requirements will over power the actuation system. Based on the past experience, the retraction time requirement is more critical than that of the extension time. The reasons are as following: a) During taking off, the landing gear has to be retracted as fast as possible to
reduce drag [19], in order to maximize the climb and accelerate performance, which are critical for safety.
b) During taking off, the accelerating rate is considerable, so the landing gear
placard speed is likely to be exceeded if the retraction speed is not quick enough.

21
c) During retraction, massive actuation power is needed to raise the heavy gears. In
contrast, during extension, actuation force is normally needed only to decelerate the gears. As a result, retraction is always more critical for the actuation system, which means retraction is prone to use more time than extension.
Focuses will be put on the retraction mode during the following analyses. And extension mode performance will be checked for validity. In Appendix D, two methods were used to estimate the retraction time requirement. One method contains summarizing the requirements of existing aircraft. The other method calculates the time requirement through aircraft performance simulation. The result suggested by these two methods is 15-20s. To limit the scale of the analysis, the retraction time requirement was fixed to 15s. This gives some allowance to the actuation of landing gear subsidiary components such as locks and doors.
4.6.3 Heat and Power Dissipation Heat is generally perceived to be the major contributor to motor and power electronics degradation. According to reference [38], electronic component life reduces by half with every 10degree of heat increase. Temperature control is particularly important for more-electric actuation, because of the extensive use of motor and power electronics. Two parameters could be used in analyzing this problem: the amount of energy conversion, and the efficiency. So, higher efficiency and smaller energy consumption are favorable. For more-electric actuators, a unique problem is power dissipation. During landing gear extension, actuators should be engaged to provide resistant force. Otherwise the massive dynamic energy converted from potential energy would cause damage to the down locks. The motors work as generators during landing gear extension. According to reference [50], the generated electrical power should be dissipated locally rather than feed into power grid. The reason is that this generated power does not fit the onboard power quality requirements.
4.6.4 Installation and Working Environment Due to the sizing constraint of the landing gear bay, effort must be made to minimize the volume of actuators. The landing gear actuation system has to survive the severe vibration and also the ambient environment. When gears are in the lowered position, the landing gear actuators are exposed to the open atmosphere. Dust,humidity, temperature change,de-icing agents all pose effects on the actuation system. Human error is another major cause of malfunctions. These issues should be considered in system design.

22
4.7 Summary
In this chapter, certain assumptions were made to simplify the problem. In order to form a clear case study basis, an aircraft with enough data was chosen and analysed. The landing gear data for this aircraft was extracted. Its loading condition on landing gear extension was calculated. Requirements for the systems were derived. A minimum mechanical power source redundancy level of 2 was considered to be adequate. A 15s landing gear retraction time was set as the minimum requirement. Potential systems such as heat and power dissipation, and working environment compatibility were identified. These requirements were followed throughout this study.

23
5 System Analysis and Optimization
Methodologies
5.1 Introduction
Given the case study aircraft and the design requirements, possible more-electric landing gear actuation solutions are discussed in this chapter. The functions and compositions of systems are analysed. System mathematic models are built for simulation. Optimization philosophies are identified based on analysis. After that, kinematics concepts and motors are discussed. Central hydraulics driven landing gear actuation system for the case study aircraft is analyzed to form a comparison basis.
5.2 System Modelling
Landing gear actuation system could be divided into three parts: prime mover, transmission, and load. In traditional central hydraulic circuit, prime mover of actuator is the central hydraulic power generation system. In more-electric actuation systems, electrical motors become prime movers. The power electronics should be regarded as an integral part of motor because of their close relationship. The transmission is composed of two sub nodes: speed reducer, and kinematics. Speed reducer in a hydraulic actuator contains components from pumps to cylinders. Subsidiary components such as valves, tubes, reservoirs are also part of speed reducer. Gearbox serves as speed reducer in an EMA. In a linear EMA, the speed reducer normally contains a screw, several pair of gears, and structural parts. Kinematics (linkages) can also be regarded as a kind of speed reducing device. However, their speed reduction ratios are functions of landing gear swing angle, rather than being constant as that of speed reducers. The static load torque is a function of landing gear swing angle. So the landing gear can be simplified as a fly wheel with a separate resistant torque. The following graph illustrates the simplified system:
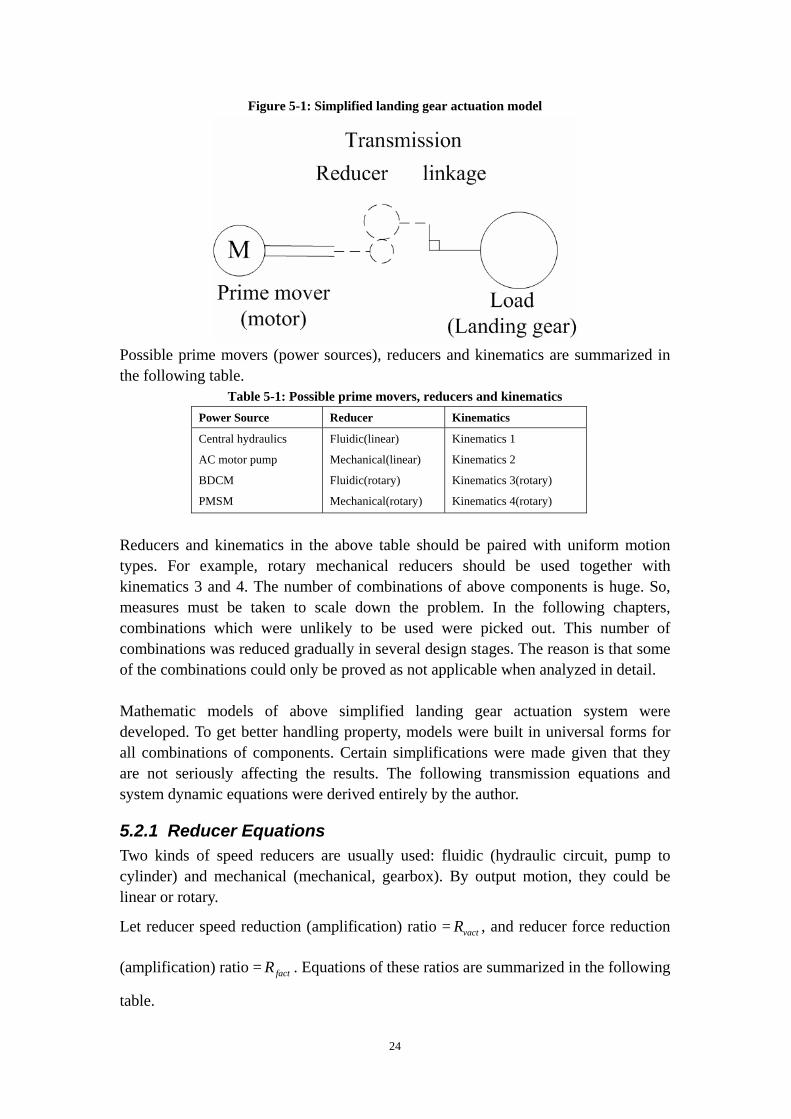
24
Figure 5-1: Simplified landing gear actuation model
Possible prime movers (power sources), reducers and kinematics are summarized in the following table.
Table 5-1: Possible prime movers, reducers and kinematics Power Source Reducer Kinematics
Central hydraulics
AC motor pump
BDCM
PMSM
Fluidic(linear)
Mechanical(linear)
Fluidic(rotary)
Mechanical(rotary)
Kinematics 1
Kinematics 2
Kinematics 3(rotary)
Kinematics 4(rotary)
Reducers and kinematics in the above table should be paired with uniform motion types. For example, rotary mechanical reducers should be used together with kinematics 3 and 4. The number of combinations of above components is huge. So, measures must be taken to scale down the problem. In the following chapters, combinations which were unlikely to be used were picked out. This number of combinations was reduced gradually in several design stages. The reason is that some of the combinations could only be proved as not applicable when analyzed in detail. Mathematic models of above simplified landing gear actuation system were developed. To get better handling property, models were built in universal forms for all combinations of components. Certain simplifications were made given that they are not seriously affecting the results. The following transmission equations and system dynamic equations were derived entirely by the author.
5.2.1 Reducer Equations Two kinds of speed reducers are usually used: fluidic (hydraulic circuit, pump to cylinder) and mechanical (mechanical, gearbox). By output motion, they could be linear or rotary.
Let reducer speed reduction (amplification) ratio = vactR , and reducer force reduction
(amplification) ratio = factR . Equations of these ratios are summarized in the following
table.

25
Table 5-2: Reducer speed and force reduction ratio equations Equations Variables
a) Hydraulic linear transmission
actuatoreffective
pumpv
motor
AD
νηπ
ω=××
×2
actuatoractuatormvmotormotor FT ×=××× νηηω
effective
vpump
motor
actuatorvact A
DvR×××
==π
ηω 2
pump
meffective
motor
actuatorfact D
AT
FRηπ ×××
==2
vactR =reducer speed reduction ratio,
m/radian;
factR =reducer force reduction ratio, N/Nm;
motorω =motor speed, radian/s;
actuatorν =actuator output speed, m/s;
motorT =motor output torque, Nm;
actuatorF =actuator output force, N;
vη =pump volumetric efficiency, 0.96;
mη =pump mechanical efficiency, 0.90;
pumpD =pump displacement, m3/s;
effectiveA =cylinder effective area, m2;
b) Mechanical linear transmission
actuatorgearhmotor v
RP=
×××π
ω2
actuatoractuatormmotormotor FT ×=×× νηω
πω ××
==2
gearh
motor
actuatorvact
RPvR
gearh
m
motor
actuatorfact RPT
FR×××
==ηπ2
vactR =reducer speed reduction ratio,
m/radian;
factR =reducer force reduction ratio, N/Nm;
motorω =motor speed, radian/s;
actuatorν =actuator output speed, m/s;
motorT =motor output torque, Nm;
actuatorF =actuator output force, N;
mη =mechanical efficiency, 0.78;
gearR =gearbox rotary reduction ratio;
hP =gearbox screw pitch;
c) Hydraulic rotary transmission vactR =reducer speed reduction ratio;

26
actuatoractuator
pumpvmotor DD ×
×=××
× πωη
πω
22
actuatoractuatormvmotormotor TT ωηηω ×=×××
actuator
pumpv
motor
actuatorvact D
DR ×== η
ωω
pump
actuatorm
motor
actuatorfact D
DT
TR ×== η
factR =reducer force reduction ratio;
motorω =motor speed, radian/s;
actuatorω =actuator rotary speed, radian/s;
motorT =motor output torque, Nm;
actuatorT =actuator output torque, Nm;
vη =pump volumetric efficiency, 0.96;
mη =pump mechanical efficiency, 0.90;
pumpD =pump displacement, m3/s;
actuatorD =hydraulic motor displacement,
m3/s;
d) Mechanical rotary transmission
actuatorgearmotor R ωω =×
actuatoractuatormmotormotor TT ωηω ×=××
gearmotor
actuatorvact RR ==
ωω
gear
m
motor
actuatorfact RT
TR η==
motorω =motor speed, radian/s;
actuatorω =actuator output speed, radian/s;
motorT =motor output torque, Nm;
actuatorT =actuator output force, Nm;
mη =mechanical efficiency, 0.78;
gearR =gearbox rotary reduction ratio
According to reference [41], hydraulic pump overall efficiency is around 0.88, with volumetric efficiency exceeds 0.96. So its mechanical efficiency is around 0.92. Although the above data was measured at rated working condition and 3000psi pressure, it provides enough accuracy for 5000psi pumps. To account for the pressure loss in pipe work and friction losses, mechanical efficiency was adjusted to 0.9. Then the overall efficiency of hydraulic linear transmission is 0.864. There is no speed loss in mechanical transmission, which is different from hydraulic circuit. According to reference [10], roller screw efficiency can reach to 77.5%. This efficiency estimation was conducted in 1990s, so it reflects the technology level of that period. A roller screw efficiency of 72.8% was suggested by calculation in Appendix G. In terms of gear pair efficiency, reference [44] suggested a value of 94%.

27
So a total efficiency of 68.4% was obtained. These efficiency values represent the technology level for ground products, not for aerospace purpose. An estimated transmission mechanical efficiency of 78% was used in the following analysis to account for technology improvements. The efficiency of rotary transmission was assumed to be the same as their linear counterparts.
5.2.2 Kinematics Equations The speed reduction ratios of kinematics linkages are functions of landing gear swing angle. If linear actuator is used, the linkage converts linear motion of actuator to pivot rotary motion. If rotary actuator is used, then the linkage converts rotary motion to
landing gear pivot rotary motion. Let linkage speed ratio= vlinkR , force ratio= flinkR .
The kinematics speed and force reduction (amplification) ratios are calculated in the following table.
Table 5-3: Kinematics speed and force reduction ratio equations Equations Variables
a) Linear to rotary
pivotactuator Kv ωθ =× )(
pivotpivotmactuatoractuator TvF ωη ×=××
)(θω
Kv
Ractuator
pivotvlink ==
)(1θKF
TR
actuator
pivotflink ==
vlinkR =link speed reduction ratio, radian/m;
flinkR =link force reduction ratio, Nm/N;
actuatorν =actuator output speed, m/s;
pivotω =landing gear swing speed, radian/s;
actuatorF =actuator output force, N;
pivotT =driving torque on pivot, Nm;
)(θK =kinematics speed reduction ratio,
radian/m;
mη =link mechanical efficiency, assumed to be
100%
b) Linear to rotary
pivotactuator K ωθω =× )(
pivotpivotmactuatoractuator TT ωηω ×=××
)(θωω
KRactuator
pivotvlink ==
vlinkR =link speed reduction ratio;
flinkR =link force reduction ratio;
actuatorω =actuator output speed, radian/s;
pivotω =landing gear swing speed, radian/s;
actuatorT =actuator output torque, Nm;

28
)(1θKT
TR
actuator
pivotflink == pivotT =driving torque on pivot, Nm;
)(θK =kinematics speed reduction ratio, no unit;
mη =link mechanical efficiency, assumed to be
100%;
From the above table, linear and rotary actuators have the same speed and force reduction ratios formulas. However, caution has to be taken to their units. For linear actuator, the unit is m/radian; while rotary actuator has no unit.
5.2.3 Transmission Integration Transmission speed and force ratios were obtained by summing the speed reducer and kinematics together.
Let transmission speed reduction ratio = vR , then pivotvmotor R ωω =× , vlinkvactv RRR ×= .
Let transmission reduction ratio = fR , then pivotfmotor TRT =× , flinkfactf RRR ×= .
The factors vR and fR have unique forms for all synergies of actuators and linkages.
They have no units. These two factors are representative for most of the transmission characteristics except for actuator inertia. The following table summarizes the transmission equations:
Table 5-4: Transmission speed and force equations
Motion Component Speed Reduction Ratio Force Reduction Ratio
Hydraulic
reducer ADvR vpump
motor
actuatorvact ××
×==
πη
ω 2
pump
m
motor
actuatorfact D
AT
FR
ηπ ×××==
2
Mechanical
reducer πω ×
×==
2gearscrew
motor
actuatorvact
RPvR gearscrew
m
motor
actuatorfact RPT
FR×××
==ηπ2
Linear
Kinematics
linkage )(θ
ωK
vR
actuator
pivotvlink ==
)(1θKF
TR
actuator
pivotflink ==
Hydraulic
reducer actuator
pumpv
motor
actuatorvact D
DR ×== η
ωω
pump
actuatorm
motor
actuatorfact D
DT
TR ×== η
Mechanical
reducer gear
motor
actuatorvact RR ==
ωω
gear
m
motor
actuatorfact RT
TR η==
Rotary
Kinematics
linkage )(θ
ωω
KRactuator
pivotvlink ==
)(1θKF
TR
actuator
pivotflink ==
Transmission vlinkvactv RRR ×= flinkfactf RRR ×=
5.2.4 Dynamic Equations Dynamic simulation is important in verifying system designs and optimizations. Similarities of different systems were summarized. And uniform dynamic equations

29
were developed to facilitate simulation. In the following table, an equation for motor driven systems was developed. For systems which do not contain motors in models, an actuator force driven system dynamic equation was developed. Supporting equations which contribute to the above equations were also listed. Dynamic equations for systems using rotary actuators were not developed, as further study proved they are not applicable.
Table 5-5: Dynamic equations a) Motor driven systems
{
{{
65
43
21
motorfact
drag
fact
actuatoractuatormotorm
f
pivotg
f
static
TRF
RmJ
RJ
RT
=+
′×+′×+
′×+
44 344 2143421
43421
νωω
Part 1 stands for the torque on motor shaft by static load;
Part 2 stands for the torque on motor shaft by landing gear
inertia;
Part 3 stands for the torque on motor shaft by motor inertia;
Part 4 stands for the torque on motor shaft by actuator inertia;
Part 5 stands for the torque on motor caused by actuator drag
force;
Part 6 stands for the motor electromagnetic torque
vact
actuatormotor R
v=ω ;
vact
actuatormotor R
v ′=′ω ; vactR is assumed to be
constant.
flinkpivot
pivotflinkactuator Rdt
ddRv ×+×=′
ωω 2 ;
fact
drag
f
staticmotor
actuatorvact
m
fact
actuator
f
pivotg
RF
RTT
vRJ
Rm
RJ
−−=
′×++′×
)(ω
;
444 3444 21444444 3444444 21
44444 344444 21
32
2
1
)(
])([
fact
drag
f
staticmotorpivotflink
vact
m
fact
actuator
pivotflinkvact
m
fact
actuator
f
g
RF
RTTdR
RJ
Rm
RRJ
Rm
RJ
−−=××++
′××++
ω
ω
Part 1 stands for the torque on motor shaft cause by inertia;
Part 2 stands for the torque on motor shaft caused by kinematics;
Part 3 stands for dynamic force.
fR =transmission force reduction ratio;
vR =transmission speed reduction ratio;
vactR =reducer speed reduction ratio;
factR =reducer force reduction ratio;
vlinkR =link speed reduction ratio;
flinkR =link force reduction ratio;
staticT = pivot axial static torque load, Nm;
motorT =motor output torque;
pivotω =landing gear swing speed, radian/s;
motorω =motor speed, radian/s;
gJ =landing gear inertia, kg×m2;
mJ =motor inertia, kg×m2;
actuatorm =actuator inertia, kg;
actuatorν =actuator speed, m/s;
dragF =actuator drag force, N;
flinkdR =coefficient(defined below);
1L =landing gear linkage length;
2L =landing gear linkage length;

30
b) Actuator force driven systems
{ 32144 344 2143421321 543
21
actuatordragactuatoractuatorflink
gpivot
flink
static FFmR
JRT
=+′×+×′
+ νω
Part 1 stands for the force on actuator caused by static torque.
Part 2 stands for the force on actuator caused by landing gear
inertia.
Part 3 stands for the force on actuator caused by actuator inertia.
Part 4 stands for the drag force on actuator.
flinkpivot
pivotflinkactuator Rdt
ddRv ×+×=′
ωω 2
444 3444 214444 34444 21
44444 344444 21
32
2
1
)(
dragflink
staticactuatorpivotflinkactuator
pivotflinkactuatorflink
g
FRTFdRm
RmRJ
−−=××+
′××+
ω
ω
Part 1 stands for the force cause by inertia;
Part 2 stands for the force caused by kinematics;
Part 3 stands for dynamic force. c) Supporting Equations
flinks
sflink
flinks
sflink
flinks
sflink
flins
sflinkpivotflinkactuator
Rdt
ddR
kinematicsRdt
dd
dR
kinematicsRdt
dd
dR
Rdt
ddtd
ddR
dtRd
dtdv
×+×=
×+×−=
×+×=
×+××=×
=
ωω
ωωα
ωωα
ωωαα
ω
2
2
2
)1(
)2(
)(
αdR
dR flinkflink ×−= )1( (For kinematics 1)
αdR
dR flinkflink = (For kinematics 2)
It is worth noting thatpivotdt
d ωα−= for kinematics 1, because
when the gear swings up angleα decreases. In order to get a
uniform expression, a variable flinkdR was introduced to count
for this effect:
hLLL ×=×× 321 )sin(α
ααα
dhLd
dLLd )())sin(( 321 ×
=××
α =angle formed by 1L and 2L ;
h =actuation force arm;

31
33
21)()()cos( L
dhdh
dLdLL ×+×=××
ααα
3
321 )cos(L
hLLLh ×′−××=′
α
)cos(2 212
22
12
3 α×××−+= LLLLL
)sin(22 2133 α×××=′×× LLLL
3
213
)sin(L
LLL α××=′
23
321
23
21321
))sin()cos((
))sin(()cos(
LhLLL
LhLLLLLh
dRflink
αα
ααα
×−×××=
×××−×××=′=
Hydraulic actuator back pressure effects were represented by a constant drag force acting on the actuator. Simulation showed that the back pressure has very limited effects. Motor inertia values from existing motors were used in simulation. Dynamic performance was proven to be sensitive towards motor inertia. Actuator inertia is less important according to simulation sensitivity study.
5.3 System Optimization Philosophies
In order to achieve a fair comparison, the design of each system must be optimized according to its own characteristics. In this particular case, the optimization objects had to be generated by the author. The reason was that more-electric actuation system is different from traditional central hydraulics driven systems in nature. Past experiences on optimizing the central hydraulic system driven landing gear actuation system may no longer applicable on more-electric systems. Each node of the system was discussed first. Then optimization targets were extracted through summarizing requirements from each node.
5.3.1 Energy Optimization During landing gear retraction the actuators deliver power to counteract landing gear static load. A reasonable speed is required thus dynamic power is important for lifting the gear in time. The dynamic energy will be dissipated through impact with locks in the end of retraction. Excessive dynamic energy yields big and less reliable landing gear up locks. So, the end phase landing gear swing speed should be as slow as possible to alleviate the impact. Energy consumption was estimated by integrating the static torque load curve:
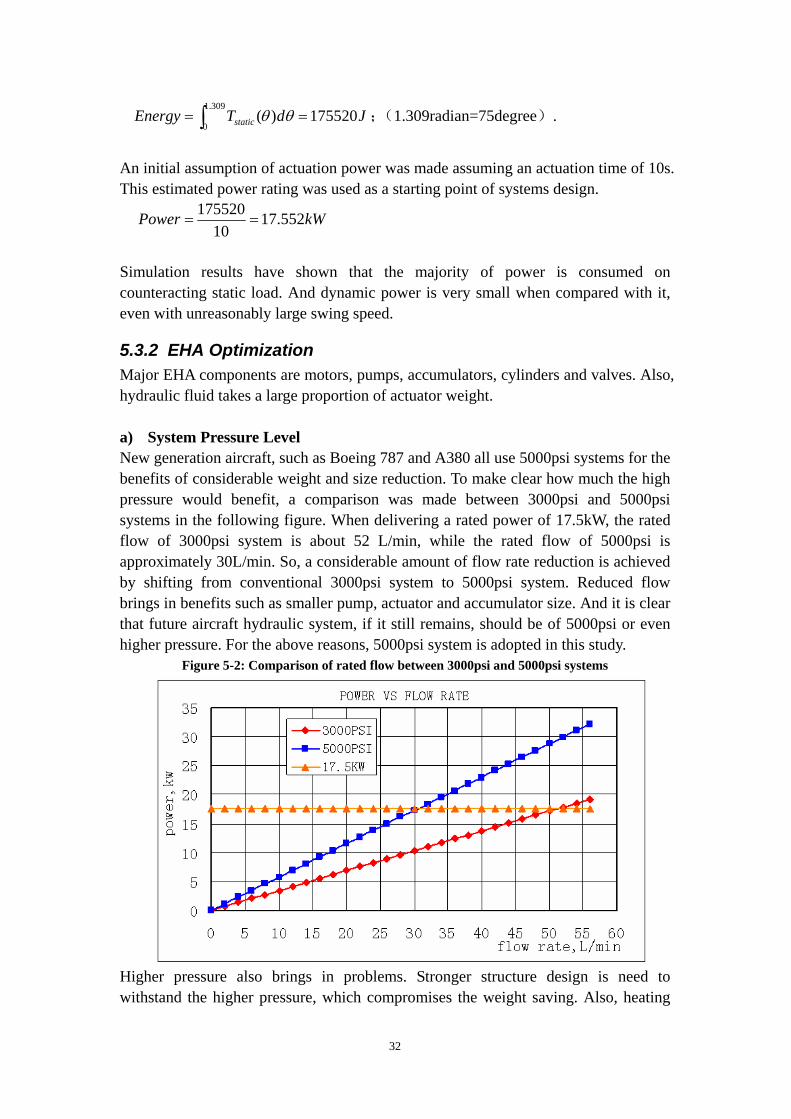
32
JdTEnergy static 175520)(309.1
0== ∫ θθ ;(1.309radian=75degree).
An initial assumption of actuation power was made assuming an actuation time of 10s. This estimated power rating was used as a starting point of systems design.
kWPower 552.1710
175520==
Simulation results have shown that the majority of power is consumed on counteracting static load. And dynamic power is very small when compared with it, even with unreasonably large swing speed.
5.3.2 EHA Optimization Major EHA components are motors, pumps, accumulators, cylinders and valves. Also, hydraulic fluid takes a large proportion of actuator weight. a) System Pressure Level New generation aircraft, such as Boeing 787 and A380 all use 5000psi systems for the benefits of considerable weight and size reduction. To make clear how much the high pressure would benefit, a comparison was made between 3000psi and 5000psi systems in the following figure. When delivering a rated power of 17.5kW, the rated flow of 3000psi system is about 52 L/min, while the rated flow of 5000psi is approximately 30L/min. So, a considerable amount of flow rate reduction is achieved by shifting from conventional 3000psi system to 5000psi system. Reduced flow brings in benefits such as smaller pump, actuator and accumulator size. And it is clear that future aircraft hydraulic system, if it still remains, should be of 5000psi or even higher pressure. For the above reasons, 5000psi system is adopted in this study.
Figure 5-2: Comparison of rated flow between 3000psi and 5000psi systems
Higher pressure also brings in problems. Stronger structure design is need to withstand the higher pressure, which compromises the weight saving. Also, heating
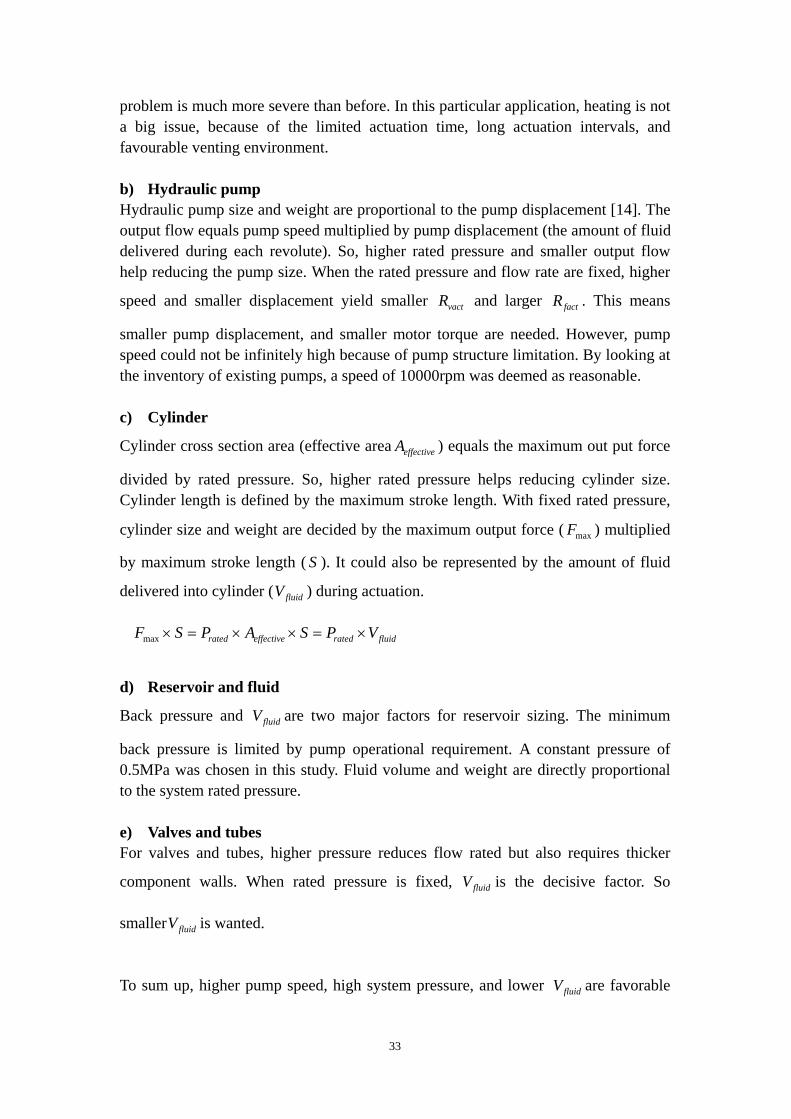
33
problem is much more severe than before. In this particular application, heating is not a big issue, because of the limited actuation time, long actuation intervals, and favourable venting environment. b) Hydraulic pump Hydraulic pump size and weight are proportional to the pump displacement [14]. The output flow equals pump speed multiplied by pump displacement (the amount of fluid delivered during each revolute). So, higher rated pressure and smaller output flow help reducing the pump size. When the rated pressure and flow rate are fixed, higher
speed and smaller displacement yield smaller vactR and larger factR . This means
smaller pump displacement, and smaller motor torque are needed. However, pump speed could not be infinitely high because of pump structure limitation. By looking at the inventory of existing pumps, a speed of 10000rpm was deemed as reasonable. c) Cylinder
Cylinder cross section area (effective area effectiveA ) equals the maximum out put force
divided by rated pressure. So, higher rated pressure helps reducing cylinder size. Cylinder length is defined by the maximum stroke length. With fixed rated pressure,
cylinder size and weight are decided by the maximum output force ( maxF ) multiplied
by maximum stroke length ( S ). It could also be represented by the amount of fluid
delivered into cylinder ( fluidV ) during actuation.
fluidratedeffectiverated VPSAPSF ×=××=×max
d) Reservoir and fluid
Back pressure and fluidV are two major factors for reservoir sizing. The minimum
back pressure is limited by pump operational requirement. A constant pressure of 0.5MPa was chosen in this study. Fluid volume and weight are directly proportional to the system rated pressure. e) Valves and tubes For valves and tubes, higher pressure reduces flow rated but also requires thicker
component walls. When rated pressure is fixed, fluidV is the decisive factor. So
smaller fluidV is wanted.
To sum up, higher pump speed, high system pressure, and lower fluidV are favorable

34
for EHA sizing. This also applies to central hydraulic system and local hydraulic system design, as they follow the same basic rules.
5.3.3 EMA Optimization EMA is composed of motor, speed reduction gear box, and clutch. For linear actuators, the speed reduction gearbox can be further divided into roller screw and gear pairs. a) Roller screw Roller screw weight and volume are defined by the maximum output force [42]. The screw rod length is defined by the maximum stroke. Size and weight of roller screw could also be defined by maximum force multiplied by maximum stroke. b) Gear pairs Larger gear pairs force amplification ratio reduces the required motor torque. However, it induces more complexity, size and weight. So gear pairs design must be balanced with the motor. This is different from that of hydraulic circuits. The size and weight of gear pairs are not linearly related to the force amplification ratio. With fixed force amplification ratio, the gear box size and weight are decided by the maximum load. The EMA design is not as sensitive to the stroke length as that in EHA design, because the screw can be lengthened to accommodate larger stroke. So, the primary target of optimization was to minimize the maximum load. However,
roller screw takes a large proportion of unit weight. So, minimized SF ×max is also
important.
5.4 Motors and Power Electronics
In order to retract the landing gear in time, the motor output power should be enough.
∫∫ ××=××+15
0
15
0)( dtPdtTT ontransmissitmotoroutpupivotdynamicstatic ηω ;
ontransmissi
statictmotoroutpu
dTdtP
η
θ∫∫×
≈×
75
015
0,
ontransmissi
staticmotormotor
dTdtT
η
θω ∫∫
×≈××
75
015
0;
So, f
staticmotor R
TT ≈
From the above equations, transmission could be modified to extract the maximum motor output power from a given motor. For a given transmission, the motor can be modified to provide adequate output power. Because the motors are normally sized by their maximum output power capacities, even output is favorable. In this circumstance, motors could work in their maximum power conditions. For every moment of landing gear retraction, the swing speed is decided by the motor output

35
power at this time. It is favorable to have the motors work on a high speed and low output torque when they are required to deliver a fixed amount of power. However, the motor maximum speed is limited by motor structure and other attached components. For BDCM and PMSM, their maximum speeds are limited by power electronics. Other components such as pumps and gearbox also have limitation speeds. A speed of 9000 rpm is usually used. To make sure landing gear could be raised in all loading conditions, motors should provide enough torque to counteract the maximum possible load. To increase dispatch reliability, one motor should have enough torque ability to raise the gear. Heat dissipation is a decisive factor on motor sizing. However, in this particular study the heat problem is not as severe as that for flight control actuators. The reason is that the actuators work for short time with long intervals. Also, landing gear actuators are exposed to incoming forced cooling air circulation. For short time rated motors, higher temperature rise than that for long time operation is permitted. Motor speed to torque performance is affected by many factors. To scale down the problem, simplification methods were used on producing motor curves. Motor characteristics were analyzed, and motor speed-torque curves were produced through resemblance to reference curves. Power density method has been used in various literatures to size motors. This method is rather crude because it does not consider other factors such as maximum torque and maximum speed. In fact according to motor design theory [40], the size and weight of motor are directly proportional to the maximum output torque. However, power density method represents a reasonable and convenient tool for engineers who are not specialized in motor design. The author invested a lot of time trying to find better ways to size motors analytically. But finally he realized that motor design is too complex a discipline to be learnt in a short time.
5.4.1 ACMP Current ACMP design features an optimized solution between AC motor and variable displacement hydraulic pump. So, ACMP should be evaluated as a whole, rather than separately as motor plus pump. Two cooling methods have been used on existing AC motor pumps: fan cooling, and fluid cooling. For landing gear actuation, fan cooling is enough. AC induction motors performance features constant horsepower characteristics. So, special constant power mechanisms are normally incorporated in hydraulic pumps accordingly. As a result, the corner of conventional variable displacement pump P-Q curve is cut by a near constant horsepower curve. By implementing this measure, the weight and size of AC induction motor are minimized because it could be used more
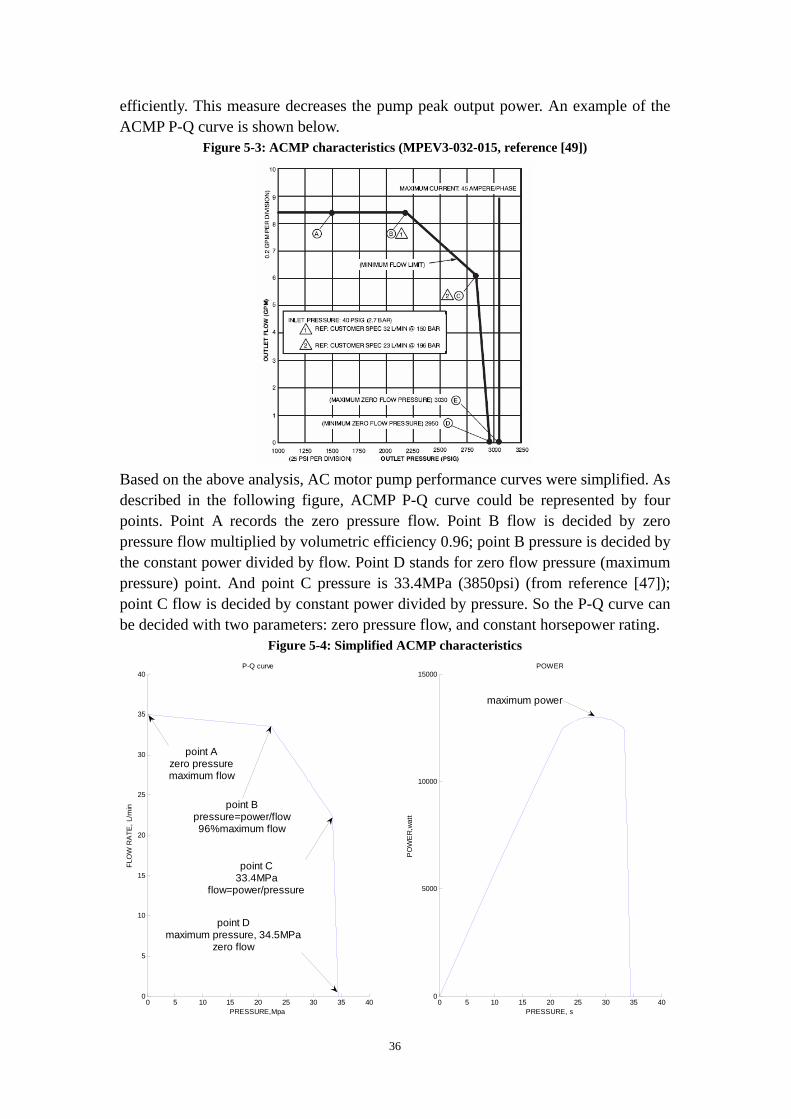
36
efficiently. This measure decreases the pump peak output power. An example of the ACMP P-Q curve is shown below.
Figure 5-3: ACMP characteristics (MPEV3-032-015, reference [49])
Based on the above analysis, AC motor pump performance curves were simplified. As described in the following figure, ACMP P-Q curve could be represented by four points. Point A records the zero pressure flow. Point B flow is decided by zero pressure flow multiplied by volumetric efficiency 0.96; point B pressure is decided by the constant power divided by flow. Point D stands for zero flow pressure (maximum pressure) point. And point C pressure is 33.4MPa (3850psi) (from reference [47]); point C flow is decided by constant power divided by pressure. So the P-Q curve can be decided with two parameters: zero pressure flow, and constant horsepower rating.
Figure 5-4: Simplified ACMP characteristics
0 5 10 15 20 25 30 35 400
5
10
15
20
25
30
35
40
PRESSURE,Mpa
FLO
W R
ATE
, L/m
in
P-Q curve
0 5 10 15 20 25 30 35 400
5000
10000
15000
PRESSURE, s
PO
WE
R,w
att
POWER
point Azero pressuremaximum flow
point C33.4MPa
flow=power/pressure
point Dmaximum pressure, 34.5MPa
zero flow
point Bpressure=power/flow96%maximum flow
maximum power

37
In Appendix F, power density of AC motor pumps was calculated through summarizing existing products. The results suggested that an ACMP unit power density of 0.5kW/kg was reasonable. From reference [49], the maximum efficiency of the whole ACMP unit is 60%.
5.4.2 BDCM Brushless DC motor has trapezoidal or square wave form of current input. In this thesis, square wave form was used for simplicity. So the characteristics of BDCM can be represented by an equivalent brush DC motor. Methods of deciding DC motor characteristics could be used to decide BDCM [39]. When ignoring the iron losses, the characteristics of a typical DC motor can be illustrated by the following formula:
2)( φω
kRT
KV em
e
amotor
×−=
motorω =motor speed, radian/s
aV =terminal voltage, 270 V;
emT =electromagnetic torque, Nm;
R =electrical resistance;
eK =motor constant.
Motor constant eK is directly proportional to the amount of magnets and conductors
used in the motor. With the increase of eK , motor output torque, weight, size and price
all increase, while motor speed reduces. The motor starting current is limited by the capacity of power electronics and electrical system. Current researches on solid electronics have already proved that high performance SSPC and inverters can deal with a current up to 300A [10]. Together with the maximum speed of 9000 rpm chosen previously, the motor characteristics were decided. The following table and figures illustrate the characteristics of the motor:
Table 5-6: BDCM parameters Parameters Value Units
Terminal voltage 270 V
Maximum speed 9000 rpm
Maximum torque 84.9 Nm
Electrical resistance 0.9 Ohm
Limit current 3000 A
Motor constant 0.286
Motor mechanical resistance 1 Nm

38
Figure 5-5: BDCM speed-torque and speed-power curves
0 1000 2000 3000 4000 5000 6000 7000 8000 90000
10
20
30
40
50
60
70
80
90
100MOTOR TORQUE - SPEED
MOTOR SPEED,rpm
TOR
QU
E,N
m
0 1000 2000 3000 4000 5000 6000 7000 8000 90000
0.5
1
1.5
2
2.5x 10⁴ MOTOR POWER - SPEED
MOTOR SPEED,rpm
Pow
er,w
att
It is worth noting that these performance curves represent marginal conditions for the motor. Under the control of power electronics, motor working condition could be any point under the speed-torque curve. To simplify the analysis process, the author assumed that motor always works on this curve. The power density of BDCM is around 2kW/kg. Its efficiency could reach 95% [40].
5.4.3 PMSM Permanent magnetic synchronous motor has unique characteristics. When the motor speed is slower than a certain speed, the maximum motor output torque equalizes to a certain value. When this speed is exceeded, a phenomenon of “flux-weakening” begins to affect and the maximum output torque reduces with speed increases. [38]. The following figure illustrates a typical PMSM speed-torque curve.
Figure 5-6: Example of PMSM motor performance curves (Figure from reference [38])

39
As shown in the above figure, the “flux-weakening” starting speed is approximately 1/3 of maximum speed. And the maximum output torque on maximum speed is 1/2 of that on zero speed. This feature was adopted in this study. As described in the following figure, the curve can be represented with 4 points. Because the maximum speed was fixed to 9000 rpm, the zero speed maximum torque became the only parameter of motor characteristics.
Figure 5-7: Simplified PMSM motor performance curves
0 1000 2000 3000 4000 5000 6000 7000 8000 9000 100000
0.5
1
1.5
2x 10⁴ MOTOR POWER - SPEED
MOTOR SPEED,rpm
Pow
er,w
att
0 1000 2000 3000 4000 5000 6000 7000 8000 9000 100000
5
10
15
20
25
30
35
40MOTOR TORQUE - SPEED
MOTOR SPEED,rpm
TOR
QU
E,N
m
point Azero speed
maximum torque
point B1/3 maximum speed
maixmum torque
point Cmaximum speed
1/2 maximum torque
point Dmaximum speed
zero torque
maximum power
Similar to that of BDCM, the above curves also represents marginal working conditions. The power density of PMSM is almost 1.3 times that of BDCM. From reference [56], a power density of 2.1kW/kg is reasonable. The power density of power electronics according to current technology is around 2kW/kg [56]. This value was used in EHA and EMA power electronics sizing. AC induction motor needs simple electrical components. Its power electronics was sized through the author’s experience. The solid state power electronic technology is developing rapidly in the recent years. Its efficiency varies greatly. To reduce the complexity of this study, the power electronics efficiency was not considered.
5.5 Landing Gear Kinematics Concepts
Kinematics plays an important role in landing gear actuator design. As described by
the equation: flinkfactf RRR ×= , kinematics linkages can shape the loading conditions
on actuators. Current kinematics concepts are designed for central hydraulic system driven actuators, which are apparently different from more-electric actuators. So, kinematics design guidelines using more-electric actuators have to be built.

40
5.5.1 Kinematics Concepts The first three landing gear kinematics concepts were created through summarization of existing concepts. The fourth one was created by the author to see whether other concepts can possibly be used. In Appendix E, each of them was analyzed in detail. Kinematics concepts and their characteristics are summarized in the following table.
Table 5-7: Kinematics concepts Kinematics Concepts Characteristics
Kinematics concept 1
pivot axialactuator
actuator attachment
landing gear cg
landing gear
h
α
L1L2
L3
Lcg
retracti
on
retraction
1. Good load shaping ability
2. Small stroke
3. Good efficiency
4. Actuator tends to be long
5. Ultimate tensile stressing condition
Kinematics concept 2
pivot axial
actuator
landing gear
actuator attachment
landing gear cg
retraction
retraction
α
Lcg
h
L3
L1
L2
1. Moderate load shaping ability
2. Large stroke
3. Moderate efficiency
4. Short actuator
5. Ultimate compression stressing
condition
Kinematics concept 3
actuator
pivot axial
βα
L5
L4
L2
L1
retraction
Lcg
1. Poor load shaping ability
2. Actuators and power wiring (or
hydraulic tubes) are difficult to mount
and maintain
3. Large actuator torque is needed

41
Kinematics concept 4
actuator
Lcg
retraction
pivot axial
1. No load shaping ability
2. Actuators and power wiring (or
hydraulic tubes) are difficult to mount
and maintain
3. Large actuator torque is needed
As analyzed in Appendix E, kinematics concepts 3 and 4 were proven to be not applicable, for their poor load shaping abilities and large actuator torque requirement. In kinematics 1 and 2 optimization, more-electric solutions follow the same rules as central hydraulic systems. Kinematics 1 is better in terms of efficiency and load shaping ability. However, several factors compromise its superiority. Selection of kinematics and their parameters were made according to actuator characteristics. a) Kinematics 1 is more subject to space limitation. b) The stressing condition for kinematics 1 is ultimate tensile strength, which is
considerably less than ultimate compression strength. So, kinematics 1 actuator parts tend to use more material than kinematics 2 parts.
c) Hydraulic cylinder for kinematics 1 has larger diameter than that for kinematics 2,
for the existence of actuator rod.
5.5.2 Kinematics for Hydraulic Solutions For hydraulic solutions, both kinematics 1 and kinematics 2 are applicable. Component sizing in Appendix F have shown that hydraulic cylinders and reservoirs of kinematics 1 have more weight and volume than that for kinematics 2. Both kinematics were evaluated in the following chapters, to see whether other issues have more impacts.
5.5.3 Kinematics for EMA For EMA application, kinematics 1 is better for the following reasons: a) Fault segregation. EMA is still prone to jamming under conditions of current
technology. As a result, jam segregation is of great importance for EMA. When jam happens, the landing gear must have free fall ability. Kinematics 1 has better attributes on fault segregation. The actuator in kinematics 1 is subject to tensile
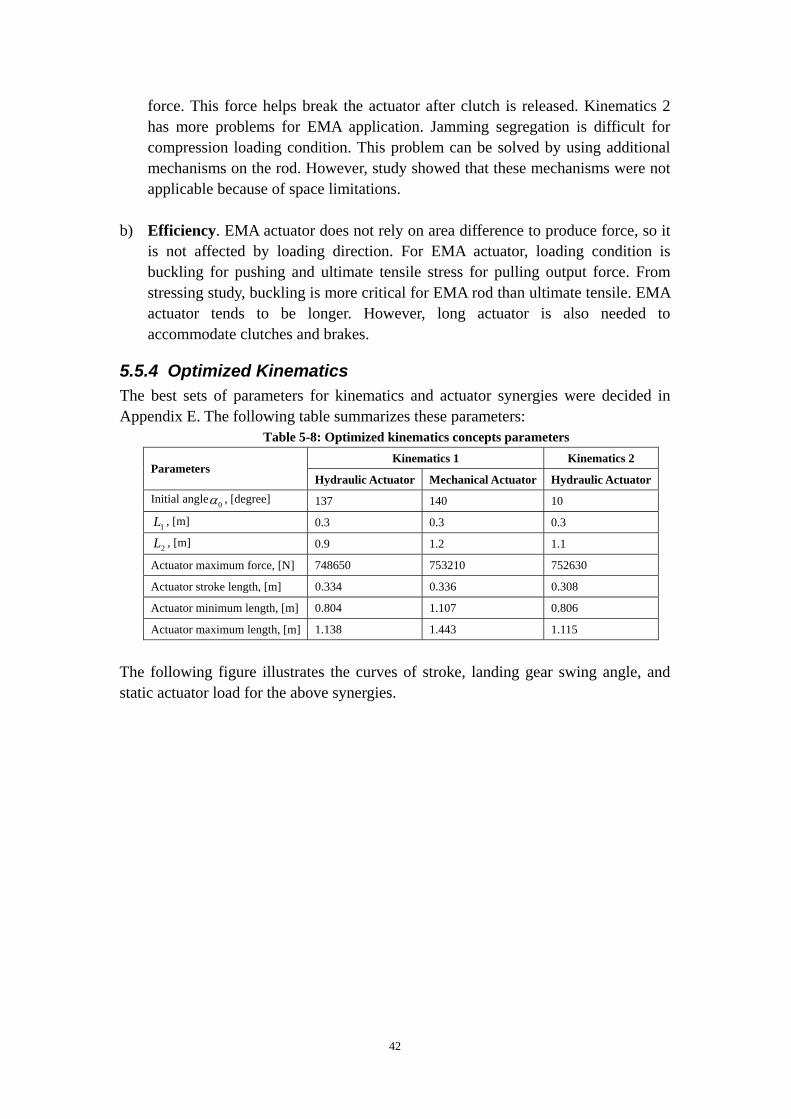
42
force. This force helps break the actuator after clutch is released. Kinematics 2 has more problems for EMA application. Jamming segregation is difficult for compression loading condition. This problem can be solved by using additional mechanisms on the rod. However, study showed that these mechanisms were not applicable because of space limitations.
b) Efficiency. EMA actuator does not rely on area difference to produce force, so it
is not affected by loading direction. For EMA actuator, loading condition is buckling for pushing and ultimate tensile stress for pulling output force. From stressing study, buckling is more critical for EMA rod than ultimate tensile. EMA actuator tends to be longer. However, long actuator is also needed to accommodate clutches and brakes.
5.5.4 Optimized Kinematics The best sets of parameters for kinematics and actuator synergies were decided in Appendix E. The following table summarizes these parameters:
Table 5-8: Optimized kinematics concepts parameters Kinematics 1 Kinematics 2
Parameters Hydraulic Actuator Mechanical Actuator Hydraulic Actuator
Initial angle 0α , [degree] 137 140 10
1L , [m] 0.3 0.3 0.3
2L , [m] 0.9 1.2 1.1
Actuator maximum force, [N] 748650 753210 752630
Actuator stroke length, [m] 0.334 0.336 0.308
Actuator minimum length, [m] 0.804 1.107 0.806
Actuator maximum length, [m] 1.138 1.443 1.115
The following figure illustrates the curves of stroke, landing gear swing angle, and static actuator load for the above synergies.

43
Figure 5-8: Kinematics 1 and 2 actuator static load curves
0 0.1 0.2 0.3 0.40
1
2
3
4
5
6
7
8x 10⁵
STROKE,m
STA
TIC
FO
RC
E,N
STATIC FORCE ON ACTUATOR
0 20 40 60 800
1
2
3
4
5
6
7
8x 10⁵
SWING ANGLE
STA
TIC
FO
RC
E,N
STATIC FORCE ON ACTUATOR
0 20 40 60 800
0.05
0.1
0.15
0.2
0.25
0.3
0.35
SWING ANGLE,deg
STR
OK
E,m
SWING TO STORKE
kinematics 1 hyd
kinematics 1 mech
kinematics 2 hyd
kinematics 1 hyd
kinematics 1 mech
kinematics 2 hyd
kinematics 1 hyd
kinematics 1 mech
kinematics 2 hyd
5.6 Central Hydraulic System Analysis
More-electric landing gear may provide better performance than conventional central hydraulic solution. However, this can only be validated through comparison. To form a comparable conventional baseline design, a central hydraulic solution was designed. This measure also helped design of more-electric solutions. From previous analysis, kinematics and cylinder synergies optimized for more- electric actuator are also optimized results for central hydraulic systems. So these components were used directly for central hydraulic system analysis. Boeing 787 center hydraulic system flow rate data was used in this design. Because of the obvious resemblance between MRT7-T and Boeing 787 on MTOW and landing gear design, their landing gear actuation system would have similar requirements. Another reason for this measure was to make this study as near to real solutions as possible. The central hydraulic system flow rate for 787 is 54 gallon/min, which equals to 204 L/min. The nose landing gear of MRT7-T weights 1300kg. And each main landing gear weights 3767kg. Assume that the three gear units are retracted simultaneously. Then the flow rate sharing may be represented by their weight. The flow for each main landing gear would be: 204×3767/(1300+3767+3767)=87 L/min. Assume a 5 L/min leakage on rated pressure. Then the useful rated flow is 82 L/min for one leg. For the sake of simplicity, the variable displacement pump characteristics were simplified. The resultant equivalent pump P-Q character is a typical two stage curve. The P-Q curve and P-W curves are shown in the figure below.

44
Figure 5-9: Equivalent pump P-Q and P-W curves
0 5 10 15 20 25 30 35 40 450
10
20
30
40
50
60
70
80
90
100
X: 0Y: 82
X: 33.4Y: 76.2
X: 34.5Y: 0
PRESSURE,Mpa
FLO
W R
ATE
, L/m
inP-Q curve
0 5 10 15 20 25 30 35 40 450
0.5
1
1.5
2
2.5
3
3.5
4
4.5
5x 10
4
X: 33.4Y: 4.242e+004
PRESSURE, s
PO
WE
R,w
att
POWER
The actuator speed to force curves for both kinematics are shown in the following figure.
Figure 5-10: Actuator speed-force curves
0 0.01 0.02 0.03 0.04 0.05 0.06 0.070
1
2
3
4
5
6
7
8
9x 10⁵
X: 0.05752Y: 7.526e+005
ACTUATOR SPEED,m/s
AC
TUA
TOR
FO
RC
E,N
ACTUATOR FORCE
kinematics 1 cylinder
kinematics 2 cylinder
Dynamic simulation of landing gear retraction powered by the above central hydraulic system was conducted. The following figure shows the landing gear dynamics parameters namely swing angle, swing speed, and swing acceleration with respect to time.
Figure 5-11: Landing gear swing performance (central hydraulic system)

45
0 1 2 3 4 5 60
10
20
30
40
50
60
70
80
TIME, s
AN
GLE
OF
SW
ING
, deg
ANGLE OF SWING
0 1 2 3 4 5 60
5
10
15
20
25
30
35
TIME, s
SP
EE
D O
F S
WIN
G, d
eg/s
SPEED OF SWING
0 2 4 6-50
0
50
100
150
200
TIME, s
AC
CE
LER
ATI
ON
OF
SW
ING
, rad
/s/s
ACCELERATION OF SWING
kinematics 1
kinematics 2
kinematics 1
kinematics 2
kinematics 1
kinematics 2
The following figure shows actuator parameters during retraction.
Figure 5-12: Actuator performance (central hydraulic system)
0 1 2 3 4 5 60
0.01
0.02
0.03
0.04
0.05
0.06
TIME, s
AC
TUA
TIO
N S
PE
ED
, m/s
ACTUATOR SPEED
0 1 2 3 4 5 60
10
20
30
40
50
60
70
80
90
TIME, s
FLO
W, L
/min
FLOW
0 1 2 3 4 5 60
5
10
15
20
25
30
35
TIME, s
AC
TUA
TIO
N P
RE
SS
UR
E, M
Pa
ACTUATOR PRESSURE
kinematics 1
kinematics 2
kinematics 1
kinematics 2
kinematics 1
kinematics 2
The following figure shows force and torque parameters.

46
Figure 5-13: Force and torque performance (central hydraulic system)
0 1 2 3 4 5 6-4
-2
0
2
4
6
8x 10⁵
TIME, s
AC
TUA
TIO
N F
OR
CE
, N
ACTUATOR FORCE
0 1 2 3 4 5 6-0.5
0
0.5
1
1.5
2
2.5x 10⁵
TIME, s
TOR
QU
E, N
m
TORQUE
load torque-kinematics 1
output torque-kinematics 1
dTORQUE-kinematics 1
load torque-kinematics 2
output torque-kinematics 2
dTORQUE-kinematics 2
load force-kinematics 1
output force-kinematics 1
dFORCE-kinematics 1
load force-kinematics 2
output force-kinematics 2
dFORCE-kinematics 2
The following figure shows the power which flow into the cylinder during retraction. It was calculated through multiplying hydraulic pressure and flow.
Figure 5-14: Cylinder input power performance (central hydraulic system)
0 1 2 3 4 5 60
0.5
1
1.5
2
2.5
3
3.5
4
4.5x 10⁴
TIME, s
PO
WE
R,w
POWER
kinematics 1
kinematics 2

47
As shown in the above figures, kinematics 1 has similar dynamic performance characteristics with kinematics 2. Kinematics 2 is better in smaller components weight and less fluid as suggested by Appendix F. However, actual kinematics selection may be affected primarily by space limitation. From the above figures, the landing gear was retracted within 6 seconds with both kinematics concepts. This swing speed is considerable when taking into consideration of the large landing gear mass. This poses danger to aircraft attitude control. Also, massive energy conversion will happen when the landing gear bumps into locks, causing concerns about locks and structure strength. Addition to that, simulation results showed sharp change in flow and pressure when the pump was in transition phase. On current aircraft, hydraulic line downstream flow restrictors are normally used to limit the swing speed and eliminate shocks. This measure makes the actuator work mostly on the constant pressure section. So it actually provides more power than needed to counteract landing gear load, and causes a lot of power waste.
5.7 Summary
In this chapter, aspects of more-electric landing gear actuation were analyzed systematically. System models were built. System optimization guidelines were established. Kinematics concepts were identified and analyzed. Two favourable kinematics concepts and their parameters were targeted. Then, central hydraulic solutions for both kinematics were designed and analyzed to form a comparison basis. The number of solution synergies has been reduced. The following table shows the existing ones. Central hydraulic system was listed here as a reference system. In the following chapters, these systems were analysed in more detail.
Table 5-9: Solution synergies Synergies Power Source Reducer Kinematics
1 Central hydraulics Engine mechanical power
2 DHS AC distributed hydraulic system Fluidic(linear)
3 PMSM + EHA PMSM
4 BDCM + EHA BDCM
5 PMSM + EMA PMSM
6 BDCM + EMA BDCM
Fluidic(linear)
Mechanical(linear)
Kinematics 1
Kinematics 2

48
6 Distributed Hydraulic System Design
6.1 Introduction
In this part, issues about distributed hydraulic system for landing gear actuation purpose are discussed. Then, DHS systems are designed and optimized. Because of the page limit, only the design process and the simulation results are presented in this report. Both kinematics 1 and kinematics 2 are analyzed in this chapter. Two system are designed, one for kinematics 1 and one for kinematics 2. Finally, these two systems are compared and the one with better performance is chosen.
6.2 DHS System Diagram
As has been noted in previous chapters, a minimized redundancy level of 2 is needed for safety and certification consideration. The low power density and inefficient nature of ACMP prevents allocating a single actuator with two AC induction motors. Also, existing off-the-shelf components should be used as long as they are applicable. So the best system architecture for DHS would be inter-connected actuation system.
Figure 6-1: DHS diagram
(8)
(8)
(7)
(6)
(5)
(4)
(3)(3)
(3)(3)
(2)(2)(1)
gear actuation
power generation

49
Table 6-1: DHS list of components Number Component Name Quantity
1 Reservoir 1
2 AC motor pump 2
3 Check valve 4
4 Filter 1
5 Pressure relieve valve 1
6 Landing gear selector valve 1
7 Selective resistor 1
8 Cylinder 2
In this architecture, cylinders of two landing gear legs share the same power generation and control system. The diagram and component list are shown below. In this diagram, two AC motor pumps (3) deliver high pressure hydraulic power to both main landing gear cylinders. Pressure relieve valve is used to protect system from possible over pressure. Because ACMP can only deliver power in one direction, a three position landing gear selector valve (6) is used to control the actuation direction. Landing gear selective valve is centered by spring force when no action is needed. In this circumstance, all the chambers of cylinders are connected to the reservoir. When a free-fall operation is activated, landing gears are released from locks, and fall down under gravitation. Selective resistor (7) is used to limit the extension swing speed. The above diagram was designed for system with kinematics 2. For system using kinematics 1, the selective resistor must be reversed.
6.3 System Parametric Study
Omitting the subsidiary components, the major composition of DHS are AC motor pumps and cylinders. The system performance is decided by these components. Parameters of landing gear kinematics such as actuator length, stroke length and maximum static force have already been decided in chapter 5. With these parameters, cylinders for both kinematics 1 and kinematics 2 were designed (Refer to Appendix F). ACMP was the next component to design. As analyzed previously, AC motor pump characteristics could be decided by two parameters: maximum flow rate, and power rating of the constant horsepower. The maximum speed of AC motor is directly proportional to electrical power source frequency. So, it is less subject to change. Given a fixed maximum motor speed, larger maximum flow rate requires larger pump displacement and hence more pump weight. Larger constant horsepower requires larger AC motor. So, both of these two parameters should be minimized. Dynamic simulation method has been used to evaluate the effect of these two parameters. Optimized results were obtained when the following three goals were achieved:

50
a) Pump displacement and constant horsepower power rating were minimized. b) Retraction time requirement was fulfilled. c) Dynamic behaviors were reasonable.
Simulation showed that the minimization of the two parameters converged simultaneously. Due to page limitation, the optimization procedure was not presented. System design results are listed in the following table. When one of the two motors fails, the system can still retract the landing gear. The retraction time in that condition is longer than normal.
Table 6-2: DHS system parametric study results Parameter Kinematics 1 Kinematics 2
Rated power, [kW] 14 12.5
Maximum flow, [L/min] 36 35
Normal retraction time, [s] 15 15
One motor inoperative retraction time, [s] 26.5 25.5
The pressure to flow and pressure to power curves with above pump parameters are shown in the following figure.
Figure 6-2: ACMP P-Q curve and P-W curves
0 5 10 15 20 25 30 350
5
10
15
20
25
30
35
40
PRESSURE,Mpa
FLO
W R
ATE
, L/m
in
P-Q curve
0 5 10 15 20 25 30 350
5000
10000
15000
PRESSURE, s
PO
WE
R,w
att
POWER
kinematics 1
kinematics 2
kinematics 1
kinematics 2
As shown in the above figure, kinematics 1 system requires larger maximum flow and larger constant horsepower. Actuator speed-force curves for both actuators are presented in the following figure.

51
Figure 6-3: DHS actuator speed to force curves
0 0.005 0.01 0.015 0.02 0.025 0.030
1
2
3
4
5
6
7
8
9x 10⁵
ACTUATOR SPEED,m/s
AC
TUA
TOR
FO
RC
E,N
ACTUATOR FORCE
kinematics 1
kinematics 2
Because of the same effective cylinder actuation area and hydraulic pressure, the two systems output forces are nearly the same. The small difference was caused by hydraulic back pressure. Maximum actuator output speed of kinematics 1 system is larger, because of the larger zero pressure flow rate.
6.4 Dynamic Performance
Dynamic simulation results of systems with the above parameters are presented below. Conditions with both kinematics are presented. For clarity, one motor fail conditions are not presented in the following pictures. The following figure shows the landing gear swing dynamics.
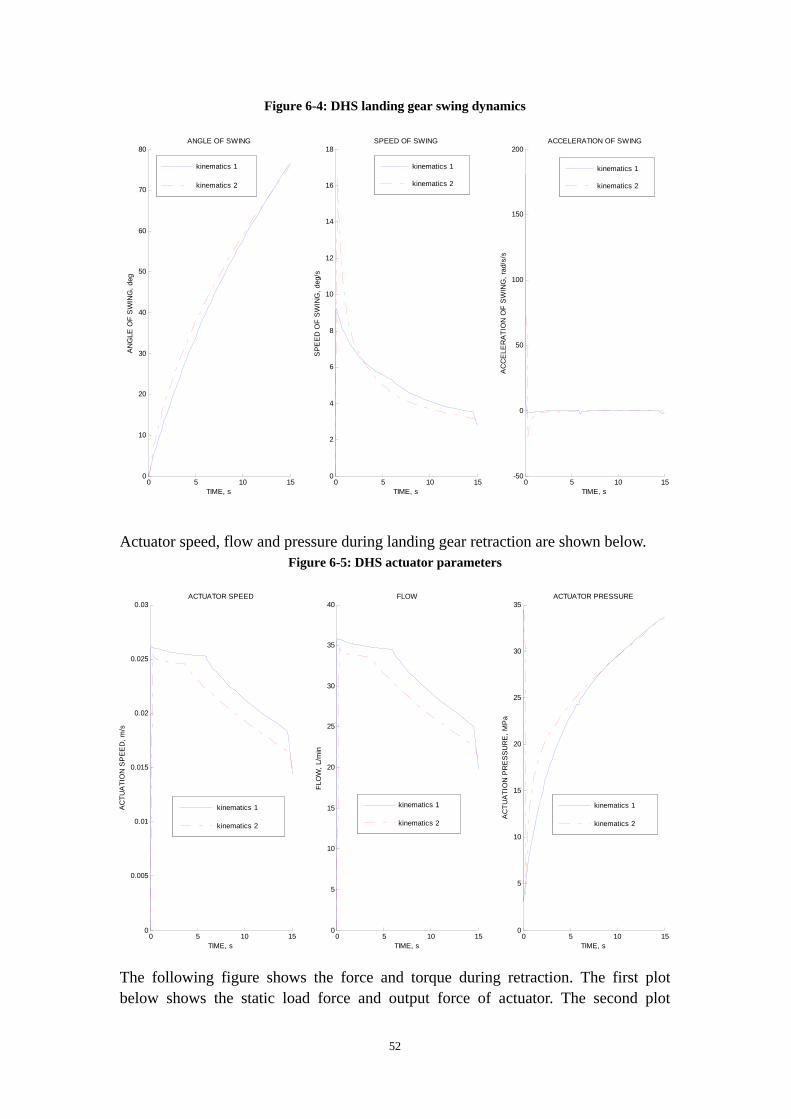
52
Figure 6-4: DHS landing gear swing dynamics
0 5 10 150
10
20
30
40
50
60
70
80
TIME, s
AN
GLE
OF
SW
ING
, deg
ANGLE OF SWING
0 5 10 150
2
4
6
8
10
12
14
16
18
TIME, s
SP
EE
D O
F S
WIN
G, d
eg/s
SPEED OF SWING
0 5 10 15-50
0
50
100
150
200
TIME, sA
CC
ELE
RA
TIO
N O
F S
WIN
G, r
ad/s
/s
ACCELERATION OF SWING
kinematics 1
kinematics 2
kinematics 1
kinematics 2
kinematics 1
kinematics 2
Actuator speed, flow and pressure during landing gear retraction are shown below. Figure 6-5: DHS actuator parameters
0 5 10 150
0.005
0.01
0.015
0.02
0.025
0.03
TIME, s
AC
TUA
TIO
N S
PE
ED
, m/s
ACTUATOR SPEED
0 5 10 150
5
10
15
20
25
30
35
40
TIME, s
FLO
W, L
/min
FLOW
0 5 10 150
5
10
15
20
25
30
35
TIME, s
AC
TUA
TIO
N P
RE
SS
UR
E, M
Pa
ACTUATOR PRESSURE
kinematics 1
kinematics 2
kinematics 1
kinematics 2
kinematics 1
kinematics 2
The following figure shows the force and torque during retraction. The first plot below shows the static load force and output force of actuator. The second plot

53
illustrates the load torque and driving torque acting on pivot. Figure 6-6: DHS force and torque dynamics
0 5 10 15-2
-1
0
1
2
3
4
5
6
7
8x 10⁵
TIME, s
AC
TUA
TIO
N F
OR
CE
, N
ACTUATOR FORCE
0 5 10 15-0.5
0
0.5
1
1.5
2
2.5x 10⁵
TIME, s
TOR
QU
E, N
m
TORQUE
load force-kinematics 1
output force-kinematics 1
dFORCE-kinematics 1
load force-kinematics 2
output force-kinematics 2
dFORCE-kinematics 2
load torque-kinematics 1
output torque-kinematics 1
dTORQUE-kinematics 1
load torque-kinematics 2
output torque-kinematics 2
dTORQUE-kinematics 2
Information included in the above figures is summarized in the following table.
Table 6-3: DHS dynamic performance summary Parameters Kinematics 1 Kinematics 2
Maximum swing speed, [degree/s] 9.2 16.6
Minimum swing speed, [degree/s] 2.8 3.2
Maximum acceleration, [degree/s2] 100 72
Minimum acceleration, [degree/s2] -1.9 -20
Maximum actuator speed, [m/s] 0.026 0.0254
Average actuator speed, [m/s] 0.021 0.021
Maximum flow, [L/min] 35.8 34
Average flow, [L/min] 28.7 28
Maximum pressure, [MPa] 34.5 34.5
Minimum pressure, [MPa] 3.14 3.8
Average pressure, [MPa] 22.2 25
Maximum force discrepancy, [N] 7.1e5 6.5e5
Minimum force discrepancy, [N] -7424 -143000
Maximum torque discrepancy, [Nm] 116000 46000
Minimum torque discrepancy, [Nm] -1211 -12930
Simulation results have shown that with the same kinematics, AC motor driven distributed system has smoother dynamic performance than central hydraulic system. Results have shown that although no particular control method was used, the two distributed hydraulic systems have shown a “power on need” feature. That means the
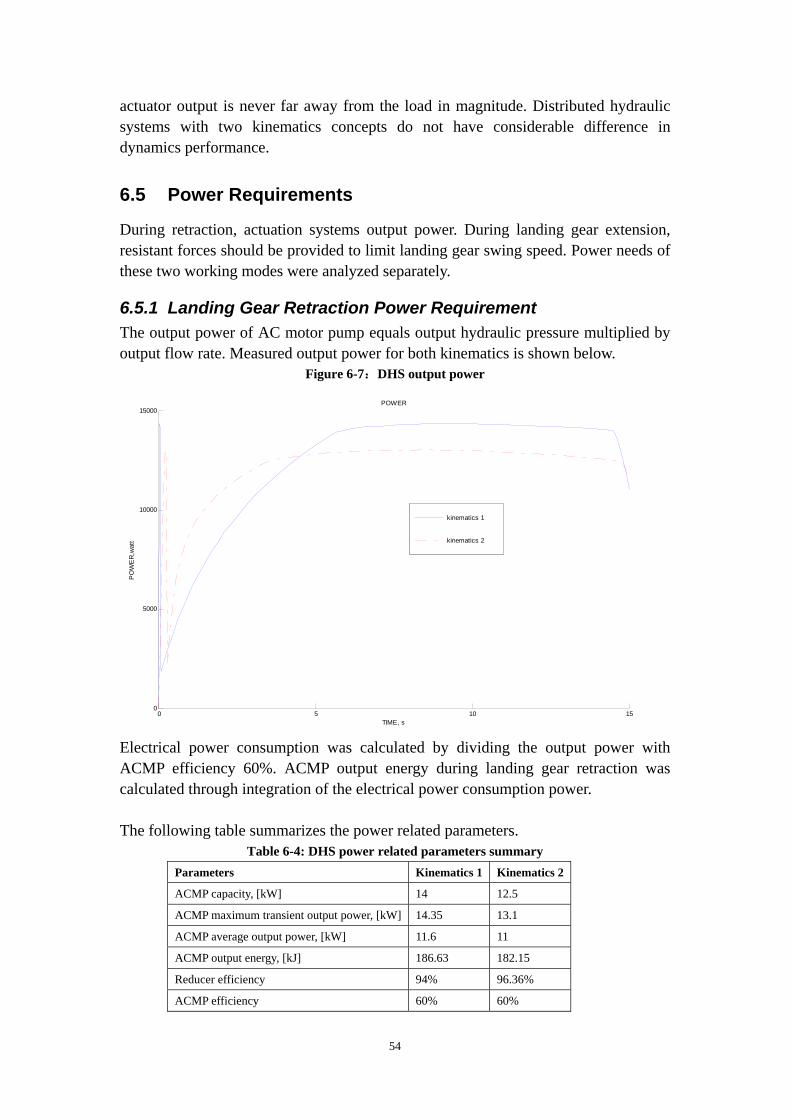
54
actuator output is never far away from the load in magnitude. Distributed hydraulic systems with two kinematics concepts do not have considerable difference in dynamics performance.
6.5 Power Requirements
During retraction, actuation systems output power. During landing gear extension, resistant forces should be provided to limit landing gear swing speed. Power needs of these two working modes were analyzed separately.
6.5.1 Landing Gear Retraction Power Requirement The output power of AC motor pump equals output hydraulic pressure multiplied by output flow rate. Measured output power for both kinematics is shown below.
Figure 6-7:DHS output power
0 5 10 150
5000
10000
15000
TIME, s
PO
WE
R,w
att
POWER
kinematics 1
kinematics 2
Electrical power consumption was calculated by dividing the output power with ACMP efficiency 60%. ACMP output energy during landing gear retraction was calculated through integration of the electrical power consumption power. The following table summarizes the power related parameters.
Table 6-4: DHS power related parameters summary Parameters Kinematics 1 Kinematics 2
ACMP capacity, [kW] 14 12.5
ACMP maximum transient output power, [kW] 14.35 13.1
ACMP average output power, [kW] 11.6 11
ACMP output energy, [kJ] 186.63 182.15
Reducer efficiency 94% 96.36%
ACMP efficiency 60% 60%
55
Electrical energy consumption, [kJ] 311.05 303.583
System efficiency 56.43% 57.82%
The capacity of ACMP equals the power rating of constant horsepower. The reducer efficiency losses here represent the energy stored in landing gear dynamic inertia. They were calculated through division of energy counteracting static force and pump output energy. Cylinder efficiencies were simplified to be 100%. Efficiencies of the whole actuation systems were calculated by counting in the pump efficiency. The results showed that the majority of energy was used to counteract static torque. ACMP features very low efficiency, so the total system efficiencies are very low. The electrical power consumption is considerable. Kinematics 1 and kinematics 2 have minor difference on power consumption.
6.5.2 Landing Gear Extension Power Requirement Using downstream hydraulic restrictor is a good way of providing landing gear extension speed limitation. In this way, the potential energy is damped in hydraulic fluid. From reference [53], a specific fluid named “Exxon HyJet V” which meets the requirement of AS1241 was found. Its specific heat capacity at 40℃ is 0.42cal/g/℃, which equals 1757.3 J/kg/℃. To be conservative, the power calculated for retraction was used. In actual operation, the g load should be lower when deploying landing gear, so the potential power is lower. Assume 10kg of fluid serves as heat sink. The
temperature rise equals: C99.910kgC//3.1757
175520°=
×°kgJJ .
This temperature rise is negligible. So for distributed hydraulic system, landing gear extension speed control is not a problem.
6.6 Components and Weight
Based on the above parametric design results, major components were sized. AC motor pumps were sized by their capacity, and the power density calculated in reference F. The weight of ACMP is:
Kinematics 1 ACMP weight: kgkgkw
kw 28/5.0
14=
Kinematics 1 ACMP weight: kgkgkw
kw 25/5.0
5.12=
Cylinders, reservoirs and fluid volume for both kinematics were sized in Appendix F. Weight of valves, tubing and power electronics was decided based on the author’s past experience. The power electronics for ACMP driving contain contactors and possibly inverters. Health management system could also be integrated in it. The

56
system has been integrated on board for space check. The following pictures show the cylinder installation conditions. No problem was found on mounting other components.
Table 6-8: DHS cylinder installation-landing gear lowered
Table 6-9: DHS cylinder installation-landing gear retracted
The following table summarizes component sizing information. All the weight was measured with respect to one main landing gear, namely one actuator. The weight of shared components such as reservoirs was divided into each actuator.
Table 6-5: DHS Component parameters Parameters Kinematics 1 Kinematics 2
ACMP zero pressure flow, [L/min] 36 35
ACMP constant horse power, [kW] 14 12.5
ACMP unit weight, [kg] 28 25
Cylinder minimum length, [m] 0.804 0.806
Cylinder stroke length, [m] 0.334 0.308
Cylinder weight, [kg] 67.181 53.193
Reservoir volume, [L] 4.62×0.5 4.14×0.5
Reservoir dry weight, [kg] 2.371×0.5 2.204×0.5
System total fluid volume, [L] 26.52×0.5 21.75×0.5

57
System total fluid weight, [kg] 27.84×0.5 22.838×0.5
Valves weight, [kg] 5×0.5 5×0.5
Tubing weight, [kg] 3×0.5 3×0.5
Power electronics weight, [kg] 5×0.5 5×0.5
Total weight, [kg] 116.788 97.214
The total weight of kinematics 1 system is around 20 kg more than kinematics 2 system. It is because kinematics 1 system has larger cylinder and reservoir. Also, it uses more fluid.
6.7 Safety, Reliability and Maintainability
Landing gear extension safety is critical. The following fault tree analysis has landing gear extension failure as the top event. The analysis was only qualitative, because of the difficulties on finding reasonable failure probability data. Both main landing gears should be lowered and locked before aircraft touch down. There is no big difference between consequences of one gear up landing and two gears up landing. So the two landing gear actuators function in series in failure probability assessment.
Figure 6-10: DHS landing gear extension fault tree analysis
Main landing gear extension failure
Normal extension failure
Emergency extension fail
Cylinder jamming
Left or right
Hydraulic power generation system
failure
Locks failureLeft or rightCylinder
jammingLeft or right
ACMP A failure ACMP B failure
Motor failure Pump failureElectrical power source failure Motor failure Pump failureElectrical power
source failure
Fluid conveyance and control failure
Cylinder jamming is very improbable from operating experience. So, landing gear emergency safety level is high. No major safety problem was found in fault tree analysis. The safety level of DHS was considered to be high.
58
AC motor driven distributed hydraulic system features a conservative solution. These systems are widely used on general aviation aircraft as main hydraulic power source. On these aircraft, landing gear could be the only client system of hydraulics. Hand pumps are some times used to provide emergency power for landing gear deployment, which is prohibitive on large transporters as MRT7-T. Problems of using DHS as the sole landing gear actuation power source on large aircraft and on light aircraft may vary in magnitude. However, the system architectures are nearly the same. Distributed hydraulic system makes full use of existing parts and operational procedures. So airworthiness should not be a problem for it. Distributed hydraulic system also inherits the maintenance intensive attributes of traditional hydraulic systems. It still extensively uses hydraulic tubing. So its maintenance requirement is high. Dispatch reliability calculation of DHS was conducted in collaboration with a colleague student. The calculation results fulfilled allocated reliability requirements.
6.8 Summary
In this chapter, distributed hydraulic system was designed and optimized. System diagram was built. Then parameters of systems using both kinematics 1 and kinematics 2 were decided through parametric analysis. With these parameters, simulations were run to discover dynamic performance and power requirements. Systems with both kinematics have similar performance in terms of dynamic behaviors and power consumption. System using kinematics 2 is better than the system using kinematics 1 in weight and volume. As a result, system using kinematics 2 was selected. The optimized DHS system retracts the landing gear in 15s in normal conditions, and 25.5s in one motor fail condition. System components were sized. Actuator was mounted on the landing gear for space check. No installation problem was found. The heat and power dissipation problems were proven to be not critical for distributed hydraulic system. Power consumption is large for this kind of system, mainly because of the low efficiency of AC motor pump. Landing gear extension safety analysis was conducted through fault tree analysis. Dispatch reliability calculation results suggested that the design could fulfill the requirements. Through discussion, maintenance requirement of DHS was considered to be high.

59
7 EHA System Design
7.1 Introduction
In this chapter, EHA systems are designed and optimized. Two system diagrams are proposed, one with isolated actuators, and the other with inter-connected actuators. EHA solutions have two motor and two possible kinematics concepts candidates. Together with using isolated actuator or interconnected actuators, there are eight possible system synergies. Because of the time and page limit, there is no way to discuss these possibilities equally in detail. Firstly, the best combination of motor and kinematics for isolated actuator is chosen through simulation results comparison. Then systems for the two diagrams are developed based on this combination.
7.2 EHA System Diagrams
Two EHA system diagrams were designed based on the redundancy level requirement.
7.2.1 EHA Diagram 1-Isolated EHA System diagram 1 features two isolated actuators. In this diagram, the two actuators work separately, each drives one main landing gear leg. Each actuator contains two motor driven fixed displacement hydraulic pumps. Totally there are two actuators and four pumps on each aircraft. The diagrams and lists of components are shown below.
Figure 7-1: EHA diagram 1-Isolated EHA
(8)
(7)
(6)
(5)
(4)
(4)(3)
(3)
(2)(1)(2)
(1)
power generation
gear actuation
MM
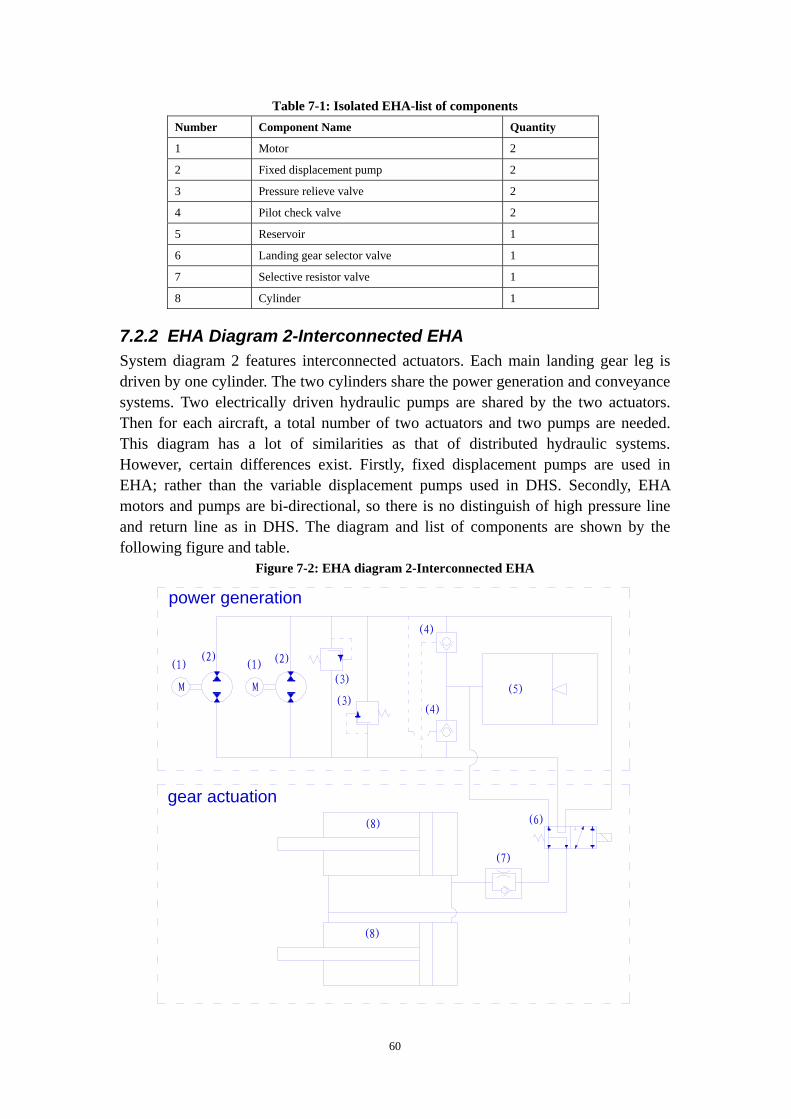
60
Table 7-1: Isolated EHA-list of components Number Component Name Quantity
1 Motor 2
2 Fixed displacement pump 2
3 Pressure relieve valve 2
4 Pilot check valve 2
5 Reservoir 1
6 Landing gear selector valve 1
7 Selective resistor valve 1
8 Cylinder 1
7.2.2 EHA Diagram 2-Interconnected EHA System diagram 2 features interconnected actuators. Each main landing gear leg is driven by one cylinder. The two cylinders share the power generation and conveyance systems. Two electrically driven hydraulic pumps are shared by the two actuators. Then for each aircraft, a total number of two actuators and two pumps are needed. This diagram has a lot of similarities as that of distributed hydraulic systems. However, certain differences exist. Firstly, fixed displacement pumps are used in EHA; rather than the variable displacement pumps used in DHS. Secondly, EHA motors and pumps are bi-directional, so there is no distinguish of high pressure line and return line as in DHS. The diagram and list of components are shown by the following figure and table.
Figure 7-2: EHA diagram 2-Interconnected EHA
(8)
(8)
(7)
(5)
(4)
(4)
(3)
(3)
(2)(2)(1)(1)
(6)
power generation
gear actuation
M M

61
Table 7-2: Interconnected EHA-list of components Number Component Name Quantity
1 Motor 2
2 Fixed displacement pump 2
3 Pressure relieve valve 2
4 Pilot check valve 2
5 Reservoir 1
6 Landing gear selector valve 1
7 Selective resistor valve 1
8 Cylinder 2
Permanent magnetic motors (1) are used to drive fixed displacement hydraulic pumps (2). Pressure relieve valves (3) are used to protect systems. Check valves serve to isolate the reservoir from high pressure line, and connect the reservoir to pump suction line. Because motors and pumps work in both directions, a two position landing gear selector valve (6) is used to engage and isolate the cylinders with pumps. Landing gear actuation direction is controlled through motor control. Selective resistor valve is used to provide landing gear extension speed limitation. The above diagrams were designed for systems with landing kinematics 2. For systems using kinematics 1 system, the selective resistor should be reversed. The only difference between diagram 1 and diagram 2 is the number of cylinders in systems.
7.3 Motor and Kinematics Selection
For BDCM driven EHA, the only parameter subject to change was pump displacement. According to BDCM speed to power curve, smaller speed produces larger torque and higher power output. To retract the landing gear in time, pump displacement should be sufficiently large. On the other hand, large pump displacement yields large pump unit size and weight. In the following approaches, the pump displacement was manipulated to be just enough for retraction time requirement. For EHA with PMSM motors, the maximum motor output torque and the pump displacement were subject to change. These two parameters are related. The maximum motor output torque is decided by the pump displacement and rated pressure. These parameters were decided by dynamic simulation. In order to achieve better usage, minimized pump displacement and motor torque were selected. Small adjustments were made to achieve better dynamic performances. Combinations of two motor types and two kinematics concepts were explored. Each of them was optimized. The following table summarizes the input parameters and

62
their dynamic performance outcomes. Table 7-3: EHA synergies performance comparison
BDCM PMSM
Parameters Kinematics 1 Kinematics 2 Kinematics 1 Kinematics 2
Displacement, [mL/rev] 3.7 4.6 3.3 4
Maximum torque, [Nm] 33 33
Maximum swing speed, [degree/s] 11.5 10 8.7 7.89
Minimum swing speed, [degree/s] 3.25 3.82 3.5 3.7
Maximum acceleration, [degree/s2] 40.3 34.4 13.2 11.2
Minimum acceleration, [degree/s2] -2.9 -2.14 -1 -0.7
Maximum actuator speed, [m/s] 0.0166 0.024 0.017 0.025
Average actuator speed, [m/s] 0.016 0.022 0.016 0.022
Maximum flow, [L/min] 24.5 32.3 25.3 34.4
Average flow, [L/min] 22.8 29 23 28
Maximum pressure, [MPa] 34 33.7 33.3 33.9
Minimum pressure, [MPa] 20.4 12 18.2 10.4
Average pressure, [MPa] 32 25 31 25
Maximum force discrepancy, [N] 6.43e5 3.1e5 2.1e5 1e5
Minimum force discrepancy, [N] -22000 -9720 -5715 2332
Maximum torque discrepancy, [Nm] 26000 0.22e5 8459 7172
Minimum torque discrepancy, [Nm] -1850 -1370 -630 -432
Maximum motor speed, [rpm] 6900 7300 8000 8900
Average motor speed, [rpm] 6600 6600 7500 7500
Maximum torque, [Nm] 80 80 33 33
Average torque, [Nm] 22 23 21 21
Maximum power, [kW] 19.8 19.7 16.1 16
Average power, [kW] 15 15 15.3 15.5
Based on the above analysis, the following conclusions were made:
1. Kinematics 2 is better than kinematics 1. The two kinematics concepts have similar requirements towards motors and pumps. In terms of dynamic performance, the force and torque discrepancy of kinematics 2 are smaller with both motors. Landing gear with kinematics 2 system works smoother than kinematics 1 system. The weight and volume of kinematics 1 cylinder, reservoir and fluid are much larger.
2. PMSM is better than BDCM. Systems with PMSM work much smoother with
both kinematics. The synergy of kinematics 2 and PMSM was used in the following discussion.
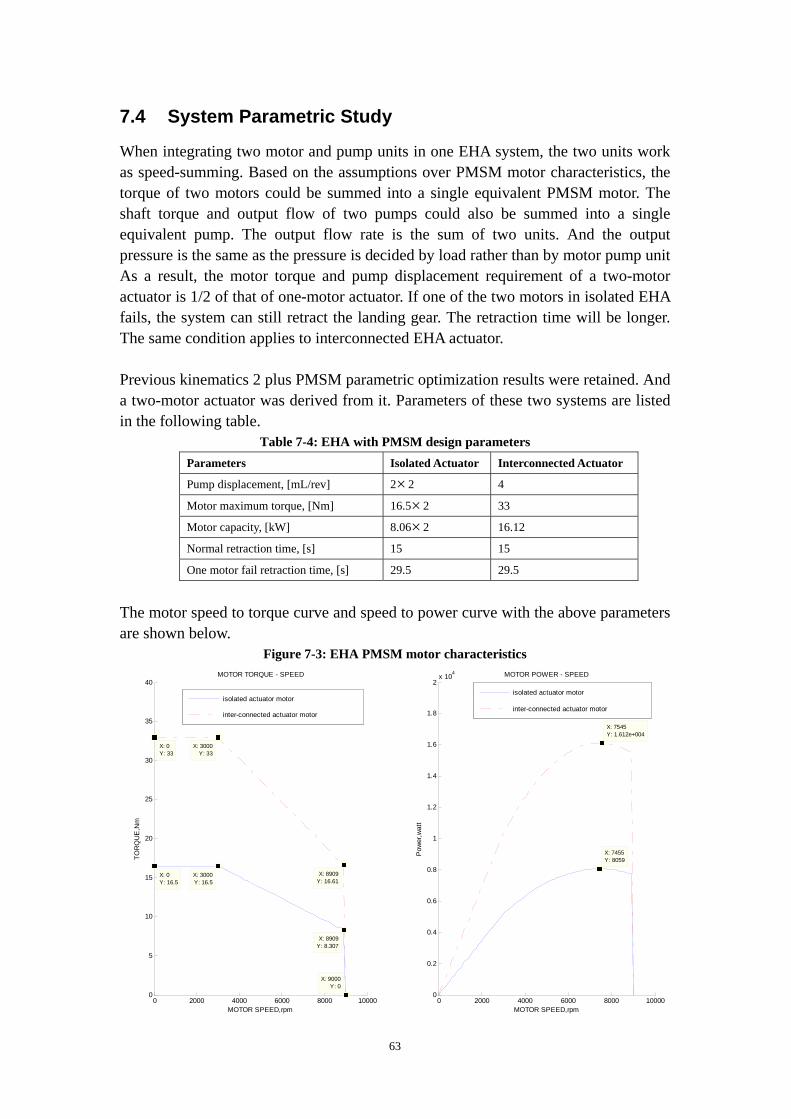
63
7.4 System Parametric Study
When integrating two motor and pump units in one EHA system, the two units work as speed-summing. Based on the assumptions over PMSM motor characteristics, the torque of two motors could be summed into a single equivalent PMSM motor. The shaft torque and output flow of two pumps could also be summed into a single equivalent pump. The output flow rate is the sum of two units. And the output pressure is the same as the pressure is decided by load rather than by motor pump unit As a result, the motor torque and pump displacement requirement of a two-motor actuator is 1/2 of that of one-motor actuator. If one of the two motors in isolated EHA fails, the system can still retract the landing gear. The retraction time will be longer. The same condition applies to interconnected EHA actuator. Previous kinematics 2 plus PMSM parametric optimization results were retained. And a two-motor actuator was derived from it. Parameters of these two systems are listed in the following table.
Table 7-4: EHA with PMSM design parameters Parameters Isolated Actuator Interconnected Actuator
Pump displacement, [mL/rev] 2×2 4
Motor maximum torque, [Nm] 16.5×2 33
Motor capacity, [kW] 8.06×2 16.12
Normal retraction time, [s] 15 15
One motor fail retraction time, [s] 29.5 29.5
The motor speed to torque curve and speed to power curve with the above parameters are shown below.
Figure 7-3: EHA PMSM motor characteristics
0 2000 4000 6000 8000 100000
5
10
15
20
25
30
35
40
X: 0Y: 33
X: 3000Y: 33
X: 0Y: 16.5
X: 3000Y: 16.5
X: 8909Y: 16.61
X: 8909Y: 8.307
X: 9000Y: 0
MOTOR TORQUE - SPEED
MOTOR SPEED,rpm
TOR
QU
E,N
m
0 2000 4000 6000 8000 100000
0.2
0.4
0.6
0.8
1
1.2
1.4
1.6
1.8
2x 10⁴
X: 7455Y: 8059
MOTOR POWER - SPEED
MOTOR SPEED,rpm
Pow
er,w
att
X: 7545Y: 1.612e+004
isolated actuator motor
inter-connected actuator motorisolated actuator motor
inter-connected actuator motor

64
7.5 Dynamic Performance
Dynamic performances of the two systems are shown in the following figures. Because of the speed-summing attribute, the two systems have a lot of similarities in dynamic performance. When all motors are working normally, isolated actuator and inter-connected actuator have the same hydraulic outputs. So, the two systems have the same dynamic behavior. When one motor failure happens in either isolated actuator or inter-connected actuator, the output is reduced by half. So, they also have the same dynamic performance. As a result, performance curves were presented in terms of normal operation and emergency operation (one motor fail operation) in the following figures, rather than by systems. Figure 7-4 illustrates the dynamic performance of landing gear. Landing gear swing angle, speed, and acceleration rates are plotted.
Figure 7-4: EHA landing gear swing dynamics
0 5 10 15 20 25 300
10
20
30
40
50
60
70
80
TIME, s
AN
GLE
OF
SW
ING
, deg
ANGLE OF SWING
0 5 10 15 20 25 300
1
2
3
4
5
6
7
8
TIME, s
SP
EE
D O
F S
WIN
G, d
eg/s
SPEED OF SWING
0 5 10 15 20 25 30-2
0
2
4
6
8
10
12
TIME, s
AC
CE
LER
ATI
ON
OF
SW
ING
, rad
/s/s
ACCELERATION OF SWING
normal
one motor
normal
one motor
normal
one motor
Figure 7-5 illustrates the actuator parameters such as actuator speed, flow and pressure.

65
Figure 7-5: EHA actuator dynamics
0 5 10 15 20 25 300
0.005
0.01
0.015
0.02
0.025
0.03
TIME, s
AC
TUA
TIO
N S
PE
ED
, m/s
ACTUATOR SPEED
0 5 10 15 20 25 300
5
10
15
20
25
30
35
TIME, s
FLO
W, L
/min
FLOW
0 5 10 15 20 25 305
10
15
20
25
30
35
TIME, s
AC
TUA
TIO
N P
RE
SS
UR
E, M
Pa
ACTUATOR PRESSURE
normal
one motor
normal
one motor
normal
one motor
Figure 7-6 plots actuator load force and output force, and also load torque and driving torque.
Figure 7-6: EHA force and torque dynamics
0 5 10 15 20 25 30-1
0
1
2
3
4
5
6
7
8x 10
5
TIME, s
AC
TUA
TIO
N F
OR
CE
, N
ACTUATOR FORCE
0 5 10 15 20 25 30-0.5
0
0.5
1
1.5
2
2.5x 10
5
TIME, s
TOR
QU
E, N
m
TORQUE
load torque-normal
output torque-normal
dTORQUE-normal
load torque-one motor
output torque-one motor
dTORQUE-one motor
load force-normal
output force-normal
dFORCE-normal
load force-one motor
output force-one motor
dFORCE-one motor
The following table summarizes the dynamic performance.
Table 7-5: EHA dynamic performance Parameter Normal Operation One Motor Inoperative
Maximum swing speed, [degree/s] 7.89 3.98
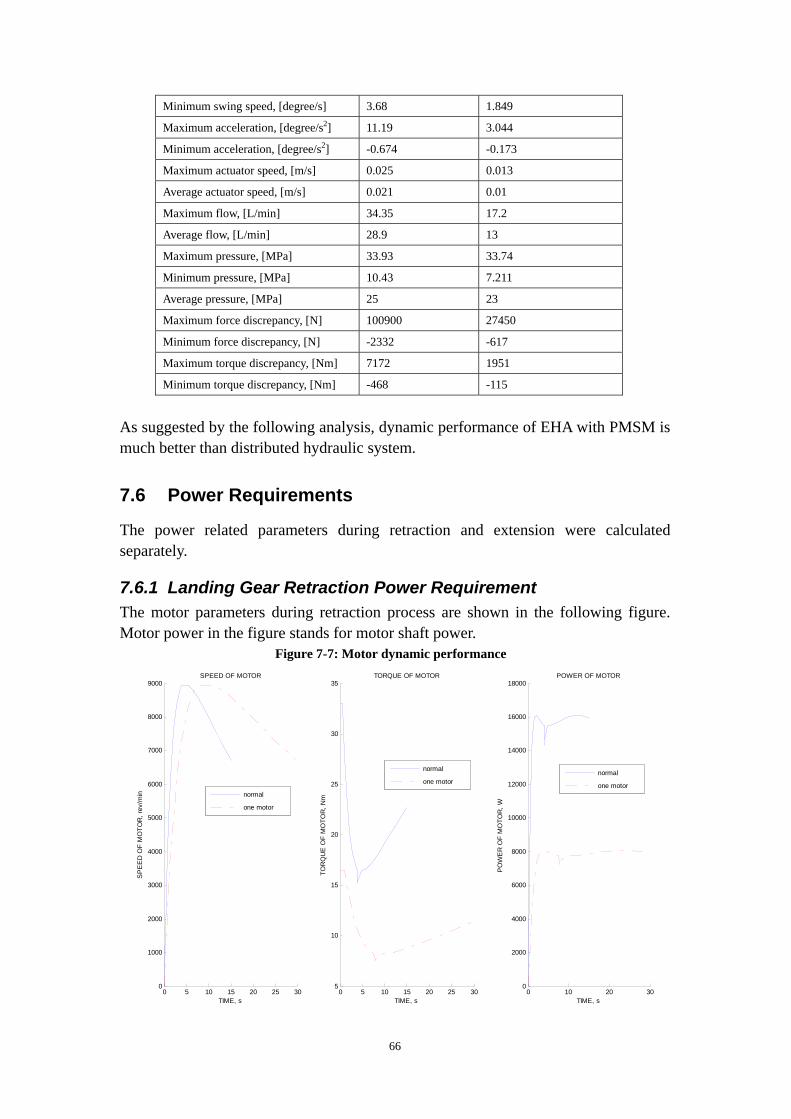
66
Minimum swing speed, [degree/s] 3.68 1.849
Maximum acceleration, [degree/s2] 11.19 3.044
Minimum acceleration, [degree/s2] -0.674 -0.173
Maximum actuator speed, [m/s] 0.025 0.013
Average actuator speed, [m/s] 0.021 0.01
Maximum flow, [L/min] 34.35 17.2
Average flow, [L/min] 28.9 13
Maximum pressure, [MPa] 33.93 33.74
Minimum pressure, [MPa] 10.43 7.211
Average pressure, [MPa] 25 23
Maximum force discrepancy, [N] 100900 27450
Minimum force discrepancy, [N] -2332 -617
Maximum torque discrepancy, [Nm] 7172 1951
Minimum torque discrepancy, [Nm] -468 -115
As suggested by the following analysis, dynamic performance of EHA with PMSM is much better than distributed hydraulic system.
7.6 Power Requirements
The power related parameters during retraction and extension were calculated separately.
7.6.1 Landing Gear Retraction Power Requirement The motor parameters during retraction process are shown in the following figure. Motor power in the figure stands for motor shaft power.
Figure 7-7: Motor dynamic performance
0 5 10 15 20 25 300
1000
2000
3000
4000
5000
6000
7000
8000
9000
TIME, s
SP
EE
D O
F M
OTO
R, r
ev/m
in
SPEED OF MOTOR
0 5 10 15 20 25 305
10
15
20
25
30
35
TIME, s
TOR
QU
E O
F M
OTO
R, N
m
TORQUE OF MOTOR
0 10 20 300
2000
4000
6000
8000
10000
12000
14000
16000
18000
TIME, s
PO
WE
R O
F M
OTO
R, W
POWER OF MOTOR
normal
one motor
normal
one motor
normal
one motor
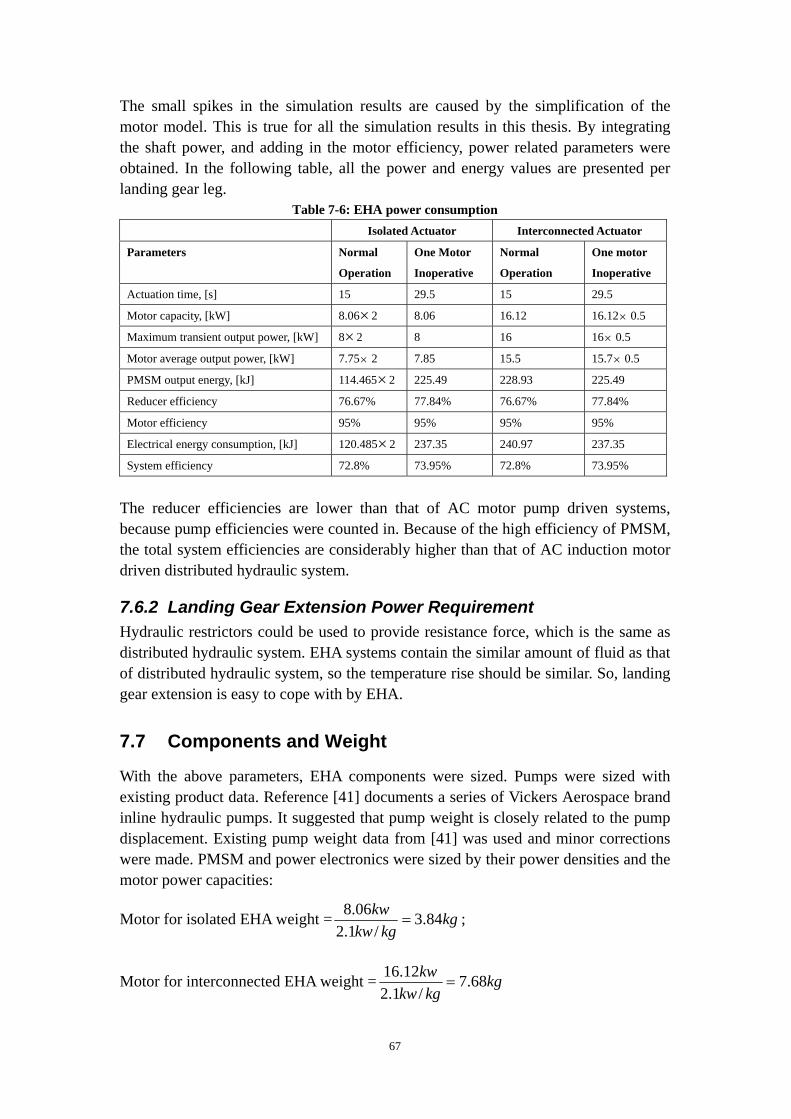
67
The small spikes in the simulation results are caused by the simplification of the motor model. This is true for all the simulation results in this thesis. By integrating the shaft power, and adding in the motor efficiency, power related parameters were obtained. In the following table, all the power and energy values are presented per landing gear leg.
Table 7-6: EHA power consumption Isolated Actuator Interconnected Actuator
Parameters Normal
Operation
One Motor
Inoperative
Normal
Operation
One motor
Inoperative
Actuation time, [s] 15 29.5 15 29.5
Motor capacity, [kW] 8.06×2 8.06 16.12 16.12× 0.5
Maximum transient output power, [kW] 8×2 8 16 16× 0.5
Motor average output power, [kW] 7.75× 2 7.85 15.5 15.7× 0.5
PMSM output energy, [kJ] 114.465×2 225.49 228.93 225.49
Reducer efficiency 76.67% 77.84% 76.67% 77.84%
Motor efficiency 95% 95% 95% 95%
Electrical energy consumption, [kJ] 120.485×2 237.35 240.97 237.35
System efficiency 72.8% 73.95% 72.8% 73.95%
The reducer efficiencies are lower than that of AC motor pump driven systems, because pump efficiencies were counted in. Because of the high efficiency of PMSM, the total system efficiencies are considerably higher than that of AC induction motor driven distributed hydraulic system.
7.6.2 Landing Gear Extension Power Requirement Hydraulic restrictors could be used to provide resistance force, which is the same as distributed hydraulic system. EHA systems contain the similar amount of fluid as that of distributed hydraulic system, so the temperature rise should be similar. So, landing gear extension is easy to cope with by EHA.
7.7 Components and Weight
With the above parameters, EHA components were sized. Pumps were sized with existing product data. Reference [41] documents a series of Vickers Aerospace brand inline hydraulic pumps. It suggested that pump weight is closely related to the pump displacement. Existing pump weight data from [41] was used and minor corrections were made. PMSM and power electronics were sized by their power densities and the motor power capacities:
Motor for isolated EHA weight = kgkgkw
kw 84.3/1.2
06.8= ;
Motor for interconnected EHA weight = kgkgkw
kw 68.7/1.2
12.16=
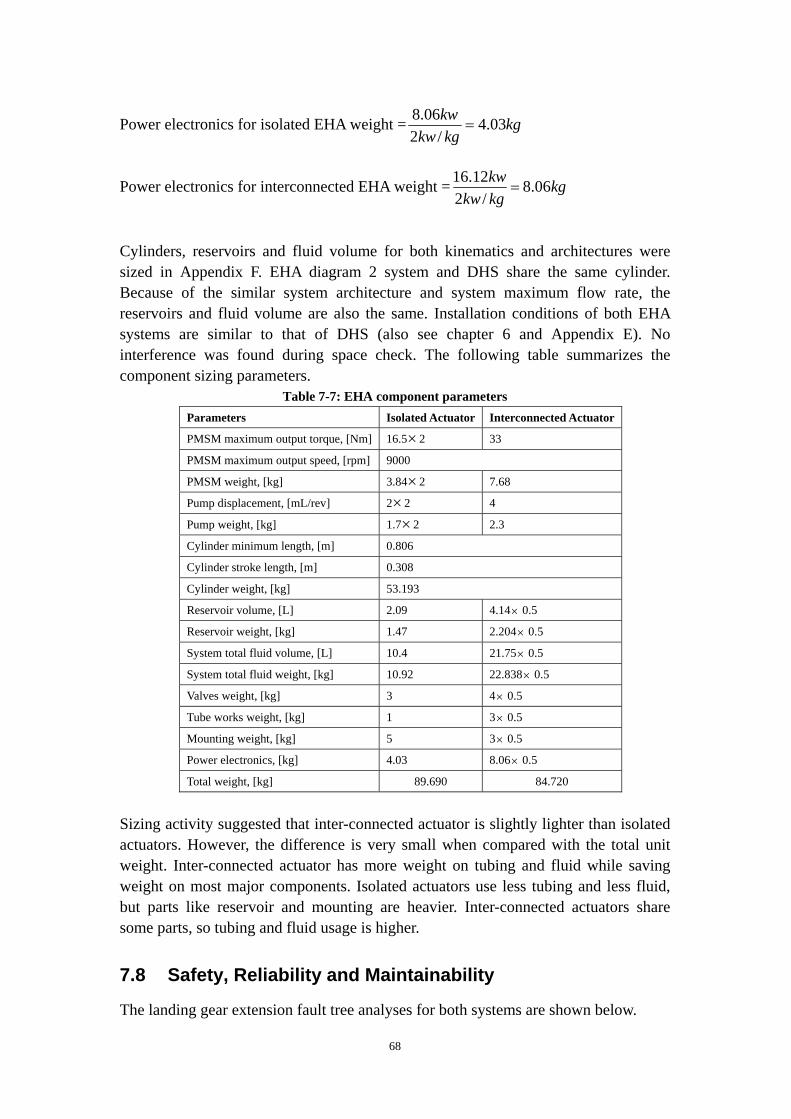
68
Power electronics for isolated EHA weight = kgkgkw
kw 03.4/2
06.8=
Power electronics for interconnected EHA weight = kgkgkwkw 06.8
/212.16
=
Cylinders, reservoirs and fluid volume for both kinematics and architectures were sized in Appendix F. EHA diagram 2 system and DHS share the same cylinder. Because of the similar system architecture and system maximum flow rate, the reservoirs and fluid volume are also the same. Installation conditions of both EHA systems are similar to that of DHS (also see chapter 6 and Appendix E). No interference was found during space check. The following table summarizes the component sizing parameters.
Table 7-7: EHA component parameters Parameters Isolated Actuator Interconnected Actuator
PMSM maximum output torque, [Nm] 16.5×2 33
PMSM maximum output speed, [rpm] 9000
PMSM weight, [kg] 3.84×2 7.68
Pump displacement, [mL/rev] 2×2 4
Pump weight, [kg] 1.7×2 2.3
Cylinder minimum length, [m] 0.806
Cylinder stroke length, [m] 0.308
Cylinder weight, [kg] 53.193
Reservoir volume, [L] 2.09 4.14× 0.5
Reservoir weight, [kg] 1.47 2.204× 0.5
System total fluid volume, [L] 10.4 21.75× 0.5
System total fluid weight, [kg] 10.92 22.838× 0.5
Valves weight, [kg] 3 4× 0.5
Tube works weight, [kg] 1 3× 0.5
Mounting weight, [kg] 5 3× 0.5
Power electronics, [kg] 4.03 8.06× 0.5
Total weight, [kg] 89.690 84.720
Sizing activity suggested that inter-connected actuator is slightly lighter than isolated actuators. However, the difference is very small when compared with the total unit weight. Inter-connected actuator has more weight on tubing and fluid while saving weight on most major components. Isolated actuators use less tubing and less fluid, but parts like reservoir and mounting are heavier. Inter-connected actuators share some parts, so tubing and fluid usage is higher.
7.8 Safety, Reliability and Maintainability
The landing gear extension fault tree analyses for both systems are shown below.

69
Figure 7-8: Main landing gear extension fault tree analysis-EHA diagram 1
Main landing gear extension failure
Normal extension failure
Emergency extension failure
Cylinder jamming
Left or right
Hydraulic power generation system
failure
Pump unit A failure Pump unit B failure
Motor failure Pump failureElectrical power source failure
Fluid conveyance and control failure
Right cylinder jamming
Locks failureLeft or right
Right EHA failure
Motor failure Pump failureElectrical power source failure
Fluid conveyance and control failure
Left cylinder jamming
Left EHA failure
Hydraulic power generation system
failure
Pump unit A failure Pump unit B failure
Motor failure Pump failureElectrical power source failureMotor failure Pump failureElectrical power
source failure
Figure 7-9: Main landing gear extension fault tree analysis-EHA diagram 2

70
Electrical power supply is vital for electrical actuators. Multiple sets of electrical power could be applied on a single actuator to increase power source availability. Power electronics is an integral part of PMSM motor. The motor simply does not work if the power electronics fail. PMSM has more reliance on power electronics than AC induction motor and BDCM. However, technology advancements have already given solid power electronics enough reliability. Hydraulic cylinders have an extremely high service safety record. Cylinder jamming has been generally perceived to be improbable. Landing gear emergency extension is easy to perform with EHA. Landing gear free fall operation induces no damage, and it does not change any system settings. So the free fall procedure is reversible. This attribute gives flexibility on training and system rigging. The safety levels of both EHA systems were considered to be high. In both system architectures, motors, pumps and tubing are the components which are most probable to fail. Assume the motor pump unit (motor + pump) failure
probability is motorpumpP . Components in both systems are of the same technology level.
So, they share the same level of reliability. Tubing failure probability is related with the length, working conditions and mounting conditions. Assume the tubing failure
probability of diagram 1 is 1tubingP , and 2tubingP for diagram 2. Diagram 1 uses less
tubing than diagram 2, also the two actuators are entirely separated, so 21 tubingtubing PP < .
With these probability expressions, the normal extension failure probabilities of both EHA diagrams were approximated as:
Diagram 1: 2)( 11 ×+×= tubingmotorpumpmotorpumpEHA PPPP .
Diagram 2: 22 tubingmotorpumpmotorpumpEHA PPPP +×= .
From the above equations, diagram 2 has smaller main landing gear normal extension failure probability. To increase the diagram 1 safety level, more motor pump units must be used. If tubing failure probabilities are omitted, each isolated EHA should contain four motor and pump units to get the same level of system failure probability as interconnected EHA. Using more and smaller motors and pumps is applicable in EHA design. Because of the nature of hydraulic system, very small pumps are also able to raise the heavy landing gear. But the retraction time would be much longer. So dispatch ability is higher with this approach. Actuator unit weight would not be increased dramatically, but the reliability will suffer because of the larger number of components. Isolated EHA can be integrated as a LRU. So diagram 1 has the advantages of easier production and maintenance. The drawbacks are more weight and larger volume. The

71
cost is also higher because nearly 100% more components are used. Diagram 2 has reduced weight, volume and cost. Also two landing gears are actuated simultaneously, so there is no worry about consistency. However, more tubing is retained, which means more production and maintenance problems. Safety is slightly compromised because tubing failure risk is higher. EHA hydraulic pump is more reliable and efficient than AC motor pump, because of deletion of various internal mechanisms. Dispatch reliability of both systems fulfills requirement in calculation.
7.9 Summary
In this chapter, EHA with two different motors, two kinematics concepts and two system architectures were discussed. The combination of PMSM and kinematics 2 was proven to be the best by comparison of dynamic simulation results. Two systems were developed based on this combination, one with isolated EHA and the other with interconnected EHA. Both systems retract the landing gear in 15s in normal conditions, and 29.5s in one motor fail conditions. Analyses suggested that these two systems have the same level of dynamic performance, power consumption and weight. Safety analyses were conducted to both systems. The results showed that both systems have high safety levels. With the same power source availability level, interconnected EHA has lower extension failure probability. However, isolated EHA performs better in terms of maintainability.

72
8 EMA System Design
8.1 Introduction
In this chapter, an EMA design is presented. Similar to the previous chapters, this chapter starts from system diagram design. Then synergy of motor and kinematics is selected though simulation results comparison. After that, system design and analysis are carried out and results are presented.
8.2 EMA System Diagram
There is no reasonable measure to link the mechanical actuators together. So, EMA is definitely an isolated actuator. The situation was different from that of EHA. Only one diagram was applicable. Based on the minimum redundancy level requirement, a system diagram was made as illustrated in the following figure and table.
Figure 8-1: EMA diagram
(3)(2)
(1)
(1)
M
gearbox
M
Table 8-1: EMA diagram-list of components
Number Component Name Quantity
1 Motor 2
2 Transmission 1
3 Clutch 1
In this design two motors (1) are used to drive a single gearbox (transmission) (2). A clutch (3) is used to free the landing gear from actuator when jamming happens. The gearbox is composed of one roller screw and two pair of spur gears. The designed EMA cross section view was shown in Appendix G.
8.3 Motor and Kinematics Selection
In the following paragraphs, EMA with BDCM and PMSM using both kinematics 1
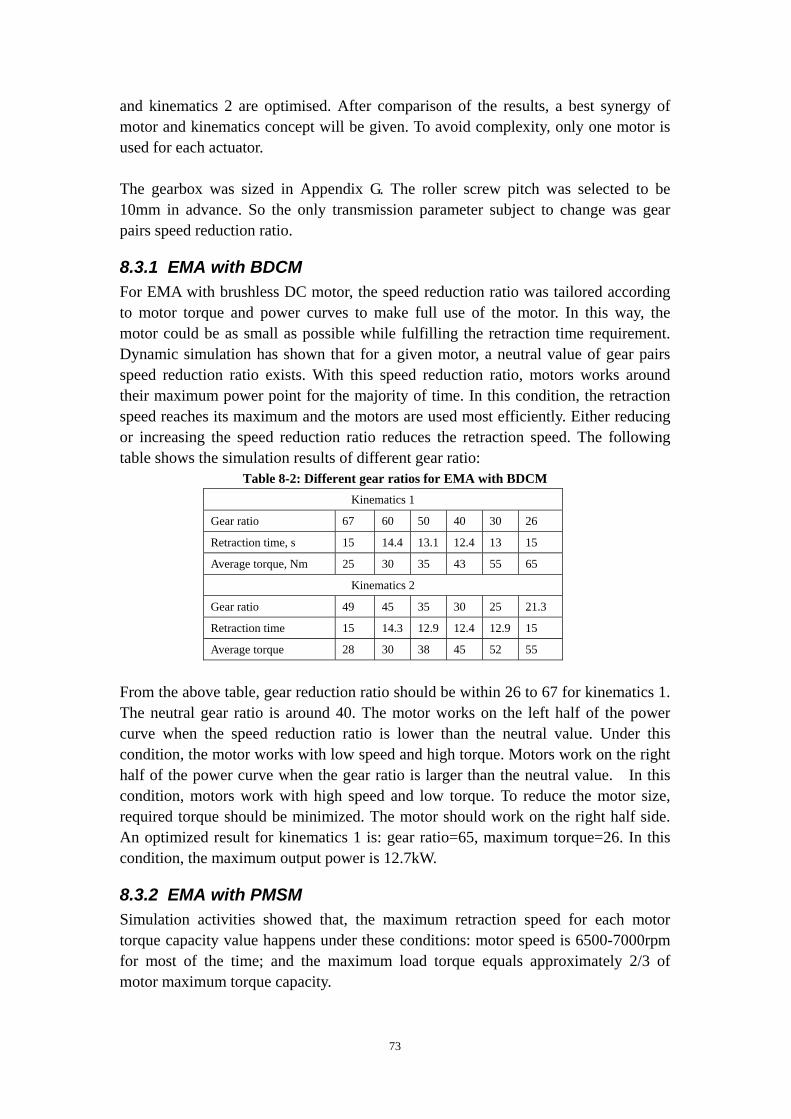
73
and kinematics 2 are optimised. After comparison of the results, a best synergy of motor and kinematics concept will be given. To avoid complexity, only one motor is used for each actuator. The gearbox was sized in Appendix G. The roller screw pitch was selected to be 10mm in advance. So the only transmission parameter subject to change was gear pairs speed reduction ratio.
8.3.1 EMA with BDCM For EMA with brushless DC motor, the speed reduction ratio was tailored according to motor torque and power curves to make full use of the motor. In this way, the motor could be as small as possible while fulfilling the retraction time requirement. Dynamic simulation has shown that for a given motor, a neutral value of gear pairs speed reduction ratio exists. With this speed reduction ratio, motors works around their maximum power point for the majority of time. In this condition, the retraction speed reaches its maximum and the motors are used most efficiently. Either reducing or increasing the speed reduction ratio reduces the retraction speed. The following table shows the simulation results of different gear ratio:
Table 8-2: Different gear ratios for EMA with BDCM Kinematics 1
Gear ratio 67 60 50 40 30 26
Retraction time, s 15 14.4 13.1 12.4 13 15
Average torque, Nm 25 30 35 43 55 65
Kinematics 2
Gear ratio 49 45 35 30 25 21.3
Retraction time 15 14.3 12.9 12.4 12.9 15
Average torque 28 30 38 45 52 55
From the above table, gear reduction ratio should be within 26 to 67 for kinematics 1. The neutral gear ratio is around 40. The motor works on the left half of the power curve when the speed reduction ratio is lower than the neutral value. Under this condition, the motor works with low speed and high torque. Motors work on the right half of the power curve when the gear ratio is larger than the neutral value. In this condition, motors work with high speed and low torque. To reduce the motor size, required torque should be minimized. The motor should work on the right half side. An optimized result for kinematics 1 is: gear ratio=65, maximum torque=26. In this condition, the maximum output power is 12.7kW.
8.3.2 EMA with PMSM Simulation activities showed that, the maximum retraction speed for each motor torque capacity value happens under these conditions: motor speed is 6500-7000rpm for most of the time; and the maximum load torque equals approximately 2/3 of motor maximum torque capacity.

74
Motor maximum torque and gear ratio were coupled according to the above conditions. Increasing the maximum torque reduces the reliance on large reduction ratio. However, larger motor torque results in larger motor weight. Simulation results showed that with kinematics 1, the smallest torque to retract the landing gear within 15s is 35 Nm. The corresponding gear ratio is 70. When decreasing gear ratio, the motor maximum torque should be increased accordingly to reach the required speed.
8.3.3 Optimization Results EMA gearbox sizing study showed that large gear ratio causes excessive size and weight penalties. For the given force and stroke requirement, a gear ratio of around 50 is reasonable. Increasing this ratio would result in large size and weight increment. And reducing this ratio would not get much benefit. For a given gear ratio of 52.37, PMSM maximum torque should not be less than 37.5Nm. The following table summarizes the optimized results of the four combinations.
Table 8-3: EMA synergies performance comparison BDCM PMSM
Parameters Kinematics 1 Kinematics 2 Kinematics 1 Kinematics 2
Gear ratio 52.37 49 52.37 52.37
Maximum torque, [Nm] 84.9 84.9 37.5 34.5
Maximum swing speed, [degree/s] 13 10.2 10.1 8.4
Minimum swing speed, [degree/s] 3.7 3.74 3.26 3.2
Maximum acceleration, [degree/s2] 40 32 16.15 12.3
Minimum acceleration, [degree/s2] -3.8 -2.34 -1.716 -0.88
Maximum actuator speed, [m/s] 0.019 0.024 0.018 0.026
Average actuator speed, [m/s] 0.018 0.021 0.016 0.02
Maximum force discrepancy, [N] 6.8e5 3.1e5 2.58e5 1.11e5
Minimum force discrepancy, [N] -26950 -10540 -10400 -3110
Maximum torque discrepancy, [Nm] 27430 22290 10350 7906
Minimum torque discrepancy, [Nm] -2412 -1480 -1100 -561
Maximum motor speed, [rpm] 6063 7110 5619 8250
Average motor speed, [rpm] 5600 6200 4850 6400
Maximum torque, [Nm] 80 80 37.5 35
Average torque, [Nm] 31 27 30 25
Maximum power, [kW] 19.7 19.8 17.2 16.8
Average power, [kW] 18 16.3 16 16
Dynamic simulation results have shown that all kinds of EMA discussed here have similar dynamic performance. This is due to the fact that motors are all “power-on-demand”. PMSM have shown superiority over BDCM in terms of dynamic performance. The differences between kinematics 2 systems and kinematics 1 systems are very limited. Combined with the fault segregation requirement, kinematics 1 was selected.

75
Based on the above analysis, synergy of PMSM and kinematics 1 was selected for EMA design.
8.4 System Parametric Study
At least two motors should be used on each EMA as defined by the redundancy requirement. EMA output is torque summing rather than speed summing (as that of EHA). So two limitations apply here: a) One motor should have enough torque ability to raise the gear. Although the
effective of inertia could reduce this requirement, it provides more safety for uncertain loading conditions. In this circumstance, retraction time is not limited. So, motor maximum output torque should be larger than needed in counteracting
the maximum static load. fact
motor RFT max
max ≥ .
b) With two motors, the retraction time requirement must be fulfilled. To achieve fastest retraction speed, the maximum load on torque shaft should be 2/3 of
maximum torque. fact
motor RFT max
max34
=× .
The first requirement yields motor larger torque than the second one. Motors sized according to the first requirement are actually over powered. The retraction time will be shorter than required. The following table shows the simulation results under different motor maximum torques.
Table 8-4: Torque effects of EMA with kinematics 1 Two motor torque, [Nm] 35 40 45 50 55 60 65 70 75 80
One motor torque, [Nm] 17.5 20 22.5 25 27.5 30 32.5 35 37.5 40
Minimum gear ratio 95 82 74 66 60 55 50.5 47 44 41.5
Swing angle (15s), [degree] 72.7 80 86 86.7 99 105.7 112.6 119.2 126.2 133.2
Normal retraction time, [s] 15.8 14 12.5 11.2 10.2 9.5 8.7 8.1 7.6 7.1
One motor retraction time, [s] 40 36 30 28.5 25 24 22 20.5 18.8 17.5
Speed(normal), [rpm] 9000 9000 9000 9000 9000 9000 9000 9000 9000 9000
From the above table, when the two motors total torque ranges from 35Nm to 60Nm, the corresponding gear ratio reduces greatly. Then the gear ratio levels to around 50. With a gear ratio of 52.37 (suggested by Appendix G), one motor should provide a
torque of: NmRFT
factmotor 2.29
9.25665748650max
max === .
The above optimized EMA design parameters are listed in the following table. The normal retraction time and one motor fail retraction time are also listed.

76
Table 8-5: EMA parameters Parameters Value
Gear ratio 52.37
Number of motors 2
Motor torque, [Nm] 29.2
Motor capacity, [kW] 14.24
Normal retraction time, [s] 12.5
One motor fail retraction time, [s] 18.8
The speed to torque curve and speed to power curve of PMSM with the above parameters are shown below. Both normal conditions and one motor inoperative conditions are given.
Figure 8-2: EMA Motor speed-torque and speed-power curves
0 2000 4000 6000 8000 100000
5
10
15
20
25
30
35
X: 0Y: 29.2
X: 9000Y: 0
X: 3000Y: 29.2
X: 8909Y: 14.7
MOTOR TORQUE - SPEED
MOTOR SPEED,rpm
TOR
QU
E,N
m
0 2000 4000 6000 8000 100000
2000
4000
6000
8000
10000
12000
14000
16000
X: 7182Y: 1.424e+004
MOTOR POWER - SPEED
MOTOR SPEED,rpm
Pow
er,w
att
8.5 Dynamic Performance
With the above design parameters, the landing gear retraction dynamic simulation was run. Simulation results were presented below. Each of the following figures contained curves under both normal operation, and one motor fail operation conditions. The dynamic performance curves of landing gear swing angle, speed and acceleration are shown below:

77
Figure 8-3: EMA landing gear swing dynamics
0 5 10 15 200
10
20
30
40
50
60
70
80
TIME, s
AN
GLE
OF
SW
ING
, deg
ANGLE OF SWING
0 5 10 15 200
1
2
3
4
5
6
7
8
9
TIME, s
SP
EE
D O
F S
WIN
G, d
eg/s
SPEED OF SWING
0 5 10 15 20-2
0
2
4
6
8
10
12
TIME, sA
CC
ELE
RA
TIO
N O
F S
WIN
G, r
ad/s
/s
ACCELERATION OF SWING
normal
one motor
normal
one motor
normal
one motor
Figure 8-4 illustrates actuator speed, force and stroke during retraction. Figure 8-4: EMA actuator dynamics
0 5 10 15 200
0.005
0.01
0.015
0.02
0.025
0.03
TIME, s
AC
TUA
TIO
N S
PE
ED
, m/s
ACTUATOR SPEED
0 5 10 15 200
1
2
3
4
5
6
7
8x 10⁵
TIME, s
AC
TUA
TIO
N F
OR
CE
, N
ACTUATOR FORCE
0 0.1 0.2 0.3 0.40
1
2
3
4
5
6
7
8x 10⁵
STROKE,M
FOR
CE
,N
FORCE-STROKE
normal
one motor
normal
one motor
normal
one motor
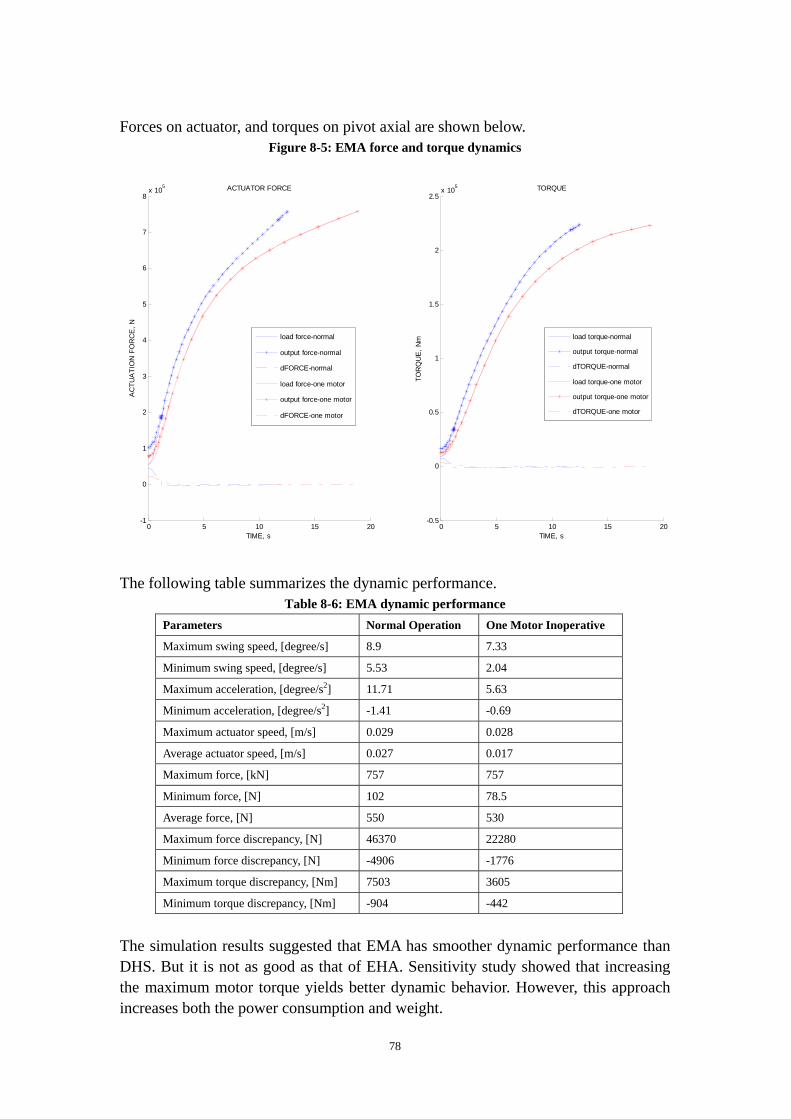
78
Forces on actuator, and torques on pivot axial are shown below.
Figure 8-5: EMA force and torque dynamics
0 5 10 15 20-1
0
1
2
3
4
5
6
7
8x 10⁵
TIME, s
AC
TUA
TIO
N F
OR
CE
, N
ACTUATOR FORCE
0 5 10 15 20-0.5
0
0.5
1
1.5
2
2.5x 10⁵
TIME, s
TOR
QU
E, N
m
TORQUE
load force-normal
output force-normal
dFORCE-normal
load force-one motor
output force-one motor
dFORCE-one motor
load torque-normal
output torque-normal
dTORQUE-normal
load torque-one motor
output torque-one motor
dTORQUE-one motor
The following table summarizes the dynamic performance.
Table 8-6: EMA dynamic performance Parameters Normal Operation One Motor Inoperative
Maximum swing speed, [degree/s] 8.9 7.33
Minimum swing speed, [degree/s] 5.53 2.04
Maximum acceleration, [degree/s2] 11.71 5.63
Minimum acceleration, [degree/s2] -1.41 -0.69
Maximum actuator speed, [m/s] 0.029 0.028
Average actuator speed, [m/s] 0.027 0.017
Maximum force, [kN] 757 757
Minimum force, [N] 102 78.5
Average force, [N] 550 530
Maximum force discrepancy, [N] 46370 22280
Minimum force discrepancy, [N] -4906 -1776
Maximum torque discrepancy, [Nm] 7503 3605
Minimum torque discrepancy, [Nm] -904 -442
The simulation results suggested that EMA has smoother dynamic performance than DHS. But it is not as good as that of EHA. Sensitivity study showed that increasing the maximum motor torque yields better dynamic behavior. However, this approach increases both the power consumption and weight.
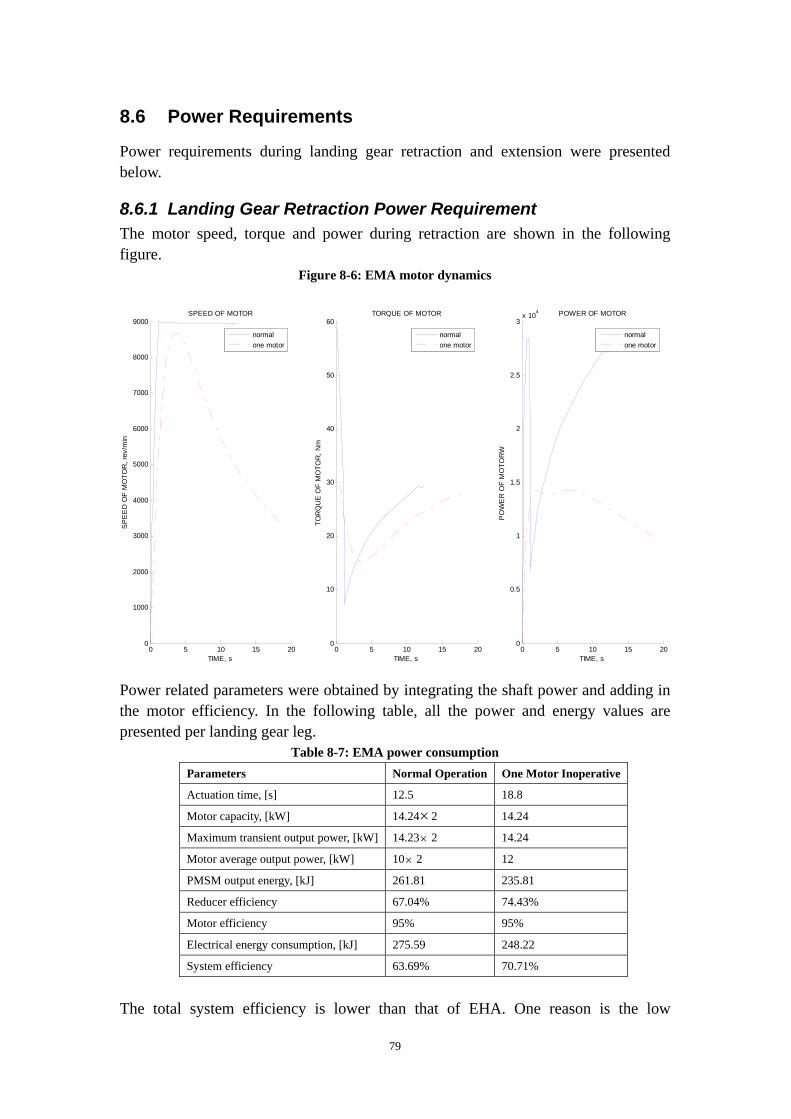
79
8.6 Power Requirements
Power requirements during landing gear retraction and extension were presented below.
8.6.1 Landing Gear Retraction Power Requirement The motor speed, torque and power during retraction are shown in the following figure.
Figure 8-6: EMA motor dynamics
0 5 10 15 200
1000
2000
3000
4000
5000
6000
7000
8000
9000
TIME, s
SP
EE
D O
F M
OTO
R, r
ev/m
in
SPEED OF MOTOR
0 5 10 15 200
10
20
30
40
50
60
TIME, s
TOR
QU
E O
F M
OTO
R, N
mTORQUE OF MOTOR
0 5 10 15 200
0.5
1
1.5
2
2.5
3x 10⁴
TIME, s
PO
WE
R O
F M
OTO
RW
POWER OF MOTOR
normalone motor
normalone motor
normalone motor
Power related parameters were obtained by integrating the shaft power and adding in the motor efficiency. In the following table, all the power and energy values are presented per landing gear leg.
Table 8-7: EMA power consumption Parameters Normal Operation One Motor Inoperative
Actuation time, [s] 12.5 18.8
Motor capacity, [kW] 14.24×2 14.24
Maximum transient output power, [kW] 14.23× 2 14.24
Motor average output power, [kW] 10× 2 12
PMSM output energy, [kJ] 261.81 235.81
Reducer efficiency 67.04% 74.43%
Motor efficiency 95% 95%
Electrical energy consumption, [kJ] 275.59 248.22
System efficiency 63.69% 70.71%
The total system efficiency is lower than that of EHA. One reason is the low

80
efficiency of EMA mechanical transmission. Another reason is the over powered motor, so the landing gear dynamic power is large. One motor operation has better efficiency because the landing gear swing speed is considerably lower.
8.6.2 Landing Gear Extension Power Requirement For EMA, landing gear extension was proved to be a difficult problem. A sink device such as resistor or capacitor has to be incorporated in the system to damp the generated electrical power. Otherwise the motor could not provide resistant force at all. These devices bring in a lot of weight [79].
8.7 Components and Weight
PMSM weight and power electronics weight were calculated by their power densities and the motor power capacity. Weight of one motor is calculated below.
Motor weight= kgkgkw
kw 78.6/1.2
24.14= ;
Assume one power electronics package supplies for the both motors, than the power electronics weight is:
Power electronics weight= kgkgkwkw 24.142
/224.14
=×
Transmission and clutch were sized in Appendix G. Because of time and page limitation, clutch design was not detailed. Clutch size and weight were reflected on the EMA output rod. EMA has been mounted on the landing gear for space check. The following pictures illustrate the installation conditions. No structural interference was found during space check.
Table 8-7: EMA installation-landing gear lowered

81
Table 8-8: EMA installation-landing gear retracted
The major components parameters and weight are listed in the following table
Table 8-8: EMA component parameters Parameters Value
PMSM maximum output torque, [Nm] 29.2× 2
PMSM maximum output speed, [rpm] 9000
PMSM motor weight, [kg] 6.78× 2
Actuator minimum length, [m] 1.069
Actuator stroke length, [m] 0.228
Roller screw pitch [mm] 10
Gear ratio 52.37
Transmission weight, [kg] 87.67
Power electronics weight, [kg] 14.24
Total weight, [kg] 115.472
As described in above table, the system weight of EMA is larger than all previous solutions. The transmission takes most of the weight.
8.8 Safety, Reliability and Maintainability
Issues concerning safety, reliability and maintainability were covered below. The landing gear extension fault tree analysis is shown below.
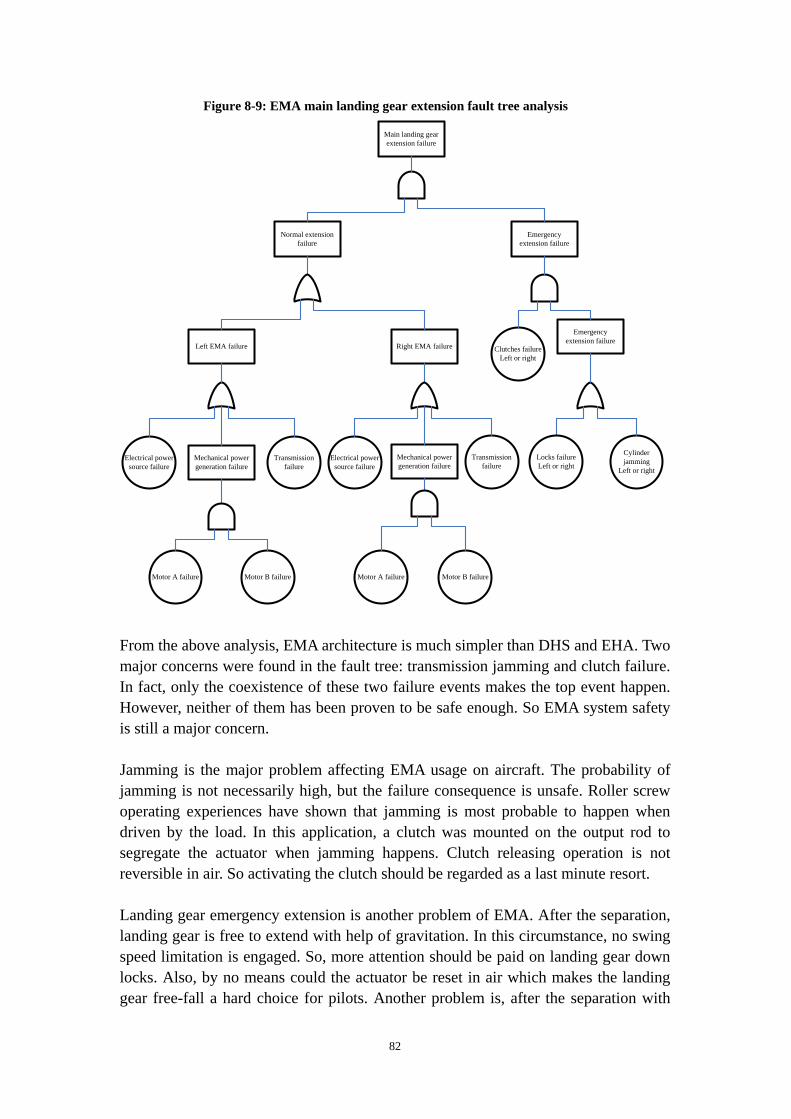
82
Figure 8-9: EMA main landing gear extension fault tree analysis
Main landing gear extension failure
Normal extension failure
Emergency extension failure
Cylinder jamming
Left or right
Locks failureLeft or right
Right EMA failure
Electrical power source failure
Transmission failure
Left EMA failure
Mechanical power generation failure
Motor A failure Motor B failure
Electrical power source failure
Transmission failure
Mechanical power generation failure
Motor A failure Motor B failure
Emergency extension failure
Clutches failureLeft or right
From the above analysis, EMA architecture is much simpler than DHS and EHA. Two major concerns were found in the fault tree: transmission jamming and clutch failure. In fact, only the coexistence of these two failure events makes the top event happen. However, neither of them has been proven to be safe enough. So EMA system safety is still a major concern. Jamming is the major problem affecting EMA usage on aircraft. The probability of jamming is not necessarily high, but the failure consequence is unsafe. Roller screw operating experiences have shown that jamming is most probable to happen when driven by the load. In this application, a clutch was mounted on the output rod to segregate the actuator when jamming happens. Clutch releasing operation is not reversible in air. So activating the clutch should be regarded as a last minute resort. Landing gear emergency extension is another problem of EMA. After the separation, landing gear is free to extend with help of gravitation. In this circumstance, no swing speed limitation is engaged. So, more attention should be paid on landing gear down locks. Also, by no means could the actuator be reset in air which makes the landing gear free-fall a hard choice for pilots. Another problem is, after the separation with

83
landing gear, the actuator will have a free end. Under the effects of gravity and shock, this free end can punch through the wing skin. Possible solution may include using sleeve rods or cables to provide additional support. The EMA architecture is fairly simple, which implies that electro-mechanical actuators are more reliable in nature when compared with their hydraulic counterparts. No fluidic material is needed so problems of leakage and fire hazard do not exist. Maintenance works on an EMA mainly contain greasing and visual checking. When compared hydraulic solutions, EMA maintenance requirement is greatly relaxed. However, the transmission could be very complex. Also, subsidiary components like brakes and clutches tend to increase the complexity. Calculation suggested that EMA dispatch reliability level fulfills requirement.
8.9 Summary
In this chapter, the EMA system was evaluated for landing gear actuation purpose. Firstly, an EMA system diagram was built. Then the combination of PMSM and kinematics 1 was chosen through analysis. Combined with mechanical parts sizing activities, system parameters were decided. After that, system dynamic simulation was run to discover various performances. System components were sized. Then safety, reliability and maintainability analyses were carried out. The results showed that EMA is applicable for landing gear actuation application. Its design differs from hydraulic solutions in several aspects. The EMA system was over powered. Under normal conditions, it retracts the landing gear in 12.5s. If one of the two motors in one EMA fails, the retraction time is 18.8s. EMA design is heavier than DHS and EHA. Potentially unsafe failure mode is still a concern for EMA application. Regenerative power dissipation is a potential problem. However, EMA system is much better in terms of maintenance. EMA dispatch reliability fulfills requirement.

84
9 Results
9.1 Introduction
In this chapter, the results produced by the previous chapters were summarized. Further discussions were carried out in a larger prospective. As discussed previously, four more-electric solutions provide reasonable answers to the requirements:
a) Distributed hydraulic system (using kinematics 2); b) Isolated EHA system (using PMSM and kinematics 2); c) Inter-connected EHA system (using PMSM and kinematics 2); d) EMA system (using PMSM and kinematics 1).
Traditional hydraulic system was also included in the comparisons. It was used as comparison basis. Five major factors were identified as major contributors to system selection. For each of these factors, systems were discussed and compared. Other issues concerning the systems were also discussed to accomplish the study. These issues were not considered in scoring and weighting. Quantitative comparisons were used wherever it was possible. And in other cases, qualitative analysis served to clarify the problems. Weighting method suggested by reference [54] and [55] has been used to evaluate systems. With this method, the system with best attribute was given a score of 10. Scores of other system were given according to the degree of their performances relative to the best system. Systems were scored in terms of each of the major factors. Maximum effort was made to produce these scores analytically. Also, the experiences and impressions gained by the author during the study played an important role. Some of the scores were produced by the author through engineering judgement.
9.2 Dynamic Performance and Functions
Simulations have shown that electrically driven systems have a “power on demand” feature. No major shocks were observed in dynamics simulations. EHA has the smoothest dynamic behaviors, and EMA is slightly inferior to EHA. Distributed hydraulic system is less favorable in dynamics. However, it is still better than central hydraulic system when no downstream restrictor is used. Hydraulic solutions have greater potential in extending their functions. Other landing gear affiliated systems such as locks, steering system, door actuation can share this power source. In this way, the actuation system turns into a localized hydraulic system, no matter hydrostatic or not. This measure has benefits such as large weight and space saving and simpler electrical interface. On the other hand, it results in complex tubing networks. For many years, airframe manufacturers have been eager to remove the complex hydraulic networks from aircraft. When shifting to localized

85
hydraulics, tubing works are reduced in a magnitude. But it is unknown to what extent these small number of tubing works can be tolerated. So the merits of hydraulics functional versatility are compromised. Electromechanical actuators are rigid in nature. It can not be used for other functions. Scores were allocated to each system considering all the factors discussed above.
Table 9-1: Dynamic performance and functions HYD DHS EHA(isolated) EHA(interconnected) EMA
Performance 5 8 10 10 9
Functionality 10 10 10 10 8
Score 8 9 10 10 8.5
9.3 Weight and Geometry
The weight of each system is listed in the following table. And scores were given respectively. According to 3D model kinematics simulation, the designed actuators are all compatible with the aircraft structure. One advantage of hydraulic solutions is that they are flexible in component disposition. Its major components such as reservoirs, motor and pump units can be located away from cylinders. However, this induces an increase in tubing works and hence more weight and maintenance work. EHA actuators have smaller weight and volume than distributed hydraulic systems, thanks to the high power density motors. EMA is rigid, so its flexibility of disposition is the worst. The scores of each system are list below.
Table 9-2: Weight and geometry HYD DHS EHA(isolated) EHA(interconnected) EMA
Weight, [kg] - 97.214 89.69 84.72 115.472
Score of Weight 8 10 9.5 7
Score of Geometry 10 9 8 10 7
Total Score 9 8.5 9 10 7
9.4 Power Requirements
More-electric landing gear actuation systems consume electrical power when retracting. When deploying the gears, electrical power is generated. According to MIL-STD-704, this electrical power should be dissipated, rather than fed in to electrical network. Hydraulic solutions have no problems on damping this energy. Special devices must be included in EMA to tackle this problem. Energy consumptions of each system are list below and scores were given to each system.

86
Table 9-3: Power requirements HYD DHS EHA(isolated) EHA(interconnected) EMA
Power Requirements, [kJ] - 303.583 240.97 240.97 275.59
Score 5 5 10 10 8
9.5 Reliability and Maintenance
Various benefits of hydraulic technology have ensured its dominance in actuation domain. However, since the very beginning it has been criticized for its intensive maintenance requirements. On large passenger transporters, there are typically several tons of hydraulic components, tubing and fluid. And because of its large number and complex distribution, the conveyance system causes most of the troubles. It also takes majority of the weight. Tubing has to be checked regularly for leakage and damage. Trouble shooting and fault segregation of hydraulic system components have proven to be extremely difficult. Electro-hydraulic solutions partly solved these service problems by significantly reducing tubing works and components. Trouble shooting of these systems can be much easier. They use quite a lot of electrical components, so they can benefit from using health management systems. Massive service experience also helps. Interconnected EHA and DHS have reduced the using of tubing greatly. However, they are still inherently maintenance intensive because of the fluid conveyance system. For example, the leakage problem was not eliminated. So for every flight, the reservoir fluid level still has to be checked. The components and tubing also have to be checked for leakage and damage. Isolated actuator is better in this aspect. The whole actuator could be integrated as a LRU. So simpler interface and easier replacement greatly improves the maintainability. EMA is simpler than hydraulic solutions in nature. So, it has dominant advantages over hydraulic solutions on reliability and maintenance. Only greasing and visual inspections are needed regularly. There is not a problem of leakage. And there are fewer components. So service work could be much reduced. However, when adding in clutches and brakes, EMA begins to add on complexity. Cost represents an important aspect of maintenance. The cost of a solution consists of two parts: component acquisition cost, and operating cost. The acquisition cost of the precise hydraulic system components is high. Together with the large number of component types, the cost for spare parts and their storage is quite high. Hydraulic systems operating cost is also high. No matter distributed hydraulic system, or EHA, they all inherit this attribute to some extent. For the EMA solution, gears and roller screws also need precise manufacturing if high efficiency and jam free characteristics are wanted. In the future, this cost would decrease with the advance of technology. The biggest advantage of EMA over EHA lays on operating cost.

87
Another cost has to be considered is infrastructure rebuilding. Hydraulic solutions have dominated the actuation domain for many years. And massive research, production, and service facilities have been built around it. Shifting from hydraulic solution to electromechanical ones needs large investment on building another supporting system. Electro-hydraulic solutions have the ability of using existing off-the-shelf products and production system. In the following table, the problem was divided into five aspects: complexity, reliability, life, service and logistics. Scores were given to the systems on each aspect. Then synthetic results were generated. The scores of each system are listed below.
Table 9-4: Reliability and maintenance HYD DHS EHA(isolated) EHA(interconnected) EMA
Complexity 5 7 9 8 10
Reliability 5 8 8 8 10
Life 6 8 8 8 10
Service 5 8 9 8 10
Logistics 6 10 9 8 9
Score 5 8 8.5 8 10
9.6 Airworthiness
Hydraulic systems have been proven to be very reliable. Hydraulic cylinders have an excellent service record. During the last several decades, no jammed cylinder has been recorded. Hydraulic solutions are failure-safe because landing gear free fall ability is easy to build in. Distributed hydraulic system is a quite conservative solution. So airworthiness for it could be easier than EHA and EMA. EMA has been used extensively on horizontal tail trimming and flaps actuation for many years. Several U.S. and EU project have already flown electromechanical actuators as flight control actuators. However, they have never been used on single route components such as landing gear control. EMA solution is prone to jam, although extensive researches have focused on make it jam-free. If a landing gear is jammed and clutch fails to effect, the aircraft will have to experience a dangerous wheels-up landing. Scores of systems are listed in the following table.
Table 9-5: Airworthiness HYD DHS EHA(isolated) EHA(inter-connected) EMA
Score 10 9 8 8 7
9.7 Other Issues
Hydraulic solutions are not environmentally friendly. The most commonly used hydraulic fluids are all poisonous and not degradable. Hydraulic fluid vapor has been
88
criticized for being hazardous to human health since the very beginning of its usage. Fluid which has reasonable performance characteristics and simultaneously being safe is not feasible up to date. EMA solutions have better records in this area. Grease does not affect human health. Although it is also not degradable, the required quantity of it is very limited. Further more, dry lubrication materials have received extensive research in the last several decades. In the future, EMA could be entirely environmentally friendly.
9.8 Summary
Systems which were designed and analyzed previously were summarized in this chapter. Various aspects of these systems were discussed and compared. Scores were allocated to each system based on their abilities. These scores will be used to generate final comparison result.
89
10 Discussion
10.1 Introduction
Shifting from central hydraulic systems to more-electric solutions represents a fundamental change in system architecture. No single benefit would be important enough to make the decision. In this chapter, various factors are brought together to make the final comparison. Firstly weighting of different factors is set. Then system synergies are evaluated.
10.2 Weighting of Factors
a) Dynamic performance and functions Dynamic performance is important in reducing shocks. Also, it provides components with better stressing conditions. In terms of functionality, solutions which have the ability to share their resources for other functions provide more flexibility for system growth. A score of 4 would be reasonable. b) Weight and Geometry Weight is of great importance for all the aerospace components. It is general knowledge that an increment in single component weight will result in several times larger weight increments in the aircraft level. Aircraft installation environment is always limited. However in this application, the case study aircraft is a large transporter, so the geometrical confinement is not too severe. And nothing mounted in the landing gear is more important than the landing gear itself. So the geometry is of less importance. A score of 8 was chosen. c) Power Requirements One hindrance of achieving all-electric aircraft is the ability of generating enough electric power. In this application, the power requirement is considerable. Around 70kW of electric input is needed for all the three gears. So reducing the power requirement is absolutely meaningful. A score of 6 was used. d) Reliability and Maintenance The major advantage of more-electric solution over traditional central hydraulics lays on the much better reliability and maintenance. A score of 10 is reasonable. e) Airworthiness Safety is vital especially for landing gear actuation. If landing gear could not be lowered, serious consequences will happen. In certain conditions it could end up with catastrophe. So a score of 10 was used. The following table summarizes the scores of factors. The weight of each factor was

90
calculated through division of its score and the score sum of all factors. Table 10-1: Factor weight calculation
Factors Power Weight
Dynamic performance and functions 4 0.11
Weight and Geometry 8 0.21
Power Requirements 6 0.16
Reliability and Maintenance 10 0.26
Airworthiness 10 0.26
10.3 Comparison and Selection
The designed systems were compared in the following table. The overall score of each system is the sum of factor scores multiplied by weight of factors.
Table 10-2: System comparison
Factors Weight HYD DHSEHA
(isolated)
EHA
(inter-connected) EMA
Dynamic performance and functions 0.11 5 8 10 10 9
Weight and Geometry 0.21 9 8.5 9 10 7
Power Requirements 0.16 5 5 10 10 8
Reliability and Maintenance 0.26 5 8 9 8 10
Airworthiness 0.26 10 9 8 8 7
Overall score 7.158 7.895 9.000 8.947 8.158
The calculation results suggest that isolated EHA has the highest score. However, the difference between isolated EHA and inter-connected EHA is very small. The major reason isolated EHA scores higher than inter-connected EHA is the advantage in reliability and maintenance. EMA scores less because of its larger weight and potentially unsafe failure mode. Distributed hydraulic system has no major advantages over EHA or EMA in the long run. However, in the short term, it prevails in technology maturity. Stand alone EHA is the best answer for landing gear actuation application according to the above analysis.
10.4 Case Study Limitations
The author experienced various difficulties during the research. The biggest obstacles, as usual, were tight time frame and lack of information. Page limitation also affected the scope of research. There are certain problems which are very important to this topic, but have not been addressed perfectly, or have been intentionally simplified for some reasons. They are discussed below. Motor characteristics are very important to system performance. Simulation activities have shown that system dynamic performances are very sensitive to motor

91
characteristics. However in this report, motor characteristics are very much simplified because of time limitation. Also power density method was used to size motors and power electronics. This method is convenient, but it omits the some very important points such as torque producing. The validity of research results could suffer from these simplifications. Power electronics technology has developed so fast in the recent years that the past experience could be no longer applicable. However, this information was very difficult to grasp. In this report, only the weight of power electronics was estimated. The reliability, power quality and heat dissipation problems were not covered. In this study, two methods were used to size the mechanical components. Complex components such as roller screw and hydraulic pumps were sized by using existing product information. Most other mechanical components were sized through stress analysis. Components which are subject to hydraulic pressure effects were sized by burst stressing condition. And other major components were sized through ultimate tensile or ultimate compression stress. Universal factors (load factor=1.5, safety factor=2) were used in stress analysis. Geometry of small parts was decided relying on the author’s past experience. These activities may not always yield correct results. More detailed sizing study could produce more precise outcomes. Reliability and maintenance are extremely important when making decisions between the above systems. Due to time and resource limitation, these issues were only discussed briefly.
92
11 Conclusions This report tries to answer the question of whether more-electric landing gear actuation is possible, and which more-electric system synergy is the best for landing gear actuation application. Information concerning this topic was reviewed and past experiences were understood. More-electric landing gear system design requirements were generated. And all possible systems were analyzed for their viability. All the major components of more-electric landing gear actuation system were analyzed. Analyses were made both on aircraft level and actuation system level. The author gathered massive knowledge about aircraft and landing gear in GDP design activities. The knowledge has proven to be extremely relevant and useful during this study. In this report, landing gear kinematics received great emphasis. Four kinematics concepts were identified. And through analysis of the kinematics concepts and actuators, optimized kinematics and actuator synergies were targeted. Results have shown that more-electric solutions which incorporate hydraulic transmission follow the same kinematics design guidelines as central hydraulic systems. Three different motors: AC induction motor, BDCM (brushless DC motor) and PMSM (permanent magnetic synchronous motor), were analyzed. Results have shown that PMSM provides better attributes than the other two motor candidates. Three kinds of more-electric systems: AC induction motor driven DHS (distributed hydraulic system), EHA (electro-hydrostatic actuator) and EMA (electro-mechanical actuator) were designed. Two system architectures were designed for EHA, one having isolated EHA, and the other having interconnected EHA. These systems were designed in detail. Their important characteristics such as dynamic performance and power requirements were simulated. Their components were sized, and the weight of systems was derived. Reliability, safety and maintainability of these systems were discussed. Space check of these systems proved that they did not interfere with other components. Comparison of systems was made using a scoring method. EHA solutions were proven to be favourable. Isolated EHA has slightly higher score than inter-connected EHA. EMA scores less, mainly because of its large weight, potentially unsafe failure mode and low transmission efficiency. Through this study, the feasibility of more electric landing gear actuation has been demonstrated. A conclusion could be made that EHA (electro-hydrostatic actuator) is still the best choice although it remains to use hydraulic technology. Using isolated EHA gives a good balance between good performance and reasonable maintainability. EMA is applicable and promising for landing gear actuation application. However,

93
more researches and test should be performed to make it safer, lighter and more efficient.
94
12 Recommendations for Future Work This study has uncovered some interesting results. However, more work has to be done to validate these results, and to trace new problems. Increasing the research scope is very important. The following points are of importance from the perspective of the author: a) Thorough reliability and maintainability calculation and comparison. Relaxed
maintenance is the major benefit of using more-electric actuators. Quantitative analysis is needed to unveil the magnitude of this benefit.
b) More detailed modeling of motors. Electrical motor by it self is a big discipline.
The characteristics of motors diversify greatly even within a specific type. Modeling the motors with better accuracy is needed.
c) Taking power electronics into consideration. Power electronics should be
regarded as an integral part of the motor. Past experience shows that power electronics, motor, and transmission roughly account for the same percentage of weight in an actuator. This is not true in this study because of the large transmission weight caused by massive output force requirement. However, the importance of power electronics should not be underestimated.
d) Control logics and failure diagnosis research. Landing gear control logics may be
affected by the use of more-electric actuators. The extensive use of electrical components facilitates better failure diagnosis. System fault detection and segregation enhancement could result in better dispatch reliability.
e) More detailed components design. The component design in this study was quite
simplified. For example, brakes and clutches are important for EMA, but they were not addressed in this study. More detailed analysis of these components could yield more real results.

95
Reference 1. Lester Faleiro. Beyond the More Electric Aircraft. Aerospace America.
September 2005. 2. J.A.Rosero; J.A.Ortega; E.Aldabas; L.Romeral. Moving Towards a More
Electric Aircraft. IEEE A&E systems magazine, March 2007. 3. I.Moir. More-Electric Aircraft-System Consideration. IEE. 1999. 4. Alain Coutrot. Key Technology Enablers for the Future of Aeronautical
Equipment Industry. ICAS. 2006. 5. R.I.Jones. The More Electric Aircraft-Assessing the Benefits. Aerospace
Engineering, IMechE. 2002. 6. R.I.Jones. The More Electric Aircraft: the Past and the future. IEE. 1999. 7. David Blanding. Subsystem Design and Integration for the More Electric
Aircraft. AIAA 2007-4828. 2007. 8. Gale.R.Sundberg. Civil Air Transport: a Fresh Look at Power-By-Wire and
Fly-By-Light. NASA Technical Memorandum 102574. NASA Lewis Research Center, Cleveland, Ohio. 1985.
9. J.S.Montero. Yanez. Advances in Onboard System Technology. Page 196 to
256. EC Aeronautics Research Series. Wiley. 1996. 10. Miguel.A.Maldonado. Power Management and Distribution System for a
More-Electric Aircraft(MADMEL)-Program Status. IEEE. 1996. 11. James.S.Cloyd. A Status of the United States Air Force’s More Electric
Aircraft Initiative. IEEE AES Systems Magazine, April 1998. 12. C.R.Avery; S.G.Burrow; P.H.Mellor. Electrical Generation and Distribution
for the More Electric Aircraft. IEEE. 2007. 13. Patrick. Monclar. Technology Programs for Landing Gear Systems. AIAA.
2003. 14. Messier-Dorty Company Website (2008). Available at:
http://www.messier-dowty.com/.

96
15. Messier-Bugatti Company Website (2008). Available at: http://www.messier-bugatti.com/article.php3?id_article=675&lang=en.
16. The Boeing Company Website (2008). Available at: http://www.boeing.com/.
17. Norman S. Currey. Landing Gear Design Handbook. Lockheed-Georgia
Company. 1982. 18. Norman S. Currey. Aircraft Landing Gear Design: Principles and Practices.
Lockheed-Georgia Company. 1988. 19. The Boeing Company. Jet Transport Performance Method. Seventh Edition.
1989. 20. P. Stocking. MRT7 ‘Harbinger’ Military Air-To-Air Refueling Tanker with
‘Meridian’ Civil Transport Variants, Project Executive Summary. Cranfield University. 2008.
21. Jasbir Dhillon. Main Landing Gear of MRT7-3 and MRT7-3R. (Cranfield
MSc Thesis). Cranfield University. 2008. 22. The Boeing Company. Boeing 787 From the Ground Up. AERO
QUARTERLY QTR_04. Boeing Commercial Airplanes, Seattle, Washington. 23. The Boeing Company. 707 Airplane Characteristics for Airport Planning.
Boeing Commercial Airplanes, Seattle, Washington. 24. The Boeing Company. 727 Airplane Characteristics for Airport Planning.
Boeing Commercial Airplanes, Seattle, Washington. 25. The Boeing Company. 737 Airplane Characteristics for Airport Planning.
Boeing Commercial Airplanes, Seattle, Washington. 26. The Boeing Company. 747 Airplane Characteristics for Airport Planning.
Boeing Commercial Airplanes, Seattle, Washington. 27. The Boeing Company. 757 Airplane Characteristics for Airport Planning.
Boeing Commercial Airplanes, Seattle, Washington. 28. The Boeing Company. 767 Airplane Characteristics for Airport Planning.
Boeing Commercial Airplanes, Seattle, Washington. 29. The Boeing Company. 787 Airplane Characteristics for Airport Planning.

97
Boeing Commercial Airplanes, Seattle, Washington. 30. Airbus. A330 Airplane Characteristics for Airport Planning. Airbus S.A.S,
Blagnac Cedex, France. 2002. 31. SAE International. Landing Gear System Development Plan. Revision A. SAE
aeronautical information report AIR 1598. Society of Automotive Engineers (SAE), Warrendale, PA, USA. 1990.
32. SAE International. Aerospace-Commercial Aircraft Hydraulic Systems. SAE
aeronautical information report AIR 5005. Society of Automotive Engineers (SAE), Warrendale, PA, USA. 2003.
33. SAE International. Aerospace-Military Aircraft Hydraulic Systems. SAE
aeronautical information report AIR 1899. Revision A. Society of Automotive Engineers (SAE), Warrendale, PA, USA. 2001.
34. SAE International. Electrical Actuation Systems for Aerospace and Other
Applications. SAE aeronautical information report AIR 5005. Society of Automotive Engineers (SAE), Warrendale, PA, USA. 1991.
35. SAE International. Certification Considerations for Highly-Integrated Or
Complex Aircraft Systems. SAE aeronautical information report AIR 4754. Society of Automotive Engineers (SAE), Warrendale, PA, USA. 1996.
36. Kenneth.E.Schreiner. Electro-Mechanical Actuator-DC Resonant Link
Controller. NASA Contract Report 198510. 1996. 37. PO Jemitola. Field & Flight Performance of MRT7-T Multi-Roll Tanker
Aircraft. (Cranfield MSc Thesis). Cranfield University. 2008. 38. H.Wayne Beaty; James L.Kirtley,Jr. Electric Motor Handbook. McGraw-Hill
Handbooks 39. William H.Yeadon,P.E; Alan W.Yeadon,P.E. Handbook of Small Electric
Motors. McGraw-Hill 40. A.E.Fitzgerald;Charles Kingsley,Jr;Stephen D.Umans. Electric Machinery,
Sixth Edition. McGrwa-Hill Higher Education,2003 41. Vickers Fluid Systems. A Descriptive Summary of Vickers Inline Pumps and
their Applications. Eaton Aerospace. 2000. 42. SKF group. Roller Screws. 2005.
98
43. Warren C.Yong; Richard G.Budynas. Roark's Formulas for Stress and Strain,
Seventh Edition. McGraw-Hill. 2003. 44. Wittenstein company. Produce Brochure 2008. 45. FAA. Federal Aviation Regulation Part 25. 2008. 46. SAE International. 8000psi Hydraulic Systems: Experience and Test Results.
SAE AIR 4002. Society of Automotive Engineers (SAE), Warrendale, PA, USA.
47. SAE International. Hydraulic Systems, Aircraft, Design and Installation
Requirements For. SAE AS5440. Society of Automotive Engineers (SAE), Warrendale, PA, USA.
48. US Department of Defence. Reservoirs, Aircraft and Missile, Hydraulic,
Separated Type. MIL-R-8931. 49. Vickers Fluid Systems. Eaton ACMP Brochures. Eaton Aerospace. 2000. 50. US Department of Defence. Aircraft Electric Power Characteristics.
MIL-STD-704F. 1991. 51. SAE International. Fire resistant phosphate ester hydraulic fluid for aircraft,
rev C. Society of Automotive Engineers (SAE), Warrendale, PA, USA. 1997. 52. Fu Lei. Active Power Management for All-Electric Aircraft. (Cranfield MSc
Thesis). Cranfield University. 2009. 53. http://www.exxonmobil.com/lubes/exxonmobil/emal/files/HyJetV_Data_Shee
t.pdf 54. John P.Fielding. Introduction to Aircraft Design. Cambridge University Press,
1999. 55. Rui Miguel Martins Pipes. Design Methodology for Wing Trailing Edge
Device Mechanisms. (Cranfield Phd Thesis). Cranfield University. 2007. 56. Ronald Slingerland; Sijmen Zandstra. Green Freighter Systems. 46th AIAA
Aerospace Sciences Meeting and Exhibit. January 2008. 57. Malik E.Elbuluk; M.David Kankam. Motor Drive Technologies for the
Power-By-Wire(PBW) Progrem: Options, Trends and Tradeoffs. IEEE AES

99
Systems Magazine, November 1995. 58. Mary Ellen Roth. Electromechanical Actuation for Thrust Vector Control
Applications. NASA Technical Memorandum 102548. NASA Lewis Research Center, Cleveland, Ohio.
59. Greissner Carsten; Carl Udo. Control of an Electro-Hydrostatic Actuation
System for the Nose Landing gear of an “All Electric Aircraft”. Recent Advances in Aerospace Actuation Systems and Components 2004. Toulouse, November 2004.
60. Denis Howe. Aircraft Conceptual Design Synthesis. Professional Engineering
Publishing Limited, London, 2005 61. Torenbeek, E. Synthesis of Subsonic Airplane Design. Delft University Press,
The Netherlands, 1982. 62. Roskam, J. Airplane Design Part I. Preliminary Sizing of Airplanes. Roskam
Aviation and Engineering, Ottawa, Kansas, 1985. 63. Roskam, J. Airplane Design Part II Preliminary Configuration Design and
Integration of Propulsion System. Roskam Aviation and Engineering, Ottawa, Kansas, 1985.
64. Roskam, J. Airplane Design Part III. Layout Design of Cockpit, Fuselage,
Wing and Empennage Cutaways and Inboard Profiles. Roskam Aviation and Engineering, Ottawa, Kansas, 1985.
65. Roskam, J. Airplane Design Part IV. Layout Design of Landing Gear and
System. Roskam Aviation and Engineering, Ottawa, Kansas, 1985. 66. Roskam, J. Airplane Design Part V. Component Weight Estimation. Roskam
Aviation and Engineering, Ottawa, Kansas, 1985. 67. Raymer, Daniel P. Aircraft Design: A Conceptual Approach, 3rd Edition.
AIAA Education Series, 1999 68. Lloyd R. Jenkinson. Civil Jet aircraft Design. Hodder Headline, 1999 69. Michimasa Fujino. Design and Development of the HondaJet. AIAA
2003-2530. AIAA/ICAS International Air and Space Symposium and Exposition: The Next 100 Y 14-17 July 2003, Dayton, Ohio.
70. P. Douglas Arbuckle; Steven M. Sliwa. Parametric Study of a

100
Canard-Configured Transport Using Conceptual Design Optimization. NASA Technical Paper 2400, 1985.
71. Long P. Yip. Wing-Tunnel Investigation of a Full-Scale Canard-Configured
General Aviation Airplane. NASA Technical Paper 2382. 1985. 72. Paul Jackson. Jane’s All the World’s Aircraft 2004-2005. Jane’s Information
Group Limited, Sentinel House, UK. 73. Conway, H. G. Landing Gear Design. Chapman & Hall, London, 1958. 74. Sonny T. Chai; William H. Mason. Landing Gear Integration in Aircraft
Conceptual Design. NASA Report MAD 96-09-01. 75. Airbus. Airplane Characteristics for Airport Planning, A319, A320, A321.
Airbus S.A.S, Blagnac Cedex, France, 2002 76. Dunlop Gourp. Tyre Specification Guide. June, 2008 77. Cranfield Lecture Notes. 78. Robert Navarro. Performance of an Electro-Hydrostatic Actuator on the F-18
Systems Research Aircraft. NASA/TM-97-206224. NASA Dryden Flight Research Center. Edwards, California.
79. Stephen C.Jensen; Gavin D. Jenney. Flight Test Experience with an
Electromechanical Actuator on the F-18 Systems Research Aircraft. NASA Project Report. NASA Dryden Flight Research Center. Edwards, California.

101
List of Appendices Appendix A: GDP Aircraft Conceptual Design ....................................................... 102 Appendix B: GDP Landing Gear Conceptual Design ............................................. 116 Appendix C: Landing Gear Loading Calculation ................................................... 131 Appendix D: Landing Gear Actuation Time Calculation....................................... 140 Appendix E: Landing Gear Kinematics Optimization............................................ 143 Appendix F: Hydraulic Components design ............................................................ 160 Appendix G: EMA Components design.................................................................... 168

102
Appendix A: GDP Aircraft Conceptual Design
A.1 GDP Introduction
This GDP project differs from the past Cranfield University group design projects in several aspects. Firstly, it was the first time that the project started from conceptual design phase, rather than preliminary phase. Secondly, all the team members were experienced engineers from AVIC. However, most of them had not been involved in aircraft conceptual design before, so their experiences did not make their work easier. The project did not have a specification to follow in the beginning. The only requirement was: the aircraft should be a civil transporter with a seat capacity of around 130. The team had to generate their own design aims and requirements through market survey and analysis of other important issues. Standard methods and procedures commonly used in the industry were followed in the design. By the end of the design phase, a design concept was made and presented. Aircraft specification was produced. It is ready for the next group to bring it into preliminary design phase. The final design concept was named “flying crane”. It aims at both Chinese domestic market and the world market of 2020. It has benefits over its competitors especially in aspects of more comfort and better engines.
A.1.1 Project Evolution The following diagram illustrates the process of the conceptual design project.
Figure A-1: Proceeding of the GDP project

103
The design process was consisted of four phases. Each phase had its tasks to be accomplished. However, as the nature of conceptual design, all the works were dynamic and constantly iterating. The team could only summarize and finalize the design when they entered the final stage.
A.1.2 Work of the Author The author’s work in each phase is illustrated by the following diagram:
Figure A-2: The author’s work in GDP project
The author’s main works in the design team could be summarized as following
a) Requirement generation. b) Over-wing mounted engine aircraft configuration design c) The “flying crane” aircraft geometry design d) Landing gear conceptual design.
A.2 GDP Phase One Activities
A.2.1 Phase One Introduction The main task of GDP phase one was to generate the requirements for the aircraft. This task was accomplished in two steps. In the first step, market survey was performed. The whole team was divided into several sub-groups. Each group covered one aspect of the survey, namely, general characteristics, performance, aerodynamics, geometry, manufacturers and operators. Large amount of data was collected and sorted properly. The scope of the data covered all the existing aircraft which have the seat capacity of around 130. In the second step, aircraft requirements were proposed and compared based on the
104
analysis of the available data. By the end of the first phase, a database was set up. It contains information on all aspects of civil aircraft and market. This database gave a lot of benefits to the design team later on. Also, initial requirements such as seat capacity and range were argued and finalized.
A.2.2 Work of the Author in Phase One The author’s work in this phase contains the following parts: a) Data collection. The data of Bombardier series, McDonnell Douglas series, and
Russian civil aircraft was collected and sorted. b) Performance requirement generation. Based on the analysis of the market, a
proposal of the performance requirements was presented. For seat capacity, a 130-seat five abreast configuration, and a 150-seat six abreast configuration were proposed. For the design range requirement, 2500nm seemed to be reasonable. Later on, the 150-seat configuration was adopted, and the design range was modified to be 2000nm [72].
A.3 GDP Phase Two Activities
A.3.1 Phase Two Introduction The aim of the second phase was to validate the requirements. Four individual design teams were formed, each responsible for a possible solution of the requirement. The four configurations were:
a) Single-aisle conventional configuration(blue team) b) Twin-aisle conventional configuration(yellow team) c) Upper-wing mounted engine, configuration(golden team) d) Longer range single aisle configuration(red team)
At the end of the second phase, a competition was made among the four configurations. A matrix was used to score the designs. The single-aisle conventional and twin-aisle conventional aircraft won the competition.
A.3.2 Work of the Author in Phase Two The author was in the golden team. He was responsible for configuration and wing design of the upper-wing mounted engine aircraft. Two configurations were produced, firstly a canard configuration, and then a T-tail configuration. Knowledge from reference [60] through [68] was used in the design. Prior to the configuration design, a requirement matrix was produced:
a) The aircraft must provide major improvement than the existing ones.
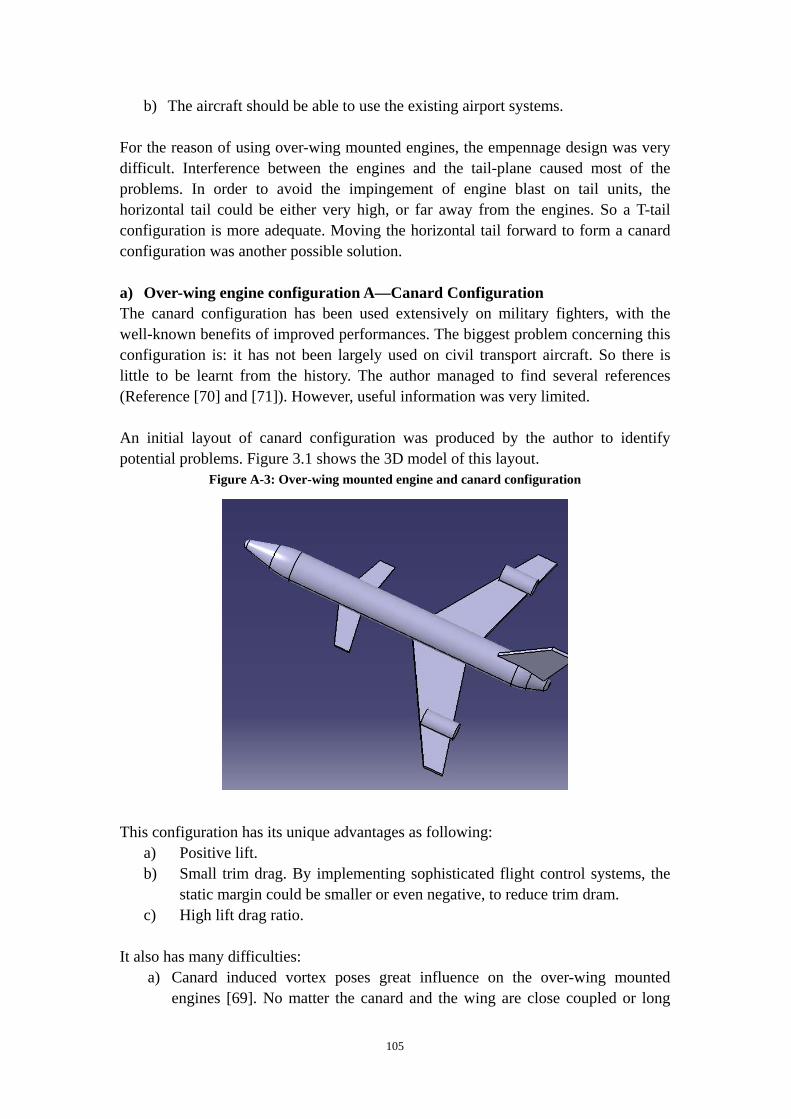
105
b) The aircraft should be able to use the existing airport systems. For the reason of using over-wing mounted engines, the empennage design was very difficult. Interference between the engines and the tail-plane caused most of the problems. In order to avoid the impingement of engine blast on tail units, the horizontal tail could be either very high, or far away from the engines. So a T-tail configuration is more adequate. Moving the horizontal tail forward to form a canard configuration was another possible solution. a) Over-wing engine configuration A—Canard Configuration The canard configuration has been used extensively on military fighters, with the well-known benefits of improved performances. The biggest problem concerning this configuration is: it has not been largely used on civil transport aircraft. So there is little to be learnt from the history. The author managed to find several references (Reference [70] and [71]). However, useful information was very limited. An initial layout of canard configuration was produced by the author to identify potential problems. Figure 3.1 shows the 3D model of this layout.
Figure A-3: Over-wing mounted engine and canard configuration
This configuration has its unique advantages as following:
a) Positive lift. b) Small trim drag. By implementing sophisticated flight control systems, the
static margin could be smaller or even negative, to reduce trim dram. c) High lift drag ratio.
It also has many difficulties:
a) Canard induced vortex poses great influence on the over-wing mounted engines [69]. No matter the canard and the wing are close coupled or long

106
coupled, the influence was difficult to eliminate. The only solution might be, moving the engines outwards from the fuselage. This in turn causes difficulties on ETOPS operation. And the fin area must be increased, bring in mass and drag penalties.
b) Canard control is complicated and maintenance intensive. To reduce the
effects of canard induced vortex on the engines, it is favorable to keep the canard to be small. In that case, either sophisticated flap system or all-move canard should be used to produce enough trimming force. Both of these approaches are not favorable from the standing point of manufacturers and operators.
c) Large CG travel is hard to accommodate. The trimming ability of the aircraft
is limited by the size and efficiency of the canard. As a result, there must be a restriction on passenger and fuel loading.
d) Landing gear disposition is hard. The CG point moves backwards relative to
the wing, so it is hard to locate the main landing gear in the wing extension area.
e) The canard blocks the access to the passenger door.
f) Fuselage is hard to extend. So, it is unlikely to grow the aircraft into a family.
g) Not enough data and experiences available for the conceptual design.
h) Market response would be unpredictable because of the peculiar look.
The author tried hard to address these problems, but at last a conclusion was drawn that the canard configuration was unlikely to succeed. So, he made a shift to the more conservative T-tail configuration. b) Over-wing engine configuration B—T-tail Configuration After the initial configuration study of T-tail configuration, it seemed that the engine blast had limited influence on the empennage. And the configuration seemed to be promising. Figure 2 shows the 3D model of the over-wing mounted engine and T-tail configuration.
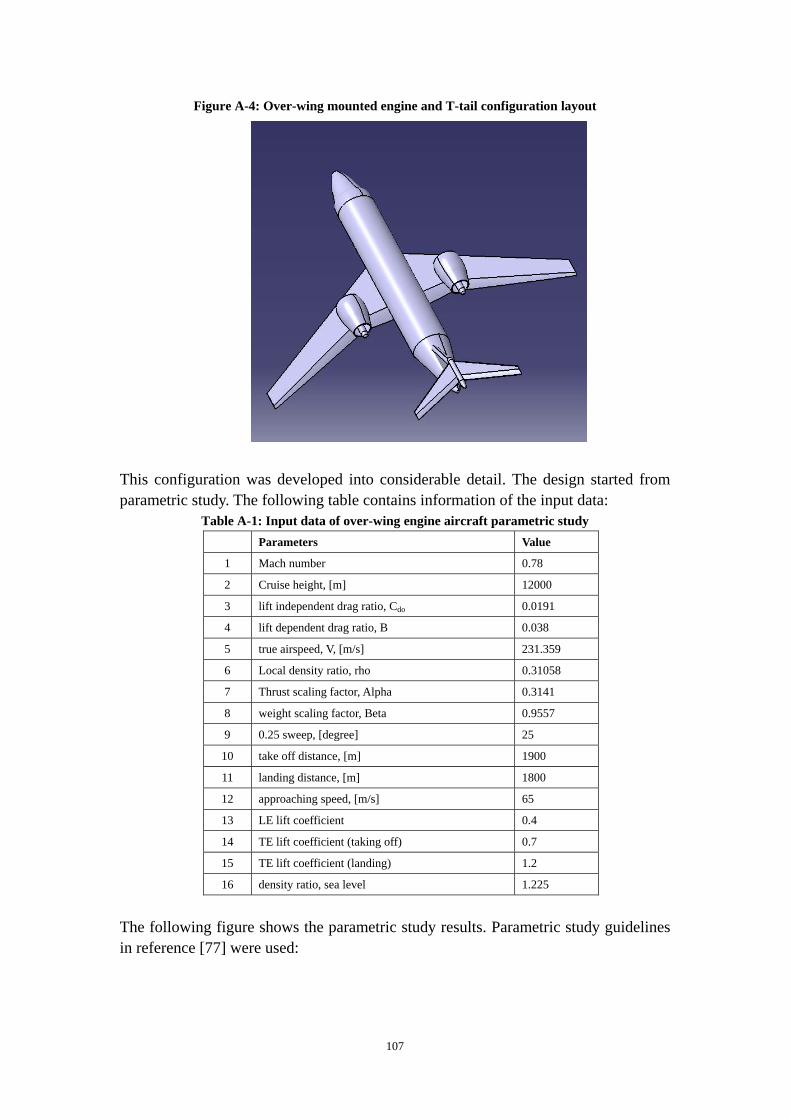
107
Figure A-4: Over-wing mounted engine and T-tail configuration layout
This configuration was developed into considerable detail. The design started from parametric study. The following table contains information of the input data:
Table A-1: Input data of over-wing engine aircraft parametric study Parameters Value
1 Mach number 0.78
2 Cruise height, [m] 12000
3 lift independent drag ratio, Cdo 0.0191
4 lift dependent drag ratio, B 0.038
5 true airspeed, V, [m/s] 231.359
6 Local density ratio, rho 0.31058
7 Thrust scaling factor, Alpha 0.3141
8 weight scaling factor, Beta 0.9557
9 0.25 sweep, [degree] 25
10 take off distance, [m] 1900
11 landing distance, [m] 1800
12 approaching speed, [m/s] 65
13 LE lift coefficient 0.4
14 TE lift coefficient (taking off) 0.7
15 TE lift coefficient (landing) 1.2
16 density ratio, sea level 1.225
The following figure shows the parametric study results. Parametric study guidelines in reference [77] were used:

108
Figure A-5: Over-wing engine aircraft parametric study
0
0.1
0.2
0.3
0.4
0.5
0.6
0.7
0.8
0.9
1
0 1000 2000 3000 4000 5000 6000 7000 8000 9000 10000
W/S
T/W
cruiseCase 2Case 3Case 4Case 5Case 6Case 7Case 8Case 9Case 102nd Segtake offlanding
From the parametric study, the wing loading is 568 kg/m2, and thrust weight ratio is 0.28. Given the MTOW estimation results finished by other team members, the author made the following design:
Table A-2: Over-wing engine aircraft design results datasheet 1 General input
MTOW, [kg] 62700
wing loading, [kg/m2] 568
cruise altitude, [m] 12000
cruise mach number 0.78
cruise speed, V, [m/s] 230.15
cruise air density, [kg/m3] 0.31752
2 wing design
wing area, S, [m2] 110.39
cruise lift ratio, CLcr 0.49
aspect ratio, A 10
wing span, B, [m] 33.22
taper ratio 0.25
1/4 chord angle, [degree] 25
root thickness ratio 0.13
tip thickness ratio 0.11
dihedral angle, [degree] 3
incidence angle, [degree] 2
twist angle, [degree] -2
root chord, [m] 5.32
tip chord, [m] 1.33

109
MAC, [m] 3.323
front spar location, [MAC] 0.2
rear spar location, [MAC] 0.695
control surface hinge line location, [MAC] 0.7
3 high lift device
flap chord, [MAC] 0.3
span ratio, [span] 0.8
flap angle, [degree] 10,40
flap type double slot
4 fuel volume calculation
fuel density, [T/m3] 0.785
fuel mass needed, [kg] 15971
fuel volume needed, [m3] 20.35
calculated wing fuel volume, [m3] 21.14
extra volume 3.9%
5 horizontal tail
Xh, [m] 13
Vh 0.8
Se/Sh 0.25
Sh , [m2] 22.57
Aspect ratio 3
leading edge swept angle, [degree] 35
taper ratio 0.4
thickness ratio 0.12
dihedral angle, [degree] 0
airfoil NACA 0012
Span, [m] 5.82
MAC, [m] 1.94
root chord, [m] 2.77
tip chord, [m] 1.11
6 vertical tail
Xv, [m] 12
Vv 0.09
Sr/Sv 0.25
Sv, [m2] 27.51
aspect ratio 1.5
leading edge swept angle, [degree] 50
taper ratio 0.75
thickness ratio 0.15
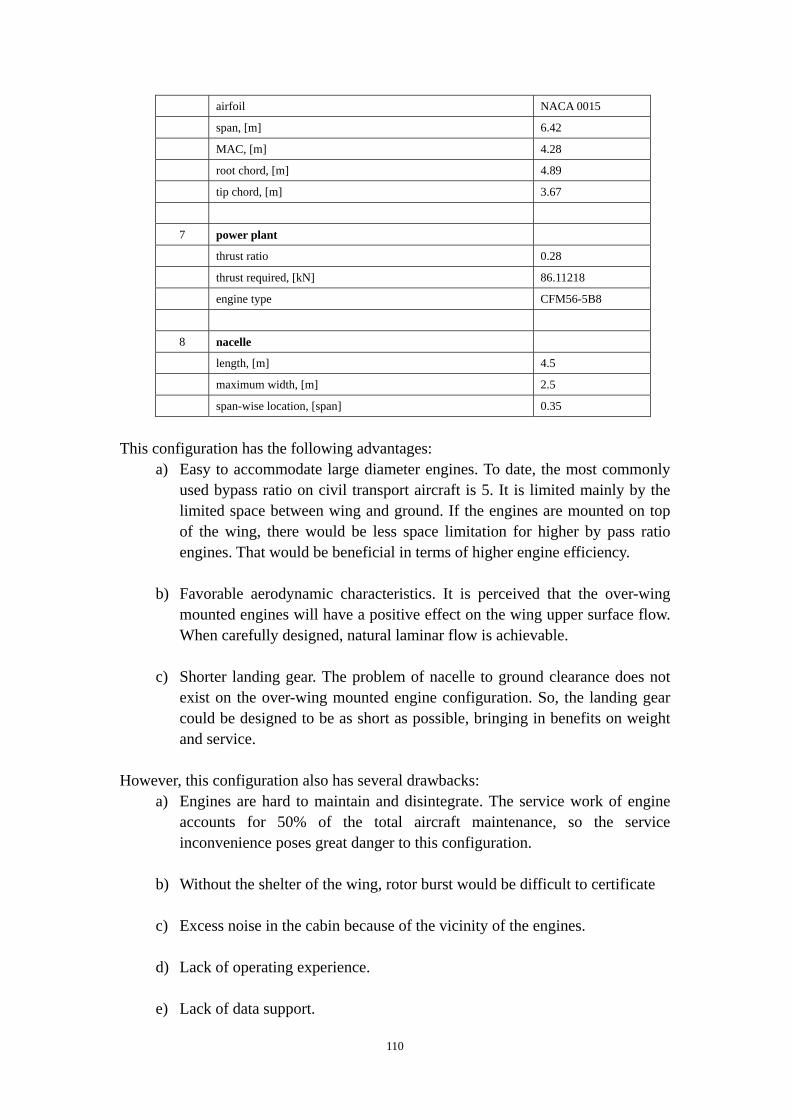
110
airfoil NACA 0015
span, [m] 6.42
MAC, [m] 4.28
root chord, [m] 4.89
tip chord, [m] 3.67
7 power plant
thrust ratio 0.28
thrust required, [kN] 86.11218
engine type CFM56-5B8
8 nacelle
length, [m] 4.5
maximum width, [m] 2.5
span-wise location, [span] 0.35
This configuration has the following advantages:
a) Easy to accommodate large diameter engines. To date, the most commonly used bypass ratio on civil transport aircraft is 5. It is limited mainly by the limited space between wing and ground. If the engines are mounted on top of the wing, there would be less space limitation for higher by pass ratio engines. That would be beneficial in terms of higher engine efficiency.
b) Favorable aerodynamic characteristics. It is perceived that the over-wing
mounted engines will have a positive effect on the wing upper surface flow. When carefully designed, natural laminar flow is achievable.
c) Shorter landing gear. The problem of nacelle to ground clearance does not
exist on the over-wing mounted engine configuration. So, the landing gear could be designed to be as short as possible, bringing in benefits on weight and service.
However, this configuration also has several drawbacks:
a) Engines are hard to maintain and disintegrate. The service work of engine accounts for 50% of the total aircraft maintenance, so the service inconvenience poses great danger to this configuration.
b) Without the shelter of the wing, rotor burst would be difficult to certificate
c) Excess noise in the cabin because of the vicinity of the engines.
d) Lack of operating experience.
e) Lack of data support.

111
It turned out that the greatest obstacles for the over-wing mounted engine and T-tail configuration was the shortage of data support. The perceived aerodynamic benefits could not be evaluated quantitatively because not enough data was available. As a result, this configuration did not survive in the competition.
A.4 GDP Phase Three Activities
A.4.1 Phase Three Introduction In the third phase, the surviving two designs were developed into more detail. The group was divided into two teams for these two aircraft. That is, the “Amber team” for the twin-aisle conventional aircraft, and the “Jade team” for the single-aisle conventional aircraft. The two designs were crossed checked regularly to find out hidden faults and problems. At the end of the third phase, a final competition was held between the two designs. After that, the two teams came into consensus to develop the final aircraft on the basis of the “Amber” aircraft. However this aircraft was to some extent redesigned. The good points of the “Jade” aircraft were also adopted in the design activities.
A.4.2 Work of the Author in Phase Three The author worked in the “Amber team” in this phase. The author was responsible for engine integration and landing gear design (Please refer to Appendix B).
A.5 GDP Phase Four Activities
A.5.1 Phase Four Introduction In the fourth phase, the design was brought into more detail. It grew into a complete conceptual design. The aircraft was named “flying crane” since then.
A.5.2 Work of the Author in Phase Four The author’s work in this phase contains the following:
a) Landing gear design. b) Aircraft geometry design. c) Engine integration.
Because of page limitation, only the design results were presented in this report. a) 3D View Drawings The following figures show the 3-view drawings of the “flying crane”.

112
Figure A-6: Plan view of “flying crane”
Figure A-7: Side view of “flying crane”

113
Figure A-8: Front view of “flying crane”
b) Major Components Geometry The following figures illustrate the geometry of the major components:
Figure A-9: Fuselage geometry of “flying crane”

114
Figure A-10: Wing geometry of “flying crane”
Figure A-11: Tail geometry of “flying crane”

115
Figure A-12: Fin geometry of “flying crane”
c) Engine Installation The following figure illustrates the nacelle installation:
Figure A-13: Nacelle installation of “flying crane”
A.6 GDP Summary
After the four phases, the conceptual design was finished. All the drawings, calculations and analysis were ready for presentation. As no major problem was found, the team concluded that the final design was feasible.
116
Appendix B: GDP Landing Gear Conceptual
Design
B.1 Introduction
The landing gear design for “flying crane” was a real challenge for the author. The aircraft maximum take off weight fluctuated dramatically during the design process, so did the geometry design. As a result, the landing gear design was constantly changing. However, the final design of the landing gear fitted exceptionally well with the aircraft. The landing gear design for the “flying crane” has its unique features. It was largely driven by two factors: the implementation of large diameter engines, and the family issues. The landing gear design lasted for several design phases, but the work was continuous and consistent. The final result of the design was reported in the following paragraphs. The author designed the landing gear for the “flying crane” with heavy reliance on reference [17], [18], [73] and [74].
B.2 Landing Gear Configuration Selection
The landing gear of “flying crane” is of tricycle type. For civil transport aircraft, tricycle landing gear configuration has been exceptionally used to date. And there is no serious reason to derivate from it. This was particularly true provided that the “flying crane” had a rather conventional configuration design. With the estimated maximum take off weight of around 65 tons, the landing gear strut and wheel numbers were determined based on the past aircraft data. The nose landing gear is composed of one strut and two wheels. The main landing gear has two struts, with two wheels per strut. The landing gear 3D models are shown in the following figures:
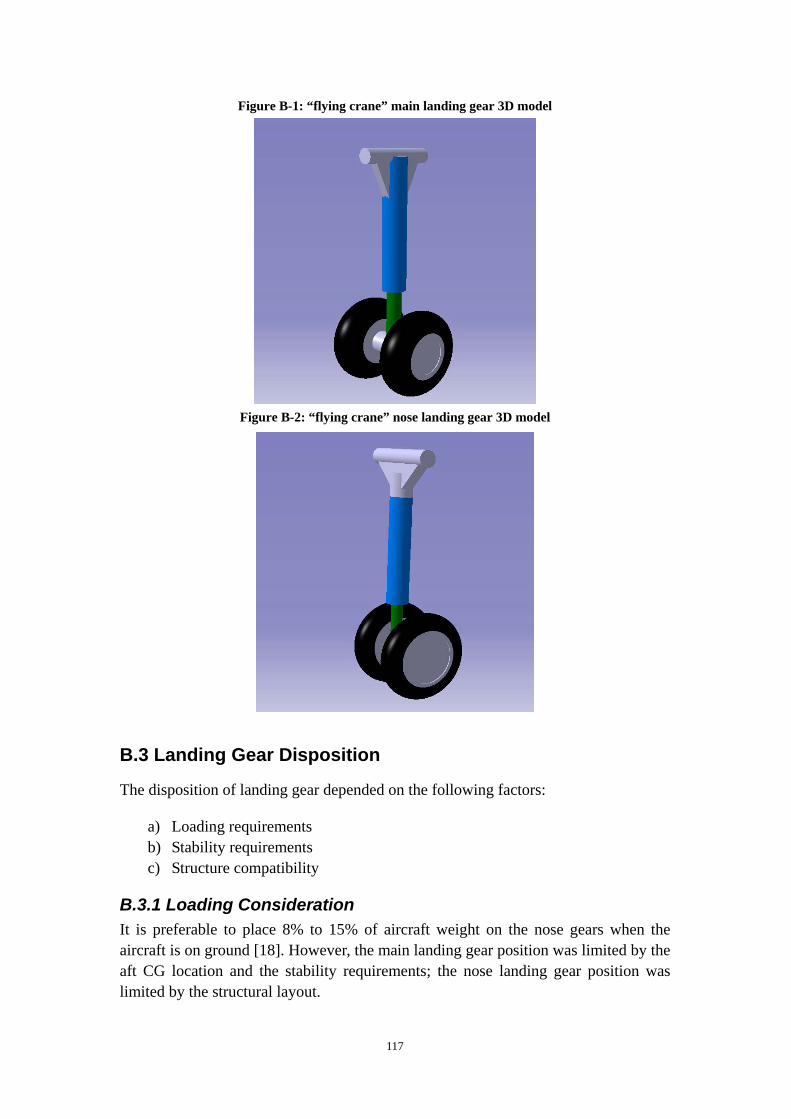
117
Figure B-1: “flying crane” main landing gear 3D model
Figure B-2: “flying crane” nose landing gear 3D model
B.3 Landing Gear Disposition
The disposition of landing gear depended on the following factors:
a) Loading requirements b) Stability requirements c) Structure compatibility
B.3.1 Loading Consideration It is preferable to place 8% to 15% of aircraft weight on the nose gears when the aircraft is on ground [18]. However, the main landing gear position was limited by the aft CG location and the stability requirements; the nose landing gear position was limited by the structural layout.
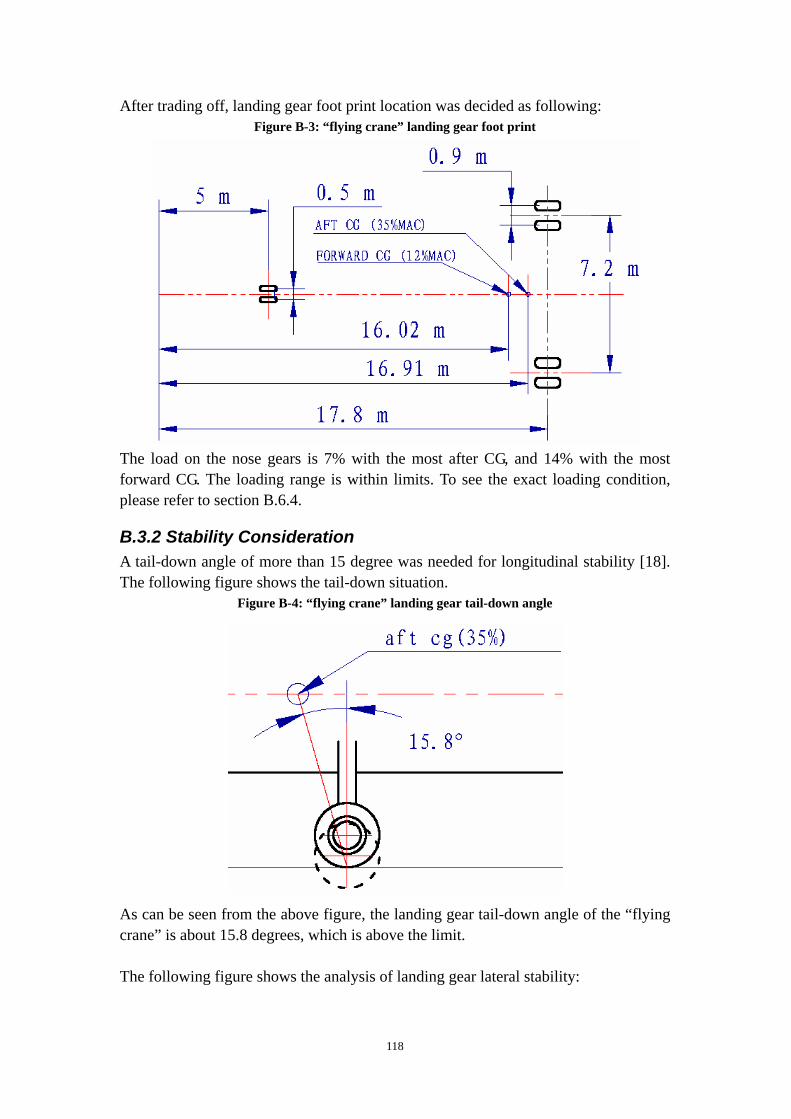
118
After trading off, landing gear foot print location was decided as following: Figure B-3: “flying crane” landing gear foot print
The load on the nose gears is 7% with the most after CG, and 14% with the most forward CG. The loading range is within limits. To see the exact loading condition, please refer to section B.6.4.
B.3.2 Stability Consideration A tail-down angle of more than 15 degree was needed for longitudinal stability [18]. The following figure shows the tail-down situation.
Figure B-4: “flying crane” landing gear tail-down angle
As can be seen from the above figure, the landing gear tail-down angle of the “flying crane” is about 15.8 degrees, which is above the limit. The following figure shows the analysis of landing gear lateral stability:
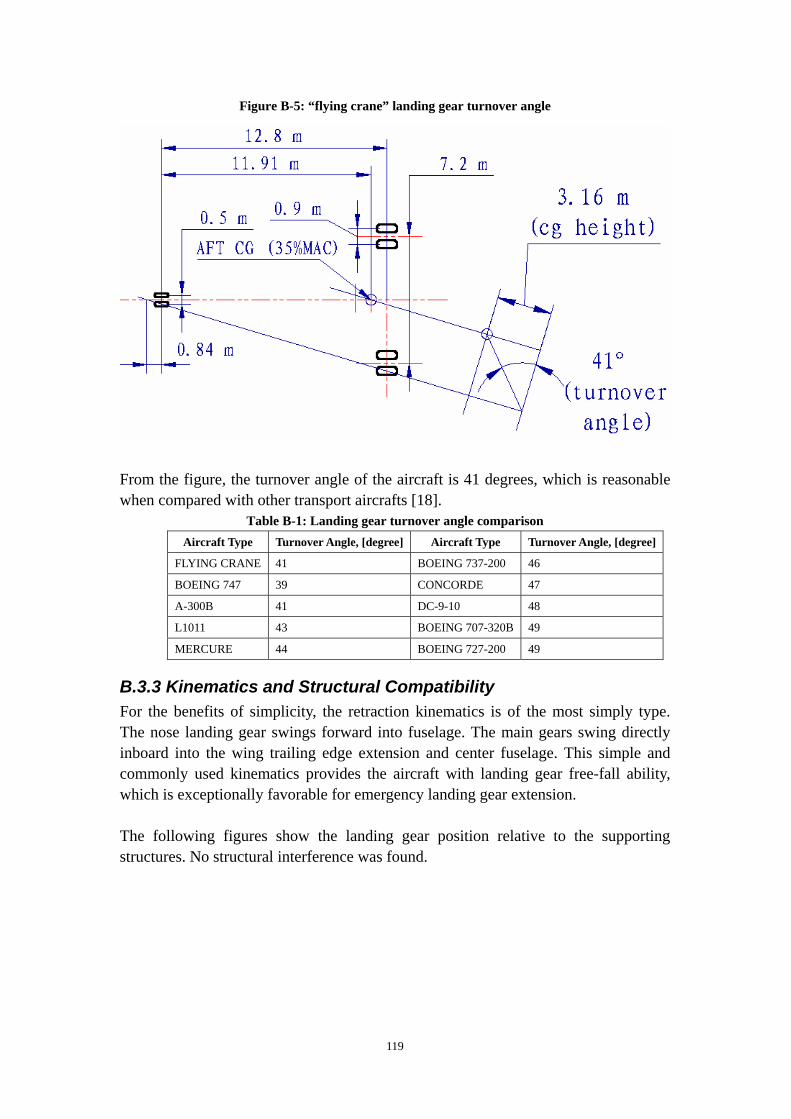
119
Figure B-5: “flying crane” landing gear turnover angle
From the figure, the turnover angle of the aircraft is 41 degrees, which is reasonable when compared with other transport aircrafts [18].
Table B-1: Landing gear turnover angle comparison Aircraft Type Turnover Angle, [degree] Aircraft Type Turnover Angle, [degree]
FLYING CRANE 41 BOEING 737-200 46
BOEING 747 39 CONCORDE 47
A-300B 41 DC-9-10 48
L1011 43 BOEING 707-320B 49
MERCURE 44 BOEING 727-200 49
B.3.3 Kinematics and Structural Compatibility For the benefits of simplicity, the retraction kinematics is of the most simply type. The nose landing gear swings forward into fuselage. The main gears swing directly inboard into the wing trailing edge extension and center fuselage. This simple and commonly used kinematics provides the aircraft with landing gear free-fall ability, which is exceptionally favorable for emergency landing gear extension. The following figures show the landing gear position relative to the supporting structures. No structural interference was found.
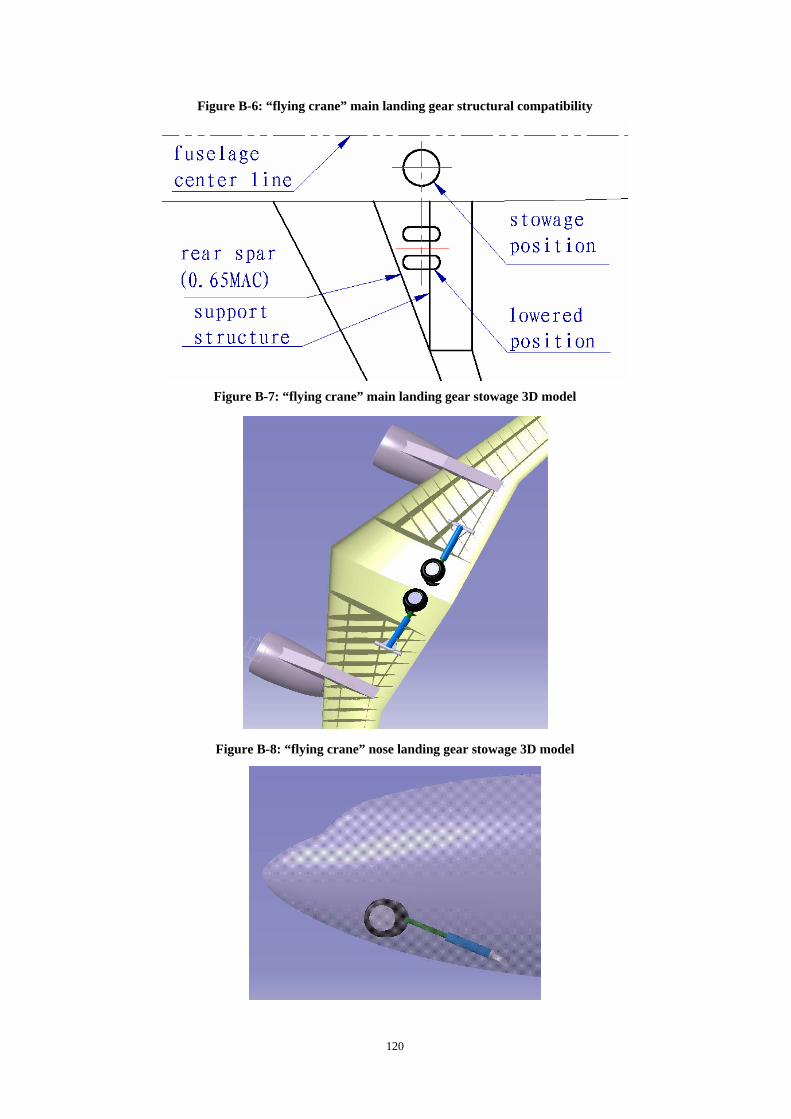
120
Figure B-6: “flying crane” main landing gear structural compatibility
Figure B-7: “flying crane” main landing gear stowage 3D model
Figure B-8: “flying crane” nose landing gear stowage 3D model
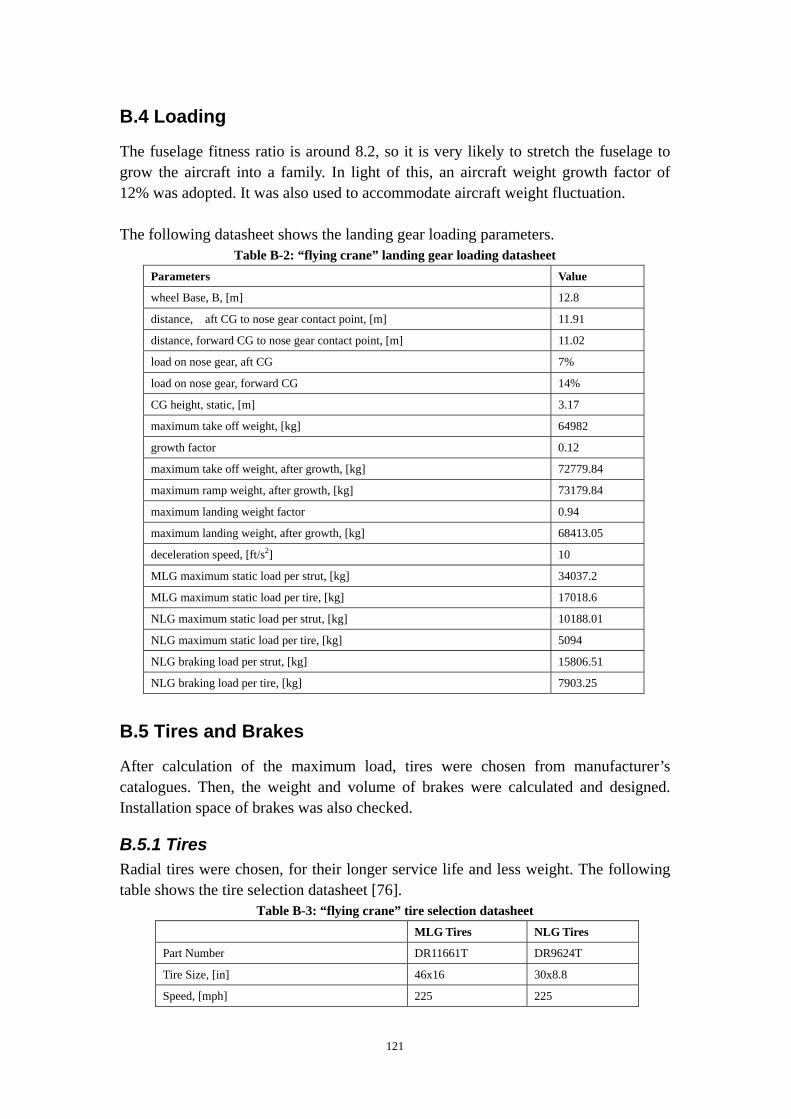
121
B.4 Loading
The fuselage fitness ratio is around 8.2, so it is very likely to stretch the fuselage to grow the aircraft into a family. In light of this, an aircraft weight growth factor of 12% was adopted. It was also used to accommodate aircraft weight fluctuation. The following datasheet shows the landing gear loading parameters.
Table B-2: “flying crane” landing gear loading datasheet Parameters Value
wheel Base, B, [m] 12.8
distance, aft CG to nose gear contact point, [m] 11.91
distance, forward CG to nose gear contact point, [m] 11.02
load on nose gear, aft CG 7%
load on nose gear, forward CG 14%
CG height, static, [m] 3.17
maximum take off weight, [kg] 64982
growth factor 0.12
maximum take off weight, after growth, [kg] 72779.84
maximum ramp weight, after growth, [kg] 73179.84
maximum landing weight factor 0.94
maximum landing weight, after growth, [kg] 68413.05
deceleration speed, [ft/s2] 10
MLG maximum static load per strut, [kg] 34037.2
MLG maximum static load per tire, [kg] 17018.6
NLG maximum static load per strut, [kg] 10188.01
NLG maximum static load per tire, [kg] 5094
NLG braking load per strut, [kg] 15806.51
NLG braking load per tire, [kg] 7903.25
B.5 Tires and Brakes
After calculation of the maximum load, tires were chosen from manufacturer’s catalogues. Then, the weight and volume of brakes were calculated and designed. Installation space of brakes was also checked.
B.5.1 Tires Radial tires were chosen, for their longer service life and less weight. The following table shows the tire selection datasheet [76].
Table B-3: “flying crane” tire selection datasheet MLG Tires NLG Tires
Part Number DR11661T DR9624T
Tire Size, [in] 46x16 30x8.8
Speed, [mph] 225 225

122
Max Load, [lbs] 44800 14200
Inflation Pressure Loaded, [psi] 234 203
Inf Dim OD Max, [in] 45.25 30.4
Inf Dim Width Max, [in] 16 8.9
actual speed, [mph] 140 140
actual loading, [lbs] 37519.6 11230.36
load reserve factor 19.4% 26.4%
actual tire press, MTOW, [psi] 175 143
tire press, (1+0.12)MTOW, [psi] 196 161
As shown above, the chosen tires have 19.4% and 26.4% excess loading abilities respectively than actually needed. This is from the consideration of lower inflation pressure, which provides better floatation and tire service life.
B.5.2 Brakes On modern aircrafts, carbon brakes have been extensively used for various benefits. The author could only get access to the data of steel brakes and the scale factors of steel brakes to carbon brakes. So, the design process started with calculation of required steel heat sink. Then estimation of carbon equivalents was performed. Method and data suggested by reference [74] was used in calculation. For the first step, the required steel heat sink weight and volume was calculated (table 6.4). The following parameters were used in the calculation:
a) Air density: 1.225kg/m3. b) Wing area: 118m2. c) Maximum landing lift coefficient: 3.
Table B-4: “flying crane” steel brakes heat sink calculation Parameters Design Landing Weight MTOW Rejected Takeoff
weight of the aircraft, [kg] 50581.0 68413.0 72779.8
stalling speed, [m/s] 45.0 52.3 54.0
Power-off stalling speed, [m/s] 54.0 62.8 64.8
kinetic energy, [J] 73754500.8 134924744.8 152698896.4
brake assemble weight, [lb] 540.0 640.0 440.0
averaged brake assemble weight, [kg] 290.3
brake assemble volume estimation,
[L] 33.2590552
In the second step, scale factors were applied to calculate the weight and volume of required carbon brakes (table B.5).

123
Table B-5: “flying crane” carbon brakes heat sink calculation Parameters Value
weight scaling factor, carbon to steel 0.40
volume scaling factor, carbon to steel 1.28
carbon brake assembly weight, [kg] 116.12
carbon brake assembly volume, [in3] 2597.89
heat sink volume/in3, [in2] 136.70
heat sink width/per wheel, [m] 0.12
width envelope, [m] 0.19
In the third step, the envelope was checked with the respective wheel rim width.
Table B-6: “flying crane” brake installation space check Parameters Value
width envelope, [m] 0.19
rim width, [inch] 0.343
envelope compared, [inch] 0.153
As can be seen from the table above, there is enough space for the carbon brakes.
B.6 Shock Absorber Design
Shock absorber is the major component of the landing gear. It decides most of the landing gear characteristics. As a result, it was important to finish the initial sizing work of it in the conceptual design phase.
B.6.1 Main Landing Gear Shock Absorber Design The following table contains information for the main landing gear shock absorber design:
Table B-7: “flying crane” main landing gear shock absorber design datasheet Parameters Value
sink speed ,V, [ft/s] 10.00
reaction factor ,N 1.20
lift ratio ,K 1.00
tire defection under N*W, St, [m] 0.10
tire efficiency, nt 0.47
shock strut efficiency ,ns 0.80
extra stroke, [m] 0.03
vertical wheel travel ,S, [m] 0.46
pressure ratio, static to extended 4.00
pressure ratio, compressed to static 3.00
static pressure,P2, [psi] 1500.00
Pressure when extended,P1, [psi] 375.00
Pressure when compressed,P3, [psi] 4500.00

124
Piston Area, A, [in2] 50.03
Piston Diameter, D, [m] 0.20
Displacement, Vd, [m3] 0.01
Volume of Air(compressed),V3, [in3] 82.28
Length of Gas chamber, [m] 0.042
Volume of Air(extended),V1, [in3] 987.38
Volume of Air(static),V2, [in3] 246.84
Extension ratio(static point) 0.18
extension, static, [m] 0.08
distance, static to extended, [m] 0.38
Minimum distance between bearing ends, [m] 0.507
Actual upper bearing length, [m] 0.30
Actual lower bearing length, [m] 0.30
bored Length, cylinder, [m] 1.10
Actual useful length, cylinder, [m] 1.12
Length, compressed, [m] 1.12
Length, static, [m] 1.20
Length, extended, [m] 1.58
minimum length, rod, [m] 1.06
bored diameter, [m] 0.20
The following figure shows the main landing gear shock absorber load-stroke curve.
Figure B-9: “flying crane” main landing gear load-stroke curve
MLG Load-Stroke Curve
0
50
100
150
200
250
0 1 2 3 4 5 6 7 8 9 10 11 12 13 14 15 16 17 18 19
stroke-inch
load
-100
0lbs
B.6.2 Nose Landing Gear Shock Absorber Design The following table contains information for the nose landing gear shock absorber design:
Table B-8: “flying crane” nose landing gear shock absorber design datasheet Parameters Value
Pressure ratio, braking to extended 4.00

125
Pressure ratio, compressed to braking 3.00
NLG stroke, [inch] 18.00
braking pressure,P2, [psi] 1500.00
Pressure when extended,P1, [psi] 375.00
Pressure when compressed,P3, [psi] 4500.00
Piston Area, A, [in2] 23.23
Piston Diameter, D, [m] 0.14
actual bored diameter, [m] 0.15
Displacement, Vd, [m3] 0.01
Volume of Air(compressed),V3, [in3] 38.02
Length of Gas chamber, compressed, [inch] 1.64
Volume of Air(extended),V1, [in3] 456.18
Volume of Air(braking),V2, [in3] 114.05
Extension ratio(static point) 0.18
Extension of braking point, [m] 0.08
Extension of static point, [m] 0.15
Minimum distance between bearing ends, [inch] 13.60
Actual upper bearing length, [m] 0.20
Actual lower bearing length, [m] 0.20
bored Length, cylinder, [m] 0.90
Actual length, cylinder, [m] 0.92
Length, compressed, [m] 0.92
Length, static, [m] 1.00
Length, extended, [m] 1.38
minimum length, rod, [m] 0.86
The following figure shows the nose landing gear shock absorber load-stroke curve.
Figure B-10: “flying crane” nose landing gear load-stroke curve
NLG Load-Stroke Curve
0
20
40
60
80
100
120
0 1 2 3 4 5 6 7 8 9 10 11 12 13 14 15 16 17 18 19
stroke-inch
load
-100
0lbs

126
B.7 Landing Gear Weight Estimation
The landing gear mass was estimated with several different methods to achieve a reasonable result. The landing gear was designed with a 12% MTOW growth factor. That means the landing gear is more heavy then needed. So the weight penalty needs to be known. The calculations are summarized in the following table:
Table B-9: “flying crane” landing gear weight estimation Landing Gear Assembly Weight
Method Before Growth After Growth (12%)
maximum take off weight, [kg] 64982 72780
Roskam's method, class I, [kg] 2599 2911.2
Torenbeek's method, [kg] 2548 2851.1
Currey's method I, [kg] 2809 3147
Currey's method II, [kg] 2587 2954
estimated landing gear weight, [kg] 2500
estimated weight penalty for growth, [kg] 300
landing gear weight fraction 0.038 0.034
As suggested by the four methods used above, a reasonable weight would be 2850 kg. However, it is worth noting that all these methods are based on the 1970’s technology. It is over pessimistic to use these methods on a 2020’s aircraft. Corrections were made according to the technology advancements. Taking into consideration the mass reduction effects of using carbon brakes, radial tires, and more advanced structural materials, 2500 kg would be adequate for the “flying crane”. A 300 kg weight penalty was carried by the aircraft. However, the design team agreed that it is worthy, because it gives great flexibility for the family issues.
B.8 Aircraft Floatation Analysis
Aircraft floatation was calculated with ACN-PCN method. A flotation calculation code named “COMFAA” was used in calculating data points. The floatation was compared with the Airbus A319-100 and Boeing 737-700. The following figures showed the comparison results. The tire pressure of “flying crane” used in the calculation is for the original aircraft, that is, before the growth. Because of the page limits, only the cases for CBR of “C” class are presented.

127
Figure B-11: “flying crane” ACN on rigid pavements, CBR=C class
Aircraft Classification Number--Rigid Pavement,C class
20
25
30
35
40
45
40000 45000 50000 55000 60000 65000 70000
RAMP , kg
ACNBoeing 737-700A319-100Flying Crane
Figure B-12: “flying crane” ACN on flexible pavements, CBR=C class
Aircraft Classification Number-Flexible Pavement,C class
20
25
30
35
40
45
40000 45000 50000 55000 60000 65000 70000
RAMP , kg
ACN
Boeing 737-700A319-100Flying Crane
As can be seen from the above figures, the floatation of “flying crane” is better then its major competitors.
B.9 Ground Operation Characteristics
The following figure and table illustrate the turning radii of the aircraft.
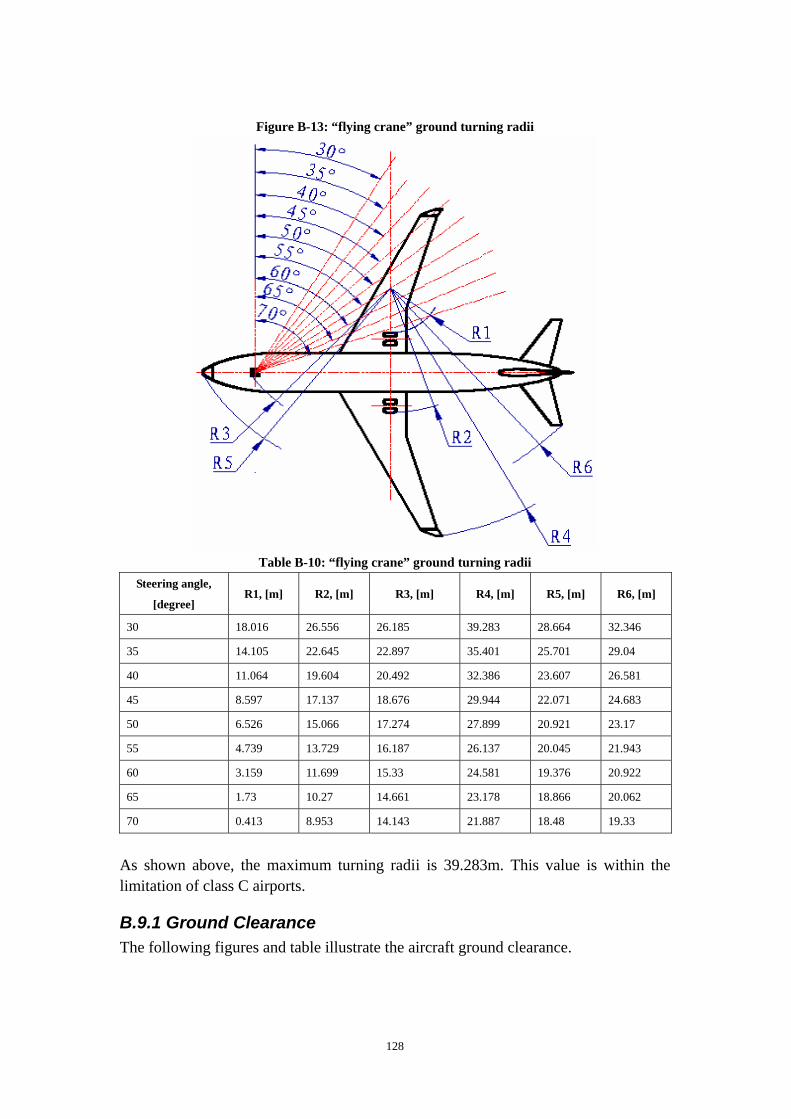
128
Figure B-13: “flying crane” ground turning radii
Table B-10: “flying crane” ground turning radii
Steering angle,
[degree] R1, [m] R2, [m] R3, [m] R4, [m] R5, [m] R6, [m]
30 18.016 26.556 26.185 39.283 28.664 32.346
35 14.105 22.645 22.897 35.401 25.701 29.04
40 11.064 19.604 20.492 32.386 23.607 26.581
45 8.597 17.137 18.676 29.944 22.071 24.683
50 6.526 15.066 17.274 27.899 20.921 23.17
55 4.739 13.729 16.187 26.137 20.045 21.943
60 3.159 11.699 15.33 24.581 19.376 20.922
65 1.73 10.27 14.661 23.178 18.866 20.062
70 0.413 8.953 14.143 21.887 18.48 19.33
As shown above, the maximum turning radii is 39.283m. This value is within the limitation of class C airports.
B.9.1 Ground Clearance The following figures and table illustrate the aircraft ground clearance.
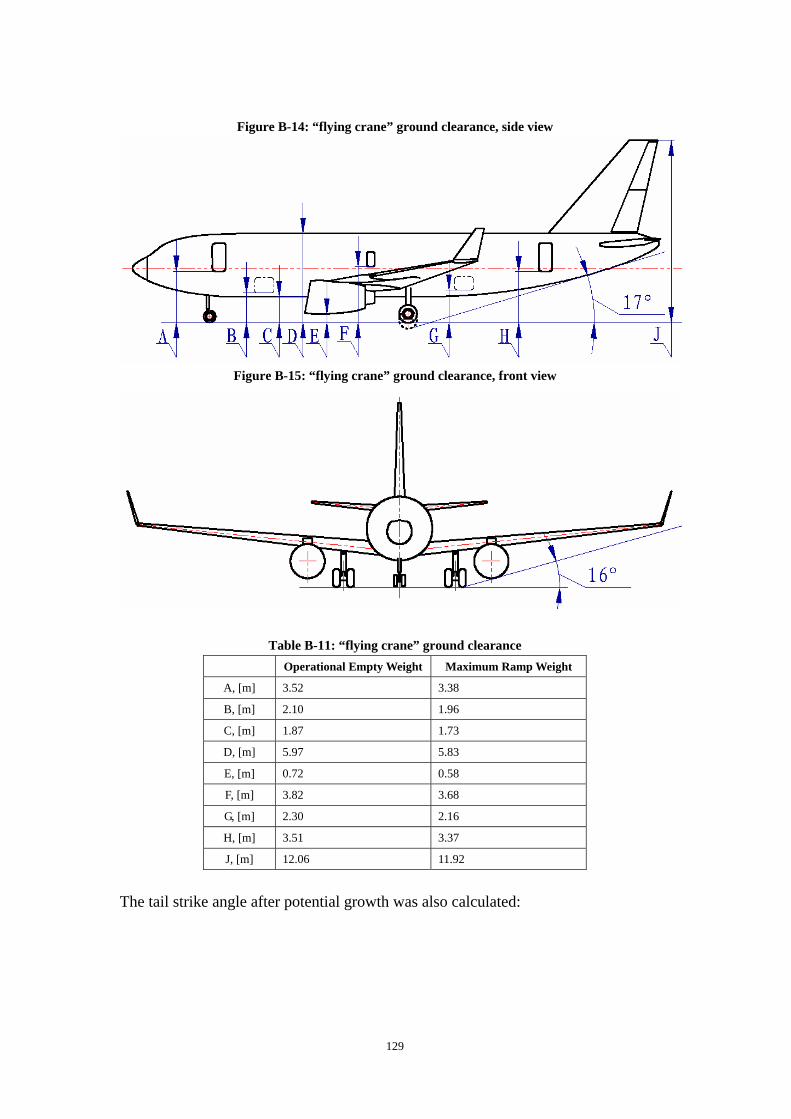
129
Figure B-14: “flying crane” ground clearance, side view
Figure B-15: “flying crane” ground clearance, front view
Table B-11: “flying crane” ground clearance
Operational Empty Weight Maximum Ramp Weight
A, [m] 3.52 3.38
B, [m] 2.10 1.96
C, [m] 1.87 1.73
D, [m] 5.97 5.83
E, [m] 0.72 0.58
F, [m] 3.82 3.68
G, [m] 2.30 2.16
H, [m] 3.51 3.37
J, [m] 12.06 11.92
The tail strike angle after potential growth was also calculated:

130
Figure B-16: “flying crane” tail strike angle after potential stretch
The tail strike angle is 14degrees after a 2m after fuselage extension. The growth potential of this aircraft from the landing gear point of view has been proven.
B.10 GDP Landing Gear Design Summary
The landing gear design was a result of close collaboration. The author tried hard to harmonize the landing gear with all other design domains. It was also a result of tradeoff and compromise. The landing gear was specially designed to accommodate large diameter engines, which gives the aircraft performance superiority over its competitors. Also, it had considered the family issues seriously. The aircraft has better floatation over its competitors, according to the analysis. The landing gear conceptual design process has been finished. No problem remains. Data is valid and reliable. The landing gear design of the “flying crane” meets with the FAR-25 and EASA-25, and also the CCAR-25.

131
Appendix C: Load Calculation Loads during landing gear retraction were calculated in this chapter. Four types of static loads and their sum were calculated. The dynamic power was estimated briefly. The following types of static load were calculated:
a) Load by gravity force; b) Load by aerodynamic force, c) Load by friction force, d) Dynamic load.
C.1 Load by Gravitation According to reference [45], the load factor for landing gear actuation equals to that of flaps in climbing condition, which is 2. So, the pivot torque caused by gravitation is:
)sin(3376781.92
)sin(θ
θ
××××=
××××=××= LmassgNarmweightNTgravity
gravityT =static torque on pivot axial caused by gravitation.
N = load factor, equals 2;
g = acceleration of gravity, 9.81m/s2;
θ = landing gear swing angle, deg, θ =0 deg when lowered and locked;
cgL = vertical distance from landing gear centre of gravity to pivot axial, when
lowered and locked, equals 3m [21];
weight = weight of landing gear;
mass = mass of landing gear, 3767kg; arm = gravity force arm with respect to landing gear pivot axial;
The above formula and conditions apply when landing gear weight distribution is laterally symmetric with respect to the pivot axial, when the landing gear is in lowered and locked position. In this study, this condition applies. As indicated by the above formula, the torque produced by gravity force is a sine function of swing angleθ . It reaches its maximum when the landing gear approaches to stowed position. The pivot torque by gravity force with respect to swing angle θ is shown in the following plot:
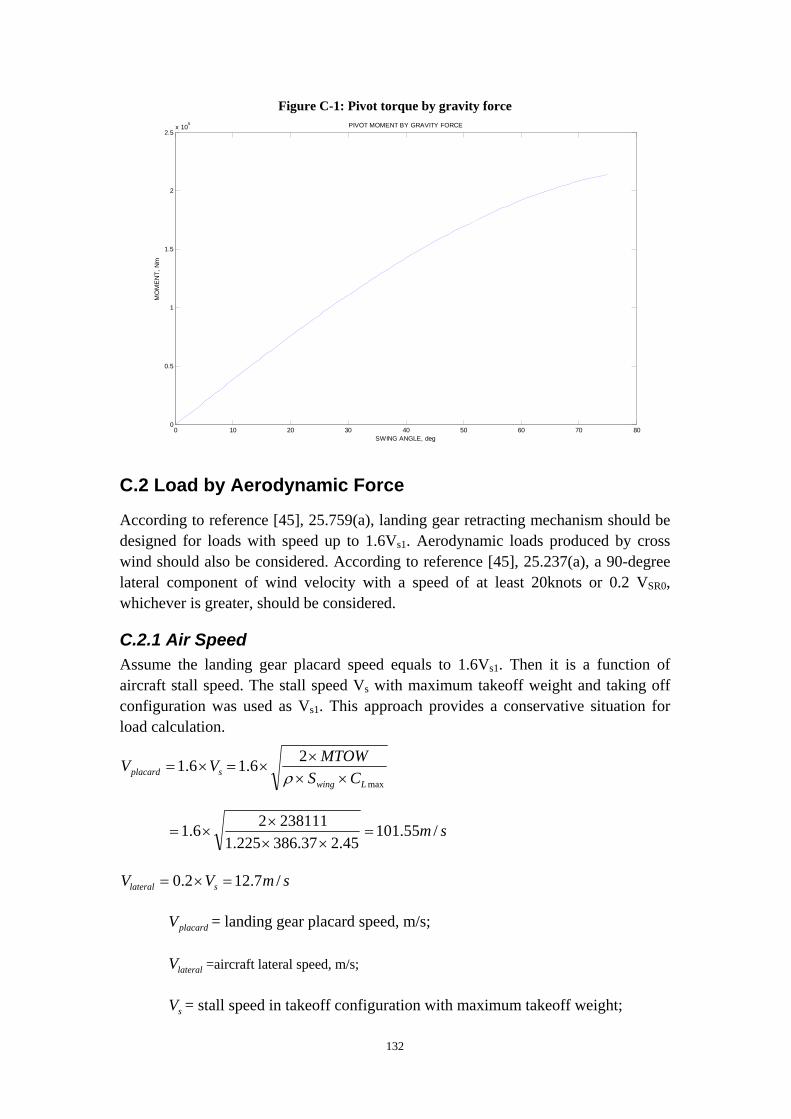
132
Figure C-1: Pivot torque by gravity force
0 10 20 30 40 50 60 70 800
0.5
1
1.5
2
2.5x 10⁵ PIVOT MOMENT BY GRAVITY FORCE
SWING ANGLE, deg
MO
ME
NT,
Nm
C.2 Load by Aerodynamic Force
According to reference [45], 25.759(a), landing gear retracting mechanism should be designed for loads with speed up to 1.6Vs1. Aerodynamic loads produced by cross wind should also be considered. According to reference [45], 25.237(a), a 90-degree lateral component of wind velocity with a speed of at least 20knots or 0.2 VSR0, whichever is greater, should be considered.
C.2.1 Air Speed Assume the landing gear placard speed equals to 1.6Vs1. Then it is a function of aircraft stall speed. The stall speed Vs with maximum takeoff weight and taking off configuration was used as Vs1. This approach provides a conservative situation for load calculation.
splacard VV ×= 6.1max
26.1Lwing CS
MTOW××
××=
ρ
sm /55.10145.237.386225.1
23811126.1 =××
××=
smVV slateral /7.122.0 =×=
placardV = landing gear placard speed, m/s;
lateralV =aircraft lateral speed, m/s;
sV = stall speed in takeoff configuration with maximum takeoff weight;

133
wingS = wing area, m2;
maxLC = lift coefficient in takeoff configuration, equals to 2.45(reference [37]);
ρ = air density, 1.225kg/m3, sea level, ISA;
C.2.2 Aerodynamic Force Calculation The main landing gear components exposed to aerodynamic effects are landing gear panel (attached on gear leg), wheel unit and leg. The aerodynamic effects on landing gear can be divided into two components:
a) Direct effect, which is caused by lateral forces. It contributes directly to pivot moment;
b) Indirect effect, which is caused by longitudinal forces. It contributes indirectly to pivot moment by means of pivot bearing friction.
Aerodynamic forces acting on the panel are caused by both longitudinal speed
placardV and lateral speed lateralV . These aerodynamic forces can be divided into a
longitudinal component and a lateral component. Aerodynamic effects acting on the wheel unit and the leg are similar. Longitudinal speed will cause longitudinal force, and lateral speed will generate lateral force. For ease of computation, the effective area of leg was counted into the effective area of wheel unit. The following table summarizes these effects:
Table C-1: Aerodynamic effects Components Speed Directions Force Direction Moment
1 Panel longitudinal lateral Direct
2 Panel longitudinal longitudinal Indirect
3 Panel lateral lateral Direct
4 Panel lateral longitudinal Indirect
5 Leg longitudinal longitudinal Indirect
6 Leg lateral lateral Direct
7 Wheel unit longitudinal longitudinal Indirect
8 Wheel unit lateral lateral Direct
a) Directly effective moments The lateral force produced by panel is:
)cos())cos()cos((5.0
)cos())sin((5.0)1(2
2
γθγρ
γγρ
××××××+
××××××−=
panellateral
panelplacardalpanellater
SV
SVF
The lateral force produced by wheel unit is:
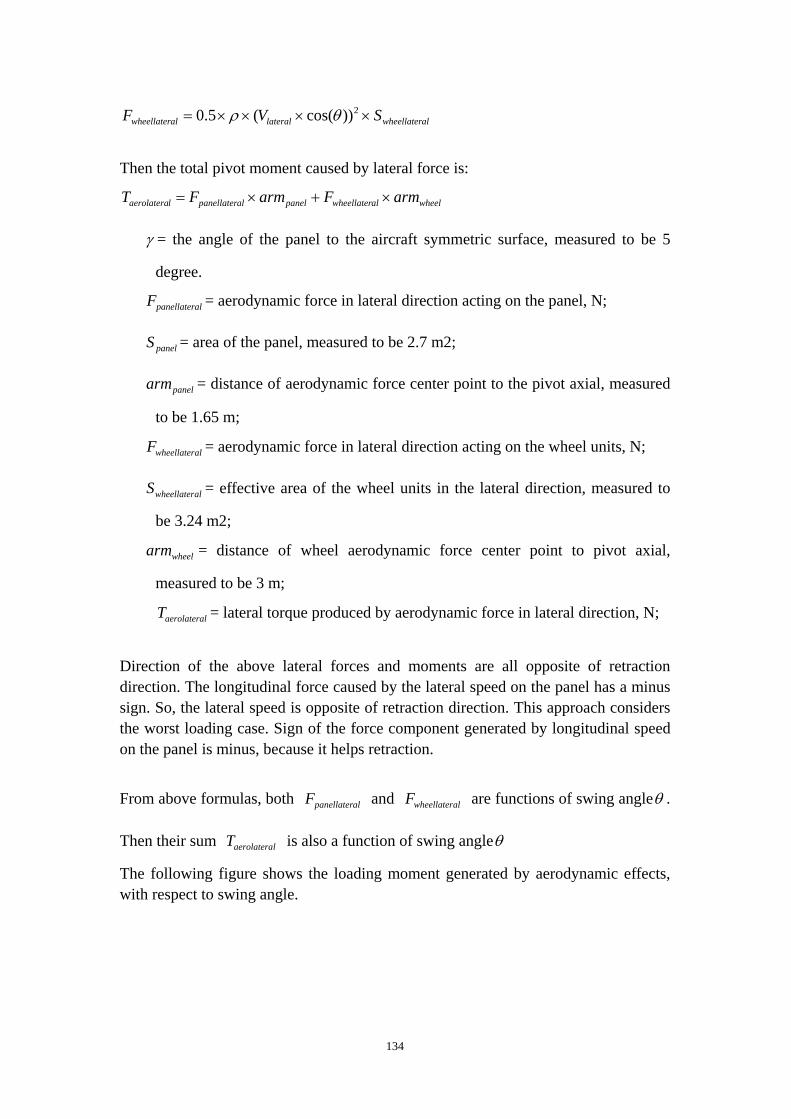
134
alwheellaterlateralalwheellater SVF ××××= 2))cos((5.0 θρ
Then the total pivot moment caused by lateral force is:
wheelalwheellaterpanelalpanellaterlaerolatera armFarmFT ×+×=
γ = the angle of the panel to the aircraft symmetric surface, measured to be 5
degree.
alpanellaterF = aerodynamic force in lateral direction acting on the panel, N;
panelS = area of the panel, measured to be 2.7 m2;
panelarm = distance of aerodynamic force center point to the pivot axial, measured
to be 1.65 m;
alwheellaterF = aerodynamic force in lateral direction acting on the wheel units, N;
alwheellaterS = effective area of the wheel units in the lateral direction, measured to
be 3.24 m2;
wheelarm = distance of wheel aerodynamic force center point to pivot axial,
measured to be 3 m;
laerolateraT = lateral torque produced by aerodynamic force in lateral direction, N;
Direction of the above lateral forces and moments are all opposite of retraction direction. The longitudinal force caused by the lateral speed on the panel has a minus sign. So, the lateral speed is opposite of retraction direction. This approach considers the worst loading case. Sign of the force component generated by longitudinal speed on the panel is minus, because it helps retraction.
From above formulas, both alpanellaterF and alwheellaterF are functions of swing angleθ .
Then their sum laerolateraT is also a function of swing angleθ
The following figure shows the loading moment generated by aerodynamic effects, with respect to swing angle.

135
Figure C-2: Pivot torque by aerodynamics
0 10 20 30 40 50 60 70 80-200
0
200
400
600
800
1000
1200
1400
SWING ANGLE, deg
MO
ME
NT,
Nm
PIVOT MOMENT BY AERODYNAMICS
MOMENT BY AERODYNAMICS
MOMENT BY FORCE ON PANEL
MOMENT BY FORCE ON WHEEL UNIT
b) Indirect Effect The lateral force produced by panel is:
)sin())cos()cos((5.0)1(
)sin())sin((5.02
2
γθγρ
γγρ
×××××××−+
×××××=
panellateral
panelplacardtudinalpanellongi
SV
SVF
The lateral force produced by wheel unit is:
tudinalwheellongiplacardtudinalwheellongi SVF ×××= 25.0 ρ
Then the total longitudinal force caused by aerodynamics is:
tudinalwheellongitudinalpanellongiudinalaerolongit FFF +=
tudinalpanellongiF = aerodynamic force in longitudinal direction acting on the panel, N;
udinalaerolongitF = aerodynamic force in lateral direction on the panel, N;
udinalaerolongitF = aerodynamic force in lateral direction on the panel
tudinalwheellongiF = aerodynamic force in longitudinal direction acting on the wheel
unit and leg, N;
tudinalwheellongiS = effective area of the wheel unit and leg in the longitudinal direction,

136
measured to be 3.19m2; This longitudinal force acts on the landing gear pivot bearing and produces friction force. So, it generates resistant torque indirectly. The pivot moment produced by aerodynamic indirect effect will be calculated later on.
C.3 Load by Friction Force
From reference [21], the selected pivot bearings, which have a designation number of GE 160ES-2RS, are provided by SKF. Each main landing gear has two bearings, one on each end of pivot. SKF provides an on line friction calculation software. In order to calculate the friction torque, longitudinal and axial forces must be known. In this application, the pivot has bearings on each end, and the load distribution between these bearings is difficult to know. For ease of computation, the author assumed that all the loads are acting on one bearing. The longitudinal force acting on pivot is produced by aerodynamic force. The radial force is not easy to derive, as it is a function of all the acting forces. However, the two largest force components, gravity force and actuation force are dominating. From kinematics analysis, actuation force is very unlikely to act downwards. So, an actuation force which is normal to the gravity force will generate the largest axial force. Assume the actuation force is 10 times the gravity force. The forces are:
NFF udinalaerolongitpivotaxial 20160== ;
NweightF lpivotradia 371390101 2 =×+=
pivotaxialF =axial force on pivot, N;
lpivotradiaF =radial force on pivot, N;
Then, the friction moment was calculated by SKF software. The maximum recommended friction coefficient 0.2 was used for the most conservative result. The
calculated friction torque is: NmTfriction 7942= .

137
Figure C-3: Friction moment calculation
(http://www.skf.com/skf/productcatalogue/calculationsFilter;jsessionid=qKc-LfvcRXbwh5fCaGvAPAw?lang=en
&reloading=false&next=ok&windowName=xyY8mKGaxPHA8t69cpBz78_1225456336737_PlainCalc2&action=
PlainCalc2&newlink=&calcform=form1&calc_extrainfo=false&prodid=183004004&Fr=371.390&Fa=22.340&m
y=0.2)
The following figure shows the friction variables with respect to swing angle.
Figure C-4: Friction force calculation variables
0 10 20 30 40 50 60 70 807920
7920.5
7921
7921.5
7922PIVOT MOMENT BY FRICTION FORCE
SWING ANGLE, deg
MO
ME
NT,
Nm
0 10 20 30 40 50 60 70 802.0135
2.014
2.0145
2.015
2.0155
2.016x 10⁴ AXIAL FORCE ON BEARINGS
SWING ANGLE, deg
FOR
CE
, N
0 10 20 30 40 50 60 70 803.7138
3.7138
3.7139
3.7139
3.7139
3.7139x 10⁵ RADIAL FORCE ON BEARINGS
SWING ANGLE, deg
FOR
CE
, N
C.4 Total Static Loading Moment
The total static loading moment is the sum of the above loading moments.

138
frictionlaerolateragravitystatic TTTT ++=
The following graphs illustrate the total pivot moment, and also its components. Figure C-5: Landing gear loading moment-distributed
0 10 20 30 40 50 60 70 800
1
2
3x 10⁵ TOTAL PIVOT MOMENT
SWING ANGLE, deg
MO
ME
NT,
Nm
0 10 20 30 40 50 60 70 800
1
2
3x 10⁵ PIVOT MOMENT BY GRAVITATION
SWING ANGLE, deg
MO
ME
NT,
Nm
0 10 20 30 40 50 60 70 80-1000
0
1000
2000PIVOT MOMENT BY AERODYNAMICS
SWING ANGLE, deg
MO
ME
NT,
Nm
0 10 20 30 40 50 60 70 807920
7921
7922PIVOT MOMENT BY FRICTION
SWING ANGLE, deg
MO
ME
NT,
Nm
Figure C-6: Landing gear loading moment on pivot
0 10 20 30 40 50 60 70 80-0.5
0
0.5
1
1.5
2
2.5x 10⁵
SWING ANGLE, deg
MO
ME
NT,
Nm
PIVOT MOMENT
TOTAL MOMENT
PIVOT MOMENT BY GRAVITATION
PIVOT MOMENT BY AERODYNAMICS
PIVOT MOMENT BY FRICTION
From the above plot, it is clear that the moment produced by gravitation dominates.
139
C.5 Dynamic Loading Moment Estimation
Assume the landing gear swings into landing gear bay in 10 seconds with a constant
speed. Then the reference swing speed 5.71075
== degree/s =0.1309 radian/s. Under
this speed, the dynamic energy 25.0 pivotgJ ω××= =0.5×36719×0.13092=314.58 J.
gJ =landing gear inertia, measured to be 36719 kg×m2.
Compare it with the energy consumed by static loading moment:
%2.0164338
58.314==
static
dynamic
energyenergy
The result shows that when the swing speed is in a reasonable rage, the dynamic energy is very small when compared with energy used to counteract static load. Enough accuracy is ensured using static load for component sizing.

140
Appendix D: Actuation Time Calculation According to the aircraft performance requirements, the landing gear has to be raised or lowed within a certain time after the pilot command. Two methods are used to decide the landing gear retraction time requirement. The first method derives the time through summarizing requirements of other aircraft. The second method generates the time requirement though considering performance requirement for aircraft operation.
D.1 Method 1-Existing Requirements Summary
Time requirements can be derived from other aircraft specifications. A series of data of Boeing aircraft were provided in reference [19]. These data were acquired by actual flight test. It was assumed that retraction was initiated 3s after liftoff. And in order to achieve conservative results, 1 pump was shut off during the tests. The following table summarizes these data and the MTOW of each aircraft:
Table D-1: Retraction time requirement of existing aircraft Aircraft Type Retraction Time, [s] One Pump Failure Considered MTOW, [kg]
707-100/200 12.3 YES 117100
707-300/400 12.3 YES 143500
707-300B/C 15.5 YES 152500
727-100/200 11 YES 104000
737-100/200 7 YES 58333
737-300 7.1 YES 63277
757-200 17 YES 115650
767-200/300 15.3 YES 179623
747 20 NO 351000
The following plot illustrates the relation of retraction time and MTOW of the above aircraft:
Figure D-1: Retraction time requirement of existing aircraft
RETRACTION TIME
707-300/400
767-200/300
747
707-100/200
707-300B/C
727-100/200
737-100/200737-300
757-200 MRT-7
0
5
10
15
20
25
0 50000 100000 150000 200000 250000 300000 350000 400000MTOW, kg
retra
ctio
n tim
e, s
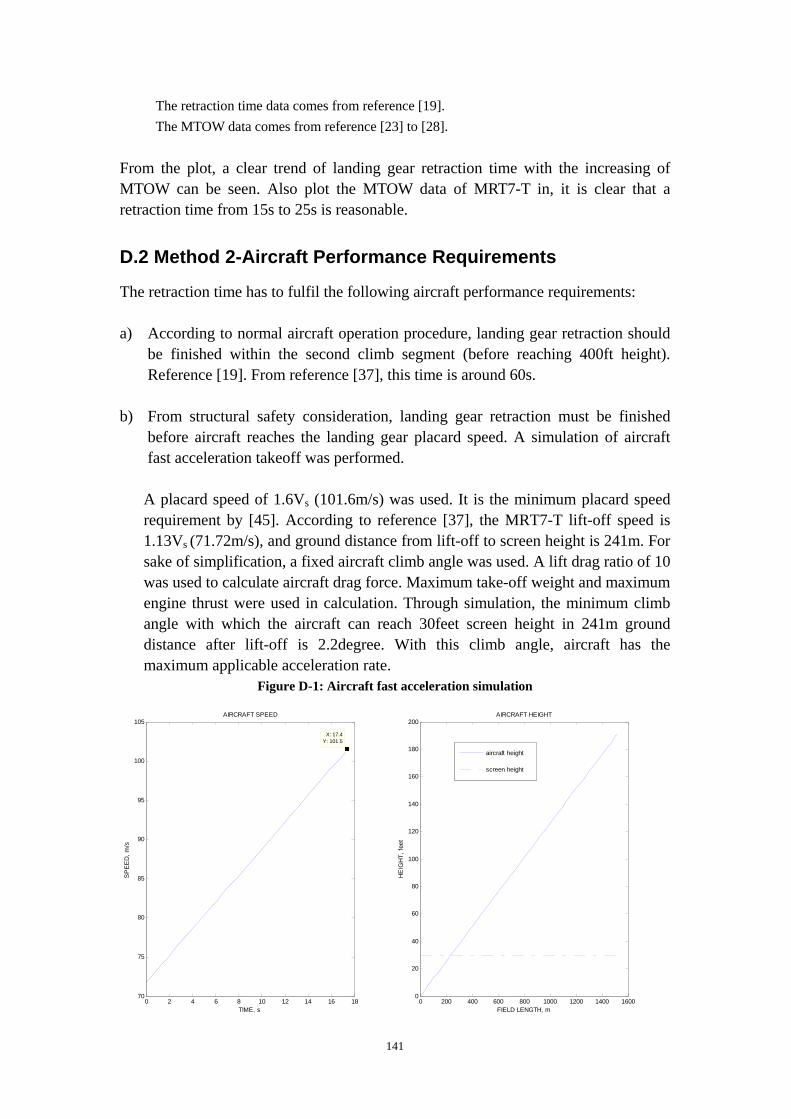
141
The retraction time data comes from reference [19]. The MTOW data comes from reference [23] to [28].
From the plot, a clear trend of landing gear retraction time with the increasing of MTOW can be seen. Also plot the MTOW data of MRT7-T in, it is clear that a retraction time from 15s to 25s is reasonable.
D.2 Method 2-Aircraft Performance Requirements
The retraction time has to fulfil the following aircraft performance requirements: a) According to normal aircraft operation procedure, landing gear retraction should
be finished within the second climb segment (before reaching 400ft height). Reference [19]. From reference [37], this time is around 60s.
b) From structural safety consideration, landing gear retraction must be finished
before aircraft reaches the landing gear placard speed. A simulation of aircraft fast acceleration takeoff was performed.
A placard speed of 1.6Vs (101.6m/s) was used. It is the minimum placard speed requirement by [45]. According to reference [37], the MRT7-T lift-off speed is 1.13Vs (71.72m/s), and ground distance from lift-off to screen height is 241m. For sake of simplification, a fixed aircraft climb angle was used. A lift drag ratio of 10 was used to calculate aircraft drag force. Maximum take-off weight and maximum engine thrust were used in calculation. Through simulation, the minimum climb angle with which the aircraft can reach 30feet screen height in 241m ground distance after lift-off is 2.2degree. With this climb angle, aircraft has the maximum applicable acceleration rate.
Figure D-1: Aircraft fast acceleration simulation
0 2 4 6 8 10 12 14 16 1870
75
80
85
90
95
100
105
X: 17.4Y: 101.5
AIRCRAFT SPEED
TIME, s
SP
EE
D, m
/s
0 200 400 600 800 1000 1200 1400 16000
20
40
60
80
100
120
140
160
180
200AIRCRAFT HEIGHT
FIELD LENGTH, m
HE
IGH
T, fe
et
aircraft height
screen height

142
Simulation results show that the aircraft accelerates to landing gear placard speed in 17.5s after lift-off.
D.3 Summary
Through above analysis, reasonable retraction time requirement ranges from 15s to 20s. A conservative time requirement for the MRT7-T would be 15s. This time requirement gives some allowance for operation of subsidiary components such as locks and doors.

143
Appendix E: Landing Gear Kinematics
Optimization Reference [17] and [18] well document the current landing gear kinematics concepts. Through summarization of existing kinematics concepts, three kinematics concepts were identified. In order to see whether other kinds of kinematics concepts are possible, a fourth one was worked out by the author. Each of them was analyzed in detail. Firstly mathematic models were built. Then Simulations methods have been used to explore kinematics performances with different parameters. After analysis and iterative simulation, likely parameters were obtained. Sensitivity studies were then carried out to check the validity of parameters
E.1 Landing Gear Bay Envelope
The following figure shows the envelope of the landing gear bay. Figure E-1: Landing gear bay envelope
E.2 Landing Gear Kinematics Selection Criteria
The criteria of kinematics selection are really complicated. Generally speaking, kinematics characteristics under consideration are:
a) Maximum static force b) Shape of static force on actuator c) Stroke length. d) Maximum static force×Stroke length
The sizing of both hydraulic cylinder and mechanical actuator is heavily affected by the maximum static force. So, the maximum static force on actuator should be as small as possible. Stroke length also plays an important role on sizing. So, maximum static force×Stroke length is more suitable as a criterion. However, the importance of
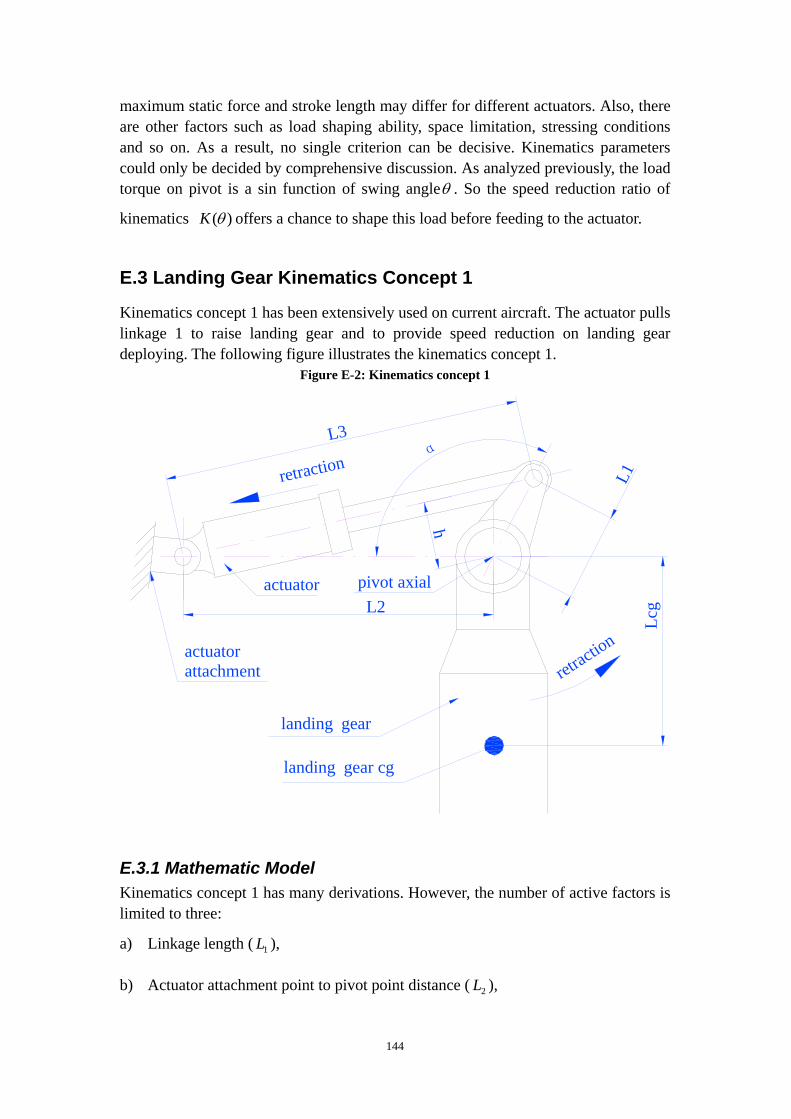
144
maximum static force and stroke length may differ for different actuators. Also, there are other factors such as load shaping ability, space limitation, stressing conditions and so on. As a result, no single criterion can be decisive. Kinematics parameters could only be decided by comprehensive discussion. As analyzed previously, the load torque on pivot is a sin function of swing angleθ . So the speed reduction ratio of
kinematics )(θK offers a chance to shape this load before feeding to the actuator.
E.3 Landing Gear Kinematics Concept 1
Kinematics concept 1 has been extensively used on current aircraft. The actuator pulls linkage 1 to raise landing gear and to provide speed reduction on landing gear deploying. The following figure illustrates the kinematics concept 1.
Figure E-2: Kinematics concept 1
pivot axialactuator
actuator attachment
landing gear cg
landing gear
h
α
L1L2
L3
Lcg
retracti
on
retraction
E.3.1 Mathematic Model Kinematics concept 1 has many derivations. However, the number of active factors is limited to three:
a) Linkage length ( 1L ),
b) Actuator attachment point to pivot point distance ( 2L ),

145
c) Initial value of actuation angle (the angle formed by 1L and 2L ,α ) 0α .
Landing gear swing angle θ ranges from oo 750 − , then the actuation angle
θαα −= 0 .
2102
22
1212
22
13 )cos(2)cos(2 LLLLLLLLL ××−×−+=×××−+= θαα
Angle β (the angle formed by 2L and 3L ) is: )2
cos(32
21
23
22
LLLLLa
××−+
=β
Arm of the actuation force is:
2)sin()( Lh ×= βθ , pivotactuator ThF =× )(θ
So )(
1)(θ
θKF
Th
actuator
pivot ==
E.3.2 Parametric Study Simulation results suggest that the above three parameters effect differently. The following figure shows the change of actuator stroke to force curves with different parameters. Forces caused by static load were used for simplicity.
( mLmL 2.1,3.0,140 210 === oα were used as neutral values)
Figure E-3: Kinematics 1 force to stroke curves with different parameters
0 0.1 0.2 0.3 0.40
0.5
1
1.5
2
2.5x 10⁶
←a0=90
STROKE,m
STA
TIC
FO
RC
E,N
STATIC FORCE TO STROKE-a0
←a0=110
←a0=130
←a0=150
←a0=170
0 0.1 0.2 0.3 0.40
0.5
1
1.5
2
2.5x 10⁶
←L1=0.1
STROKE,m
STA
TIC
FO
RC
E,N
STATIC FORCE TO STROKE-L1
←L1=0.2
←L1=0.3
←L1=0.4
←L1=0.5
0 0.05 0.1 0.15 0.2 0.252
3
4
5
6
7
8
9
10x 105
←L2=0.5
STROKE,m
STA
TIC
FO
RC
E,N
STATIC FORCE TO STROKE-L2
←L2=0.7
←L2=0.9←L2=1.1←L2=1.3
←L2=1.5

146
Figure E-4: Kinematics 1 characteristics-Changing 0α
120 130 140 150 160 170 1807
7.5
8
8.5
9x 10⁵
INITIAL ANGLE(a0),degMA
XIM
UM
AC
TUA
TIO
N F
OR
CE
,N MAXIMUM STATIC FORCE - INITIAL ACTUATION ANGLE
120 130 140 150 160 170 1800.2
0.25
0.3
0.35
0.4
INITIAL ANGLE,deg
STR
OK
E L
EN
GTH
(a0),m
STROKE LENGTH - INITIAL ACTUATION ANGLE
120 130 140 150 160 170 1801.5
2
2.5
3
3.5x 10⁵
INITIAL ANGLE(a0),deg
FOR
CE
x S
TRO
KE
MAXIMUM FORCE x STROKE - INITIAL ACTUATION ANGLE
Figure E-5: Kinematics 1 characteristics-Changing L1
0.1 0.15 0.2 0.25 0.3 0.35 0.4 0.45 0.50
0.5
1
1.5
2
2.5x 10⁶
LENGTH OF LINK1(L1),m
MA
XIM
UM
AC
TUA
TIO
N F
OR
CE
,N MAXIMUM STATIC FORCE - LENGTH OF LINK1
0.1 0.15 0.2 0.25 0.3 0.35 0.4 0.45 0.50.1
0.2
0.3
0.4
0.5
0.6
LENGTH OF LINK1(L1),m
STR
OK
E L
EN
GTH
,m
STROKE LENGTH - LENGTH OF LINK1
0.1 0.15 0.2 0.25 0.3 0.35 0.4 0.45 0.52.3
2.4
2.5
2.6
2.7
2.8x 10⁵
LENGTH OF LINK1(L1),m
FOR
CE
x S
TRO
KE
MAXIMUM FORCE x STROKE - LENGTH OF LINK1
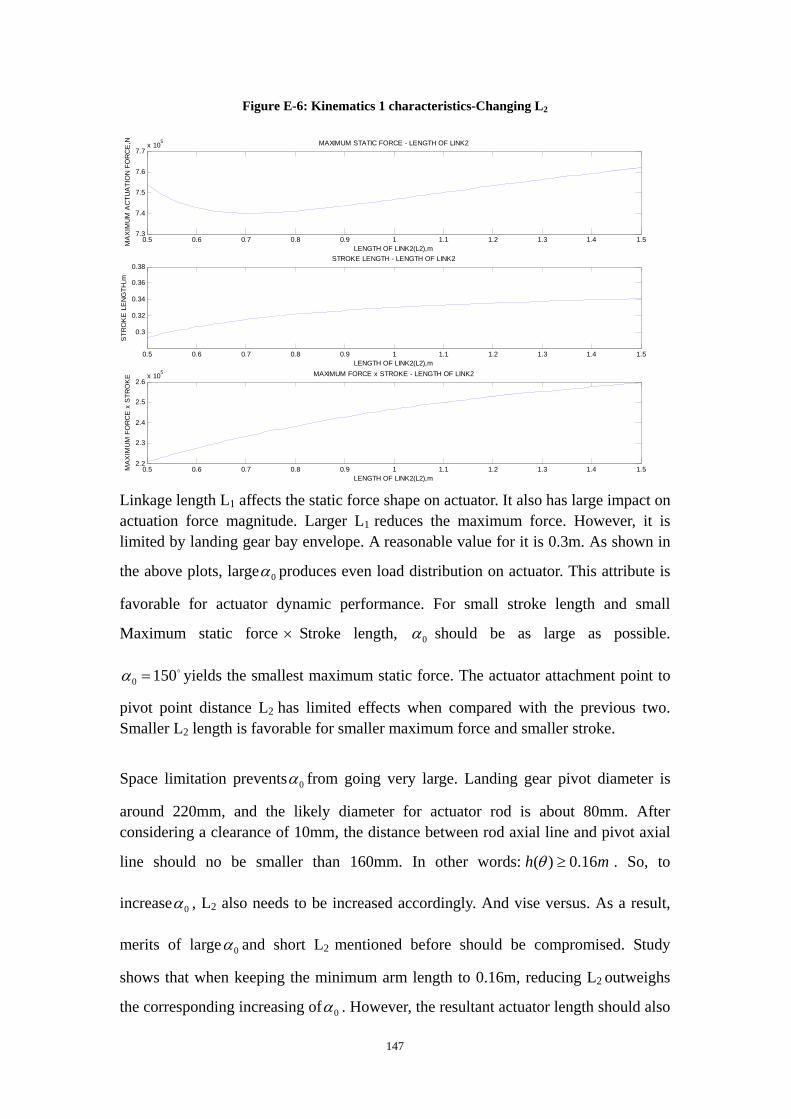
147
Figure E-6: Kinematics 1 characteristics-Changing L2
0.5 0.6 0.7 0.8 0.9 1 1.1 1.2 1.3 1.4 1.57.3
7.4
7.5
7.6
7.7x 10⁵
LENGTH OF LINK2(L2),mMA
XIM
UM
AC
TUA
TIO
N F
OR
CE
,N MAXIMUM STATIC FORCE - LENGTH OF LINK2
0.5 0.6 0.7 0.8 0.9 1 1.1 1.2 1.3 1.4 1.5
0.3
0.32
0.34
0.36
0.38
LENGTH OF LINK2(L2),m
STR
OK
E L
EN
GTH
,m
STROKE LENGTH - LENGTH OF LINK2
0.5 0.6 0.7 0.8 0.9 1 1.1 1.2 1.3 1.4 1.52.2
2.3
2.4
2.5
2.6x 10⁵
LENGTH OF LINK2(L2),m
MA
XIM
UM
FO
RC
E x
STR
OK
E MAXIMUM FORCE x STROKE - LENGTH OF LINK2
Linkage length L1 affects the static force shape on actuator. It also has large impact on actuation force magnitude. Larger L1 reduces the maximum force. However, it is limited by landing gear bay envelope. A reasonable value for it is 0.3m. As shown in
the above plots, large 0α produces even load distribution on actuator. This attribute is
favorable for actuator dynamic performance. For small stroke length and small
Maximum static force × Stroke length, 0α should be as large as possible.
o1500 =α yields the smallest maximum static force. The actuator attachment point to
pivot point distance L2 has limited effects when compared with the previous two. Smaller L2 length is favorable for smaller maximum force and smaller stroke.
Space limitation prevents 0α from going very large. Landing gear pivot diameter is
around 220mm, and the likely diameter for actuator rod is about 80mm. After considering a clearance of 10mm, the distance between rod axial line and pivot axial
line should no be smaller than 160mm. In other words: mh 16.0)( ≥θ . So, to
increase 0α , L2 also needs to be increased accordingly. And vise versus. As a result,
merits of large 0α and short L2 mentioned before should be compromised. Study
shows that when keeping the minimum arm length to 0.16m, reducing L2 outweighs
the corresponding increasing of 0α . However, the resultant actuator length should also

148
be long enough to accommodate stroke length and component size. So the guideline for choosing kinematics 1 parameters becomes: keep the minimum arm length to 0.16m, and choose as small L2 length as actuator sizing permits. Optimized parameters and their characteristics for hydraulic and mechanical actuators are listed in the following table.
Table E-1: Kinematics concept 1 parameters Parameters Hydraulic Actuator Mechanical Actuator Initial angle 0α , [degree] 137 140
1L , [m] 0.3 0.3
2L , [m] 0.9 1.2
Actuator maximum force, [N] 748650 753210
Actuator stroke length, [m] 0.334 0.336
Actuator minimum length, [m] 0.804 1.107
Actuator maximum length, [m] 1.138 1.443
Performance curves with above parameters are shown in chapter 5. The following figures illustrate the kinematics geometry for both kinds of actuator. Landing gears are in lowered position.
Figure E-7: Kinematics 1 geometry for hydraulic actuator
Figure E-8: Kinematics 1 geometry for mechanical actuator

149
E.4 Landing Gear Kinematics Concept 2
Kinematics concept 2 has the similar features as concept 1. The only difference lies on stroke direction. In concept 1, the actuator shortens to retract the landing gear; while in concept 2 it lengthens. The following figure shows the concept.
Figure E-9: Kinematics concept 2
pivot axial
actuator
landing gear
actuator attachment
landing gear cg
retraction
retractio
n
α
Lcg
h
L3
L1
L2
E.4.1 Mathematic Model Kinematics concept 2 also has many derivations. Also as kinematics, the affecting variables are:
a) Linkage length ( 1L ),
b) Actuator attachment point to pivot point distance ( 2L ),
c) Initial value of actuation angle (the angle formed by 1L and 2L ,α ) 0α .
Assume landing gear swing angle is θ (ranges oo 750 − ), then the actuation angle
θαα += 0
Then 2102
22
1212
22
13 )cos(2)cos(2 LLLLLLLLL ××+×−+=×××−+= θαα
Angle β (the angle formed by 2L and 3L ) is: )2
cos(32
21
23
22
LLLLLa
××−+
=β

150
Arm of the actuation force is: 2)sin()( Lh ×= βθ ,
pivotactuator ThF =× )(θ
So )(
1)(θ
θKF
Th
actuator
pivot ==
Simulations have been carried out to discover kinematics performances.
E.4.2 Parametric Study The following figure shows the effects of different parameters. Same as kinematics 1 analysis, forces caused by static load were used for simplicity.
( mLmL 1.1,3.0,10 210 === oα were used as neutral values).
Figure E-10: Kinematics 2 force to stroke curves with different parameters
0 0.1 0.2 0.3 0.40
2
4
6
8
10
12x 10
5
←a0=10
STROKE,m
STA
TIC
FO
RC
E,N
STATIC FORCE TO STROKE-a0
←a0=20←a0=30←a0=40
←a0=50
0 0.2 0.4 0.6 0.80
0.5
1
1.5
2
2.5x 10
6
←L1=0.1
STROKE,m
STA
TIC
FO
RC
E,N
STATIC FORCE TO STROKE-L1
←L1=0.2
←L1=0.3
←L1=0.4
←L1=0.5
0 0.1 0.2 0.3 0.40
1
2
3
4
5
6
7
8
9x 10
5
←L2=0.5
STROKE,m
STA
TIC
FO
RC
E,N
STATIC FORCE TO STROKE-L2
←L2=0.7←L2=0.9←L2=1.1←L2=1.3←L2=1.5

151
Figure E-11: Kinematics 2 characteristics-Changing 0α
0 5 10 15 20 25 30 35 40 45 507
8
9
10
11x 105
INITIAL ANGLE(a0),degMA
XIM
UM
AC
TUA
TIO
N F
OR
CE
,N MAXIMUM STATIC FORCE ON ACTUATOR WITH DIFFERENT INITIAL ACTUATION ANGLE
0 5 10 15 20 25 30 35 40 45 500.25
0.3
0.35
0.4
0.45
INITIAL ANGLE(a0),deg
STR
OK
E L
EN
GTH
,m
STROKE LENGTH - INITIAL ACTUATION ANGLE
0 5 10 15 20 25 30 35 40 45 502
2.5
3
3.5
4x 10⁵
INITIAL ANGLE(a0),deg
FOR
CE
x S
TRO
KE
MAXIMUM FORCE x STROKE - INITIAL ACTUATION ANGLE
Figure E-12: Kinematics 2 characteristics-Changing L1
0.1 0.15 0.2 0.25 0.3 0.35 0.4 0.45 0.50
0.5
1
1.5
2
2.5x 10⁶
LENGTH OF LINK1(L1),mMA
XIM
UM
AC
TUA
TIO
N F
OR
CE
,N MAXIMUM STATIC FORCE - LENGTH OF LINK1
0.1 0.15 0.2 0.25 0.3 0.35 0.4 0.45 0.50
0.2
0.4
0.6
0.8
LENGTH OF LINK1(L1),m
STR
OK
E L
EN
GTH
,m
STROKE LENGTH - LENGTH OF LINK1
0.1 0.15 0.2 0.25 0.3 0.35 0.4 0.45 0.52
2.2
2.4
2.6
2.8x 10⁵
LENGTH OF LINK1(L1),m
FOR
CE
x S
TRO
KE
MAXIMUM FORCE x STROKE - LENGTH OF LINK1
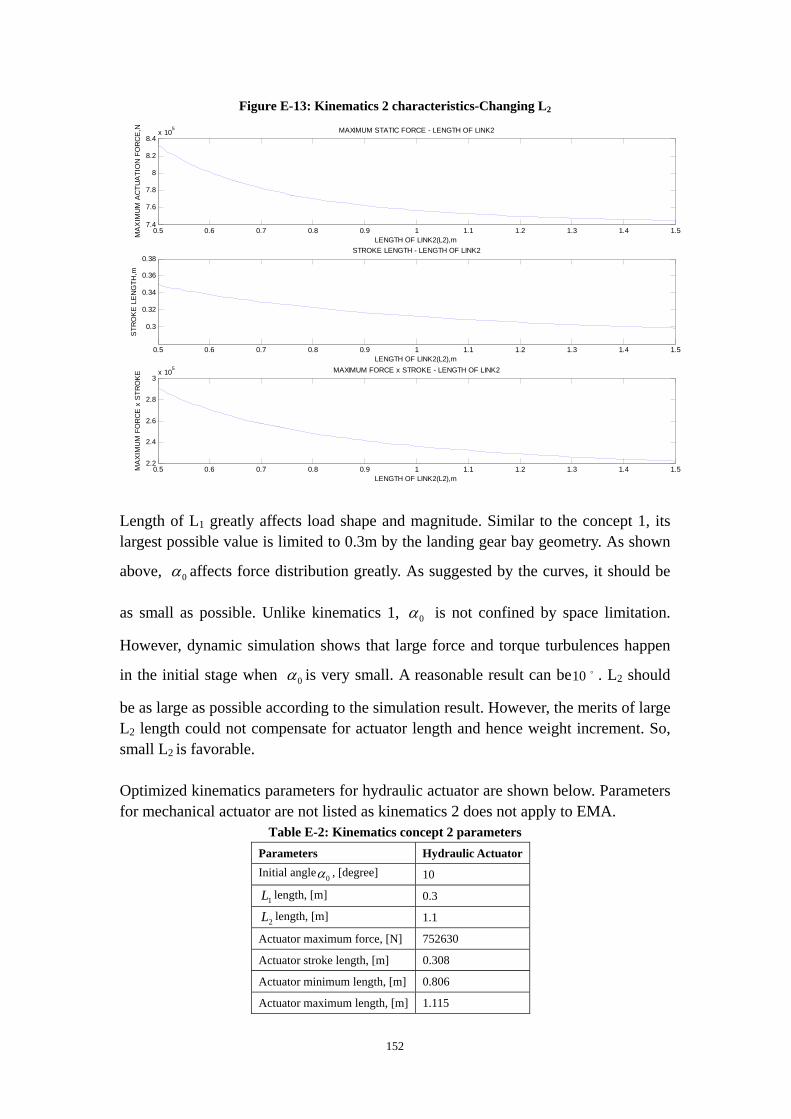
152
Figure E-13: Kinematics 2 characteristics-Changing L2
0.5 0.6 0.7 0.8 0.9 1 1.1 1.2 1.3 1.4 1.57.4
7.6
7.8
8
8.2
8.4x 10⁵
LENGTH OF LINK2(L2),mMA
XIM
UM
AC
TUA
TIO
N F
OR
CE
,N MAXIMUM STATIC FORCE - LENGTH OF LINK2
0.5 0.6 0.7 0.8 0.9 1 1.1 1.2 1.3 1.4 1.5
0.3
0.32
0.34
0.36
0.38
LENGTH OF LINK2(L2),m
STR
OK
E L
EN
GTH
,m
STROKE LENGTH - LENGTH OF LINK2
0.5 0.6 0.7 0.8 0.9 1 1.1 1.2 1.3 1.4 1.52.2
2.4
2.6
2.8
3x 10⁵
LENGTH OF LINK2(L2),m
MA
XIM
UM
FO
RC
E x
STR
OK
E MAXIMUM FORCE x STROKE - LENGTH OF LINK2
Length of L1 greatly affects load shape and magnitude. Similar to the concept 1, its largest possible value is limited to 0.3m by the landing gear bay geometry. As shown
above, 0α affects force distribution greatly. As suggested by the curves, it should be
as small as possible. Unlike kinematics 1, 0α is not confined by space limitation.
However, dynamic simulation shows that large force and torque turbulences happen
in the initial stage when 0α is very small. A reasonable result can be o10 . L2 should
be as large as possible according to the simulation result. However, the merits of large L2 length could not compensate for actuator length and hence weight increment. So, small L2 is favorable. Optimized kinematics parameters for hydraulic actuator are shown below. Parameters for mechanical actuator are not listed as kinematics 2 does not apply to EMA.
Table E-2: Kinematics concept 2 parameters Parameters Hydraulic ActuatorInitial angle 0α , [degree] 10
1L length, [m] 0.3
2L length, [m] 1.1
Actuator maximum force, [N] 752630
Actuator stroke length, [m] 0.308
Actuator minimum length, [m] 0.806
Actuator maximum length, [m] 1.115

153
Performance curves with above parameters are shown in chapter 5. The kinematics geometry is shown in the following figure:
Figure E-14: Kinematics 2 geometry for hydraulic actuator
E.5 Landing Gear Kinematics Concept 3
The kinematics concept 3 features an actuator on the landing gear side brace. The following figure illustrates its features:
Figure E-15: Kinematics concept 3
actuator
pivot axial
βα
L5
L4
L2
L1
retraction
Lcg

154
E.4.1 Mathematic Model
The swing angle and the actuation angle β decrease when retracting. If properly
designed, the kinematics should feed the actuator with a load torque less than that of pivot load torque. A speed reduction effect could be obtained by different speed between actuator and landing gear. Kinematics concept 4 could be described with the following parameters.
a) Linkage length ( 1L );
b) Linkage length ( 2L );
c) Linkage length ( 4L );
d) Linkage length ( 5L );
e) Initial value of α (the angle formed by 1L and 2L ,), 0α ;
f) Initial value of β (the angle formed by 4L and 5L ,), 0β ;
Assume landing gear swing angle is θ (ranges oo 750 − ), then θαα −= 0 ;
)cos(2)cos(2 432
42
3212
22
1 βα ×××−+=×××−+ LLLLLLLL
Then torque amplification ratio equals: )sin()sin()(/)(1
43
21
βααβ
××××
===LLLL
dtd
dtd
RR
vlinkflink
E.4.2 Parametric Study The torque amplification ratio of kinematics 4 has a close relationship with the shape of kinematics. And it is not affected by its overall size. Take into consideration of the shape of landing gear bay, it is adequate to let the initial α to be 90 degrees. That means the linkage attach point is of the same height as that of landing gear pivot. Then, angle α changes from 90 degrees to 15 degrees throughout the retraction.
The above factor )sin(21 α×× LL equals to 2 times of the area of the triangle shaped
by 1L and 2L . Further analysis suggests that when 1L equals to 2L , this area will
have the maximum value for a given sum of 4L and 5L . The factor )sin(54 β×× LL
equals to 2 times of the area of the triangle shaped by 4L and 5L . This area should be
minimized when large speed reduction ratio is wanted. When 1L equals to 2L , different

155
combinations of 4L and 5L produces different load for the actuator. For a minimized
area, 54 LL × should be minimized.
The smallest 54 LL + happens when it equals to the triangle side formed by 1L and 2L .
By choosing an arbitrary length for 1L and 2L of 1m, then 54 LL + equals 1.4m,
changing 4L slightly, the different performance curves are obtained. From the
simulation results, the maximum actuator load decreases when length discrepancy
between 4L and 5L increases. However, when 4L and 5L have considerably different
length, they both will rotate and extrude themselves outside of the landing gear bay.
As a result, the practical geometry would require 4L and 5L to be equal, so that the
actuator could be stored in the landing gear bay in the retracted position. So, 4L
= 5L =0.71 m. Then the geometry of kinematics concept 3 is finalized.
The following figure shows its performance. The first figure shows the performance
when changing the 4L length, the second show the performance with 4L = 5L =0.71m.
Figure E-16: Kinematics 3 performance - changing L4
0 20 40 60 80 100 1200
20
40
60
80
100
120
140
160
180
←link4=0.71
ANGLE OF SWING,degree
AN
GLE
OF
AC
TUA
TOR
,deg
ree
ANGLE - ANGLE
←link4=0.75←link4=0.79
←link4=0.83
0 20 40 60 80 100 1200
2
4
6
8
10
12
←link4=0.71
ANGLE OF SWING,degree
SP
EE
D R
ED
UC
TIO
N R
ATI
O
SPEED REDUCTION RATIO - SWING ANGLE
←link4=0.75←link4=0.79
←link4=0.83
0 20 40 60 80 100 1200
2
4
6
8
10
12
14
16x 10
4
←link4=0.71
ANGLE OF SWING,degree
TOR
QU
E O
F M
OTO
R,N
m
MOTOR TORQUE - SWING ANGLE
←link4=0.75
←link4=0.79
←link4=0.83
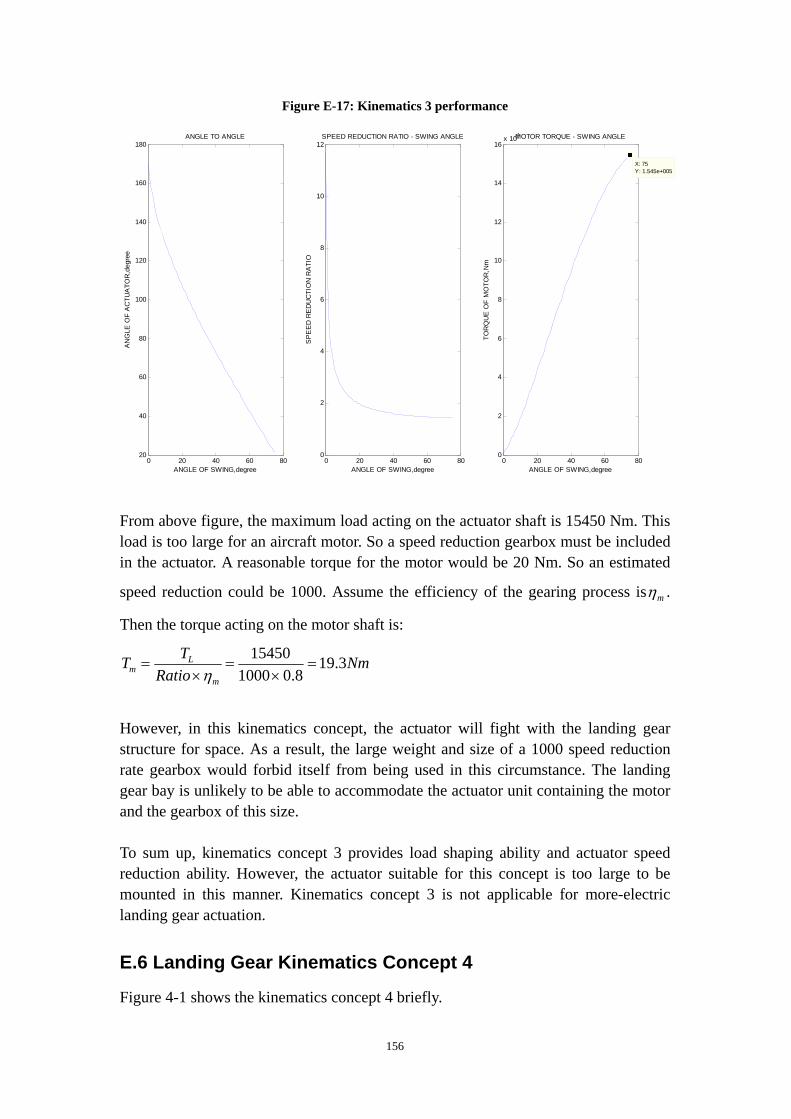
156
Figure E-17: Kinematics 3 performance
0 20 40 60 8020
40
60
80
100
120
140
160
180
ANGLE OF SWING,degree
AN
GLE
OF
AC
TUA
TOR
,deg
ree
ANGLE TO ANGLE
0 20 40 60 800
2
4
6
8
10
12
ANGLE OF SWING,degree
SP
EE
D R
ED
UC
TIO
N R
ATI
O
SPEED REDUCTION RATIO - SWING ANGLE
0 20 40 60 800
2
4
6
8
10
12
14
16x 104
X: 75Y: 1.545e+005
ANGLE OF SWING,degree
TOR
QU
E O
F M
OTO
R,N
m
MOTOR TORQUE - SWING ANGLE
From above figure, the maximum load acting on the actuator shaft is 15450 Nm. This load is too large for an aircraft motor. So a speed reduction gearbox must be included in the actuator. A reasonable torque for the motor would be 20 Nm. So an estimated
speed reduction could be 1000. Assume the efficiency of the gearing process is mη .
Then the torque acting on the motor shaft is:
NmRatio
TTm
Lm 3.19
8.0100015450
=×
=×
=η
However, in this kinematics concept, the actuator will fight with the landing gear structure for space. As a result, the large weight and size of a 1000 speed reduction rate gearbox would forbid itself from being used in this circumstance. The landing gear bay is unlikely to be able to accommodate the actuator unit containing the motor and the gearbox of this size. To sum up, kinematics concept 3 provides load shaping ability and actuator speed reduction ability. However, the actuator suitable for this concept is too large to be mounted in this manner. Kinematics concept 3 is not applicable for more-electric landing gear actuation.
E.6 Landing Gear Kinematics Concept 4
Figure 4-1 shows the kinematics concept 4 briefly.

157
Figure E-18: Kinematics concept 4
actuator
Lcg
retraction
pivot axial
E.6.1 Mathematic Model This concept features a gear pairing transmission between the actuator and the pivot. So, there should be a gear mounting coaxially with the pivot. In this concept, both the input velocity is angular. The whole kinematics can be treated as a gearbox. Assume the reduction ratio of this gearbox speed to be n , and efficiency of the gearing process
to be mη . The speed reduction ratio will keep constant in its service life. Mechanical
efficiency varies slightly. Torque acting on the motor shaft is:
mgear
staticmotor R
TTη×
=
motorT =torque on the motor shaft
So the only variable to optimize is gearR (the gearbox speed reduction ratio).
E.6.2 Parametric Study The following plots show the loading curve of different ratios. And the maximum load with respect to speed reduction ratio.

158
Figure E-19: Kinematics 4 motor shaft moment to landing gear swing angle
0 10 20 30 40 50 60 70 800
0.5
1
1.5
2
2.5
3x 10⁴
←ratio=10
←ratio=30
←ratio=50
←ratio=70←ratio=90
SWING ANGLE, deg
MO
TOR
SH
AFT
MO
ME
NT,
Nm
MOTOR SHAFT MOMENT - SWING ANGLE
Figure E-20: Kinematics 4 maximum motor shaft moment to gear ratio
10 20 30 40 50 60 70 80 90 1000
0.5
1
1.5
2
2.5
3x 10⁴
GEAR SPEED REDUCTION RATIO
MA
XIM
UM
MO
TOR
SH
AFT
MO
ME
NT,
Nm
MAXIMUM MOTOR SHAFT MOMENT - GEAR RATIO
As shown by the above plot, shaft torque decreases largely when speed reduction ratio increases. And maximum shaft torque always happens when the swing angle is the maximum. This maximum torque is of great importance, because the motor has to be sized according to it. Every effort must be made to reduce the maximum motor. But the maximum speed ratio is limited both geometrically and mechanically. Another issue is that when delivering a fixed large specific power, the motor could not be too small mainly because of heating problems. The biggest driving motor found is used on the B2A nose wheel steering [33], which provides an output torque of 378 Nm. Take into consideration that the maximum
159
torque of the loading is 8313 Nm, the hydraulic motor still need a decelerating gear
ratio of gearR =8313/378=22. Assume that the pivot gear is 400mm in diameter, the
motor gear should be 400/22=18.2mm. That is impossible for a gearing pair providing this amount of torque. Motor with much bigger torque has to be found.
E.7 Landing Gear Kinematics Optimization Summary
Through above analysis, concept 3 and 4 are not applicable for more-electric landing gear application. For one reason, these two kinematics concepts can not provide adequate load shaping ability. So, both actuator efficiency and maximum load will suffer. For another reason, very large motor and gearbox are needed in these two kinematics concepts. Also, actuators and power wiring (or hydraulic tubes) are difficult to mount and maintain in these concepts. Kinematics 1 and kinematics 2 are rather conventional. However, they are still suitable for use in more-electric solutions. These two concepts each has their advantages and disadvantages. The choice of kinematics concepts must be made after broader researches. Dynamic performance and component sizing should also be considered. In traditional central hydraulics driven systems, the system pressure during landing gear actuation can be regarded as constant. Then the force multiplied by stroke stand for the input power during actuation. It can be seen from the analysis that central hydraulic system driven actuators favor large initial angle for the sake of high efficiency, and smaller linkage length for shorter stroke length. These ideas fit the actual situation.

160
Appendix F: Hydraulic Components Design The reducer here refers to pump and cylinder, and also other components like reservoir and valves. After the decision of kinematics concept, static loading condition on the actuator is decided. From loading analysis, dynamic loading is significantly smaller than average static loading. As a result, maximum static load can provide enough accuracy on actuator sizing. Further analysis and simulation works show that even this maximum static load never occurs in normal working condition. However, this maximum static load has to be accommodated, to eliminate the danger of mid-phase stop.
F.1 ACMP Sizing
Existing information from reference [49] was summarized to find a guideline for AC motor pump sizing. Power density and performance characteristics were of interest.
Table F-1: Existing ACMP summary
Pump Type Aircraft
Flow Rate,
(2800psi)
[L/min]
Rated Power,
[kW]
Unit Weight,
[kg]
Power Density,
[kW/kg]
MPEV3-019-2 Falcon 2000,CRJ 15.00 4.91 9.75 0.50
MPEV3-056-7A-10A 727 and 737 series 21.60 7.07 16.4 0.43
MPEV3-032 series
DC9-10,MD80/90,
A300,A310,A320,
A330,A340,C-130,
BAE-146,AWACS
23.10 7.57 13.61 0.56
MPEV3-032-15 A320,A330,A340 23.10 7.57 14.51 0.52
MPEV3-032-1E A300,A310 22.00 7.21 13.61 0.53
MPEV3-032-UK2 BAE-146 23.10 7.57 12.7 0.60
MPEV3-056-6 747-400,757,767 26.50 8.68 22.23 0.39
MPEV3-056-7 737-600/700 14.00 4.59 10.66 0.43
MPEV3-012-2 challenger 14.00 4.59 8.62 0.53
0.498(average)
As shown in the above table, the average power density is around 0.5kW/kg. Although these AC motor pumps are of 3000psi kind, their power density should be nearly the same as that of 5000psi pumps. The reason is that in an ACMP, motor which counts for most of the weight is not affected by system pressure. And 3000psi and 5000psi pumps for a same power rating have roughly the same weight.
F.2 Cylinder Design
Two cylinders were designed in this section, one for kinematics 1 and the other for kinematics 2. Length and maximum output force were decided by inputs from kinematics study. Stress analysis method was used in cylinders detail design.
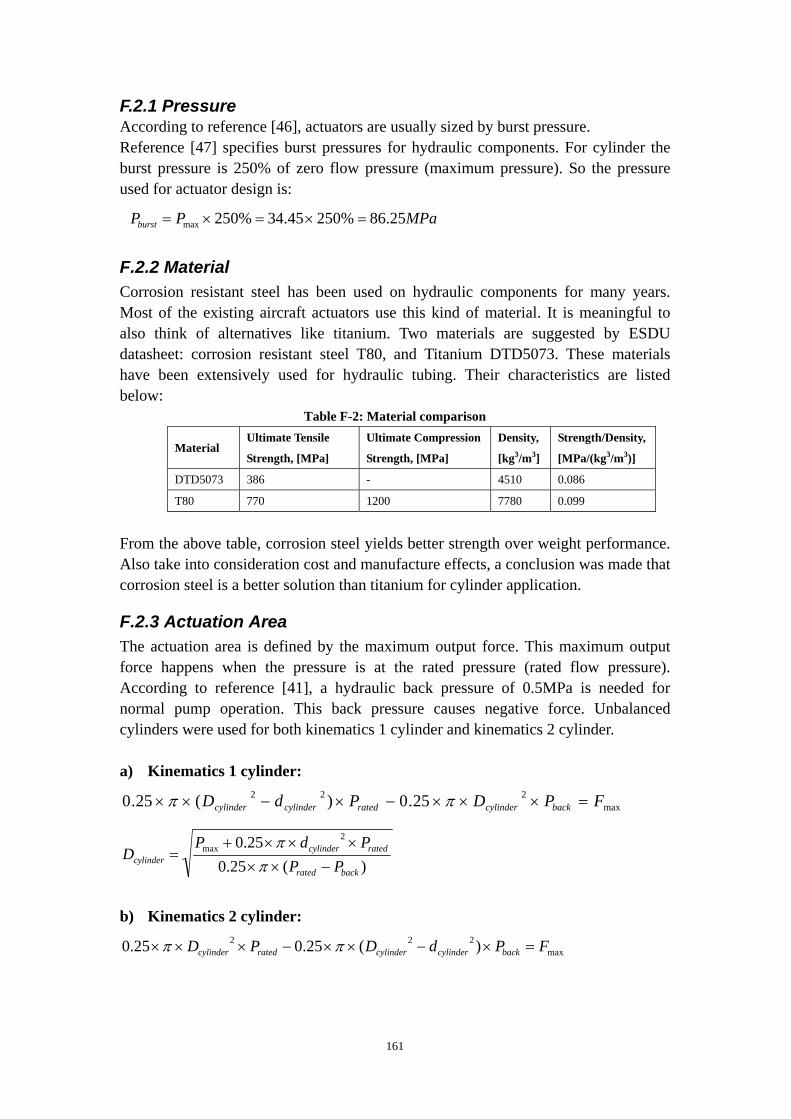
161
F.2.1 Pressure According to reference [46], actuators are usually sized by burst pressure. Reference [47] specifies burst pressures for hydraulic components. For cylinder the burst pressure is 250% of zero flow pressure (maximum pressure). So the pressure used for actuator design is:
MPaPPburst 25.86%25045.34%250max =×=×=
F.2.2 Material Corrosion resistant steel has been used on hydraulic components for many years. Most of the existing aircraft actuators use this kind of material. It is meaningful to also think of alternatives like titanium. Two materials are suggested by ESDU datasheet: corrosion resistant steel T80, and Titanium DTD5073. These materials have been extensively used for hydraulic tubing. Their characteristics are listed below:
Table F-2: Material comparison
Material Ultimate Tensile
Strength, [MPa]
Ultimate Compression
Strength, [MPa]
Density,
[kg3/m3]
Strength/Density,
[MPa/(kg3/m3)]
DTD5073 386 - 4510 0.086
T80 770 1200 7780 0.099
From the above table, corrosion steel yields better strength over weight performance. Also take into consideration cost and manufacture effects, a conclusion was made that corrosion steel is a better solution than titanium for cylinder application.
F.2.3 Actuation Area The actuation area is defined by the maximum output force. This maximum output force happens when the pressure is at the rated pressure (rated flow pressure). According to reference [41], a hydraulic back pressure of 0.5MPa is needed for normal pump operation. This back pressure causes negative force. Unbalanced cylinders were used for both kinematics 1 cylinder and kinematics 2 cylinder. a) Kinematics 1 cylinder:
max222 25.0)(25.0 FPDPdD backcylinderratedcylindercylinder =×××−×−×× ππ
)(25.025.0 2
max
backrated
ratedcylindercylinder PP
PdPD
−×××××+
=ππ
b) Kinematics 2 cylinder:
max222 )(25.025.0 FPdDPD backcylindercylinderratedcylinder =×−××−××× ππ
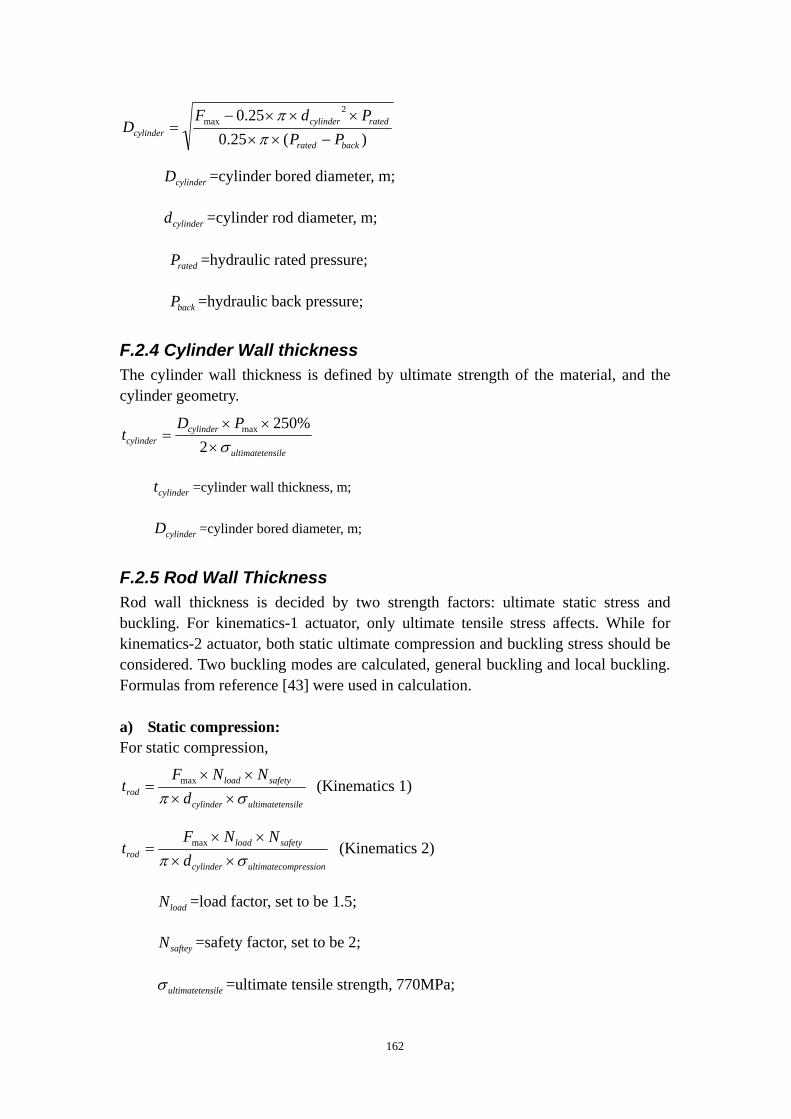
162
)(25.025.0 2
max
backrated
ratedcylindercylinder PP
PdFD
−×××××−
=π
π
cylinderD =cylinder bored diameter, m;
cylinderd =cylinder rod diameter, m;
ratedP =hydraulic rated pressure;
backP =hydraulic back pressure;
F.2.4 Cylinder Wall thickness The cylinder wall thickness is defined by ultimate strength of the material, and the cylinder geometry.
nsileultimatete
cylindercylinder
PDt
σ×××
=2
%250max
cylindert =cylinder wall thickness, m;
cylinderD =cylinder bored diameter, m;
F.2.5 Rod Wall Thickness Rod wall thickness is decided by two strength factors: ultimate static stress and buckling. For kinematics-1 actuator, only ultimate tensile stress affects. While for kinematics-2 actuator, both static ultimate compression and buckling stress should be considered. Two buckling modes are calculated, general buckling and local buckling. Formulas from reference [43] were used in calculation. a) Static compression: For static compression,
nsileultimatetecylinder
safetyloadrod d
NNFt
σπ ××××
= max (Kinematics 1)
mpressionultimatecocylinder
safetyloadrod d
NNFt
σπ ××××
= max (Kinematics 2)
loadN =load factor, set to be 1.5;
safteyN =safety factor, set to be 2;
nsileultimateteσ =ultimate tensile strength, 770MPa;

163
mpressionultimatecoσ =ultimate compression strength, 1200MPa;
cylinderd =rod outside diameter, m;
b) General buckling: Euler Formula was used to calculate rod buckling as a whole.
2
2
2max
)/2(25.0 cylinderrodcylinder dLEC
dF
×××
=××
ππ
33
2max
25.0 cylinder
rodrod dEC
Lforcet××××
×=
π
rodL =rod length;
C =coefficient, equals 2 for free ends;
E =modulus of elasticity, 111003.2 × Pa;
c) Local buckling:
cylinder
rod
rodcylinder dtE
tdF ×
×−×
=××
213 2
max
νπ
EFtrod ××
−××=
πν
213 2
max
ν =Poisson’s ratio, equals 0.3; Stressing results show that static compression is far more critical than buckling. So the rod is stressed by ultimate compression.
F.2.6 Summary Maximum static forces were used to calculate ultimate stress in the above calculations. This is valid as dynamic simulation shows that the forces experienced by actuators never reach static forces. So, maximum static forces actually represent the most critical stressing condition. A load factor of 1.5 and a safety factor of 2 were used in both design cases. This stressing condition will never be experienced by hydraulic cylinder because of the existence of pressure relief valve. However, these factors provide some allowance for fatigue stressing and also for material and manufacturing uncertainties. Other parts of cylinders, such as joints and cylinder caps have the same parameters for both cylinders. This approach was designed to provide a fair comparison ground

164
for the cylinders. These parts take only small percentage of total unit weight, so they would not affect the accuracy seriously. A free length of 0.08 m was designed in both cylinders to accommodate internal locks and shock alleviation mechanisms. The cylinders were designed to provide fluid shock absorbance when the landing gear approaches upper lock. The following table summarizes the design of both cylinders:
Table F-3: Cylinder design parameters Parameters Kinematics 1 Kinematics 2
Maximum pressure, [MPa] 34.5
Burst pressure ratio 250%
Rated pressure, [MPa] 33.44
Back pressure, [MPa] 0.5
Maximum output force, [N] 748650 752630
Stroke, [m] 0.334 0.3085
Free length, [m] 0.08
Cylinder bored diameter, [m] 0.1883 0.1704
Cylinder bored area, [m2] 0.0279 0.0228
Cylinder wall thickness, [m] 0.0106 0.0096
Rod diameter, [m] 0.08 0.08
Rod wall thickness, [m] 0.0116 0.0075
Maximum fluid volume, [L] 11.13 8.86
Minimum fluid volume, [L] 9.45 7.31
Unbalance fluid volume, [L] 1.68 1.56
Cylinder body weight, [kg] 32.933 26.572
Cylinder rod weight, [kg] 20.209 13.894
Cylinder cap weight, [kg] 8.337 7.026
Rod end weight, [kg] 5.701 5.701
Unit dry weight, [kg] 67.181 53.193
As shown in the above table, kinematics 1 cylinder weights 14kg more than kinematics 2 cylinder. This is due to its large diameter and long actuator length.
Figure F-1: Kinematics 1 cylinder
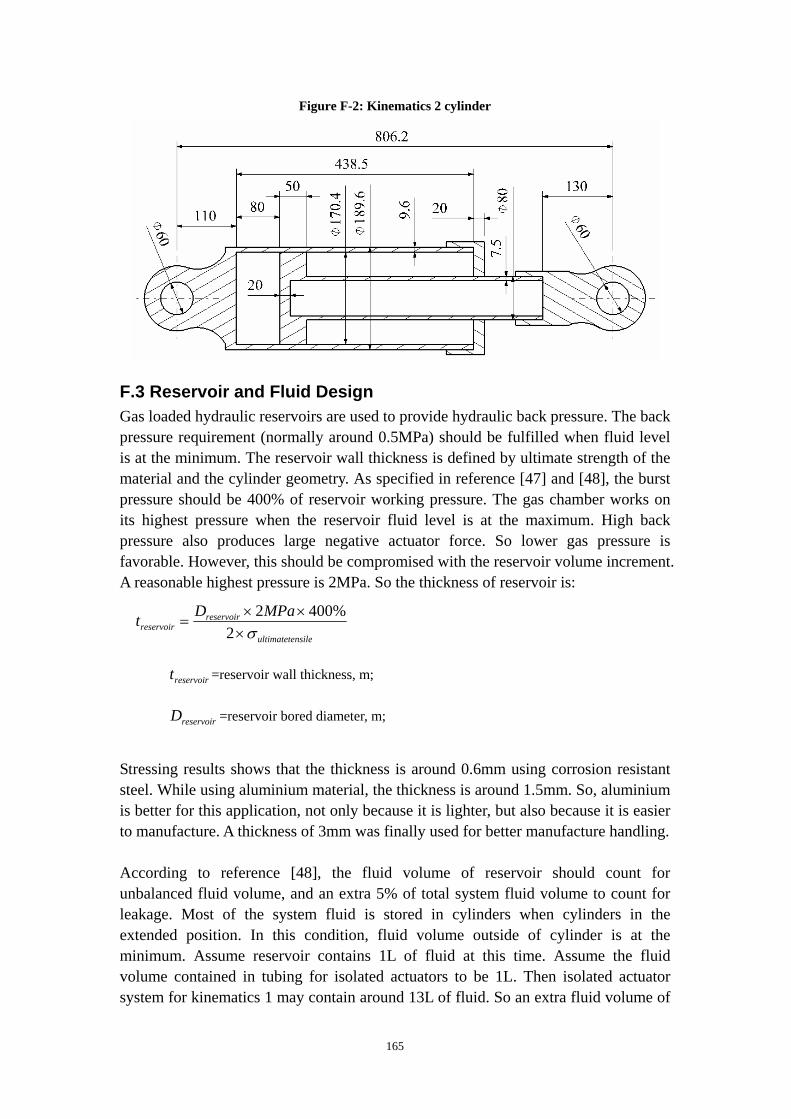
165
Figure F-2: Kinematics 2 cylinder
F.3 Reservoir and Fluid Design Gas loaded hydraulic reservoirs are used to provide hydraulic back pressure. The back pressure requirement (normally around 0.5MPa) should be fulfilled when fluid level is at the minimum. The reservoir wall thickness is defined by ultimate strength of the material and the cylinder geometry. As specified in reference [47] and [48], the burst pressure should be 400% of reservoir working pressure. The gas chamber works on its highest pressure when the reservoir fluid level is at the maximum. High back pressure also produces large negative actuator force. So lower gas pressure is favorable. However, this should be compromised with the reservoir volume increment. A reasonable highest pressure is 2MPa. So the thickness of reservoir is:
nsileultimatete
reservoirreservoir
MPaDtσ×
××=
2%4002
reservoirt =reservoir wall thickness, m;
reservoirD =reservoir bored diameter, m;
Stressing results shows that the thickness is around 0.6mm using corrosion resistant steel. While using aluminium material, the thickness is around 1.5mm. So, aluminium is better for this application, not only because it is lighter, but also because it is easier to manufacture. A thickness of 3mm was finally used for better manufacture handling. According to reference [48], the fluid volume of reservoir should count for unbalanced fluid volume, and an extra 5% of total system fluid volume to count for leakage. Most of the system fluid is stored in cylinders when cylinders in the extended position. In this condition, fluid volume outside of cylinder is at the minimum. Assume reservoir contains 1L of fluid at this time. Assume the fluid volume contained in tubing for isolated actuators to be 1L. Then isolated actuator system for kinematics 1 may contain around 13L of fluid. So an extra fluid volume of

166
0.65L is reasonable. And kinematics 2 actuator contains around 11L of fluid. Extra fluid volume for it would be 0.6L. Reservoir maximum fluid volume equals cylinder unbalanced fluid volume plus extra fluid volume. Inter-connected actuators have more tubing and thus more fluid. Assume 1L more fluid is contained in these tubing. According to reference [51], commercial aircraft generally use fire resistant phosphate ester hydraulic fluid. The most commonly used one is AS 1241 with a mean density of 1.05 mg/ml (type IV class 2). The following table summarizes the design of reservoirs and system fluid volume:
Table F-4: Reservoir and system fluid volume design Isolated Actuators Connected Actuators
Parameters Kinematics 1 Kinematics 2 Kinematics 1 Kinematics 2
Cylinder maximum fluid volume, [L] 11.13 8.86 22.25 17.71
Tube line fluid volume, [L] 1 1 3 3
Unbalanced fluid volume, [L] 1.68 1.55 3.36 3.10
Extra fluid volume, [L] 0.66 0.54 1.26 1.04
Reservoir fluid volume, [L] 2.34 2.09 4.62 4.14
Reservoir maximum pressure, [MPa] 2 2 2 2
Reservoir minimum pressure, [MPa] 0.5 0.5 0.5 0.5
Reservoir material Aluminium Aluminium Aluminium Aluminium
Calculated shell thickness, [mm] 1.2 1.2 1.5 1.5
Reservoir shell thickness, [mm] 3 3 3 3
Reservoir diameter, [m] 0.106 0.106 0.136 0.136
Reservoir length, [m] 0.409 0.368 0.477 0.428
Total system fluid volume, [L] 12.78 10.40 26.52 21.75
Fluid weight, [kg] 13.422 10.920 27.84 22.838
Reservoir dry weight, [kg] 1.578 1.470 2.371 2.204
The cross section views of these reservoirs are shown below:
Figure F-3: Reservoir for kinematics 1 and isolated actuator

167
Figure F-4: Reservoir for kinematics 2 and isolated actuator
Figure F-5: Reservoir for kinematics 1 and connected actuator
Figure F-6: Reservoir for kinematics 2 and connected actuator
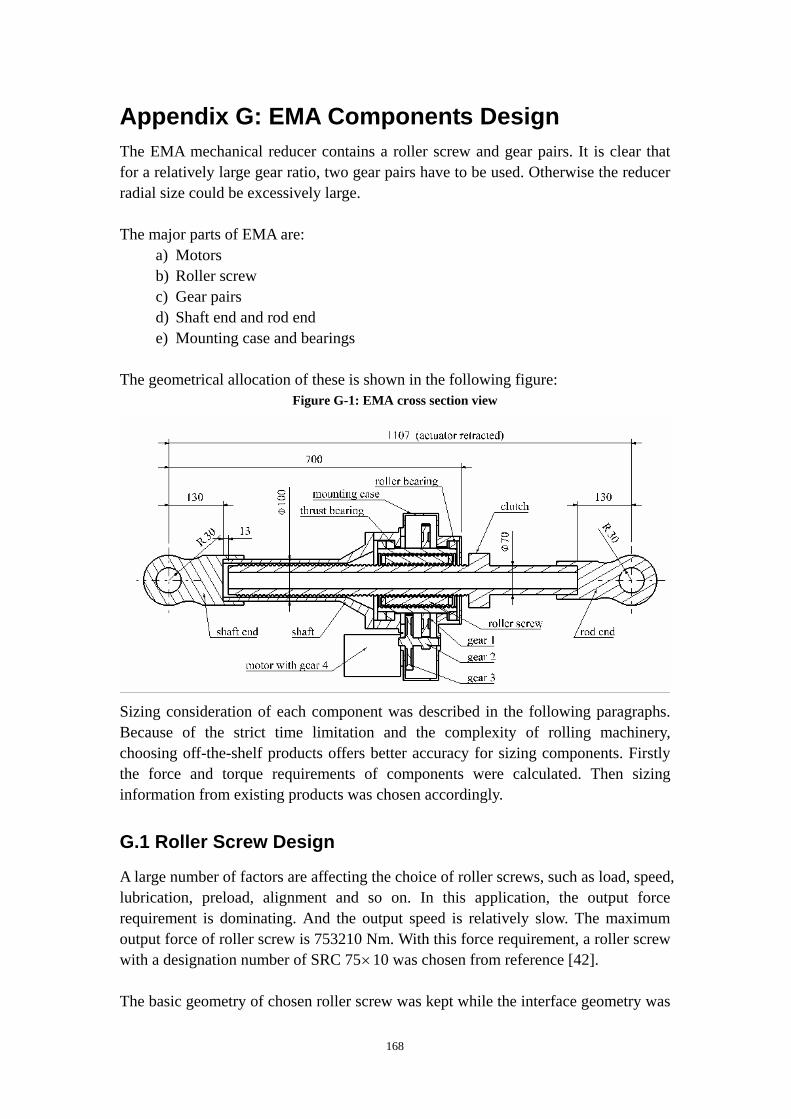
168
Appendix G: EMA Components Design The EMA mechanical reducer contains a roller screw and gear pairs. It is clear that for a relatively large gear ratio, two gear pairs have to be used. Otherwise the reducer radial size could be excessively large. The major parts of EMA are:
a) Motors b) Roller screw c) Gear pairs d) Shaft end and rod end e) Mounting case and bearings
The geometrical allocation of these is shown in the following figure:
Figure G-1: EMA cross section view
Sizing consideration of each component was described in the following paragraphs. Because of the strict time limitation and the complexity of rolling machinery, choosing off-the-shelf products offers better accuracy for sizing components. Firstly the force and torque requirements of components were calculated. Then sizing information from existing products was chosen accordingly.
G.1 Roller Screw Design
A large number of factors are affecting the choice of roller screws, such as load, speed, lubrication, preload, alignment and so on. In this application, the output force requirement is dominating. And the output speed is relatively slow. The maximum output force of roller screw is 753210 Nm. With this force requirement, a roller screw with a designation number of SRC 75×10 was chosen from reference [42]. The basic geometry of chosen roller screw was kept while the interface geometry was

169
modified for this particular usage. The lead of the screw is 10mm. And the nominal diameter of rod is 75mm. The chosen roller screw rod has been designed to serve in both directions. The primary stressing condition for the rod in this application is tensile rather than compression deformation. So the rod was resized for weight reduction. a) Screw Efficiency From [42], the efficiency of roller screw is calculated using the recommended method:
%8.729.001.0
10751416.31
19.01
10
=××
×+
=××
×+
=μπη
h
p
Pd
o7<α , so 010.0=μ
pη =screw efficiency;
0d =screw nominal diameter;
hP =screw pitch;
The calculated efficiency was used only as reference in analysis, for the fact that industry products are less efficient than aerospace components. b) Rod stressing Screw contact stress was not calculated, because of the use of existing lead geometry and material. Rod nominal diameter is standard. And rod thickness needs to be redesigned. According to reference [42], the standard shaft material is 40CrMn4, with ultimate tensile strength of 850MPa.
mNNF
Ddnsileultimatete
safetyloadscrewrodscrewrod 039.0
108501416.325.025.175321007.0
25.0 62max2 =
×××××
−=××
××−=
σπ
screwrodd =screw rod inside diameter, m;
screwrodD =rod diameter=0.07m;
maxF =Maximum force=753210 N;
loadN =load factor, set to be 1.5;
safetyN =safety factor, set to be 2;
nsileultimateteσ =ultimate tensile strength=850MPa;

170
The following figure illustrates the roller screw design: Figure G-2: Roller screw geometry
G.2 Gear Pairs Design
A gear ratio of around 50 is reasonable according to design activities. The diameter of roller screw set a limit for the second stage radial size. So, small gear ratio is not efficient. Large gear ratio will increase the outside diameter largely. So the benefits on motor weight saving will be compromised or even overwhelmed by gearbox weight increment. Gear ratio around 50 represents an efficient and compromised solution. The stressing condition of gear teeth is fairly complex. Existing gear teeth information was used. Firstly, the likely contact forces were calculated. Existing gear teeth information, such as reference circle pitch and gear width were chosen accordingly from reference [44] was used. From reference [44], efficiency of a two-stage gear box is around 0.94. This efficiency is very high when compared with that of roller screw. So when stressing the gear pairs, it is accurate enough to assume gear pair efficiency to be 100%. The minimum thickness of wheel was decided by
nsileultimatete
safetyloadgeargear d
NNTt
σπ ××××××
=5.0
22 ,
geart =gear wall thickness, m;
gearT =torque transmitted by gear, Nm;
loadN =load factor, set to be 1.5;
safetyN =safety factor, set to be 2;
nsileultimateteσ =ultimate tensile strength=850MPa;

171
d =diameter where the stress is most critical. The calculated thicknesses are relatively small. Actually thicknesses are deliberately increased to reasonable values. The following table summarizes the gear pairs design:
Table G-1: Gear pairs design First Pair Second Pair
Parameters Gear 1 Gear 2 Gear 3 Gear 4
Gear ratio 7.73 6.78
Reference circle pitch, mm 10 6.67
Number of teeth 85 11 61 9
Pitch diameter, mm 270.6 35 129.5 19.1
Maximum torque, Nm 1651 171.7 171.7 25.3
Maximum force on teeth, N 14443 14443 2651.8 2651.8
Teeth width, mm 29 29 24 24
The following figures show the basic geometry of gear 1 to 3. Gear 4 is one the motor shaft. It is not shown because of its small size:
Figure G-3: Gear 1 geometry
Figure G-4: Gear 2 and gear 3 geometry
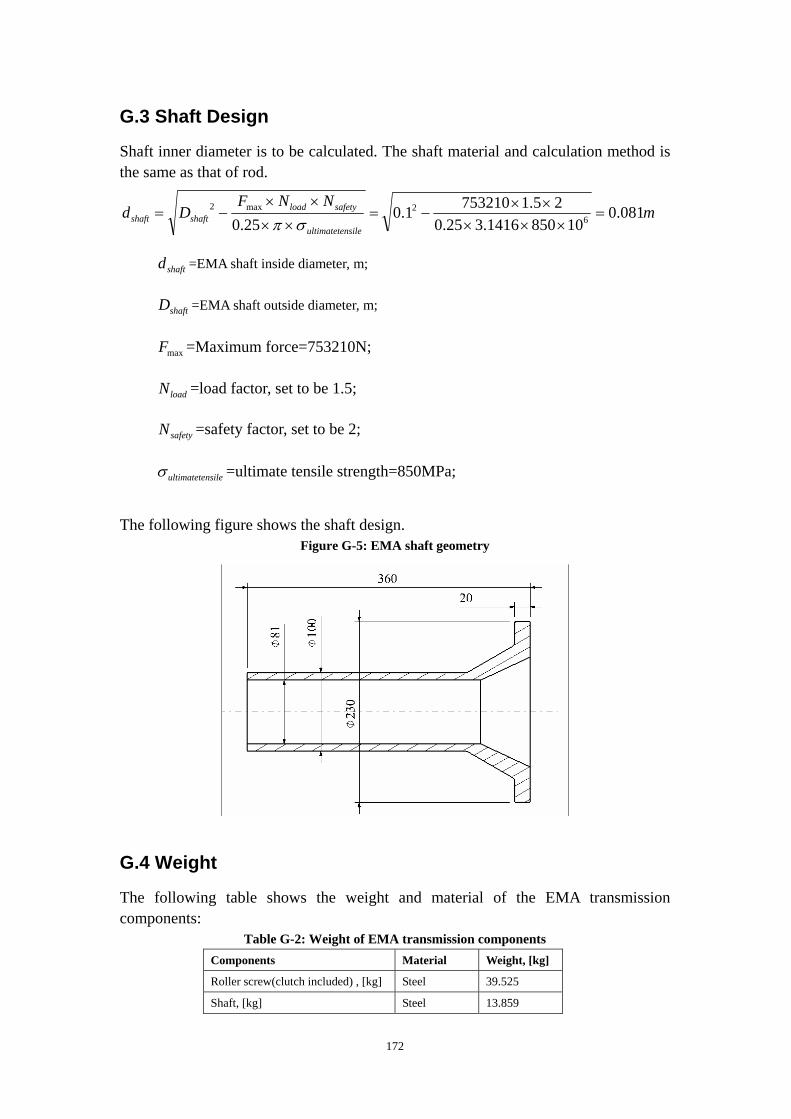
172
G.3 Shaft Design
Shaft inner diameter is to be calculated. The shaft material and calculation method is the same as that of rod.
mNNF
Ddnsileultimatete
safetyloadshaftshaft 081.0
108501416.325.025.17532101.0
25.0 62max2 =
×××××
−=××
××−=
σπ
shaftd =EMA shaft inside diameter, m;
shaftD =EMA shaft outside diameter, m;
maxF =Maximum force=753210N;
loadN =load factor, set to be 1.5;
safetyN =safety factor, set to be 2;
nsileultimateteσ =ultimate tensile strength=850MPa;
The following figure shows the shaft design.
Figure G-5: EMA shaft geometry
G.4 Weight
The following table shows the weight and material of the EMA transmission components:
Table G-2: Weight of EMA transmission components Components Material Weight, [kg]
Roller screw(clutch included) , [kg] Steel 39.525
Shaft, [kg] Steel 13.859

173
Shaft end, [kg] Steel 6.701
Rod end, [kg] Steel 5.22
Gear 1, [kg] Steel 4.601
Gear 2 and 3, [kg] Steel 1.572
Bearings, [kg] Steel 3.324
Mounting case, [kg] Aluminium 4.697
Total transmission weight, [kg] 87.67