Embed Size (px)
Citation preview
1
CRANFIELD UNIVERSITY
ROLANDO VEGA DÍAZ
ANALYSIS OF AN ELECTRIC ENVIRONMENTAL CONTROL SYSTEM TO REDUCE THE ENERGY CONSUMPTION OF
FIXED-WING AND ROTARY-WING AIRCRAFT
SCHOOL OF ENGINEERING MSc by research
MSc BY RESEARCH THESIS Academic Year: 2010 - 2011
Supervisor: Dr Craig Lawson October 2011


3
CRANFIELD UNIVERSITY
School of Engineering
MSc by Research THESIS Academic Year 2010 – 2011
ROLANDO VEGA DÍAZ
ANALYSIS OF AN ELECTRIC ENVIRONMENTAL CONTROL SYSTEM TO REDUCE THE ENERGY CONSUMPTION OF
FIXED-WING AND ROTARY-WING AIRCRAFT
Supervisor: Dr Craig LAWSON
October 2011 This thesis is submitted in fulfilment of the requirements for the
degree of Master of Sciences by research
© Cranfield University 2011. All rights reserved. No part of this publication may be reproduced without the written permission of the
copyright owner

4
i
ABSTRACT
Nowadays the aviation industry is playing an important role in our daily life,
since is the main medium that satisfies the present human needs to reach long
distances in the fastest way. But such benefit doesn’t come free of collateral
consequences. It is estimated that each year, only the air transport industry produces
628 mega tonnes of CO2. Therefore, urgently actions need to be implemented
considering that the current commercial fleet will be doubled by 2050. The research
field for more efficient aircraft systems is a very constructive field; where novel ideas
can be exploited towards the mitigation of the coming air transport development.
In this research the configuration of the Environmental Control System (ECS)
has been analysed aiming to reduce its energy consumption for both, fixed-wing and
rotary-wing aircraft. This goal is expected to be achieved mainly through the
replacement of the main source of power that supplies the ECS, from pneumatic to
electric. Differently from the conventional ECS, a new electric-source technology is
integrated in the system configuration to compare its effects on the energy
consumption. This new technology doesn’t bleed air directly from the engines; instead
of that, it takes the air directly from the atmosphere through the implementation of an
electric compressor. This new technology has been implemented by Boeing in one of
its most recent airplanes, the B787.
Towards achieving the main goal, a framework integrated with five steps has
been designed. An algorithmic analysis is integrated on the framework. The first step
meets the required aircraft characteristics for the analysis. The second step is in
charge of meeting the mission profile characteristics where the overall analysis will be
carried out. The third step assesses the conventional ECS penalties. The fourth step
carries out a complex analysis for the proposed electric ECS model, from its design up
to its penalties assessment. The fifth step compares the analysis results for both, the
conventional and the electric models.
The fourth step of the framework, which analyses the electric ECS, is
considered the most critic one; therefore is divided in three main tasks. Firstly, a small
parametric study is done to select an optimum configuration. This task is carried out
towards meeting the ECS air conditioning requirements of a selected aircraft.
ii
Secondly, the cabin temperature and pressurization are simulated to analyse the
response of the configured electric ECS for a mission profile. And finally, the fuel
penalties are assessed in terms of system weight, drag and fuel due power-off take.
To achieve the framework results, a model which receives the name ELENA
has been created using the tool Simulink®. This model contains 5 interconnected
modules; each one reads a series of inputs to perform calculations and exchange
information with other modules.
Keywords:
Environmental Control System, Fixed-Wing, Rotary-Wing, Energy, Fuel Penalty,
Mission, Air Conditioning, Pressurization, Thermal Balance.

iii
ACKONOWLEDGEMENTS
Firstly, I want to give very special thanks to my mother Rosa Díaz; without such
effort you have placed through my entire life I wouldn’t be the person I am
today. Thanks, thanks so much, mother!
To my entire family whom have been beside me since my childhood in the best
and most difficult moments; especially to my aunts María Elena Díaz† and
Victoria Díaz; and my uncle Eduardo Díaz. Great thanks to you.
At Cranfield University I want to give especial thanks to my supervisor Dr Craig
Lawson for his support and guidance. To Professor Howard Smith by have
been sharing his experience. To Prof Dieter Scholz for its feedback received.
To Shelagh and Francis Glenister by open me its great home and to make me
live this England experience on an unforgettable way.
To Carlos Linares by share its friendship over this MSc experience. To Ignacio
Sanchez by its encouraging words.
To those friends and staff; who make this academic year so enjoyable and
constructive.
Finally, I want to acknowledge Clean Sky JTI (Joint Technology Initiative) for
have been sponsored my research.

v
TABLE OF CONTENTS
ABSTRACT ................................................................................................................... i
ACKONOWLEDGEMENTS .......................................................................................... iii
LIST OF FIGURES ...................................................................................................... xi
LIST OF TABLES ....................................................................................................... xv
NOTATIONS .............................................................................................................. xvii
1. ABREVIATIONS .............................................................................................. xvii
2. LIST OF SYMBOLS ......................................................................................... xix
CHAPTER 1 | INTRODUCTION .................................................................................... 1
1.1. The research for less-energy consuming systems .......................................... 1
1.2. The Environmental Control System ................................................................ 1
1.3. Aim and objective ........................................................................................... 2
1.4. Methodology ................................................................................................... 3
1.5. Thesis Scheme ............................................................................................... 5
CHAPTER 2 | THE ENVIRONMENTAL CONTROL SYSTEM....................................... 7
2.1. The ECS Principles ......................................................................................... 7
2.2. Air Conditioning Configurations..................................................................... 12
2.3. Air Cycle Machine Principles ........................................................................ 14
2.4. The Atmosphere ........................................................................................... 17
Temperature ....................................................................................................................... 18
Static pressure ..................................................................................................................... 18
Density ................................................................................................................................. 19
Speed of sound .................................................................................................................... 19
2.5. Pressurisation ............................................................................................... 19
2.6. Flow Distribution ........................................................................................... 21
2.7. Cabin Thermodynamic Balance .................................................................... 21
2.8. Heat Exchangers .......................................................................................... 23
2.9. Combustion Heating Principles ..................................................................... 24
2.10. Airworthiness Requirements ...................................................................... 25
2.11. Models to Simulate the ECS ...................................................................... 26
2.12. New Technologies ..................................................................................... 26
2.13. The Fuel Penalty ....................................................................................... 27
vi
2.14. Measurement ............................................................................................ 29
2.15. Cost Estimation ......................................................................................... 29
Depreciation Cost ................................................................................................................ 30
Fuel Cost .............................................................................................................................. 31
Direct Maintenance Cost ..................................................................................................... 32
2.16. Airbus A321-200 ....................................................................................... 33
2.17. ATR 72-500 ............................................................................................... 35
2.18. Bell 206 ..................................................................................................... 36
2.19. The Engine Performance Simulation Tool ................................................. 37
2.20. Engine Data for the Engine Performance Tool .......................................... 38
CHAPTER 3 | THE METHODOLOGY OF ANALYSING THE ENVIRONMENTAL
CONTROL SYSTEM................................................................................................... 39
3.1. Research Framework Process ...................................................................... 39
Aircraft Selection ................................................................................................................. 40
Mission Profile ..................................................................................................................... 40
Conventional ECS analysis ................................................................................................... 40
Electric ECS analysis............................................................................................................. 41
Results comparison ............................................................................................................. 41
3.2. The Software for Analysis ............................................................................. 42
3.3. ELENA v1 – Environmental Control System Analysis Tool ........................... 43
Framework scheme ............................................................................................................. 43
Simulink scheme .................................................................................................................. 44
3.4. AIRCRAFT INPUTS ...................................................................................... 48
3.5. MISSION PROFILE CALCULATIONS .......................................................... 49
Mission Inputs ..................................................................................................................... 51
Mission Outputs .................................................................................................................. 52
Cruise Values ....................................................................................................................... 53
Mission profile signals ......................................................................................................... 55
Departure/Arrival airport values ......................................................................................... 58
3.6. ELECTRIC ECS CONDITIONING PACK ...................................................... 59
ECS Conditioning Pack Inputs .............................................................................................. 63
Conditioning Pack Outputs .................................................................................................. 64
Compressor ......................................................................................................................... 65
Fan ....................................................................................................................................... 66
vii
Heat Exchanger ................................................................................................................... 68
Turbine ................................................................................................................................ 69
Manifold .............................................................................................................................. 70
ECS Selection Signal ............................................................................................................. 71
SFC rate increase due to Pneumatic and Electric Powers ................................................... 71
3.7. CABIN SIMULATION CALCULATIONS ........................................................ 72
Thermal Balance .................................................................................................................. 72
Pressure Module ................................................................................................................. 76
3.8. FUEL PENALTY CALCULATIONS ............................................................... 80
ECS Fuel Flow Penalties ....................................................................................................... 82
ECS Drag Penalties ............................................................................................................... 83
ECS Weight Penalties........................................................................................................... 85
ECS Total Fuel Weight for the Mission ................................................................................ 87
3.9. FUEL PENALTY FOR A COMBUSTION HEATER ....................................... 88
3.10. MODEL SPECIFICATIONS ....................................................................... 91
3.11. VALIDATION PROCESS .......................................................................... 91
Mission Profile ..................................................................................................................... 91
ECS power consumption ..................................................................................................... 92
Electric ECS power Consumption ........................................................................................ 92
Temperature ....................................................................................................................... 94
Pressure ............................................................................................................................... 95
Fuel penalties ...................................................................................................................... 95
CHAPTER 4 | FIXED-WING AIRCRAFT ANALISYS 1 - A CIVIL TURBO-FAN
AIRPLANE .................................................................................................................. 99
4.1. Aircraft Selection .......................................................................................... 99
4.2. Mission Profile ............................................................................................ 100
4.3. Conventional ECS Analysis ........................................................................ 102
Pneumatic energy required ............................................................................................... 102
Engine SFC impact ............................................................................................................. 102
Conventional model impact .............................................................................................. 103
4.4. Electric ECS Analysis ................................................................................. 104
Conditioning pack configuration ....................................................................................... 104
Electric ECS electric energy required ................................................................................ 108
viii
Engine SFC impact ............................................................................................................. 108
Electric ECS model impact ................................................................................................. 109
4.5. Results comparison .................................................................................... 110
4.6. Fuel Cost .................................................................................................... 113
CHAPTER 5 | FIXED-WING AIRCRAFT ANALISYS 2 - A REGIONAL TURBO-PROP
AIRPLANE ................................................................................................................ 115
5.1. Aircraft Selection ........................................................................................ 115
5.2. Mission Profile ............................................................................................ 116
5.3. Conventional ECS Analysis ........................................................................ 118
Pneumatic energy required ............................................................................................... 118
Engine SFC impact ............................................................................................................. 118
Conventional model impact .............................................................................................. 119
5.4. Electric ECS Analysis ................................................................................. 120
Conditioning pack configuration ....................................................................................... 120
Electric ECS electric energy required ................................................................................ 124
Engine SFC impact ............................................................................................................. 124
Electric ECS model impact ................................................................................................. 125
5.5. Results comparison .................................................................................... 126
5.6. Fuel Cost .................................................................................................... 129
CHAPTER 6 | ROTARY-WING AIRCRAFT ANALISYS FOR A 5 PASSENGERS
HELICOPTER ........................................................................................................... 131
6.1. Aircraft Selection ........................................................................................ 131
6.2. Mission Profile ............................................................................................ 132
6.3. Conventional ECS Analysis ........................................................................ 133
Pneumatic energy required ............................................................................................... 134
Engine SFC impact ............................................................................................................. 134
Conventional model impact .............................................................................................. 135
6.4. Electric ECS Analysis ................................................................................. 135
Conditioning pack configuration ....................................................................................... 135
Electric ECS electric energy required ................................................................................ 138
Engine SFC impact ............................................................................................................. 138
Electric ECS model impact ................................................................................................. 139
6.5. Combustion heater ..................................................................................... 139
6.6. Results comparison .................................................................................... 141
ix
6.7. Fuel Cost .................................................................................................... 144
CHAPTER 7 | CONCLUSIONS ................................................................................. 145
CHAPTER 8 | RECOMMENDATIONS FOR FUTURE WORK .................................. 147
REFERENCES ......................................................................................................... 149
BIBLIOGRAPHY ....................................................................................................... 151
APPENDIX A – PREVIOUS SIMULATION FRAMEWORK ....................................... 155
APPENDIX B – Alternative method to calculate the fuel penalty ............................... 156
APPENDIX C – PREVIOUR FRAMEWORK PROCESS ........................................... 158
APPENDIX D - CONCEPTUAL ELECTRIC ECS DESIGN FOR A FLYING WING ... 161

xi
LIST OF FIGURES
Page.
Figure 1: Common ECS scheme for fixed-wing aircraft ................................................. 2
Figure 2: Framework flowchart ...................................................................................... 4
Figure 3: Common ECS scheme for fixed-wing aircraft ................................................. 7
Figure 4: ECS air sources distribution ........................................................................... 8
Figure 5: Pneumatic energy outputs ............................................................................. 9
Figure 6: Engine bleed flow pressure and temperature at various flight stages ............. 9
Figure 7: ECS air conditioning section ........................................................................ 10
Figure 8: Basic ECS scheme with the control unit ....................................................... 11
Figure 9: ECS cockpit control unit ............................................................................... 11
Figure 10: Common ECS scheme for rotary-wing aircraft ........................................... 14
Figure 11: Air Cycle Machine - Turbofan ..................................................................... 15
Figure 12: Air Cycle Machine - Bootstrap .................................................................... 15
Figure 13: Air Cycle Machine - 3-Wheel ...................................................................... 16
Figure 14: Temperature values for different altitudes at the atmosphere ..................... 18
Figure 15: Pressure levels at different altitudes ........................................................... 20
Figure 16: Cabin pressurization achieved by the control unit ...................................... 20
Figure 17: Airplane cabin air distribution ..................................................................... 22
Figure 18: Helicopter air distribution ............................................................................ 22
Figure 19: Heat Exchanger ......................................................................................... 24
Figure 20: Combustion Heater .................................................................................... 25
Figure 21: Flowmaster V7 ........................................................................................... 26
Figure 22: Decimals .................................................................................................... 29
Figure 23: Depreciation over time ............................................................................... 30
Figure 24: Airbus A321-200 ........................................................................................ 33
Figure 25: Airbus A321 Air Cycle Machine .................................................................. 34
Figure 26: Airbus 321 ECS scheme ............................................................................ 34
Figure 27: ATR 72-500 ............................................................................................... 35
Figure 28: Cabin of the ATR 72-500 ........................................................................... 36
Figure 29: Bell 206 ...................................................................................................... 36
Figure 30: Turbomatch ................................................................................................ 37
Figure 31: GasTurb 11 Entry Level Version ................................................................ 38
Figure 32: Detailed flowchart for the analysis process ................................................ 39
Figure 33: Mission profile for ELENA .......................................................................... 40
Figure 34: Simulation framework for ELENA v1 .......................................................... 43
Figure 35: Simulation framework for the rotary-wing aircraft ....................................... 44
Figure 36: Final version of the Simulink model ELENA ............................................... 44
Figure 37: Final version of the Simulink model ELENA (Left view) .............................. 45
Figure 38: Final version of the Simulink model ELENA (Right view) ............................ 46
Figure 39: Simulink model for the rotary-wing aircraft ................................................. 47
Figure 40: Aircraft Database Characteristics ............................................................... 48
xii
Figure 41: Mission Profile Module ............................................................................... 50
Figure 42: Content for the box of mission profile calculations ...................................... 51
Figure 43: Mission cruise calculations in ELENA ........................................................ 53
Figure 44: Aircraft speed calculation in ELENA ........................................................... 55
Figure 45: Flight path to be followed by the algorithm ................................................. 56
Figure 46: Algorithm for the flight path, designed in ELENA ........................................ 57
Figure 47: Box for departure/arrival airport in ELENA ................................................. 58
Figure 48: Departure airport calculations in ELENA .................................................... 58
Figure 49: Arrival airport calculations in ELENA .......................................................... 59
Figure 50: Electric ECS typical components ............................................................... 61
Figure 51: Conditioning Pack Module ......................................................................... 61
Figure 52: Conditioning pack module in ELENA .......................................................... 62
Figure 53: Conditioning pack module in ELENA (Left side) ......................................... 62
Figure 54: Conditioning pack module in ELENA (Right side) ....................................... 63
Figure 55: ECS flow requirement in ELENA ................................................................ 65
Figure 56: Air Cycle Machine - Compressor calculations in ELENA ............................ 65
Figure 57: Air Cycle Machine - Fan calculations in ELENA ......................................... 66
Figure 58: Air Cycle Machine - Heat exchanger calculations for ELENA ..................... 68
Figure 59: Air Cycle Machine - Turbine calculations for ELENA .................................. 69
Figure 60: Air Cycle Machine - Manifold calculations for ELENA ................................ 70
Figure 61: Cabin simulator module in ELENA ............................................................. 72
Figure 62: Content of the module for simulation .......................................................... 72
Figure 63: Calculations for the thermal balance inside ELENA ................................... 73
Figure 64: Heat loads .................................................................................................. 74
Figure 65: Internal volume energy............................................................................... 74
Figure 66: Strategy to regulate the cabin temperature ................................................ 76
Figure 67: Calculations for pressurization in ELENA ................................................... 77
Figure 68: Pressurization box in ELENA ..................................................................... 77
Figure 69: Rate of pressure entering in the aircraft cabin ............................................ 78
Figure 70: Calculations for the Pressure Release Valve Area in ELENA ..................... 79
Figure 71: Fuel Penalty Module for ELENA ................................................................. 80
Figure 72: Energy penalties calculations in ELENA .................................................... 81
Figure 73: Fuel penalties calculations due to power-off take ....................................... 82
Figure 74: Aircraft performance calculations ............................................................... 84
Figure 75: System weight penalty in ELENA ............................................................... 86
Figure 76: Combustion heater module on a first-stage model version ......................... 88
Figure 77: Combustion heater scheme ....................................................................... 89
Figure 78: Mission profile validation ............................................................................ 92
Figure 79: Electric power consumption depending on the aircraft size (image from
Lebherr) ...................................................................................................................... 93
Figure 80: Cabin temperature for the A321-200 .......................................................... 94
Figure 81: Cabin temperature for the ATR 72-500 ...................................................... 94
Figure 82: Cabin temperature for the Bell 206 ............................................................ 94
Figure 83: Pressurization validation ............................................................................ 95
Figure 84: Mission profile: Route London Heathrow-Paris Charles De Gaulle ........... 100
xiii
Figure 85: Input data for the mission profile between the airports, London Heathrow
and Paris Charles De Gaulle ..................................................................................... 100
Figure 86: Time [s] vs. Altitude, Temperature and Pressure outputs delivered by the
conditioning pack ...................................................................................................... 105
Figure 87: Time [s] vs. Altitude and Cabin Temperature ........................................... 106
Figure 88: Time [s] vs. Cabin Temperature ............................................................... 106
Figure 89: Time [s] vs. Altitude, Cabin and Atmospheric Pressures, Pressure
Differential and Pressure Release Valve Area .......................................................... 107
Figure 90: Estimated fuel cost for the electric and conventional ECS's in the Airbus
A321-200 .................................................................................................................. 113
Figure 91: Mission profile: Route Barcelona El Prat and Madrid Barajas................... 116
Figure 92: Input data for the mission profile between Barcelona El Prat and Madrid
Barajas ..................................................................................................................... 116
Figure 93: Time [s] vs. Altitude, Temperature and Pressure outputs delivered by the
conditioning pack ...................................................................................................... 121
Figure 94: Time [s] vs. Altitude and Cabin Temperature ........................................... 122
Figure 95: Time [s] vs. Cabin Temperature ............................................................... 122
Figure 96: Time [s] vs. Altitude, Cabin and Atmospheric Pressures, Pressure
Differential and Pressure Release Valve Area .......................................................... 123
Figure 97: Estimated fuel cost for the electric and conventional ECS's in the ATR 72-
500 ........................................................................................................................... 129
Figure 98: Mission profile: Route Cranfield University Airport to London City Airport 132
Figure 99: Input data for the mission profile between Cranfield University Airport and
London City Airport ................................................................................................... 132
Figure 100: Temperature range output delivered by the conditioning pack ............... 136
Figure 101: Temperature output delivered by the conditioning pack ......................... 137
Figure 102: Temperature output delivered by the conditioning pack ......................... 138
Figure 103: Estimated fuel cost for the electric and conventional ECS's in the Bell 206
................................................................................................................................. 144
Figure 104: Scheme for the previous version of the analysis model .......................... 155
Figure 105: Previous version, built on Simulink ®, of the ECS simulation model ....... 155

xv
LIST OF TABLES
Page.
Table 1: Most common helicopters registered in the United Kingdom ......................... 13
Table 2: ISA sea level conditions ................................................................................ 17
Table 3: ECS concepts comparison ............................................................................ 27
Table 4: Data for the 787 ECS .................................................................................... 27
Table 5: Considerations for future direct maintenance cost estimations ...................... 32
Table 6: Engine inputs for the engine performance simulation tool ............................. 38
Table 7: Level of model accuracy................................................................................ 42
Table 8: Aircraft inputs ................................................................................................ 49
Table 9: Mission Inputs ............................................................................................... 52
Table 10: Electric ECS typical components ................................................................. 60
Table 11: Conditioning Pack Configuration Inputs ....................................................... 64
Table 12: Difference in components for the electric and conventional ECS's .............. 85
Table 13: ECS model interface ................................................................................... 91
Table 14: Electric ECS power consumption per passenger ......................................... 93
Table 15: Aircraft inputs: Airbus A321-200 .................................................................. 99
Table 16: Mission Inputs ........................................................................................... 101
Table 17: Pneumatic power required ........................................................................ 102
Table 18: Engine SFC Impact ................................................................................... 102
Table 19: ECS configuration inputs ........................................................................... 103
Table 20: Conventional ECS fuel penalties ............................................................... 103
Table 21: ECS configuration inputs ........................................................................... 104
Table 22: Electric energy requirement ...................................................................... 108
Table 23: Engine SFC Impact ................................................................................... 108
Table 24: ECS configuration inputs ........................................................................... 108
Table 25: Electric ECS fuel penalties ........................................................................ 109
Table 26: Results comparison for the conventional and electric ECS's ..................... 110
Table 27: Results comparison for the conventional and electric ECS's (with the 90 % of
the original ECS weight) ........................................................................................... 111
Table 28: Results comparison for the conventional and electric ECS's (with the 110 %
of the original ECS weight)........................................................................................ 112
Table 29: Aircraft inputs: ATR 72-500 ....................................................................... 115
Table 30: Pneumatic power required ........................................................................ 118
Table 31: Engine SFC Impact ................................................................................... 118
Table 32: ECS configuration inputs ........................................................................... 119
Table 33: Conventional ECS fuel penalties ............................................................... 119
Table 34: ECS configuration inputs ........................................................................... 120
Table 35: Electric energy required ............................................................................ 124
Table 36: Engine SFC Impact ................................................................................... 124
Table 37: ECS configuration inputs ........................................................................... 124
Table 38: Electric ECS fuel penalties ........................................................................ 125
xvi
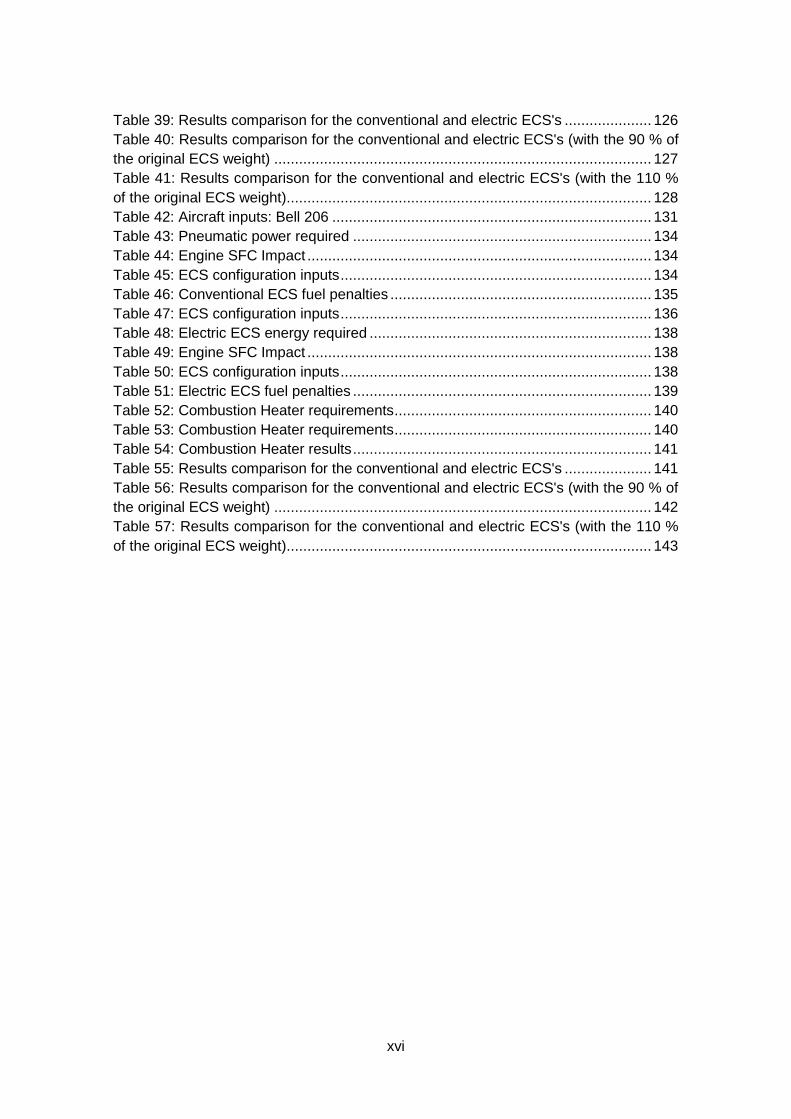
Table 39: Results comparison for the conventional and electric ECS's ..................... 126
Table 40: Results comparison for the conventional and electric ECS's (with the 90 % of
the original ECS weight) ........................................................................................... 127
Table 41: Results comparison for the conventional and electric ECS's (with the 110 %
of the original ECS weight)........................................................................................ 128
Table 42: Aircraft inputs: Bell 206 ............................................................................. 131
Table 43: Pneumatic power required ........................................................................ 134
Table 44: Engine SFC Impact ................................................................................... 134
Table 45: ECS configuration inputs ........................................................................... 134
Table 46: Conventional ECS fuel penalties ............................................................... 135
Table 47: ECS configuration inputs ........................................................................... 136
Table 48: Electric ECS energy required .................................................................... 138
Table 49: Engine SFC Impact ................................................................................... 138
Table 50: ECS configuration inputs ........................................................................... 138
Table 51: Electric ECS fuel penalties ........................................................................ 139
Table 52: Combustion Heater requirements .............................................................. 140
Table 53: Combustion Heater requirements .............................................................. 140
Table 54: Combustion Heater results ........................................................................ 141
Table 55: Results comparison for the conventional and electric ECS's ..................... 141
Table 56: Results comparison for the conventional and electric ECS's (with the 90 % of
the original ECS weight) ........................................................................................... 142
Table 57: Results comparison for the conventional and electric ECS's (with the 110 %
of the original ECS weight)........................................................................................ 143
xvii
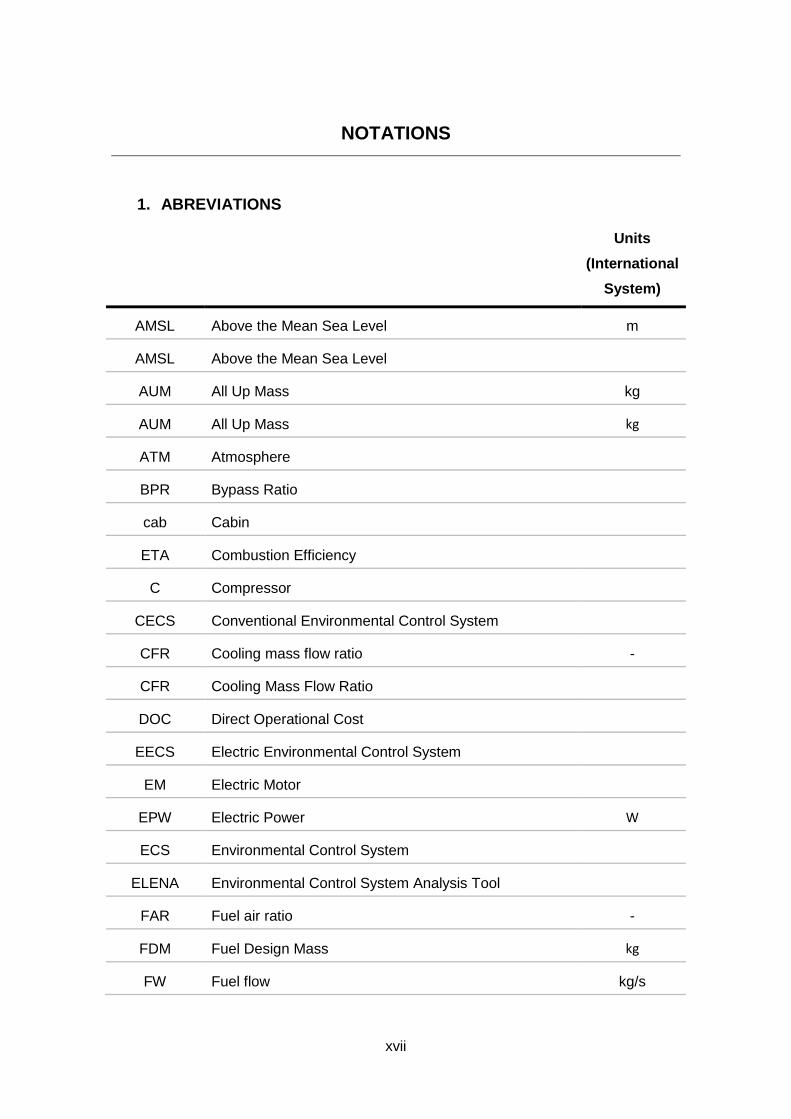
NOTATIONS
1. ABREVIATIONS
Units
(International
System)
AMSL Above the Mean Sea Level m
AMSL Above the Mean Sea Level
AUM All Up Mass kg
AUM All Up Mass kg
ATM Atmosphere
BPR Bypass Ratio
cab Cabin
ETA Combustion Efficiency
C Compressor
CECS Conventional Environmental Control System
CFR Cooling mass flow ratio -
CFR Cooling Mass Flow Ratio
DOC Direct Operational Cost
EECS Electric Environmental Control System
EM Electric Motor
EPW Electric Power W
ECS Environmental Control System
ELENA Environmental Control System Analysis Tool
FAR Fuel air ratio -
FDM Fuel Design Mass kg
FW Fuel flow kg/s
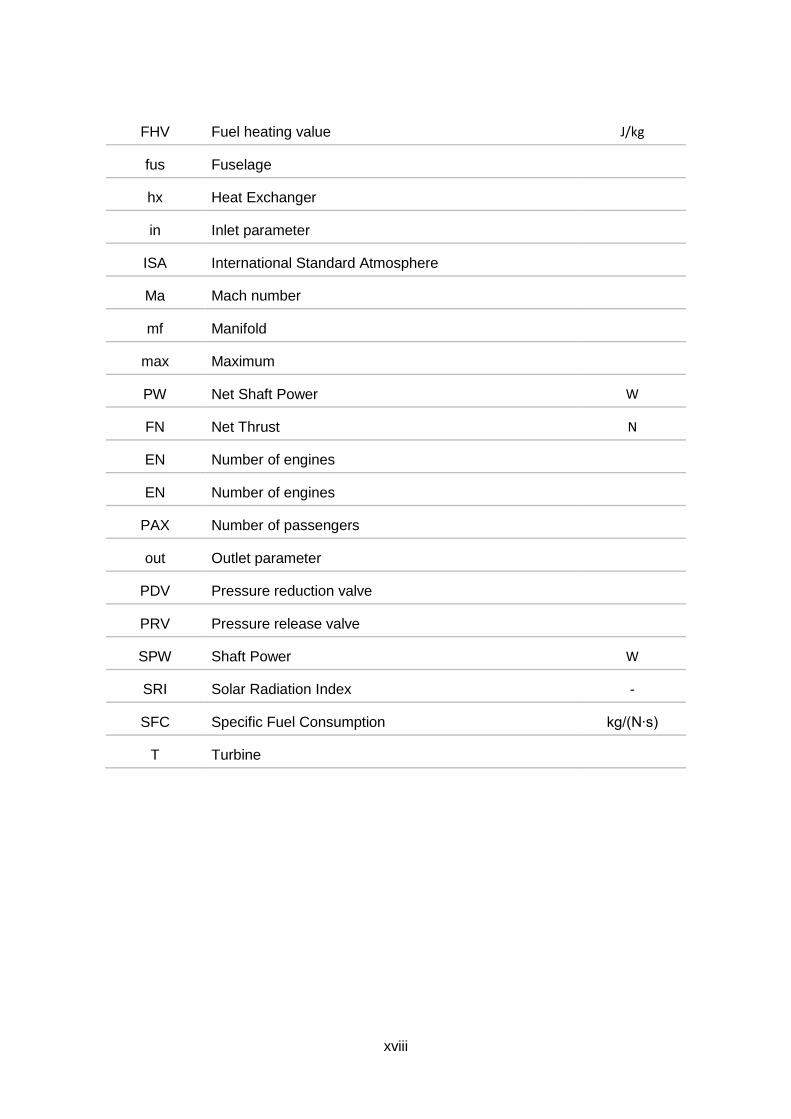
xviii
FHV Fuel heating value J/kg
fus Fuselage
hx Heat Exchanger
in Inlet parameter
ISA International Standard Atmosphere
Ma Mach number
mf Manifold
max Maximum
PW Net Shaft Power W
FN Net Thrust N
EN Number of engines
EN Number of engines
PAX Number of passengers
out Outlet parameter
PDV Pressure reduction valve
PRV Pressure release valve
SPW Shaft Power W
SRI Solar Radiation Index -
SFC Specific Fuel Consumption kg/(N∙s)
T Turbine
Chapter 1 | Introduction
xix
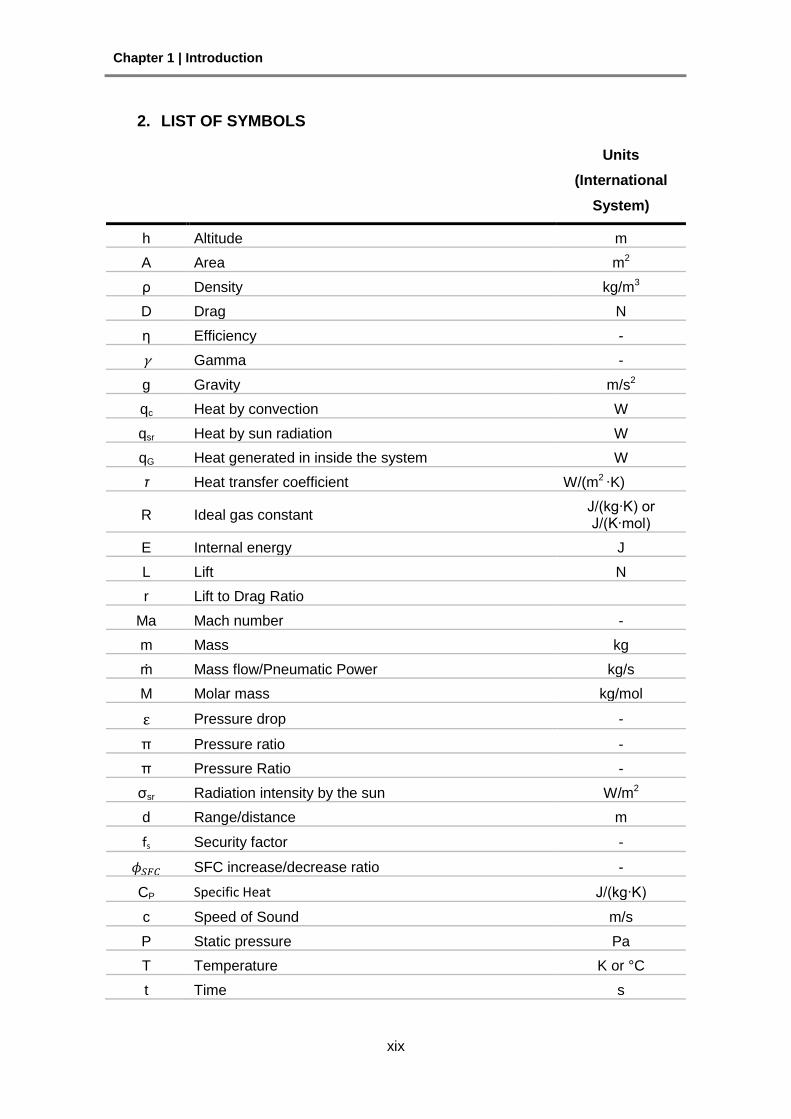
2. LIST OF SYMBOLS
Units
(International
System)
h Altitude m
A Area m2
ρ Density kg/m3
D Drag N
η Efficiency -
γ Gamma -
g Gravity m/s2
qc Heat by convection W
qsr Heat by sun radiation W
qG Heat generated in inside the system W
τ Heat transfer coefficient W/(m2 ∙K)
R Ideal gas constant J/(kg∙K) or J/(K∙mol)
E Internal energy J
L Lift N
r Lift to Drag Ratio
Ma Mach number -
m Mass kg
ṁ Mass flow/Pneumatic Power kg/s
M Molar mass kg/mol
Pressure drop -
π Pressure ratio -
π Pressure Ratio -
σsr Radiation intensity by the sun W/m2
d Range/distance m
fs Security factor -
SFC increase/decrease ratio -
CP Specific Heat J/(kg∙K)
c Speed of Sound m/s
P Static pressure Pa
T Temperature K or °C
t Time s

Chapter 1 | Introduction
xx
t Time sec
Q Total heat W
v Velocity/Speed m/s
vs Vertical speed m/s
V Volume m3
W Weight N
Chapter 1 | Introduction
1
CHAPTER 1 | INTRODUCTION
1.1. The research for less-energy consuming systems
Nowadays the environmental impact produced by the air transportation industry has
been a matter of big concern; according with [1]Clean Sky JTI (Joint Technology
Initiative) it represents 2% of human-induced CO2 emissions and 12% of the overall
transport systems. This impact is reflected by the 628 mega tonnes of CO2 produced
yearly. Urgently strategies need to be implemented since it is estimated that the
commercial fleet will be doubled by 2050 due to the introduction of about 1300 new
international airports. Such strategies can be implemented with the research on less-
energy consumer technologies in the aircraft systems. This is a field where novel ideas
can be exploited to mitigate the coming collateral effects of the air transport industry.
1.2. The Environmental Control System
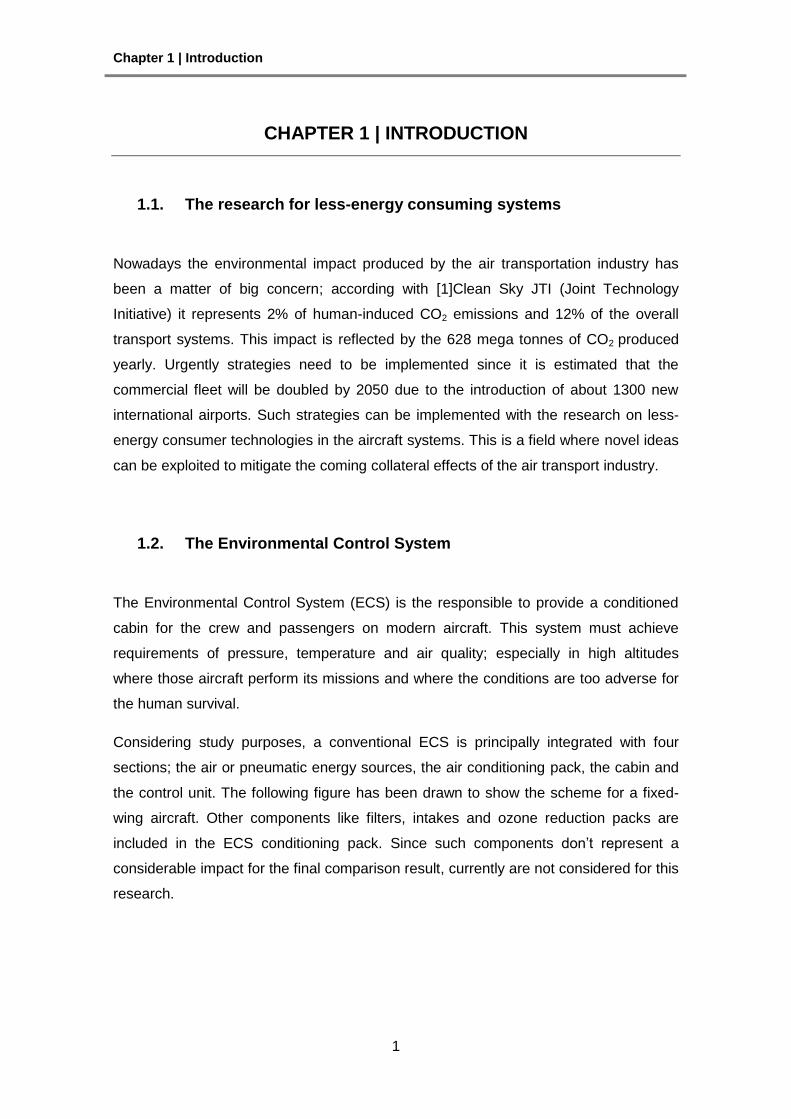
The Environmental Control System (ECS) is the responsible to provide a conditioned
cabin for the crew and passengers on modern aircraft. This system must achieve
requirements of pressure, temperature and air quality; especially in high altitudes
where those aircraft perform its missions and where the conditions are too adverse for
the human survival.
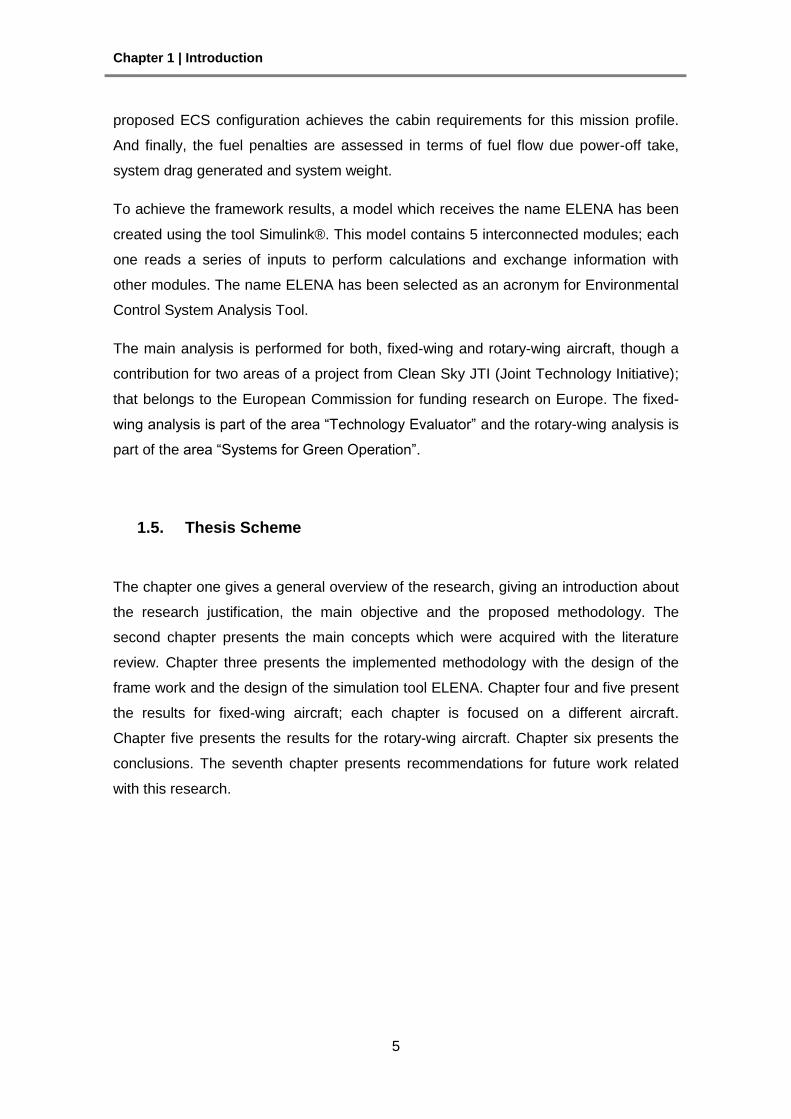
Considering study purposes, a conventional ECS is principally integrated with four
sections; the air or pneumatic energy sources, the air conditioning pack, the cabin and
the control unit. The following figure has been drawn to show the scheme for a fixed-
wing aircraft. Other components like filters, intakes and ozone reduction packs are
included in the ECS conditioning pack. Since such components don’t represent a
considerable impact for the final comparison result, currently are not considered for this
research.
Chapter 1 | Introduction
2
Figure 1: Common ECS scheme for fixed-wing aircraft
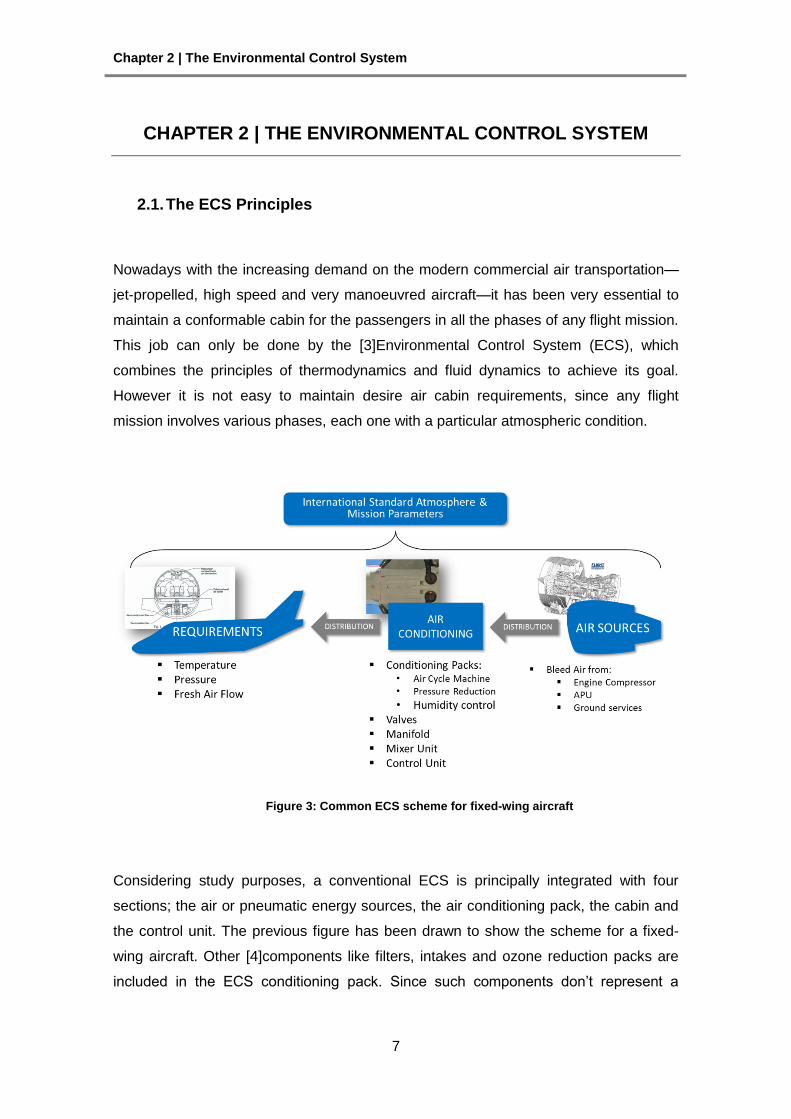
As seen on the previous figure, the pneumatic energy source provides the flow with an
internal energy, which can be measured in terms of mass flow for thermal balance
calculations. This mass flow is associated with their respective temperature, pressure
and density. Depending on the kind of pneumatic source and the mission status, the
mass flow can be provided with different characteristics. The pneumatic energy can be
provided from engine bleeding, an Alternate Power Unit APU or simply form ground
services when the aircraft is parked at the airport.
1.3. Aim and objective
Following the strategies to mitigate the environmental impact, a research is outlined for
the energy consumption of the Environmental Control System (ECS). The ECS is the
most energy-demanding system in the aircraft, consuming up to [2]75% of the energy
designated for the aircraft systems and the 3-5% of the power produced by the
engines. The importance in analysing the energy consumption of the ECS, allow us to
improve the efficiency of the entire system altering their configuration, hence resulting
on a reduction of the energy requirement for the aircraft and consequently for their
emissions.
Chapter 1 | Introduction
3
Is expected that the application of an electric ECS will achieve positive values on the
reduction of the fuel penalty; since the process of bleeding air involves a considerable
quantity of energy lose. This energy lose is represented with the reduction on the
engine mass flow available; pressure drops through the ECS pipelines and
temperature lose through the overall system.
1.4. Methodology
Aiming to achieve the main goal, the main source of power that supplies the ECS is
replaced, from pneumatic to electric. Differently from the conventional ECS, a new
electric-source technology is integrated in the system configuration to compare its
effects on the energy consumption. This new technology doesn’t bleed air directly from
the engines; instead of that, it takes the air directly from the atmosphere through the
implementation of an electric compressor. This new technology has been implemented
by Boeing in one of its most recent airplanes, the B787.
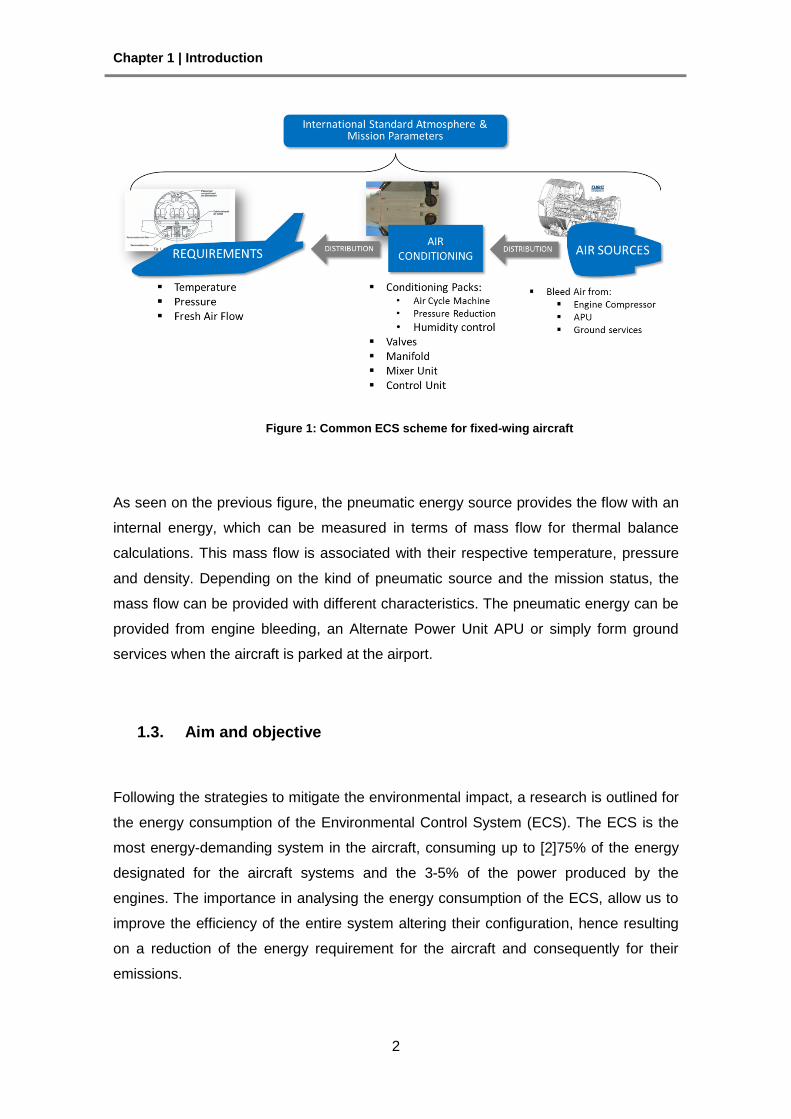
In addition, to achieve the main goal a framework integrated with five steps has been
designed. An algorithmic analysis is integrated on the framework. The first step meets
the required aircraft characteristics for the analysis. The second step is in charge of
meeting the mission profile characteristics where the overall analysis will be carried
out; this mission profile includes the three main flight phases, climbing, cruise and a
descent. The third step assesses the conventional ECS fuel penalties. The fourth step
carries out a complex analysis for the proposed electric ECS model. The fifth step
compares the analysis results for both, the conventional and the electric models. The
framework algorithm is shown in the following figure.
Chapter 1 | Introduction
4
Figure 2: Framework flowchart
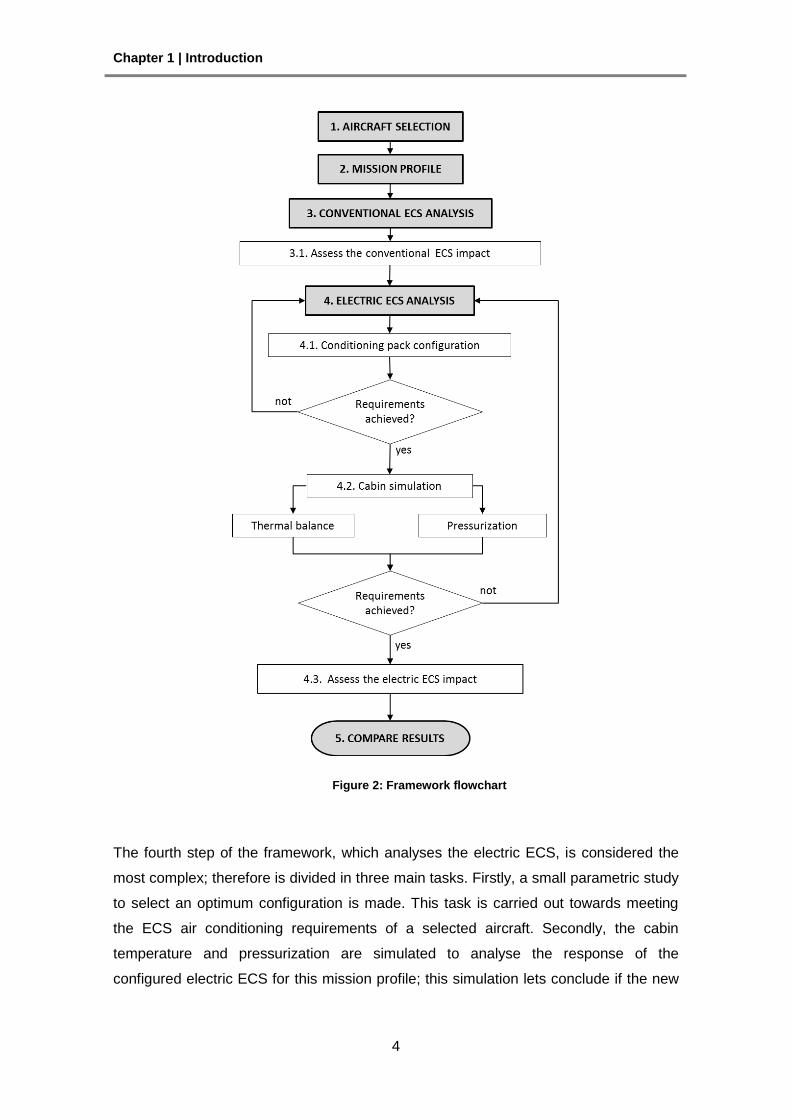
The fourth step of the framework, which analyses the electric ECS, is considered the
most complex; therefore is divided in three main tasks. Firstly, a small parametric study
to select an optimum configuration is made. This task is carried out towards meeting
the ECS air conditioning requirements of a selected aircraft. Secondly, the cabin
temperature and pressurization are simulated to analyse the response of the
configured electric ECS for this mission profile; this simulation lets conclude if the new
Chapter 1 | Introduction
5
proposed ECS configuration achieves the cabin requirements for this mission profile.
And finally, the fuel penalties are assessed in terms of fuel flow due power-off take,
system drag generated and system weight.
To achieve the framework results, a model which receives the name ELENA has been
created using the tool Simulink®. This model contains 5 interconnected modules; each
one reads a series of inputs to perform calculations and exchange information with
other modules. The name ELENA has been selected as an acronym for Environmental
Control System Analysis Tool.
The main analysis is performed for both, fixed-wing and rotary-wing aircraft, though a
contribution for two areas of a project from Clean Sky JTI (Joint Technology Initiative);
that belongs to the European Commission for funding research on Europe. The fixed-
wing analysis is part of the area ―Technology Evaluator‖ and the rotary-wing analysis is
part of the area ―Systems for Green Operation‖.
1.5. Thesis Scheme
The chapter one gives a general overview of the research, giving an introduction about
the research justification, the main objective and the proposed methodology. The
second chapter presents the main concepts which were acquired with the literature
review. Chapter three presents the implemented methodology with the design of the
frame work and the design of the simulation tool ELENA. Chapter four and five present
the results for fixed-wing aircraft; each chapter is focused on a different aircraft.
Chapter five presents the results for the rotary-wing aircraft. Chapter six presents the
conclusions. The seventh chapter presents recommendations for future work related
with this research.

Chapter 2 | The Environmental Control System
7
CHAPTER 2 | THE ENVIRONMENTAL CONTROL SYSTEM
2.1. The ECS Principles
Nowadays with the increasing demand on the modern commercial air transportation—
jet-propelled, high speed and very manoeuvred aircraft—it has been very essential to
maintain a conformable cabin for the passengers in all the phases of any flight mission.
This job can only be done by the [3]Environmental Control System (ECS), which
combines the principles of thermodynamics and fluid dynamics to achieve its goal.
However it is not easy to maintain desire air cabin requirements, since any flight
mission involves various phases, each one with a particular atmospheric condition.
Figure 3: Common ECS scheme for fixed-wing aircraft
Considering study purposes, a conventional ECS is principally integrated with four
sections; the air or pneumatic energy sources, the air conditioning pack, the cabin and
the control unit. The previous figure has been drawn to show the scheme for a fixed-
wing aircraft. Other [4]components like filters, intakes and ozone reduction packs are
included in the ECS conditioning pack. Since such components don’t represent a
Chapter 2 | The Environmental Control System
8
considerable impact for the final comparison result, currently are not considered for this
research.
As seen on the previous figure, the pneumatic energy source provides the flow with an
internal energy, which can be measured in terms of mass flow for thermal balance
calculations. This mass flow is associated with their respective temperature, pressure
and density. Depending on the kind of pneumatic source and the mission status, the
mass flow can be provided with different characteristics. This pneumatic energy can be
provided from engine bleeding, an Alternate Power Unit APU or simply form ground
services when the aircraft is parked at the airport. The following figure has been drawn
to show the distribution of pneumatic power from its sources.
Figure 4: ECS air sources distribution
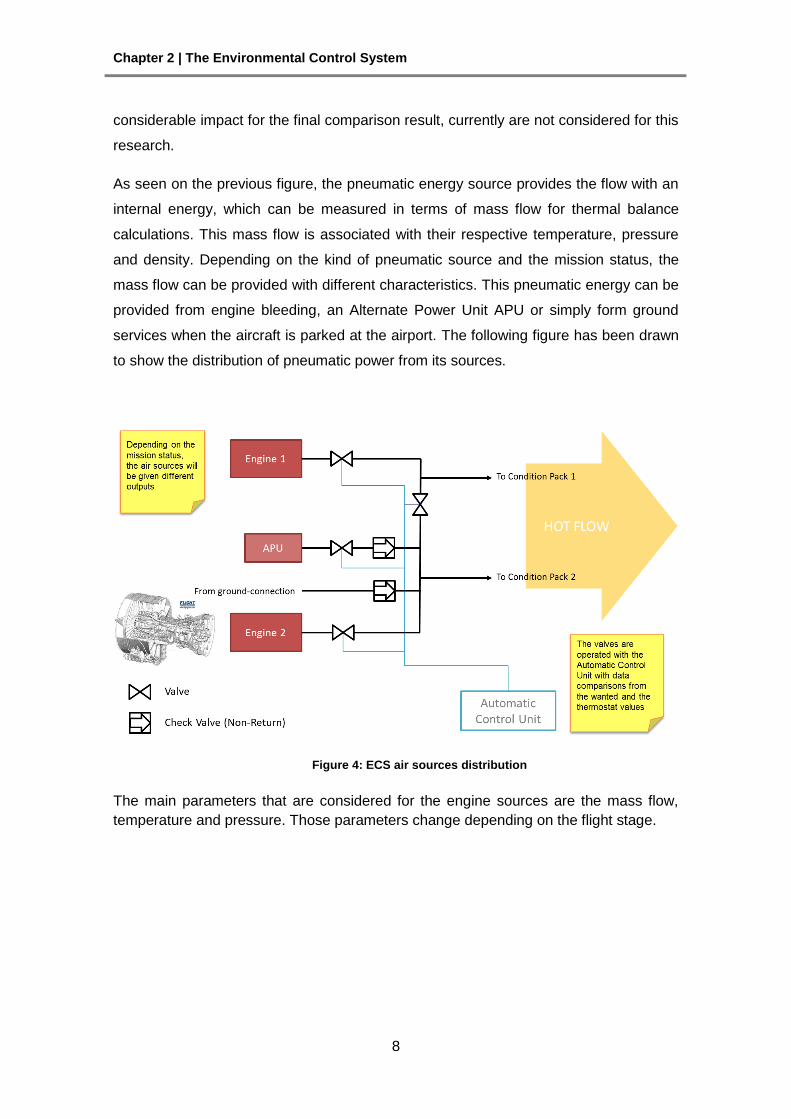
The main parameters that are considered for the engine sources are the mass flow,
temperature and pressure. Those parameters change depending on the flight stage.
Chapter 2 | The Environmental Control System
9
Figure 5: Pneumatic energy outputs
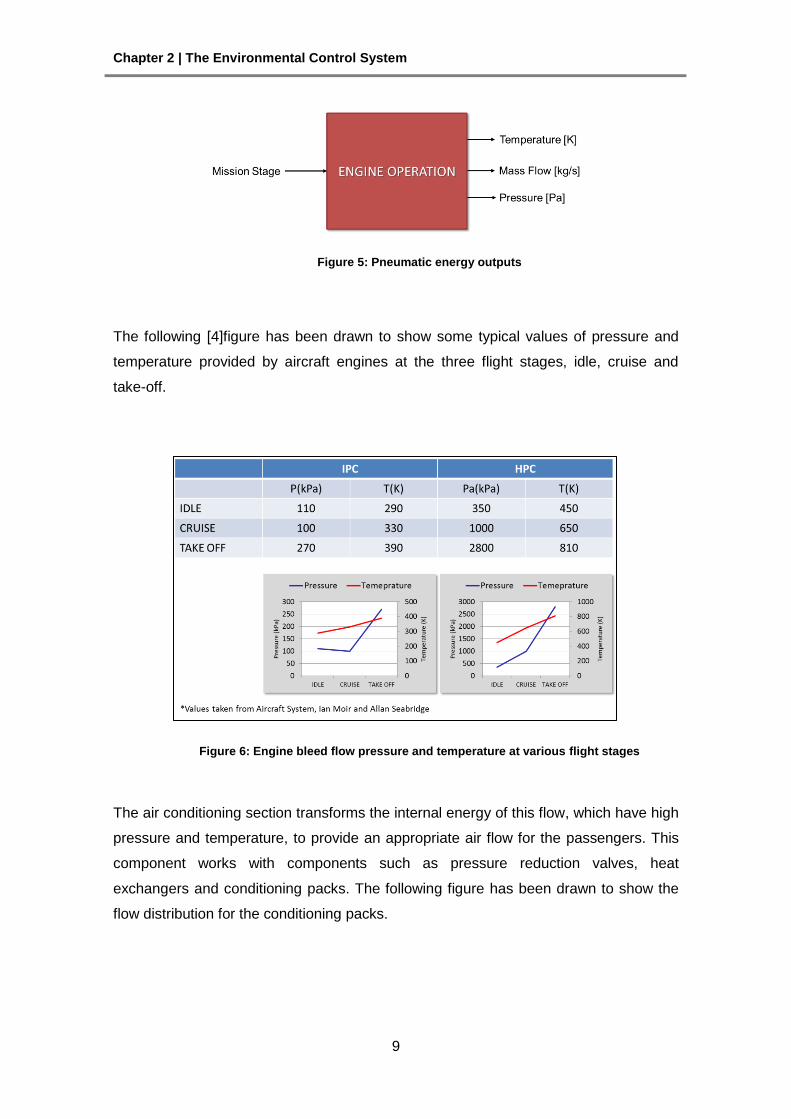
The following [4]figure has been drawn to show some typical values of pressure and
temperature provided by aircraft engines at the three flight stages, idle, cruise and
take-off.
Figure 6: Engine bleed flow pressure and temperature at various flight stages
The air conditioning section transforms the internal energy of this flow, which have high
pressure and temperature, to provide an appropriate air flow for the passengers. This
component works with components such as pressure reduction valves, heat
exchangers and conditioning packs. The following figure has been drawn to show the
flow distribution for the conditioning packs.
Chapter 2 | The Environmental Control System
10
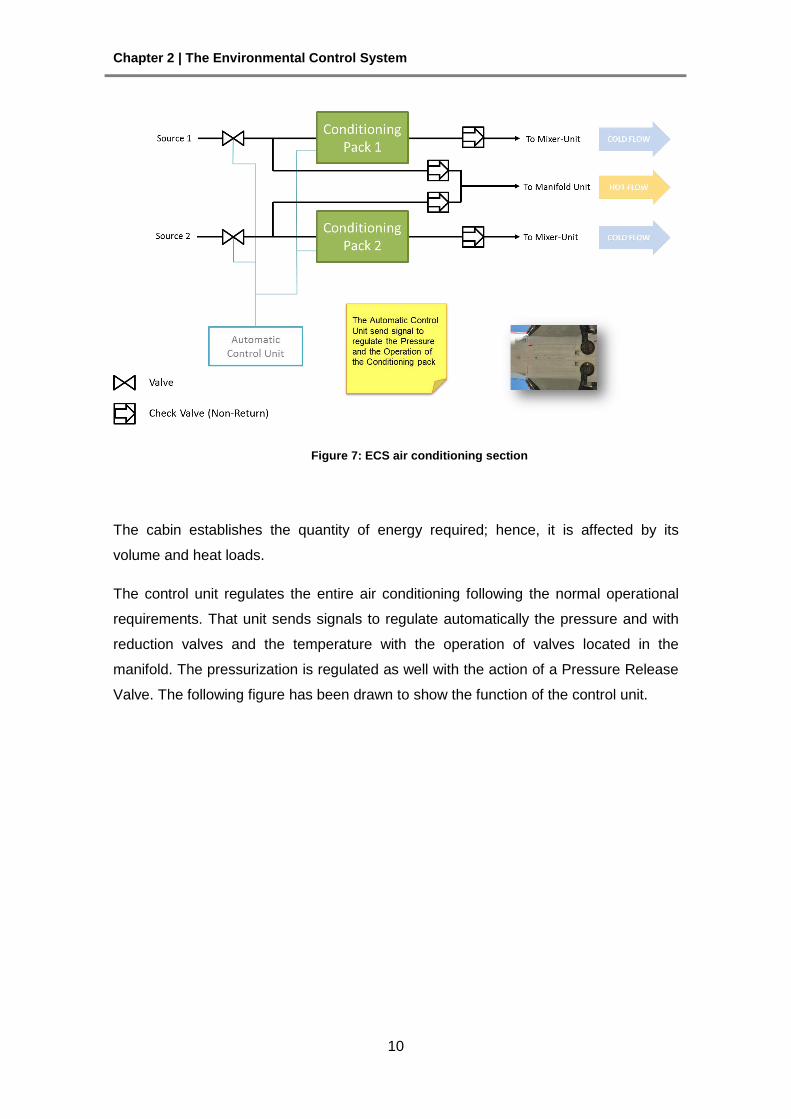
Figure 7: ECS air conditioning section
The cabin establishes the quantity of energy required; hence, it is affected by its
volume and heat loads.
The control unit regulates the entire air conditioning following the normal operational
requirements. That unit sends signals to regulate automatically the pressure and with
reduction valves and the temperature with the operation of valves located in the
manifold. The pressurization is regulated as well with the action of a Pressure Release
Valve. The following figure has been drawn to show the function of the control unit.
Chapter 2 | The Environmental Control System
11
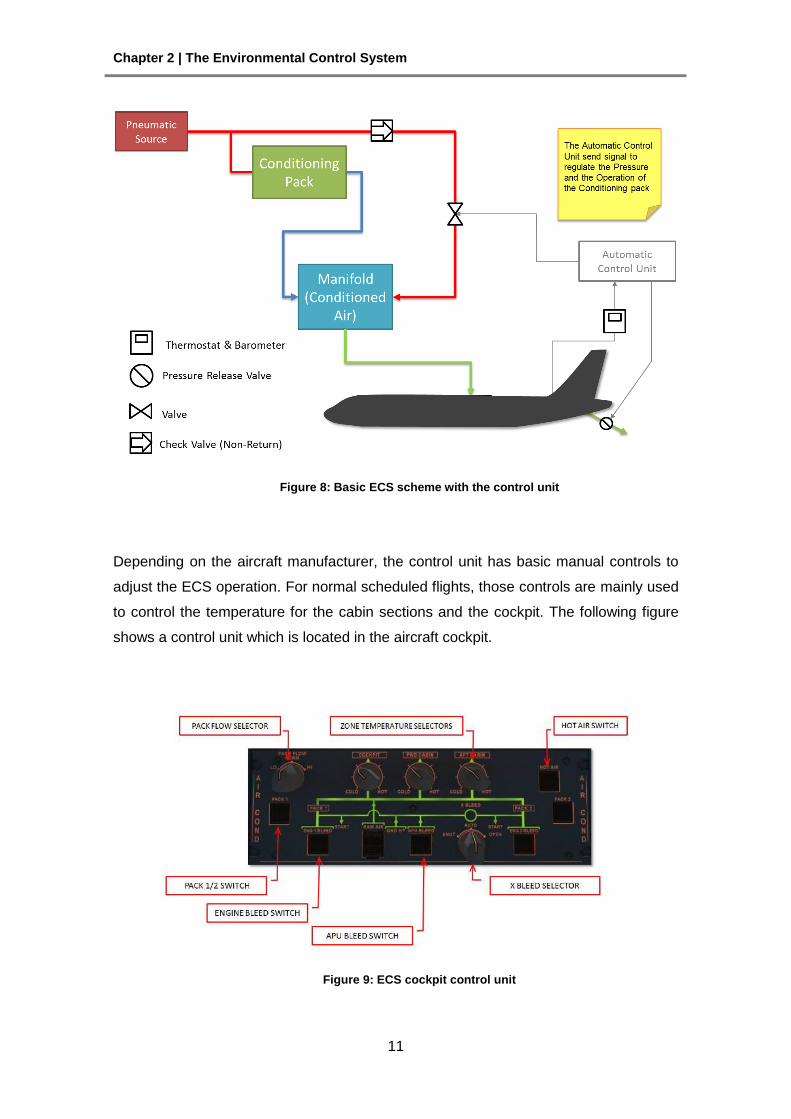
Figure 8: Basic ECS scheme with the control unit
Depending on the aircraft manufacturer, the control unit has basic manual controls to
adjust the ECS operation. For normal scheduled flights, those controls are mainly used
to control the temperature for the cabin sections and the cockpit. The following figure
shows a control unit which is located in the aircraft cockpit.
Figure 9: ECS cockpit control unit
Chapter 2 | The Environmental Control System
12
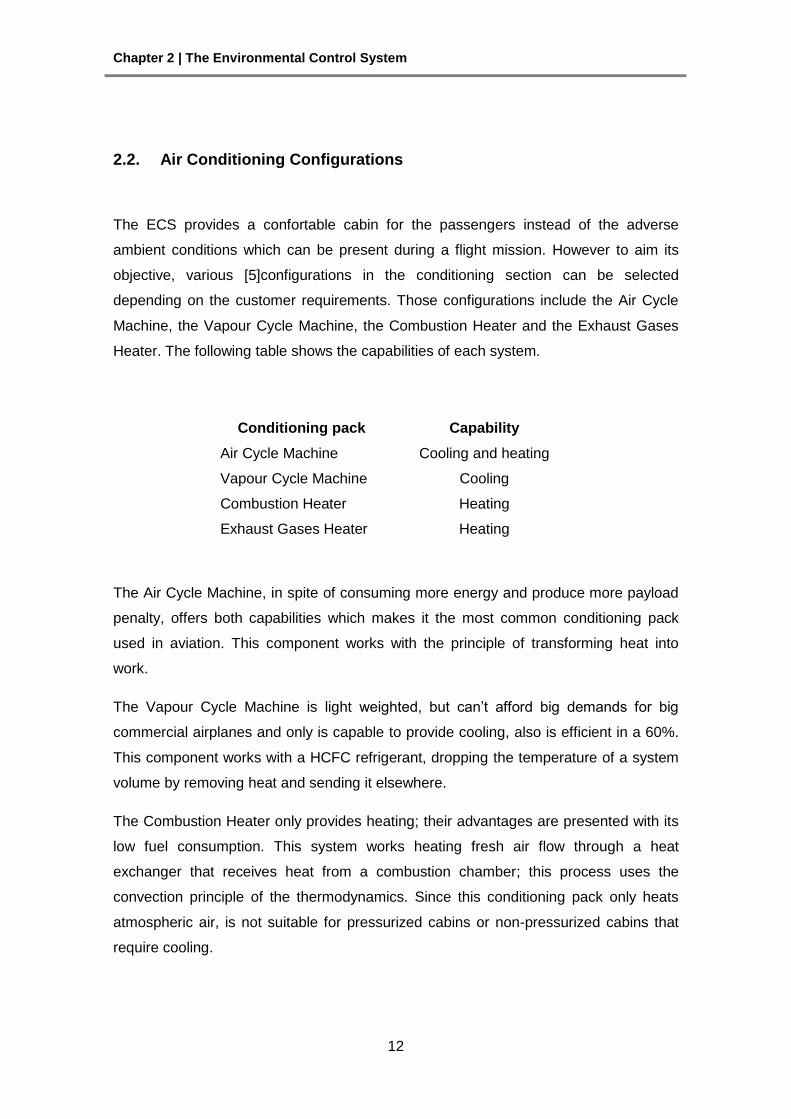
2.2. Air Conditioning Configurations
The ECS provides a confortable cabin for the passengers instead of the adverse
ambient conditions which can be present during a flight mission. However to aim its
objective, various [5]configurations in the conditioning section can be selected
depending on the customer requirements. Those configurations include the Air Cycle
Machine, the Vapour Cycle Machine, the Combustion Heater and the Exhaust Gases
Heater. The following table shows the capabilities of each system.
Conditioning pack Capability
Air Cycle Machine Cooling and heating
Vapour Cycle Machine Cooling
Combustion Heater Heating
Exhaust Gases Heater Heating
The Air Cycle Machine, in spite of consuming more energy and produce more payload
penalty, offers both capabilities which makes it the most common conditioning pack
used in aviation. This component works with the principle of transforming heat into
work.
The Vapour Cycle Machine is light weighted, but can’t afford big demands for big
commercial airplanes and only is capable to provide cooling, also is efficient in a 60%.
This component works with a HCFC refrigerant, dropping the temperature of a system
volume by removing heat and sending it elsewhere.
The Combustion Heater only provides heating; their advantages are presented with its
low fuel consumption. This system works heating fresh air flow through a heat
exchanger that receives heat from a combustion chamber; this process uses the
convection principle of the thermodynamics. Since this conditioning pack only heats
atmospheric air, is not suitable for pressurized cabins or non-pressurized cabins that
require cooling.
Chapter 2 | The Environmental Control System
13
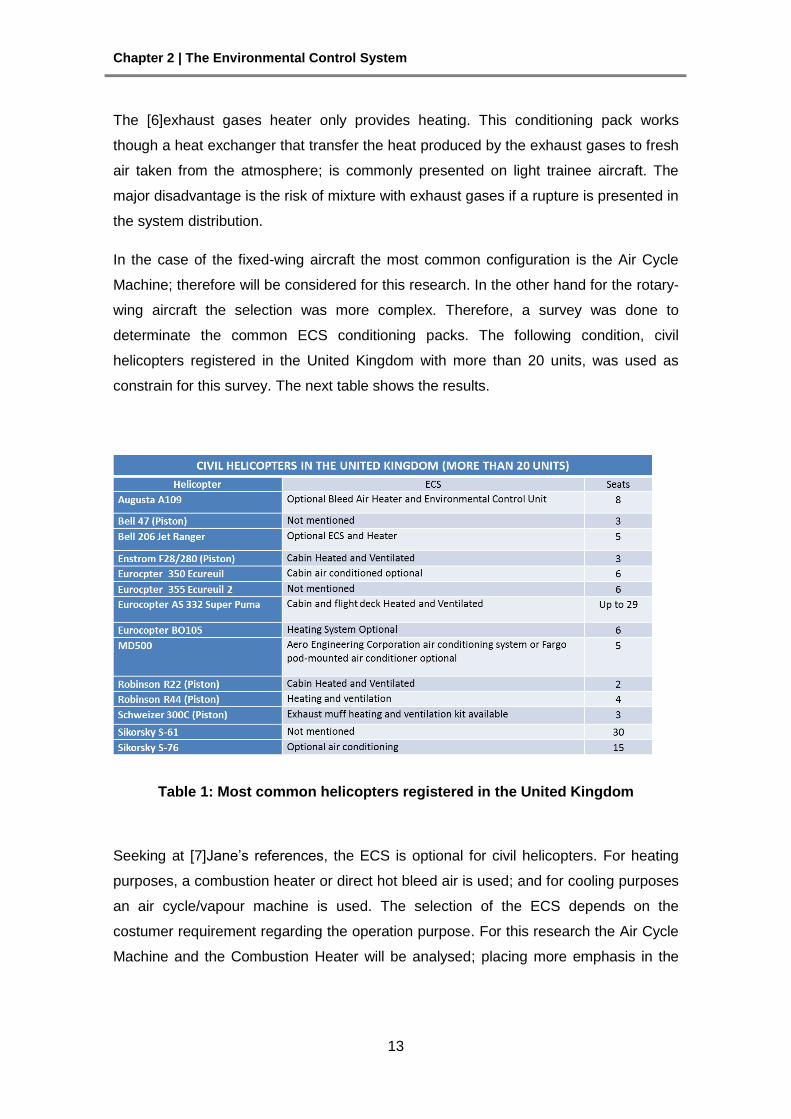
The [6]exhaust gases heater only provides heating. This conditioning pack works
though a heat exchanger that transfer the heat produced by the exhaust gases to fresh
air taken from the atmosphere; is commonly presented on light trainee aircraft. The
major disadvantage is the risk of mixture with exhaust gases if a rupture is presented in
the system distribution.
In the case of the fixed-wing aircraft the most common configuration is the Air Cycle
Machine; therefore will be considered for this research. In the other hand for the rotary-
wing aircraft the selection was more complex. Therefore, a survey was done to
determinate the common ECS conditioning packs. The following condition, civil
helicopters registered in the United Kingdom with more than 20 units, was used as
constrain for this survey. The next table shows the results.
Table 1: Most common helicopters registered in the United Kingdom
Seeking at [7]Jane’s references, the ECS is optional for civil helicopters. For heating
purposes, a combustion heater or direct hot bleed air is used; and for cooling purposes
an air cycle/vapour machine is used. The selection of the ECS depends on the
costumer requirement regarding the operation purpose. For this research the Air Cycle
Machine and the Combustion Heater will be analysed; placing more emphasis in the
Chapter 2 | The Environmental Control System
14
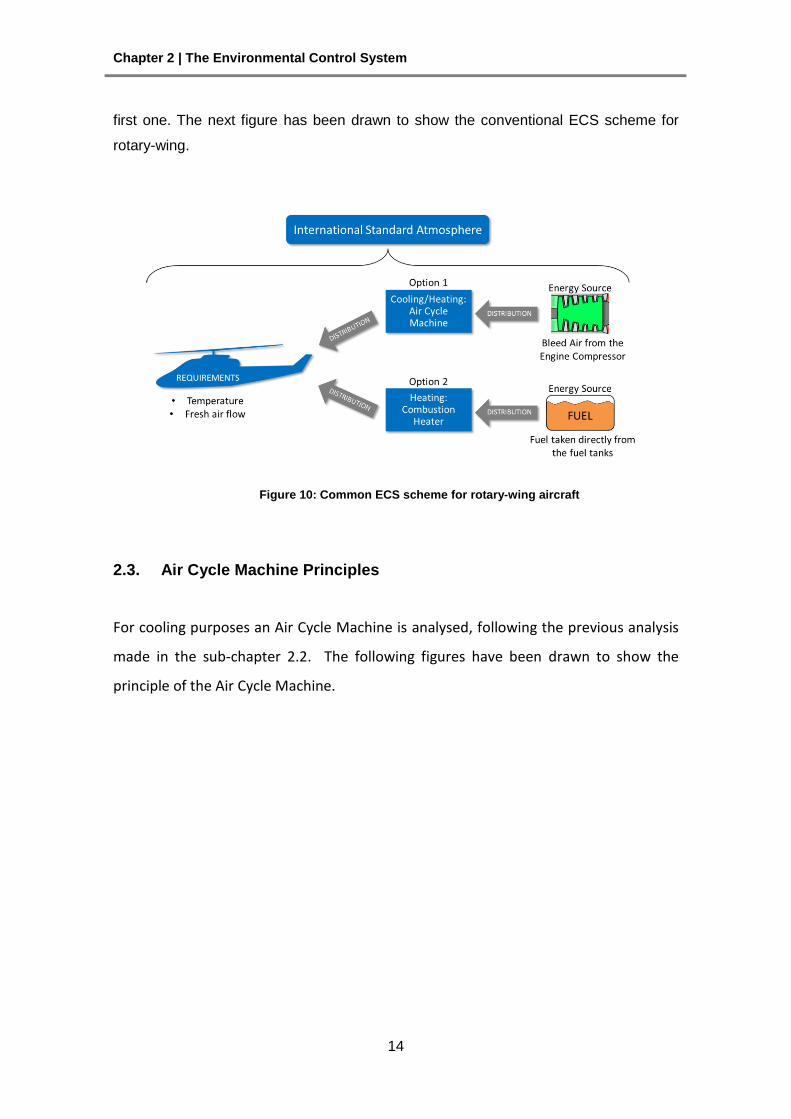
first one. The next figure has been drawn to show the conventional ECS scheme for
rotary-wing.
Figure 10: Common ECS scheme for rotary-wing aircraft
2.3. Air Cycle Machine Principles
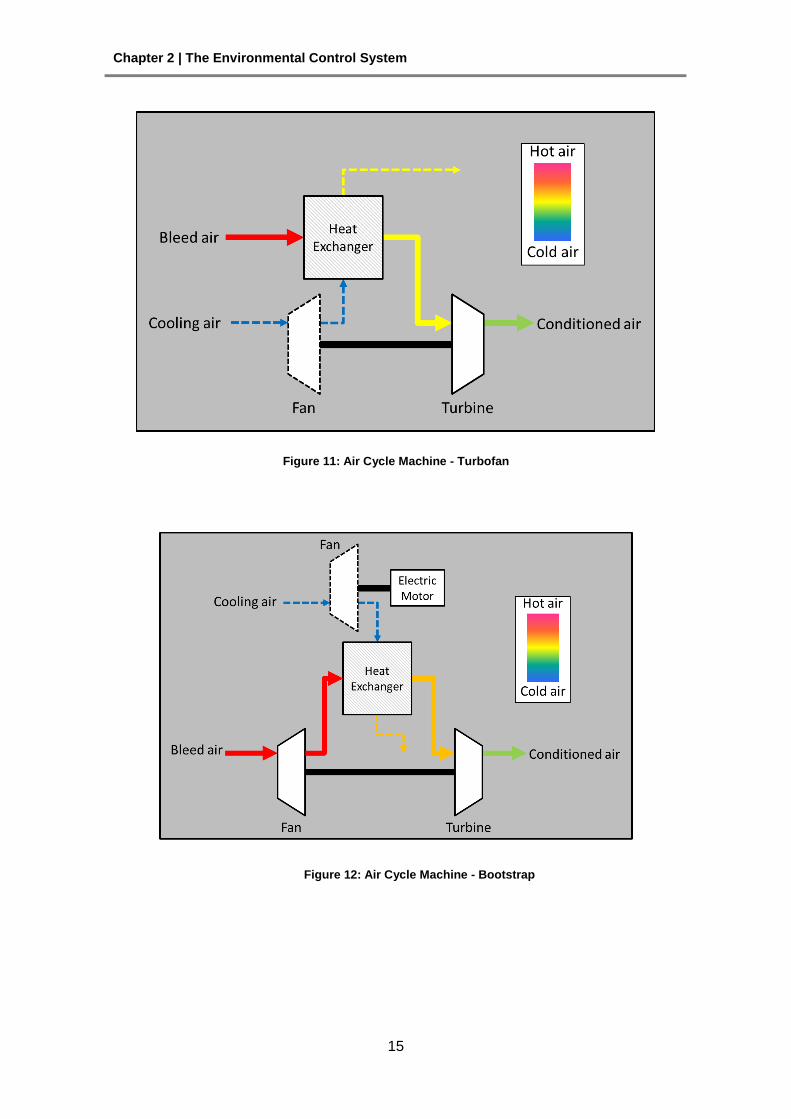
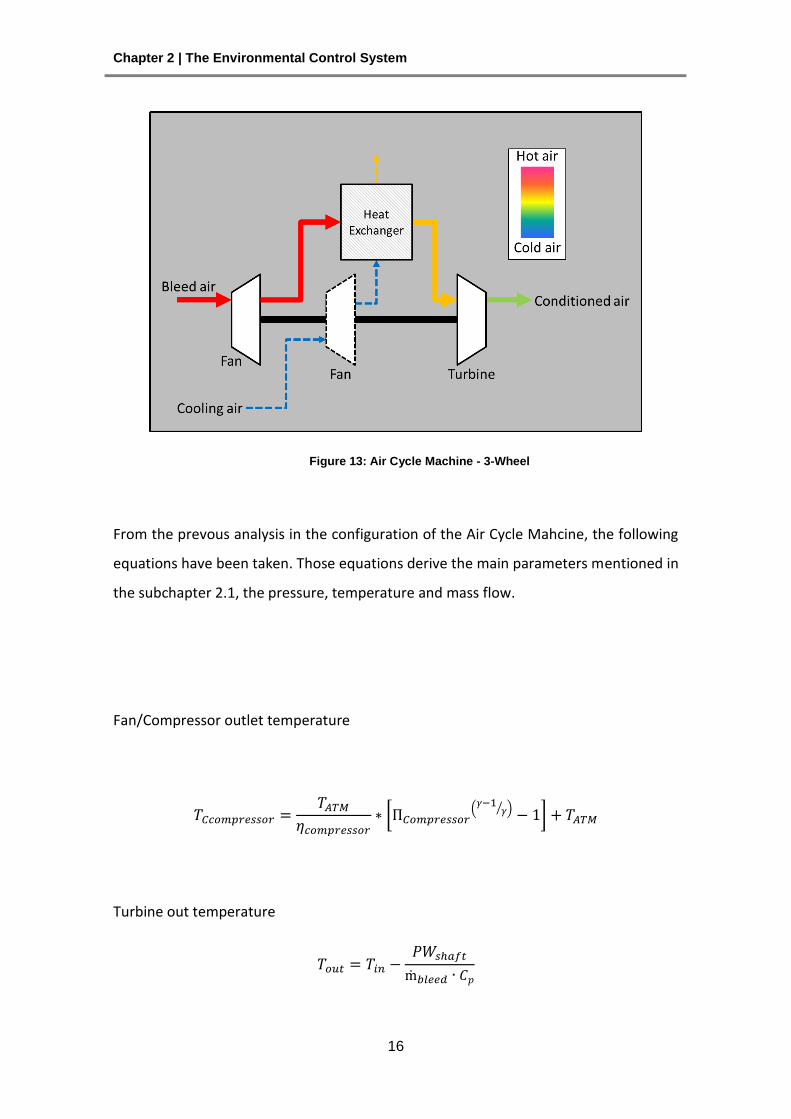
For cooling purposes an Air Cycle Machine is analysed, following the previous analysis
made in the sub-chapter 2.2. The following figures have been drawn to show the
principle of the Air Cycle Machine.
Chapter 2 | The Environmental Control System
15
Figure 11: Air Cycle Machine - Turbofan
Figure 12: Air Cycle Machine - Bootstrap
Chapter 2 | The Environmental Control System
16
Figure 13: Air Cycle Machine - 3-Wheel
From the prevous analysis in the configuration of the Air Cycle Mahcine, the following
equations have been taken. Those equations derive the main parameters mentioned in
the subchapter 2.1, the pressure, temperature and mass flow.
Fan/Compressor outlet temperature
[
(
⁄ ) ]
Turbine out temperature
Chapter 2 | The Environmental Control System
17
2.4. The Atmosphere
The earth atmosphere is an important field of consideration for ECS analysis since is
the main aspect that affects its performance during a mission profile. Common civil
aviation performs its activities in the troposphere which contains approximately the
80% of the complete atmospheric mass. The variation of the atmospheric parameters,
such as temperature, pressure, density and speed of sound; are referenced by the
International Standard Atmosphere model. The model gives the following reference
data for sea level conditions.
Table 2: ISA sea level conditions
Typical Sea Level Conditions
Temperature base 15 °C
Pressure 101353 Pa
Density 1.225 kg/m3
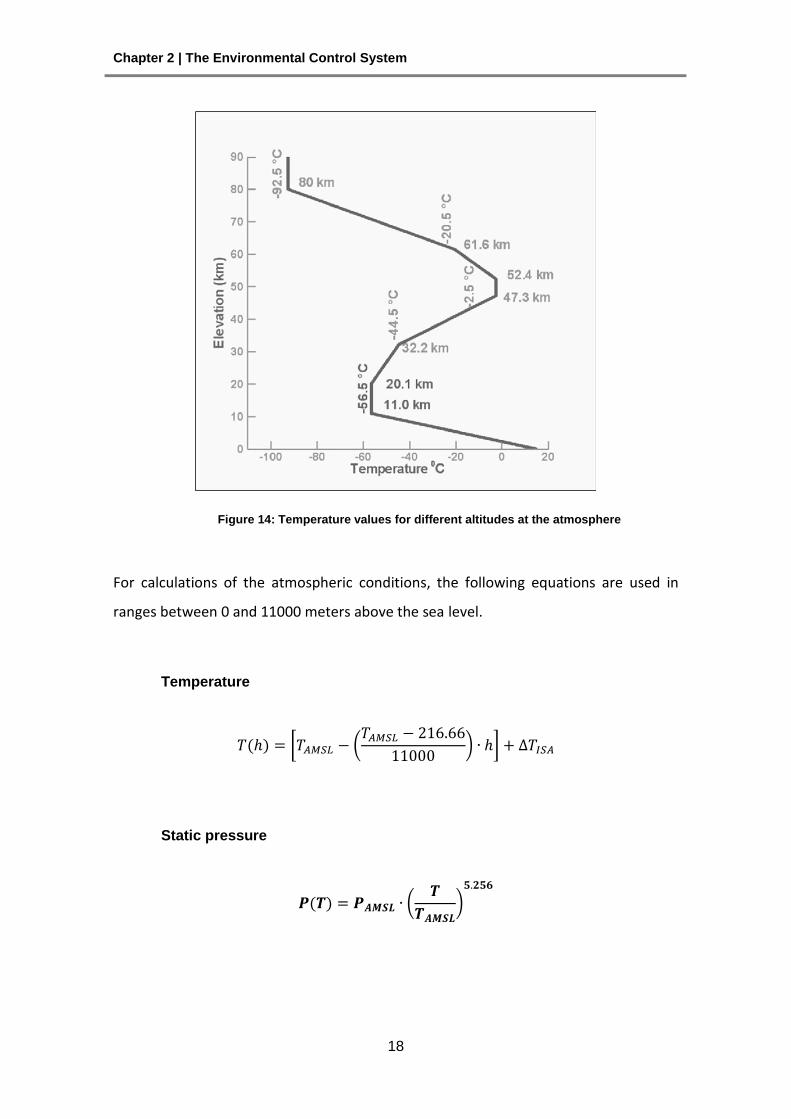
Chapter 2 | The Environmental Control System
18
Figure 14: Temperature values for different altitudes at the atmosphere
For calculations of the atmospheric conditions, the following equations are used in
ranges between 0 and 11000 meters above the sea level.
Temperature
[ (
* ]
Static pressure
(
*
Chapter 2 | The Environmental Control System
19
Density
Speed of sound
2.5. Pressurisation
The main purpose of the pressurization aims to provide acceptable levels of oxygen for
the passengers and crew. Basically, since the pressure levels at normal operation
conditions are too low, with values around 25 kPa; the oxygen concentration is too low.
Hence, the ECS needs to provide acceptable pressure levels for at least 75 kPa or the
equivalent for an altitude of 2400 m above the main sea level. This value represents a
pressure differential of around 50 kPa. Major values for a better cabin air quality, higher
than 75 kPa, can be achieved on the cabin pressurization; but since the pressure
differential would be higher, the security factor for the pressurized structure should be
as well. Hence, for civil aviation the limits are conservative. The following figure shows
the behaviour of the pressure at respective altitudes.
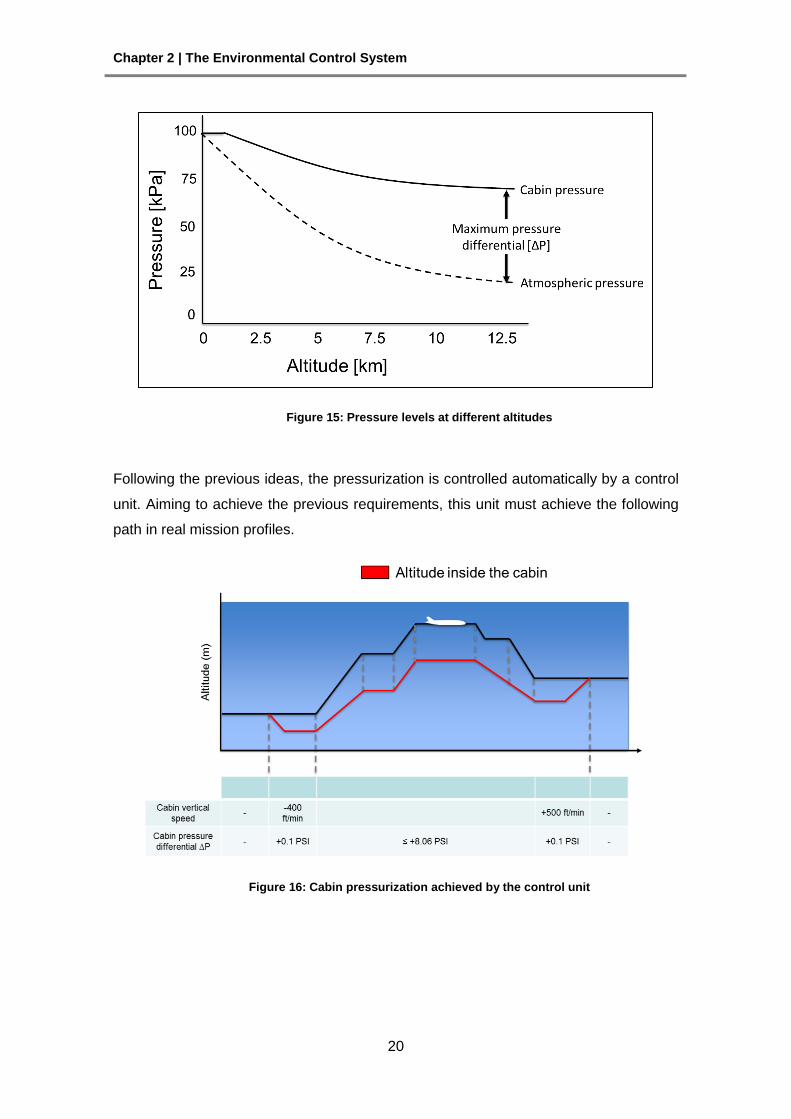
Chapter 2 | The Environmental Control System
20
Figure 15: Pressure levels at different altitudes
Following the previous ideas, the pressurization is controlled automatically by a control
unit. Aiming to achieve the previous requirements, this unit must achieve the following
path in real mission profiles.
Figure 16: Cabin pressurization achieved by the control unit
Chapter 2 | The Environmental Control System
21
For calculation purposes some equations have been considered form the field of fluid
dynamics.
Pressure rate of change for entry flow
Pressure rate of change for the output valve
√
√
2.6. Flow Distribution
For a manifold with one entry and two exits the temperature is calculates with the
energy conservation principle:
2.7. Cabin Thermodynamic Balance
The calculations of the thermal balance analyse the temperature behaviour
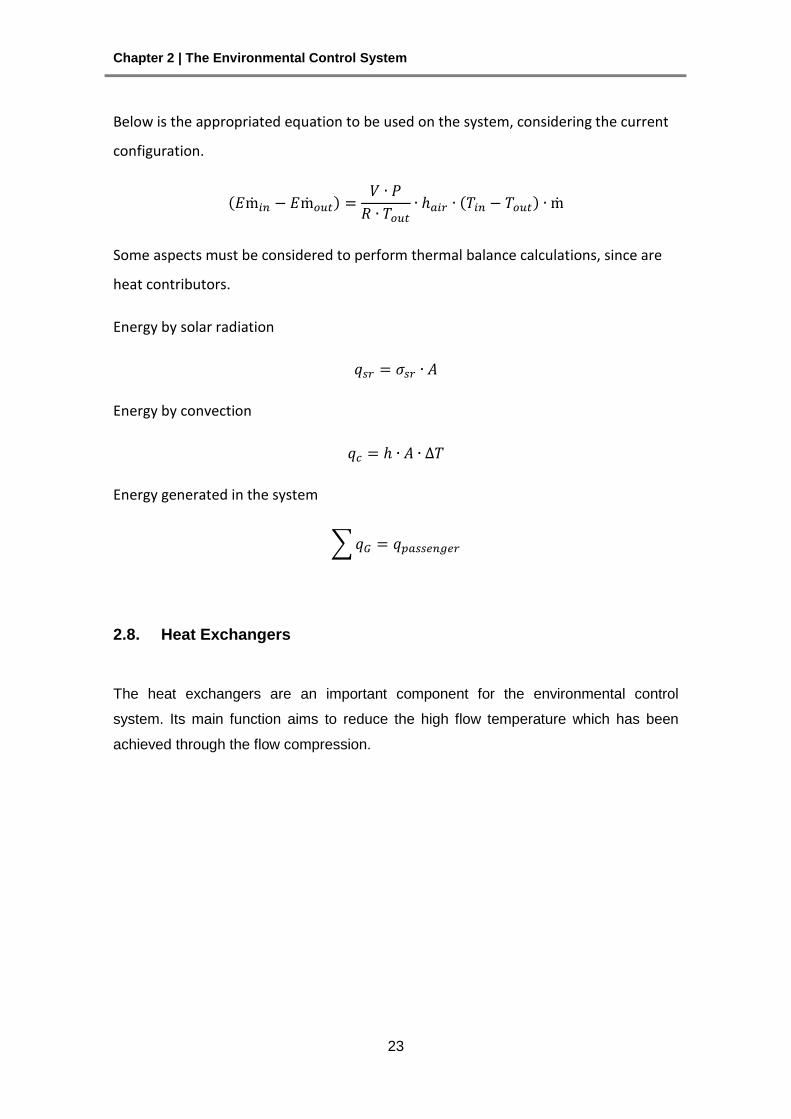
through the time under certain conditions like, solar radiation, heat produced by
passengers, atmosphere temperature and air ventilation for cabin temperature
regulation. The following figures show the air distribution for the aircraft cabin;
as seen, the air comes from the roof section towards the floor sections. This
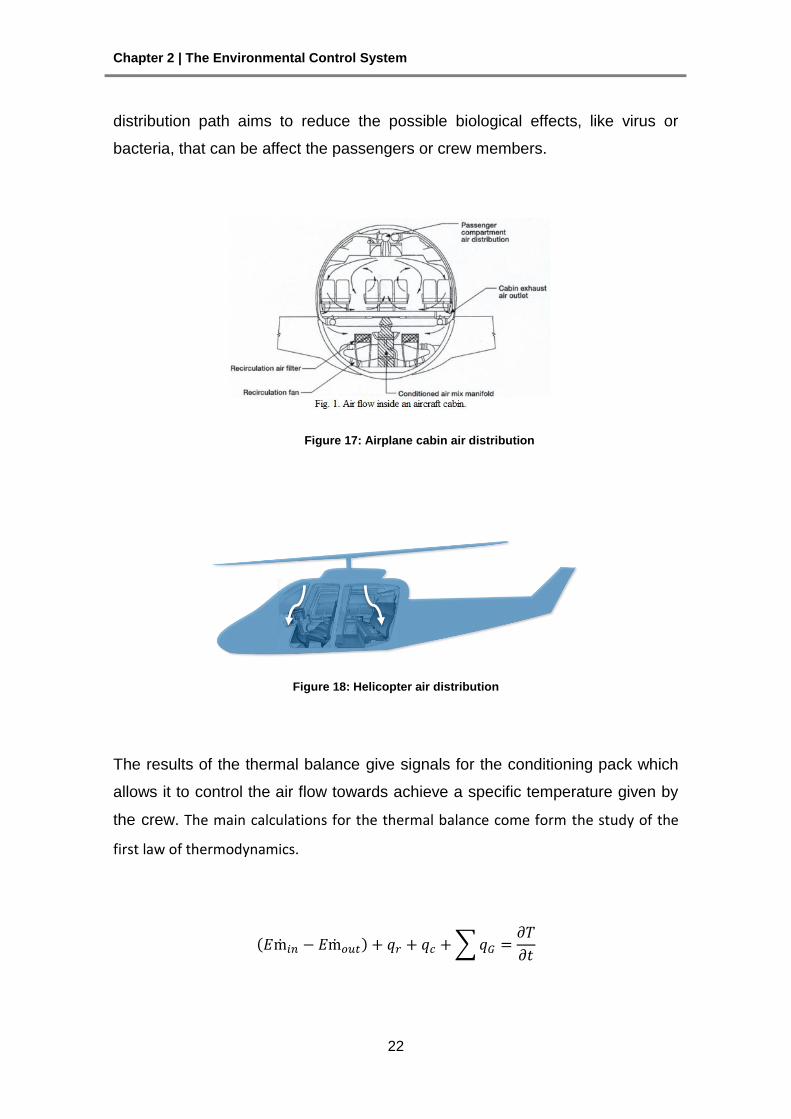
Chapter 2 | The Environmental Control System
22
distribution path aims to reduce the possible biological effects, like virus or
bacteria, that can be affect the passengers or crew members.
Figure 17: Airplane cabin air distribution
Figure 18: Helicopter air distribution
The results of the thermal balance give signals for the conditioning pack which
allows it to control the air flow towards achieve a specific temperature given by
the crew. The main calculations for the thermal balance come form the study of the
first law of thermodynamics.
∑
Chapter 2 | The Environmental Control System
23
Below is the appropriated equation to be used on the system, considering the current
configuration.
Some aspects must be considered to perform thermal balance calculations, since are
heat contributors.
Energy by solar radiation
Energy by convection
Energy generated in the system
∑
2.8. Heat Exchangers
The heat exchangers are an important component for the environmental control
system. Its main function aims to reduce the high flow temperature which has been
achieved through the flow compression.

Chapter 2 | The Environmental Control System
24
Figure 19: 1Heat Exchanger
Heat exchanger equation
The following equation has been considered to perform calculations on heat
exchangers.
2.9. Combustion Heating Principles
The Combustion Heater only provides heating, their disadvantages are presented with
it high fuel consumption, which can only be affordable for small aircraft. This system
works heating fresh air flow with a heat exchanger that receives heat from a
combustion chamber; this process uses the convection principle of the
thermodynamics.
1 http://www.lytron.com/heat-exchangers/custom/heat-exchangers-plate-fin.aspx
Chapter 2 | The Environmental Control System
25
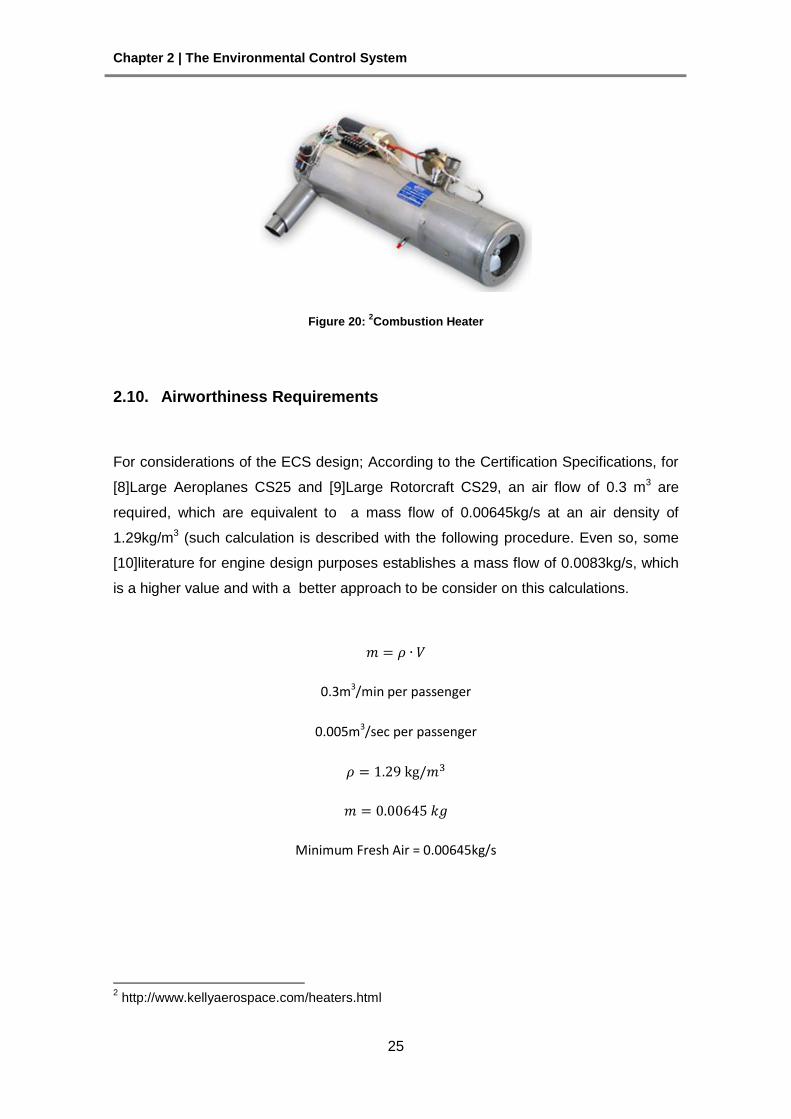
Figure 20: 2Combustion Heater
2.10. Airworthiness Requirements
For considerations of the ECS design; According to the Certification Specifications, for
[8]Large Aeroplanes CS25 and [9]Large Rotorcraft CS29, an air flow of 0.3 m3 are
required, which are equivalent to a mass flow of 0.00645kg/s at an air density of
1.29kg/m3 (such calculation is described with the following procedure. Even so, some
[10]literature for engine design purposes establishes a mass flow of 0.0083kg/s, which
is a higher value and with a better approach to be consider on this calculations.
0.3m3/min per passenger
0.005m3/sec per passenger
Minimum Fresh Air = 0.00645kg/s
2 http://www.kellyaerospace.com/heaters.html
Chapter 2 | The Environmental Control System
26
2.11. Models to Simulate the ECS
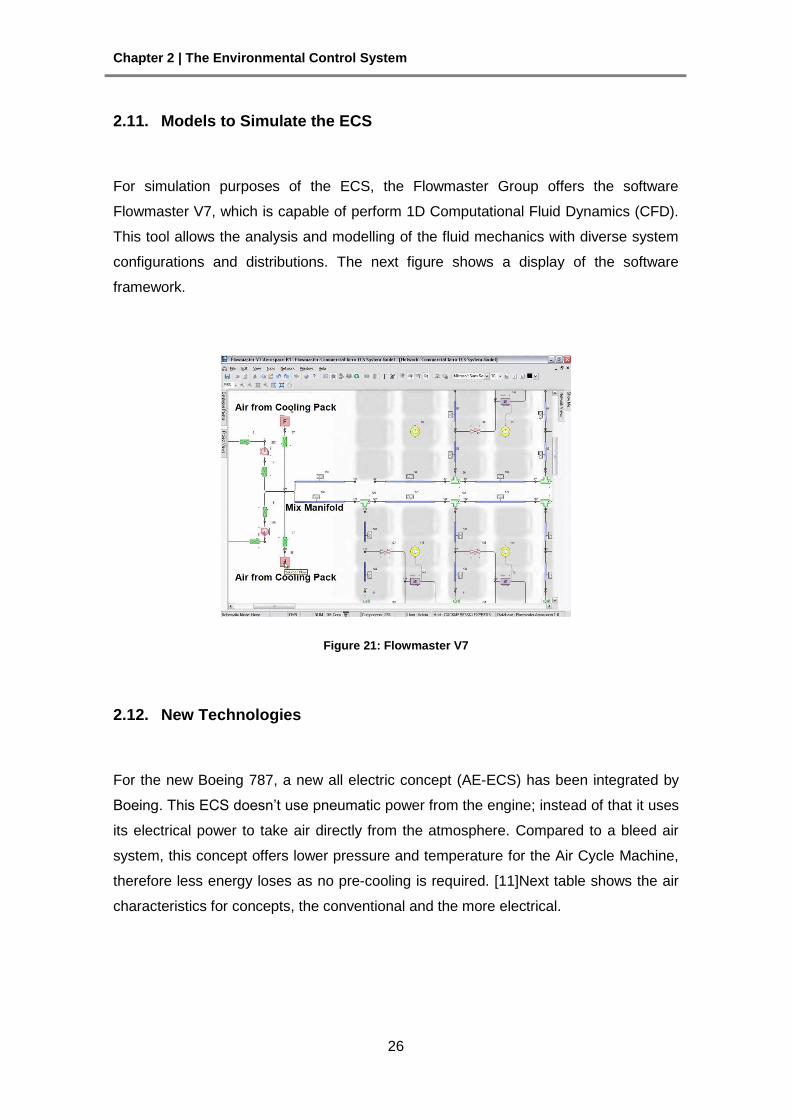
For simulation purposes of the ECS, the Flowmaster Group offers the software
Flowmaster V7, which is capable of perform 1D Computational Fluid Dynamics (CFD).
This tool allows the analysis and modelling of the fluid mechanics with diverse system
configurations and distributions. The next figure shows a display of the software
framework.
Figure 21: Flowmaster V7
2.12. New Technologies
For the new Boeing 787, a new all electric concept (AE-ECS) has been integrated by
Boeing. This ECS doesn’t use pneumatic power from the engine; instead of that it uses
its electrical power to take air directly from the atmosphere. Compared to a bleed air
system, this concept offers lower pressure and temperature for the Air Cycle Machine,
therefore less energy loses as no pre-cooling is required. [11]Next table shows the air
characteristics for concepts, the conventional and the more electrical.
Chapter 2 | The Environmental Control System
27
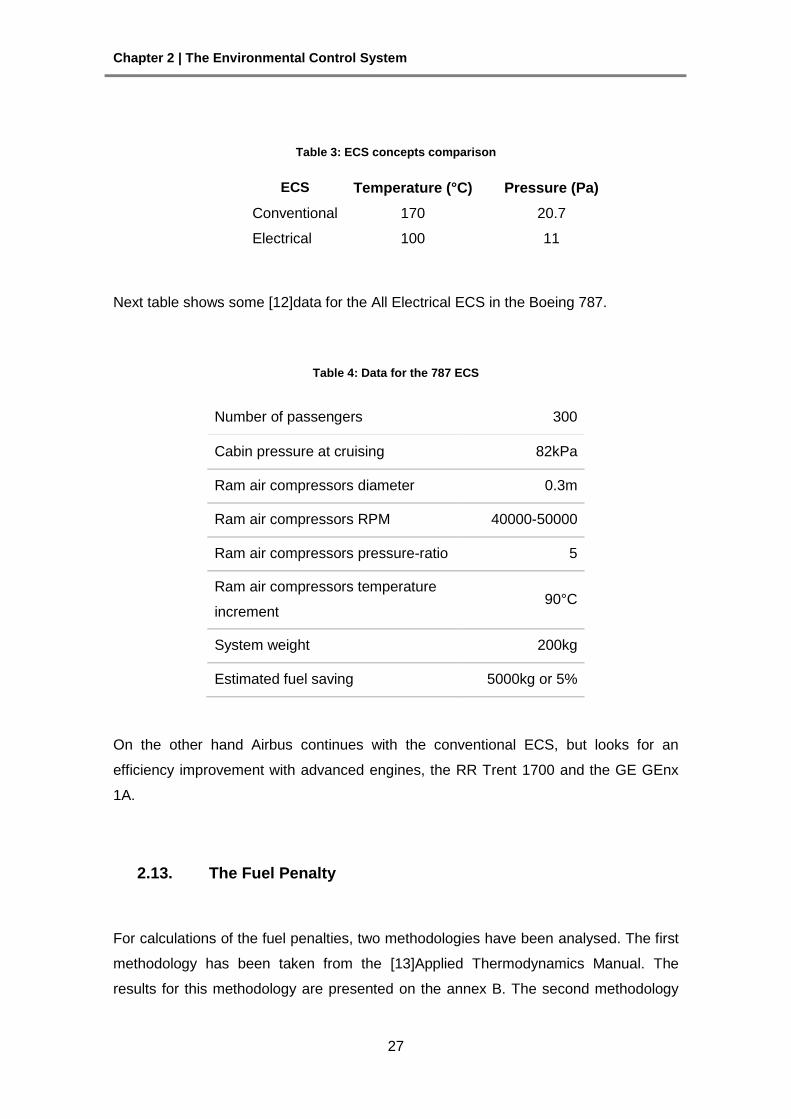
Table 3: ECS concepts comparison
ECS Temperature (°C) Pressure (Pa)
Conventional 170 20.7
Electrical 100 11
Next table shows some [12]data for the All Electrical ECS in the Boeing 787.
Table 4: Data for the 787 ECS
Number of passengers 300
Cabin pressure at cruising 82kPa
Ram air compressors diameter 0.3m
Ram air compressors RPM 40000-50000
Ram air compressors pressure-ratio 5
Ram air compressors temperature
increment 90°C
System weight 200kg
Estimated fuel saving 5000kg or 5%
On the other hand Airbus continues with the conventional ECS, but looks for an
efficiency improvement with advanced engines, the RR Trent 1700 and the GE GEnx
1A.
2.13. The Fuel Penalty
For calculations of the fuel penalties, two methodologies have been analysed. The first
methodology has been taken from the [13]Applied Thermodynamics Manual. The
results for this methodology are presented on the annex B. The second methodology
Chapter 2 | The Environmental Control System
28
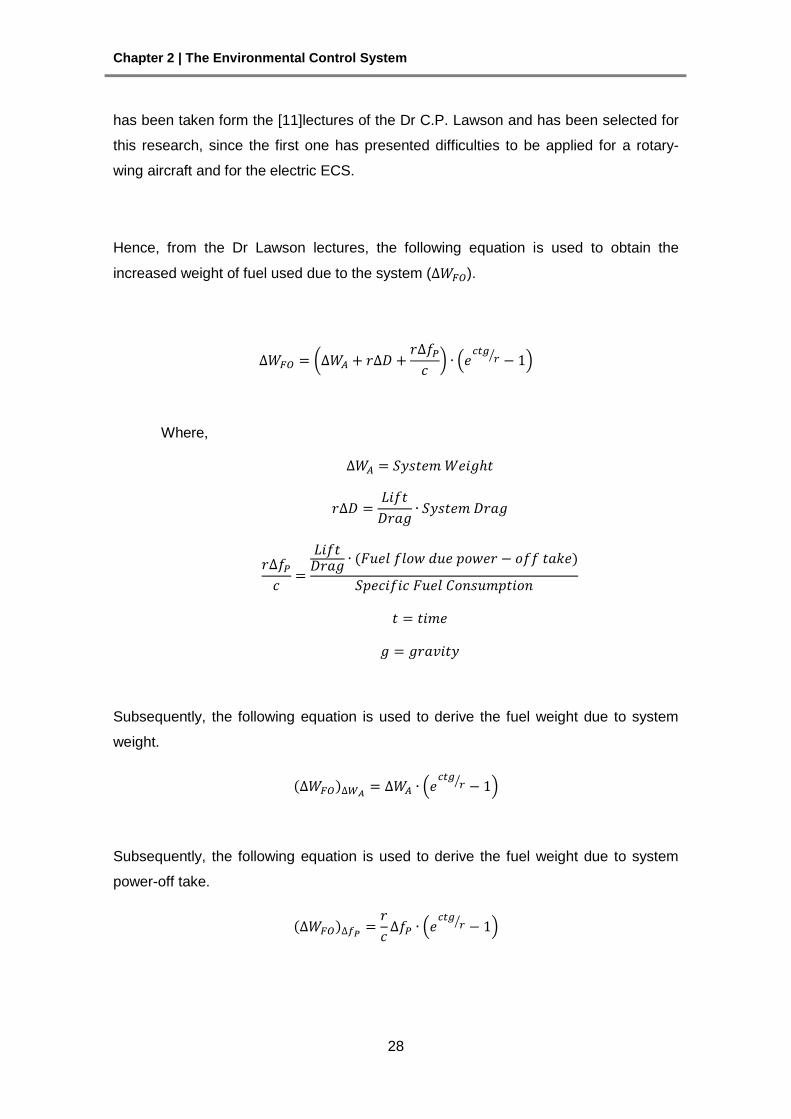
has been taken form the [11]lectures of the Dr C.P. Lawson and has been selected for
this research, since the first one has presented difficulties to be applied for a rotary-
wing aircraft and for the electric ECS.
Hence, from the Dr Lawson lectures, the following equation is used to obtain the
increased weight of fuel used due to the system ( ).
( * (
⁄ )
Where,
Subsequently, the following equation is used to derive the fuel weight due to system
weight.
(
⁄ )
Subsequently, the following equation is used to derive the fuel weight due to system
power-off take.
(
⁄ )
Chapter 2 | The Environmental Control System
29
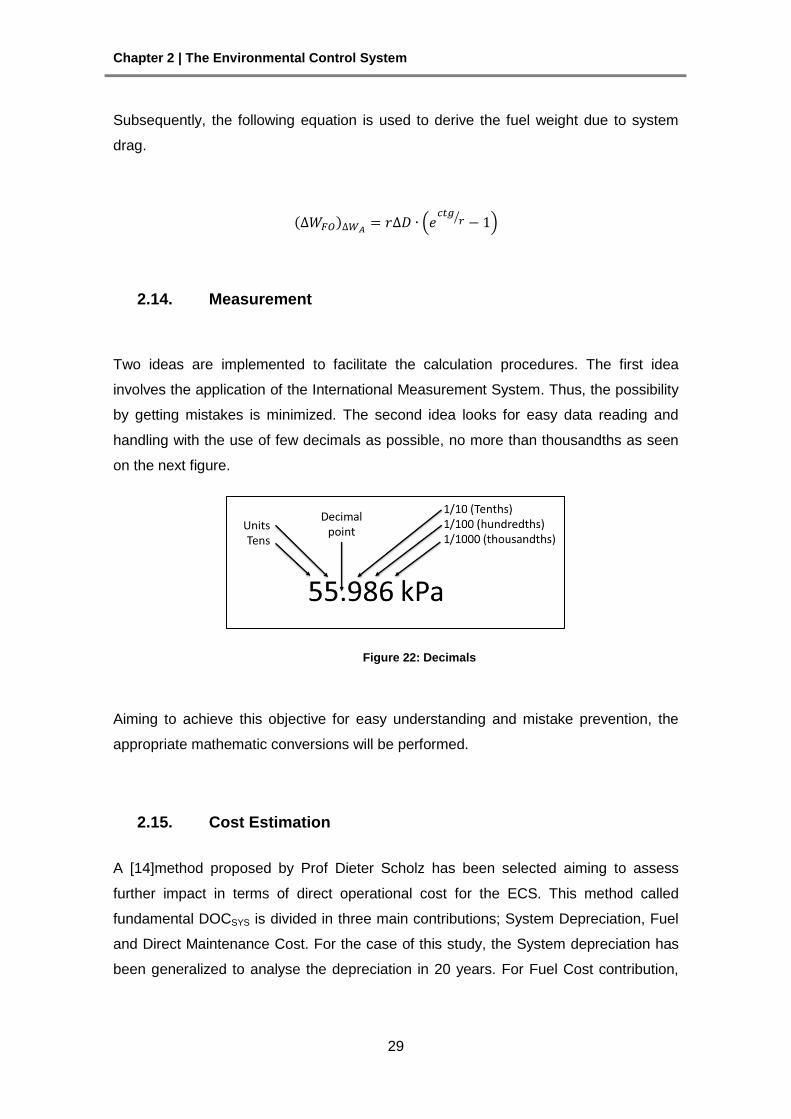
Subsequently, the following equation is used to derive the fuel weight due to system
drag.
(
⁄ )
2.14. Measurement
Two ideas are implemented to facilitate the calculation procedures. The first idea
involves the application of the International Measurement System. Thus, the possibility
by getting mistakes is minimized. The second idea looks for easy data reading and
handling with the use of few decimals as possible, no more than thousandths as seen
on the next figure.
Figure 22: Decimals
Aiming to achieve this objective for easy understanding and mistake prevention, the
appropriate mathematic conversions will be performed.
2.15. Cost Estimation
A [14]method proposed by Prof Dieter Scholz has been selected aiming to assess
further impact in terms of direct operational cost for the ECS. This method called
fundamental DOCSYS is divided in three main contributions; System Depreciation, Fuel
and Direct Maintenance Cost. For the case of this study, the System depreciation has
been generalized to analyse the depreciation in 20 years. For Fuel Cost contribution,
Chapter 2 | The Environmental Control System
30
each one of the three different cases, presented in this research, is analysed. And for
Direct Maintenance Cost a basic introduction of what can be expected is done.
Depreciation Cost
Where,
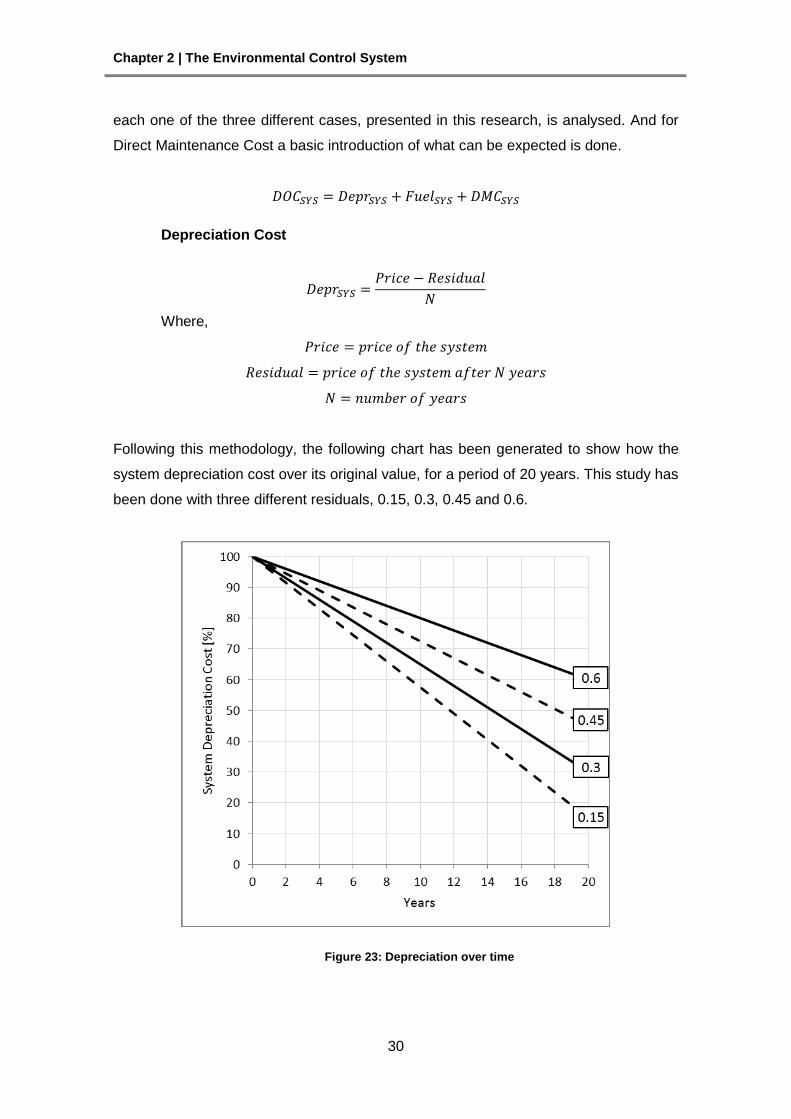
Following this methodology, the following chart has been generated to show how the
system depreciation cost over its original value, for a period of 20 years. This study has
been done with three different residuals, 0.15, 0.3, 0.45 and 0.6.
Figure 23: Depreciation over time
Chapter 2 | The Environmental Control System
31
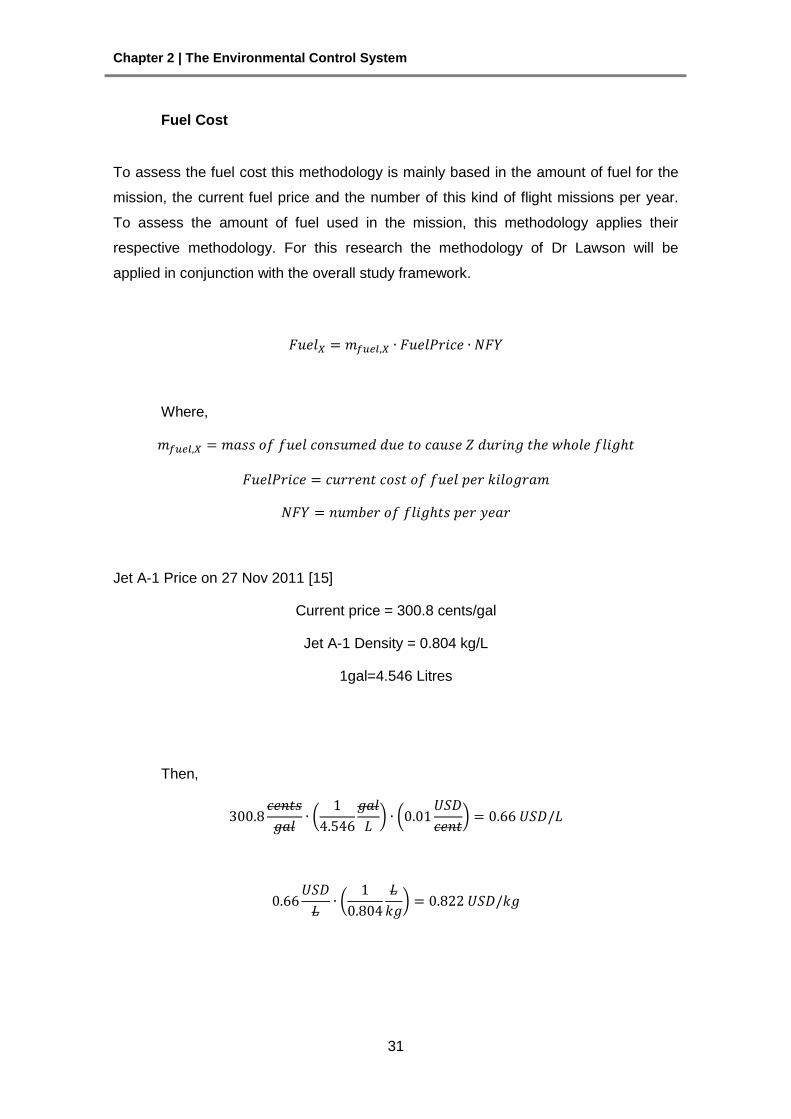
Fuel Cost
To assess the fuel cost this methodology is mainly based in the amount of fuel for the
mission, the current fuel price and the number of this kind of flight missions per year.
To assess the amount of fuel used in the mission, this methodology applies their
respective methodology. For this research the methodology of Dr Lawson will be
applied in conjunction with the overall study framework.
Where,
Jet A-1 Price on 27 Nov 2011 [15]
Current price = 300.8 cents/gal
Jet A-1 Density = 0.804 kg/L
1gal=4.546 Litres
Then,
(
* (
*
(
*
Chapter 2 | The Environmental Control System
32
Direct Maintenance Cost
The calculation of direct maintenance cost requires exhaustive analysis. Therefore, the
main methodology procedure is mentioned for future work. Hence the following
equation describes this estimation.
( )
Where,
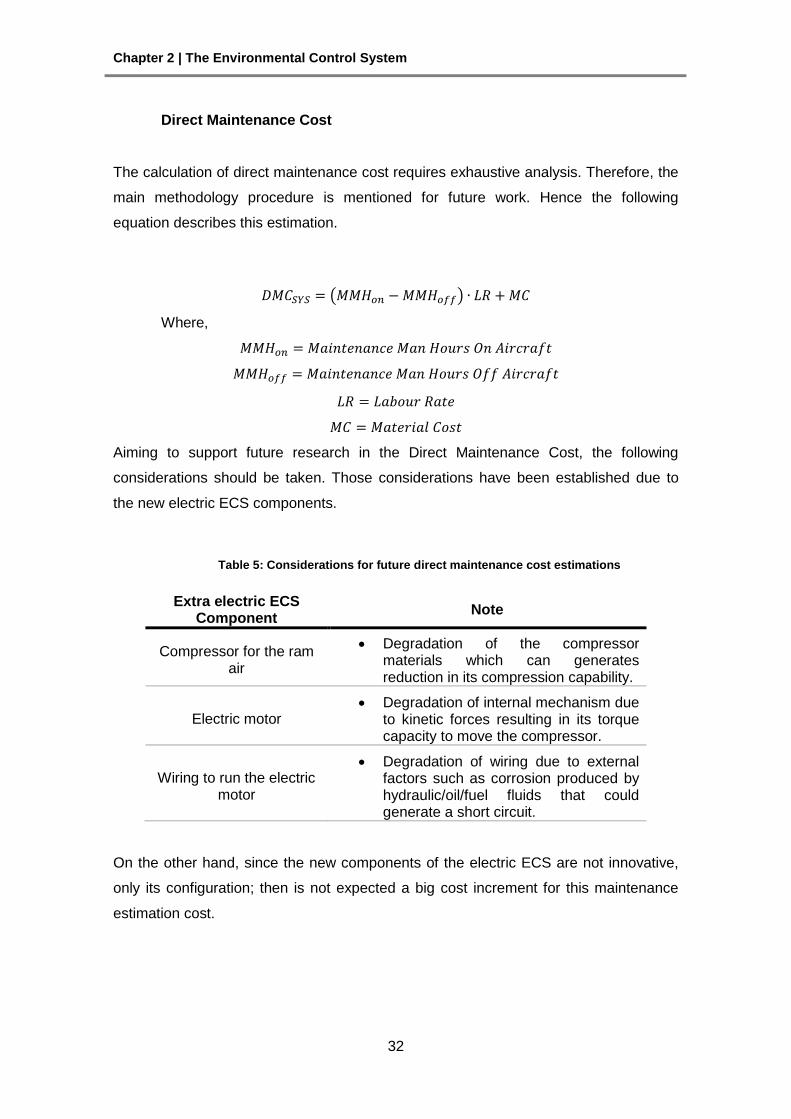
Aiming to support future research in the Direct Maintenance Cost, the following
considerations should be taken. Those considerations have been established due to
the new electric ECS components.
Table 5: Considerations for future direct maintenance cost estimations
Extra electric ECS Component
Note
Compressor for the ram air
Degradation of the compressor materials which can generates reduction in its compression capability.
Electric motor Degradation of internal mechanism due
to kinetic forces resulting in its torque capacity to move the compressor.
Wiring to run the electric motor
Degradation of wiring due to external factors such as corrosion produced by hydraulic/oil/fuel fluids that could generate a short circuit.
On the other hand, since the new components of the electric ECS are not innovative,
only its configuration; then is not expected a big cost increment for this maintenance
estimation cost.
Chapter 2 | The Environmental Control System
33
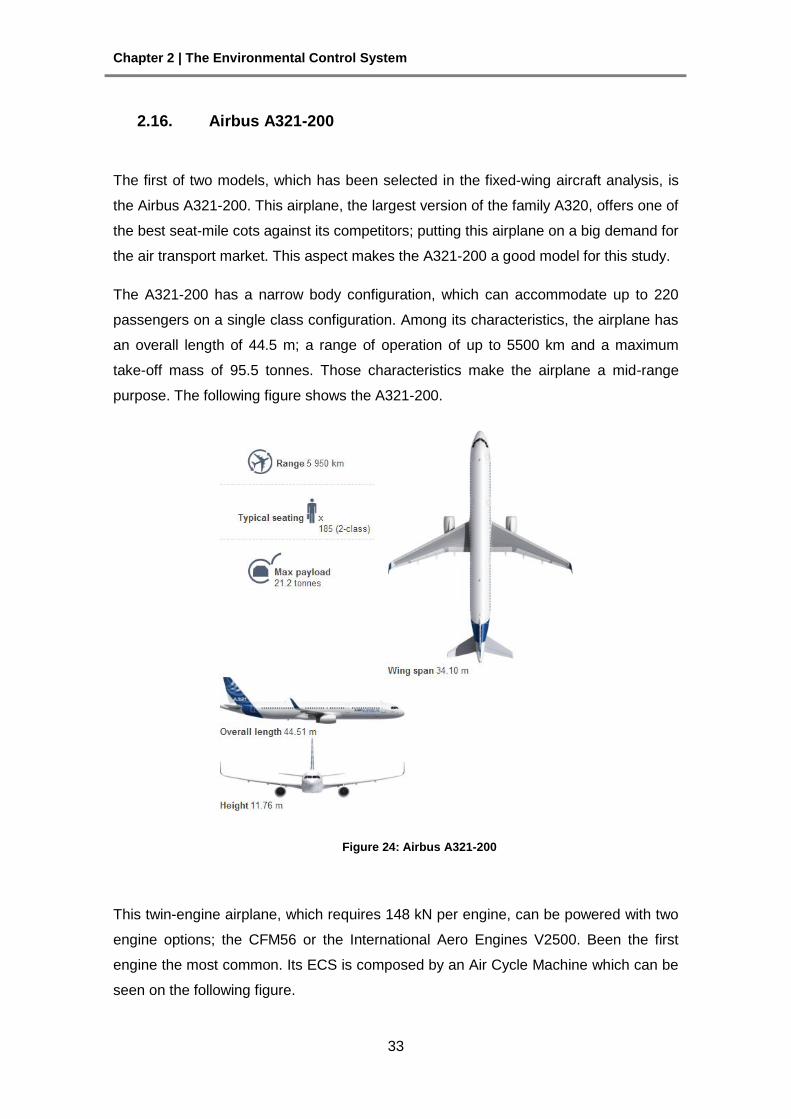
2.16. Airbus A321-200
The first of two models, which has been selected in the fixed-wing aircraft analysis, is
the Airbus A321-200. This airplane, the largest version of the family A320, offers one of
the best seat-mile cots against its competitors; putting this airplane on a big demand for
the air transport market. This aspect makes the A321-200 a good model for this study.
The A321-200 has a narrow body configuration, which can accommodate up to 220
passengers on a single class configuration. Among its characteristics, the airplane has
an overall length of 44.5 m; a range of operation of up to 5500 km and a maximum
take-off mass of 95.5 tonnes. Those characteristics make the airplane a mid-range
purpose. The following figure shows the A321-200.
Figure 24: Airbus A321-200
This twin-engine airplane, which requires 148 kN per engine, can be powered with two
engine options; the CFM56 or the International Aero Engines V2500. Been the first
engine the most common. Its ECS is composed by an Air Cycle Machine which can be
seen on the following figure.
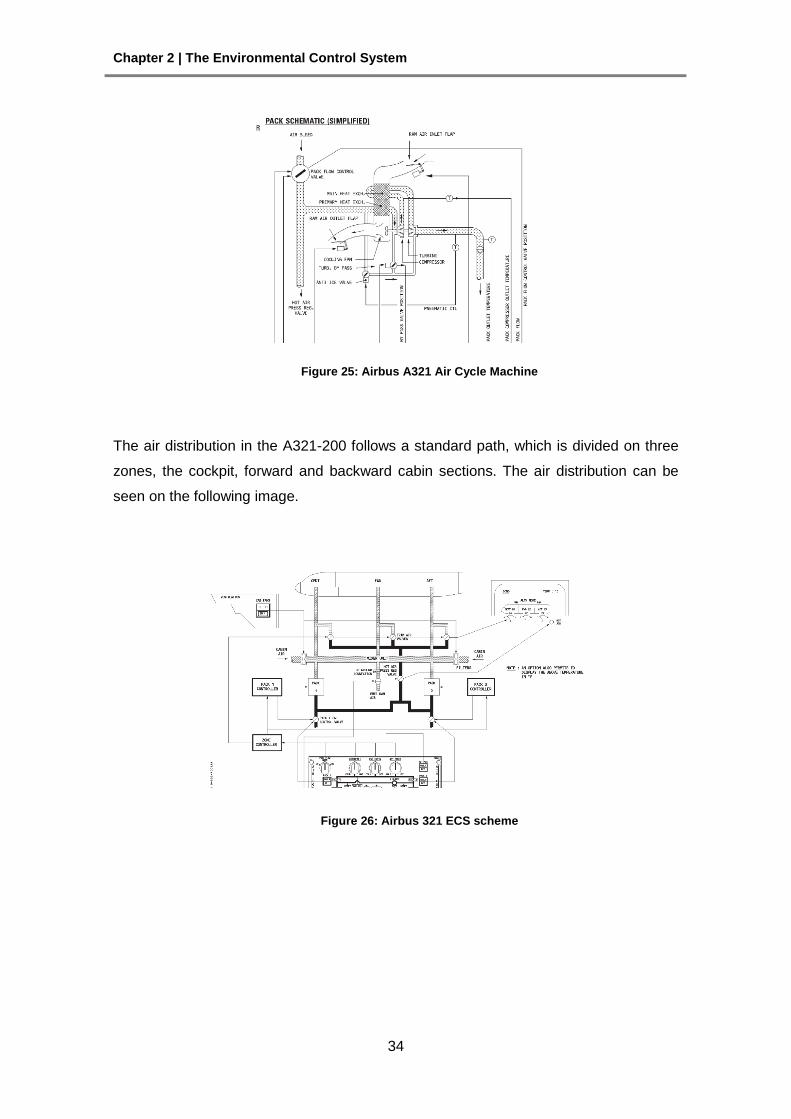
Chapter 2 | The Environmental Control System
34
Figure 25: Airbus A321 Air Cycle Machine
The air distribution in the A321-200 follows a standard path, which is divided on three
zones, the cockpit, forward and backward cabin sections. The air distribution can be
seen on the following image.
Figure 26: Airbus 321 ECS scheme
Chapter 2 | The Environmental Control System
35
2.17. ATR 72-500
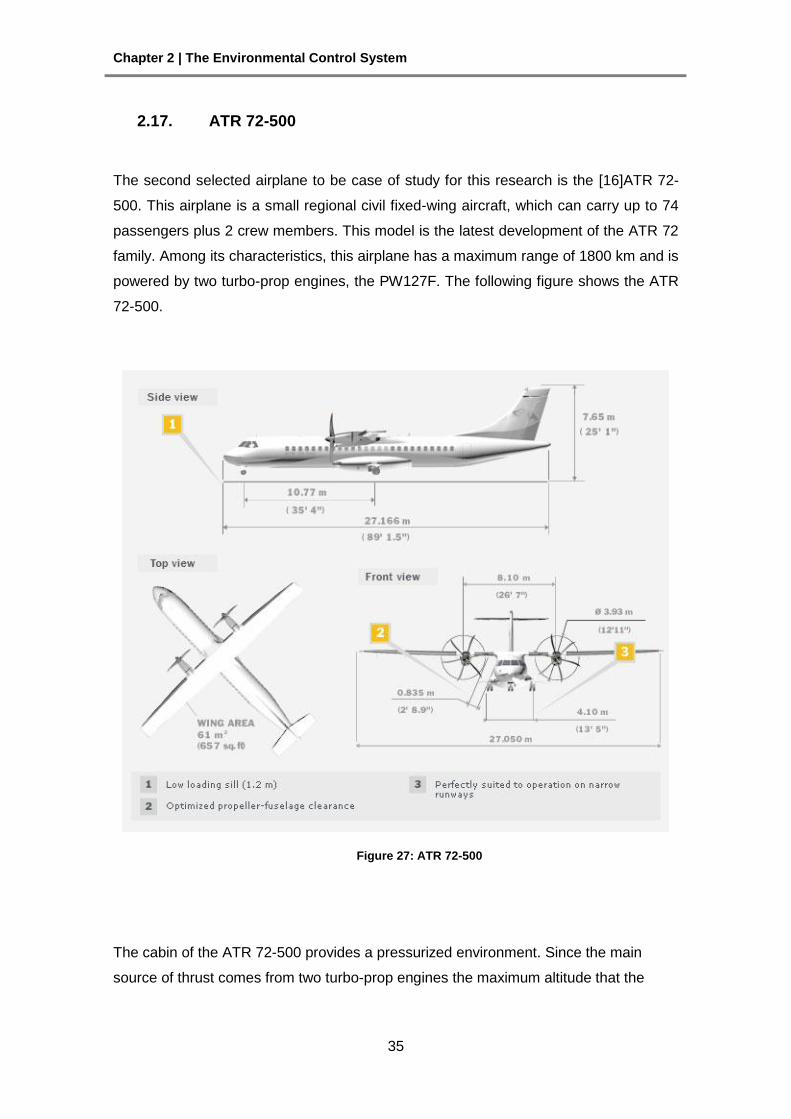
The second selected airplane to be case of study for this research is the [16]ATR 72-
500. This airplane is a small regional civil fixed-wing aircraft, which can carry up to 74
passengers plus 2 crew members. This model is the latest development of the ATR 72
family. Among its characteristics, this airplane has a maximum range of 1800 km and is
powered by two turbo-prop engines, the PW127F. The following figure shows the ATR
72-500.
Figure 27: ATR 72-500
The cabin of the ATR 72-500 provides a pressurized environment. Since the main
source of thrust comes from two turbo-prop engines the maximum altitude that the
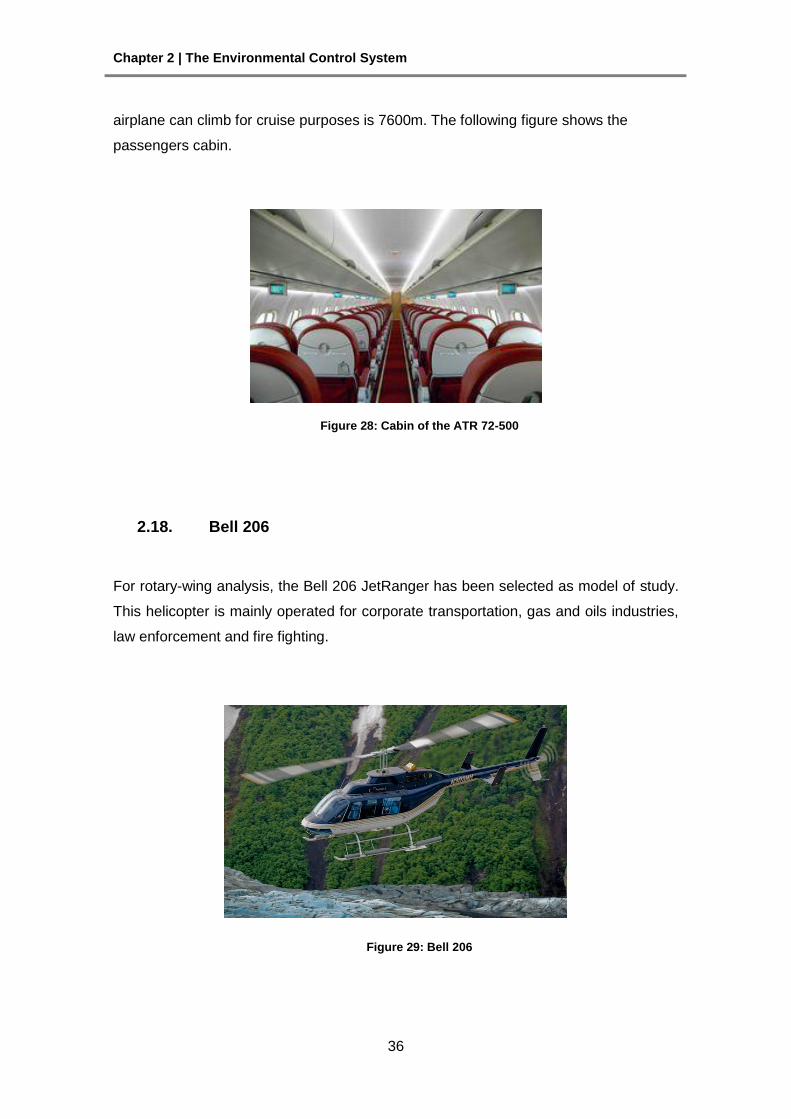
Chapter 2 | The Environmental Control System
36
airplane can climb for cruise purposes is 7600m. The following figure shows the
passengers cabin.
Figure 28: Cabin of the ATR 72-500
2.18. Bell 206
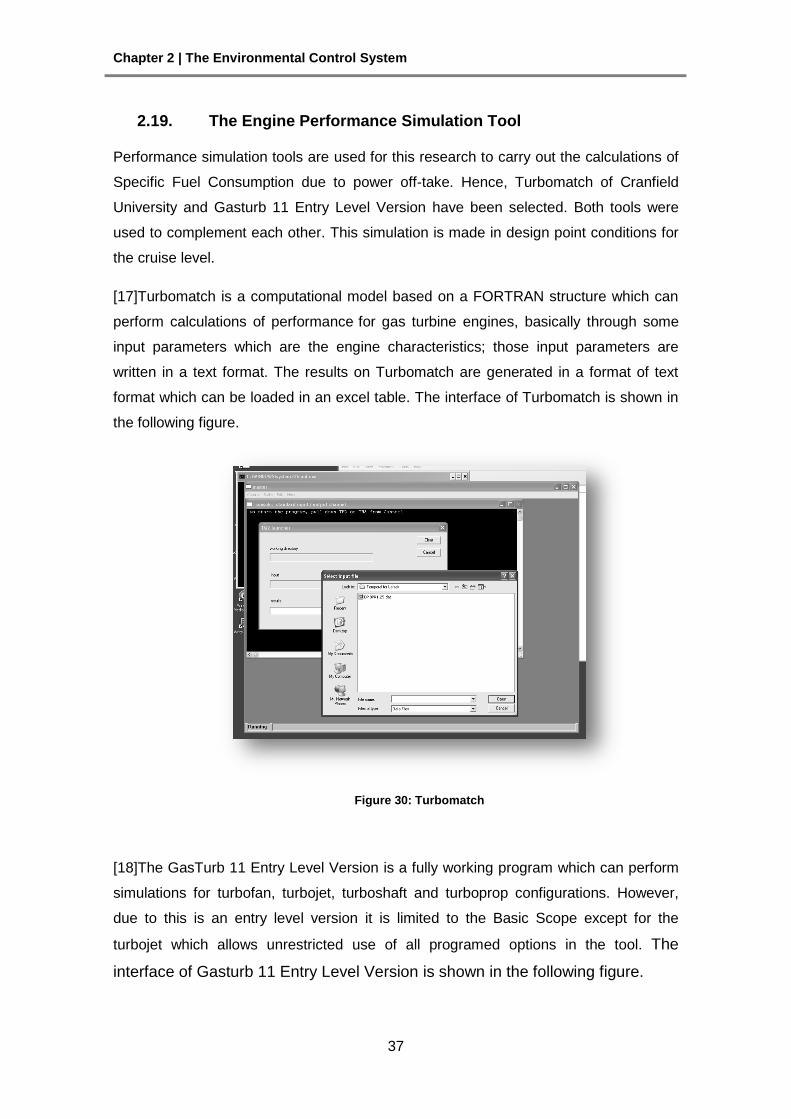
For rotary-wing analysis, the Bell 206 JetRanger has been selected as model of study.
This helicopter is mainly operated for corporate transportation, gas and oils industries,
law enforcement and fire fighting.
Figure 29: Bell 206
Chapter 2 | The Environmental Control System
37
2.19. The Engine Performance Simulation Tool
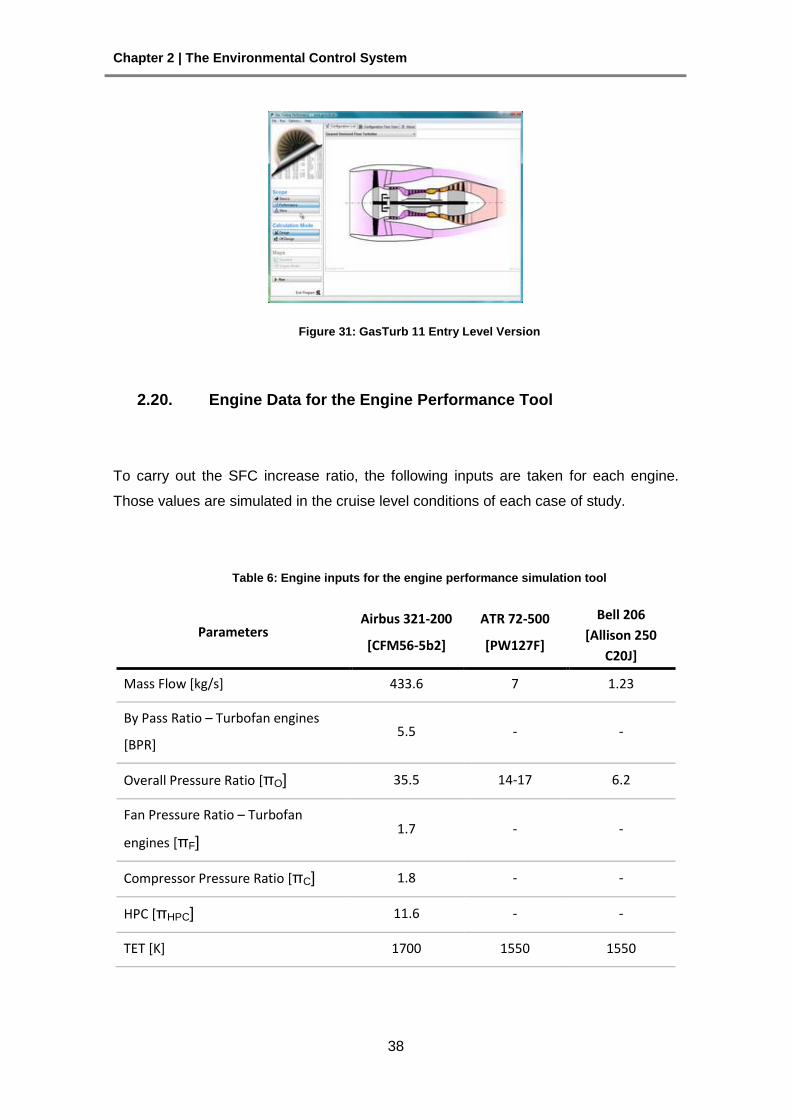
Performance simulation tools are used for this research to carry out the calculations of
Specific Fuel Consumption due to power off-take. Hence, Turbomatch of Cranfield
University and Gasturb 11 Entry Level Version have been selected. Both tools were
used to complement each other. This simulation is made in design point conditions for
the cruise level.
[17]Turbomatch is a computational model based on a FORTRAN structure which can
perform calculations of performance for gas turbine engines, basically through some
input parameters which are the engine characteristics; those input parameters are
written in a text format. The results on Turbomatch are generated in a format of text
format which can be loaded in an excel table. The interface of Turbomatch is shown in
the following figure.
Figure 30: Turbomatch
[18]The GasTurb 11 Entry Level Version is a fully working program which can perform
simulations for turbofan, turbojet, turboshaft and turboprop configurations. However,
due to this is an entry level version it is limited to the Basic Scope except for the
turbojet which allows unrestricted use of all programed options in the tool. The
interface of Gasturb 11 Entry Level Version is shown in the following figure.
Chapter 2 | The Environmental Control System
38
Figure 31: GasTurb 11 Entry Level Version
2.20. Engine Data for the Engine Performance Tool
To carry out the SFC increase ratio, the following inputs are taken for each engine.
Those values are simulated in the cruise level conditions of each case of study.
Table 6: Engine inputs for the engine performance simulation tool
Parameters Airbus 321-200
[CFM56-5b2]
ATR 72-500
[PW127F]
Bell 206
[Allison 250
C20J]
Mass Flow [kg/s] 433.6 7 1.23
By Pass Ratio – Turbofan engines
[BPR] 5.5 - -
Overall Pressure Ratio [πO] 35.5 14-17 6.2
Fan Pressure Ratio – Turbofan
engines [πF] 1.7 - -
Compressor Pressure Ratio [πC] 1.8 - -
HPC [πHPC] 11.6 - -
TET [K] 1700 1550 1550
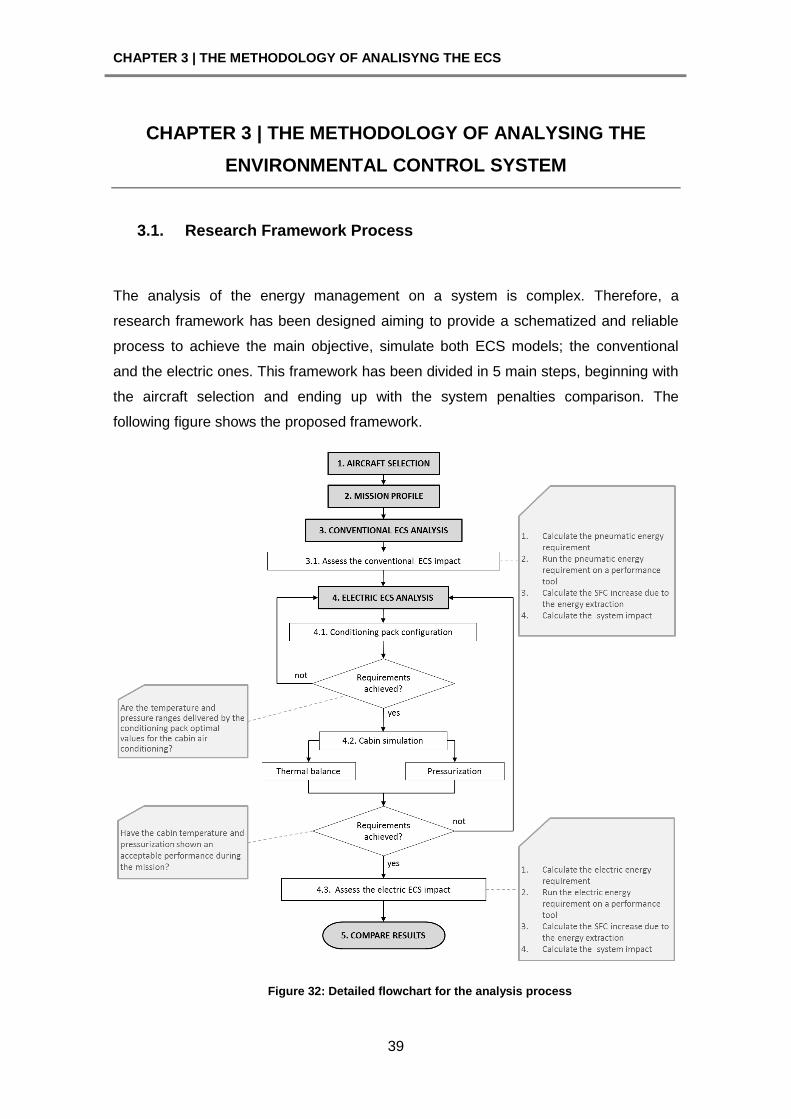
CHAPTER 3 | THE METHODOLOGY OF ANALISYNG THE ECS
39
CHAPTER 3 | THE METHODOLOGY OF ANALYSING THE
ENVIRONMENTAL CONTROL SYSTEM
3.1. Research Framework Process
The analysis of the energy management on a system is complex. Therefore, a
research framework has been designed aiming to provide a schematized and reliable
process to achieve the main objective, simulate both ECS models; the conventional
and the electric ones. This framework has been divided in 5 main steps, beginning with
the aircraft selection and ending up with the system penalties comparison. The
following figure shows the proposed framework.
Figure 32: Detailed flowchart for the analysis process
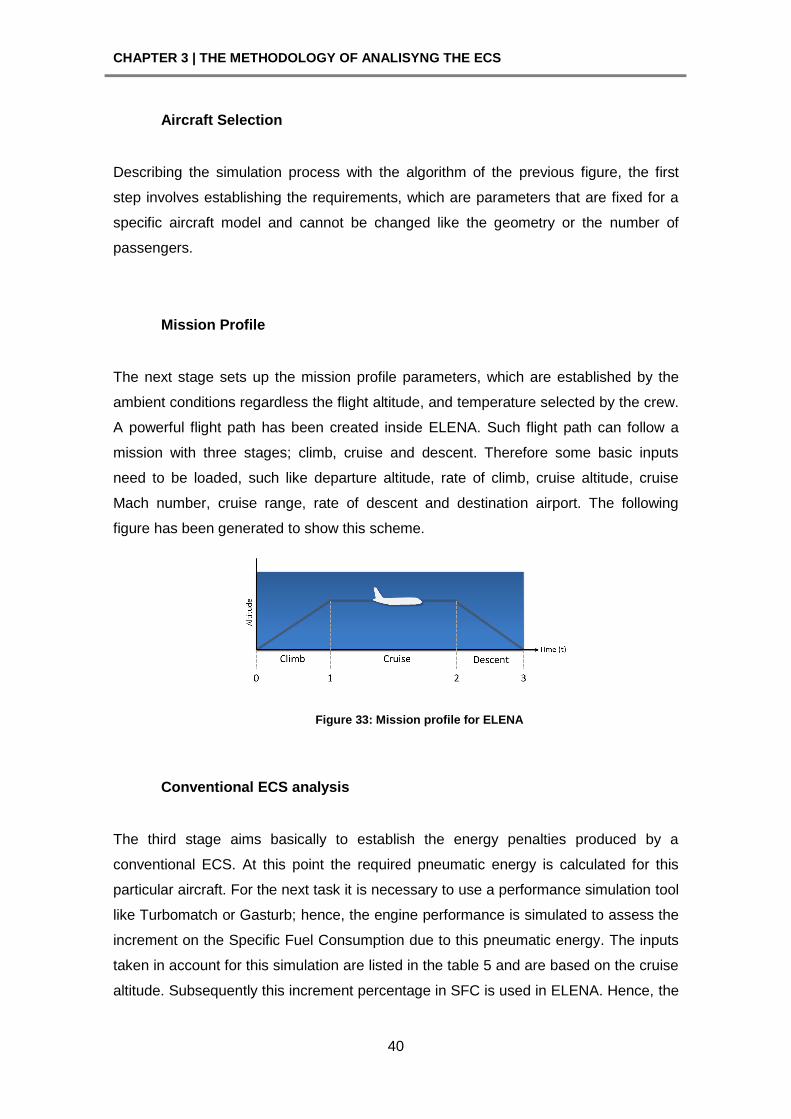
CHAPTER 3 | THE METHODOLOGY OF ANALISYNG THE ECS
40
Aircraft Selection
Describing the simulation process with the algorithm of the previous figure, the first
step involves establishing the requirements, which are parameters that are fixed for a
specific aircraft model and cannot be changed like the geometry or the number of
passengers.
Mission Profile
The next stage sets up the mission profile parameters, which are established by the
ambient conditions regardless the flight altitude, and temperature selected by the crew.
A powerful flight path has been created inside ELENA. Such flight path can follow a
mission with three stages; climb, cruise and descent. Therefore some basic inputs
need to be loaded, such like departure altitude, rate of climb, cruise altitude, cruise
Mach number, cruise range, rate of descent and destination airport. The following
figure has been generated to show this scheme.
Figure 33: Mission profile for ELENA
Conventional ECS analysis
The third stage aims basically to establish the energy penalties produced by a
conventional ECS. At this point the required pneumatic energy is calculated for this
particular aircraft. For the next task it is necessary to use a performance simulation tool
like Turbomatch or Gasturb; hence, the engine performance is simulated to assess the
increment on the Specific Fuel Consumption due to this pneumatic energy. The inputs
taken in account for this simulation are listed in the table 5 and are based on the cruise
altitude. Subsequently this increment percentage in SFC is used in ELENA. Hence, the
CHAPTER 3 | THE METHODOLOGY OF ANALISYNG THE ECS
41
fuel penalty is assessed in conjunction with other parameters; such as the system drag
and system mass contribution. If the results are acceptable with the real ones, the
simulation process can be finished and continued to the next step.
Electric ECS analysis
The next step aims to set up electric ECS configuration. Hence, following the main
purpose of the flow chart, this configuration can be changed towards achieving a
system that is capable to meet the air conditioning requirements for the selected
aircraft. Those requirements are mainly the temperature control and the pressurization
if the aircraft is a fixed-wing type.
Hence, aiming to develop a reliable analysis for the electric conditioning pack design,
this stage has been divided into three main steps. Firstly, a small parametric study is
done to establish the configuration for an electric ECS conditioning pack which is
capable to meet the flight mission requirements.
Secondly, the cabin temperature and pressurization are simulated to analyse the
response of the configured conditioning pack for a mission profile. The mission profile
includes the three main flight phases, climbing, cruise and a descent.
And finally, the fuel penalty is assessed in conjunction with other parameters; such as
the system drag and system mass contribution. If the results are acceptable the
simulation process can be finished and continued to the final step. This step is done
with the same methodology for the conventional ECS, with the difference that the
power off take will be electrical and not pneumatic.
Results comparison
The main goal in the final step is to compare the results for both, the conventional and
electric ECS’s. Hence, is possible to analyse on a first view the achievements,
advantages and disadvantages for an electric ECS.
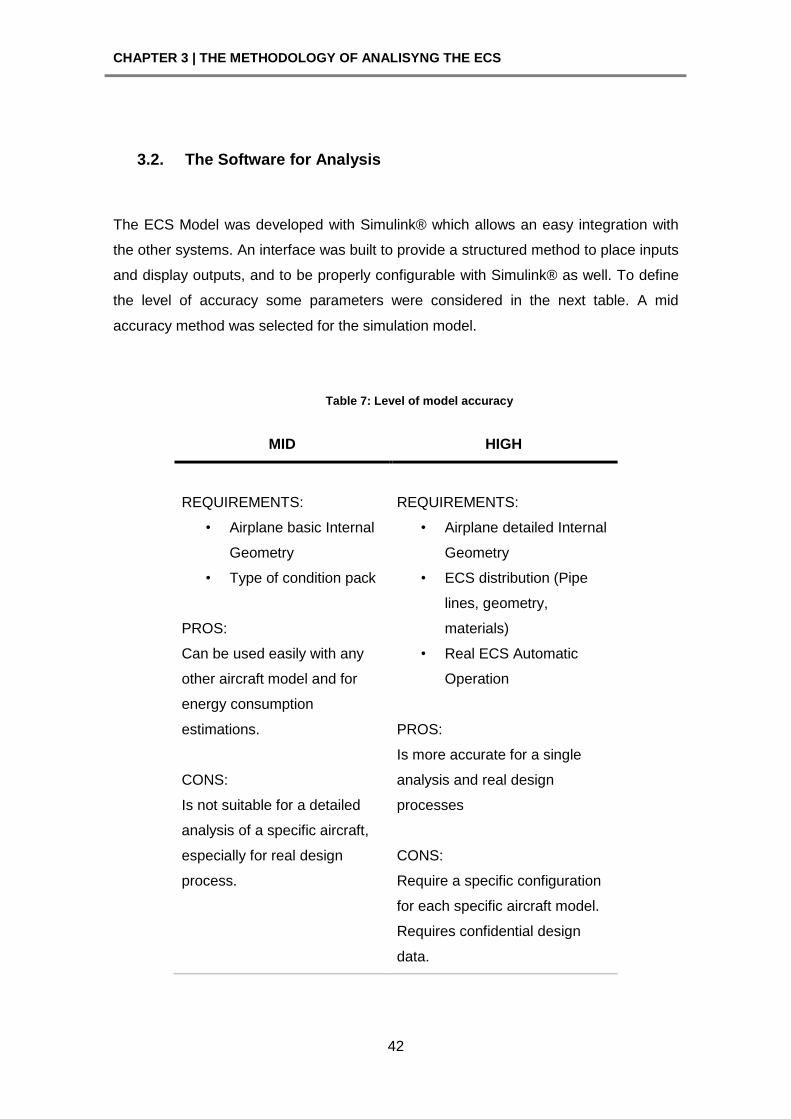
CHAPTER 3 | THE METHODOLOGY OF ANALISYNG THE ECS
42
3.2. The Software for Analysis
The ECS Model was developed with Simulink® which allows an easy integration with
the other systems. An interface was built to provide a structured method to place inputs
and display outputs, and to be properly configurable with Simulink® as well. To define
the level of accuracy some parameters were considered in the next table. A mid
accuracy method was selected for the simulation model.
Table 7: Level of model accuracy
MID HIGH
REQUIREMENTS:
• Airplane basic Internal
Geometry
• Type of condition pack
PROS:
Can be used easily with any
other aircraft model and for
energy consumption
estimations.
CONS:
Is not suitable for a detailed
analysis of a specific aircraft,
especially for real design
process.
REQUIREMENTS:
• Airplane detailed Internal
Geometry
• ECS distribution (Pipe
lines, geometry,
materials)
• Real ECS Automatic
Operation
PROS:
Is more accurate for a single
analysis and real design
processes
CONS:
Require a specific configuration
for each specific aircraft model.
Requires confidential design
data.
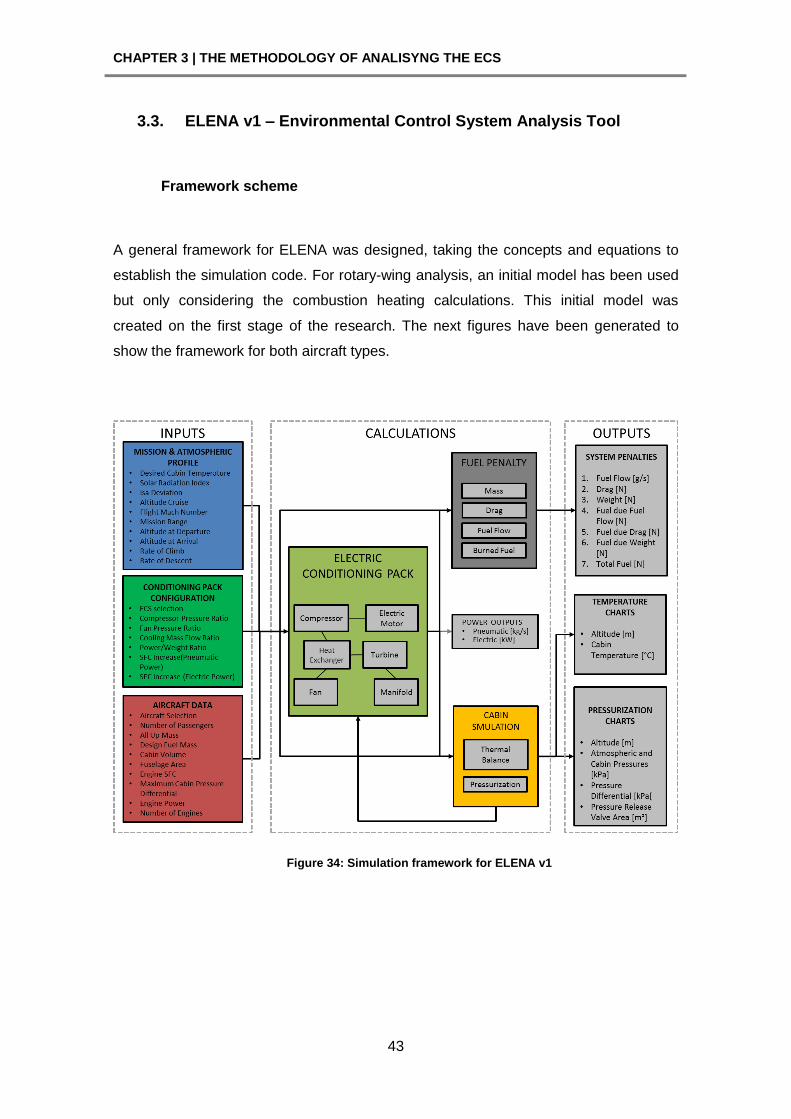
CHAPTER 3 | THE METHODOLOGY OF ANALISYNG THE ECS
43
3.3. ELENA v1 – Environmental Control System Analysis Tool
Framework scheme
A general framework for ELENA was designed, taking the concepts and equations to
establish the simulation code. For rotary-wing analysis, an initial model has been used
but only considering the combustion heating calculations. This initial model was
created on the first stage of the research. The next figures have been generated to
show the framework for both aircraft types.
Figure 34: Simulation framework for ELENA v1
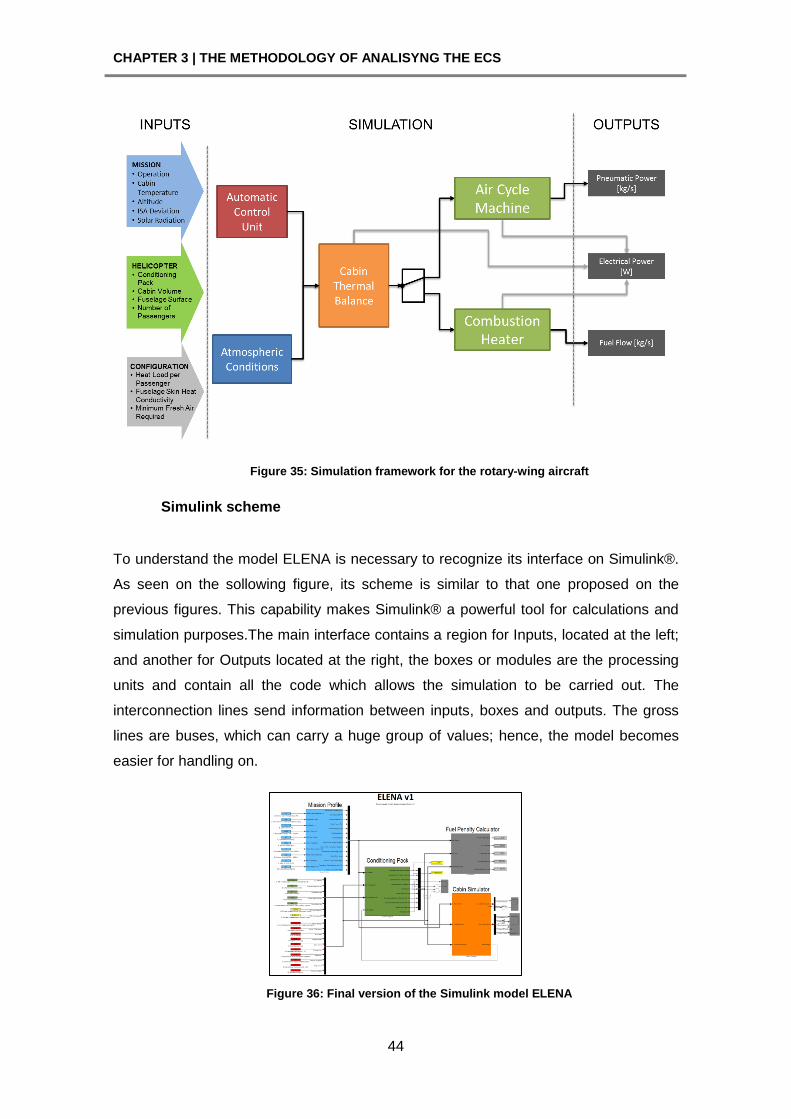
CHAPTER 3 | THE METHODOLOGY OF ANALISYNG THE ECS
44
Figure 35: Simulation framework for the rotary-wing aircraft
Simulink scheme
To understand the model ELENA is necessary to recognize its interface on Simulink®.
As seen on the sollowing figure, its scheme is similar to that one proposed on the
previous figures. This capability makes Simulink® a powerful tool for calculations and
simulation purposes.The main interface contains a region for Inputs, located at the left;
and another for Outputs located at the right, the boxes or modules are the processing
units and contain all the code which allows the simulation to be carried out. The
interconnection lines send information between inputs, boxes and outputs. The gross
lines are buses, which can carry a huge group of values; hence, the model becomes
easier for handling on.
Figure 36: Final version of the Simulink model ELENA
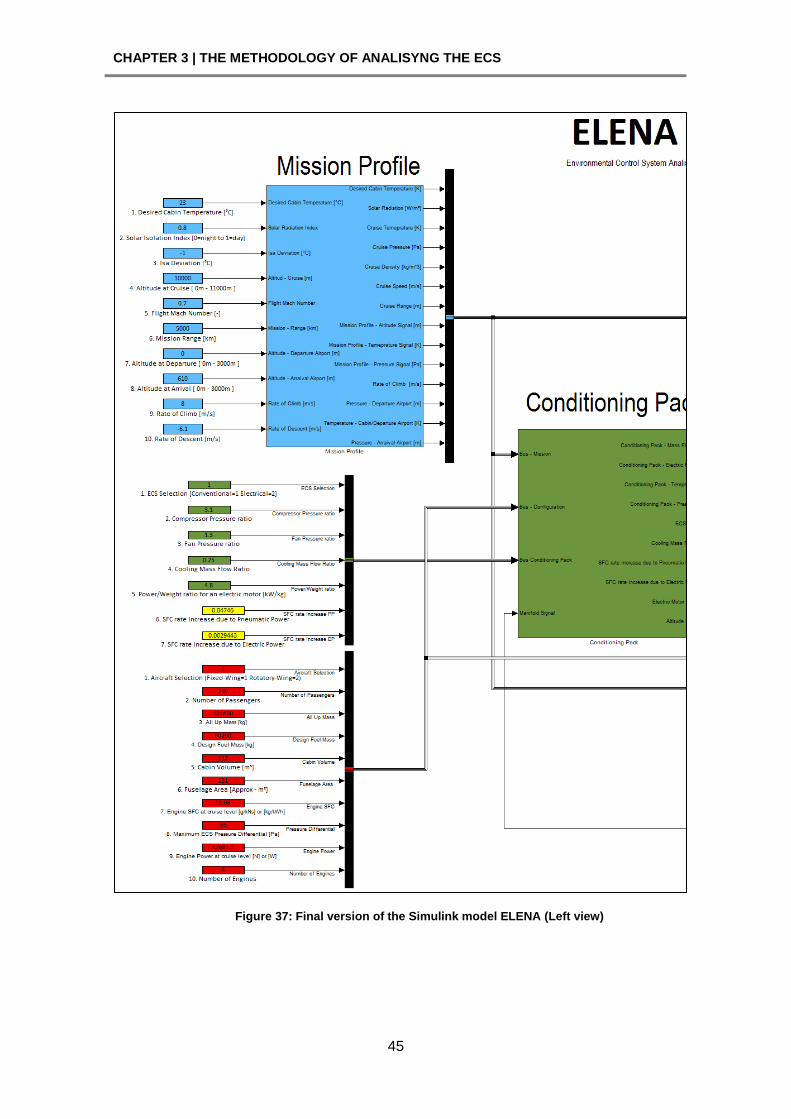
CHAPTER 3 | THE METHODOLOGY OF ANALISYNG THE ECS
45
Figure 37: Final version of the Simulink model ELENA (Left view)
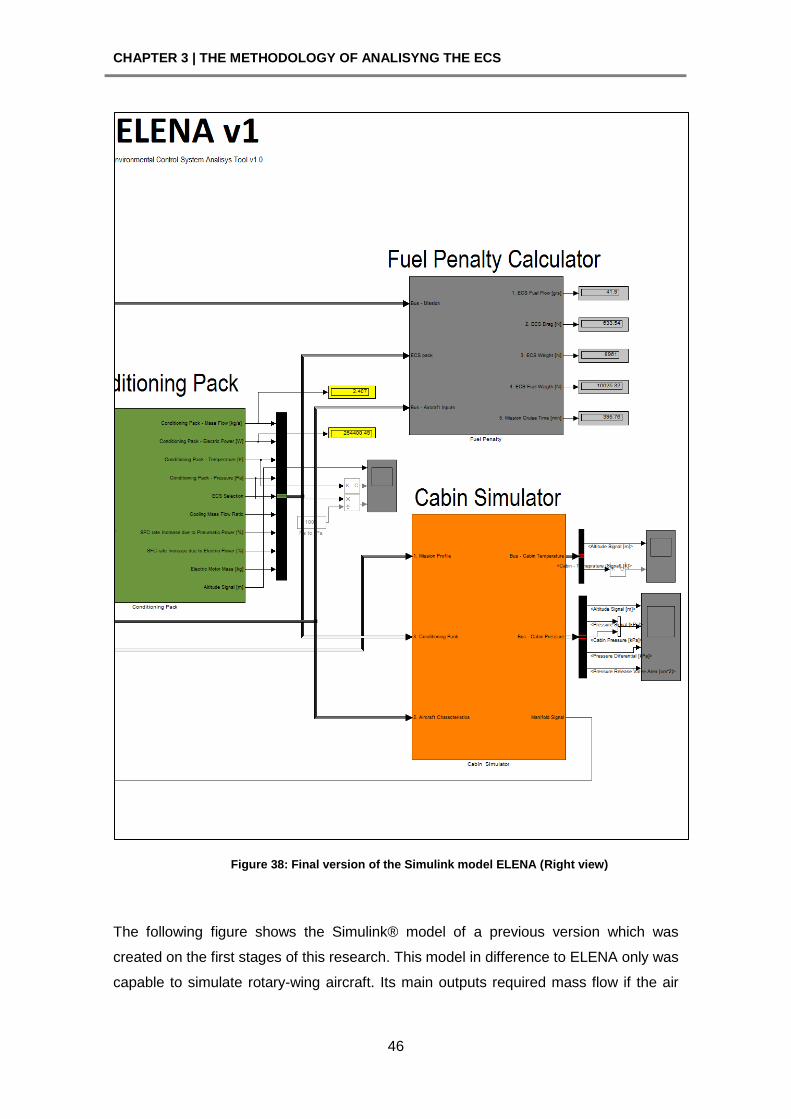
CHAPTER 3 | THE METHODOLOGY OF ANALISYNG THE ECS
46
Figure 38: Final version of the Simulink model ELENA (Right view)
The following figure shows the Simulink® model of a previous version which was
created on the first stages of this research. This model in difference to ELENA only was
capable to simulate rotary-wing aircraft. Its main outputs required mass flow if the air
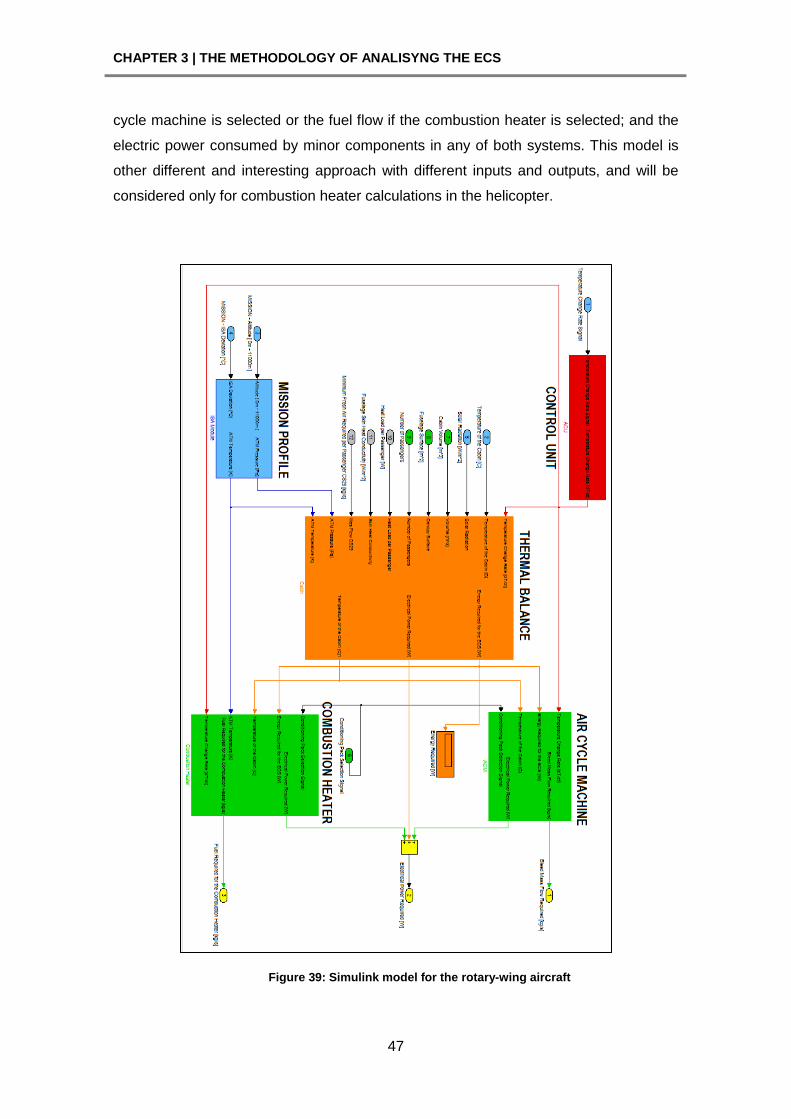
CHAPTER 3 | THE METHODOLOGY OF ANALISYNG THE ECS
47
cycle machine is selected or the fuel flow if the combustion heater is selected; and the
electric power consumed by minor components in any of both systems. This model is
other different and interesting approach with different inputs and outputs, and will be
considered only for combustion heater calculations in the helicopter.
Figure 39: Simulink model for the rotary-wing aircraft
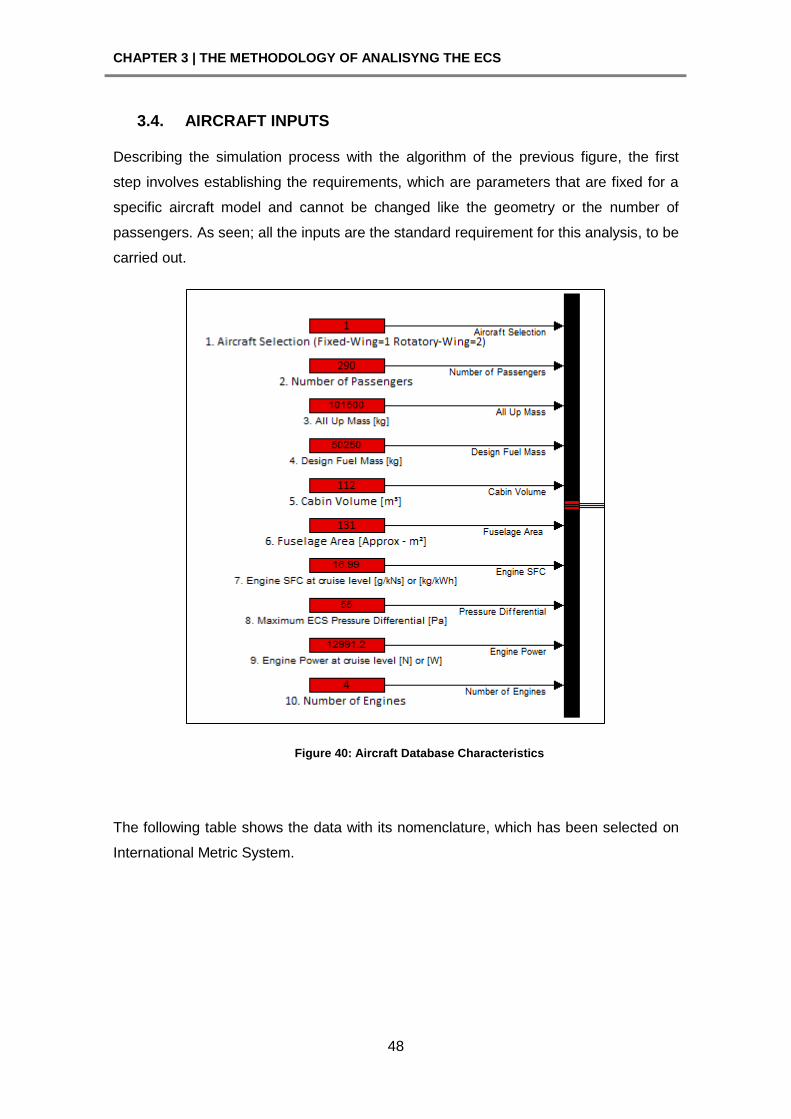
CHAPTER 3 | THE METHODOLOGY OF ANALISYNG THE ECS
48
3.4. AIRCRAFT INPUTS
Describing the simulation process with the algorithm of the previous figure, the first
step involves establishing the requirements, which are parameters that are fixed for a
specific aircraft model and cannot be changed like the geometry or the number of
passengers. As seen; all the inputs are the standard requirement for this analysis, to be
carried out.
Figure 40: Aircraft Database Characteristics
The following table shows the data with its nomenclature, which has been selected on
International Metric System.
CHAPTER 3 | THE METHODOLOGY OF ANALISYNG THE ECS
49
Table 8: Aircraft inputs
Input Units Optimal range
1. Aircraft selection signal - 1=(Fixed-Wing)
2=(Rotary-Wing)
2. Number of passengers [PN] - [0 to 800]
3. All up mass [AUM] kg [1000 to 500000]
4. Fuel weight [WF] kg [50 to 80000]
5. Cabin Volume [Vcab] m3 [10 to 1000]
6. Fuselage Area [Afus] m2 [2 to 2000]
7. Engine SFC [SFC]
g/kNs (Turbojet)
kg/kWh (Turbo-
prop/shaft)
[2 to 40]
[0.2 to 0.4]
8. Maximum Pressurization
Deferential [∆PMAX] kPa [about 55 kPa]
9. Engine net thrust or net shaft
power at cruise [FN] or [PW] N or W [50000 to 2X10⁶]
10. Number of engines [EN] -
3.5. MISSION PROFILE CALCULATIONS
As mentioned previously; the next stage sets up the mission profile parameters which
are established by the ambient conditions regardless the flight altitude, and
temperature selected by the crew. A powerful flight path has been created inside
ELENA. Such flight path can follow a mission with three stages; climb, cruise and
descent. Therefore some basic inputs need to be loaded, such like departure altitude,
rate of climb, cruise altitude, cruise Mach number, cruise range, rate of descent and
destination airport. The following figure shows the inputs and the module for mission
profiles calculations, both part of ELENA.
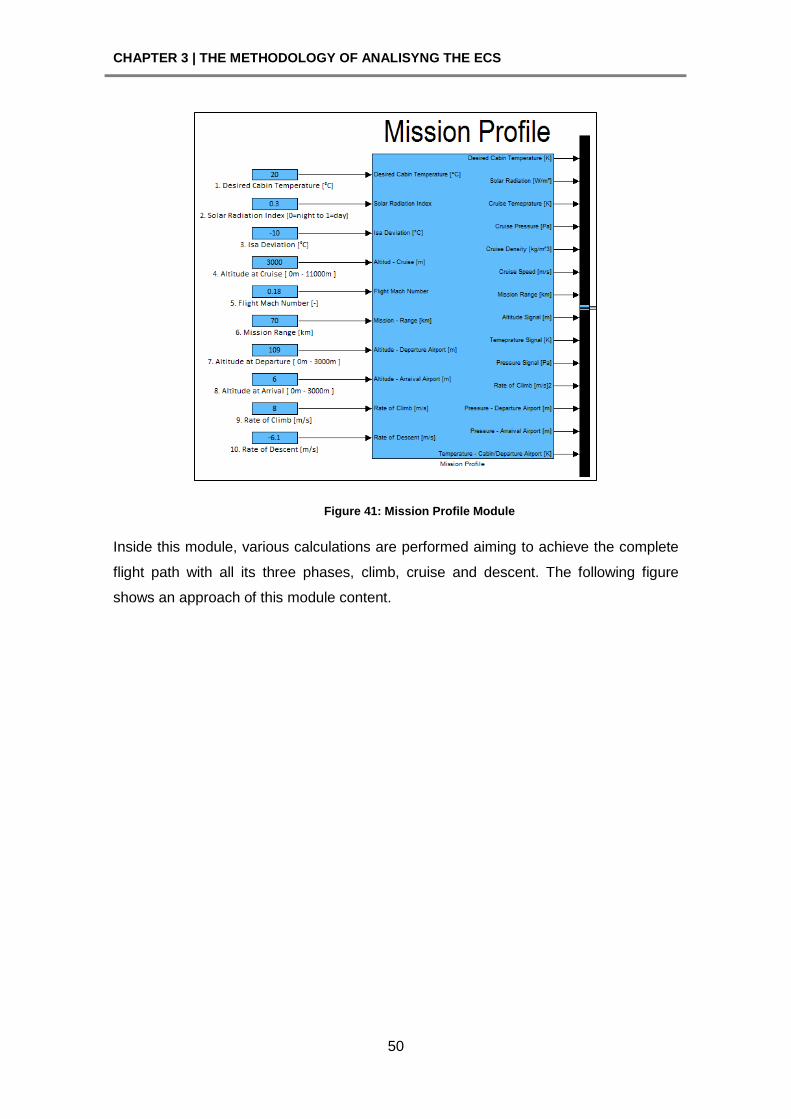
CHAPTER 3 | THE METHODOLOGY OF ANALISYNG THE ECS
50
Figure 41: Mission Profile Module
Inside this module, various calculations are performed aiming to achieve the complete
flight path with all its three phases, climb, cruise and descent. The following figure
shows an approach of this module content.
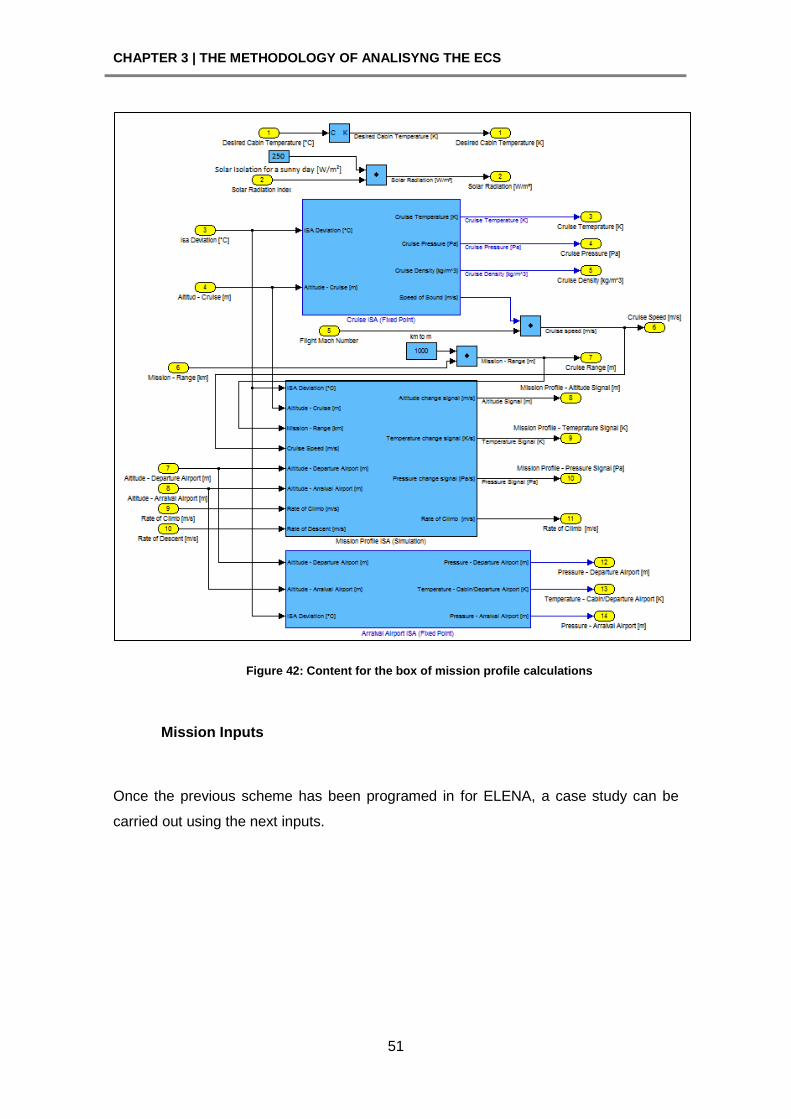
CHAPTER 3 | THE METHODOLOGY OF ANALISYNG THE ECS
51
Figure 42: Content for the box of mission profile calculations
Mission Inputs
Once the previous scheme has been programed in for ELENA, a case study can be
carried out using the next inputs.
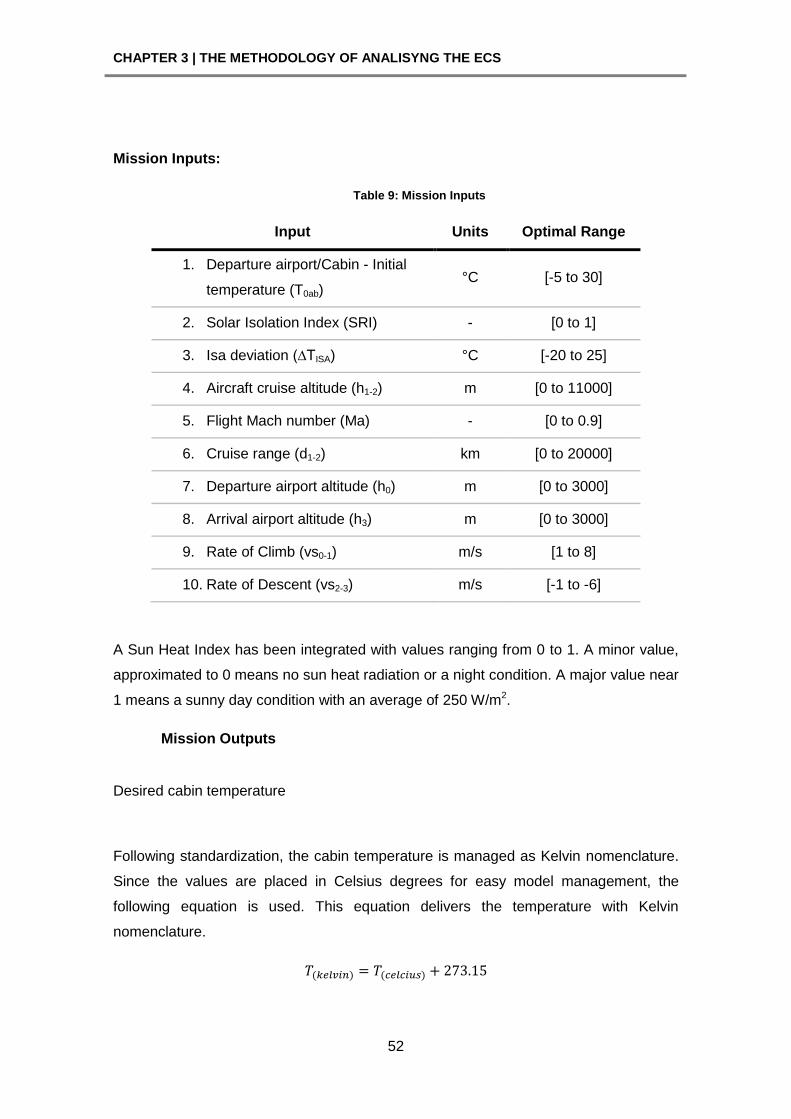
CHAPTER 3 | THE METHODOLOGY OF ANALISYNG THE ECS
52
Mission Inputs:
Table 9: Mission Inputs
Input Units Optimal Range
1. Departure airport/Cabin - Initial
temperature (T0ab) °C [-5 to 30]
2. Solar Isolation Index (SRI) - [0 to 1]
3. Isa deviation (∆TISA) °C [-20 to 25]
4. Aircraft cruise altitude (h1-2) m [0 to 11000]
5. Flight Mach number (Ma) - [0 to 0.9]
6. Cruise range (d1-2) km [0 to 20000]
7. Departure airport altitude (h0) m [0 to 3000]
8. Arrival airport altitude (h3) m [0 to 3000]
9. Rate of Climb (vs0-1) m/s [1 to 8]
10. Rate of Descent (vs2-3) m/s [-1 to -6]
A Sun Heat Index has been integrated with values ranging from 0 to 1. A minor value,
approximated to 0 means no sun heat radiation or a night condition. A major value near
1 means a sunny day condition with an average of 250 W/m2.
Mission Outputs
Desired cabin temperature
Following standardization, the cabin temperature is managed as Kelvin nomenclature.
Since the values are placed in Celsius degrees for easy model management, the
following equation is used. This equation delivers the temperature with Kelvin
nomenclature.
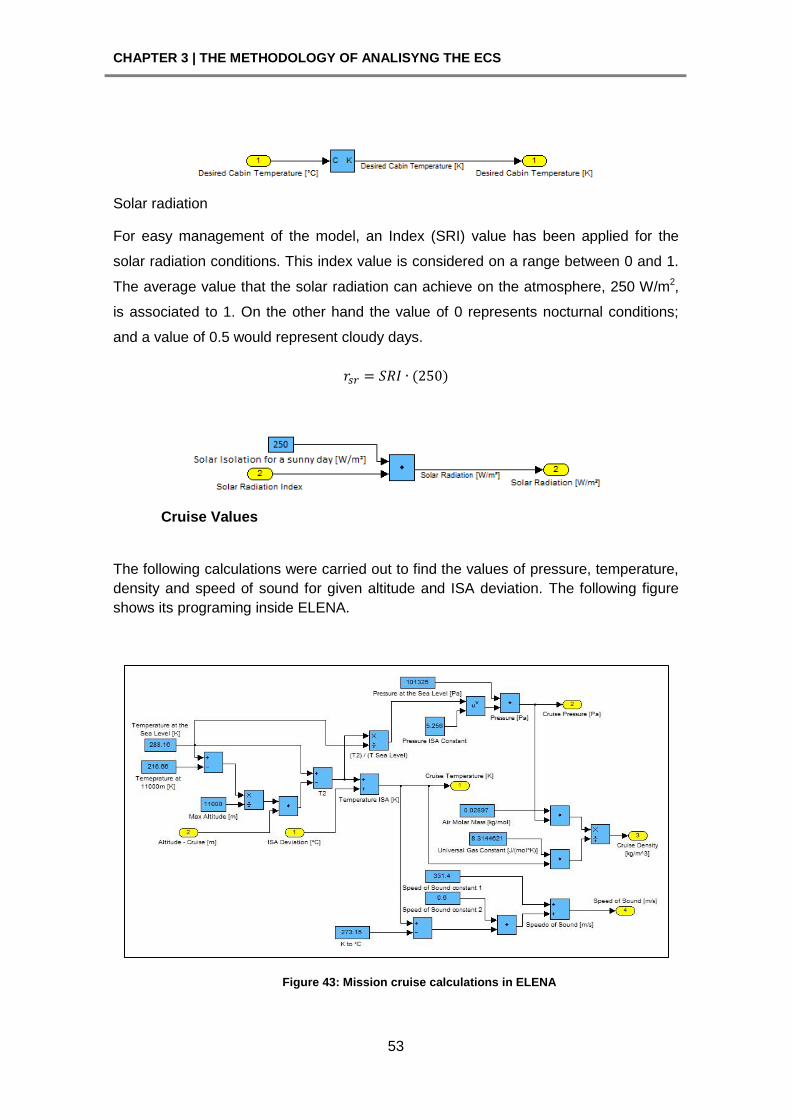
CHAPTER 3 | THE METHODOLOGY OF ANALISYNG THE ECS
53
Solar radiation
For easy management of the model, an Index (SRI) value has been applied for the
solar radiation conditions. This index value is considered on a range between 0 and 1.
The average value that the solar radiation can achieve on the atmosphere, 250 W/m2,
is associated to 1. On the other hand the value of 0 represents nocturnal conditions;
and a value of 0.5 would represent cloudy days.
Cruise Values
The following calculations were carried out to find the values of pressure, temperature,
density and speed of sound for given altitude and ISA deviation. The following figure
shows its programing inside ELENA.
Figure 43: Mission cruise calculations in ELENA
CHAPTER 3 | THE METHODOLOGY OF ANALISYNG THE ECS
54
The cruise temperature is given by the following calculations:
[ (
* ]
Where,
The cruise pressure is given by the following calculations:
(
*
Where,
The cruise density is given by the following calculations:
Where,
The cruise speed of sound is given by the following calculations:
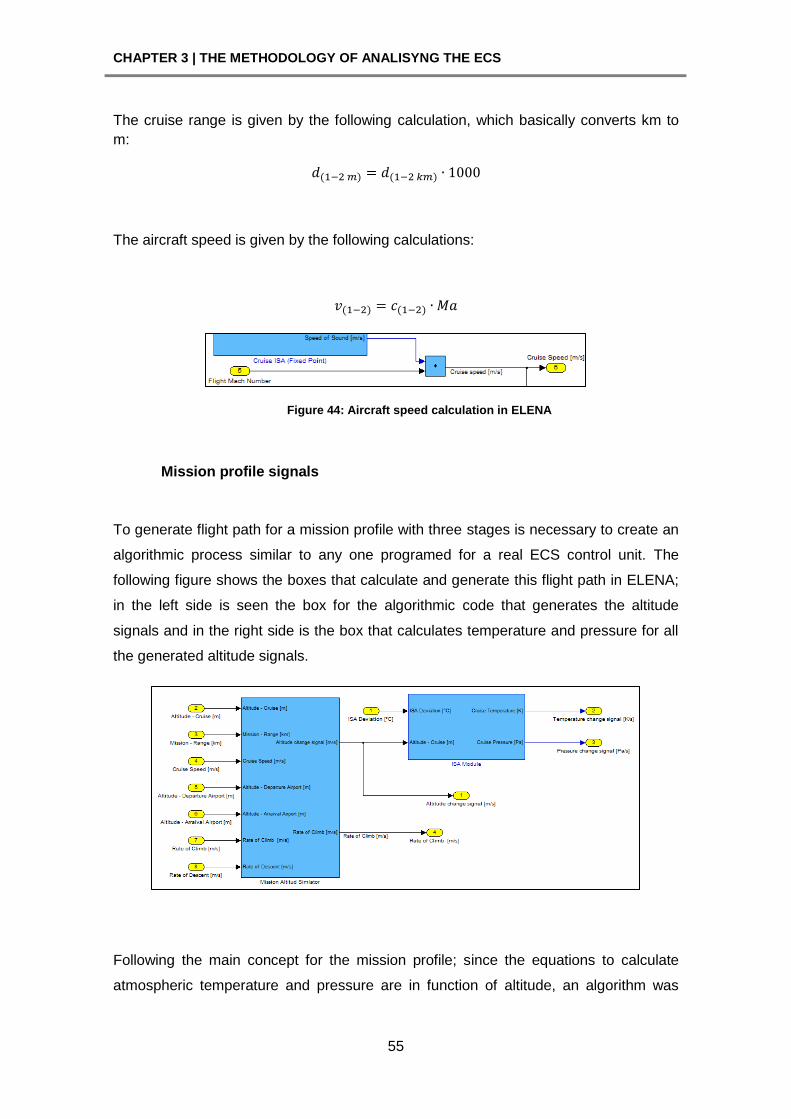
CHAPTER 3 | THE METHODOLOGY OF ANALISYNG THE ECS
55
The cruise range is given by the following calculation, which basically converts km to
m:
The aircraft speed is given by the following calculations:
Figure 44: Aircraft speed calculation in ELENA
Mission profile signals
To generate flight path for a mission profile with three stages is necessary to create an
algorithmic process similar to any one programed for a real ECS control unit. The
following figure shows the boxes that calculate and generate this flight path in ELENA;
in the left side is seen the box for the algorithmic code that generates the altitude
signals and in the right side is the box that calculates temperature and pressure for all
the generated altitude signals.
Following the main concept for the mission profile; since the equations to calculate
atmospheric temperature and pressure are in function of altitude, an algorithm was
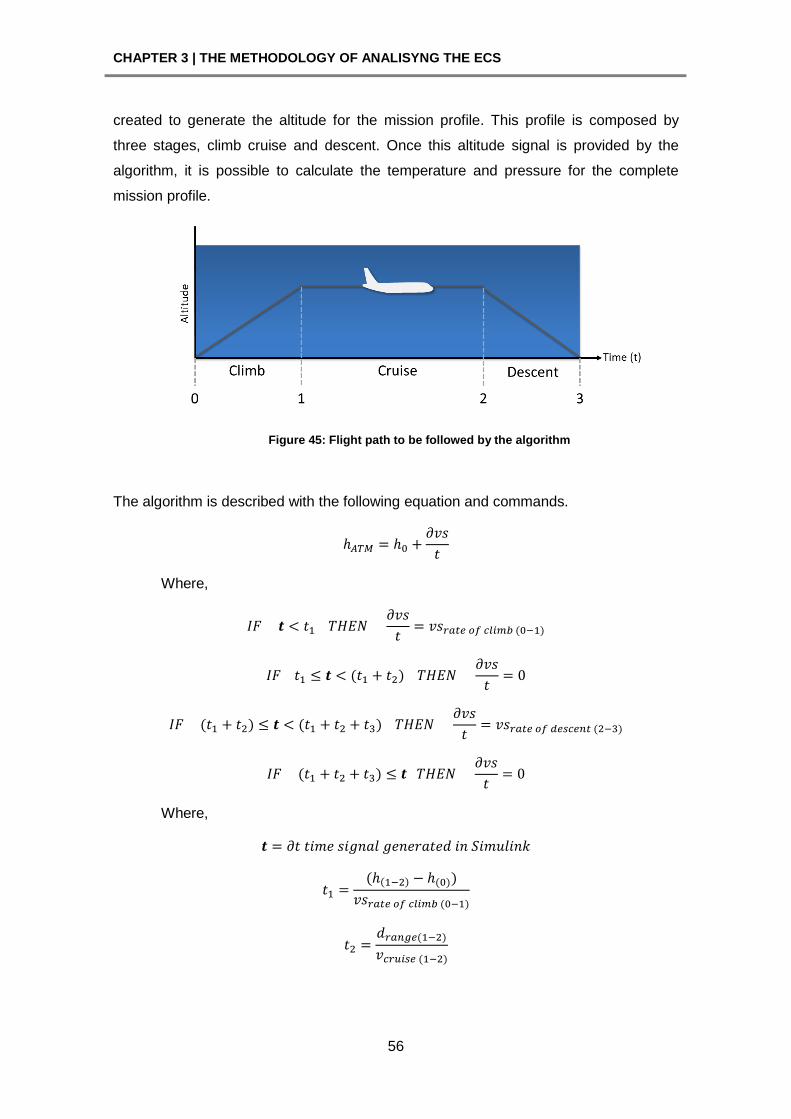
CHAPTER 3 | THE METHODOLOGY OF ANALISYNG THE ECS
56
created to generate the altitude for the mission profile. This profile is composed by
three stages, climb cruise and descent. Once this altitude signal is provided by the
algorithm, it is possible to calculate the temperature and pressure for the complete
mission profile.
Figure 45: Flight path to be followed by the algorithm
The algorithm is described with the following equation and commands.
Where,
Where,
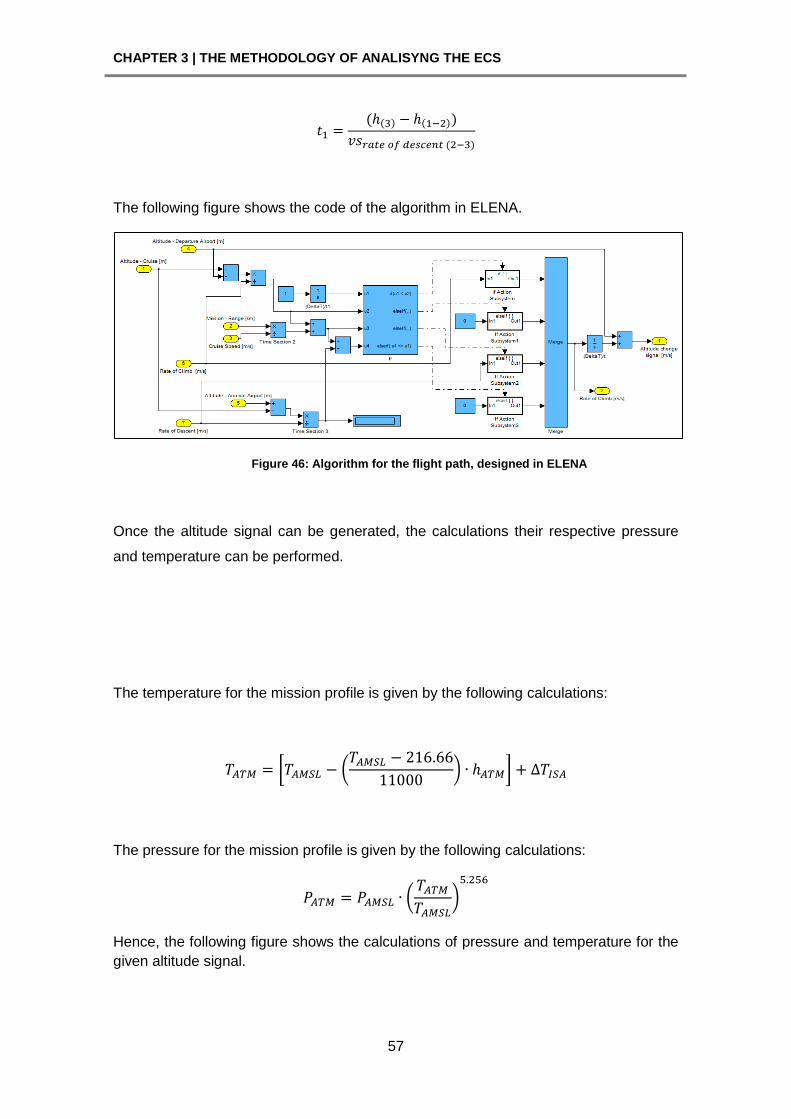
CHAPTER 3 | THE METHODOLOGY OF ANALISYNG THE ECS
57
The following figure shows the code of the algorithm in ELENA.
Figure 46: Algorithm for the flight path, designed in ELENA
Once the altitude signal can be generated, the calculations their respective pressure
and temperature can be performed.
The temperature for the mission profile is given by the following calculations:
[ (
* ]
The pressure for the mission profile is given by the following calculations:
(
*
Hence, the following figure shows the calculations of pressure and temperature for the
given altitude signal.
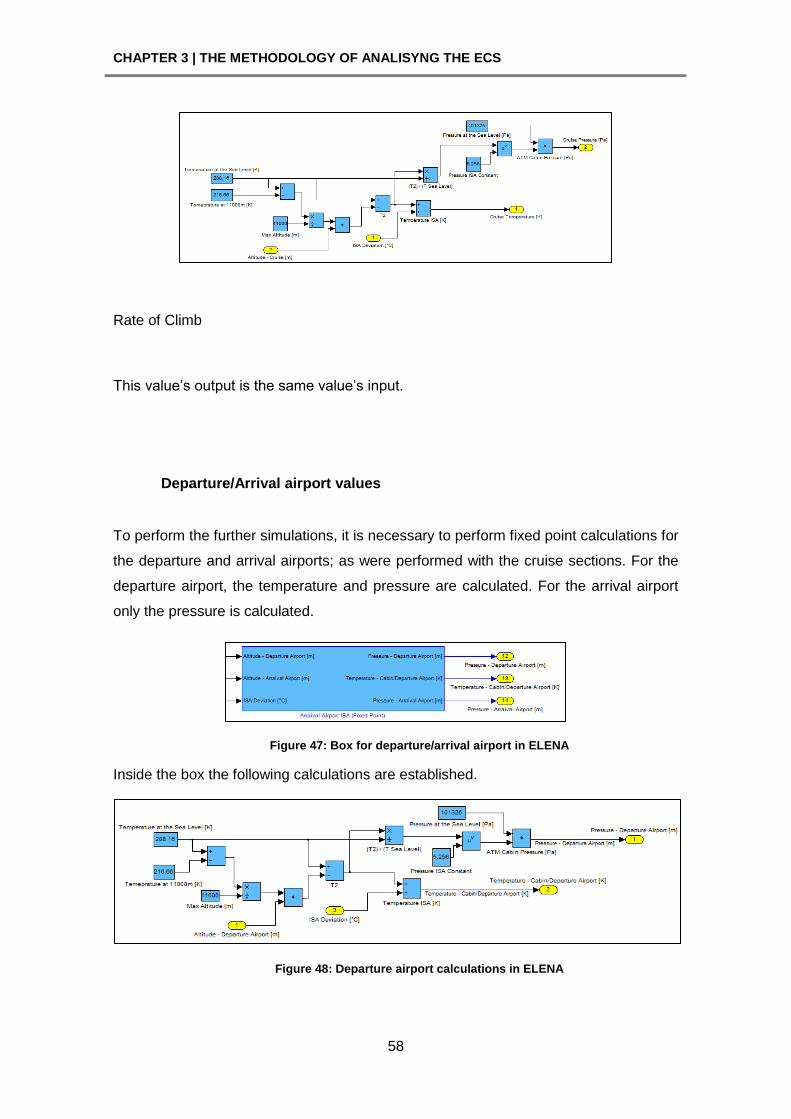
CHAPTER 3 | THE METHODOLOGY OF ANALISYNG THE ECS
58
Rate of Climb
This value’s output is the same value’s input.
Departure/Arrival airport values
To perform the further simulations, it is necessary to perform fixed point calculations for
the departure and arrival airports; as were performed with the cruise sections. For the
departure airport, the temperature and pressure are calculated. For the arrival airport
only the pressure is calculated.
Figure 47: Box for departure/arrival airport in ELENA
Inside the box the following calculations are established.
Figure 48: Departure airport calculations in ELENA
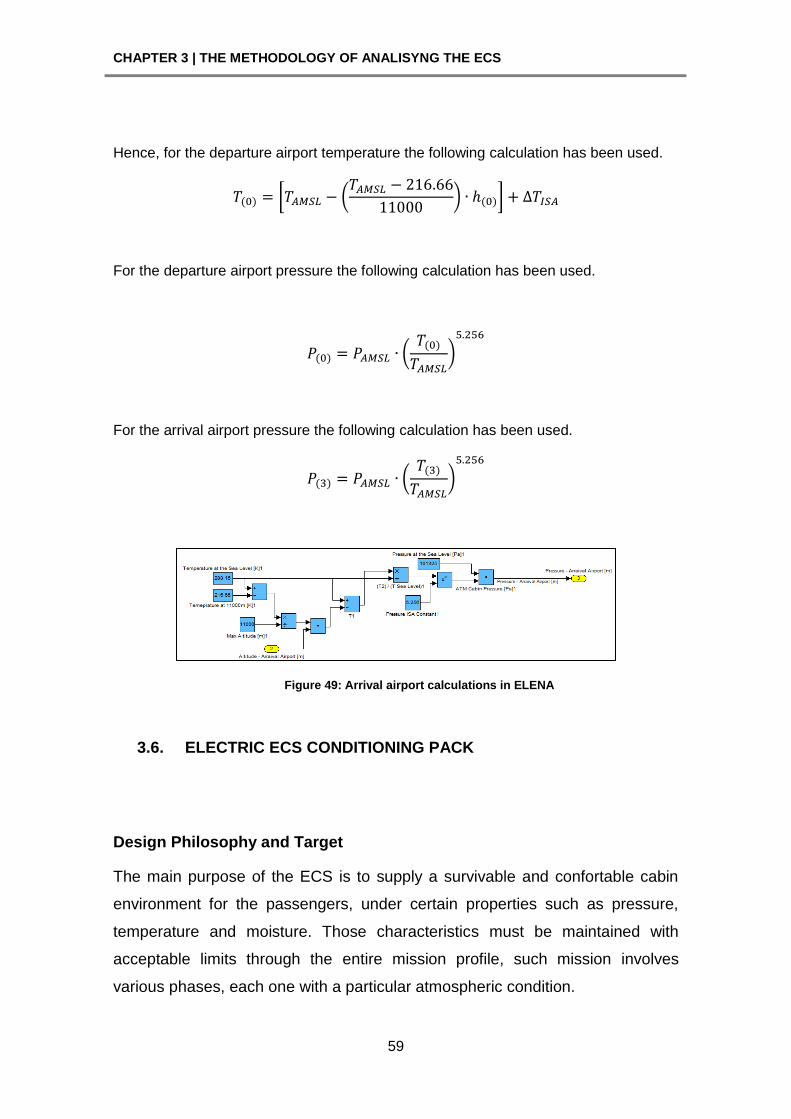
CHAPTER 3 | THE METHODOLOGY OF ANALISYNG THE ECS
59
Hence, for the departure airport temperature the following calculation has been used.
[ (
* ]
For the departure airport pressure the following calculation has been used.
(
*
For the arrival airport pressure the following calculation has been used.
(
*
Figure 49: Arrival airport calculations in ELENA
3.6. ELECTRIC ECS CONDITIONING PACK
Design Philosophy and Target
The main purpose of the ECS is to supply a survivable and confortable cabin
environment for the passengers, under certain properties such as pressure,
temperature and moisture. Those characteristics must be maintained with
acceptable limits through the entire mission profile, such mission involves
various phases, each one with a particular atmospheric condition.
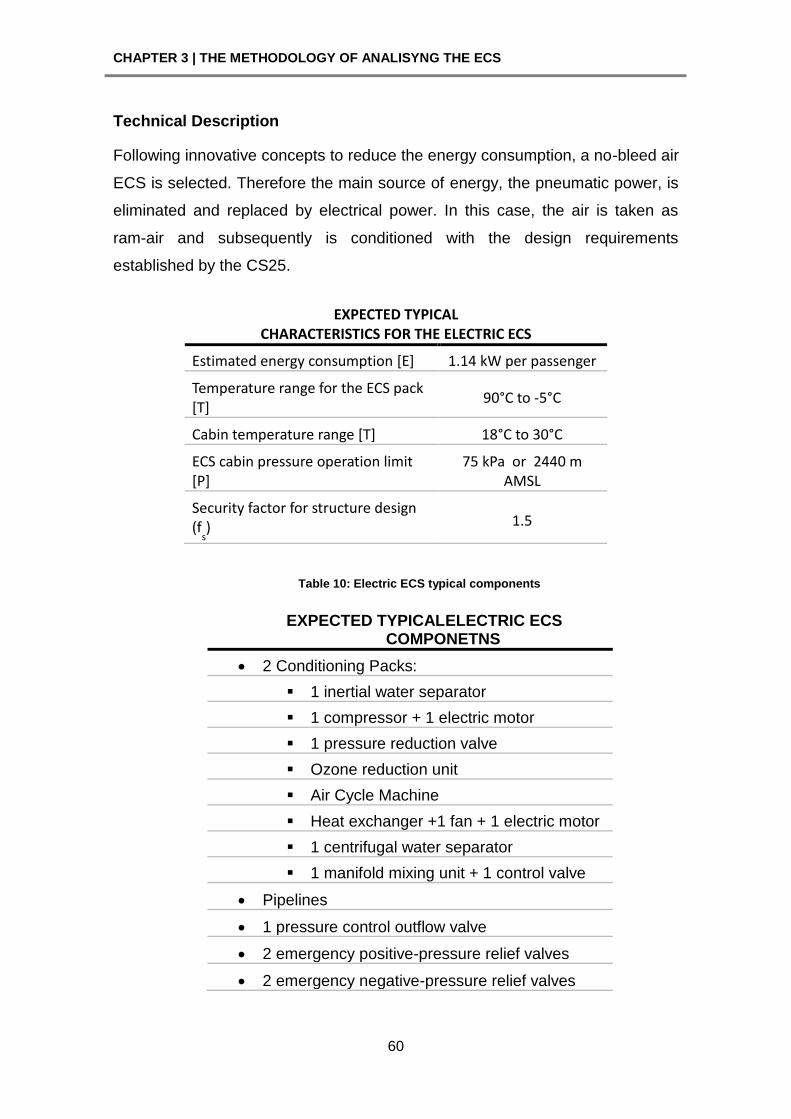
CHAPTER 3 | THE METHODOLOGY OF ANALISYNG THE ECS
60
Technical Description
Following innovative concepts to reduce the energy consumption, a no-bleed air
ECS is selected. Therefore the main source of energy, the pneumatic power, is
eliminated and replaced by electrical power. In this case, the air is taken as
ram-air and subsequently is conditioned with the design requirements
established by the CS25.
EXPECTED TYPICAL CHARACTERISTICS FOR THE ELECTRIC ECS
Estimated energy consumption *E+ 1.14 kW per passenger
Temperature range for the ECS pack *T+
90°C to -5°C
Cabin temperature range *T+ 18°C to 30°C
ECS cabin pressure operation limit *P+
75 kPa or 2440 m AMSL
Security factor for structure design (f
s) 1.5
Table 10: Electric ECS typical components
EXPECTED TYPICALELECTRIC ECS COMPONETNS
2 Conditioning Packs:
1 inertial water separator
1 compressor + 1 electric motor
1 pressure reduction valve
Ozone reduction unit
Air Cycle Machine
Heat exchanger +1 fan + 1 electric motor
1 centrifugal water separator
1 manifold mixing unit + 1 control valve
Pipelines
1 pressure control outflow valve
2 emergency positive-pressure relief valves
2 emergency negative-pressure relief valves
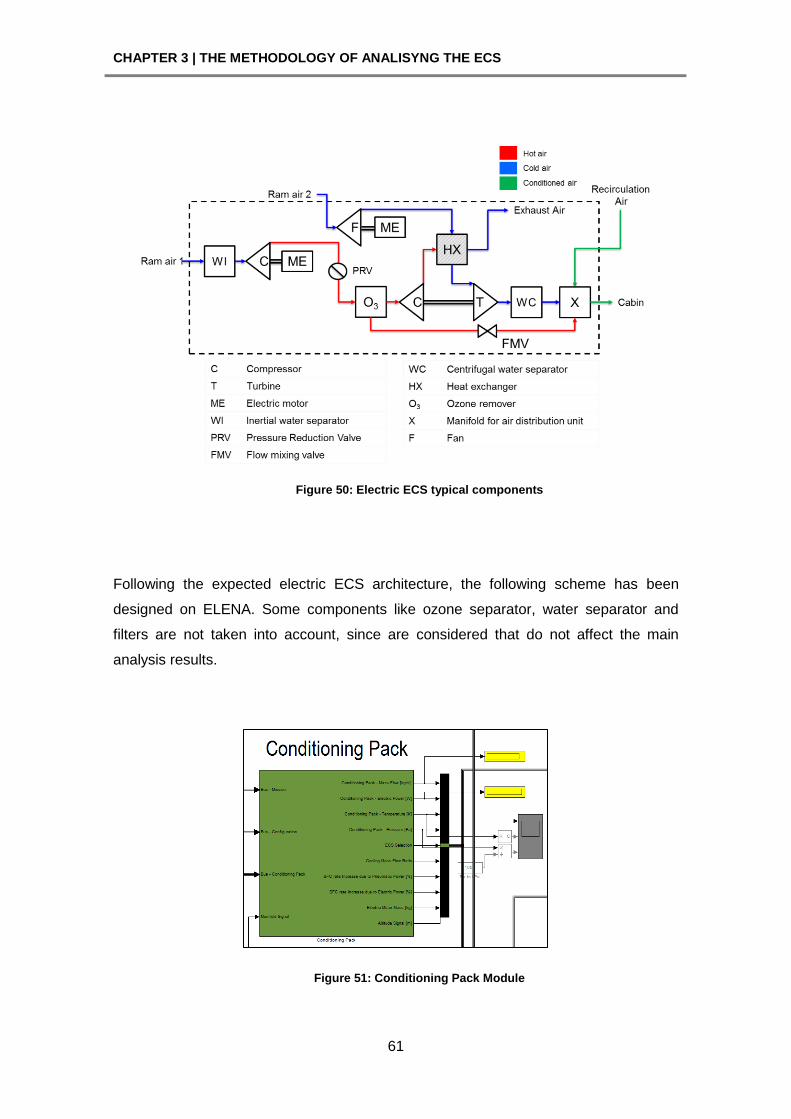
CHAPTER 3 | THE METHODOLOGY OF ANALISYNG THE ECS
61
Figure 50: Electric ECS typical components
Following the expected electric ECS architecture, the following scheme has been
designed on ELENA. Some components like ozone separator, water separator and
filters are not taken into account, since are considered that do not affect the main
analysis results.
Figure 51: Conditioning Pack Module
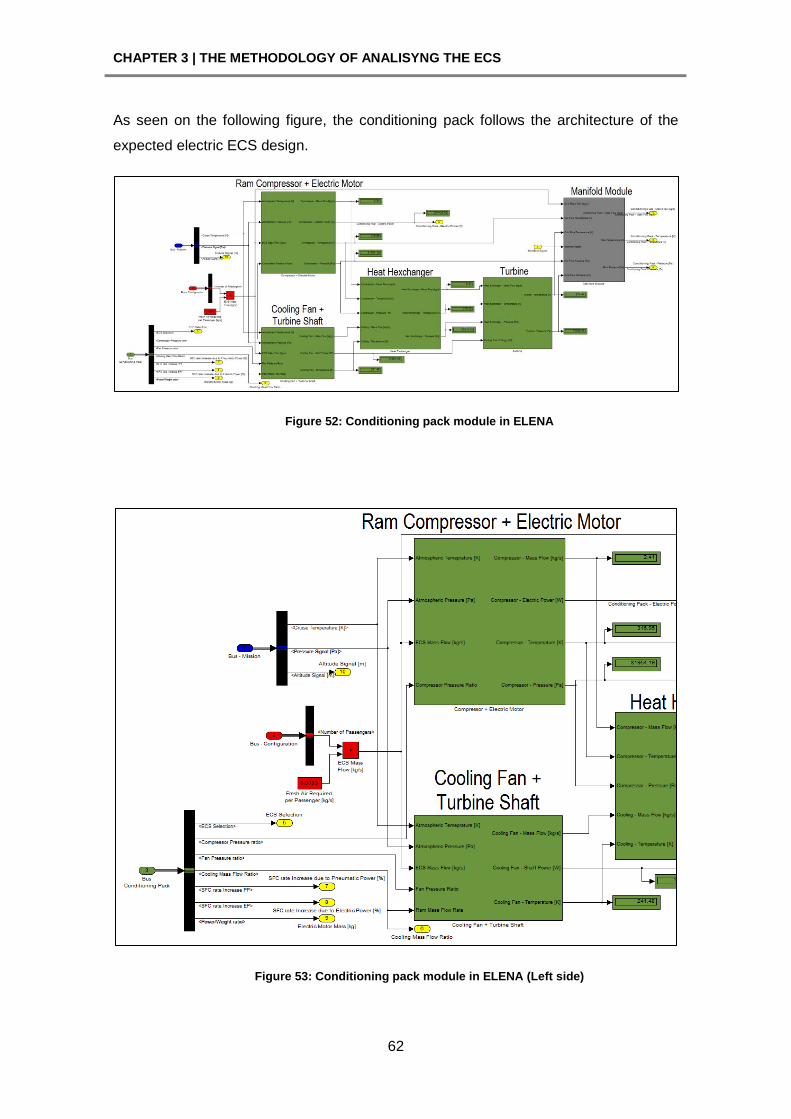
CHAPTER 3 | THE METHODOLOGY OF ANALISYNG THE ECS
62
As seen on the following figure, the conditioning pack follows the architecture of the
expected electric ECS design.
Figure 52: Conditioning pack module in ELENA
Figure 53: Conditioning pack module in ELENA (Left side)
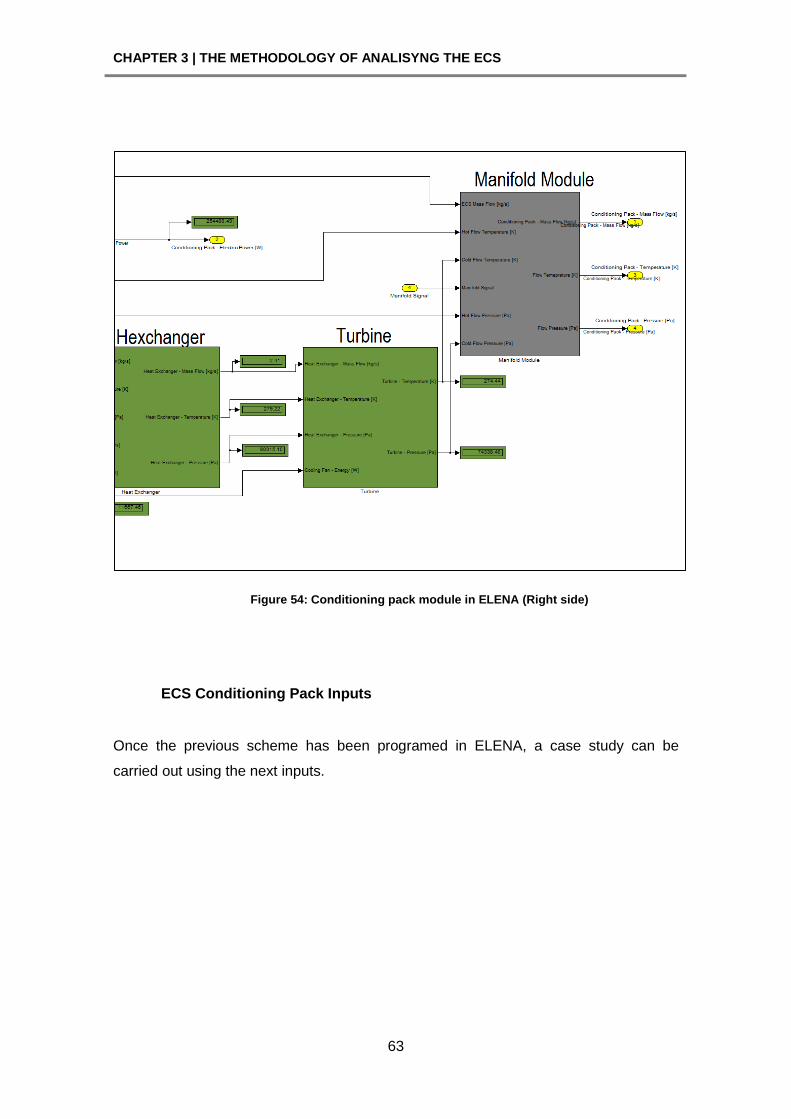
CHAPTER 3 | THE METHODOLOGY OF ANALISYNG THE ECS
63
Figure 54: Conditioning pack module in ELENA (Right side)
ECS Conditioning Pack Inputs
Once the previous scheme has been programed in ELENA, a case study can be
carried out using the next inputs.
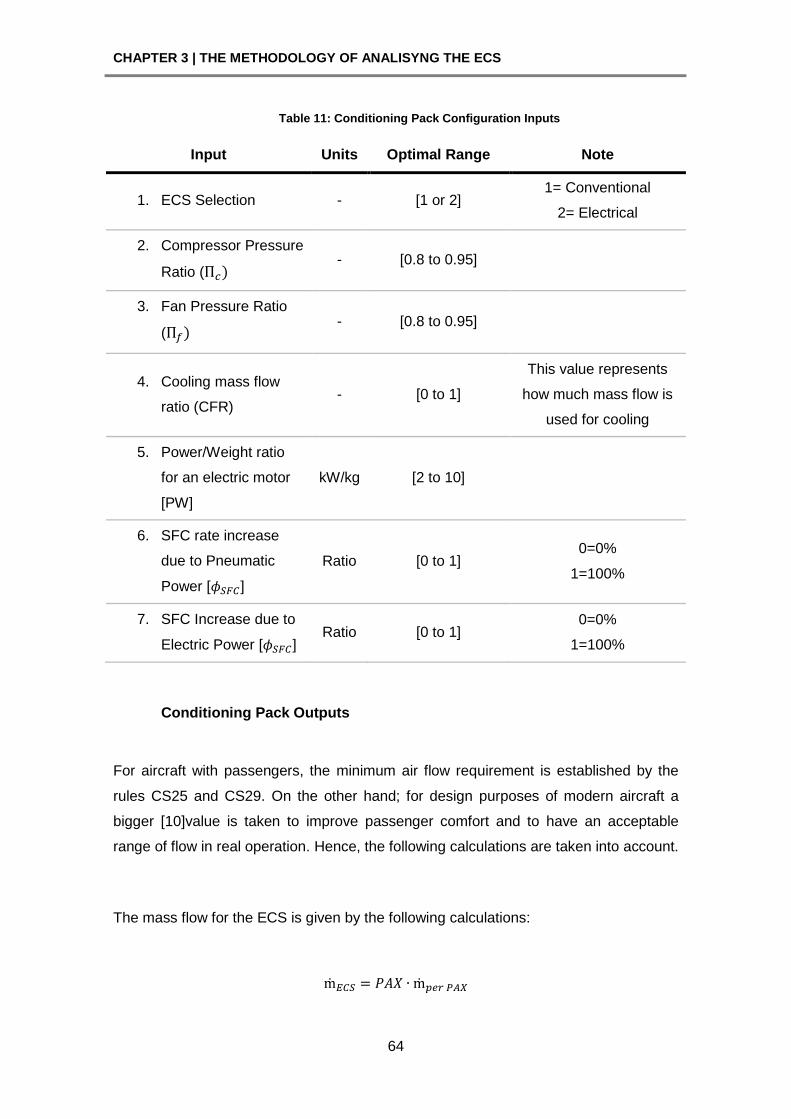
CHAPTER 3 | THE METHODOLOGY OF ANALISYNG THE ECS
64
Table 11: Conditioning Pack Configuration Inputs
Input Units Optimal Range Note
1. ECS Selection - [1 or 2] 1= Conventional
2= Electrical
2. Compressor Pressure
Ratio ( - [0.8 to 0.95]
3. Fan Pressure Ratio
( - [0.8 to 0.95]
4. Cooling mass flow
ratio (CFR) - [0 to 1]
This value represents
how much mass flow is
used for cooling
5. Power/Weight ratio
for an electric motor
[PW]
kW/kg [2 to 10]
6. SFC rate increase
due to Pneumatic
Power [ ]
Ratio [0 to 1] 0=0%
1=100%
7. SFC Increase due to
Electric Power [ ] Ratio [0 to 1]
0=0%
1=100%
Conditioning Pack Outputs
For aircraft with passengers, the minimum air flow requirement is established by the
rules CS25 and CS29. On the other hand; for design purposes of modern aircraft a
bigger [10]value is taken to improve passenger comfort and to have an acceptable
range of flow in real operation. Hence, the following calculations are taken into account.
The mass flow for the ECS is given by the following calculations:
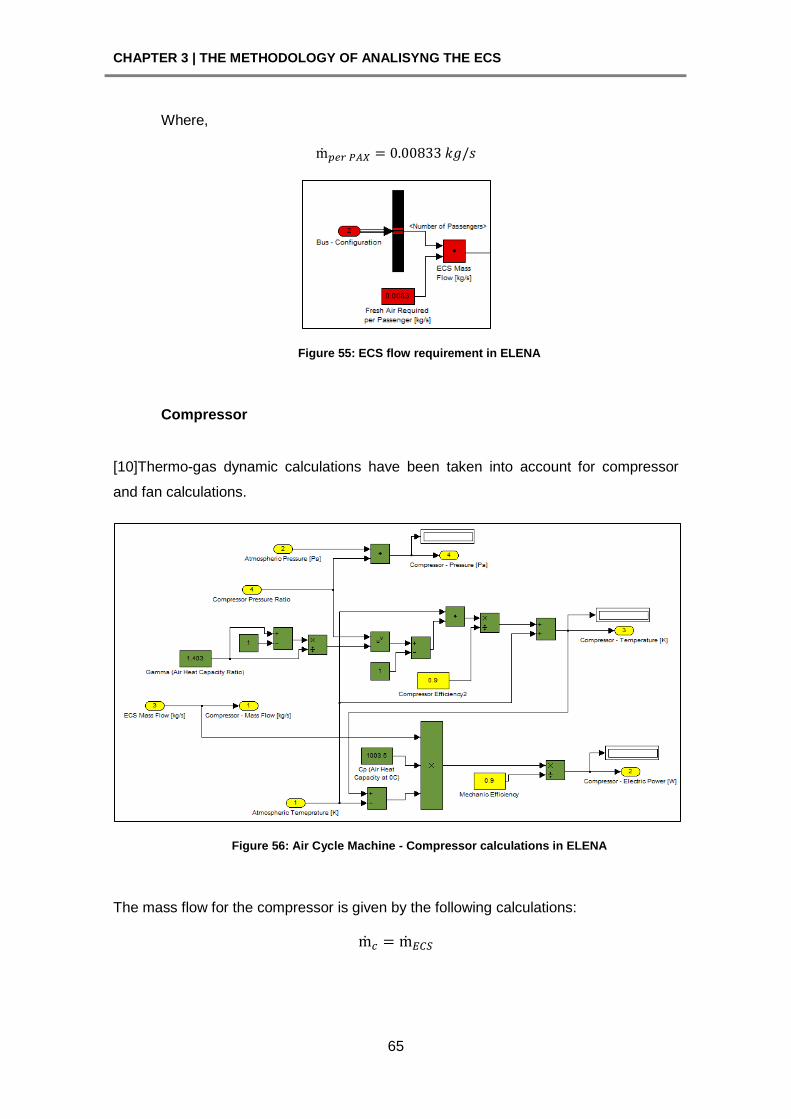
CHAPTER 3 | THE METHODOLOGY OF ANALISYNG THE ECS
65
Where,
Figure 55: ECS flow requirement in ELENA
Compressor
[10]Thermo-gas dynamic calculations have been taken into account for compressor
and fan calculations.
Figure 56: Air Cycle Machine - Compressor calculations in ELENA
The mass flow for the compressor is given by the following calculations:
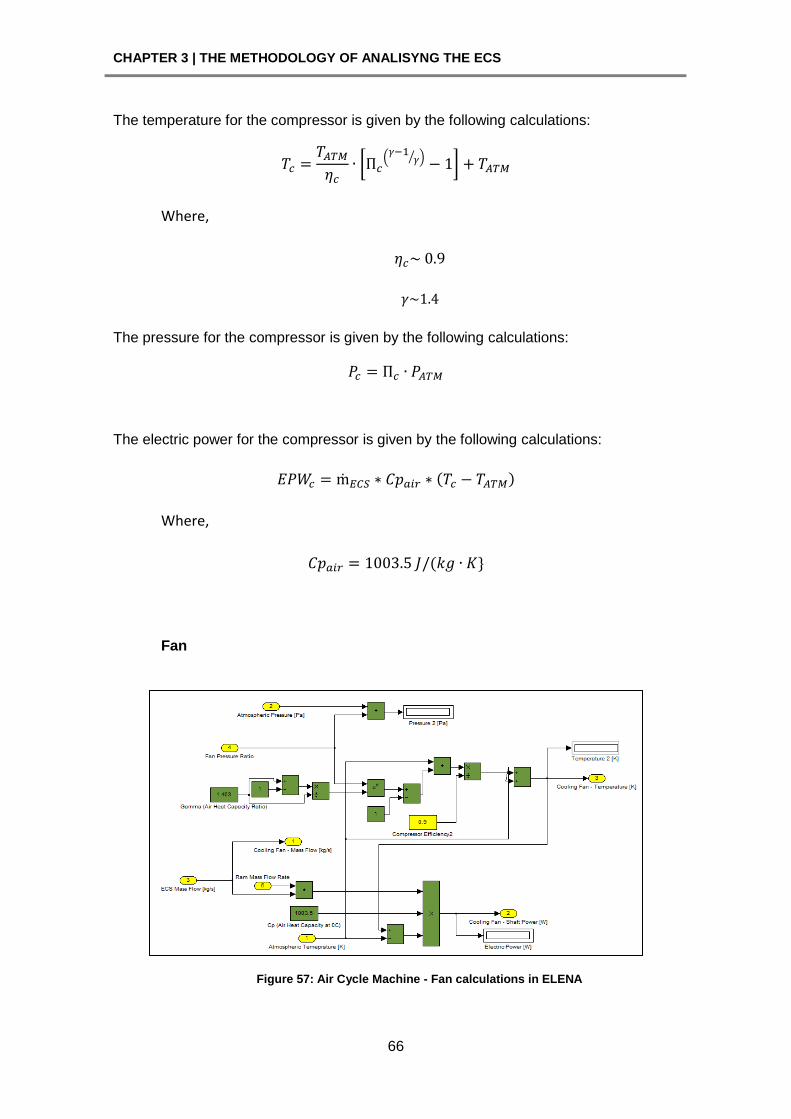
CHAPTER 3 | THE METHODOLOGY OF ANALISYNG THE ECS
66
The temperature for the compressor is given by the following calculations:
[ (
⁄ ) ]
Where,
The pressure for the compressor is given by the following calculations:
The electric power for the compressor is given by the following calculations:
Where,
Fan
Figure 57: Air Cycle Machine - Fan calculations in ELENA
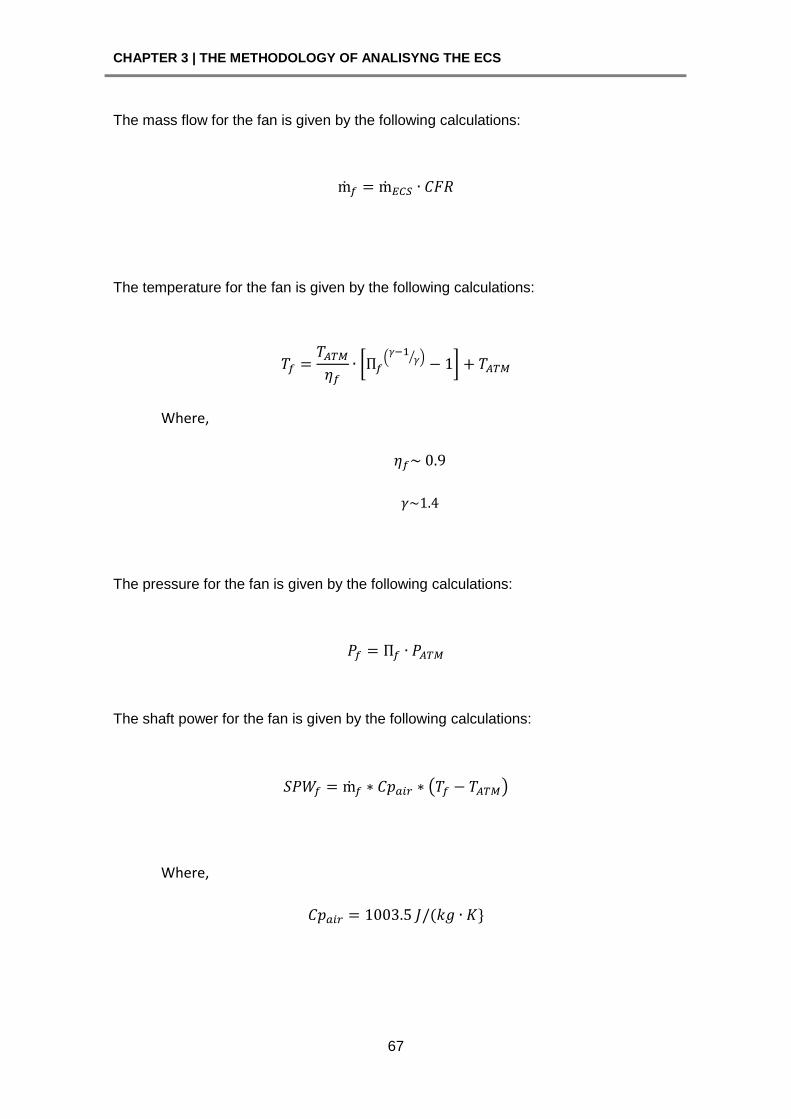
CHAPTER 3 | THE METHODOLOGY OF ANALISYNG THE ECS
67
The mass flow for the fan is given by the following calculations:
The temperature for the fan is given by the following calculations:
[ (
⁄ ) ]
Where,
The pressure for the fan is given by the following calculations:
The shaft power for the fan is given by the following calculations:
( )
Where,
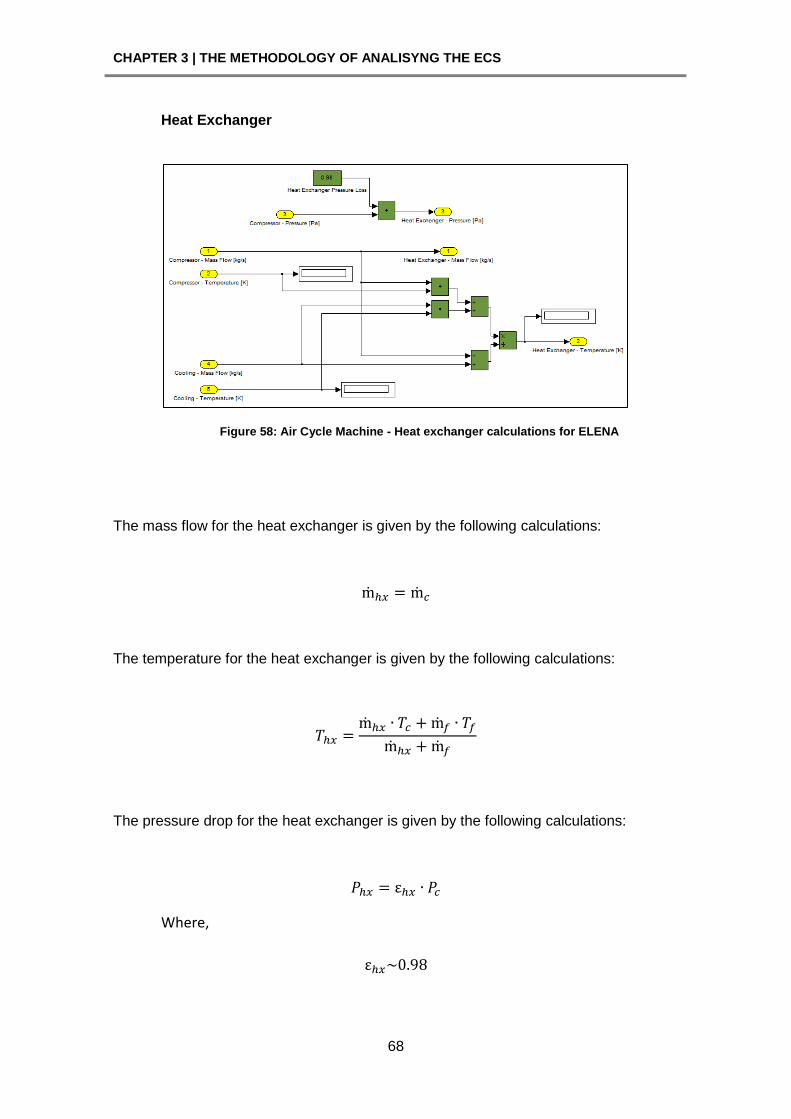
CHAPTER 3 | THE METHODOLOGY OF ANALISYNG THE ECS
68
Heat Exchanger
Figure 58: Air Cycle Machine - Heat exchanger calculations for ELENA
The mass flow for the heat exchanger is given by the following calculations:
The temperature for the heat exchanger is given by the following calculations:
The pressure drop for the heat exchanger is given by the following calculations:
Where,
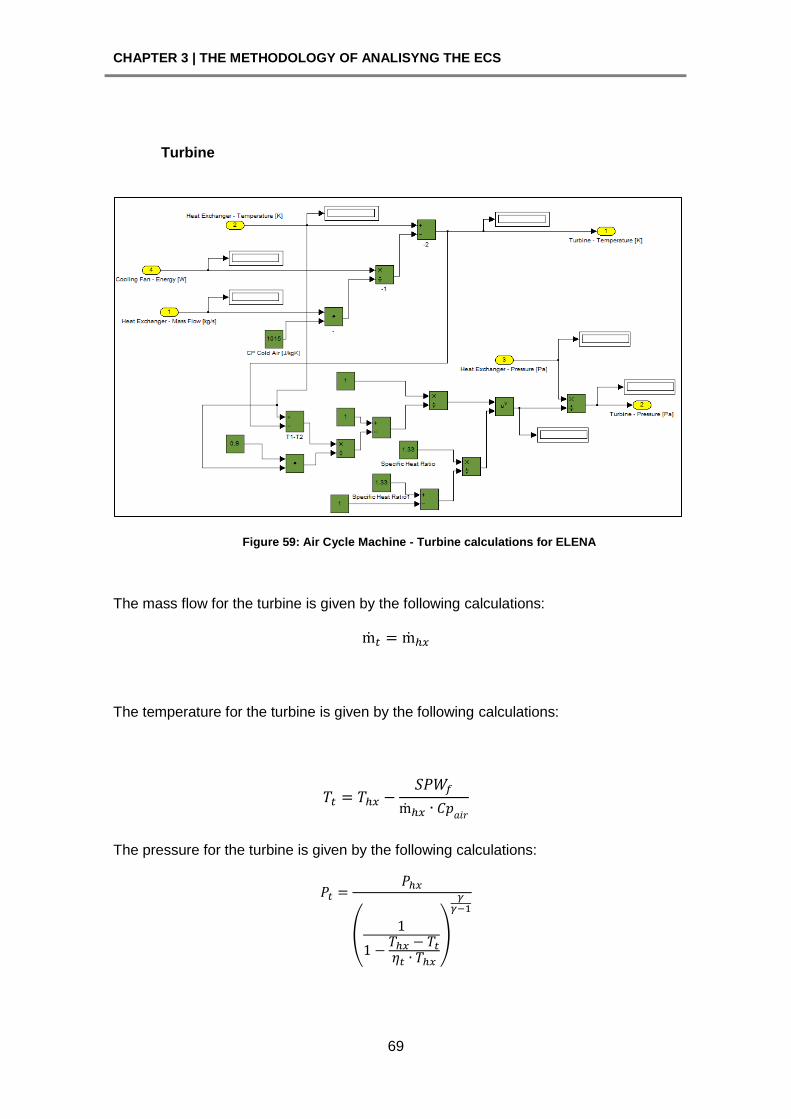
CHAPTER 3 | THE METHODOLOGY OF ANALISYNG THE ECS
69
Turbine
Figure 59: Air Cycle Machine - Turbine calculations for ELENA
The mass flow for the turbine is given by the following calculations:
The temperature for the turbine is given by the following calculations:
The pressure for the turbine is given by the following calculations:
(
)
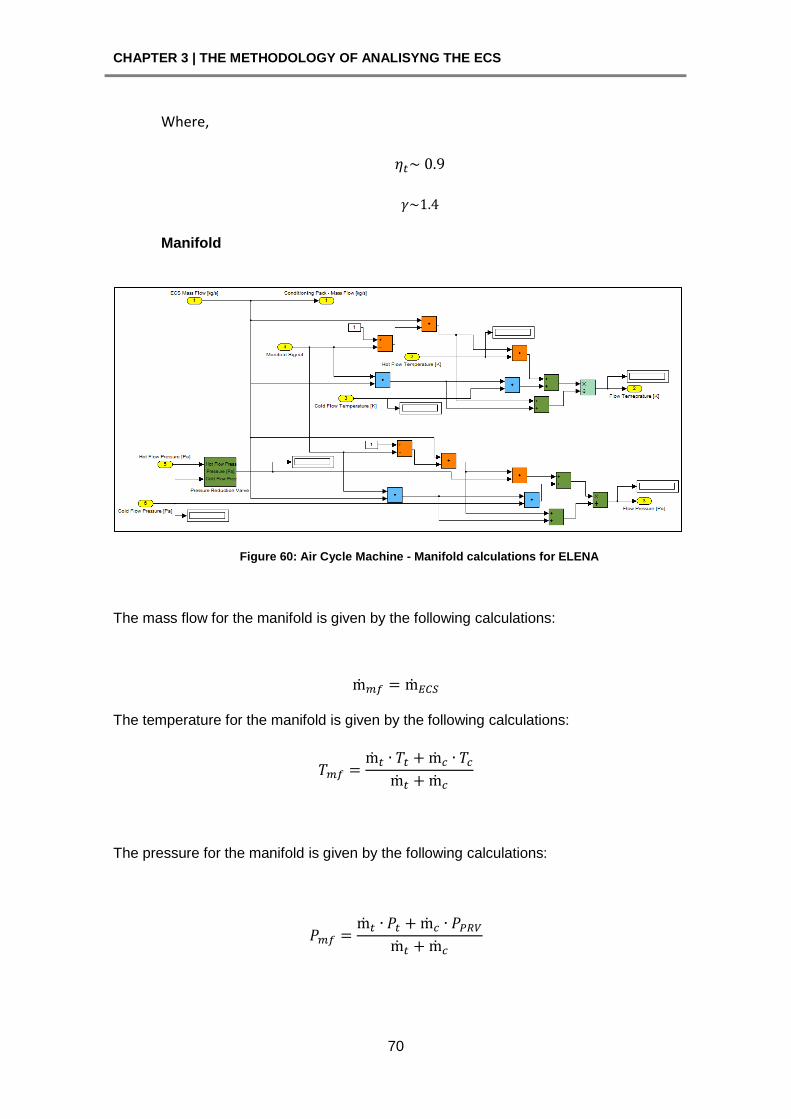
CHAPTER 3 | THE METHODOLOGY OF ANALISYNG THE ECS
70
Where,
Manifold
Figure 60: Air Cycle Machine - Manifold calculations for ELENA
The mass flow for the manifold is given by the following calculations:
The temperature for the manifold is given by the following calculations:
The pressure for the manifold is given by the following calculations:
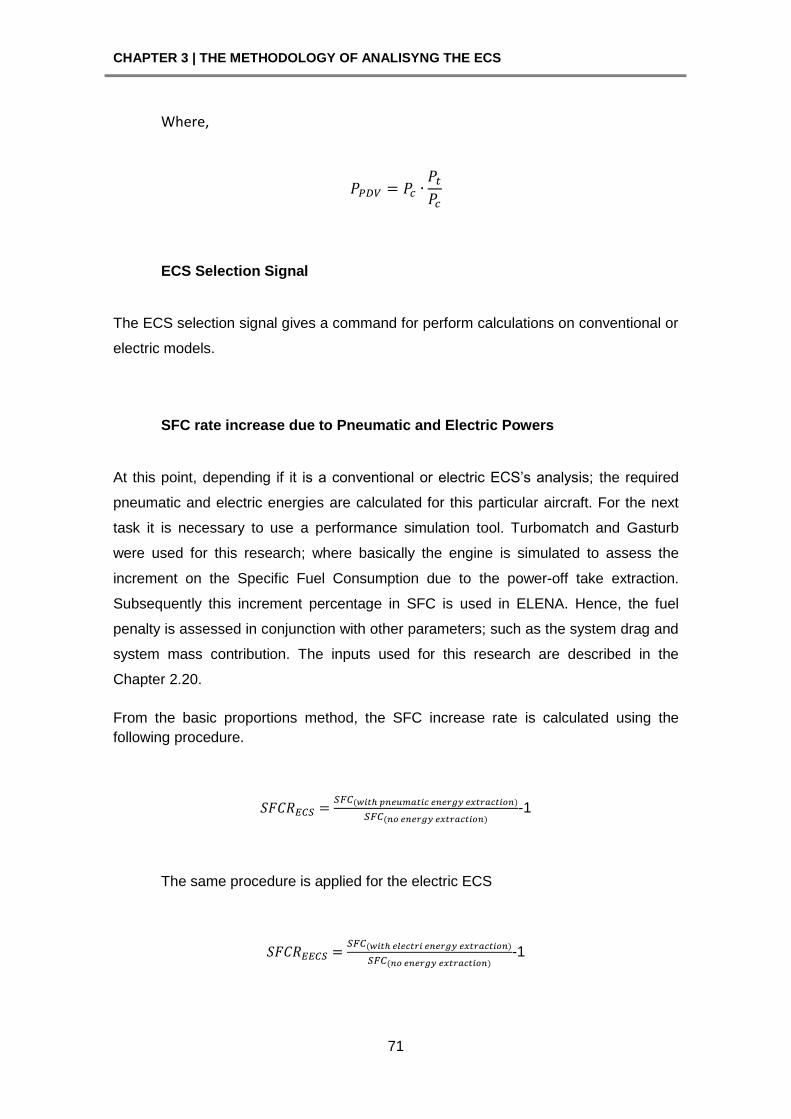
CHAPTER 3 | THE METHODOLOGY OF ANALISYNG THE ECS
71
Where,
ECS Selection Signal
The ECS selection signal gives a command for perform calculations on conventional or
electric models.
SFC rate increase due to Pneumatic and Electric Powers
At this point, depending if it is a conventional or electric ECS’s analysis; the required
pneumatic and electric energies are calculated for this particular aircraft. For the next
task it is necessary to use a performance simulation tool. Turbomatch and Gasturb
were used for this research; where basically the engine is simulated to assess the
increment on the Specific Fuel Consumption due to the power-off take extraction.
Subsequently this increment percentage in SFC is used in ELENA. Hence, the fuel
penalty is assessed in conjunction with other parameters; such as the system drag and
system mass contribution. The inputs used for this research are described in the
Chapter 2.20.
From the basic proportions method, the SFC increase rate is calculated using the
following procedure.
-1
The same procedure is applied for the electric ECS
-1
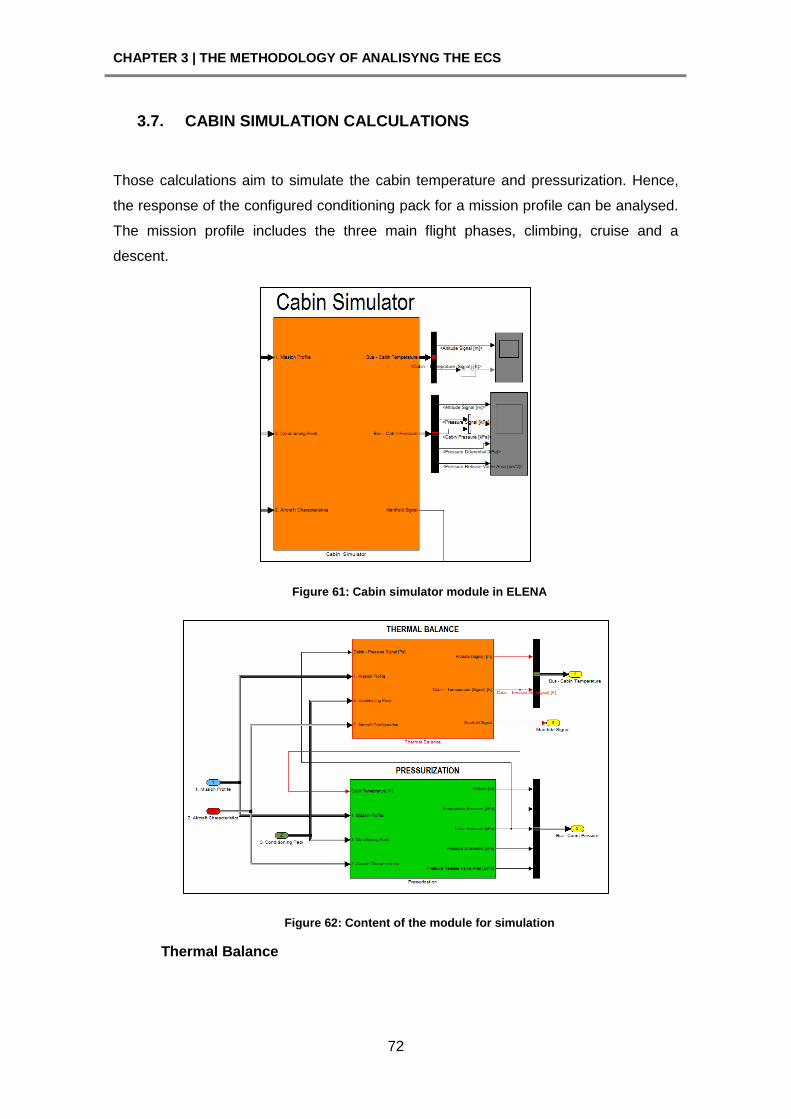
CHAPTER 3 | THE METHODOLOGY OF ANALISYNG THE ECS
72
3.7. CABIN SIMULATION CALCULATIONS
Those calculations aim to simulate the cabin temperature and pressurization. Hence,
the response of the configured conditioning pack for a mission profile can be analysed.
The mission profile includes the three main flight phases, climbing, cruise and a
descent.
Figure 61: Cabin simulator module in ELENA
Figure 62: Content of the module for simulation
Thermal Balance
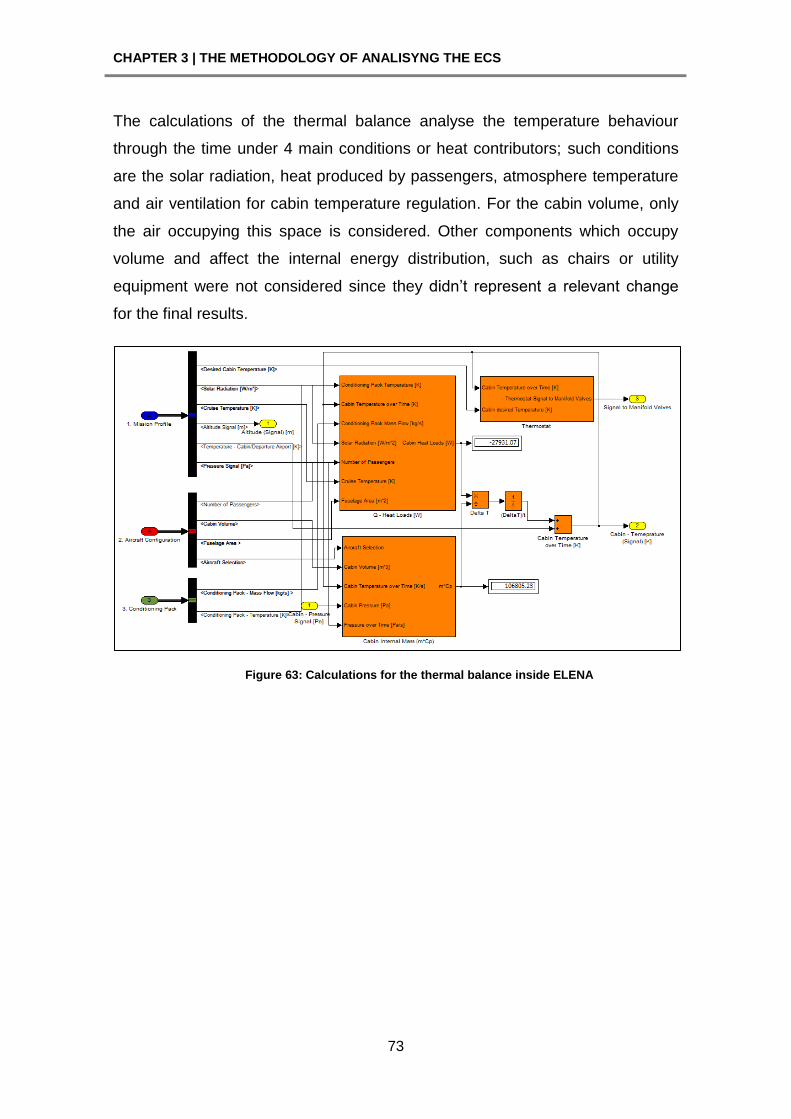
CHAPTER 3 | THE METHODOLOGY OF ANALISYNG THE ECS
73
The calculations of the thermal balance analyse the temperature behaviour
through the time under 4 main conditions or heat contributors; such conditions
are the solar radiation, heat produced by passengers, atmosphere temperature
and air ventilation for cabin temperature regulation. For the cabin volume, only
the air occupying this space is considered. Other components which occupy
volume and affect the internal energy distribution, such as chairs or utility
equipment were not considered since they didn’t represent a relevant change
for the final results.
Figure 63: Calculations for the thermal balance inside ELENA
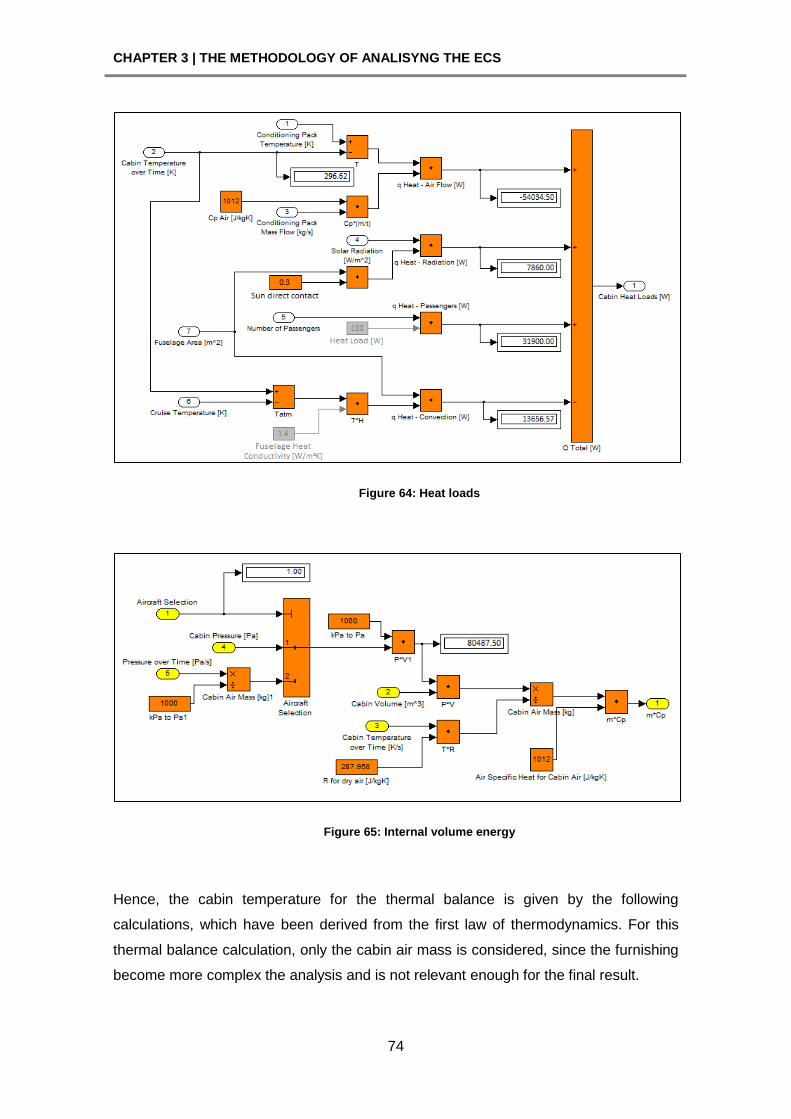
CHAPTER 3 | THE METHODOLOGY OF ANALISYNG THE ECS
74
Figure 64: Heat loads
Figure 65: Internal volume energy
Hence, the cabin temperature for the thermal balance is given by the following
calculations, which have been derived from the first law of thermodynamics. For this
thermal balance calculation, only the cabin air mass is considered, since the furnishing
become more complex the analysis and is not relevant enough for the final result.
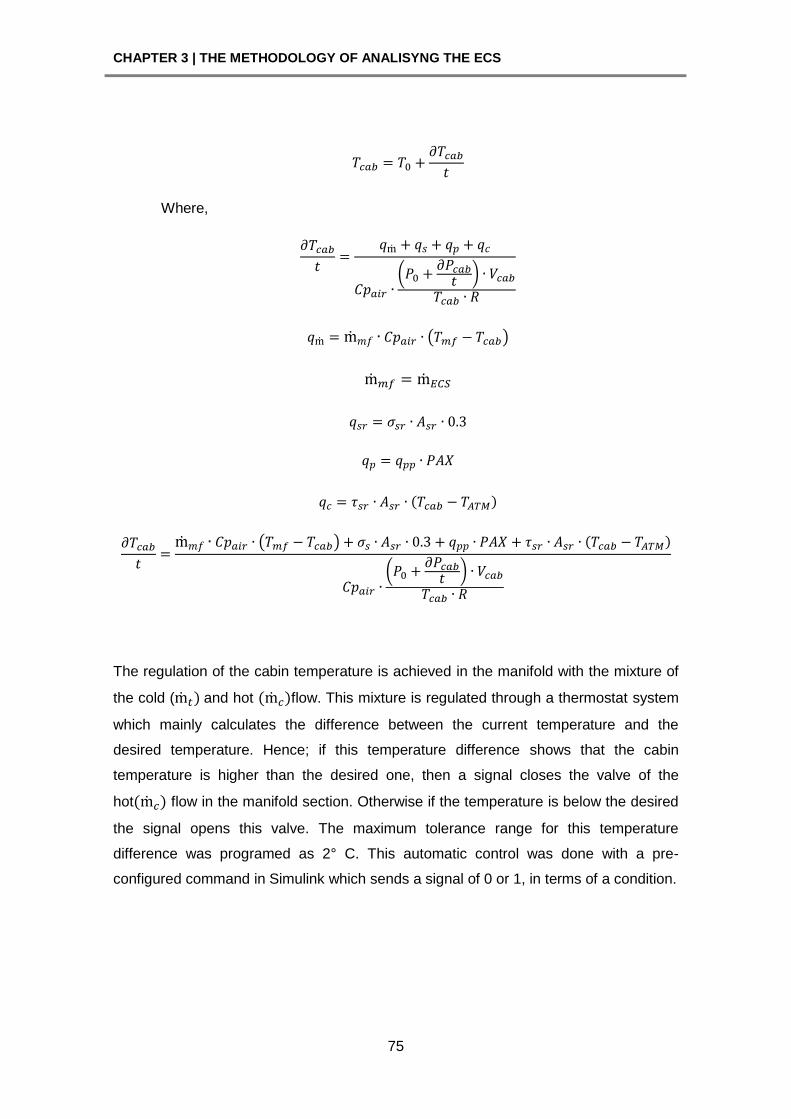
CHAPTER 3 | THE METHODOLOGY OF ANALISYNG THE ECS
75
Where,
(
*
( )
( )
(
*
The regulation of the cabin temperature is achieved in the manifold with the mixture of
the cold ( and hot flow. This mixture is regulated through a thermostat system
which mainly calculates the difference between the current temperature and the
desired temperature. Hence; if this temperature difference shows that the cabin
temperature is higher than the desired one, then a signal closes the valve of the
hot flow in the manifold section. Otherwise if the temperature is below the desired
the signal opens this valve. The maximum tolerance range for this temperature
difference was programed as 2° C. This automatic control was done with a pre-
configured command in Simulink which sends a signal of 0 or 1, in terms of a condition.
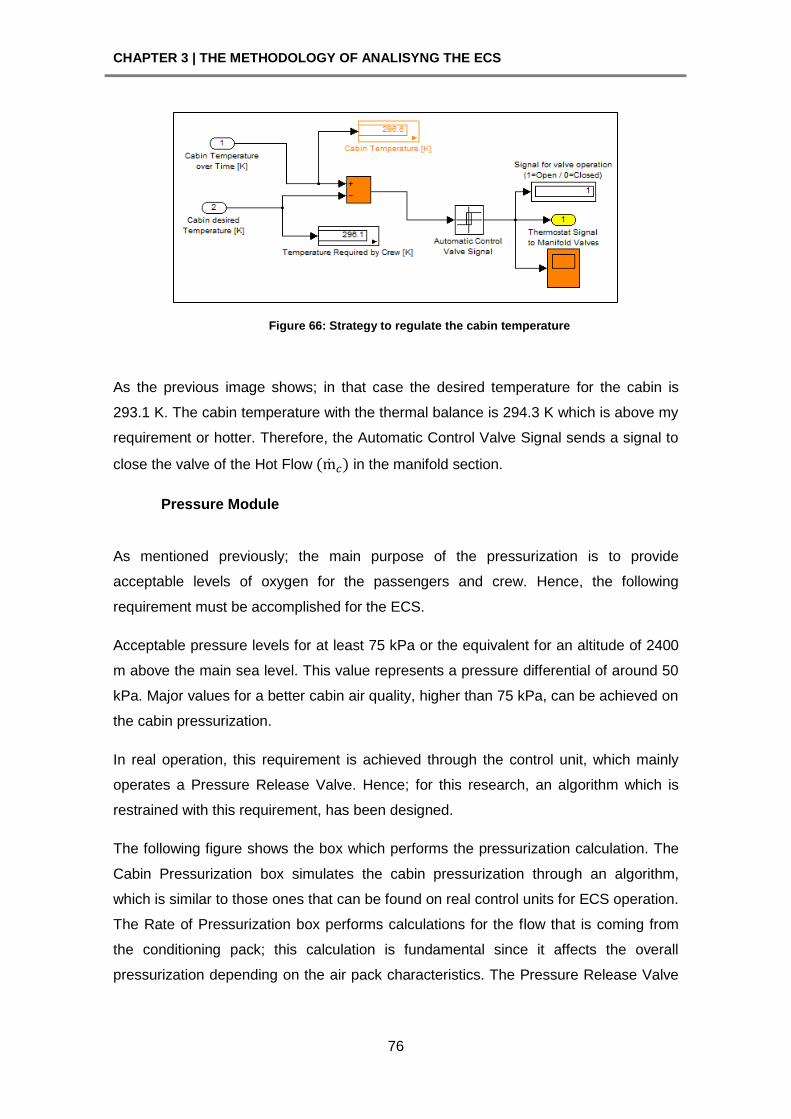
CHAPTER 3 | THE METHODOLOGY OF ANALISYNG THE ECS
76
Figure 66: Strategy to regulate the cabin temperature
As the previous image shows; in that case the desired temperature for the cabin is
293.1 K. The cabin temperature with the thermal balance is 294.3 K which is above my
requirement or hotter. Therefore, the Automatic Control Valve Signal sends a signal to
close the valve of the Hot Flow in the manifold section.
Pressure Module
As mentioned previously; the main purpose of the pressurization is to provide
acceptable levels of oxygen for the passengers and crew. Hence, the following
requirement must be accomplished for the ECS.
Acceptable pressure levels for at least 75 kPa or the equivalent for an altitude of 2400
m above the main sea level. This value represents a pressure differential of around 50
kPa. Major values for a better cabin air quality, higher than 75 kPa, can be achieved on
the cabin pressurization.
In real operation, this requirement is achieved through the control unit, which mainly
operates a Pressure Release Valve. Hence; for this research, an algorithm which is
restrained with this requirement, has been designed.
The following figure shows the box which performs the pressurization calculation. The
Cabin Pressurization box simulates the cabin pressurization through an algorithm,
which is similar to those ones that can be found on real control units for ECS operation.
The Rate of Pressurization box performs calculations for the flow that is coming from
the conditioning pack; this calculation is fundamental since it affects the overall
pressurization depending on the air pack characteristics. The Pressure Release Valve
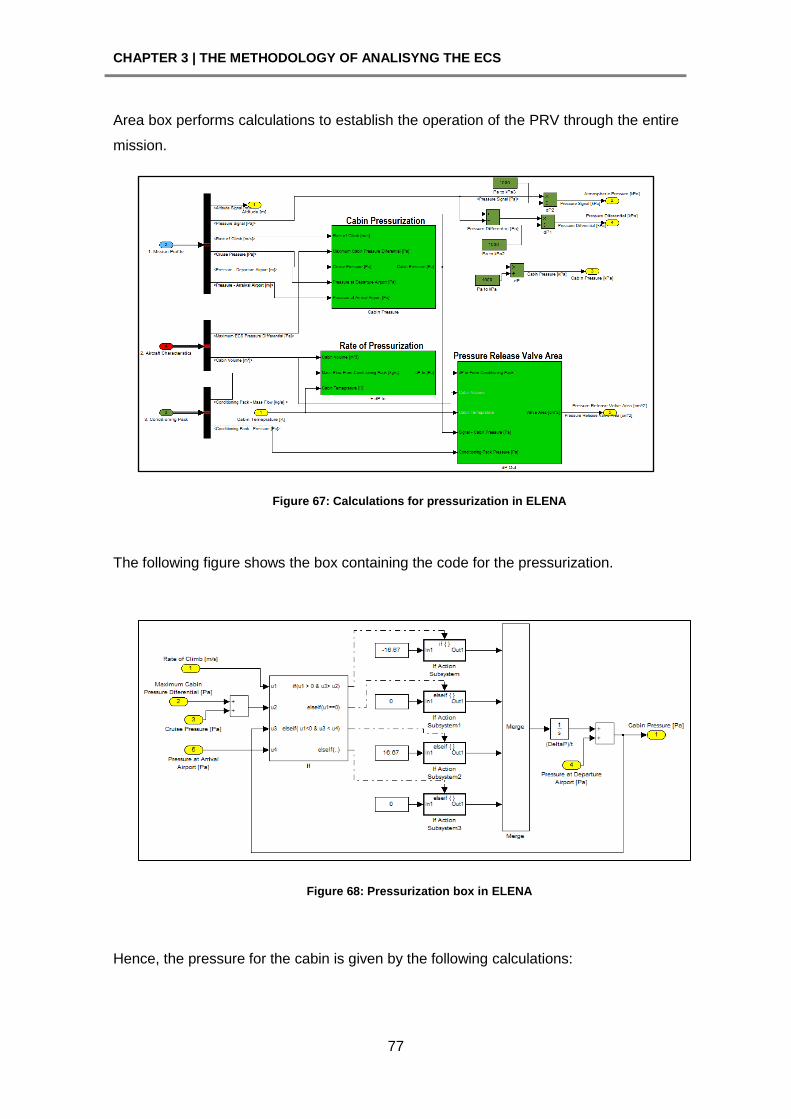
CHAPTER 3 | THE METHODOLOGY OF ANALISYNG THE ECS
77
Area box performs calculations to establish the operation of the PRV through the entire
mission.
Figure 67: Calculations for pressurization in ELENA
The following figure shows the box containing the code for the pressurization.
Figure 68: Pressurization box in ELENA
Hence, the pressure for the cabin is given by the following calculations:
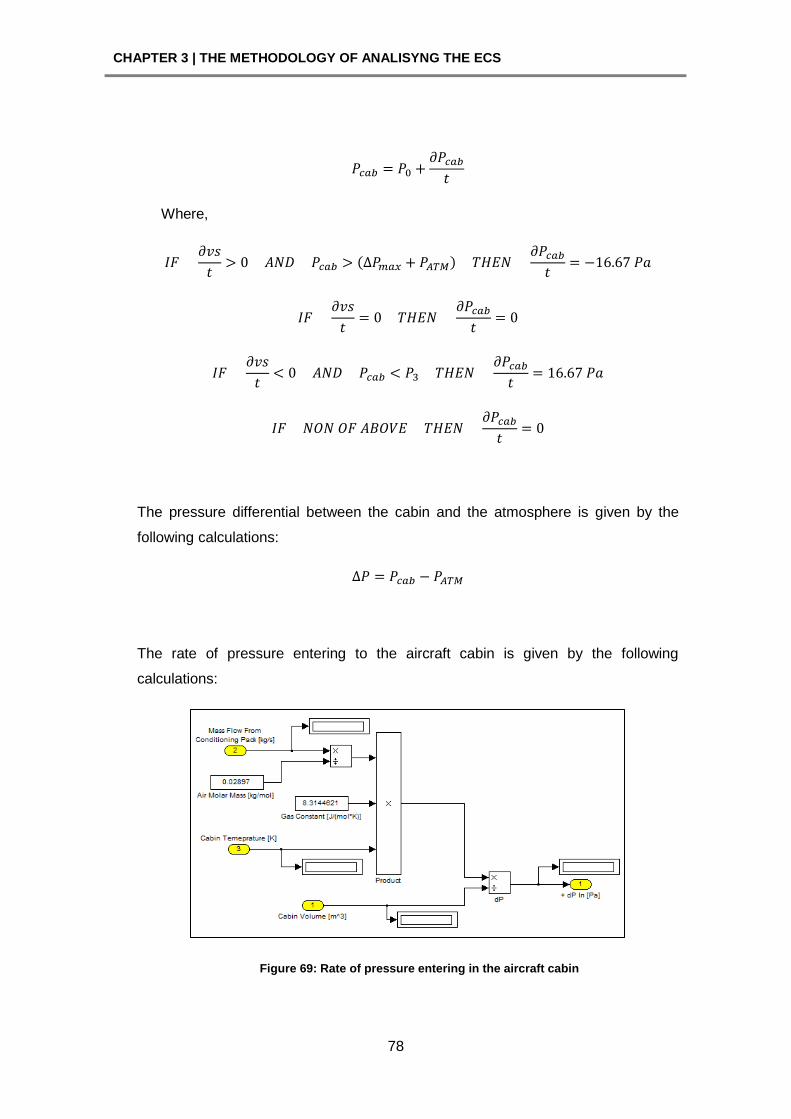
CHAPTER 3 | THE METHODOLOGY OF ANALISYNG THE ECS
78
Where,
The pressure differential between the cabin and the atmosphere is given by the
following calculations:
The rate of pressure entering to the aircraft cabin is given by the following
calculations:
Figure 69: Rate of pressure entering in the aircraft cabin
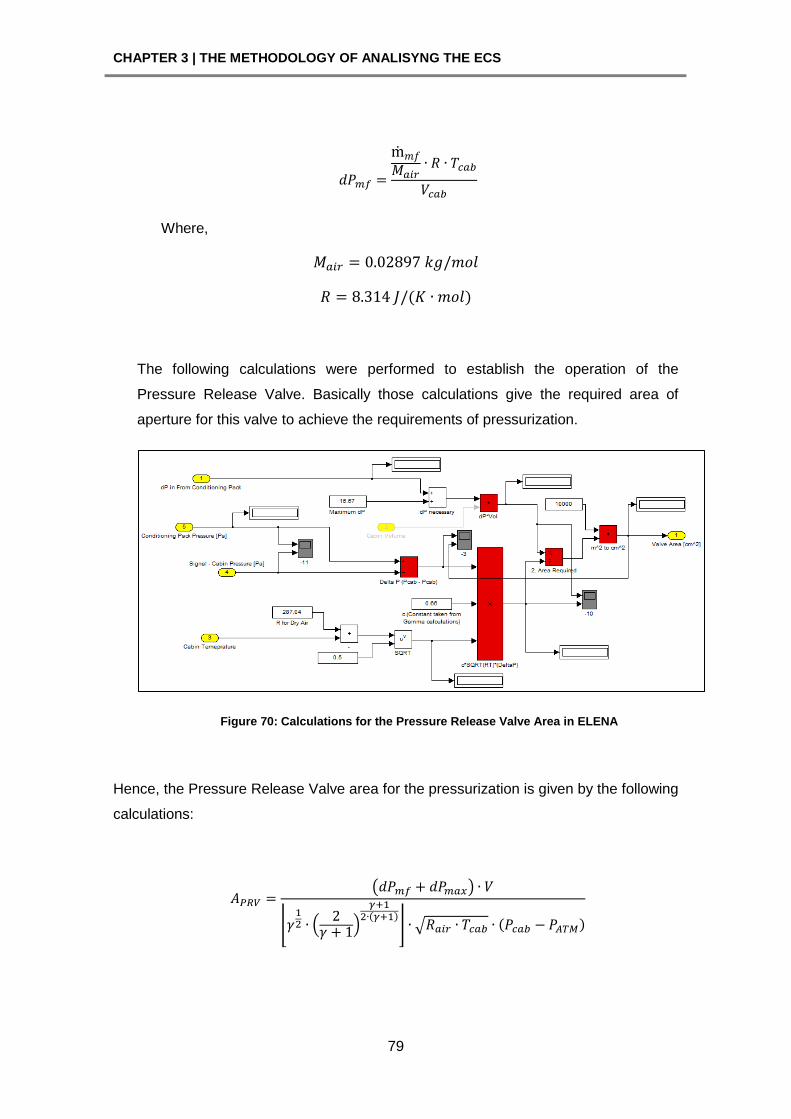
CHAPTER 3 | THE METHODOLOGY OF ANALISYNG THE ECS
79
Where,
The following calculations were performed to establish the operation of the
Pressure Release Valve. Basically those calculations give the required area of
aperture for this valve to achieve the requirements of pressurization.
Figure 70: Calculations for the Pressure Release Valve Area in ELENA
Hence, the Pressure Release Valve area for the pressurization is given by the following
calculations:
( )
⌊ (
)
⌋ √
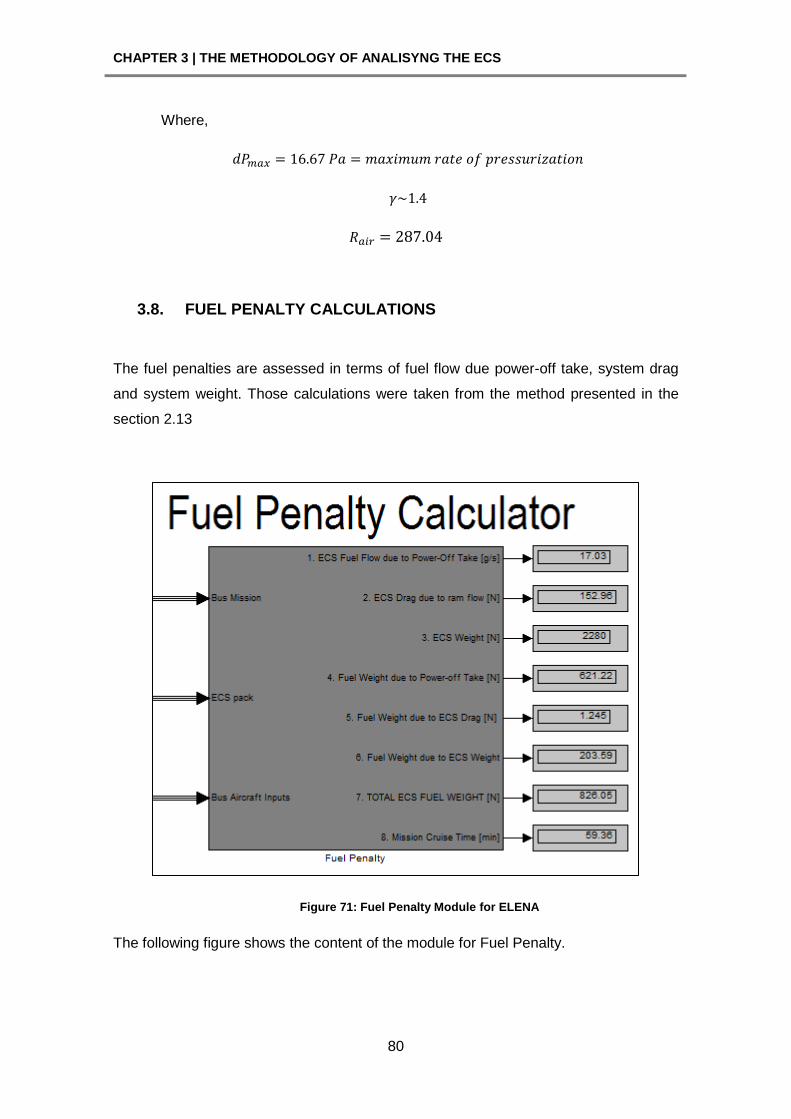
CHAPTER 3 | THE METHODOLOGY OF ANALISYNG THE ECS
80
Where,
3.8. FUEL PENALTY CALCULATIONS
The fuel penalties are assessed in terms of fuel flow due power-off take, system drag
and system weight. Those calculations were taken from the method presented in the
section 2.13
Figure 71: Fuel Penalty Module for ELENA
The following figure shows the content of the module for Fuel Penalty.
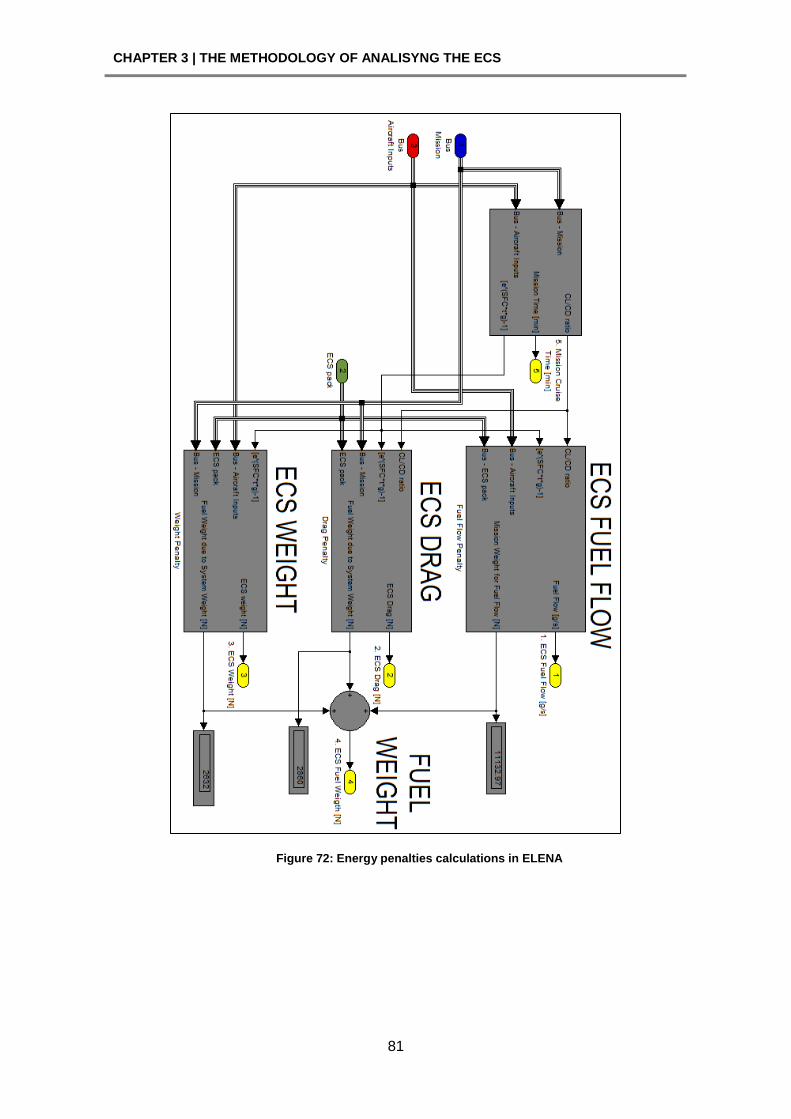
CHAPTER 3 | THE METHODOLOGY OF ANALISYNG THE ECS
81
Figure 72: Energy penalties calculations in ELENA
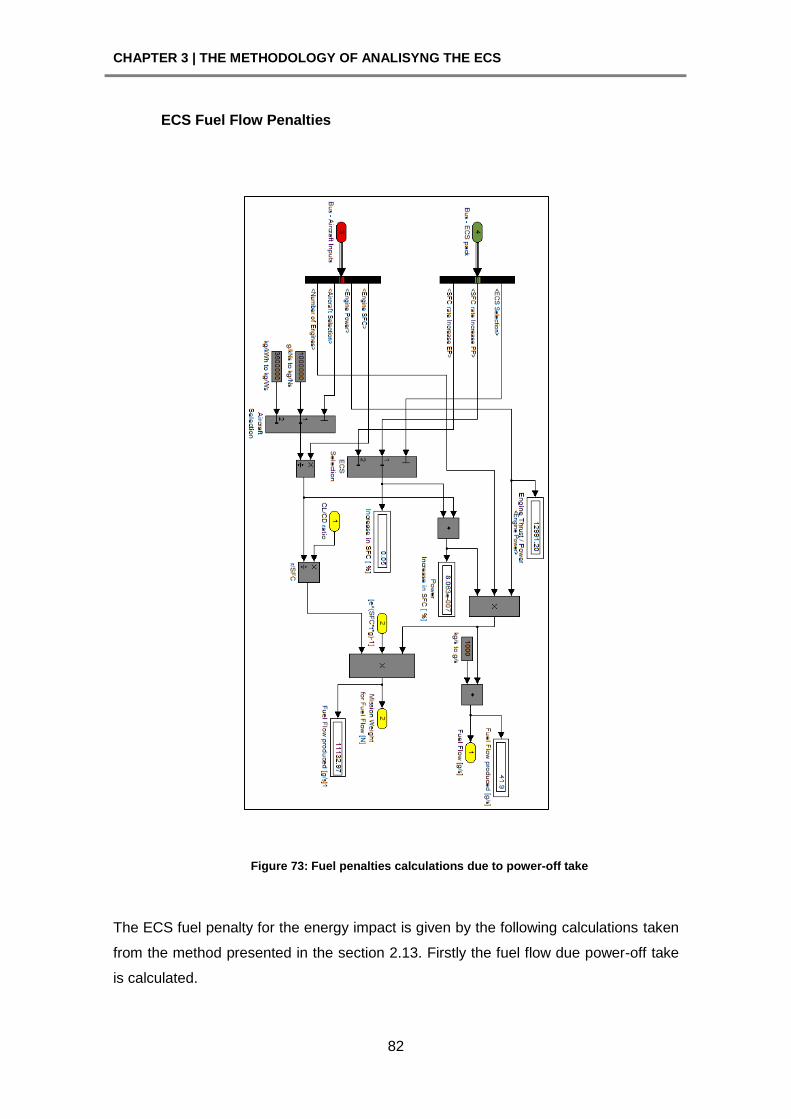
CHAPTER 3 | THE METHODOLOGY OF ANALISYNG THE ECS
82
ECS Fuel Flow Penalties
Figure 73: Fuel penalties calculations due to power-off take
The ECS fuel penalty for the energy impact is given by the following calculations taken
from the method presented in the section 2.13. Firstly the fuel flow due power-off take
is calculated.
CHAPTER 3 | THE METHODOLOGY OF ANALISYNG THE ECS
83
Where,
The fuel increment rate is taken form the analysis in the Engine Performance
Simulation Tools. Now the weight due power-off take is calculated.
Hence
( *
Where,
ECS Drag Penalties
Continuing with the procedure, the ECS drag penalties are calculated through the
following interface in ELENA.
CHAPTER 3 | THE METHODOLOGY OF ANALISYNG THE ECS
84
Figure 74: Aircraft performance calculations
Where the ECS drag penalty is derived with the following equation:
Where,
The cooling flow ratio defines the amount of mass flow to be used for cooling the main
mass flow. Hence, if the required ECS mass flow is 1.8 kg/s and the CRF is 0.5 then
the flow required for cooling will be 0.9 kg/s.
Now the weight due the drag generated by the system is derived with the following
equation.
( *
CHAPTER 3 | THE METHODOLOGY OF ANALISYNG THE ECS
85
ECS Weight Penalties
Since the electric ECS has further components, a study has been perform to analyse
how those extra components would affect the electric ECS weight in comparison with
the conventional ECS. Hence, the following table was developed.
Table 12: Difference in components for the electric and conventional ECS's
Component Conventional
ECS Electric
ECS Note
Compressor for the ram air
Is estimated, based in the mass of a titanium disc with the area required to ram the required
cabin air flow.
Electric motor Is estimated though the power to weight ratio of an electric motor
capable to supply 120 kW
Wiring to run the electric motor
Offset by the pipelines of the
conventional ECS
Engine electric generator
Is estimated using the same method for the electric motor
Piping from the engine
Offset by the extra wiring of the
electric ECS
Hence, from the previous study the mass penalty produced by the electric ECS is
calculated using the procedure for conventional ECS plus the addition of the following
weights; motor, engine electric generator impact and compressor. The weight of the
extra wiring that comes from the engine to supply electric power to the ECS is offset by
elimination of pipelines that, in the same way, would come from the engine to provide
pneumatic power to the ECS conditioning packs.
Hence, the calculations inside ELENA have been programed in the following way.
CHAPTER 3 | THE METHODOLOGY OF ANALISYNG THE ECS
86
Figure 75: System weight penalty in ELENA
CHAPTER 3 | THE METHODOLOGY OF ANALISYNG THE ECS
87
The conventional ECS weight for the mass penalty is given by the following
calculations:
Where,
The electric ECS mass for the mass penalty is given by the following calculations. To
calculate the mass contribution of the electric motors, a [19]power-to-weight ratio term
has been used. Following the requirements of the electric ECS electric motors and in
reference to the electric motor Hi-Pa Drive HPD40, which can generate up to 120 kW,
this value for power-to-weight is considered as ―4.8 kW/kg‖. This value is multiplied by
2 since represents the mass of both, the electric motor and the extra mass for the
engine electric generator.
( )
Where,
( *
ECS Total Fuel Weight for the Mission
In conclusion; for the total weight penalty due the impact on the system power-off take,
system grad and its own weight, the following equation is used.
∑
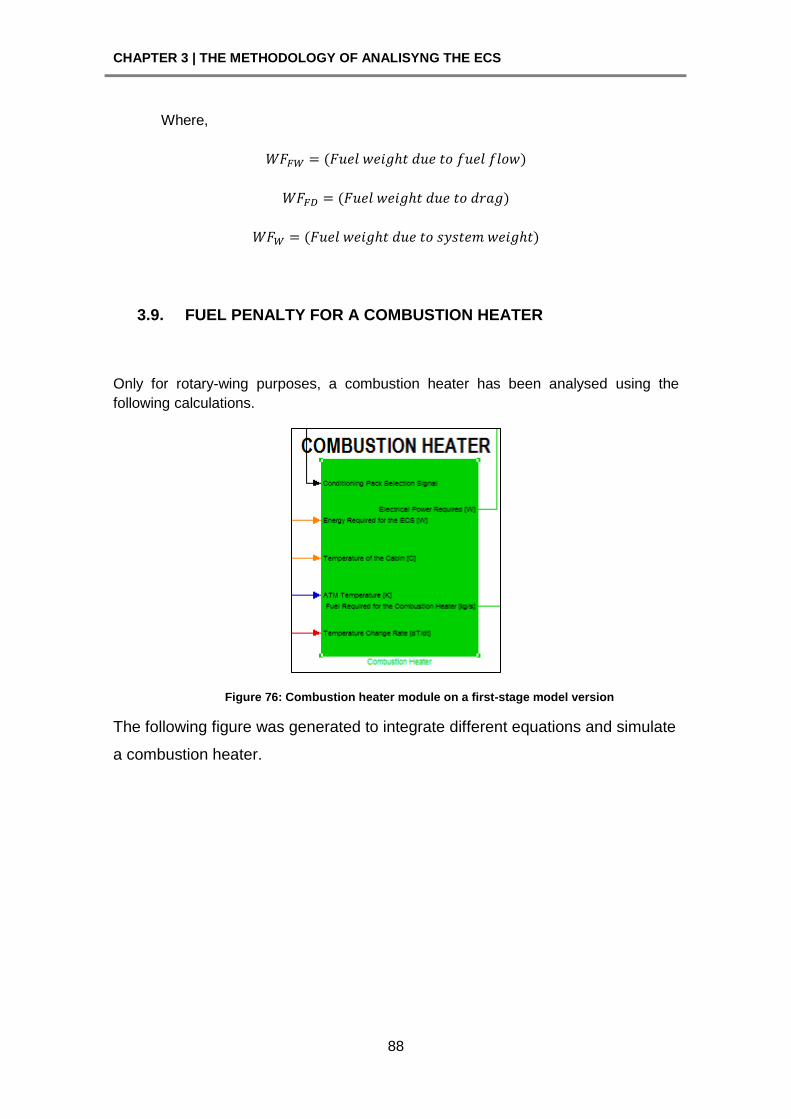
CHAPTER 3 | THE METHODOLOGY OF ANALISYNG THE ECS
88
Where,
3.9. FUEL PENALTY FOR A COMBUSTION HEATER
Only for rotary-wing purposes, a combustion heater has been analysed using the
following calculations.
Figure 76: Combustion heater module on a first-stage model version
The following figure was generated to integrate different equations and simulate
a combustion heater.
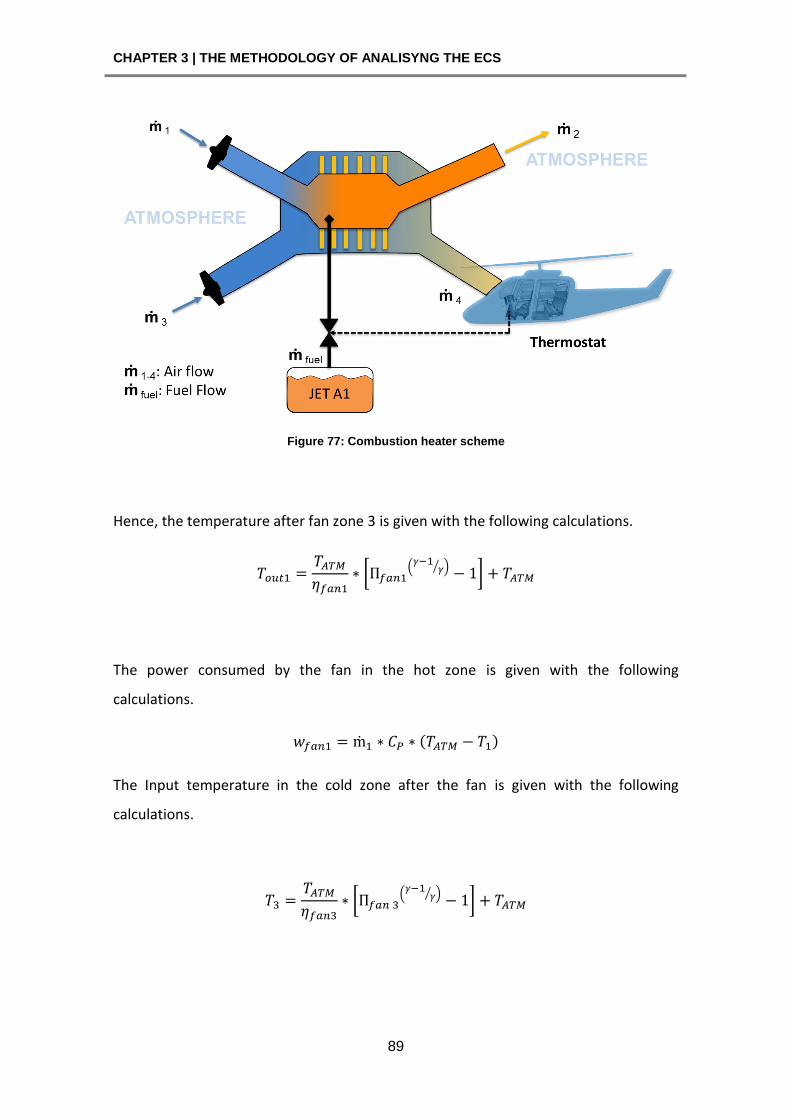
CHAPTER 3 | THE METHODOLOGY OF ANALISYNG THE ECS
89
Figure 77: Combustion heater scheme
Hence, the temperature after fan zone 3 is given with the following calculations.
[ (
⁄ ) ]
The power consumed by the fan in the hot zone is given with the following
calculations.
The Input temperature in the cold zone after the fan is given with the following
calculations.
[ (
⁄ ) ]
CHAPTER 3 | THE METHODOLOGY OF ANALISYNG THE ECS
90
The power consumed by the fan in the cold zone is given with the following
calculations.
The Fuel Air Ratio required for the combustion process is given with the following
calculations.
The Fuel flow for the combustion process is given with the following calculations.
The output temperature in the hot zone after the combustion is given with the
following calculations.
1
The output temperature after the heat transfer process is given with the following
calculations. This temperature is going into the cabin and is given with the following
calculations.
Where,
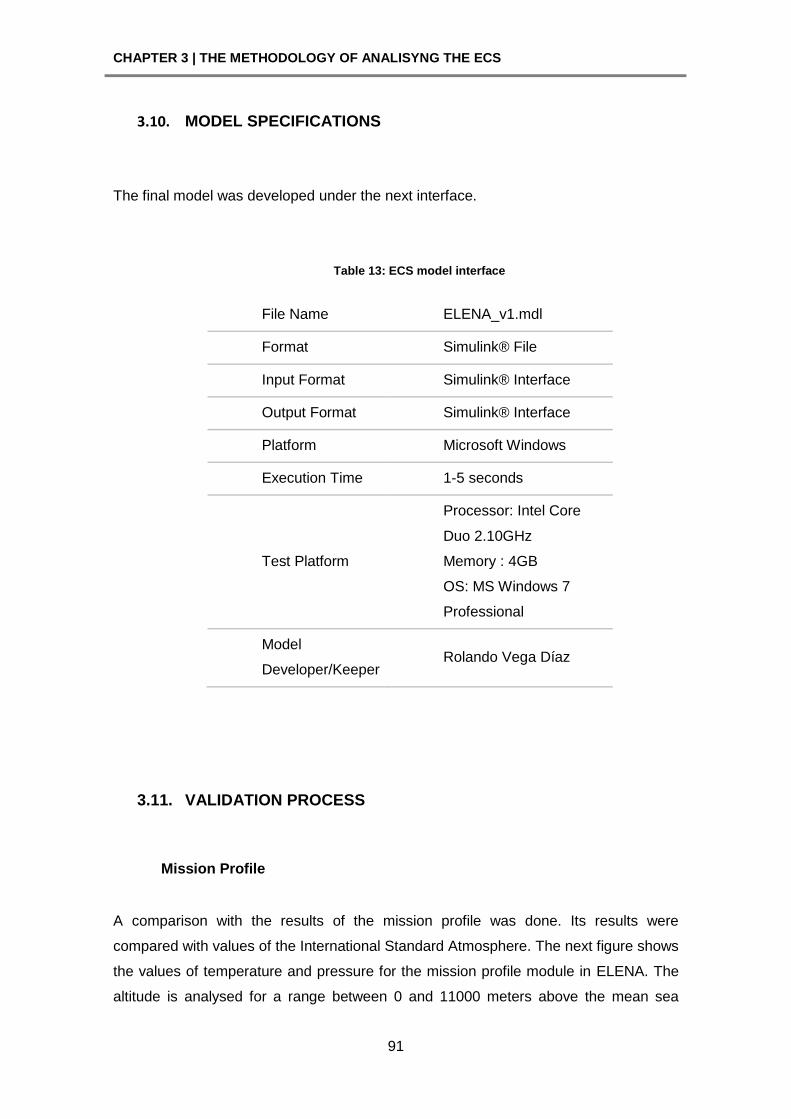
CHAPTER 3 | THE METHODOLOGY OF ANALISYNG THE ECS
91
3.10. MODEL SPECIFICATIONS
The final model was developed under the next interface.
Table 13: ECS model interface
File Name ELENA_v1.mdl
Format Simulink® File
Input Format Simulink® Interface
Output Format Simulink® Interface
Platform Microsoft Windows
Execution Time 1-5 seconds
Test Platform
Processor: Intel Core
Duo 2.10GHz
Memory : 4GB
OS: MS Windows 7
Professional
Model
Developer/Keeper Rolando Vega Díaz
3.11. VALIDATION PROCESS
Mission Profile
A comparison with the results of the mission profile was done. Its results were
compared with values of the International Standard Atmosphere. The next figure shows
the values of temperature and pressure for the mission profile module in ELENA. The
altitude is analysed for a range between 0 and 11000 meters above the mean sea
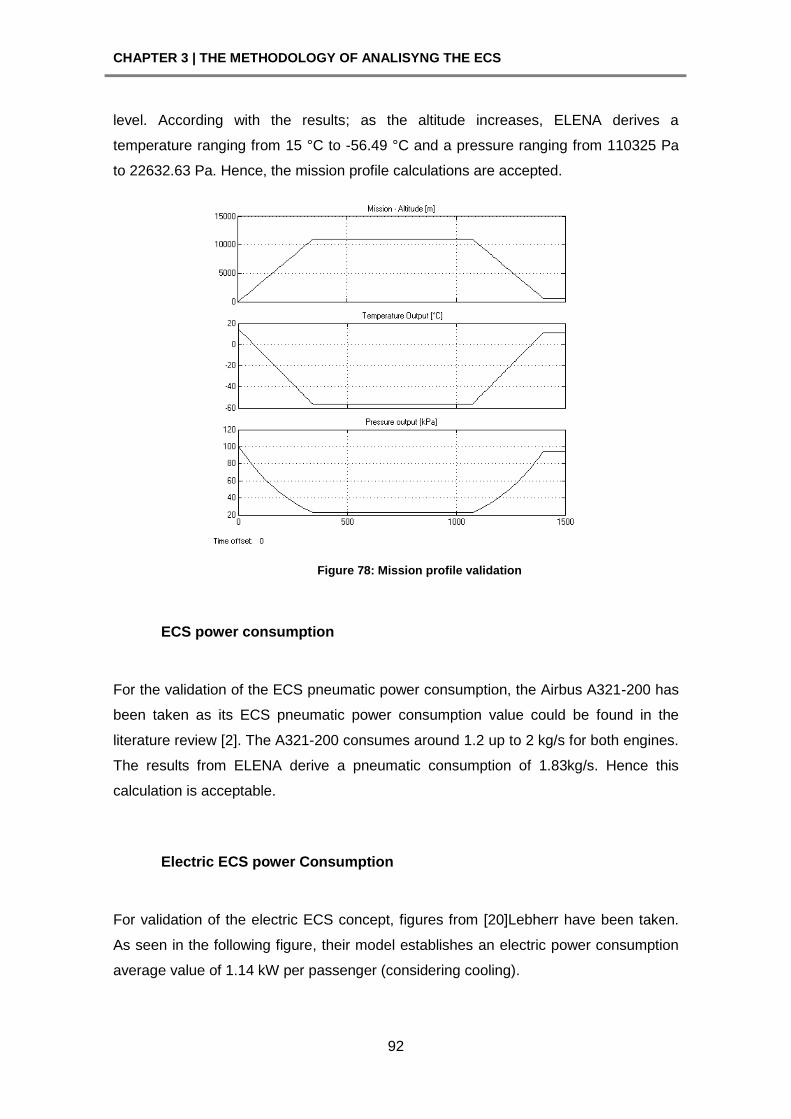
CHAPTER 3 | THE METHODOLOGY OF ANALISYNG THE ECS
92
level. According with the results; as the altitude increases, ELENA derives a
temperature ranging from 15 °C to -56.49 °C and a pressure ranging from 110325 Pa
to 22632.63 Pa. Hence, the mission profile calculations are accepted.
Figure 78: Mission profile validation
ECS power consumption
For the validation of the ECS pneumatic power consumption, the Airbus A321-200 has
been taken as its ECS pneumatic power consumption value could be found in the
literature review [2]. The A321-200 consumes around 1.2 up to 2 kg/s for both engines.
The results from ELENA derive a pneumatic consumption of 1.83kg/s. Hence this
calculation is acceptable.
Electric ECS power Consumption
For validation of the electric ECS concept, figures from [20]Lebherr have been taken.
As seen in the following figure, their model establishes an electric power consumption
average value of 1.14 kW per passenger (considering cooling).
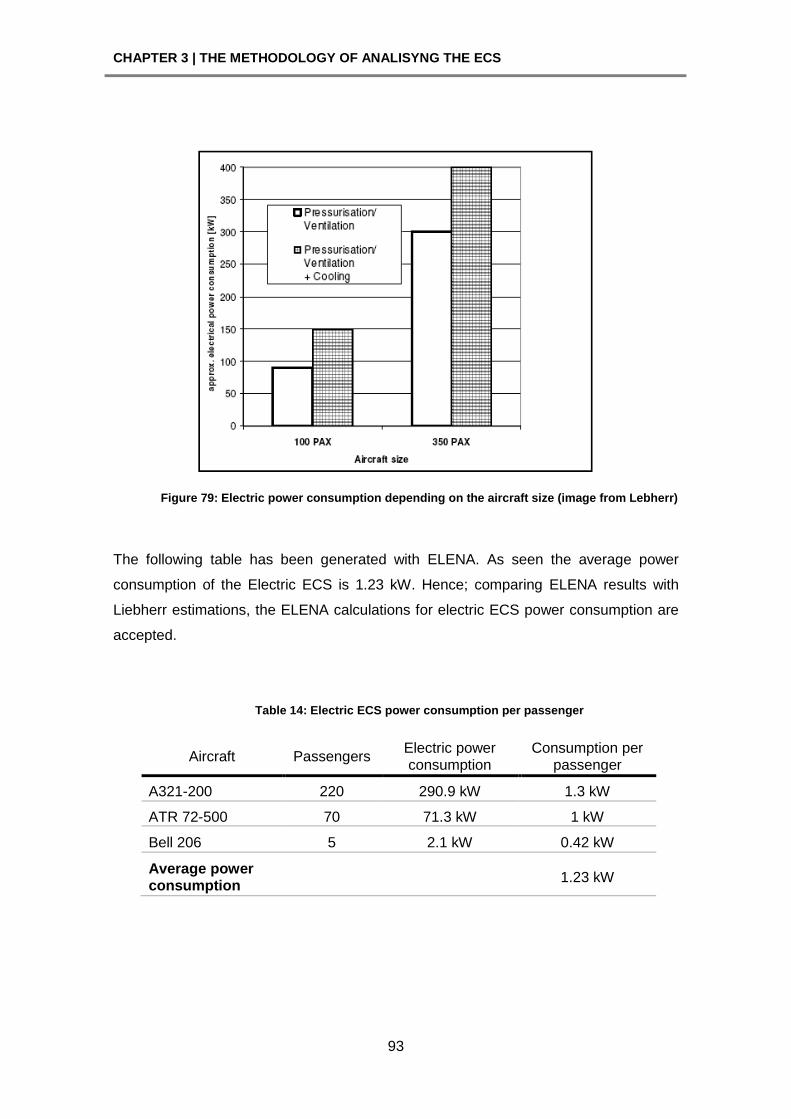
CHAPTER 3 | THE METHODOLOGY OF ANALISYNG THE ECS
93
Figure 79: Electric power consumption depending on the aircraft size (image from Lebherr)
The following table has been generated with ELENA. As seen the average power
consumption of the Electric ECS is 1.23 kW. Hence; comparing ELENA results with
Liebherr estimations, the ELENA calculations for electric ECS power consumption are
accepted.
Table 14: Electric ECS power consumption per passenger
Aircraft Passengers Electric power consumption
Consumption per passenger
A321-200 220 290.9 kW 1.3 kW
ATR 72-500 70 71.3 kW 1 kW
Bell 206 5 2.1 kW 0.42 kW
Average power consumption
1.23 kW
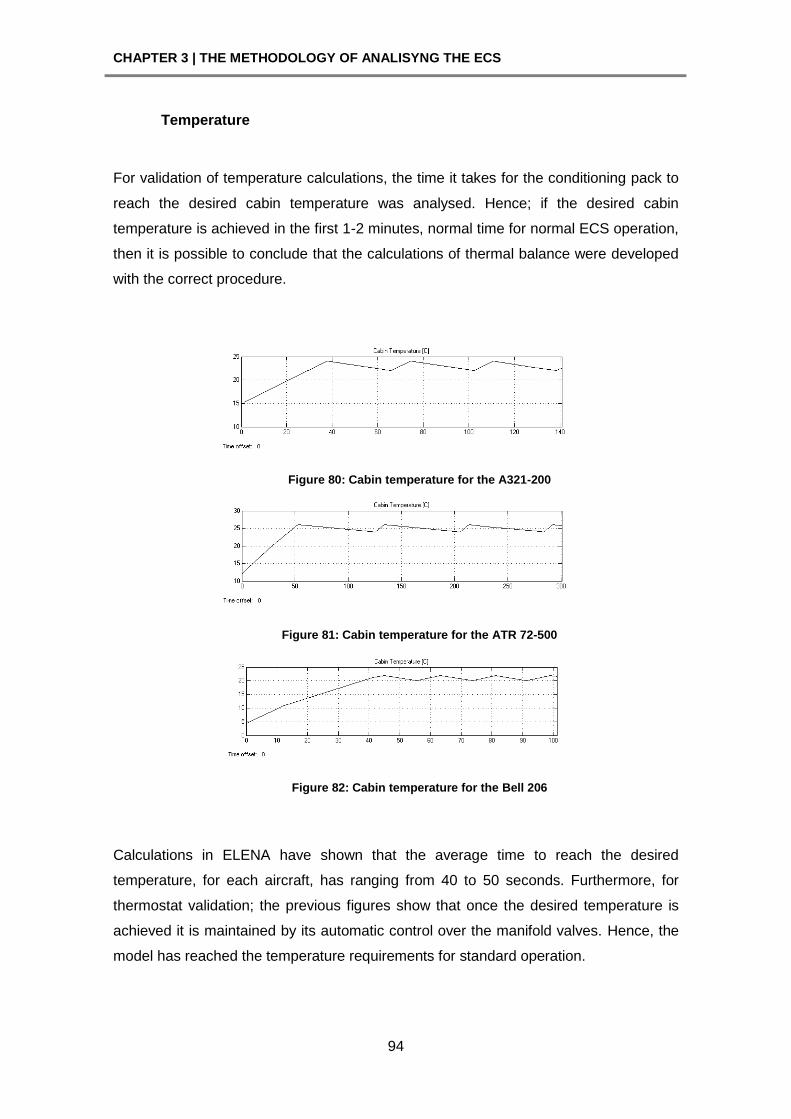
CHAPTER 3 | THE METHODOLOGY OF ANALISYNG THE ECS
94
Temperature
For validation of temperature calculations, the time it takes for the conditioning pack to
reach the desired cabin temperature was analysed. Hence; if the desired cabin
temperature is achieved in the first 1-2 minutes, normal time for normal ECS operation,
then it is possible to conclude that the calculations of thermal balance were developed
with the correct procedure.
Figure 80: Cabin temperature for the A321-200
Figure 81: Cabin temperature for the ATR 72-500
Figure 82: Cabin temperature for the Bell 206
Calculations in ELENA have shown that the average time to reach the desired
temperature, for each aircraft, has ranging from 40 to 50 seconds. Furthermore, for
thermostat validation; the previous figures show that once the desired temperature is
achieved it is maintained by its automatic control over the manifold valves. Hence, the
model has reached the temperature requirements for standard operation.
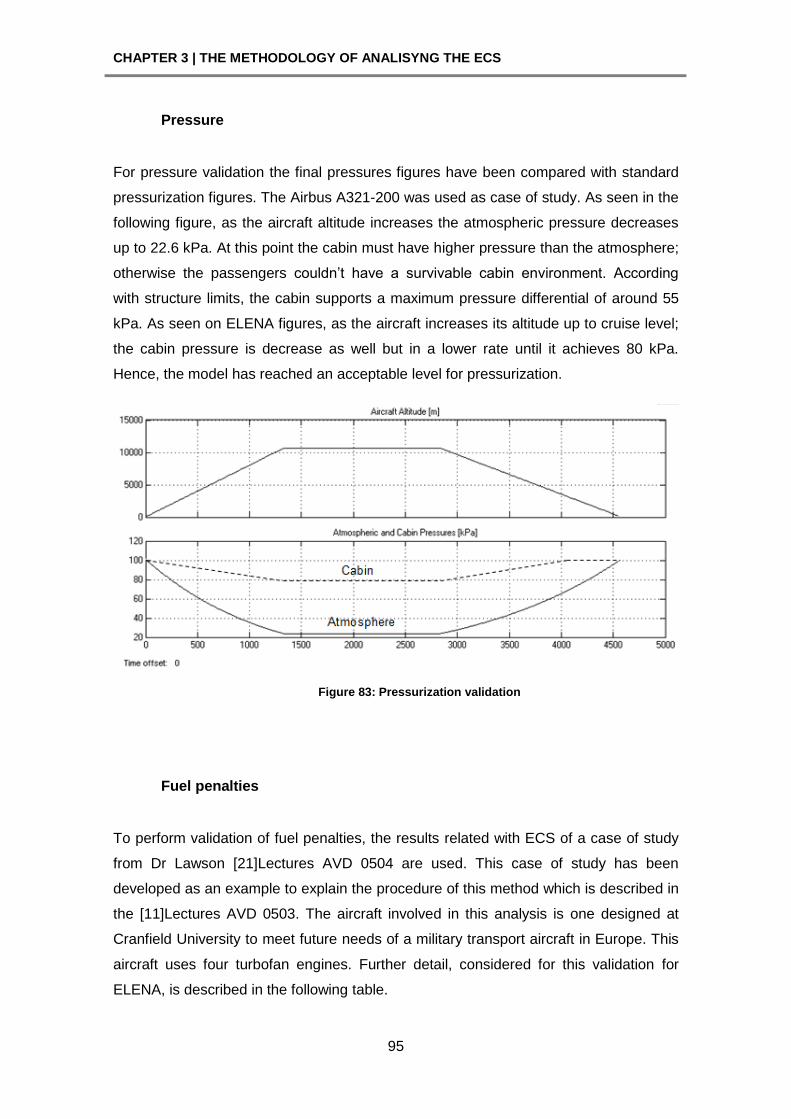
CHAPTER 3 | THE METHODOLOGY OF ANALISYNG THE ECS
95
Pressure
For pressure validation the final pressures figures have been compared with standard
pressurization figures. The Airbus A321-200 was used as case of study. As seen in the
following figure, as the aircraft altitude increases the atmospheric pressure decreases
up to 22.6 kPa. At this point the cabin must have higher pressure than the atmosphere;
otherwise the passengers couldn’t have a survivable cabin environment. According
with structure limits, the cabin supports a maximum pressure differential of around 55
kPa. As seen on ELENA figures, as the aircraft increases its altitude up to cruise level;
the cabin pressure is decrease as well but in a lower rate until it achieves 80 kPa.
Hence, the model has reached an acceptable level for pressurization.
Figure 83: Pressurization validation
Fuel penalties
To perform validation of fuel penalties, the results related with ECS of a case of study
from Dr Lawson [21]Lectures AVD 0504 are used. This case of study has been
developed as an example to explain the procedure of this method which is described in
the [11]Lectures AVD 0503. The aircraft involved in this analysis is one designed at
Cranfield University to meet future needs of a military transport aircraft in Europe. This
aircraft uses four turbofan engines. Further detail, considered for this validation for
ELENA, is described in the following table.
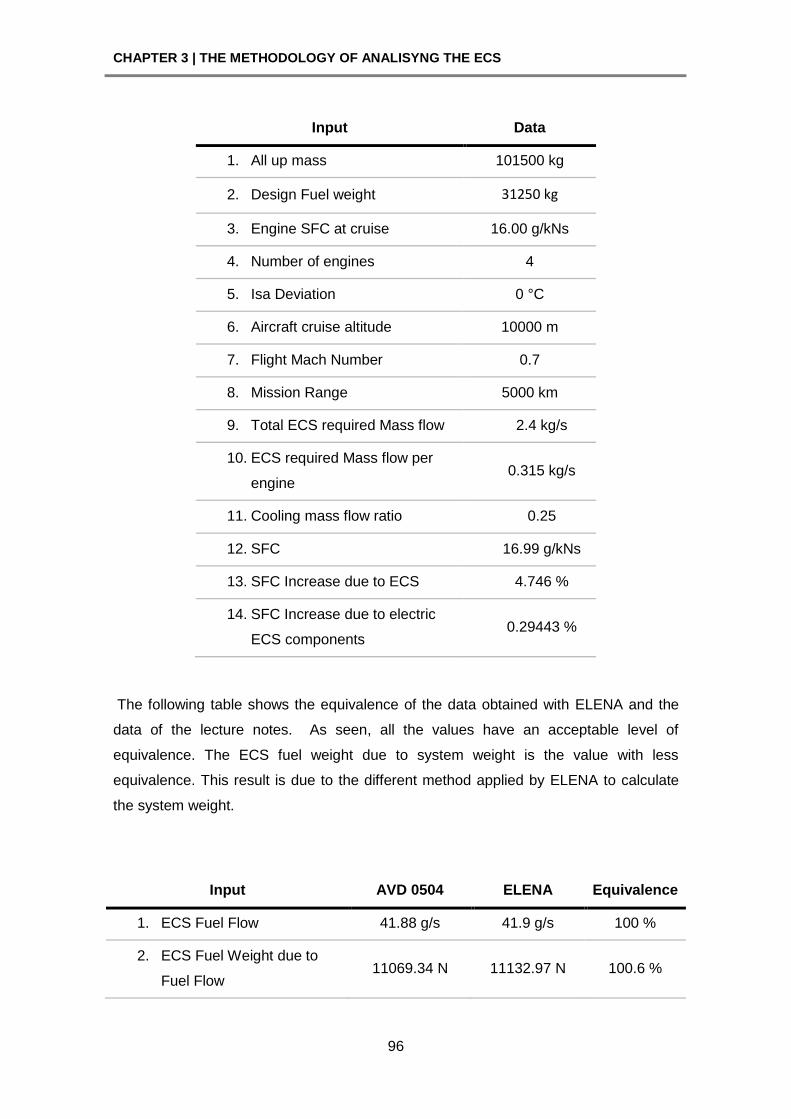
CHAPTER 3 | THE METHODOLOGY OF ANALISYNG THE ECS
96
Input Data
1. All up mass 101500 kg
2. Design Fuel weight 31250 kg
3. Engine SFC at cruise 16.00 g/kNs
4. Number of engines 4
5. Isa Deviation 0 °C
6. Aircraft cruise altitude 10000 m
7. Flight Mach Number 0.7
8. Mission Range 5000 km
9. Total ECS required Mass flow 2.4 kg/s
10. ECS required Mass flow per
engine 0.315 kg/s
11. Cooling mass flow ratio 0.25
12. SFC 16.99 g/kNs
13. SFC Increase due to ECS 4.746 %
14. SFC Increase due to electric
ECS components 0.29443 %
The following table shows the equivalence of the data obtained with ELENA and the
data of the lecture notes. As seen, all the values have an acceptable level of
equivalence. The ECS fuel weight due to system weight is the value with less
equivalence. This result is due to the different method applied by ELENA to calculate
the system weight.
Input AVD 0504 ELENA Equivalence
1. ECS Fuel Flow 41.88 g/s 41.9 g/s 100 %
2. ECS Fuel Weight due to
Fuel Flow 11069.34 N 11132.97 N 100.6 %
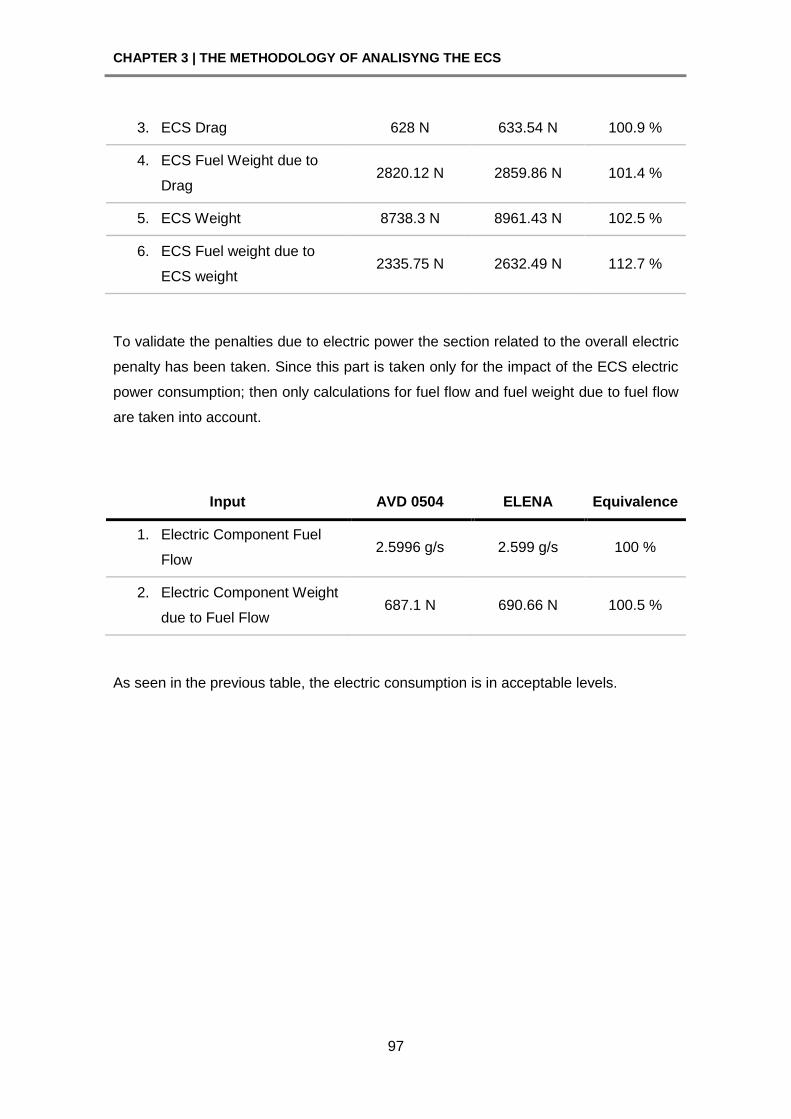
CHAPTER 3 | THE METHODOLOGY OF ANALISYNG THE ECS
97
3. ECS Drag 628 N 633.54 N 100.9 %
4. ECS Fuel Weight due to
Drag 2820.12 N 2859.86 N 101.4 %
5. ECS Weight 8738.3 N 8961.43 N 102.5 %
6. ECS Fuel weight due to
ECS weight 2335.75 N 2632.49 N 112.7 %
To validate the penalties due to electric power the section related to the overall electric
penalty has been taken. Since this part is taken only for the impact of the ECS electric
power consumption; then only calculations for fuel flow and fuel weight due to fuel flow
are taken into account.
Input AVD 0504 ELENA Equivalence
1. Electric Component Fuel
Flow 2.5996 g/s 2.599 g/s 100 %
2. Electric Component Weight
due to Fuel Flow 687.1 N 690.66 N 100.5 %
As seen in the previous table, the electric consumption is in acceptable levels.

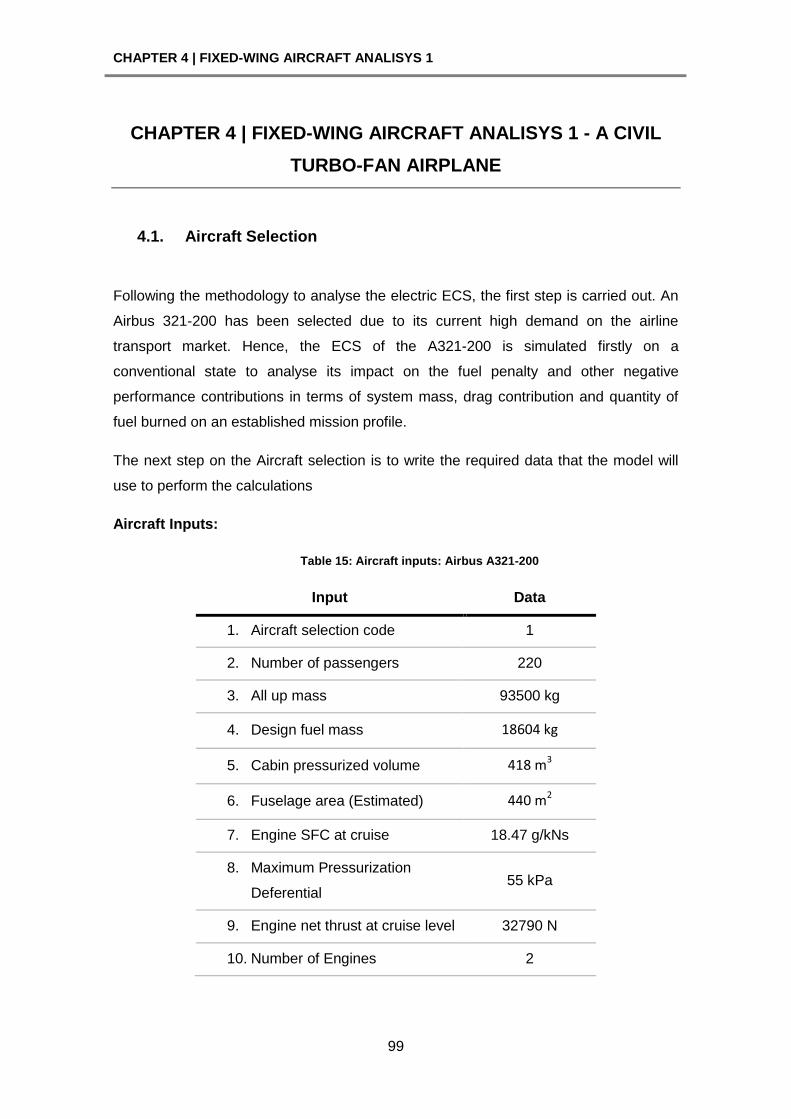
CHAPTER 4 | FIXED-WING AIRCRAFT ANALISYS 1
99
CHAPTER 4 | FIXED-WING AIRCRAFT ANALISYS 1 - A CIVIL
TURBO-FAN AIRPLANE
4.1. Aircraft Selection
Following the methodology to analyse the electric ECS, the first step is carried out. An
Airbus 321-200 has been selected due to its current high demand on the airline
transport market. Hence, the ECS of the A321-200 is simulated firstly on a
conventional state to analyse its impact on the fuel penalty and other negative
performance contributions in terms of system mass, drag contribution and quantity of
fuel burned on an established mission profile.
The next step on the Aircraft selection is to write the required data that the model will
use to perform the calculations
Aircraft Inputs:
Table 15: Aircraft inputs: Airbus A321-200
Input Data
1. Aircraft selection code 1
2. Number of passengers 220
3. All up mass 93500 kg
4. Design fuel mass 18604 kg
5. Cabin pressurized volume 418 m3
6. Fuselage area (Estimated) 440 m2
7. Engine SFC at cruise 18.47 g/kNs
8. Maximum Pressurization
Deferential 55 kPa
9. Engine net thrust at cruise level 32790 N
10. Number of Engines 2
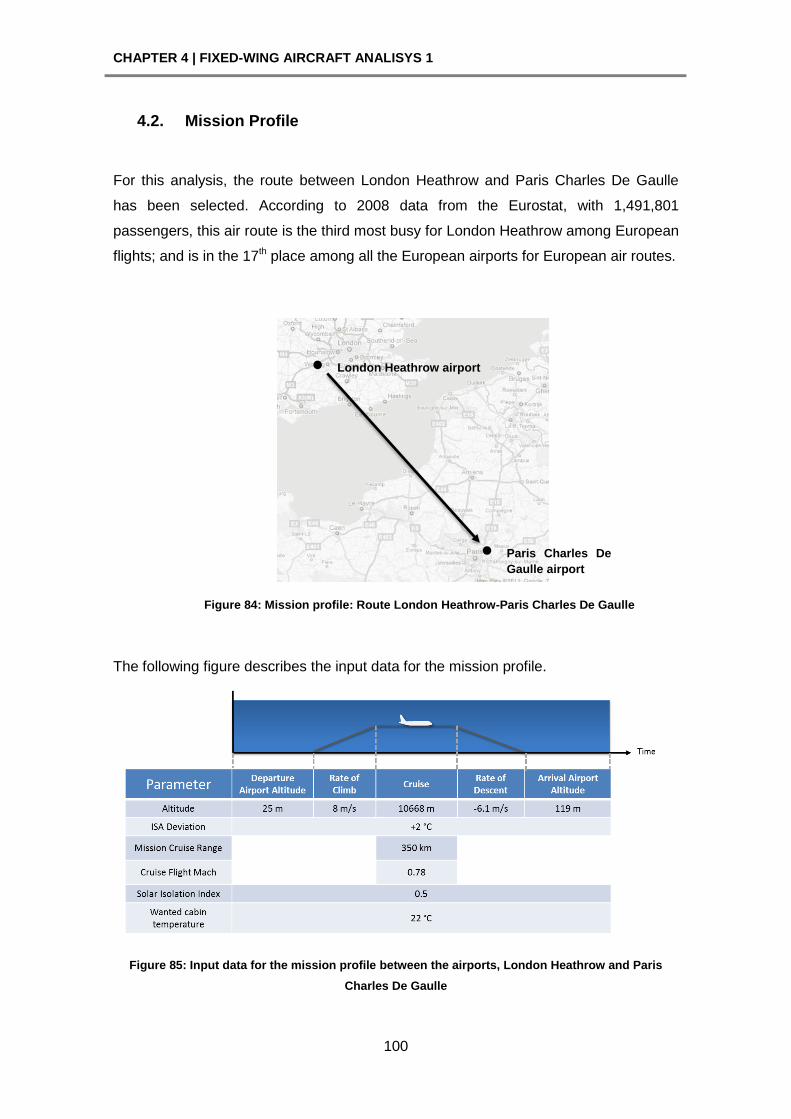
CHAPTER 4 | FIXED-WING AIRCRAFT ANALISYS 1
100
4.2. Mission Profile
For this analysis, the route between London Heathrow and Paris Charles De Gaulle
has been selected. According to 2008 data from the Eurostat, with 1,491,801
passengers, this air route is the third most busy for London Heathrow among European
flights; and is in the 17th place among all the European airports for European air routes.
Figure 84: Mission profile: Route London Heathrow-Paris Charles De Gaulle
The following figure describes the input data for the mission profile.
Figure 85: Input data for the mission profile between the airports, London Heathrow and Paris
Charles De Gaulle
London Heathrow airport
Paris Charles De
Gaulle airport
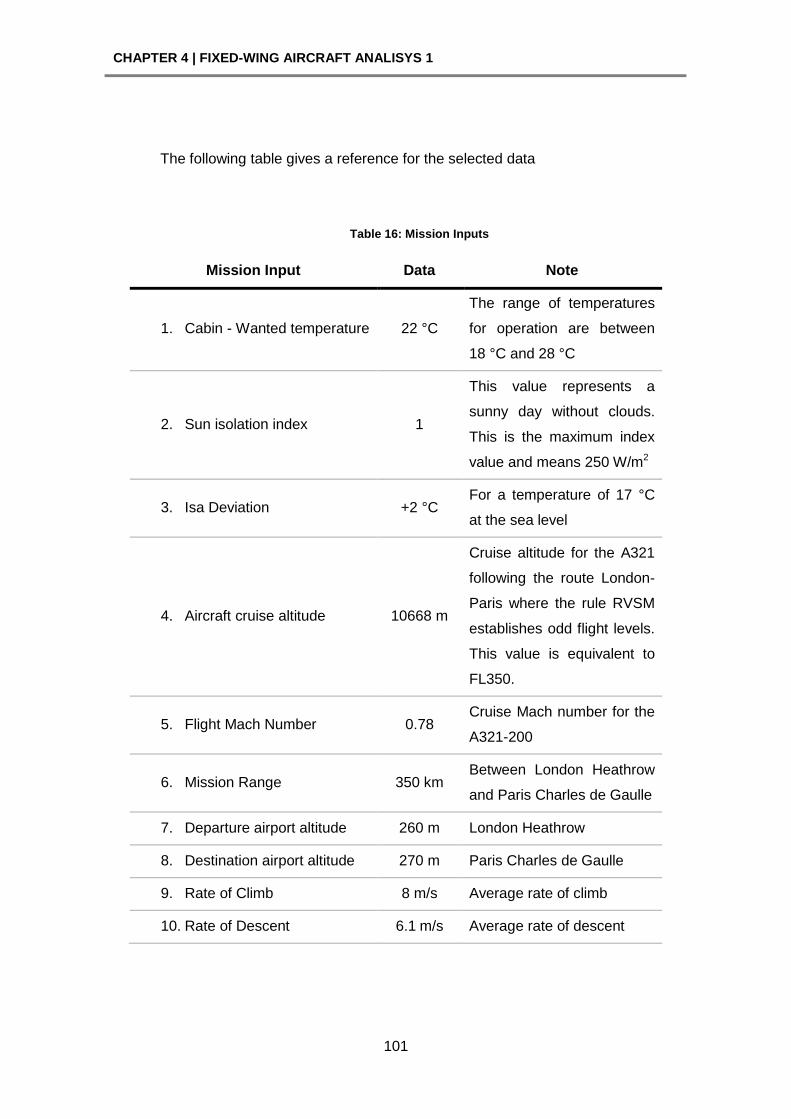
CHAPTER 4 | FIXED-WING AIRCRAFT ANALISYS 1
101
The following table gives a reference for the selected data
Table 16: Mission Inputs
Mission Input Data Note
1. Cabin - Wanted temperature 22 °C
The range of temperatures
for operation are between
18 °C and 28 °C
2. Sun isolation index 1
This value represents a
sunny day without clouds.
This is the maximum index
value and means 250 W/m2
3. Isa Deviation +2 °C For a temperature of 17 °C
at the sea level
4. Aircraft cruise altitude 10668 m
Cruise altitude for the A321
following the route London-
Paris where the rule RVSM
establishes odd flight levels.
This value is equivalent to
FL350.
5. Flight Mach Number 0.78 Cruise Mach number for the
A321-200
6. Mission Range 350 km Between London Heathrow
and Paris Charles de Gaulle
7. Departure airport altitude 260 m London Heathrow
8. Destination airport altitude 270 m Paris Charles de Gaulle
9. Rate of Climb 8 m/s Average rate of climb
10. Rate of Descent 6.1 m/s Average rate of descent
CHAPTER 4 | FIXED-WING AIRCRAFT ANALISYS 1
102
4.3. Conventional ECS Analysis
Pneumatic energy required
Now the pneumatic energy is calculated. This parameter will be used, as an input, over
an engine performance simulation tool. The main purpose of getting this data is to
compare the SFC engine with and without the extraction of this form of energy. The
following table shows the results.
Table 17: Pneumatic power required
Parameter Result
1. Total ECS required Mass flow 1.83 kg/s
2. ECS required Mass flow per
engine 0.915 kg/s
Engine SFC impact
Once the simulation has been carried out, the SFC results are compared. The following
table shows the achieved results.
Table 18: Engine SFC Impact
Parameter Result
1. SFC without ECS 18.52 g/kNs
2. SFC with conventional ECS 19.23 g/kNs
3. SFC Increase 3.83%
CHAPTER 4 | FIXED-WING AIRCRAFT ANALISYS 1
103
Table 19: ECS configuration inputs
Parameter Result
1. ECS selection code 1
2. Cooling mass flow ratio 1
3. SFC increase rate 0.0383
Conventional model impact
The next step involves the use of the SFC increasing rates on ELENA v1. The next
table shows the results for the conventional model.
Mission cruise time: 25.03 min
Table 20: Conventional ECS fuel penalties
Input Impact value
1. ECS fuel flow due to
Power-off Take 46.39 g/s
2. ECS Drag due to ram
air 854.57 N
3. ECS Weight 8255 N
4. Fuel Weight due to
ECS Power-off Take 687.92 N
5. Fuel Weight due to
ECS Drag 234.1 N
6. Fuel Weight due to
ECS Weight 175.66 N
7. Total ECS Fuel
Weight 1097.6 N
8. Total ECS Weight (ECS
weight + ECS fuel weight) 9352.6 N
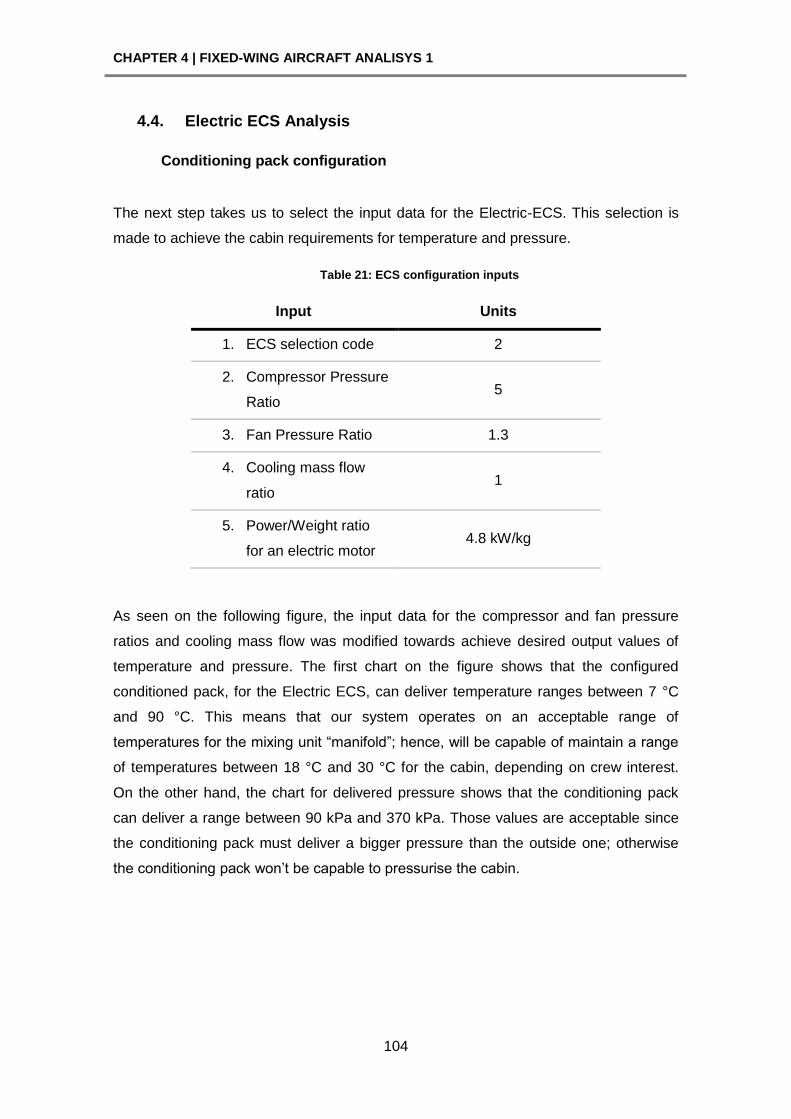
CHAPTER 4 | FIXED-WING AIRCRAFT ANALISYS 1
104
4.4. Electric ECS Analysis
Conditioning pack configuration
The next step takes us to select the input data for the Electric-ECS. This selection is
made to achieve the cabin requirements for temperature and pressure.
Table 21: ECS configuration inputs
Input Units
1. ECS selection code 2
2. Compressor Pressure
Ratio 5
3. Fan Pressure Ratio 1.3
4. Cooling mass flow
ratio 1
5. Power/Weight ratio
for an electric motor 4.8 kW/kg
As seen on the following figure, the input data for the compressor and fan pressure
ratios and cooling mass flow was modified towards achieve desired output values of
temperature and pressure. The first chart on the figure shows that the configured
conditioned pack, for the Electric ECS, can deliver temperature ranges between 7 °C
and 90 °C. This means that our system operates on an acceptable range of
temperatures for the mixing unit ―manifold‖; hence, will be capable of maintain a range
of temperatures between 18 °C and 30 °C for the cabin, depending on crew interest.
On the other hand, the chart for delivered pressure shows that the conditioning pack
can deliver a range between 90 kPa and 370 kPa. Those values are acceptable since
the conditioning pack must deliver a bigger pressure than the outside one; otherwise
the conditioning pack won’t be capable to pressurise the cabin.
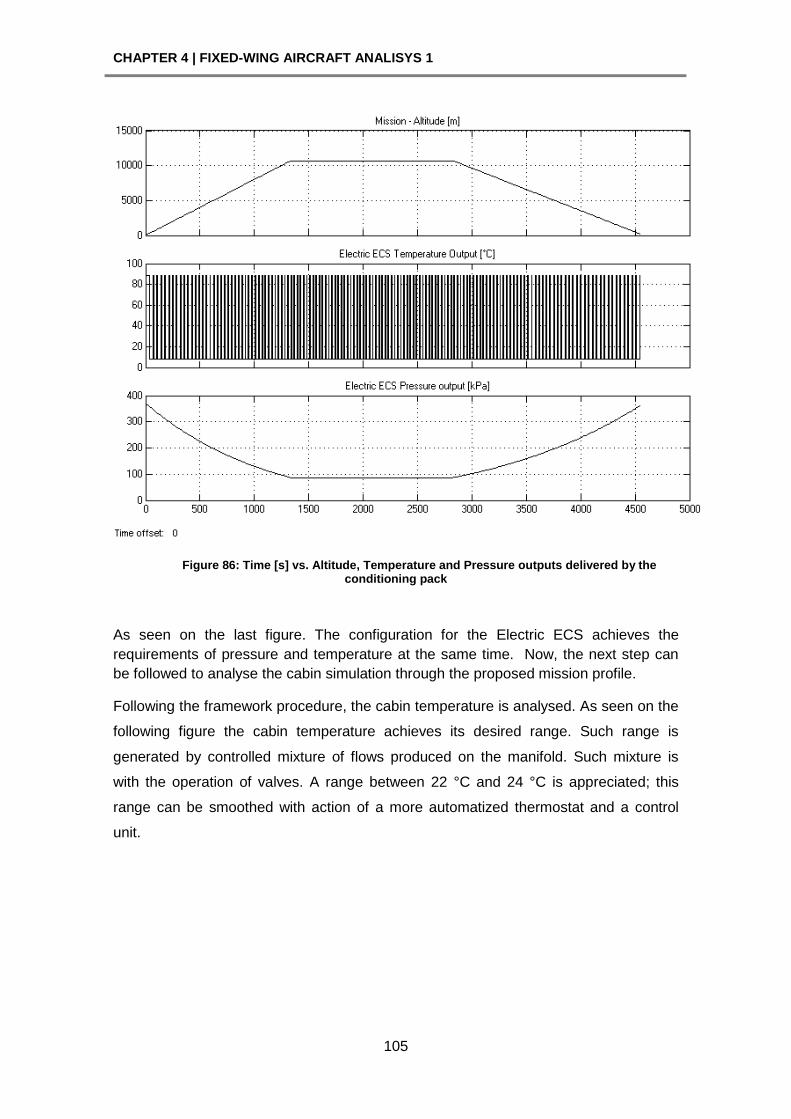
CHAPTER 4 | FIXED-WING AIRCRAFT ANALISYS 1
105
Figure 86: Time [s] vs. Altitude, Temperature and Pressure outputs delivered by the conditioning pack
As seen on the last figure. The configuration for the Electric ECS achieves the
requirements of pressure and temperature at the same time. Now, the next step can
be followed to analyse the cabin simulation through the proposed mission profile.
Following the framework procedure, the cabin temperature is analysed. As seen on the
following figure the cabin temperature achieves its desired range. Such range is
generated by controlled mixture of flows produced on the manifold. Such mixture is
with the operation of valves. A range between 22 °C and 24 °C is appreciated; this
range can be smoothed with action of a more automatized thermostat and a control
unit.
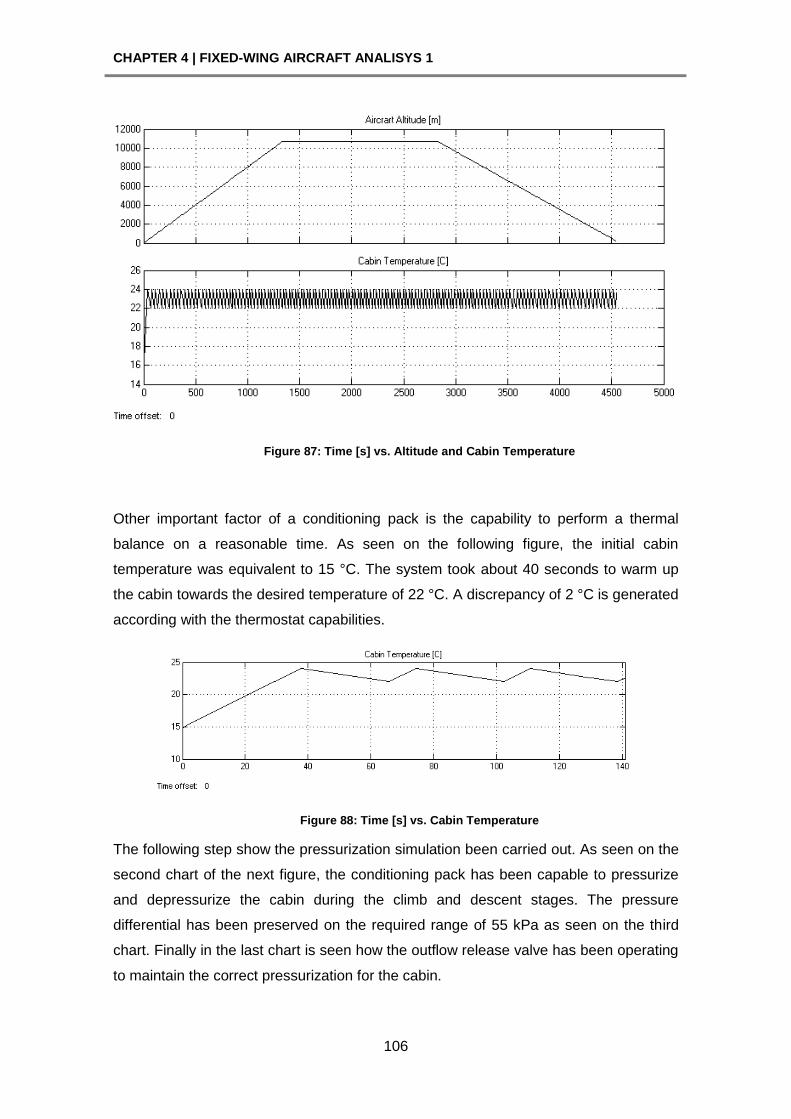
CHAPTER 4 | FIXED-WING AIRCRAFT ANALISYS 1
106
Figure 87: Time [s] vs. Altitude and Cabin Temperature
Other important factor of a conditioning pack is the capability to perform a thermal
balance on a reasonable time. As seen on the following figure, the initial cabin
temperature was equivalent to 15 °C. The system took about 40 seconds to warm up
the cabin towards the desired temperature of 22 °C. A discrepancy of 2 °C is generated
according with the thermostat capabilities.
Figure 88: Time [s] vs. Cabin Temperature
The following step show the pressurization simulation been carried out. As seen on the
second chart of the next figure, the conditioning pack has been capable to pressurize
and depressurize the cabin during the climb and descent stages. The pressure
differential has been preserved on the required range of 55 kPa as seen on the third
chart. Finally in the last chart is seen how the outflow release valve has been operating
to maintain the correct pressurization for the cabin.
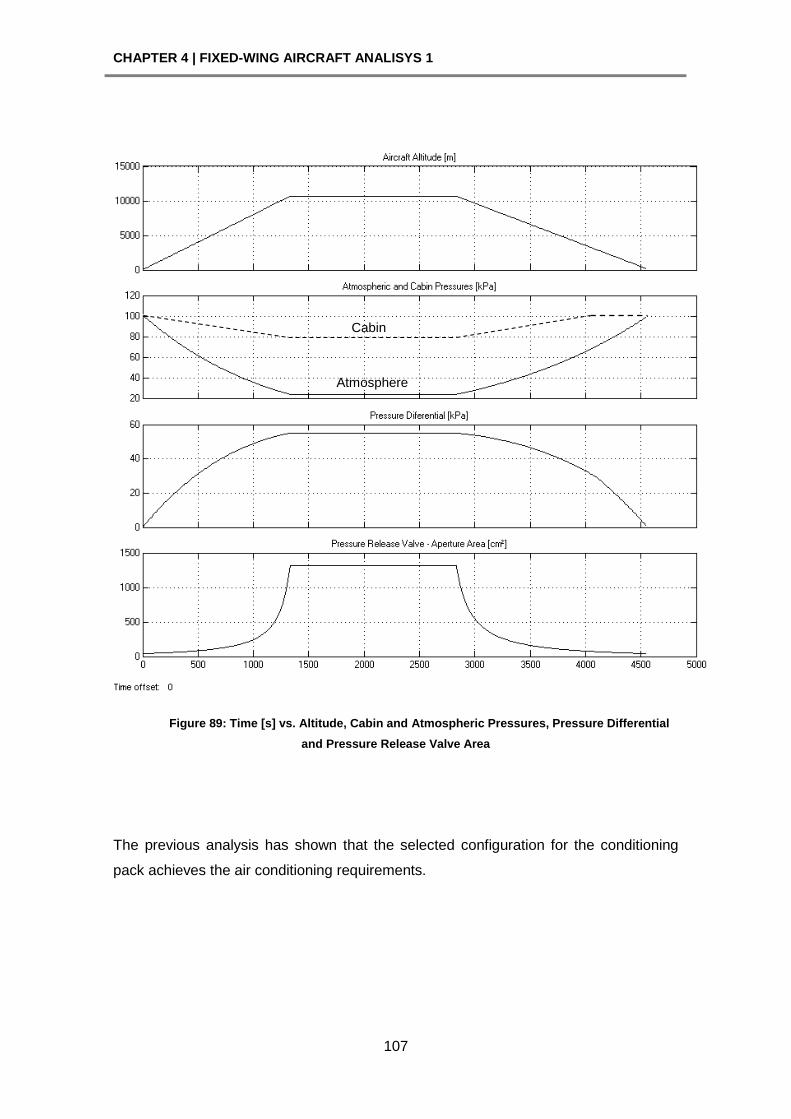
CHAPTER 4 | FIXED-WING AIRCRAFT ANALISYS 1
107
Figure 89: Time [s] vs. Altitude, Cabin and Atmospheric Pressures, Pressure Differential
and Pressure Release Valve Area
The previous analysis has shown that the selected configuration for the conditioning
pack achieves the air conditioning requirements.
Cabin
Atmosphere
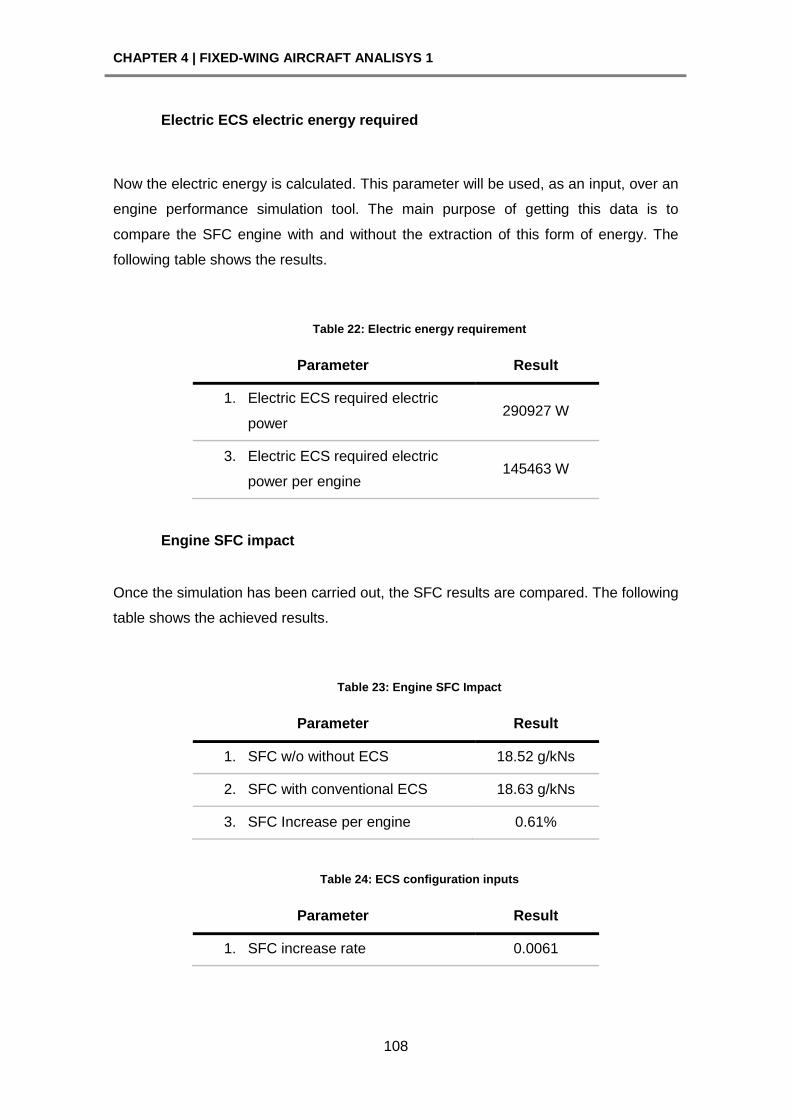
CHAPTER 4 | FIXED-WING AIRCRAFT ANALISYS 1
108
Electric ECS electric energy required
Now the electric energy is calculated. This parameter will be used, as an input, over an
engine performance simulation tool. The main purpose of getting this data is to
compare the SFC engine with and without the extraction of this form of energy. The
following table shows the results.
Table 22: Electric energy requirement
Parameter Result
1. Electric ECS required electric
power 290927 W
3. Electric ECS required electric
power per engine 145463 W
Engine SFC impact
Once the simulation has been carried out, the SFC results are compared. The following
table shows the achieved results.
Table 23: Engine SFC Impact
Parameter Result
1. SFC w/o without ECS 18.52 g/kNs
2. SFC with conventional ECS 18.63 g/kNs
3. SFC Increase per engine 0.61%
Table 24: ECS configuration inputs
Parameter Result
1. SFC increase rate 0.0061
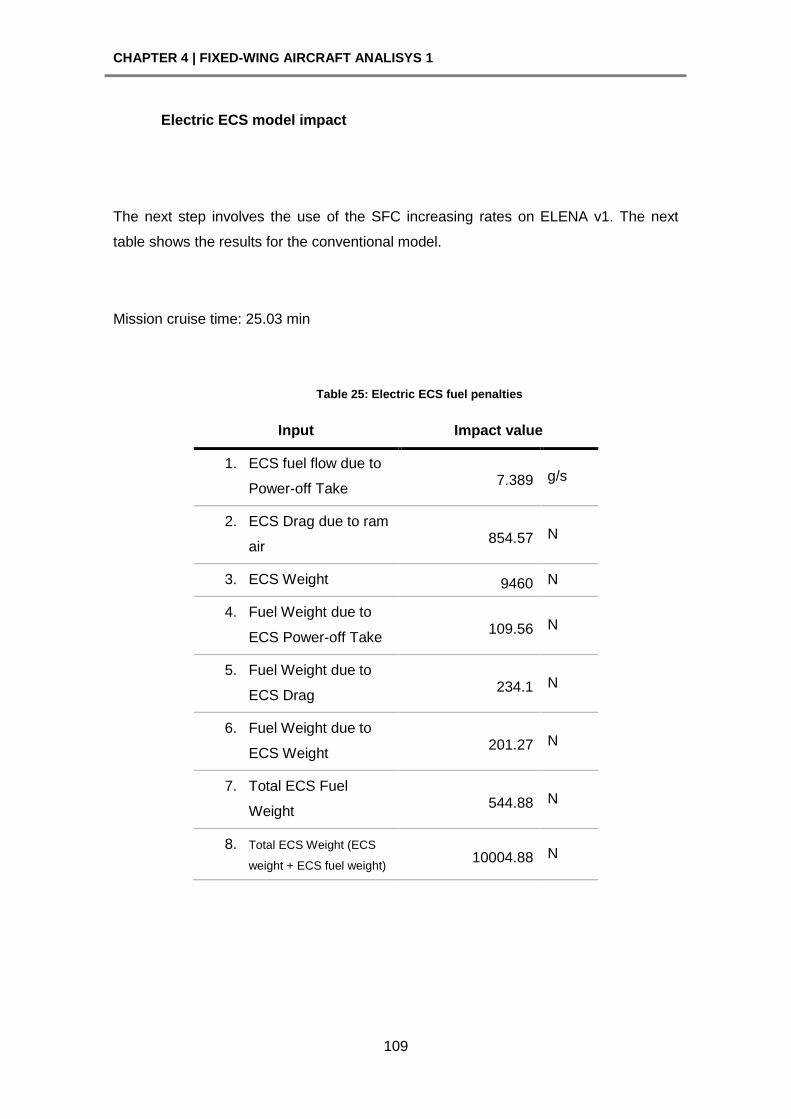
CHAPTER 4 | FIXED-WING AIRCRAFT ANALISYS 1
109
Electric ECS model impact
The next step involves the use of the SFC increasing rates on ELENA v1. The next
table shows the results for the conventional model.
Mission cruise time: 25.03 min
Table 25: Electric ECS fuel penalties
Input Impact value
1. ECS fuel flow due to
Power-off Take 7.389 g/s
2. ECS Drag due to ram
air 854.57 N
3. ECS Weight 9460 N
4. Fuel Weight due to
ECS Power-off Take 109.56 N
5. Fuel Weight due to
ECS Drag 234.1 N
6. Fuel Weight due to
ECS Weight 201.27 N
7. Total ECS Fuel
Weight 544.88 N
8. Total ECS Weight (ECS
weight + ECS fuel weight) 10004.88 N
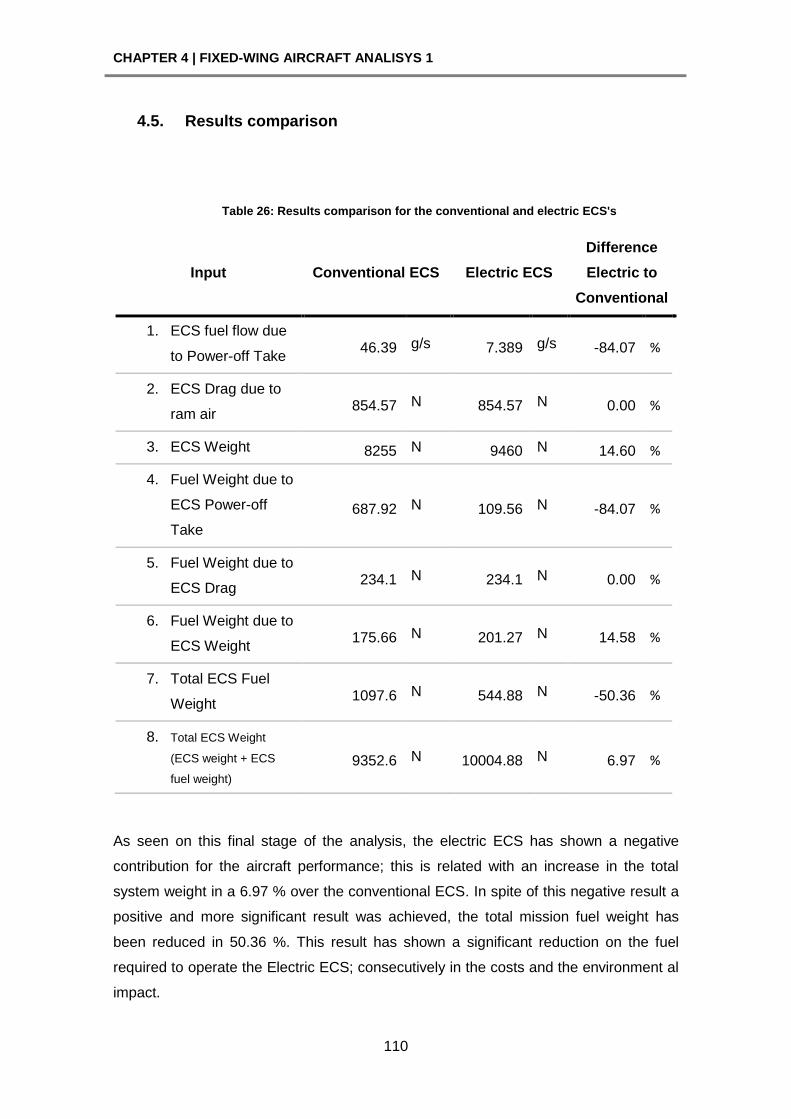
CHAPTER 4 | FIXED-WING AIRCRAFT ANALISYS 1
110
4.5. Results comparison
Table 26: Results comparison for the conventional and electric ECS's
Input Conventional ECS Electric ECS
Difference
Electric to
Conventional
1. ECS fuel flow due
to Power-off Take 46.39 g/s 7.389 g/s -84.07 %
2. ECS Drag due to
ram air 854.57 N 854.57 N 0.00 %
3. ECS Weight 8255 N 9460 N 14.60 %
4. Fuel Weight due to
ECS Power-off
Take
687.92 N 109.56 N -84.07 %
5. Fuel Weight due to
ECS Drag 234.1 N 234.1 N 0.00 %
6. Fuel Weight due to
ECS Weight 175.66 N 201.27 N 14.58 %
7. Total ECS Fuel
Weight 1097.6 N 544.88 N -50.36 %
8. Total ECS Weight
(ECS weight + ECS
fuel weight)
9352.6 N 10004.88 N 6.97 %
As seen on this final stage of the analysis, the electric ECS has shown a negative
contribution for the aircraft performance; this is related with an increase in the total
system weight in a 6.97 % over the conventional ECS. In spite of this negative result a
positive and more significant result was achieved, the total mission fuel weight has
been reduced in 50.36 %. This result has shown a significant reduction on the fuel
required to operate the Electric ECS; consecutively in the costs and the environment al
impact.
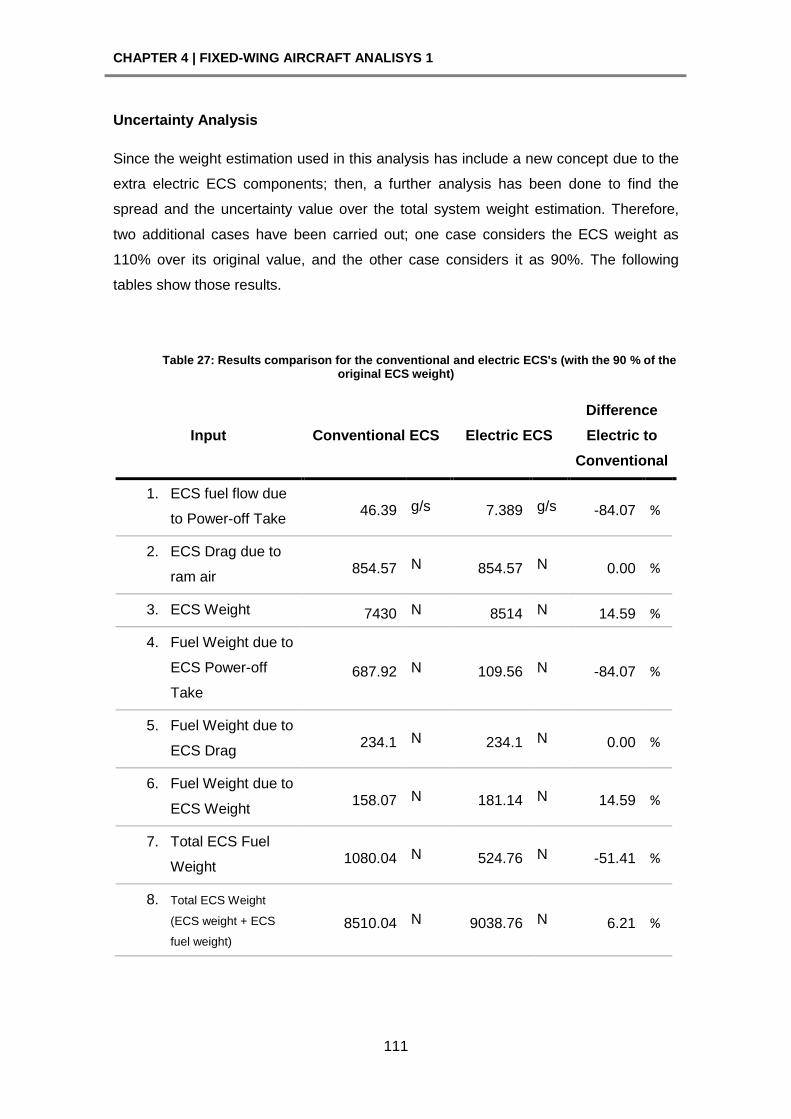
CHAPTER 4 | FIXED-WING AIRCRAFT ANALISYS 1
111
Uncertainty Analysis
Since the weight estimation used in this analysis has include a new concept due to the
extra electric ECS components; then, a further analysis has been done to find the
spread and the uncertainty value over the total system weight estimation. Therefore,
two additional cases have been carried out; one case considers the ECS weight as
110% over its original value, and the other case considers it as 90%. The following
tables show those results.
Table 27: Results comparison for the conventional and electric ECS's (with the 90 % of the original ECS weight)
Input Conventional ECS Electric ECS
Difference
Electric to
Conventional
1. ECS fuel flow due
to Power-off Take 46.39 g/s 7.389 g/s -84.07 %
2. ECS Drag due to
ram air 854.57 N 854.57 N 0.00 %
3. ECS Weight 7430 N 8514 N 14.59 %
4. Fuel Weight due to
ECS Power-off
Take
687.92 N 109.56 N -84.07 %
5. Fuel Weight due to
ECS Drag 234.1 N 234.1 N 0.00 %
6. Fuel Weight due to
ECS Weight 158.07 N 181.14 N 14.59 %
7. Total ECS Fuel
Weight 1080.04 N 524.76 N -51.41 %
8. Total ECS Weight
(ECS weight + ECS
fuel weight)
8510.04 N 9038.76 N 6.21 %
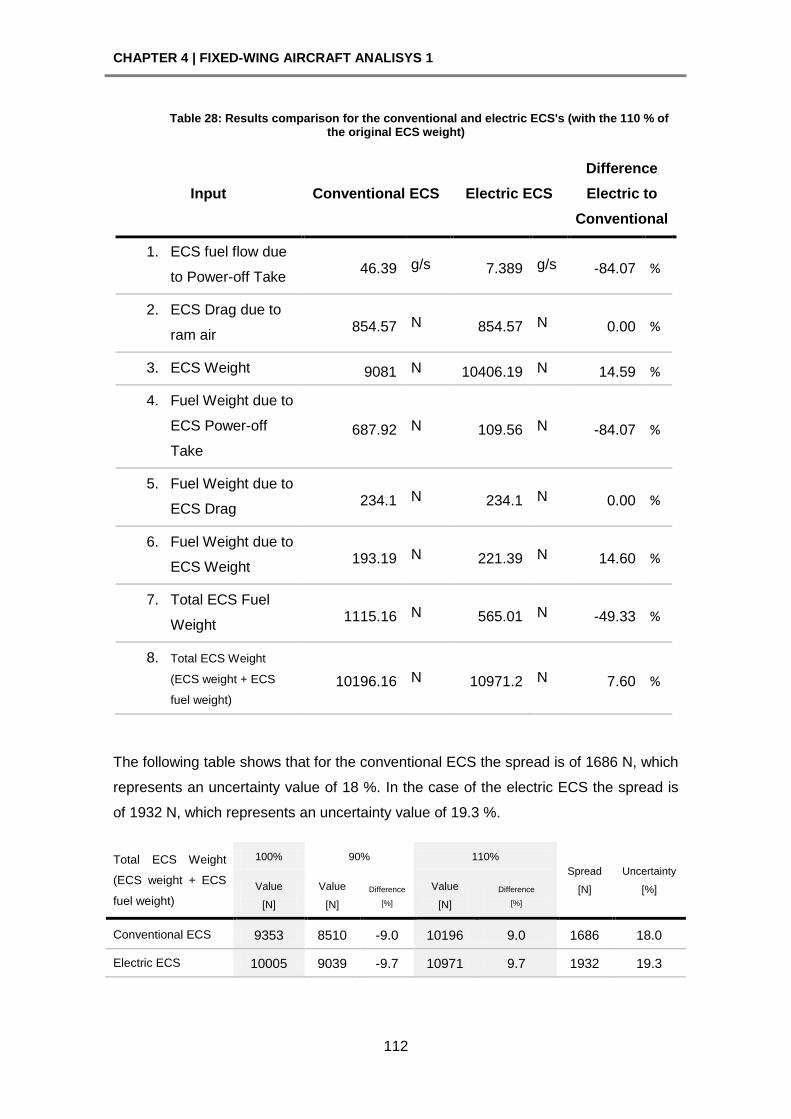
CHAPTER 4 | FIXED-WING AIRCRAFT ANALISYS 1
112
Table 28: Results comparison for the conventional and electric ECS's (with the 110 % of the original ECS weight)
Input Conventional ECS Electric ECS
Difference
Electric to
Conventional
1. ECS fuel flow due
to Power-off Take 46.39 g/s 7.389 g/s -84.07 %
2. ECS Drag due to
ram air 854.57 N 854.57 N 0.00 %
3. ECS Weight 9081 N 10406.19 N 14.59 %
4. Fuel Weight due to
ECS Power-off
Take
687.92 N 109.56 N -84.07 %
5. Fuel Weight due to
ECS Drag 234.1 N 234.1 N 0.00 %
6. Fuel Weight due to
ECS Weight 193.19 N 221.39 N 14.60 %
7. Total ECS Fuel
Weight 1115.16 N 565.01 N -49.33 %
8. Total ECS Weight
(ECS weight + ECS
fuel weight)
10196.16 N 10971.2 N 7.60 %
The following table shows that for the conventional ECS the spread is of 1686 N, which
represents an uncertainty value of 18 %. In the case of the electric ECS the spread is
of 1932 N, which represents an uncertainty value of 19.3 %.
Total ECS Weight
(ECS weight + ECS
fuel weight)
100% 90% 110%
Spread
[N]
Uncertainty
[%] Value
[N]
Value
[N]
Difference
[%]
Value
[N]
Difference
[%]
Conventional ECS 9353 8510 -9.0 10196 9.0 1686 18.0
Electric ECS 10005 9039 -9.7 10971 9.7 1932 19.3
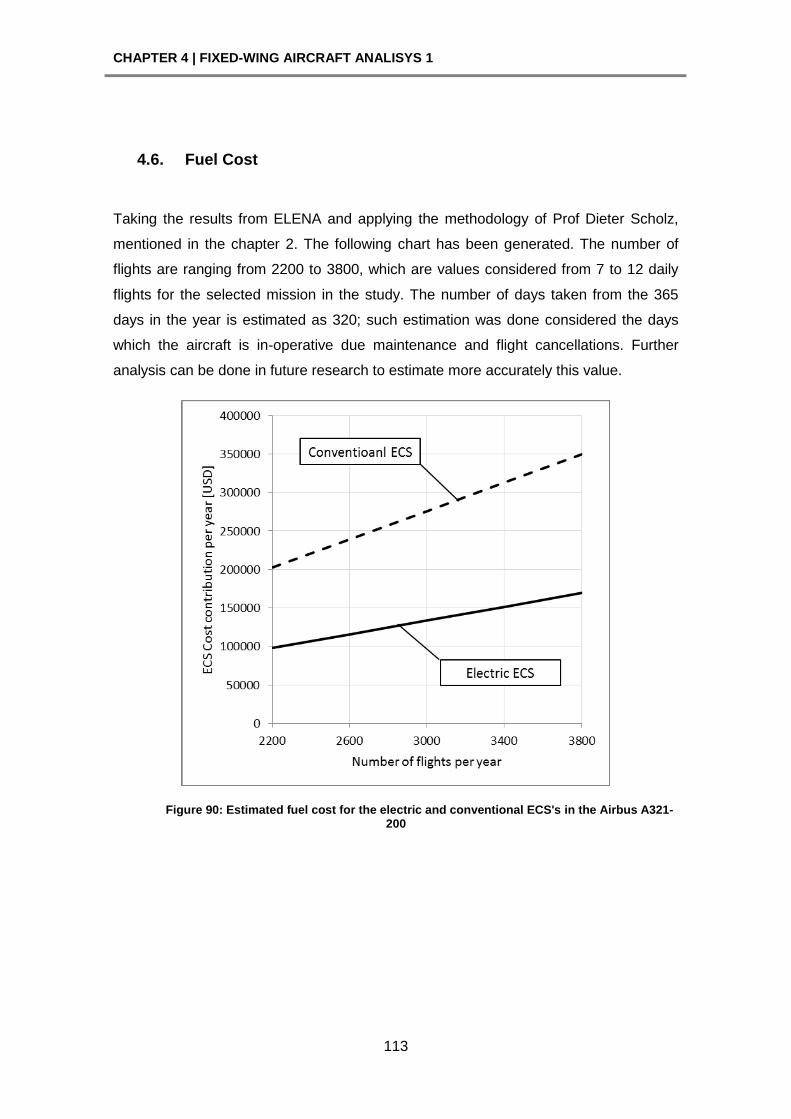
CHAPTER 4 | FIXED-WING AIRCRAFT ANALISYS 1
113
4.6. Fuel Cost
Taking the results from ELENA and applying the methodology of Prof Dieter Scholz,
mentioned in the chapter 2. The following chart has been generated. The number of
flights are ranging from 2200 to 3800, which are values considered from 7 to 12 daily
flights for the selected mission in the study. The number of days taken from the 365
days in the year is estimated as 320; such estimation was done considered the days
which the aircraft is in-operative due maintenance and flight cancellations. Further
analysis can be done in future research to estimate more accurately this value.
Figure 90: Estimated fuel cost for the electric and conventional ECS's in the Airbus A321-200

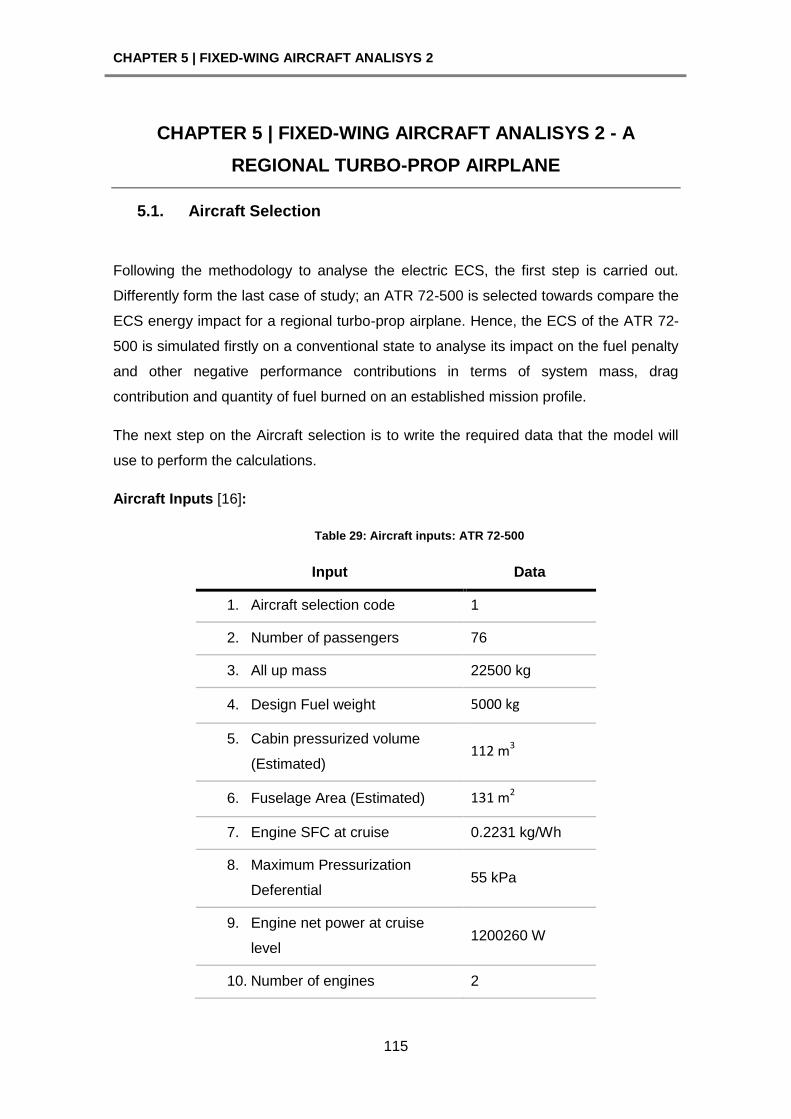
CHAPTER 5 | FIXED-WING AIRCRAFT ANALISYS 2
115
CHAPTER 5 | FIXED-WING AIRCRAFT ANALISYS 2 - A
REGIONAL TURBO-PROP AIRPLANE
5.1. Aircraft Selection
Following the methodology to analyse the electric ECS, the first step is carried out.
Differently form the last case of study; an ATR 72-500 is selected towards compare the
ECS energy impact for a regional turbo-prop airplane. Hence, the ECS of the ATR 72-
500 is simulated firstly on a conventional state to analyse its impact on the fuel penalty
and other negative performance contributions in terms of system mass, drag
contribution and quantity of fuel burned on an established mission profile.
The next step on the Aircraft selection is to write the required data that the model will
use to perform the calculations.
Aircraft Inputs [16]:
Table 29: Aircraft inputs: ATR 72-500
Input Data
1. Aircraft selection code 1
2. Number of passengers 76
3. All up mass 22500 kg
4. Design Fuel weight 5000 kg
5. Cabin pressurized volume
(Estimated) 112 m3
6. Fuselage Area (Estimated) 131 m2
7. Engine SFC at cruise 0.2231 kg/Wh
8. Maximum Pressurization
Deferential 55 kPa
9. Engine net power at cruise
level 1200260 W
10. Number of engines 2
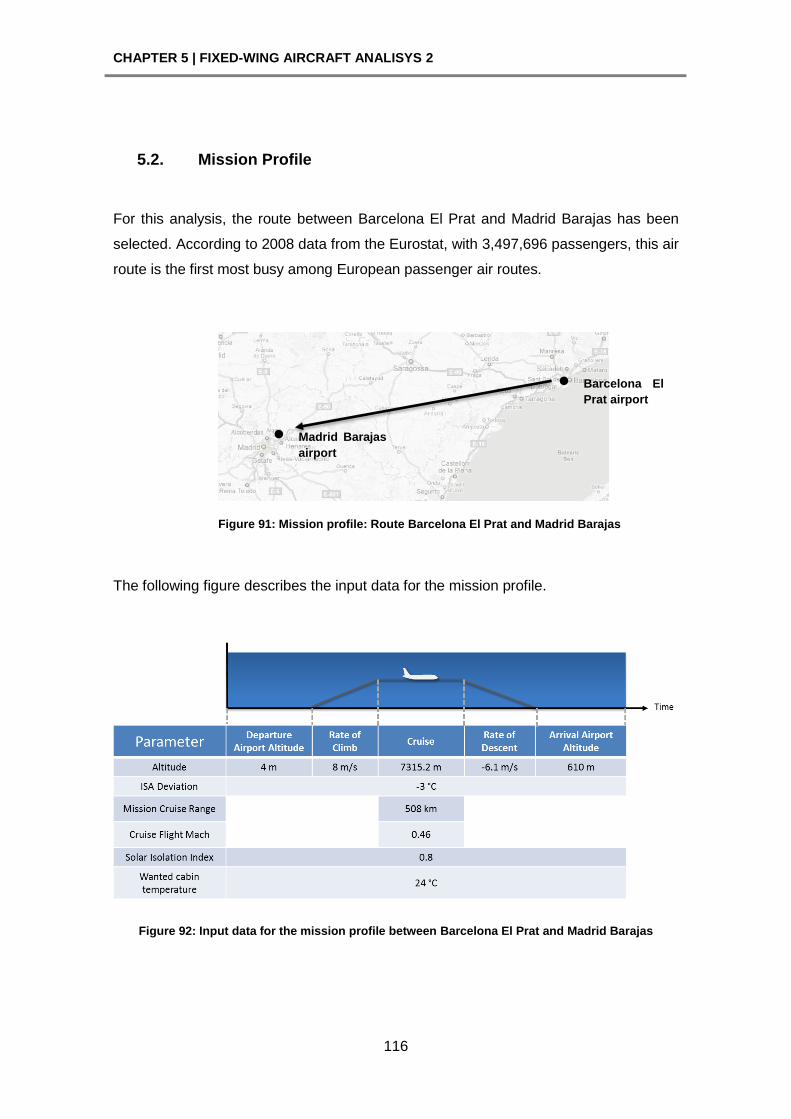
CHAPTER 5 | FIXED-WING AIRCRAFT ANALISYS 2
116
5.2. Mission Profile
For this analysis, the route between Barcelona El Prat and Madrid Barajas has been
selected. According to 2008 data from the Eurostat, with 3,497,696 passengers, this air
route is the first most busy among European passenger air routes.
Figure 91: Mission profile: Route Barcelona El Prat and Madrid Barajas
The following figure describes the input data for the mission profile.
Figure 92: Input data for the mission profile between Barcelona El Prat and Madrid Barajas
Madrid Barajas
airport
Barcelona El
Prat airport
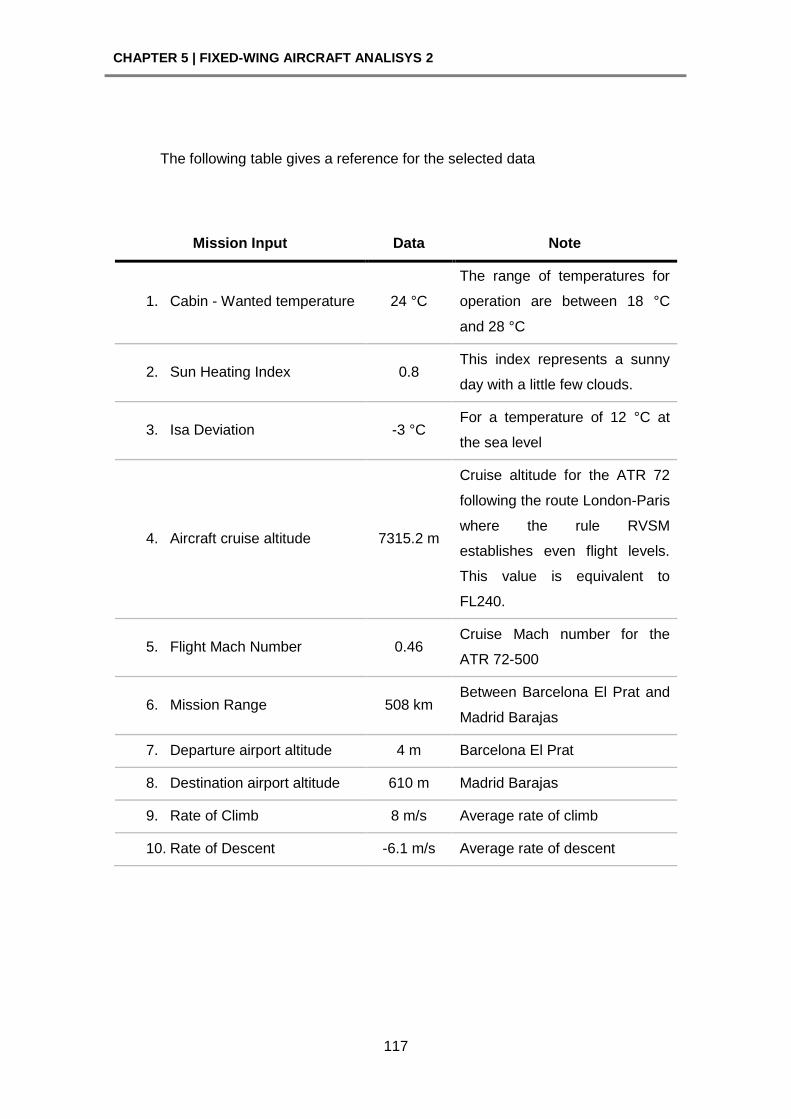
CHAPTER 5 | FIXED-WING AIRCRAFT ANALISYS 2
117
The following table gives a reference for the selected data
Mission Input Data Note
1. Cabin - Wanted temperature 24 °C
The range of temperatures for
operation are between 18 °C
and 28 °C
2. Sun Heating Index 0.8 This index represents a sunny
day with a little few clouds.
3. Isa Deviation -3 °C For a temperature of 12 °C at
the sea level
4. Aircraft cruise altitude 7315.2 m
Cruise altitude for the ATR 72
following the route London-Paris
where the rule RVSM
establishes even flight levels.
This value is equivalent to
FL240.
5. Flight Mach Number 0.46 Cruise Mach number for the
ATR 72-500
6. Mission Range 508 km Between Barcelona El Prat and
Madrid Barajas
7. Departure airport altitude 4 m Barcelona El Prat
8. Destination airport altitude 610 m Madrid Barajas
9. Rate of Climb 8 m/s Average rate of climb
10. Rate of Descent -6.1 m/s Average rate of descent
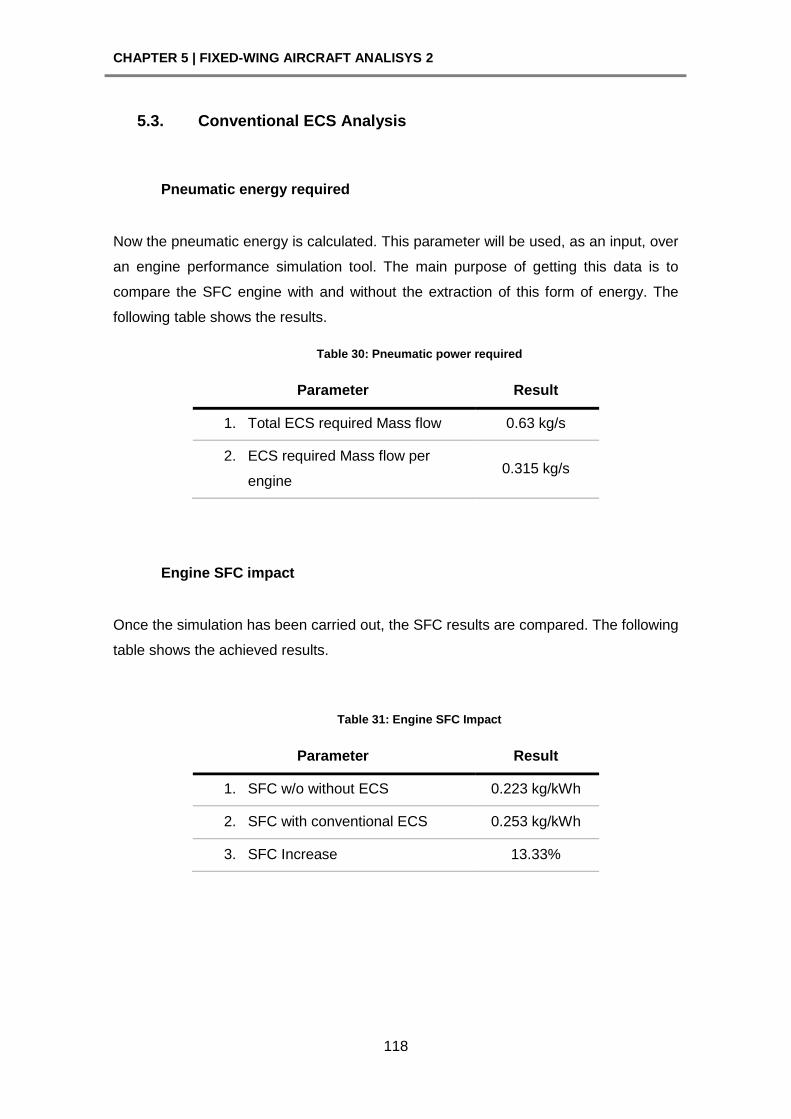
CHAPTER 5 | FIXED-WING AIRCRAFT ANALISYS 2
118
5.3. Conventional ECS Analysis
Pneumatic energy required
Now the pneumatic energy is calculated. This parameter will be used, as an input, over
an engine performance simulation tool. The main purpose of getting this data is to
compare the SFC engine with and without the extraction of this form of energy. The
following table shows the results.
Table 30: Pneumatic power required
Parameter Result
1. Total ECS required Mass flow 0.63 kg/s
2. ECS required Mass flow per
engine 0.315 kg/s
Engine SFC impact
Once the simulation has been carried out, the SFC results are compared. The following
table shows the achieved results.
Table 31: Engine SFC Impact
Parameter Result
1. SFC w/o without ECS 0.223 kg/kWh
2. SFC with conventional ECS 0.253 kg/kWh
3. SFC Increase 13.33%
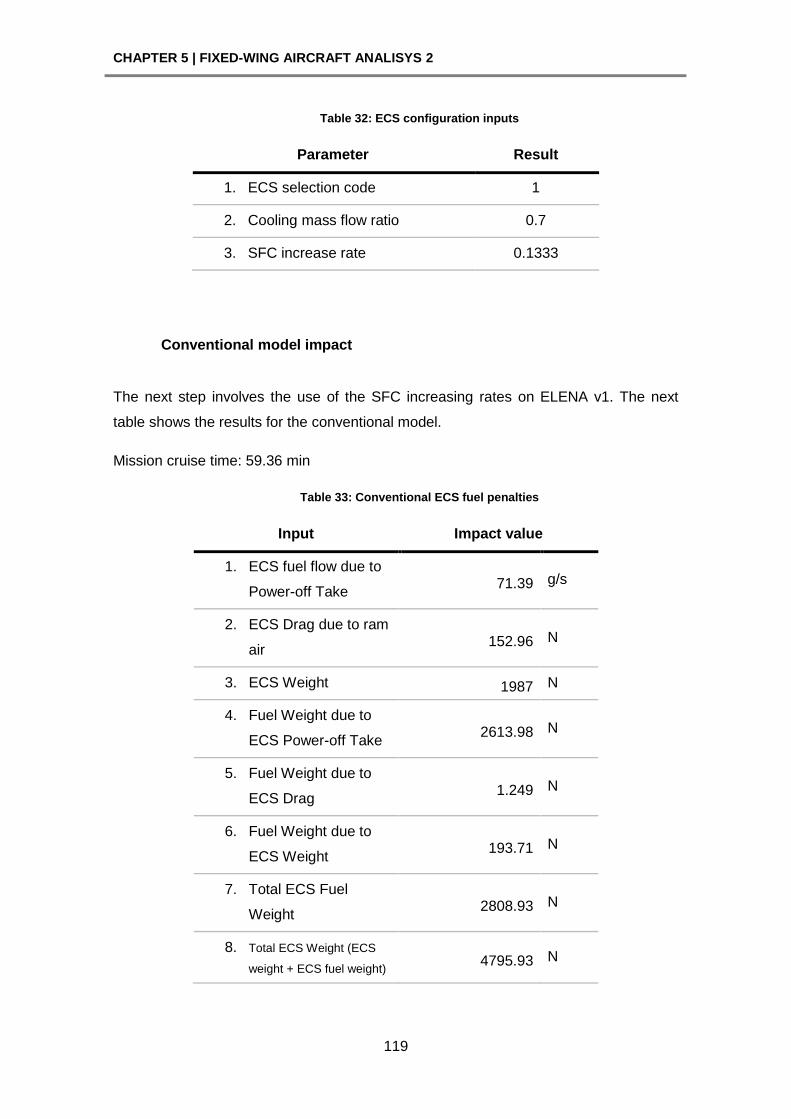
CHAPTER 5 | FIXED-WING AIRCRAFT ANALISYS 2
119
Table 32: ECS configuration inputs
Parameter Result
1. ECS selection code 1
2. Cooling mass flow ratio 0.7
3. SFC increase rate 0.1333
Conventional model impact
The next step involves the use of the SFC increasing rates on ELENA v1. The next
table shows the results for the conventional model.
Mission cruise time: 59.36 min
Table 33: Conventional ECS fuel penalties
Input Impact value
1. ECS fuel flow due to
Power-off Take 71.39 g/s
2. ECS Drag due to ram
air 152.96 N
3. ECS Weight 1987 N
4. Fuel Weight due to
ECS Power-off Take 2613.98 N
5. Fuel Weight due to
ECS Drag 1.249 N
6. Fuel Weight due to
ECS Weight 193.71 N
7. Total ECS Fuel
Weight 2808.93 N
8. Total ECS Weight (ECS
weight + ECS fuel weight) 4795.93 N
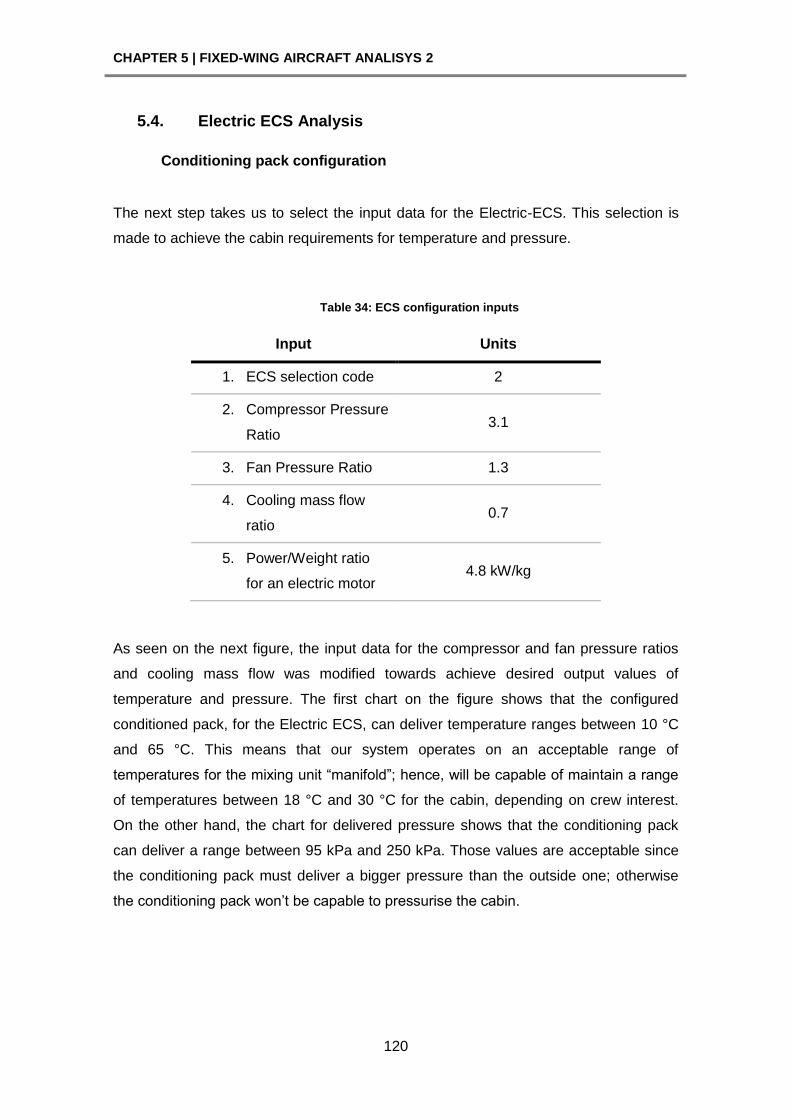
CHAPTER 5 | FIXED-WING AIRCRAFT ANALISYS 2
120
5.4. Electric ECS Analysis
Conditioning pack configuration
The next step takes us to select the input data for the Electric-ECS. This selection is
made to achieve the cabin requirements for temperature and pressure.
Table 34: ECS configuration inputs
Input Units
1. ECS selection code 2
2. Compressor Pressure
Ratio 3.1
3. Fan Pressure Ratio 1.3
4. Cooling mass flow
ratio 0.7
5. Power/Weight ratio
for an electric motor 4.8 kW/kg
As seen on the next figure, the input data for the compressor and fan pressure ratios
and cooling mass flow was modified towards achieve desired output values of
temperature and pressure. The first chart on the figure shows that the configured
conditioned pack, for the Electric ECS, can deliver temperature ranges between 10 °C
and 65 °C. This means that our system operates on an acceptable range of
temperatures for the mixing unit ―manifold‖; hence, will be capable of maintain a range
of temperatures between 18 °C and 30 °C for the cabin, depending on crew interest.
On the other hand, the chart for delivered pressure shows that the conditioning pack
can deliver a range between 95 kPa and 250 kPa. Those values are acceptable since
the conditioning pack must deliver a bigger pressure than the outside one; otherwise
the conditioning pack won’t be capable to pressurise the cabin.
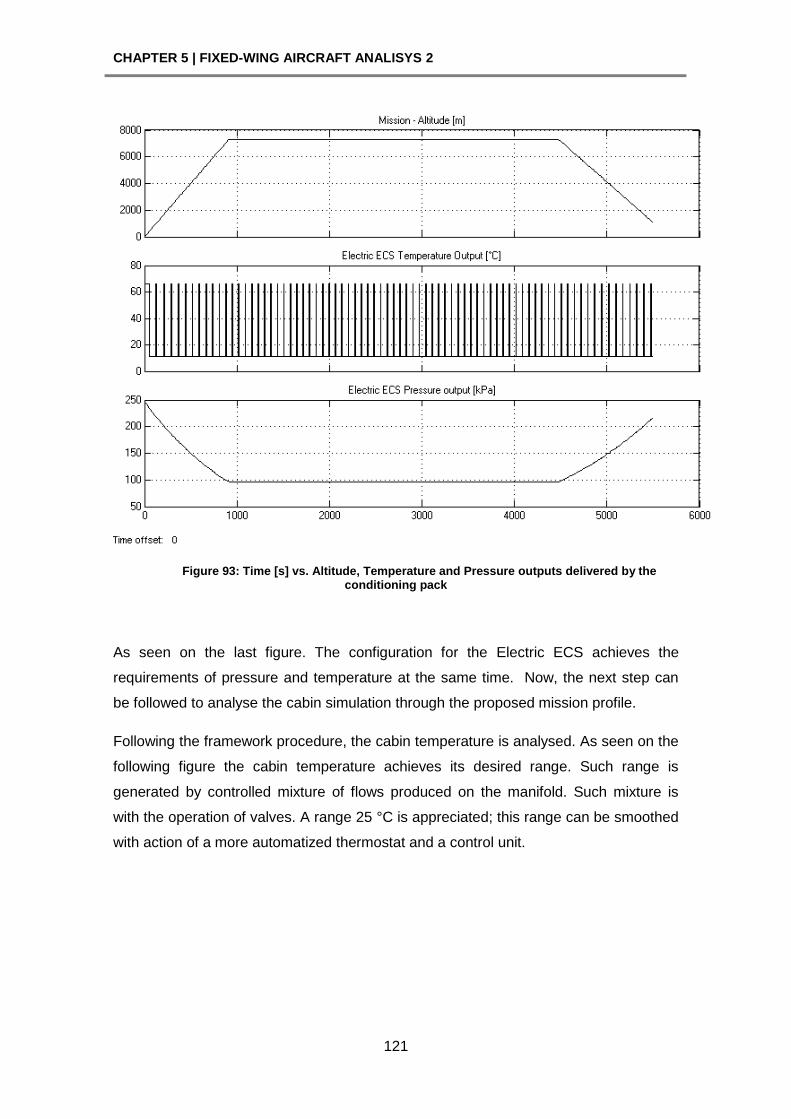
CHAPTER 5 | FIXED-WING AIRCRAFT ANALISYS 2
121
Figure 93: Time [s] vs. Altitude, Temperature and Pressure outputs delivered by the conditioning pack
As seen on the last figure. The configuration for the Electric ECS achieves the
requirements of pressure and temperature at the same time. Now, the next step can
be followed to analyse the cabin simulation through the proposed mission profile.
Following the framework procedure, the cabin temperature is analysed. As seen on the
following figure the cabin temperature achieves its desired range. Such range is
generated by controlled mixture of flows produced on the manifold. Such mixture is
with the operation of valves. A range 25 °C is appreciated; this range can be smoothed
with action of a more automatized thermostat and a control unit.
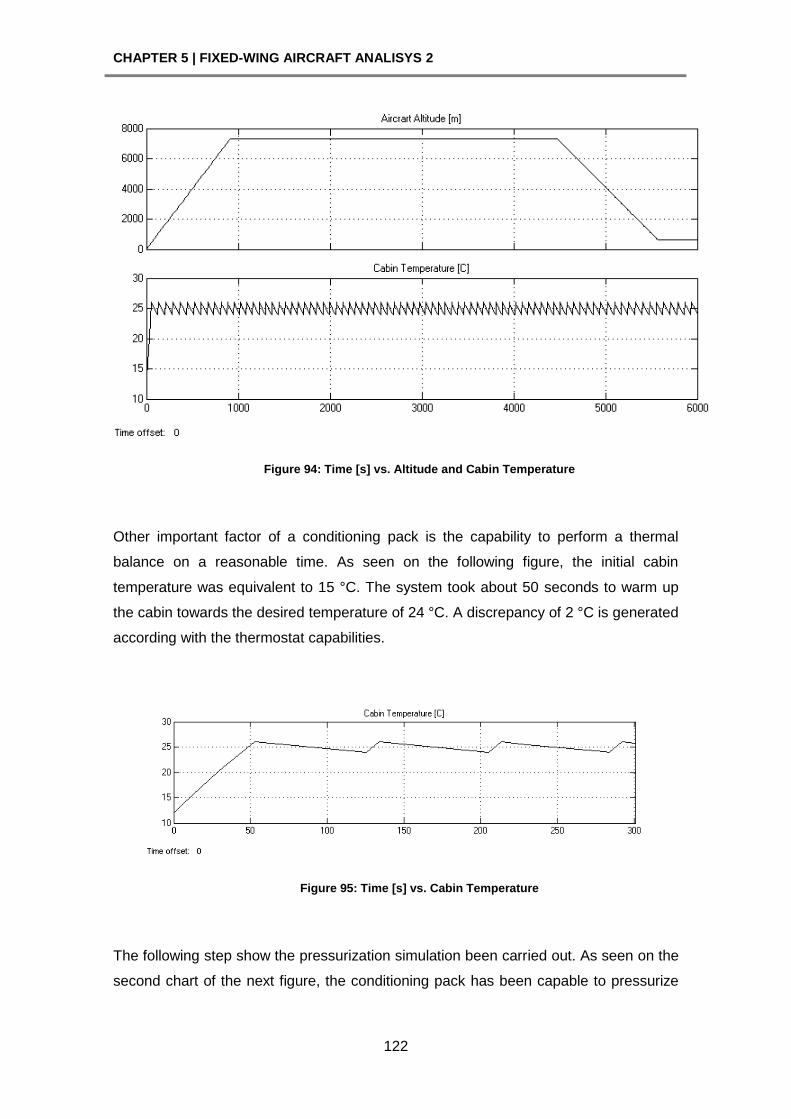
CHAPTER 5 | FIXED-WING AIRCRAFT ANALISYS 2
122
Figure 94: Time [s] vs. Altitude and Cabin Temperature
Other important factor of a conditioning pack is the capability to perform a thermal
balance on a reasonable time. As seen on the following figure, the initial cabin
temperature was equivalent to 15 °C. The system took about 50 seconds to warm up
the cabin towards the desired temperature of 24 °C. A discrepancy of 2 °C is generated
according with the thermostat capabilities.
Figure 95: Time [s] vs. Cabin Temperature
The following step show the pressurization simulation been carried out. As seen on the
second chart of the next figure, the conditioning pack has been capable to pressurize
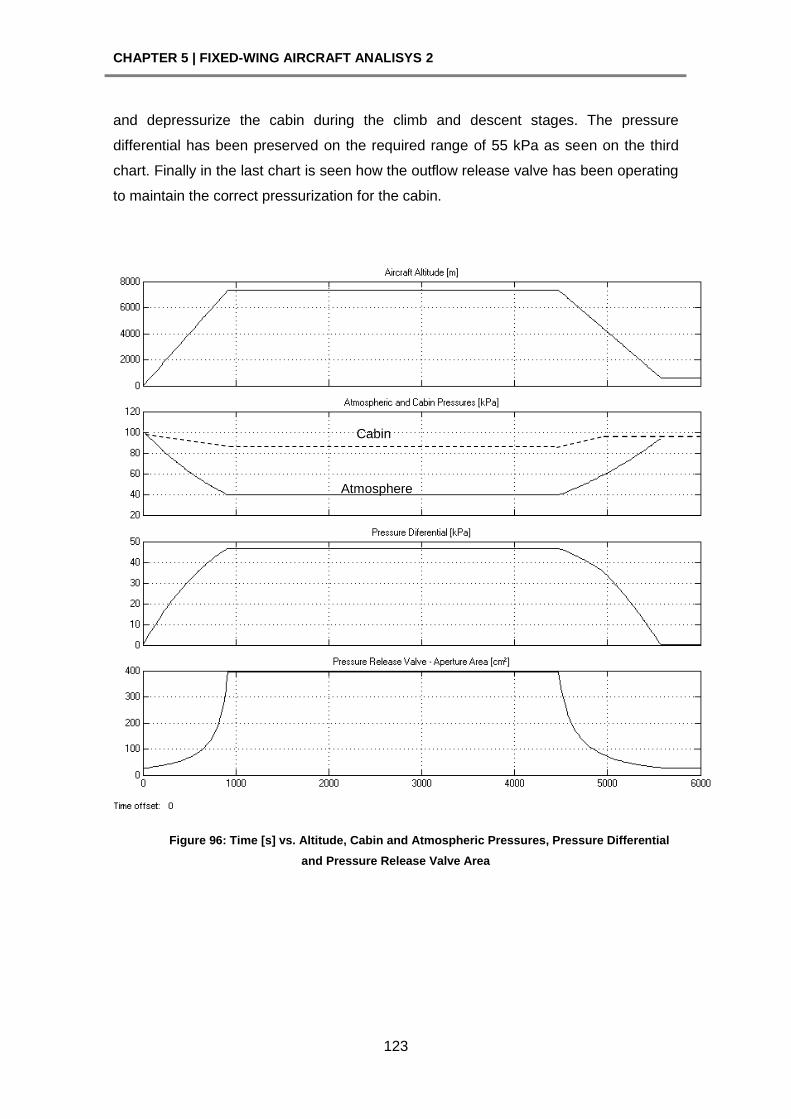
CHAPTER 5 | FIXED-WING AIRCRAFT ANALISYS 2
123
and depressurize the cabin during the climb and descent stages. The pressure
differential has been preserved on the required range of 55 kPa as seen on the third
chart. Finally in the last chart is seen how the outflow release valve has been operating
to maintain the correct pressurization for the cabin.
Figure 96: Time [s] vs. Altitude, Cabin and Atmospheric Pressures, Pressure Differential
and Pressure Release Valve Area
Cabin
Atmosphere
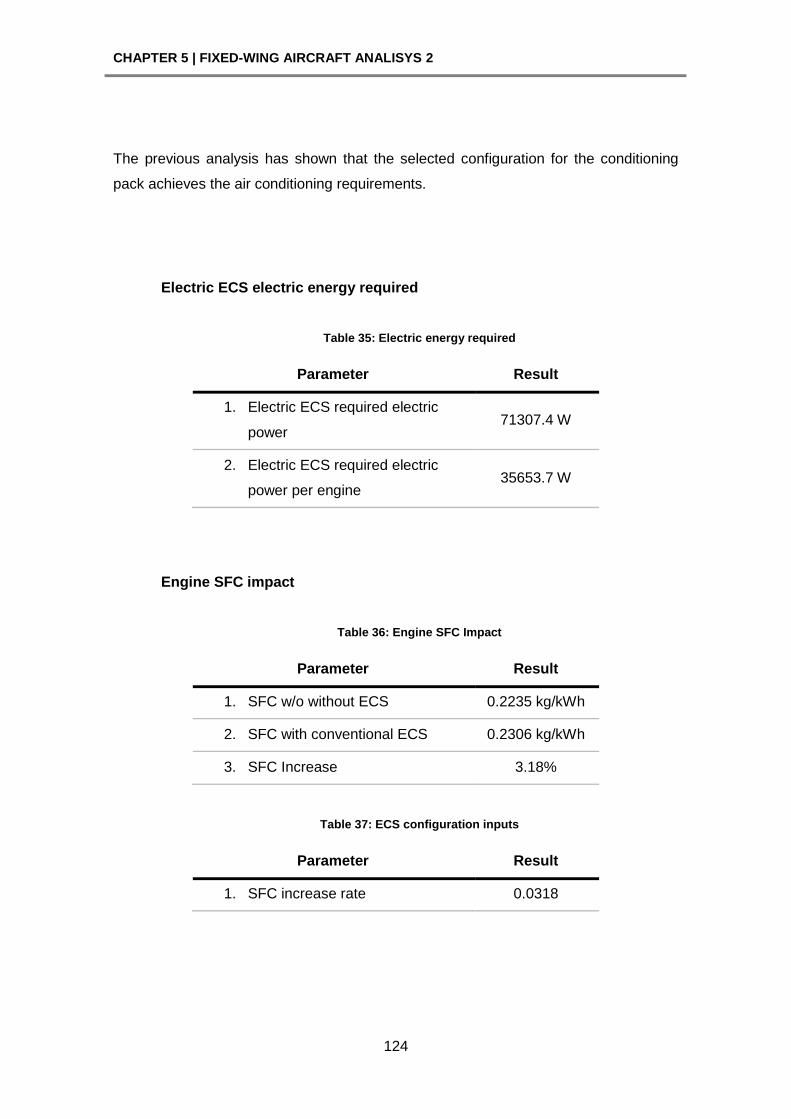
CHAPTER 5 | FIXED-WING AIRCRAFT ANALISYS 2
124
The previous analysis has shown that the selected configuration for the conditioning
pack achieves the air conditioning requirements.
Electric ECS electric energy required
Table 35: Electric energy required
Parameter Result
1. Electric ECS required electric
power 71307.4 W
2. Electric ECS required electric
power per engine 35653.7 W
Engine SFC impact
Table 36: Engine SFC Impact
Parameter Result
1. SFC w/o without ECS 0.2235 kg/kWh
2. SFC with conventional ECS 0.2306 kg/kWh
3. SFC Increase 3.18%
Table 37: ECS configuration inputs
Parameter Result
1. SFC increase rate 0.0318
CHAPTER 5 | FIXED-WING AIRCRAFT ANALISYS 2
125
Electric ECS model impact
Mission cruise time: 59.36 min
Table 38: Electric ECS fuel penalties
Input Impact value
1. ECS fuel flow due to
Power-off Take 17.03 g/s
2. ECS Drag due to ram
air 152.96 N
3. ECS Weight 2280 N
4. Fuel Weight due to
ECS Power-off Take 623.59 N
5. Fuel Weight due to
ECS Drag 1.249 N
6. Fuel Weight due to
ECS Weight 222.31 N
7. Total ECS Fuel
Weight 847.15 N
8. Total ECS Weight (ECS
weight + ECS fuel weight) 3127.15 N
CHAPTER 5 | FIXED-WING AIRCRAFT ANALISYS 2
126
5.5. Results comparison
Table 39: Results comparison for the conventional and electric ECS's
Input Conventional ECS Electric ECS
Difference
Electric to
Conventional
1. ECS fuel flow due
to Power-off Take 71.39 g/s 17.03 g/s -76.15 %
2. ECS Drag due to
ram air 152.96 N 152.96 N 0.00 %
3. ECS Weight 1987 N 2280 N 14.75 %
4. Fuel Weight due to
ECS Power-off
Take
2613.98 N 623.59 N -76.14 %
5. Fuel Weight due to
ECS Drag 1.249 N 1.249 N 0.00 %
6. Fuel Weight due to
ECS Weight 193.71 N 222.31 N 14.76 %
7. Total ECS Fuel
Weight 2808.93 N 847.15 N -69.84 %
8. Total ECS Weight
(ECS weight + ECS
fuel weight)
4795.93 N 3127.15 N -34.80 %
As seen on this final stage of the analysis, the electric ECS has shown a positive
contribution for the aircraft performance; this is related with a decrease in the total
system weight in a 34.80 % over the conventional ECS. Additionally, a further positive
and more significant result was achieved; the total mission fuel weight has been
reduced in 69.84 %. This result has shown a significant reduction on the fuel required
to operate the Electric ECS; consecutively in the costs and the environment al impact.
CHAPTER 5 | FIXED-WING AIRCRAFT ANALISYS 2
127
Uncertainty Analysis
Since the weight estimation used in this analysis has include a new concept due to the
extra electric ECS components; then, a further analysis has been done to find the
spread and the uncertainty value over the total system weight estimation. Therefore,
two additional cases have been carried out; one case considers the ECS weight as
110% over its original value, and the other case considers it as 90%. The following
tables show those results.
Table 40: Results comparison for the conventional and electric ECS's (with the 90 % of the original ECS weight)
Input Conventional ECS Electric ECS
Difference
Electric to
Conventional
1. ECS fuel flow due
to Power-off Take 71.39 g/s 17.03 g/s -76.15 %
2. ECS Drag due to
ram air 152.96 N 152.96 N 0.00 %
3. ECS Weight 1788 N 2052 N 14.77 %
4. Fuel Weight due to
ECS Power-off
Take
2613.98 N 623.59 N -76.14 %
5. Fuel Weight due to
ECS Drag 1.249 N 1.249 N 0.00 %
6. Fuel Weight due to
ECS Weight 174.34 N 200.08 N 14.76 %
7. Total ECS Fuel
Weight 2789.56 N 824.92 N -70.43 %
8. Total ECS Weight
(ECS weight + ECS
fuel weight)
4577.56 N 2876.92 N -37.15 %
CHAPTER 5 | FIXED-WING AIRCRAFT ANALISYS 2
128
Table 41: Results comparison for the conventional and electric ECS's (with the 110 % of the original ECS weight)
Input Conventional ECS Electric ECS
Difference
Electric to
Conventional
1. ECS fuel flow due
to Power-off Take 71.39 g/s 17.03 g/s -76.15 %
2. ECS Drag due to
ram air 152.96 N 152.96 N 0.00 %
3. ECS Weight 2185 N 2508 N 14.78 %
4. Fuel Weight due to
ECS Power-off
Take
2613.98 N 623.59 N -76.14 %
5. Fuel Weight due to
ECS Drag 1.249 N 1.249 N 0.00 %
6. Fuel Weight due to
ECS Weight 213.08 N 244.54 N 14.76 %
7. Total ECS Fuel
Weight 2828.3 N 869.38 N -69.26 %
8. Total ECS Weight
(ECS weight + ECS
fuel weight)
5013.3 N 3377.38 N -32.63 %
The following table shows that for the conventional ECS the spread is of 436 N, which
represents an uncertainty value of 9.1 %. In the case of the electric ECS the spread is
of 500 N, which represents an uncertainty value of 16.0 %.
Total ECS Weight
(ECS weight + ECS
fuel weight)
100% 90% 110%
Spread
[N]
Uncertainty
[%] Value
[N]
Value
[N]
Difference
[%]
Value
[N]
Difference
[%]
Conventional ECS 4796 4578 -4.6 5013 4.5 436 9.1
Electric ECS 3127 2877 -8.0 3377 8.0 500 16.0
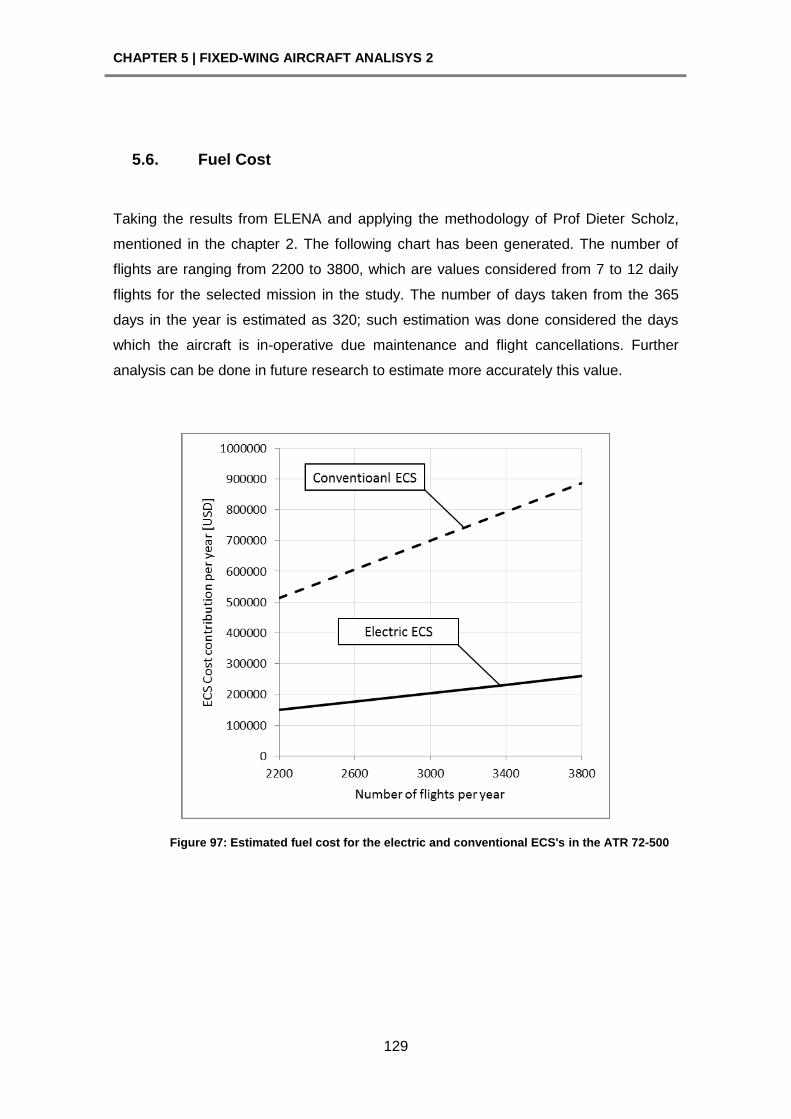
CHAPTER 5 | FIXED-WING AIRCRAFT ANALISYS 2
129
5.6. Fuel Cost
Taking the results from ELENA and applying the methodology of Prof Dieter Scholz,
mentioned in the chapter 2. The following chart has been generated. The number of
flights are ranging from 2200 to 3800, which are values considered from 7 to 12 daily
flights for the selected mission in the study. The number of days taken from the 365
days in the year is estimated as 320; such estimation was done considered the days
which the aircraft is in-operative due maintenance and flight cancellations. Further
analysis can be done in future research to estimate more accurately this value.
Figure 97: Estimated fuel cost for the electric and conventional ECS's in the ATR 72-500

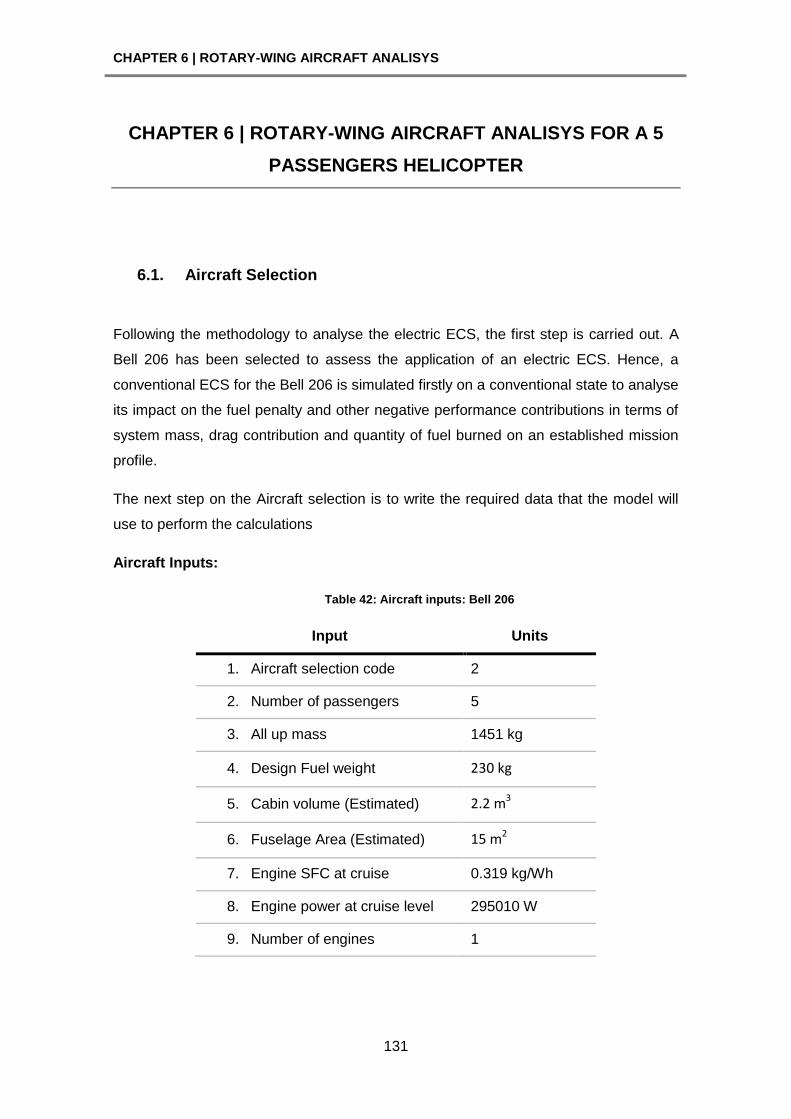
CHAPTER 6 | ROTARY-WING AIRCRAFT ANALISYS
131
CHAPTER 6 | ROTARY-WING AIRCRAFT ANALISYS FOR A 5
PASSENGERS HELICOPTER
6.1. Aircraft Selection
Following the methodology to analyse the electric ECS, the first step is carried out. A
Bell 206 has been selected to assess the application of an electric ECS. Hence, a
conventional ECS for the Bell 206 is simulated firstly on a conventional state to analyse
its impact on the fuel penalty and other negative performance contributions in terms of
system mass, drag contribution and quantity of fuel burned on an established mission
profile.
The next step on the Aircraft selection is to write the required data that the model will
use to perform the calculations
Aircraft Inputs:
Table 42: Aircraft inputs: Bell 206
Input Units
1. Aircraft selection code 2
2. Number of passengers 5
3. All up mass 1451 kg
4. Design Fuel weight 230 kg
5. Cabin volume (Estimated) 2.2 m3
6. Fuselage Area (Estimated) 15 m2
7. Engine SFC at cruise 0.319 kg/Wh
8. Engine power at cruise level 295010 W
9. Number of engines 1
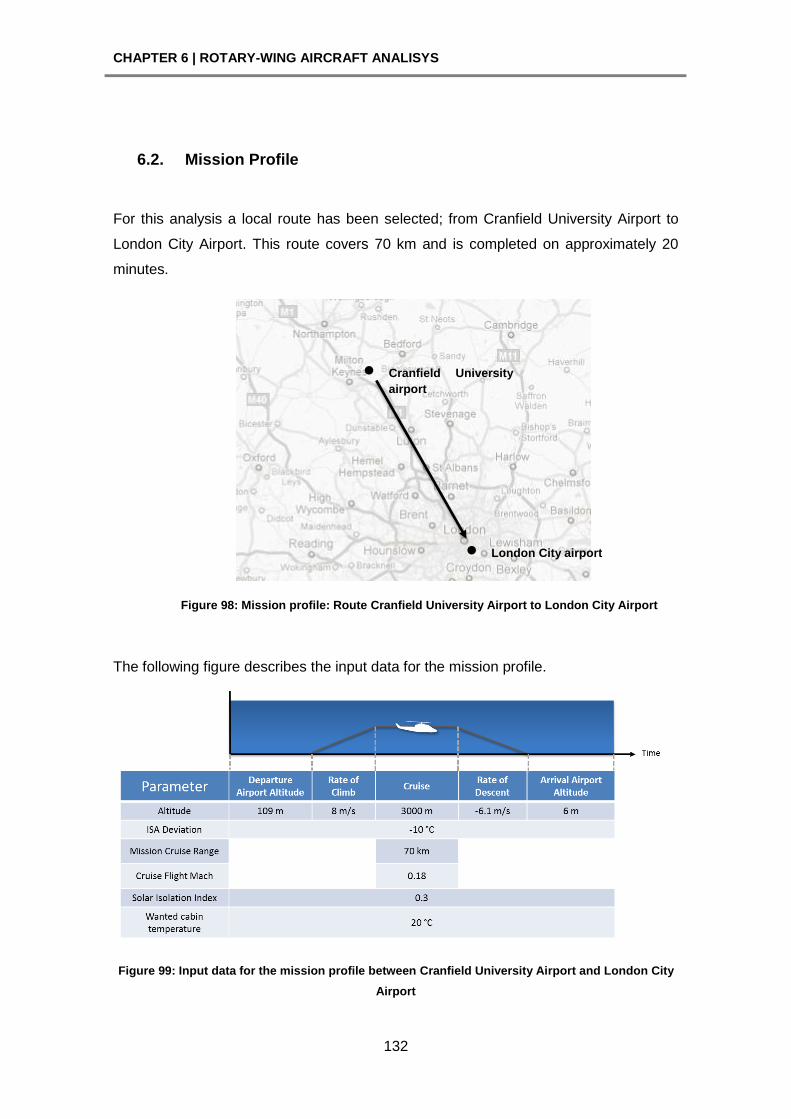
CHAPTER 6 | ROTARY-WING AIRCRAFT ANALISYS
132
6.2. Mission Profile
For this analysis a local route has been selected; from Cranfield University Airport to
London City Airport. This route covers 70 km and is completed on approximately 20
minutes.
Figure 98: Mission profile: Route Cranfield University Airport to London City Airport
The following figure describes the input data for the mission profile.
Figure 99: Input data for the mission profile between Cranfield University Airport and London City
Airport
Cranfield University
airport
London City airport
CHAPTER 6 | ROTARY-WING AIRCRAFT ANALISYS
133
The following table gives a reference for the selected data
Mission Input Units Note
1. Cabin - Wanted temperature 20 °C
The range of temperatures for
operation are between 18 °C
and 28 °C
2. Sun Heating Index 0.3 This index represents a sunny
day with a little few clouds.
3. Isa Deviation -10 °C For a temperature of 5 °C at
the sea level
4. Aircraft cruise altitude 3000 m Typical high cruise level for a
helicopter
5. Flight Mach Number 0.18 Cruise Mach number for the
Bell 206
6. Mission Range 70 km
Between Cranfield University
Airport and London City
Airport
7. Departure airport altitude 109 m Cranfield University Airport
8. Destination airport altitude 6 m London City Airport
9. Rate of Climb 8 m/s Average rate of climb
10. Rate of Descent -6.1 m/s Average rate of descent
6.3. Conventional ECS Analysis
Now the pneumatic energy is calculated. This parameter will be used, as an input, on
an engine performance simulation tool. The main purpose of getting this data is to
compare the SFC engine with and without the extraction of this form of energy.
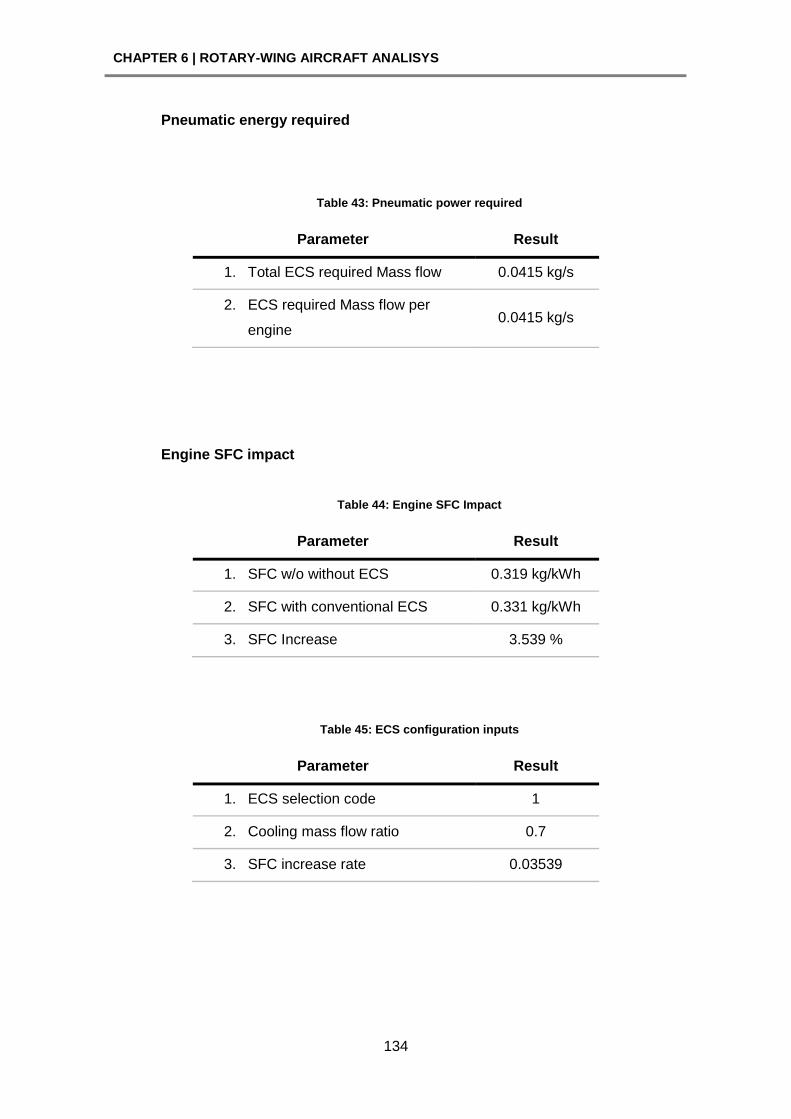
CHAPTER 6 | ROTARY-WING AIRCRAFT ANALISYS
134
Pneumatic energy required
Table 43: Pneumatic power required
Parameter Result
1. Total ECS required Mass flow 0.0415 kg/s
2. ECS required Mass flow per
engine 0.0415 kg/s
Engine SFC impact
Table 44: Engine SFC Impact
Parameter Result
1. SFC w/o without ECS 0.319 kg/kWh
2. SFC with conventional ECS 0.331 kg/kWh
3. SFC Increase 3.539 %
Table 45: ECS configuration inputs
Parameter Result
1. ECS selection code 1
2. Cooling mass flow ratio 0.7
3. SFC increase rate 0.03539
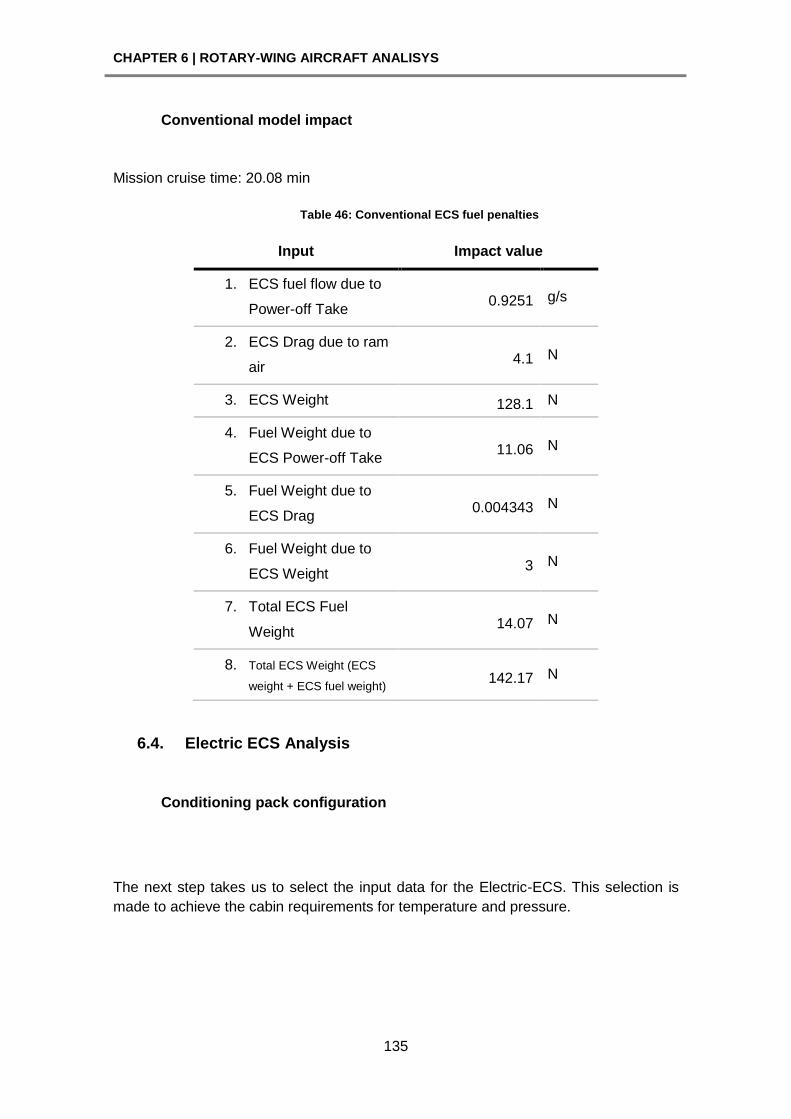
CHAPTER 6 | ROTARY-WING AIRCRAFT ANALISYS
135
Conventional model impact
Mission cruise time: 20.08 min
Table 46: Conventional ECS fuel penalties
Input Impact value
1. ECS fuel flow due to
Power-off Take 0.9251 g/s
2. ECS Drag due to ram
air 4.1 N
3. ECS Weight 128.1 N
4. Fuel Weight due to
ECS Power-off Take 11.06 N
5. Fuel Weight due to
ECS Drag 0.004343 N
6. Fuel Weight due to
ECS Weight 3 N
7. Total ECS Fuel
Weight 14.07 N
8. Total ECS Weight (ECS
weight + ECS fuel weight) 142.17 N
6.4. Electric ECS Analysis
Conditioning pack configuration
The next step takes us to select the input data for the Electric-ECS. This selection is
made to achieve the cabin requirements for temperature and pressure.
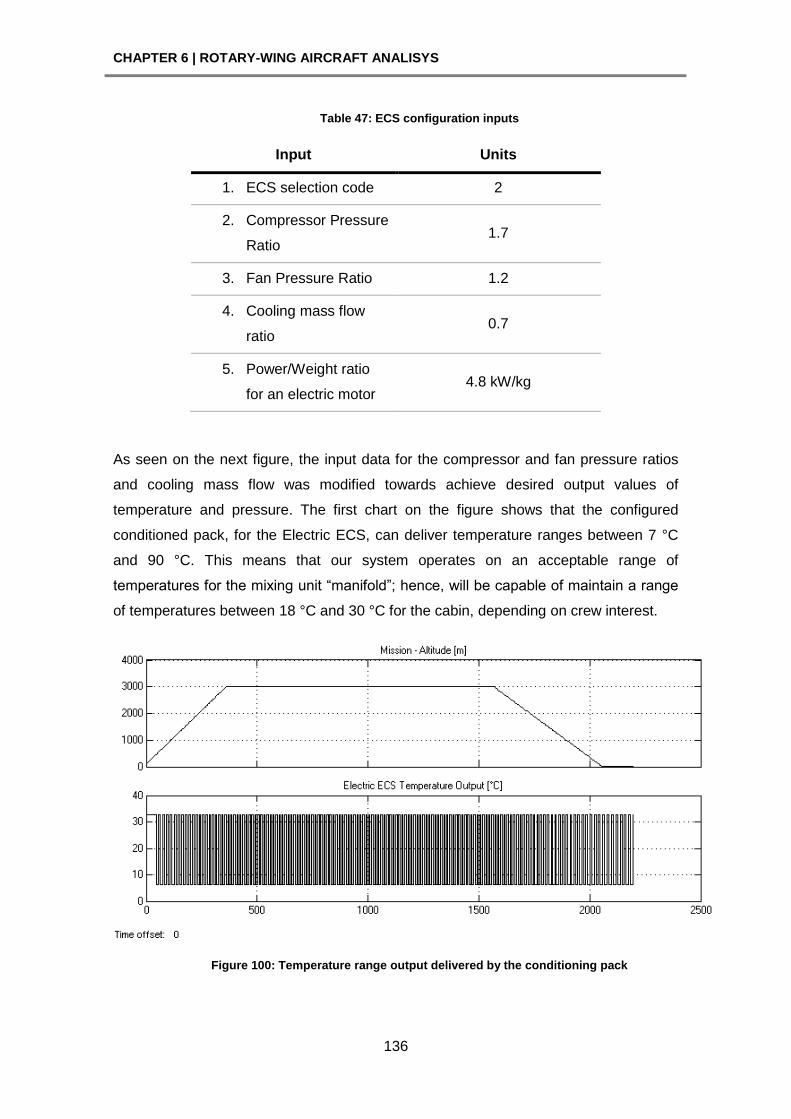
CHAPTER 6 | ROTARY-WING AIRCRAFT ANALISYS
136
Table 47: ECS configuration inputs
Input Units
1. ECS selection code 2
2. Compressor Pressure
Ratio 1.7
3. Fan Pressure Ratio 1.2
4. Cooling mass flow
ratio 0.7
5. Power/Weight ratio
for an electric motor 4.8 kW/kg
As seen on the next figure, the input data for the compressor and fan pressure ratios
and cooling mass flow was modified towards achieve desired output values of
temperature and pressure. The first chart on the figure shows that the configured
conditioned pack, for the Electric ECS, can deliver temperature ranges between 7 °C
and 90 °C. This means that our system operates on an acceptable range of
temperatures for the mixing unit ―manifold‖; hence, will be capable of maintain a range
of temperatures between 18 °C and 30 °C for the cabin, depending on crew interest.
Figure 100: Temperature range output delivered by the conditioning pack
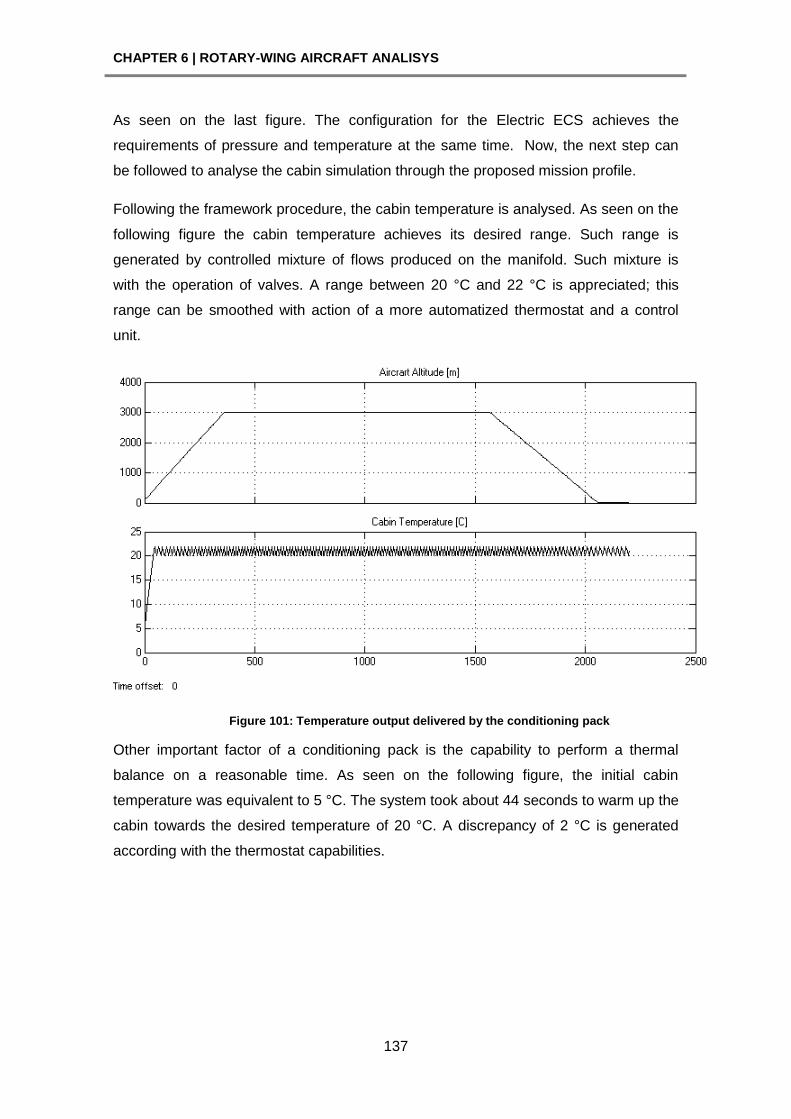
CHAPTER 6 | ROTARY-WING AIRCRAFT ANALISYS
137
As seen on the last figure. The configuration for the Electric ECS achieves the
requirements of pressure and temperature at the same time. Now, the next step can
be followed to analyse the cabin simulation through the proposed mission profile.
Following the framework procedure, the cabin temperature is analysed. As seen on the
following figure the cabin temperature achieves its desired range. Such range is
generated by controlled mixture of flows produced on the manifold. Such mixture is
with the operation of valves. A range between 20 °C and 22 °C is appreciated; this
range can be smoothed with action of a more automatized thermostat and a control
unit.
Figure 101: Temperature output delivered by the conditioning pack
Other important factor of a conditioning pack is the capability to perform a thermal
balance on a reasonable time. As seen on the following figure, the initial cabin
temperature was equivalent to 5 °C. The system took about 44 seconds to warm up the
cabin towards the desired temperature of 20 °C. A discrepancy of 2 °C is generated
according with the thermostat capabilities.
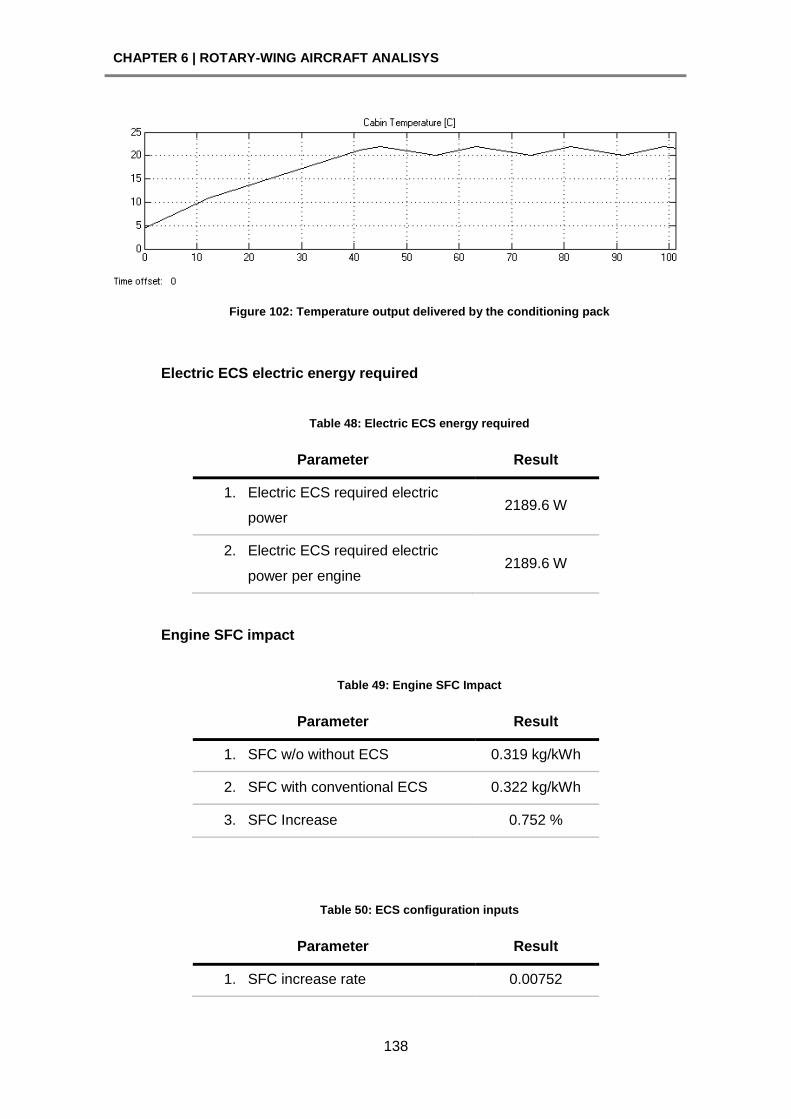
CHAPTER 6 | ROTARY-WING AIRCRAFT ANALISYS
138
Figure 102: Temperature output delivered by the conditioning pack
Electric ECS electric energy required
Table 48: Electric ECS energy required
Parameter Result
1. Electric ECS required electric
power 2189.6 W
2. Electric ECS required electric
power per engine 2189.6 W
Engine SFC impact
Table 49: Engine SFC Impact
Parameter Result
1. SFC w/o without ECS 0.319 kg/kWh
2. SFC with conventional ECS 0.322 kg/kWh
3. SFC Increase 0.752 %
Table 50: ECS configuration inputs
Parameter Result
1. SFC increase rate 0.00752
CHAPTER 6 | ROTARY-WING AIRCRAFT ANALISYS
139
Electric ECS model impact
Mission cruise time: 20.08 min
Table 51: Electric ECS fuel penalties
Input Impact value
1. ECS fuel flow due to
Power-off Take 0.1966 g/s
2. ECS Drag due to ram
air 4.1 N
3. ECS Weight 137.2 N
4. Fuel Weight due to
ECS Power-off Take 2.35 N
5. Fuel Weight due to
ECS Drag 0.004343 N
6. Fuel Weight due to
ECS Weight 3.22 N
7. Total ECS Fuel
Weight 5.57 N
8. Total ECS Weight (ECS
weight + ECS fuel weight) 142.77 N
6.5. Combustion heater
The Environmental Control System of a helicopter is simulated, using the previous
version tool, to obtain its energy consumption; consequently the energy is analysed
in terms fuel flow under certain components configuration and a fixed operational
point. The simulation is carried out under low fidelity conditions for combustion
heater conditioning system.
CHAPTER 6 | ROTARY-WING AIRCRAFT ANALISYS
140
Table 52: Combustion Heater requirements
Parameter Value Note
Number of
Passengers 5 Bell 206
CS29 Air Flow per
Passenger 0.0083 kg/s
Although the CS29 establish 0.00645kg/s, some
literature establishes 0.0083kg/s for design
purposes.
Heat Load per
Passenger 110W
This is an average taking form the heat load
produced by passengers and crew members
which is 70W and 650W respectively. This
average is considered as the best option for a
helicopter.
10 m² Assumed for a small helicopter
Cabin Skin Heat
Conductivity 1.4 W/m²K For a normal material.
Cabin Volume 2.26 m³ Bell 206 Estimated
Heating mission Scenario with Combustion Heater
Only a heating capability can be carried out in this scenario, thus cold ambient
conditions are set.
Table 53: Combustion Heater requirements
Parameter Value Note
Temperature of the
cabin 5°C Assumed
Solar Radiation 0W/m2 For a night conditions
ISA Deviation -20°C For winter conditions
Altitude [0m -
11000m] 3000 Performing a cruise flight
CHAPTER 6 | ROTARY-WING AIRCRAFT ANALISYS
141
Table 54: Combustion Heater results
Parameter Results
1. Combustion heater fuel flow 0.3327 g/s
2. Electric power 727.4 W
6.6. Results comparison
Table 55: Results comparison for the conventional and electric ECS's
Input Conventional ECS Electric ECS
Difference
Electric to
Conventional
1. ECS fuel flow due
to Power-off Take 0.9251 g/s 0.1966 g/s -78.75 %
2. ECS Drag due to
ram air 4.1 N 4.1 N 0.00 %
3. ECS Weight 128.1 N 137.2 N 7.10 %
4. Fuel Weight due to
ECS Power-off
Take
11.06 N 2.35 N -78.75 %
5. Fuel Weight due to
ECS Drag 0.004343 N 0.004343 N 0.00 %
6. Fuel Weight due to
ECS Weight 3 N 3.22 N 7.33 %
7. Total ECS Fuel
Weight 14.07 N 5.57 N -60.41 %
8. Total ECS Weight
(ECS weight + ECS
fuel weight)
142.17 N 142.77 N 0.42 %
As seen on this final stage of the analysis, the electric ECS has shown a negative
contribution for the aircraft performance; this is related with an increase in the total
system weight in a 0.42 % over the conventional ECS. In spite of this negative result a
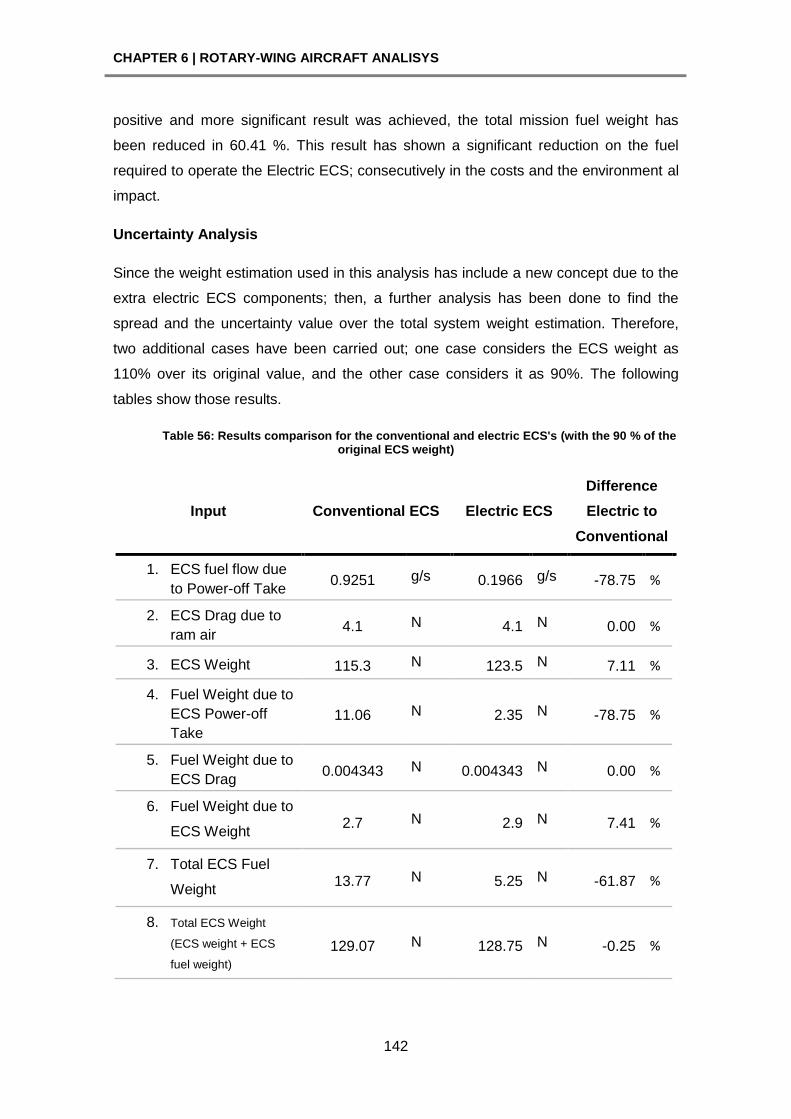
CHAPTER 6 | ROTARY-WING AIRCRAFT ANALISYS
142
positive and more significant result was achieved, the total mission fuel weight has
been reduced in 60.41 %. This result has shown a significant reduction on the fuel
required to operate the Electric ECS; consecutively in the costs and the environment al
impact.
Uncertainty Analysis
Since the weight estimation used in this analysis has include a new concept due to the
extra electric ECS components; then, a further analysis has been done to find the
spread and the uncertainty value over the total system weight estimation. Therefore,
two additional cases have been carried out; one case considers the ECS weight as
110% over its original value, and the other case considers it as 90%. The following
tables show those results.
Table 56: Results comparison for the conventional and electric ECS's (with the 90 % of the original ECS weight)
Input Conventional ECS Electric ECS
Difference
Electric to
Conventional
1. ECS fuel flow due
to Power-off Take 0.9251 g/s 0.1966 g/s -78.75 %
2. ECS Drag due to
ram air 4.1 N 4.1 N 0.00 %
3. ECS Weight 115.3 N 123.5 N 7.11 %
4. Fuel Weight due to
ECS Power-off
Take
11.06 N 2.35 N -78.75 %
5. Fuel Weight due to
ECS Drag 0.004343 N 0.004343 N 0.00 %
6. Fuel Weight due to
ECS Weight 2.7 N 2.9 N 7.41 %
7. Total ECS Fuel
Weight 13.77 N 5.25 N -61.87 %
8. Total ECS Weight
(ECS weight + ECS
fuel weight)
129.07 N 128.75 N -0.25 %
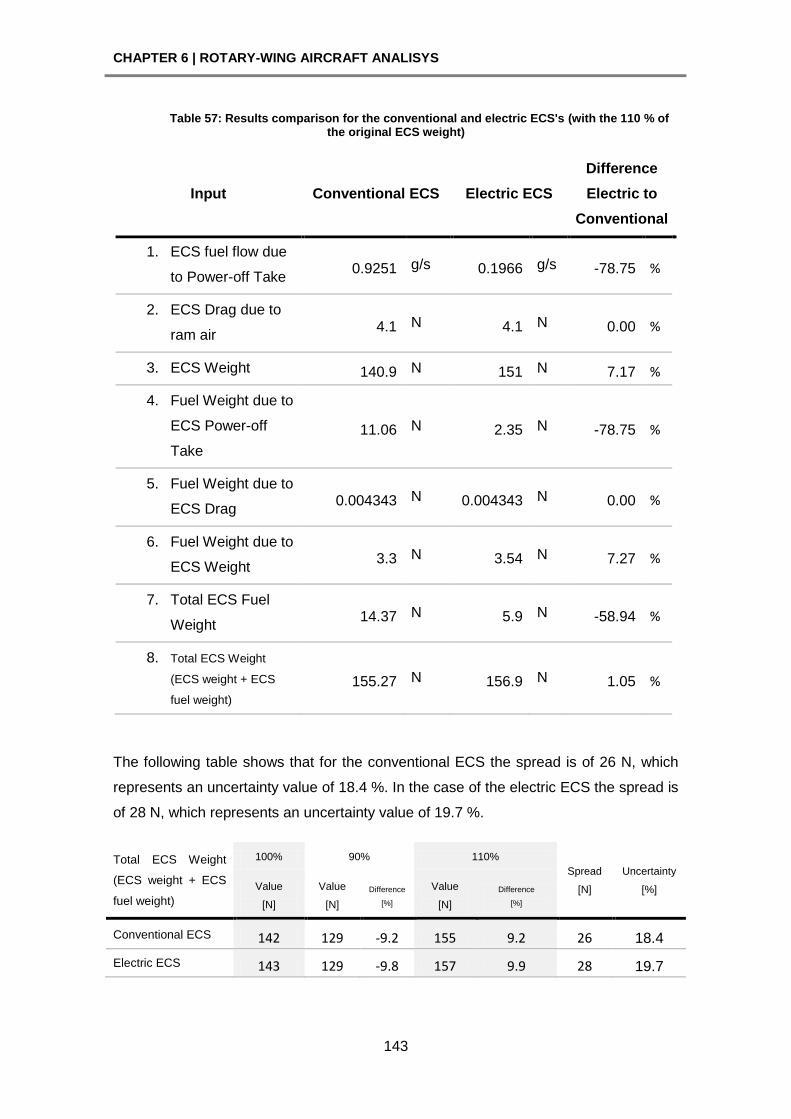
CHAPTER 6 | ROTARY-WING AIRCRAFT ANALISYS
143
Table 57: Results comparison for the conventional and electric ECS's (with the 110 % of the original ECS weight)
Input Conventional ECS Electric ECS
Difference
Electric to
Conventional
1. ECS fuel flow due
to Power-off Take 0.9251 g/s 0.1966 g/s -78.75 %
2. ECS Drag due to
ram air 4.1 N 4.1 N 0.00 %
3. ECS Weight 140.9 N 151 N 7.17 %
4. Fuel Weight due to
ECS Power-off
Take
11.06 N 2.35 N -78.75 %
5. Fuel Weight due to
ECS Drag 0.004343 N 0.004343 N 0.00 %
6. Fuel Weight due to
ECS Weight 3.3 N 3.54 N 7.27 %
7. Total ECS Fuel
Weight 14.37 N 5.9 N -58.94 %
8. Total ECS Weight
(ECS weight + ECS
fuel weight)
155.27 N 156.9 N 1.05 %
The following table shows that for the conventional ECS the spread is of 26 N, which
represents an uncertainty value of 18.4 %. In the case of the electric ECS the spread is
of 28 N, which represents an uncertainty value of 19.7 %.
Total ECS Weight
(ECS weight + ECS
fuel weight)
100% 90% 110%
Spread
[N]
Uncertainty
[%] Value
[N]
Value
[N]
Difference
[%]
Value
[N]
Difference
[%]
Conventional ECS 142 129 -9.2 155 9.2 26 18.4
Electric ECS 143 129 -9.8 157 9.9 28 19.7
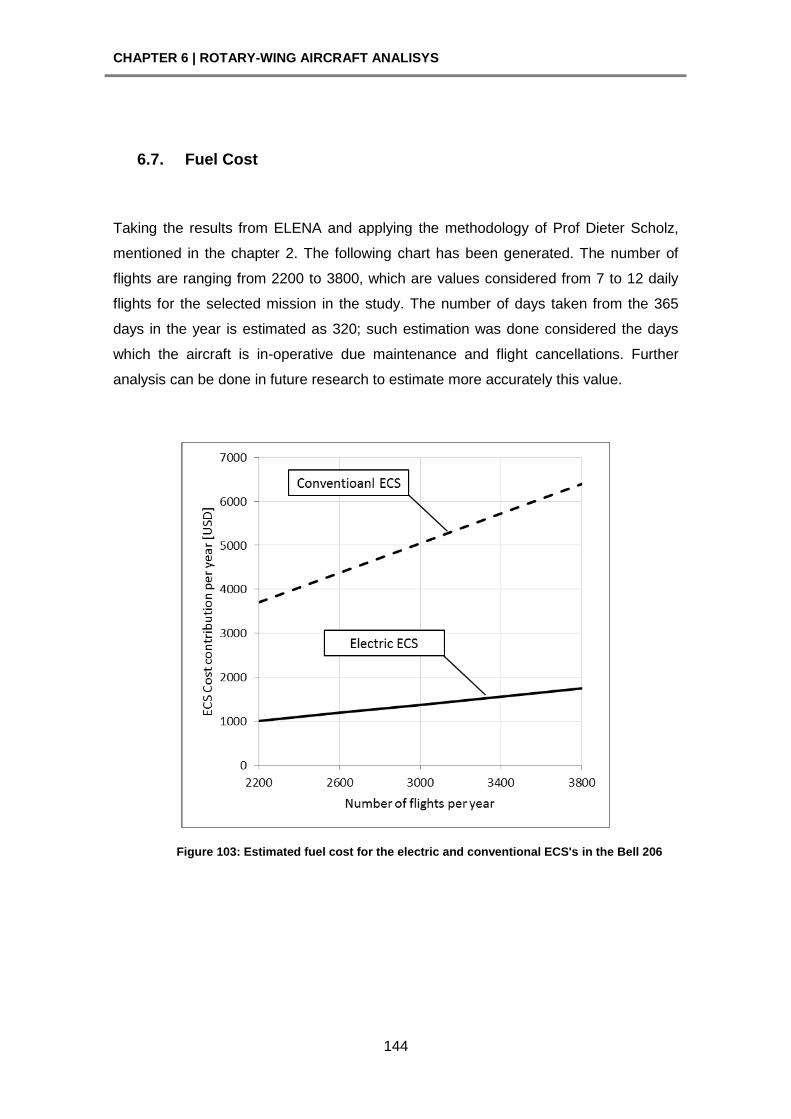
CHAPTER 6 | ROTARY-WING AIRCRAFT ANALISYS
144
6.7. Fuel Cost
Taking the results from ELENA and applying the methodology of Prof Dieter Scholz,
mentioned in the chapter 2. The following chart has been generated. The number of
flights are ranging from 2200 to 3800, which are values considered from 7 to 12 daily
flights for the selected mission in the study. The number of days taken from the 365
days in the year is estimated as 320; such estimation was done considered the days
which the aircraft is in-operative due maintenance and flight cancellations. Further
analysis can be done in future research to estimate more accurately this value.
Figure 103: Estimated fuel cost for the electric and conventional ECS's in the Bell 206
CHAPTER 7 | CONCLUSIONS
145
CHAPTER 7 | CONCLUSIONS
Generally speaking; the Electric ECS has shown a reduction from 51.2% up to 72.76%
for the total fuel penalties. The lower reduction was achieved for the Airbus A321-200.
The bigger reduction was achieved for the ATR 72-500 and Bell 206. This considerable
reduction for the system has shown that the amount of energy to run a system is
considerable bigger when is extracted as pneumatic instead of electric. In the case of
the ATR 72-500 and the Bell 206, the benefit has been better due to turboshaft/prop
engines lose more net shaft power when power-off take is pneumatic, in comparison
with turbojet engines.
This conclusion shows that the energy losses are lower when a thermodynamic
process is made by action of the thermoelectric effect, rather than when is made by
action of the convection principle.
As seen in the tables, 18, 31 and 44; the average increment on the SFC, due to
conventional ECS power extraction was 7.14 %; for the three aircraft object of study. In
the case of the Airbus A321-200, this increase was 3.83%. This increment gives a
reliable capability to the process used in ELENA, since the real [2]ECS power
consumption is ranging from 3 to 5 %. In the case of the Electric ECS, this value
average increase of SCF was 1.56%.
A negative contribution that this research has shown is the impact on the system
weight, being higher than the conventional system. This result is achieved due to the
additional components, mainly the electric motors and compressors. For the case of
the extra wiring required to provide electrical power to the Electric ECS, there is not
considerable contribution because the lack of pipelines from the engine counteracts
with this negative contribution.
In spite of this negative impact produced by an Electric-ECS weight, the improvement
in the reduction of the total fuel penalties has been quantitatively better. Therefore, this
research shows that the application of an Electric ECS has reached the main goal,
towards a reduction on the system energy consumption.
Speaking about reliability in the results and the model ELENA, the overall validation
process, presented in the section 3.11, has shown acceptable values through each
characteristic that contributes towards the final analysis: the mission profile, ECS
CHAPTER 7 | CONCLUSIONS
146
conventional power consumption, Electric ECS power consumption, thermodynamic
balance, pressurization and fuel penalties.
The use of Simulink® for this study has shown very powerful capabilities to design and
simulate the ECS. Among those capabilities, the graphical block diagramming tool and
the customizable set of block libraries are the most highlighted characteristics. The
graphical block diagramming tool makes the programming easier to understand since
each calculation step is built up through diagram connections. On the other hand the
block libraries offer a wide range of possibilities to read inputs, interconnect
calculations and generate results.
As seen on previous scenarios; for an Air Cycle Machine the cooling requires more
bleed air taken from the engine. This fact shows that the cooling process is the major
energy consumer.
This research has shown that when configuring a conditioning pack, the most critical
parameters that defined the energy consumption were the pressure ratios and the flow
amount relations. As seen, when increased the compressor pressure ratio for the ram
air, the flow temperature and pressure increased subsequently; becoming more difficult
the capacity of the air cycle machine to provide a cold flow. On the other hand, when
decreasing this value, the capability to produce enough pressure for the pressurization
is reduced.
Aiming to achieve better cabin requirements, the Air Cycle Machine response results
can be improved with the implementation of two heat exchangers instead of one. More
system weight and electric power consumption must be considered, but it is estimated
that the final energy penalties will not be higher than a conventional ECS.
CHAPTER 8 | RECOMMENDATIONS FOR FUTURE WORK
147
CHAPTER 8 | RECOMMENDATIONS FOR FUTURE WORK
The model is a powerful tool which can be used for further and more detailed analysis
through the implementation of more components; such components can include more
automatized processes, and more detailed parametric studies.
The automation of processes can improve the data reading for automatic control. As an
example; the model can perform a better flow mixture on the manifold section to
perform a smoother temperature control into the cabin.
On the other hand a more detailed parametric study can achieve more improvement on
the final energy consumption. As seen on the research, the most important parameters
to select the configuration for the Electric ECS were the compressor pressure ratio for
the ram air, the fan compressor ratio for the cooling flow and the ram-cooling flows
ratio. A methodology on a better parametric study at this stage should achieve better
parameters which would achieve less electric energy requirement; subsequently, less
mass contribution due to smaller electric motors.

149
REFERENCES
1. Clean Sky JTI (Joint Technology Initiative). [Online] [Cited: 15 September 2011.]
http://www.cleansky.eu/.
2. Martínez, Isidoro. Aircraft Environmental Control. [Online] [Cited: 29 11 2011.]
http://webserver.dmt.upm.es/~isidoro/.
3. Neese, Bill. Aircraft Environmental Systems. Casper : Endeavor Books, 1999.
4. Moir, Ian and Seabridge, Allan. Aircraft Systems: Mechanical, Electrical, and
Avionics Subsystems Integration. The Atrium : John Wiley & Sons, Ltd, 2008.
5. Mannini, Achille. Vapor Cycle Versus Air Cycle Environmental Control System
Selection Criteria on Modern Helicopters . s.l. : NLR, 1994.
6. Garrett, D. F. Aircraft Systems and Components. s.l. : IAP, 1992.
7. Jane's Helicopter Markets and Systems. s.l. : Janes' Information Group.
8. Certification Specifications for Large Aeroplanes CS25: Annex to ED Decision
2010/005/R. s.l. : European Aviation Safety Agency, 5 August 2010.
9. Certification Specifications for Large Rotorcraft CS29: Annex to ED Desicion
2008/010/R. s.l. : European Aviation Safety Agency, 17 November 2008.
10. Walsh, Philip P. and Fletcher, Paul. Gas Turbine Performance. Oxford : Blackwell
Science Ltd, 2004.
11. Lawson, Dr Craig. Analisys of the Fuel Penalties of Airframe Systems AVD 0503.
s.l. : Cranfield University, 2011.
12. Martínez, Isidro. Aircraft Environmental Control. [Online] [Cited: 7 July 2011.]
http://webserver.dmt.upm.es/~isidoro/.
13. Aerospace Information Report: Aircraft Fuel Penalty Due to Air Conditioning. s.l. :
SAE, 1989.
14. A Method to Evaluate Aircraft Systems. Scholz, Dieter. 1998.
15. IATA. [Online] [Cited: 01 12 2011.]
http://www.iata.org/whatwedo/economics/fuel_monitor/Pages/index.aspx.
16. ATR72-500. [Online] [Cited: 29 11 2011.] http://www.atraircraft.com/products/atr-
72-500.html.

151
BIBLIOGRAPHY
1. Clean Sky JTI (Joint Technology Initiative). [Online] [Cited: 15 September 2011.]
http://www.cleansky.eu/.
2. Martínez, Isidoro. Aircraft Environmental Control. [Online] [Cited: 29 11 2011.]
http://webserver.dmt.upm.es/~isidoro/.
3. Neese, Bill. Aircraft Environmental Systems. Casper : Endeavor Books, 1999.
4. Moir, Ian and Seabridge, Allan. Aircraft Systems: Mechanical, Electrical, and
Avionics Subsystems Integration. The Atrium : John Wiley & Sons, Ltd, 2008.
5. Mannini, Achille. Vapor Cycle Versus Air Cycle Environmental Control System
Selection Criteria on Modern Helicopters . s.l. : NLR, 1994.
6. Garrett, D. F. Aircraft Systems and Components. s.l. : IAP, 1992.
7. Jane's Helicopter Markets and Systems. s.l. : Janes' Information Group.
8. Certification Specifications for Large Aeroplanes CS25: Annex to ED Decision
2010/005/R. s.l. : European Aviation Safety Agency, 5 August 2010.
9. Certification Specifications for Large Rotorcraft CS29: Annex to ED Desicion
2008/010/R. s.l. : European Aviation Safety Agency, 17 November 2008.
10. Walsh, Philip P. and Fletcher, Paul. Gas Turbine Performance. Oxford : Blackwell
Science Ltd, 2004.
11. Lawson, Dr Craig. Analisys of the Fuel Penalties of Airframe Systems AVD 0503.
s.l. : Cranfield University, 2011.
12. Martínez, Isidro. Aircraft Environmental Control. [Online] [Cited: 7 July 2011.]
http://webserver.dmt.upm.es/~isidoro/.
13. Aerospace Information Report: Aircraft Fuel Penalty Due to Air Conditioning. s.l. :
SAE, 1989.
14. A Method to Evaluate Aircraft Systems. Scholz, Dieter. 1998.
15. IATA. [Online] [Cited: 01 12 2011.]
http://www.iata.org/whatwedo/economics/fuel_monitor/Pages/index.aspx.
16. ATR72-500. [Online] [Cited: 29 11 2011.] http://www.atraircraft.com/products/atr-
72-500.html.
17. University, Cranfield. The Turbomatch Scheme. 1999.
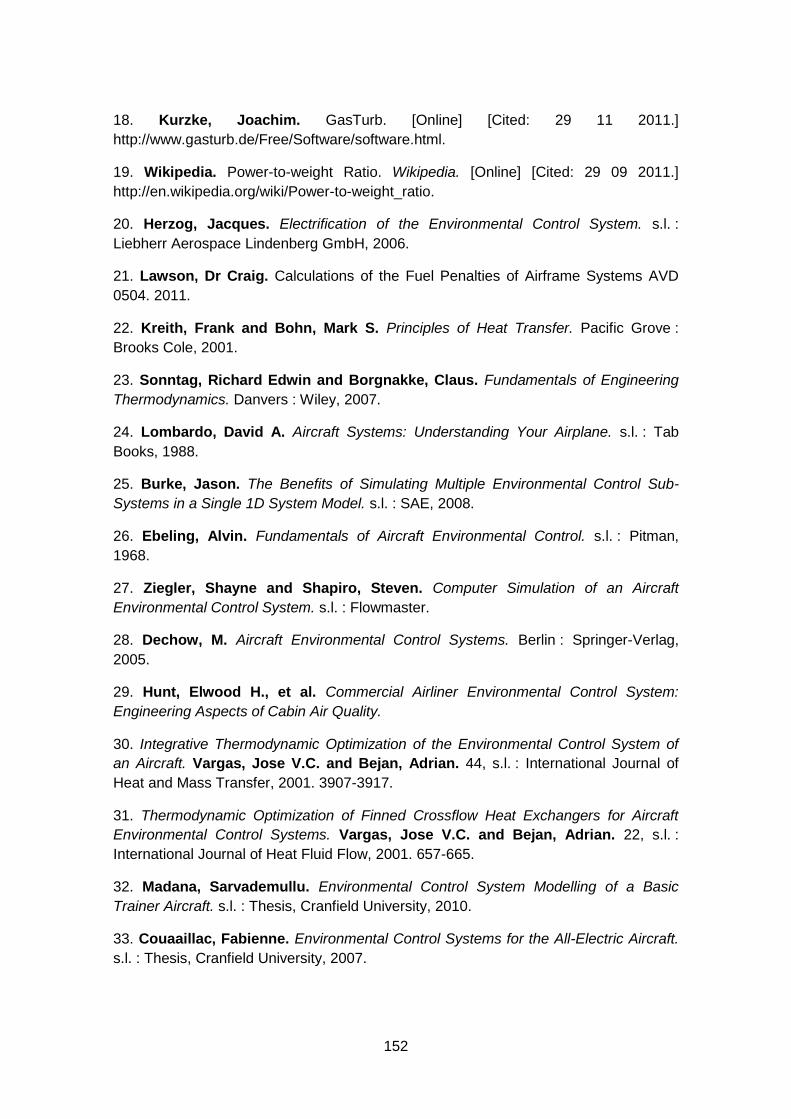
152
18. Kurzke, Joachim. GasTurb. [Online] [Cited: 29 11 2011.]
http://www.gasturb.de/Free/Software/software.html.
19. Wikipedia. Power-to-weight Ratio. Wikipedia. [Online] [Cited: 29 09 2011.]
http://en.wikipedia.org/wiki/Power-to-weight_ratio.
20. Herzog, Jacques. Electrification of the Environmental Control System. s.l. :
Liebherr Aerospace Lindenberg GmbH, 2006.
21. Lawson, Dr Craig. Calculations of the Fuel Penalties of Airframe Systems AVD
0504. 2011.
22. Kreith, Frank and Bohn, Mark S. Principles of Heat Transfer. Pacific Grove :
Brooks Cole, 2001.
23. Sonntag, Richard Edwin and Borgnakke, Claus. Fundamentals of Engineering
Thermodynamics. Danvers : Wiley, 2007.
24. Lombardo, David A. Aircraft Systems: Understanding Your Airplane. s.l. : Tab
Books, 1988.
25. Burke, Jason. The Benefits of Simulating Multiple Environmental Control Sub-
Systems in a Single 1D System Model. s.l. : SAE, 2008.
26. Ebeling, Alvin. Fundamentals of Aircraft Environmental Control. s.l. : Pitman,
1968.
27. Ziegler, Shayne and Shapiro, Steven. Computer Simulation of an Aircraft
Environmental Control System. s.l. : Flowmaster.
28. Dechow, M. Aircraft Environmental Control Systems. Berlin : Springer-Verlag,
2005.
29. Hunt, Elwood H., et al. Commercial Airliner Environmental Control System:
Engineering Aspects of Cabin Air Quality.
30. Integrative Thermodynamic Optimization of the Environmental Control System of
an Aircraft. Vargas, Jose V.C. and Bejan, Adrian. 44, s.l. : International Journal of
Heat and Mass Transfer, 2001. 3907-3917.
31. Thermodynamic Optimization of Finned Crossflow Heat Exchangers for Aircraft
Environmental Control Systems. Vargas, Jose V.C. and Bejan, Adrian. 22, s.l. :
International Journal of Heat Fluid Flow, 2001. 657-665.
32. Madana, Sarvademullu. Environmental Control System Modelling of a Basic
Trainer Aircraft. s.l. : Thesis, Cranfield University, 2010.
33. Couaaillac, Fabienne. Environmental Control Systems for the All-Electric Aircraft.
s.l. : Thesis, Cranfield University, 2007.

153
34. Tang, Chuanjun. Environmental Control System for All Electric Aircraft Flying
Crane. s.l. : Thesis, Cranfield University, 2011.
35. Still, E.W. Into Thin Air. Yeovil, England : Normalair Ltd., 1957.
36. Normalair. Toronto : Normalair Ltd., 1962.
37. Aerospace Environmental Systems. San Diego, CA : SAE, 1986.
38. Aerospace Recommended Practice: Aircraft Cabin Pressurization Criteria. s.l. :
SAE, 1976.
39. Thermofluid Mechanics and Energy: Power Station Cycles. Milton Keynes : The
Open University Press, 1982.
40. Air Conditioning Considerations for Turboprop Commuter and Business Aircraft.
Semsroth, Howard R. and Kinsell, Robert C.
41. Minimum power requirement for environmental control of aircraft. Vargas, Jose
V.C. and Bejan, Adrian. 28, s.l. : Elsevier, 2001. 1183–1202.
42. Bykov, L.T., Yegorov, M.S. and Tarasov, P.V. High Altitude Aircraft Equipment.
London : Pergamon, 1961.

155
APPENDIX A – PREVIOUS SIMULATION FRAMEWORK
Figure 104: Scheme for the previous version of the analysis model
Figure 105: Previous version, built on Simulink ®, of the ECS simulation model
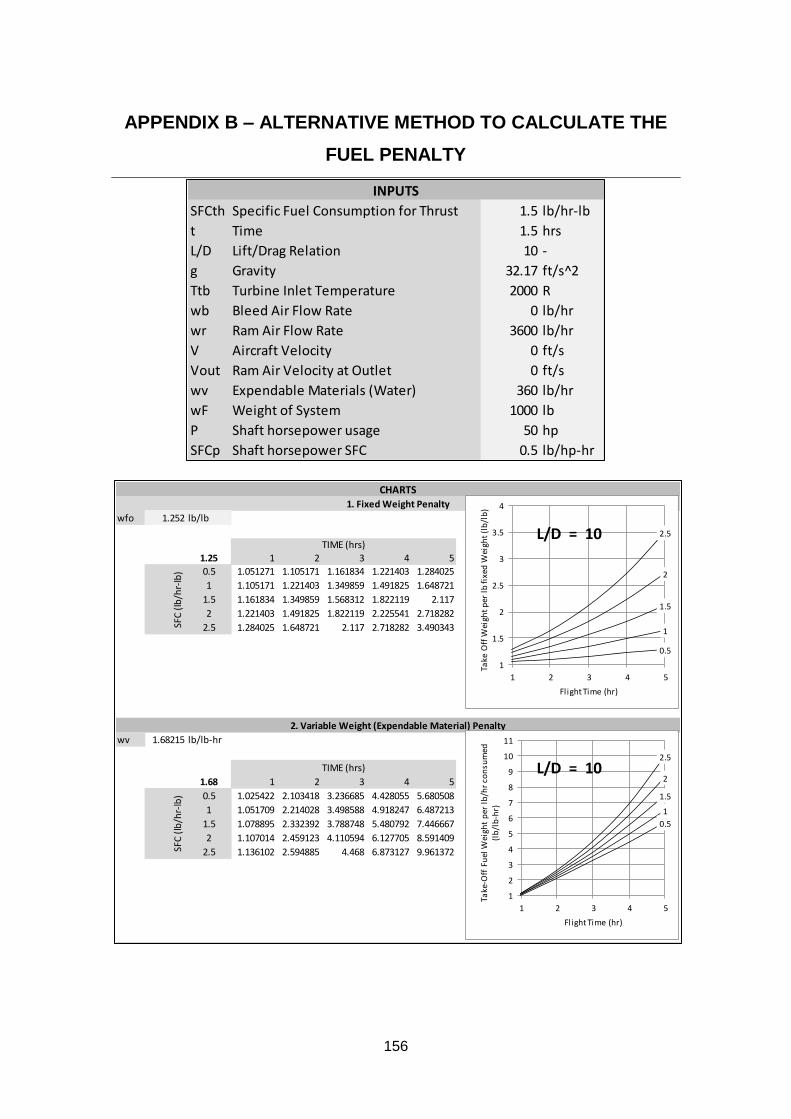
156
APPENDIX B – ALTERNATIVE METHOD TO CALCULATE THE
FUEL PENALTY
SFCth Specific Fuel Consumption for Thrust 1.5 lb/hr-lb
t Time 1.5 hrs
L/D Lift/Drag Relation 10 -
g Gravity 32.17 ft/s^2
Ttb Turbine Inlet Temperature 2000 R
wb Bleed Air Flow Rate 0 lb/hr
wr Ram Air Flow Rate 3600 lb/hr
V Aircraft Velocity 0 ft/s
Vout Ram Air Velocity at Outlet 0 ft/s
wv Expendable Materials (Water) 360 lb/hr
wF Weight of System 1000 lb
P Shaft horsepower usage 50 hp
SFCp Shaft horsepower SFC 0.5 lb/hp-hr
INPUTS
wfo 1.252 lb/lb
1.25 1 2 3 4 5
0.5 1.051271 1.105171 1.161834 1.221403 1.284025
1 1.105171 1.221403 1.349859 1.491825 1.648721
1.5 1.161834 1.349859 1.568312 1.822119 2.117
2 1.221403 1.491825 1.822119 2.225541 2.718282
2.5 1.284025 1.648721 2.117 2.718282 3.490343
wv 1.68215 lb/lb-hr
1.68 1 2 3 4 5
0.5 1.025422 2.103418 3.236685 4.428055 5.680508
1 1.051709 2.214028 3.498588 4.918247 6.487213
1.5 1.078895 2.332392 3.788748 5.480792 7.446667
2 1.107014 2.459123 4.110594 6.127705 8.591409
2.5 1.136102 2.594885 4.468 6.873127 9.961372
CHARTS
2. Variable Weight (Expendable Material) Penalty
1. Fixed Weight Penalty
TIME (hrs)
SFC
(lb
/hr-
lb)
TIME (hrs)
SFC
(lb
/hr-
lb)
0.5
1
1.5
2
2.5
1
1.5
2
2.5
3
3.5
4
1 2 3 4 5
Take
Off
Wei
ght
per
lb
fixe
d W
eigh
t (l
b/l
b)
Fl ight Time (hr)
L/D = 10
0.5
1
1.5
2
2.5
1
2
3
4
5
6
7
8
9
10
11
1 2 3 4 5
Take
-Off
Fu
el W
eigh
t p
er l
b/h
r co
nsu
med
(l
b/l
b-h
r)
Flight Time (hr)
L/D = 10
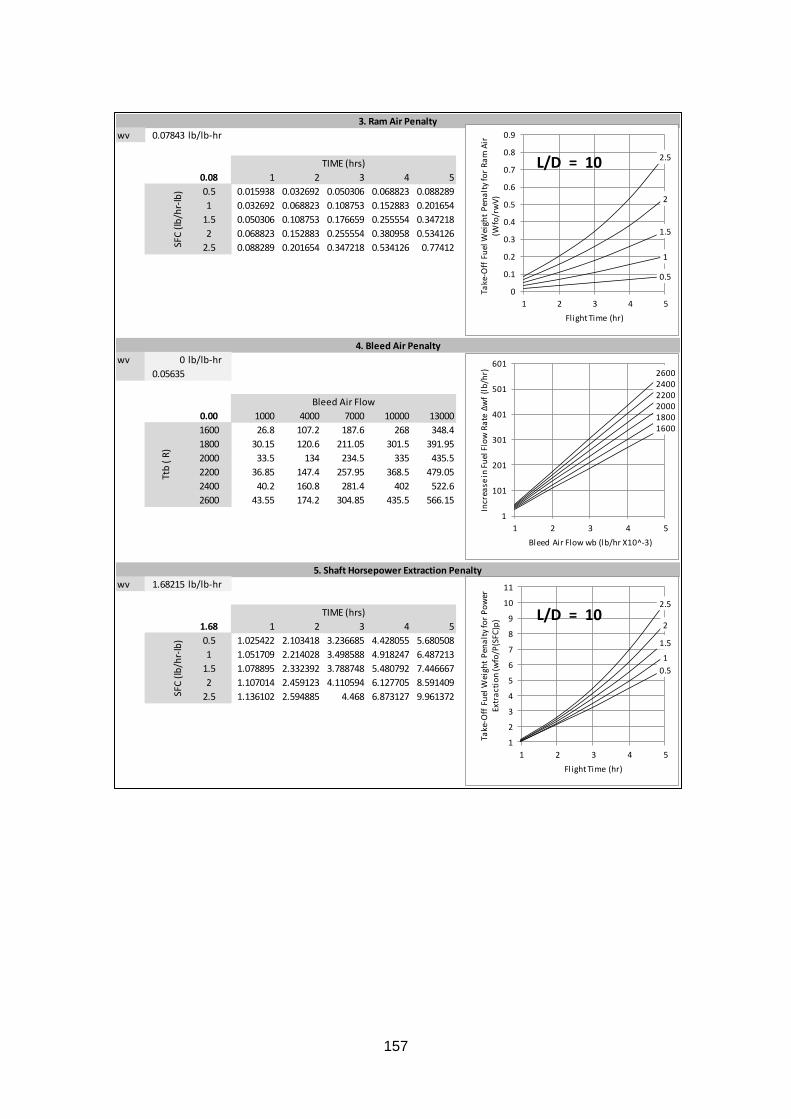
157
wv 0.07843 lb/lb-hr
0.08 1 2 3 4 5
0.5 0.015938 0.032692 0.050306 0.068823 0.088289
1 0.032692 0.068823 0.108753 0.152883 0.201654
1.5 0.050306 0.108753 0.176659 0.255554 0.347218
2 0.068823 0.152883 0.255554 0.380958 0.534126
2.5 0.088289 0.201654 0.347218 0.534126 0.77412
wv 0 lb/lb-hr
0.05635
0.00 1000 4000 7000 10000 13000
1600 26.8 107.2 187.6 268 348.4
1800 30.15 120.6 211.05 301.5 391.95
2000 33.5 134 234.5 335 435.5
2200 36.85 147.4 257.95 368.5 479.05
2400 40.2 160.8 281.4 402 522.6
2600 43.55 174.2 304.85 435.5 566.15
wv 1.68215 lb/lb-hr
1.68 1 2 3 4 5
0.5 1.025422 2.103418 3.236685 4.428055 5.680508
1 1.051709 2.214028 3.498588 4.918247 6.487213
1.5 1.078895 2.332392 3.788748 5.480792 7.446667
2 1.107014 2.459123 4.110594 6.127705 8.591409
2.5 1.136102 2.594885 4.468 6.873127 9.961372
5. Shaft Horsepower Extraction Penalty
4. Bleed Air Penalty
3. Ram Air Penalty
Bleed Air Flow
Ttb
( R
)
TIME (hrs)
SFC
(lb
/hr-
lb)
TIME (hrs)SF
C (
lb/h
r-lb
)
0.5
1
1.5
2
2.5
1
2
3
4
5
6
7
8
9
10
11
1 2 3 4 5
Take
-Off
Fu
el W
eigh
t P
ena
lty
for
Po
wer
Ex
tra
ctio
n (w
fo/P
(SFC
)p)
Fl ight Time (hr)
L/D = 10
160018002000220024002600
1
101
201
301
401
501
601
1 2 3 4 5
Incr
ease
in F
uel
Flo
w R
ate
∆w
f (l
b/h
r)
Bleed Air Flow wb (lb/hr X10^-3)
0.5
1
1.5
2
2.5
0
0.1
0.2
0.3
0.4
0.5
0.6
0.7
0.8
0.9
1 2 3 4 5
Take
-Off
Fu
el W
eigh
t P
ena
lty
for
Ra
m A
ir
(Wfo
/rw
V)
Flight Time (hr)
L/D = 10
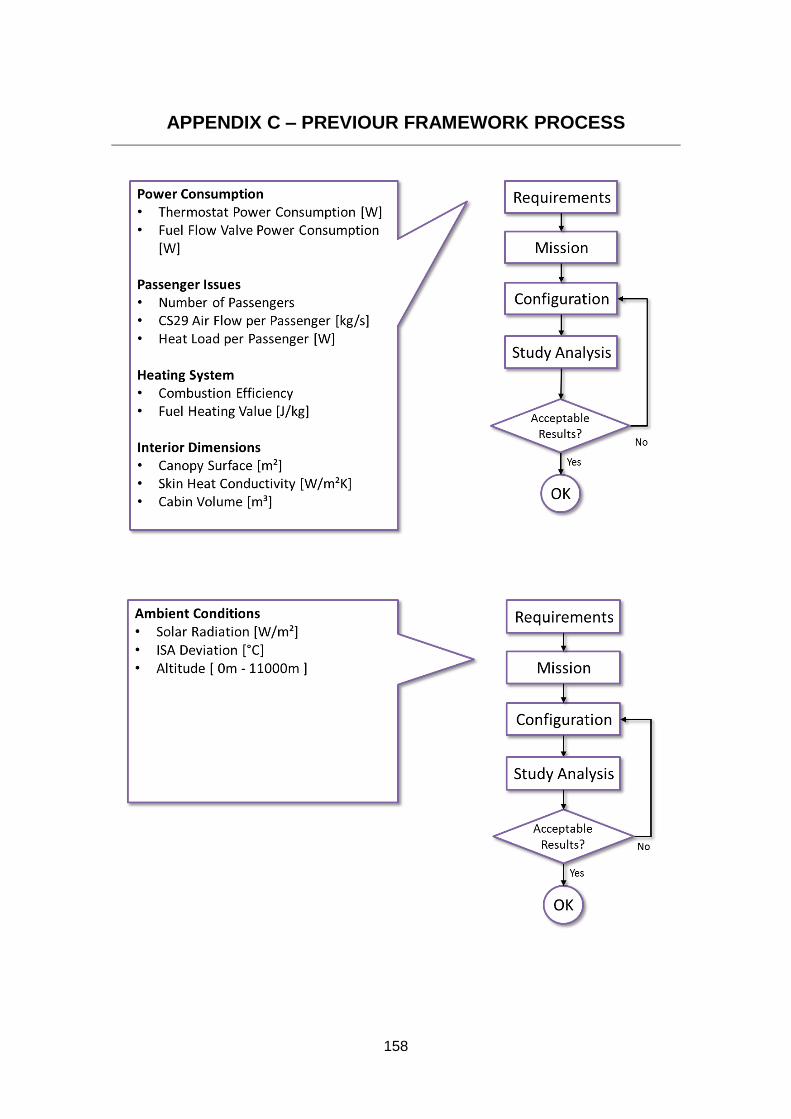
158
APPENDIX C – PREVIOUR FRAMEWORK PROCESS
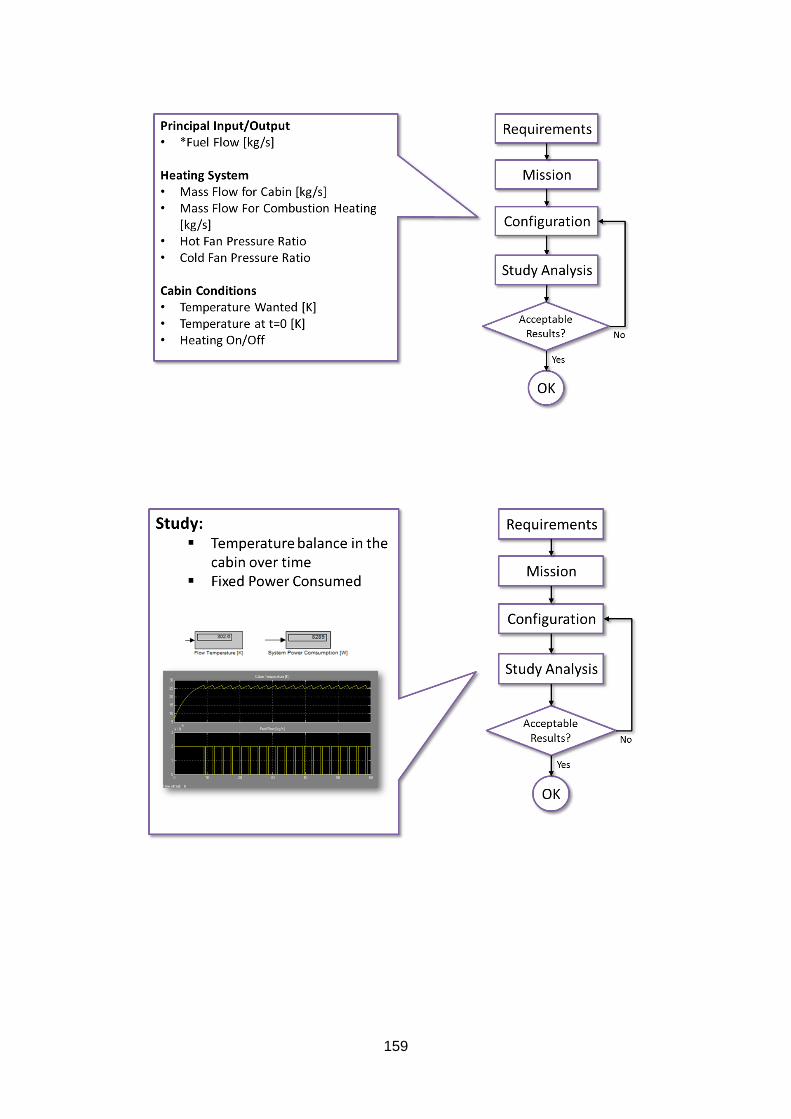
159
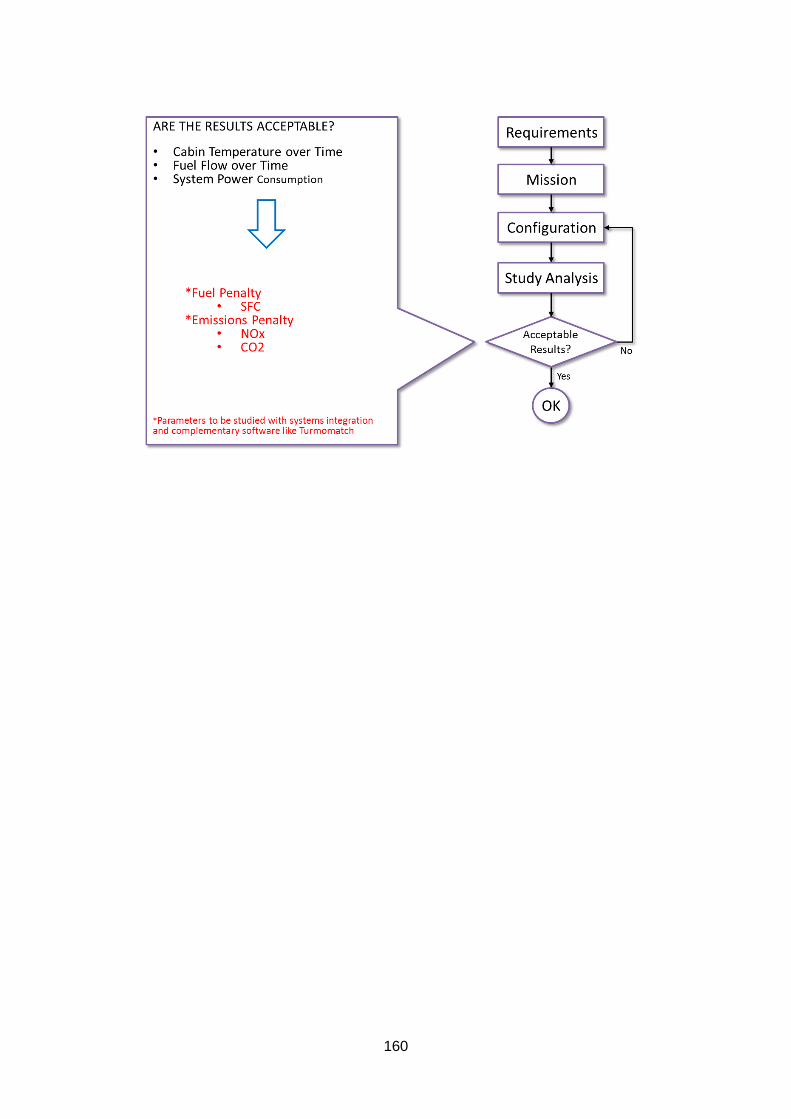
160
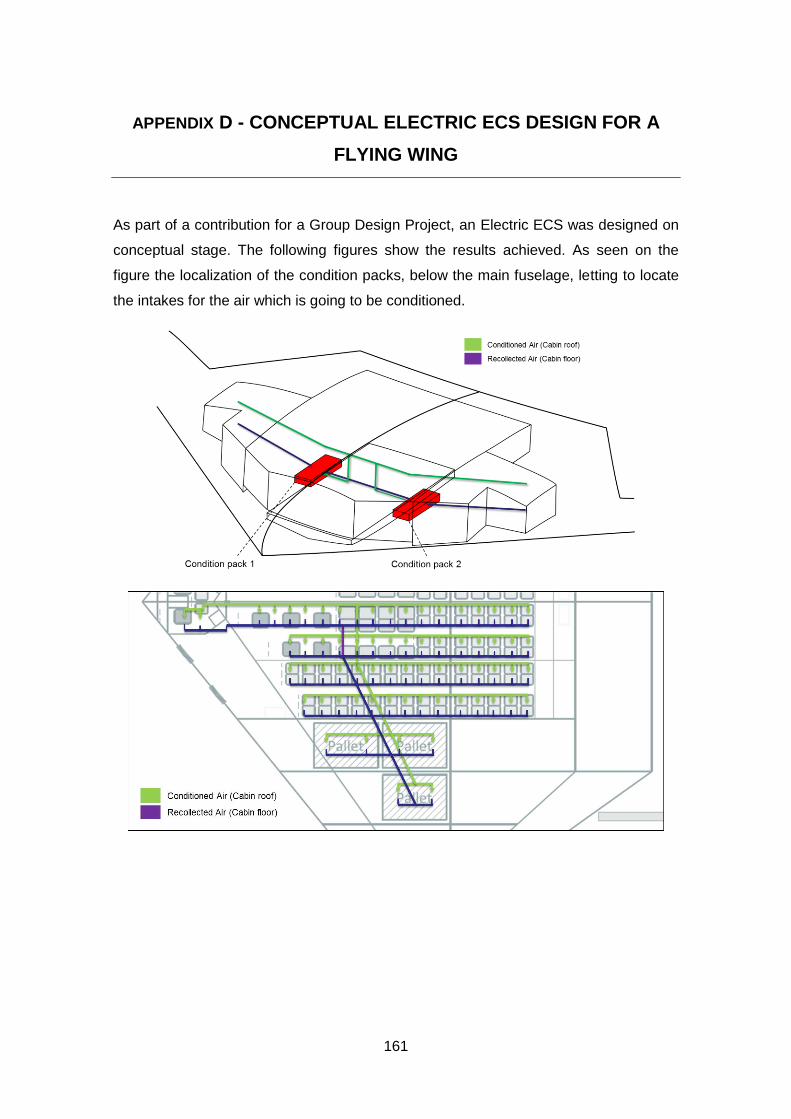
161
APPENDIX D - CONCEPTUAL ELECTRIC ECS DESIGN FOR A
FLYING WING
As part of a contribution for a Group Design Project, an Electric ECS was designed on
conceptual stage. The following figures show the results achieved. As seen on the
figure the localization of the condition packs, below the main fuselage, letting to locate
the intakes for the air which is going to be conditioned.
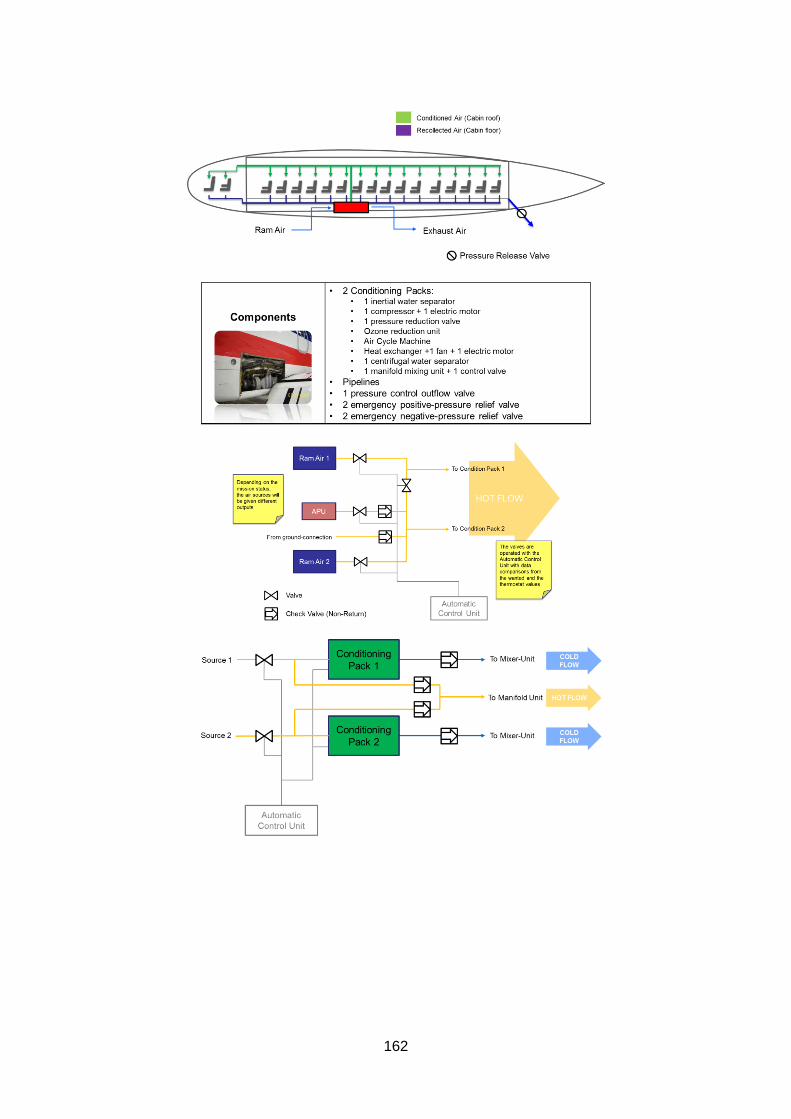
162