Embed Size (px)
Citation preview
FINAL REPORT
To:Horticultural Development Council
Bradbourne HouseStable BlockEast Malling
Kent, ME19 6DZ
UNDERSTANDING THE MECHANISMS BEHIND
ONION BULB DORMANCY INRELATION TO THE POTENTIAL
FOR IMPROVED ONION STORAGE
CP 20
Miss Gemma ChopeWarwick HRI
Wellesbourne, Warwick, CV35 9EF
December 2006
© 2006 Horticultural Development Council
Commercial - In Confidence
UNDERSTANDING THE MECHANISMS BEHIND ONION BULB DORMANCY IN RELATION TO THE POTENTIAL FOR IMPROVED ONION
STORAGE
Project Number: CP 20
Status: Final Report 2006
Key workers: G. A. Chope (holder of HDC studentship, author)Dr. L. A. Terry (supervisor, Cranfield University at Silsoe)Prof. P. J. White (supervisor Warwick HRI)A. Findlay (industrial supervisor)
Project Location: Warwick HRI Cranfield University at SilsoeWellesbourne SilsoeWarwick BedfordshireCV35 9EF MK45 4DT
Date Commenced: October 2003
Completion Date: December 2006
Key words: abscisic acid, controlled atmosphere, onion, storage, plant growth regulator, sprout growth, 1-methylcyclopropene, allium, bulb onion.
Signed on behalf of: Warwick HRI
Signature:…………………………………………… Date: …………………………….Name Professor Simon Bright Director and Head of Department
HDC copyright statement: The contents of this publication are strictly private to HDC members. No part of this publication may be copied or reproduced in any form or by any means without prior written permission of the Horticultural Development Council.
Whilst reports issued under the auspices of the HDC are prepared from the best available information, neither the authors nor the HDC can accept responsibility for inaccuracy or liability for loss, damage or injury from the application of any concept or procedure discussed.
© 2006 Horticultural Development Council
i
LIST OF CONTENTS
Page
LIST OF CONTENTS iLIST OF FIGURES vLIST OF TABLES xi
GROWER SUMMARY 1Headline 1Background and expected deliverables 1Summary of the project and main conclusions 2Financial benefits 4Action points for growers 5
SCIENCE SECTION1.0 CHAPTER ONE: Introduction 61.1 Project background 61.2 Aim and objectives 61.2.1 Aim 61.2.2 Objectives 71.3 Structure of the science section 7
2.0 CHAPTER TWO: Literature review 92.1 Allium cepa L. 92.2 Economic importance of the onion crop in the UK 112.3 The onion lifecycle 122.3.1 Bulb initiation and formation 132.3.2 Onion bulb dormancy 142.4 Quality attributes of marketable onions 152.5 Strategies to delay sprouting 152.6 Pre-harvest factors that affect storage life 152.6.1 Pre-harvest nutrition 162.6.2 Growing season temperature 162.6.3 Maleic hydrazide 182.6.4 Crop maturity at harvest 182.6.5 Harvesting process 182.7 Postharvest factors that affect storage life 192.7.1 Curing and drying 192.7.2 Irradiation 202.7.3 Nitrous oxide 202.7.4 Storage environment 212.7.4.1 Storage temperature 222.7.4.2 Controlled atmosphere storage 222.7.4.3 Humidity 232.8 Alternative strategies to delay sprouting 23
© 2006 Horticultural Development Council
ii
2.9 Changes occurring in onion bulbs during storage and sprouting
23
2.9.1 Mitotic activity 242.9.2 Flavour precursors and pungency 242.9.3 Carbohydrates 272.9.4 Fresh weight and water loss 282.9.5 Respiration 282.9.6 Plant growth regulators 292.10 Conclusions 33
3.0 CHAPTER THREE: Temporal changes in abscisic acid concentration and quality characteristics during controlled atmosphere storage of onion bulbs of three cultivars with contrasting storage potential
35
3.1 Abstract 353.2 Introduction 363.3 Materials and methods 393.3.1 Plant material and storage regime 393.3.2 Experimental design 393.3.3 Sample preparation 403.3.4 Quantification of total fructans 403.3.5 Pyruvate assay for assessment of pungency 413.3.6 Bulb firmness and total soluble solids assessments 413.3.7 Mineral analysis 423.3.8 Abscisic acid (ABA) quantification 423.3.9 Statistical analysis 443.4 Results 443.4.1 Mineral concentrations 443.4.2 Sprout growth 463.4.3 Dry weight 483.4.4 Total soluble solids 483.4.5 Firmness 483.4.6 Pyruvate 493.4.7 Total fructans 513.4.8 Abscisic acid 513.5 Discussion 553.6 Conclusion 60
4.0 CHAPTER FOUR: Neither pre- nor postharvest application of exogenous abscisic acid (ABA) or an ABA analogue affects endogenous ABA concentration of onion bulbs
61
4.1 Abstract 614.2 Introduction 624.3 Materials and methods 644.3.1 Plant material 644.3.2 Experiment 1 – Pre-harvest foliar spray method 644.3.3 Harvest procedure 66
© 2006 Horticultural Development Council
iii
4.3.4 Experiment 2 - Postharvest bulb dip method 664.3.5 Storage regime and experimental design 674.3.6 Sample preparation 674.3.7 Physical assessments 684.3.8 Biochemical assessments 684.3.8.1 NSC extraction 684.3.8.2 NSC quantification 694.3.9 Statistical analysis 694.4 Results 704.4.1 Experiment 1 - Consequences of a pre-harvest foliar
spray of ABA or PBI-36570
4.4.1.1 Pre-storage cultivar characteristics 714.4.1.2 Sprout growth 744.4.1.3 Firmness 764.4.1.4 Dry weight 764.4.1.5 Total soluble solids 794.4.1.6 Pyruvate concentration 794.4.1.7 Non-structural carbohydrates 824.4.1.8 Abscisic acid 914.4.2 Experiment 2- Consequences of postharvest bulb dip
into solutions of ABA or PBI-36593
4.4.2.1 Sprout growth 934.4.2.2 Firmness and dry weight 944.4.2.3 Total soluble solids and pyruvate concentration 954.4.2.4 Abscisic acid 964.5 Discussion 974.6 Conclusion 102
5.0 CHAPTER FIVE: The effect of 1-methylcyclopropene (1-MCP) on the physical and biochemical characteristics of onion cv. SS1 bulbs during storage
103
5.1 Abstract 1035.2 Introduction 1035.3 Materials and methods 1055.3.1 Plant material and storage regime 1055.3.2 Application of 1-MCP 1055.3.3 1-MCP quantification 1055.3.4 Storage conditions and sampling regime 1065.3.5 Sample preparation 1075.3.6 Physical assessments 1075.3.7 Biochemical assessments 1075.3.8 Statistical analyses 1085.4 Results 1085.4.1 Effect of 1-MCP on physical properties of onion bulbs 1085.4.1.1 Sprout growth 1085.4.1.2 Firmness and dry weight 1095.4.2 Effect of 1-MCP on biochemical properties of onion bulbs 1115.4.2.1 Total soluble solids and pungency 111
© 2006 Horticultural Development Council
iv
5.4.2.2 Abscisic acid 1125.4.2.3 Non-structural carbohydrates 1135.5 Discussion 1175.6 Conclusion 122
6.0 CHAPTER SIX: The effect of the transition between controlled atmosphere and air storage on bulbs of onion cultivars SS1, Carlos and Renate
123
6.1 Abstract 1236.2 Introduction 1236.3 Materials and methods 1306.3.1 Plant material 1306.3.2 Controlled atmosphere transition treatment 1306.3.3 Experimental design 1316.3.4 Sample preparation 1316.3.5 Physical assessments 1326.3.5.1 Measurement of respiration rate 1326.3.6 Biochemical assessments 1326.3.7 Statistical analysis 1336.4 Results 1346.4.1 Effect of the transition between CA and air storage on
physical characteristics of onion bulbs134
6.4.2 Effect of the transition between CA and air storage on biochemical characteristics of onion bulbs
138
6.5 Discussion 1456.6 Conclusion 150
7.0 CHAPTER SEVEN: General discussion and conclusions 1527.1 Discussion 1527.2 Recommendations for future experimental work 1617.3 Implications for growers 1697.4 Project conclusions 170
TECHNOLOGY TRANSFER 172
GLOSSARY 174
REFERENCES 178
APPENDICES 193
A. APPENDIX A: Validation of the abscisic acid radio-immunoassay
193
B. APPENDIX B: Statistical tables 199C. APPENDIX C: Published literature 254
© 2006 Horticultural Development Council
v
LIST OF FIGURES
Page
GROWER SUMMARYFigure 1. Changes in A: ABA concentration and B: sprout length of onion bulbs cv. Renate (▲), Ailsa Craig (●) and SS1 (■) over time in controlled atmosphere storage. Drop down arrows indicate the last sample taken
2
Figure 2. A. The sprout length of onion cv. SS1 expressed as a percentage of bulb height after storage in; CA for 42 days (CA/CA), CA for 21 days followed by air for 21 days (CA/Air), air for 21 days followed by CA for 21 days (Air/CA) and air for 42 days (Air/Air). B. The ABA concentration of onions cv. Carlos (
CA/CARA/AARA/CARA/RA
), Renate (CA/CARA/AARA/CARA/RA
) and SS1 (
CA/CARA/AARA/CARA/RA) measured at harvest and
before storage (day 0)
3
Figure 3. Sprout length in onions treated with 1 µl l-1 1-MCP at 20ºC for 24 hours (open symbols) and untreated onions (controls, closed symbols) stored at 4ºC for 109 days, 12ºC for 53 days or 20ºC for 39 days
4
Figure 4. Changes in sucrose, glucose and fructose concentrations during storage in untreated onions (controls, closed symbols) and in onions treated with 1 µl l-1 1-MCP at 20ºC for 24 hours (open symbols) prior to storage at 12ºC
4
CHAPTER TWOFigure 2.1. Annotated diagram of a cross-section of an onion bulb
12
Figure 2.2. Cross-sections of an onion cv. Renate bulb: A – with no sprout and B – with an external sprout
14
Figure 2.3. Chemical structure of: A – Uracil, B – Maleic hydrazide, C – Cytosine
17
Figure 2.4. Simplified pathway of flavour production in onion bulb tissue
26
Figure 2.5. Percentage sprouting and hormone activity of onions cv. Rijnsberger stored at 5-8°C (Thomas and Isenberg, 1972)
30
Figure 2.6. The synthesis of abscisic acid (ABA) from xanthoxin in higher plants. Solid arrows indicate the major pathway, dashed arrows indicate a minor pathway, AB=abscisic (Cutler and Krochko, 1999)
31
Figure 2.7. Metabolism of abscisic acid (ABA) 32
CHAPTER THREEFigure 3.1. Elemental content of onion cvs. Renate, Ailsa Craig and SS1 bulbs shortly after harvest (day 0, black bars, n=4), and at early (light grey bars, n=8) and late (dark grey bars, n=8) time points during controlled atmosphere storage (cv. Renate:
45
© 2006 Horticultural Development Council
vi
days 40 and 230, cv. Ailsa Craig: days 81 and 129, and cv. SS1: days 40 and 81). Standard error bars are shownFigure 3.2. Changes in the physical parameters; sprout length (expressed as a ratio of bulb height), total soluble solids and firmness (N mm-1), in bulbs of onion cvs. Renate (▲), Ailsa Craig (●) and SS1 (■) during controlled atmosphere storage. Drop down arrows indicate the final sample taken. LSD (P=0.05) bars are shown, symbols correspond to cultivar; n=24
47
Figure 3.3. Changes in the biochemical parameters; pyruvate, fructan, and ABA concentrations, in bulbs of onion cvs. Renate (▲), Ailsa Craig (●) and SS1 (■) during controlled atmosphere storage. Drop down arrows indicate the final sample taken. LSD bars (P=0.05) are shown, symbols correspond to cultivar. LSD bar A is for comparison of time zero with all other times, bar B is for comparison of all times except time zero. Pyruvate: n=24, fructan and ABA: time zero n=4, all other times n=8
50
CHAPTER FOURFigure 4.1. A. 8'-methylene abscisic acid methyl ester. B. (+)-abscisic acid
63
Figure 4.2. Sprout length of onion cvs. Carlos (●), Dinaro (○), Hysam (▼), Red Baron (), Renate (■) and SS1 (□) treated with a pre-harvest spray of 10-4 M ABA in 0.5% (v/v) Li-700, 10-4 M PBI-365 in 0.5% (v/v) Li-700, 0.5% (v/v) Li-700 or water and stored at 4°C for 243 days, 12°C for 109 days or 20°C for 98 days (n=5). LSD bars (P=0.05) are shown based on 321, 193 and 120 d.f for 4°C, 12°C and 20°C respectively
75
Figure 4.3. Firmness (N mm-1) of onion cvs. Carlos (●), Dinaro (○), Hysam (▼), Red Baron (), Renate (■) and SS1 (□) treated with a pre-harvest spray of 10-4 M ABA in 0.5% (v/v) Li-700, 10-4 M PBI-365 in 0.5% (v/v) Li-700, 0.5% (v/v) Li-700 or water and stored at 4°C for 243 days, 12°C for 109 days or 20°C for 98 days (n=5). LSD bars (P=0.05) are shown based on 526, 556 and 551 d.f for 4°C, 12°C and 20°C respectively
77
Figure 4.4. Dry weight of onion cvs. Carlos (●), Dinaro (○), Hysam (▼), Red Baron (), Renate (■) and SS1 (□) treated with a pre-harvest spray of 10-4 M ABA in 0.5% (v/v) Li-700, 10-4 M PBI-365 in 0.5% (v/v) Li-700, 0.5% (v/v) Li-700 or water and stored at 4°C for 243 days, 12°C for 109 days or 20°C for 98 days (n=5). LSD bars (P=0.05) are shown based on 525, 558 and 555 d.f for 4°C, 12°C and 20°C respectively
78
Figure 4.5. Total soluble solids concentration onion cvs. Carlos (●), Dinaro (○), Hysam (▼), Red Baron (), Renate (■) and SS1 (□) treated with a pre-harvest spray of 10-4 M ABA in 0.5% (v/v) Li-700, 10-4 M PBI-365 in 0.5% (v/v) Li-700, 0.5% (v/v) Li-700 or water and stored at 4°C for 243 days, 12°C for 109 days or 20°C for 98 days (n=5). LSD bars (P=0.05) are shown based on 526, 558 and 557 d.f. for 4°C, 12°C and 20°C respectively
80
© 2006 Horticultural Development Council
vii
Figure 4.6. Pyruvate concentration of onion cvs. Carlos (●), Dinaro (○), Hysam (▼), Red Baron (), Renate (■) and SS1 (□) treated with a pre-harvest spray of 10-4 M ABA in 0.5% (v/v) Li-700, 10-4 M PBI-365 in 0.5% (v/v) Li-700, 0.5% (v/v) Li-700 or water and stored at 4°C for 243 days, 12°C for 109 days or 20°C for 98 days (n=5). LSD bars (P=0.05) are shown based on 526, 559 and 557 d.f. for 4°C, 12°C and 20°C respectively
81
Figure 4.7. Fructose concentration of onion cvs. Red Baron (●), Renate (○) and SS1 (▼) treated with a pre-harvest spray of 10-4 M ABA in 0.5% (v/v) Li-700, 10-4 M PBI-365 in 0.5% (v/v) Li-700, 0.5% (v/v) Li-700 or water and stored at 4°C for 243 days, 12°C for 109 days or 20°C for 98 days (n=3). LSD bars (P=0.05) are shown based on 120, 136 and 132 d.f. for 4°C, 12°C and 20°C respectively
83
Figure 4.8. Sucrose concentration of onion cvs. Red Baron (●), Renate (○) and SS1 (▼) treated with a pre-harvest spray of 10-4 M ABA in 0.5% (v/v) Li-700, 10-4 M PBI-365 in 0.5% (v/v) Li-700, 0.5% (v/v) Li-700 or water and stored at 4°C for 243 days, 12°C for 109 days or 20°C for 98 days (n=3). LSD bars (P=0.05) are shown based on 120, 136 and 132 d.f. for 4°C, 12°C and 20°C respectively
84
Figure 4.9. Glucose concentration of onion cvs. Red Baron (●), Renate (○) and SS1 (▼) treated with a pre-harvest spray of 10-4 M ABA in 0.5% (v/v) Li-700, 10-4 M PBI-365 in 0.5% (v/v) Li-700, 0.5% (v/v) Li-700 or water and stored at 4°C for 243 days, 12°C for 109 days or 20°C for 98 days (n=3). LSD bars (P=0.05) are shown based on 120, 136 and 132 d.f. for 4°C, 12°C and 20°C respectively
85
Figure 4.10. Total sugars (glucose+sucrose+fructose) concentration of onion cvs. Red Baron (●), Renate (○) and SS1 (▼) treated with a pre-harvest spray of 10-4 M ABA in 0.5% (v/v) Li-700, 10-4 M PBI-365 in 0.5% (v/v) Li-700, 0.5% (v/v) Li-700 or water and stored at 4°C for 243 days, 12°C for 109 days or 20°C for 98 days (n=3). LSD bars (P=0.05) are shown based on 120, 136 and 132 d.f. for 4°C, 12°C and 20°C respectively
87
Figure 4.11. Ratio of monosaccharide : disaccharide ((fructose+glucose)/sucrose) of onion cvs. Red Baron (●), Renate (○) and SS1 (▼) treated with a pre-harvest spray of 10-4 M ABA in 0.5% (v/v) Li-700, 10-4 M PBI-365 in 0.5% (v/v) Li-700, 0.5% (v/v) Li-700 or water and stored at 4°C for 243 days, 12°C for 109 days or 20°C for 98 days (n=3). LSD bars (P=0.05) are shown based on 120, 136 and 132 d.f. for 4°C, 12°C and 20°C respectively
88
Figure 4.12. Total fructan concentration of onion cvs. Red Baron (●), Renate (○) and SS1 (▼) treated with a pre-harvest spray of 10-4 M ABA in 0.5% (v/v) Li-700, 10-4 M PBI-365 in 0.5% (v/v) Li-700, 0.5% (v/v) Li-700 or water and stored at 4°C for 243
90
© 2006 Horticultural Development Council
viii
days, 12°C for 109 days or 20°C for 98 days (n=3). LSD bars (P=0.05) are shown based on 120, 136 and 134 d.f. for 4°C, 12°C and 20°C respectivelyFigure 4.13. Abscisic acid concentration of onion cvs. Carlos (●), Dinaro (○), Hysam (▼), Red Baron (), Renate (■) and SS1 (□) treated with a pre-harvest spray of 10-4 M ABA in 0.5% (v/v) Li-700, 10-4 M PBI-365 in 0.5% (v/v) Li-700, 0.5% (v/v) Li-700 or water and stored at 4°C for 243 days, 12°C for 109 days or 20°C for 98 days (n=5). LSD bars (P=0.05) are shown based on 524, 556 and 554 d.f. for 4°C, 12°C and 20°C respectively
92
Figure 4.14. Sprout growth of onion cv. Hysam bulbs treated with a postharvest soak in 10-4 M ABA in 0.5% (v/v) Li-700 (●), 10-4 M PBI-365 in 0.5% (v/v) Li-700 (▼) or water (○) and stored at 4°C for 215 days, 12°C for 109 days or 20°C for 67 days (n=3). LSD bars (P=0.05) are shown based on 39 d.f.
94
© 2006 Horticultural Development Council
ix
Figure 4.15. Firmness and dry weight of onion cv. Hysam bulbs treated with a postharvest soak in 10-4 M ABA in 0.5% (v/v) Li-700 (●), 10-4 M PBI-365 in 0.5% (v/v) Li-700 (▼) or water (○) and stored at 4°C for 215 days, 12°C for 109 days or 20°C for 67 days (n=3). LSD bars (P=0.05) are shown based on: firmness - 35, 36 and 35 d.f for 4°C, 12°C and 20°C respectively, dry weight - 39 d.f.
95
Figure 4.16. Total soluble solids and pyruvate concentration of onion cv. Hysam bulbs treated with a postharvest soak in 10-4 M ABA in 0.5% (v/v) Li-700 (●), 10-4 M PBI-365 in 0.5% (v/v) Li-700 (▼) or water (○) and stored at 4°C for 215 days, 12°C for 109 days or 20°C for 67 days (n=3). LSD bars (P=0.05) are shown based on 39 d.f.
96
Figure 4.17. ABA concentration of onion cv. Hysam bulbs treated with a postharvest soak in 10-4 M ABA in 0.5% (v/v) Li-700 (●), 10-4 M PBI-365 in 0.5% (v/v) Li-700 (▼) or water (○) and stored at 4°C for 215 days, 12°C for 109 days or 20°C for 67 days (n=3). LSD bars (P=0.05) are shown based on 39, 38 and 39 d.f. for 4°C, 12°C and 20°C respectively
97
CHAPTER FIVEFigure 5.1. Sprout length in onions treated with 1 µl l-1 1-MCP at 20ºC for 24 hours (open symbols) and untreated onions (controls, closed symbols) stored at 4ºC for 109 days, 12ºC for 53 days or 20ºC for 39 days. Controls n=5, 1-MCP n=10. LSD bars (P=0.05) A=5,5; B=10,5; C=10,10
109
Figure 5.2. Firmness and dry of onions treated with 1 µl l-1 1-MCP at 20ºC for 24 hours (open symbols) and untreated onions (controls, closed symbols) stored at 4ºC for 109 days, 12ºC for 53 days or 20ºC for 39 days. Controls n=5, 1-MCP n=10. LSD bars (P=0.05) A=5,5; B=10,5; C=10,10
110
Figure 5.3. Total soluble solids (%) and pyruvate concentration of onions treated with 1 µl l-1 1-MCP at 20ºC for 24 hours (open symbols) and untreated onions (controls, closed symbols) stored at 4ºC for 109 days, 12ºC for 53 days or 20ºC for 39 days. Controls n=5, 1-MCP n=10. LSD bars (P=0.05) A=5,5; B=10,5; C=10,10
112
Figure 5.4. ABA concentration during storage in onions treated with 1 µl l-1 1-MCP at 20ºC for 24 hours (open symbols) and untreated onions (controls, closed symbols) stored at 4ºC for 109 days, 12ºC for 53 days or 20ºC for 39 days. Controls n=5, 1-MCP n=10.LSDbars(P=0.05) A=5,5; B=10,5; C=10,10
113
Figure 5.5. Sucrose, glucose and fructose concentrations in onions treated with 1 µl l-1 1-MCP at 20ºC for 24 hours (open symbols) and untreated onions (controls, closed symbols) stored at 4ºC for 109 days, 12ºC for 53 days or 20ºC for 39 days.
114
© 2006 Horticultural Development Council
x
Controls n=5, 1-MCP n=10. LSD bars (P=0.05) A=5,5; B=10,5; C=10,10Figure 5.6. Ratio of monosaccharide : disaccharide (glucose+fructose/sucrose), total sugar (sucrose+glucose+fructose) and total fructan concentration in onions treated with 1 µl l-1 1-MCP at 20ºC for 24 hours (open symbols) and untreated onions (controls, closed symbols) stored at 4ºC for 109 days, 12ºC for 53 days or 20ºC for 39 days. Controls n=5, 1-MCP n=10. LSD bars (P=0.05) A=5,5; B=10,5; C=10,10
116
CHAPTER SIXFigure 6.1. The respiration rate of onions cvs. Carlos ( CA/CA
RA/AARA/CARA/RA
), Renate (
CA/CARA/AARA/CARA/RA
) and SS1 (
CA/CARA/AARA/CARA/RA) recorded before storage (Day 0),
after 21 days storage in CA (CA P1) or air (Air P1) and after CA for 42 days (CA/CA), CA for 21 days followed by air for 21 days (CA/Air), air for 21 days followed by CA for 21 days (Air/CA) and air for 42 days (Air/Air). Day 0 n=8, CA P1 and Air P1 n=4; CA/CA, CA/Air, Air/CA and Air/Air n=2. LSD bars (P=0.05) A=2,2; B=4,2; C=4,4 are shown
135
Figure 6.2. The sprout length of onion cv. SS1 expressed as a percentage of bulb height after storage in; CA for 42 days (CA/CA), CA for 21 days followed by air for 21 days (CA/Air), air for 21 days followed by CA for 21 days (Air/CA) and air for 42 days Air/Air); n=4. LSD bar (P=0.05) is shown
136
Figure 6.3. The sucrose, glucose and fructose concentration of onion cvs. Carlos ( CA/CA
RA/AARA/CARA/RA
), Renate (CA/CARA/AARA/CARA/RA
) and SS1 (
CA/CARA/AARA/CARA/RA) measured
at harvest, before storage (Day 0), after 21 days storage in CA (CA P1) or air (Air P1) and after CA for 42 days (CA/CA), CA for 21 days followed by air for 21 days (CA/Air), air for 21 days followed by CA for 21 days (Air/CA) and air for 42 days (Air/Air). Harvest n=12, Day 0 n=16, CA P1 and Air P1 n=8; CA/CA, CA/Air, Air/CA, Air/Air n=4. LSD bars (P=0.05) A=4,4; B=8,4; C=8,8 are shown
141
Figure 6.4. The total sugar (glucose, sucrose and fructose), monosaccharide to disaccharide ratio, and total fructan concentration of onion cv. Carlos ( CA/CA
RA/AARA/CARA/RA
), Renate (CA/CARA/AARA/CARA/RA
) and SS1 (CA/CARA/AARA/CARA/RA) measured at harvest, before storage (Day 0), after 21 days
storage in CA (CA P1) or air (Air P1) and after CA for 42 days (CA/CA), CA for 21 days followed by air for 21 days (CA/Air), air for 21 days followed by CA for 21 days (Air/CA) and air for 42 days (Air/Air). Harvest n=12, Day 0 n=16, CA P1 and Air P1 n=8; CA/CA, CA/Air, Air/CA, Air/Air n=4. LSD bars (P=0.05) A=4,4; B=8,4; C=8,8 are shown
143
Figure 6.5. The ABA concentration of onion cvs. Carlos ( CA/CARA/AARA/CARA/RA
), Renate (
CA/CARA/AARA/CARA/RA
) and SS1 (
CA/CARA/AARA/CARA/RA) measured at harvest, before
storage (Day 0), after 21 days storage in CA (CA P1) or air (Air
145
© 2006 Horticultural Development Council
xi
P1) and after CA for 42 days (CA/CA), CA for 21 days followed by air for 21 days (CA/Air), air for 21 days followed by CA for 21 days (Air/CA) and air for 42 days (Air/Air). Harvest n=12, Day 0 n=16, CA P1 and Air P1 n=8; CA/CA, CA/Air, Air/CA, Air/Air n=4. LSD bars (P=0.05) A=4,4; B=8,4; C=8,8 are shown
© 2006 Horticultural Development Council
xii
CHAPTER SEVENFigure 7.1. Cross-section of a potato tuber 156Figure 7.2. Summary of the pathways involved in ABA biosynthesis and catabolism. Dashed arrow indicates export of xanthoxin from the plastid to the cytosol. ZEP=zeaxanthin epoxydase, NCED=nine cis-epoxycarotenoid dioxygenase; SDR=short chain alcohol dehydrogenase/reductase; AAO=abscisic aldehyde dehydrogenase; ABA=abscisic acid; PA=phaseic acid; DPA=dihydrophaseic acid (Nambara and Marion-Poll, 2005; Taylor et al., 2005)
165
Figure 7.3. Simplified pathway of ethylene biosynthesis. SAM=S-adenosyl-L-methionine, MTA=5’-methylthioadenosine, ACC=1-amino-cyclopropane-1-carboxylic acid (Ecker, 1995; Wang et al., 2002)
167
© 2006 Horticultural Development Council
xiii
LIST OF TABLES
Page
CHAPTER TWOTable 2.1. The area of onions1 harvested (1000 Ha), the yield (100 g Ha-1) and production (tonnes) from 2000 to 2005 in the UK and worldwide (FAOSTAT, 2006)…..
10
Table 2.2. The quantity (tonnes) and value (£10001) of onions imported to, and exported from, the UK (FAOSTAT, 2006)
11
CHAPTER THREETable 3.1. The maximum and minimum abscisic acid (ABA) concentrations reported previously in bulbs of onions and related species
38
Table 3.2. The mean elemental composition of onion cvs. Renate, Ailsa Craig and SS1 bulbs (n=20) compared with data for raw and sweet onions from the USDA database (U.S. Department of Agriculture, 2004)
46
Table 3.3. The maximum and minimum abscisic acid concentrations on a dry weight (± S.E.) and fresh weight basis recorded in onion cvs. SS1, Ailsa Craig and Renate bulbs at the beginning and end of storage (Time zero: n=4, all other times: n=8)
52
Table 3.4. The parameters (± S.E.) of the exponential functions (y = (A + B)Rx) describing the change in ABA concentration during storage (days) in onion cvs. SS1, Ailsa Craig and Renate bulbs
54
CHAPTER FOURTable 4.1. The estimated storage life (months) of onion cvs. Carlos, Dinaro, Hysam, Red Baron, Renate and SS1 (Tim Crowther, Warwick HRI, pers. comm.)
64
Table 4.2. Treatments applied to the onion plants in the field 65Table 4.3. Weather conditions in the week following pre-harvest treatment
66
Table 4.4. The ranking of the cultivars Carlos, Dinaro, Hysam, Red Baron, Renate and SS1 according to mean pre-storage measurements (n=20) of dry weight, total soluble solids, pungency, firmness and abscisic acid
72
Table 4.5. The ranking of the cultivars Red Baron, Renate and SS1 according to mean pre-storage measurements (n=12) of glucose, sucrose, fructose and fructan concentration
73
Table 4.6. The time (days) taken for 50% of the bulbs to sprout at each storage temperature
74
CHAPTER SIXTable 6.1. Summary of the changes in carbohydrate composition of onion bulbs during storage
125
© 2006 Horticultural Development Council
xiv
Table 6.2. The firmness (N mm-1) and dry weight (mg g-1 FW) of onion cvs. Carlos, Renate and SS1 measured at harvest, before storage (Day 0), after 21 days storage in CA (CA P1) or air (Air P1) and after CA for 42 days (CA/CA), CA for 21 days followed by air for 21 days (CA/Air), air for 21 days followed by CA for 21 days (Air/CA) and air for 42 days (Air/Air). Firmness LSD (P=0.05) 12,16=5.903; 8,4=9.466. Dry weight LSD (P=0.05) 12,16=7.941; 8,4=12.733
137
Table 6.3. The total soluble solids (TSS) concentration (%) and pyruvate concentration (μmol g-1 FW) of onion cvs. Carlos, Renate and SS1 measured at harvest, before storage (Day 0), after 21 days storage in CA (CA P1) or air (Air P1) and after CA for 42 days (CA/CA), CA for 21 days followed by air for 21 days (CA/Air), air for 21 days followed by CA for 21 days (Air/CA) and air for 42 days (Air/Air). TSS LSD (P=0.05) 12,16=0.8538; 8,4=1.3691. Pyruvate LSD (P=0.05) 12,16=1.049; 8,4=1.682
139
© 2006 Horticultural Development Council
1GROWERS SUMMARY
CP 20
Understanding the mechanisms behind onion bulb dormancy in relation to the potential for improved onion storage
Headline Minimal abscisic acid (ABA; an endogenous plant growth regulator) is related
to increase sprout growth. Onion bulb ABA concentration cannot be increased by foliar sprays in the
field. Current curing practice using extended periods of exposure to high
temperature could deplete ABA levels and have a negative impact on onion storage life.
An ethylene perception inhibitor (1-MCP) reduces sprout growth in onions cv. SS1 stored at 12°C.
Background and expected deliverables
Extended storage life of UK onions currently depends on the use of maleic hydrazide (MH) to suppress sprout growth in store. Concerns over residues have led to retailer pressure to reduce or eliminate MH treatment. This could seriously affect UK onion growers, who will find it increasingly difficult to supply onions from March onwards, and will lose market share to imports.
Dormancy is the result of two physiological processes; dormancy induction and sprout suppression. The true dormancy period is short and appears to be independent of storage life. During this period substantive sprout growth does not occur. Thereafter, suppression of sprout growth maintains apparent dormancy despite the occurrence of mitotic activity in the apical and floral meristems. Much of the work on improving onion storage potential has concentrated on breeding, cultural practice and storage environment, with little attention to the physiological processes behind onion bulb dormancy.
Abscisic acid (ABA) is a plant growth regulator that has been associated with the control of dormancy in onion bulbs. ABA concentration in onion and Allium wakegi (an A. cepa x A. fisulosum hybrid) has been shown to increase during bulb
© 2006 Horticultural Development Council
2development, peak at maturation and then fall during dormancy. ABA is also involved in seed and bud dormancy in other plant species and in the control of water uptake. Little is known of the timing of appearance, and levels of this plant growth regulator (PGR) in onion cultivars with differing storage potential and the consequential changes in significant storage compounds.The expected deliverables from this project were:
An understanding of the role and effects of ABA in storage potential of onions. Potential identification of superior markers for storage condition.
Summary of the project and main conclusions
The role of ABA in onion bulb dormancyThe changes in ABA during storage of onion bulbs with different storage
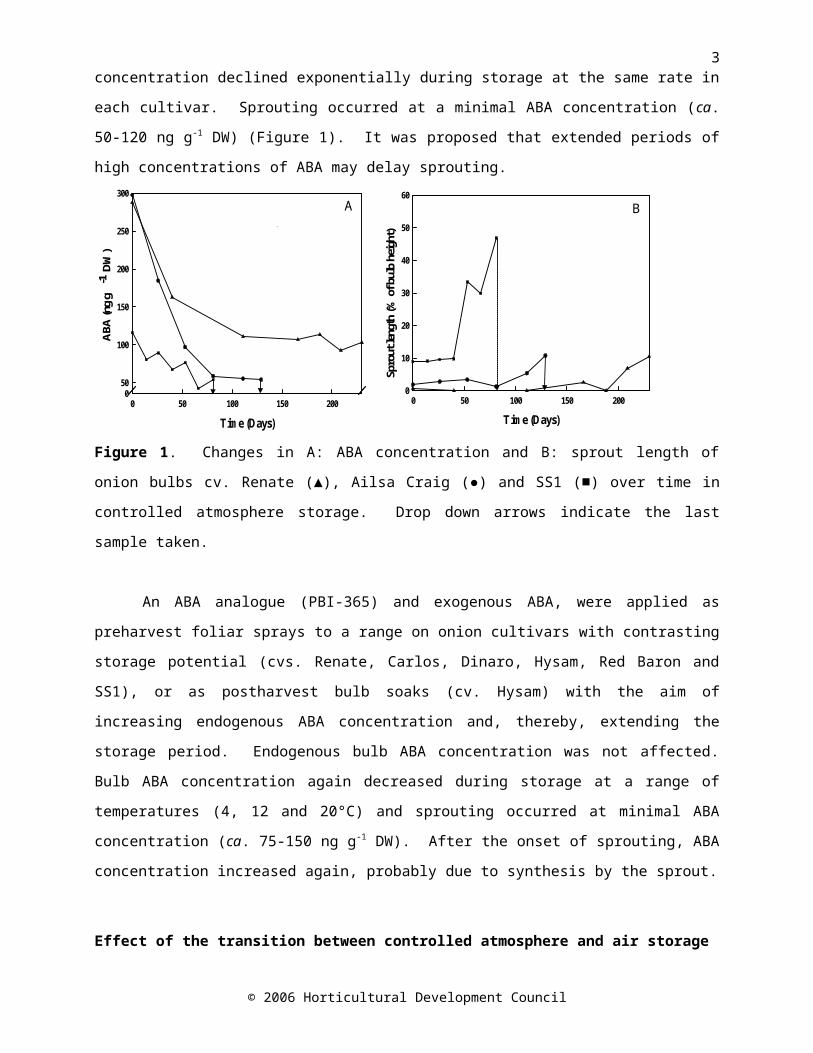
potentials (viz. Renate - long, Ailsa Craig - intermediate and SS1 - short) were profiled in order to determine the significant changes that lead to the breaking of bulb dormancy and the onset of sprouting. The onions were stored in controlled atmosphere (CA) conditions (5% O2, 3%CO2; 2ºC). Bulb ABA concentration measured before storage was greatest in onion cv. Renate and Ailsa Craig bulbs, and least in onion cv. SS1 bulbs (on a fresh weight basis). Bulb ABA concentration declined exponentially during storage at the same rate in each cultivar. Sprouting occurred at a minimal ABA concentration (ca. 50-120 ng g-1 DW) (Figure 1). It was proposed that extended periods of high concentrations of ABA may delay sprouting.
Figure 1. Changes in A: ABA concentration and B: sprout length of onion bulbs cv. Renate (▲), Ailsa Craig (●) and SS1 (■) over time in controlled atmosphere storage. Drop down arrows indicate the last sample taken.
© 2006 Horticultural Development Council
Time (Days)
0 50 100 150 200
Spro
ut le
ngth
(% o
f bul
b he
ight
)
0
10
20
30
40
50
60
Time (Days)
0 50 100 150 200
AB
A (n
g g
-1 D
W)
050
100
150
200
250
300A B
3An ABA analogue (PBI-365) and exogenous ABA, were applied as preharvest
foliar sprays to a range on onion cultivars with contrasting storage potential (cvs. Renate, Carlos, Dinaro, Hysam, Red Baron and SS1), or as postharvest bulb soaks (cv. Hysam) with the aim of increasing endogenous ABA concentration and, thereby, extending the storage period. Endogenous bulb ABA concentration was not affected. Bulb ABA concentration again decreased during storage at a range of temperatures (4, 12 and 20°C) and sprouting occurred at minimal ABA concentration (ca. 75-150 ng g-1 DW). After the onset of sprouting, ABA concentration increased again, probably due to synthesis by the sprout.
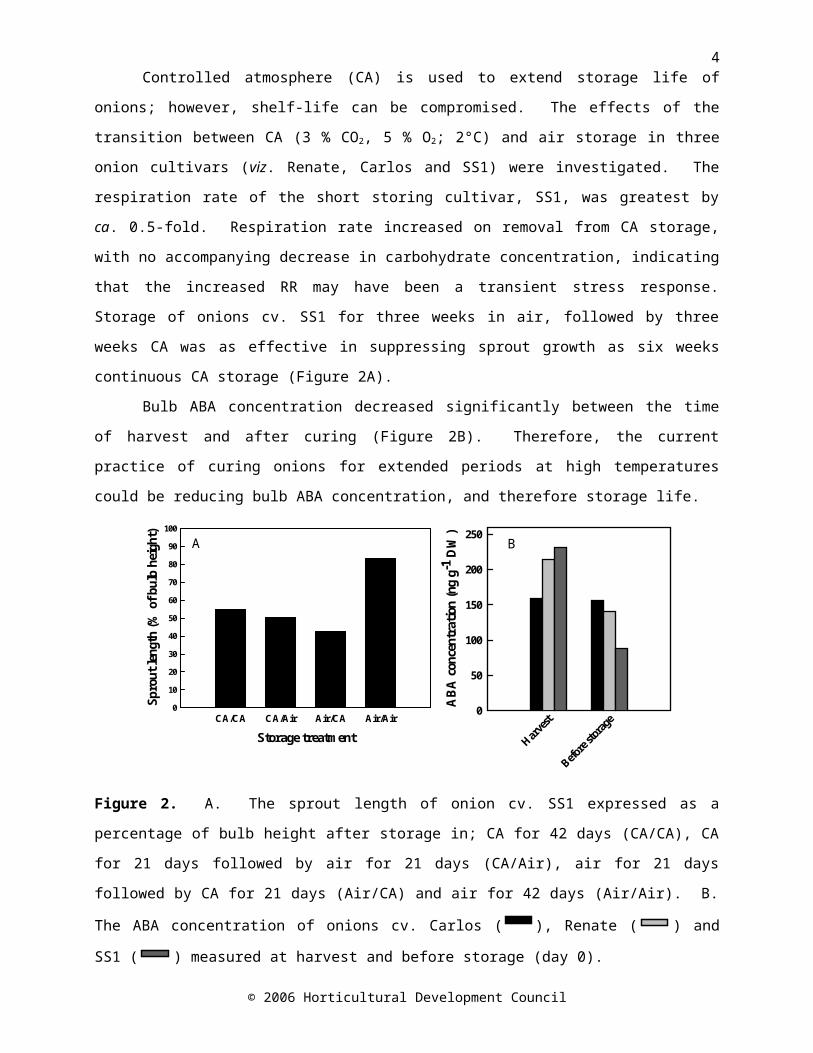
Effect of the transition between controlled atmosphere and air storageControlled atmosphere (CA) is used to extend storage life of onions; however,
shelf-life can be compromised. The effects of the transition between CA (3 % CO 2, 5 % O2; 2°C) and air storage in three onion cultivars (viz. Renate, Carlos and SS1) were investigated. The respiration rate of the short storing cultivar, SS1, was greatest by ca. 0.5-fold. Respiration rate increased on removal from CA storage, with no accompanying decrease in carbohydrate concentration, indicating that the increased RR may have been a transient stress response. Storage of onions cv. SS1 for three weeks in air, followed by three weeks CA was as effective in suppressing sprout growth as six weeks continuous CA storage (Figure 2A).
Bulb ABA concentration decreased significantly between the time of harvest and after curing (Figure 2B). Therefore, the current practice of curing onions for extended periods at high temperatures could be reducing bulb ABA concentration, and therefore storage life.
© 2006 Horticultural Development Council
Storage treatmentCA/CA CA/Air Air/CA Air/Air
Spro
ut le
ngth
(% o
f bul
b he
ight
)
0
10
20
30
40
50
60
70
80
90
100
Harvest
Before
storag
e
AB
A c
once
ntra
tion
(ng
g-1 D
W)
0
50
100
150
200
250A B
4Figure 2. A. The sprout length of onion cv. SS1 expressed as a percentage of bulb height after storage in; CA for 42 days (CA/CA), CA for 21 days followed by air for 21 days (CA/Air), air for 21 days followed by CA for 21 days (Air/CA) and air for 42 days (Air/Air). B. The ABA concentration of onions cv. Carlos ( CA/CA
RA/AARA/CARA/RA
), Renate (CA/CARA/AARA/CARA/RA
) and SS1 (
CA/CARA/AARA/CARA/RA) measured at harvest and before storage (day 0).
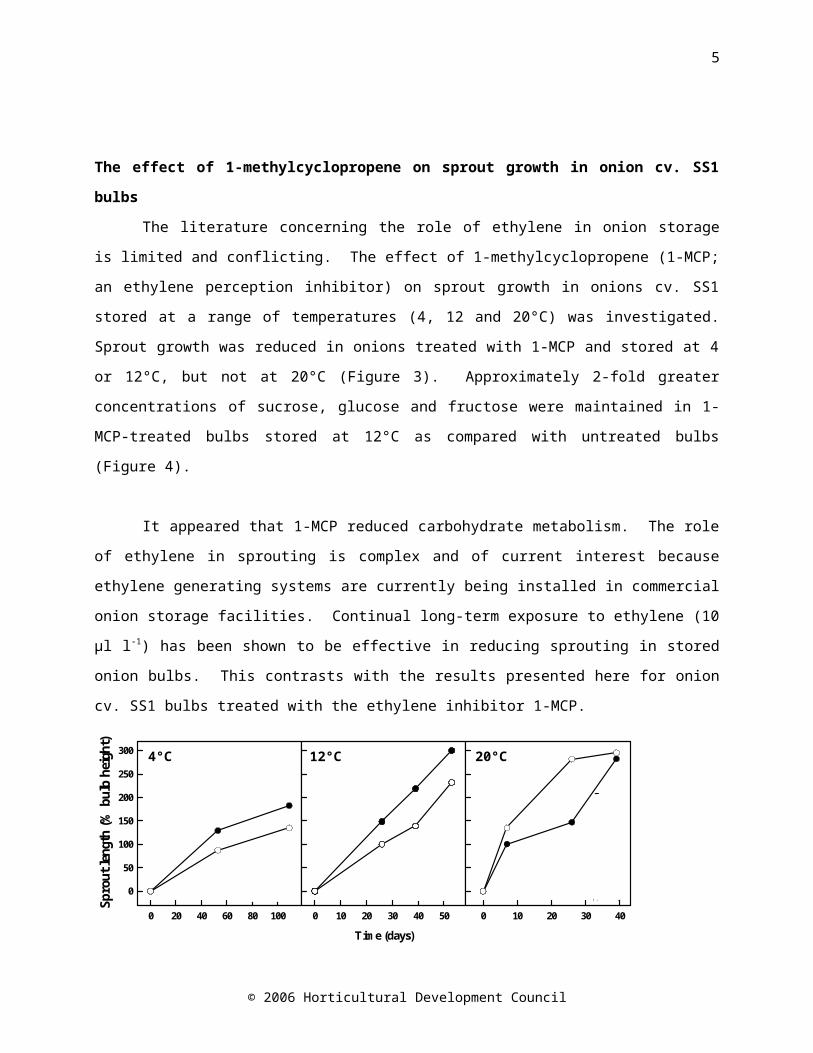
The effect of 1-methylcyclopropene on sprout growth in onion cv. SS1 bulbs
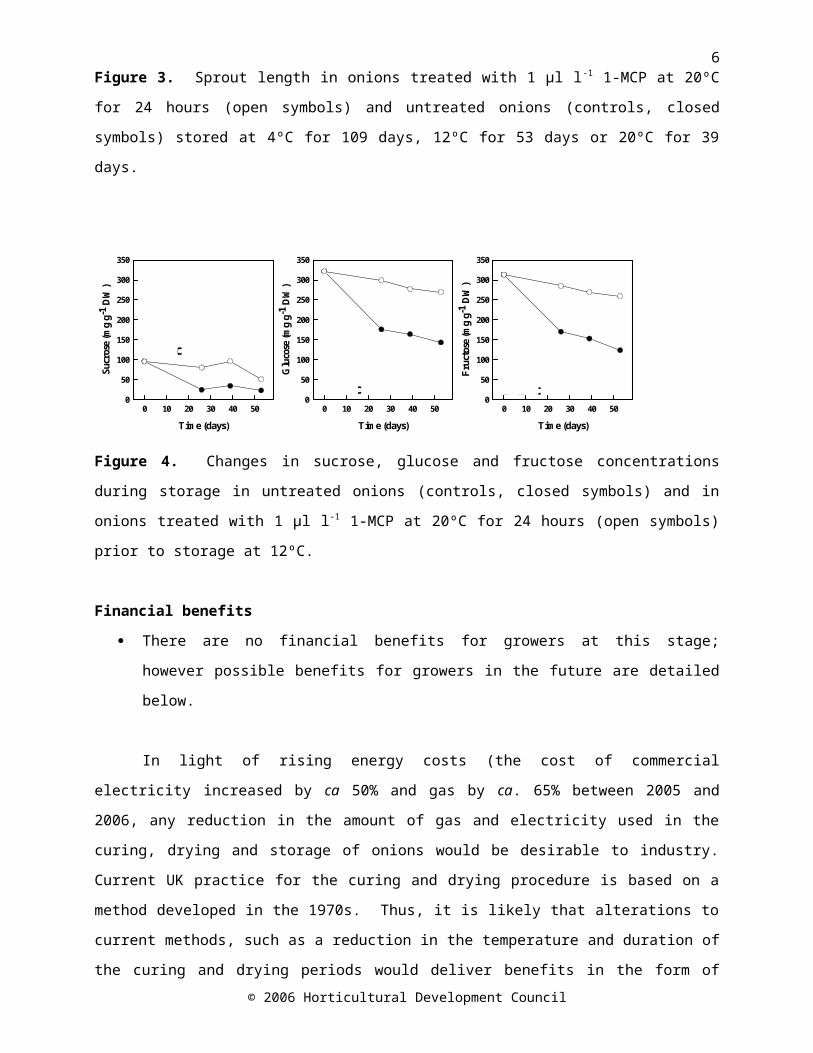
The literature concerning the role of ethylene in onion storage is limited and conflicting. The effect of 1-methylcyclopropene (1-MCP; an ethylene perception inhibitor) on sprout growth in onions cv. SS1 stored at a range of temperatures (4, 12 and 20°C) was investigated. Sprout growth was reduced in onions treated with 1-MCP and stored at 4 or 12°C, but not at 20°C (Figure 3). Approximately 2-fold greater concentrations of sucrose, glucose and fructose were maintained in 1-MCP-treated bulbs stored at 12°C as compared with untreated bulbs (Figure 4).
It appeared that 1-MCP reduced carbohydrate metabolism. The role of ethylene in sprouting is complex and of current interest because ethylene generating systems are currently being installed in commercial onion storage facilities. Continual long-term exposure to ethylene (10 µl l -1) has been shown to be effective in reducing sprouting in stored onion bulbs. This contrasts with the results presented here for onion cv. SS1 bulbs treated with the ethylene inhibitor 1-MCP.
0 20 40 60 80 100
Spro
ut le
ngth
(% b
ulb
heig
ht)
0
50
100
150
200
250
300
Time (days)
0 10 20 30 40 50 0 10 20 30 40
Figure 3. Sprout length in onions treated with 1 µl l-1 1-MCP at 20ºC for 24 hours (open symbols) and untreated onions (controls, closed symbols) stored at 4ºC for 109 days, 12ºC for 53 days or 20ºC for 39 days.
© 2006 Horticultural Development Council
4°C 12°C 20°C
A B C A B C A B C
5
Time (days)
0 10 20 30 40 50
Sucr
ose
(mg
g-1
DW
)
0
50
100
150
200
250
300
350
Time (days)
0 10 20 30 40 50G
luco
se (m
g g-
1 D
W)
0
50
100
150
200
250
300
350
Time (days)
0 10 20 30 40 50
Fruc
tose
(mg
g-1
DW
)
0
50
100
150
200
250
300
350
Figure 4. Changes in sucrose, glucose and fructose concentrations during storage in untreated onions (controls, closed symbols) and in onions treated with 1 µl l-1 1-MCP at 20ºC for 24 hours (open symbols) prior to storage at 12ºC.
Financial benefits There are no financial benefits for growers at this stage; however possible
benefits for growers in the future are detailed below.
In light of rising energy costs (the cost of commercial electricity increased by ca 50% and gas by ca. 65% between 2005 and 2006, any reduction in the amount of gas and electricity used in the curing, drying and storage of onions would be desirable to industry. Current UK practice for the curing and drying procedure is based on a method developed in the 1970s. Thus, it is likely that alterations to current methods, such as a reduction in the temperature and duration of the curing and drying periods would deliver benefits in the form of energy savings and reduced carbon emissions, while still producing onion bulbs of a satisfactory quality standard. The concentration of ABA at the beginning of the storage period appeared to be a good marker of storage potential of onion bulbs. Bulb ABA concentration decreased during curing; therefore ABA concentration would be a very useful parameter to monitor during different curing and drying regimes. This could lead to breeding of improved onion cultivars that perform better under more efficient curing regimes.
Storage of onions cv. SS1 in air for three weeks, followed by three weeks CA storage achieved a level of sprout suppression equal to that using six weeks continuous CA storage. Further investigation into the effects of delaying the start of CA storage has the potential to reduce the costs associated with this method while not compromising on effectiveness.
© 2006 Horticultural Development Council
a b c
a b ca b c
6It is recommended that 1-MCP be used as a tool to help elucidate the
mechanisms by which continual exposure to ethylene reduces sprout growth in some onion cultivars. It is also likely that this research would have the potential to increase the efficiency and optimise the application of ethylene to the crop either in terms of more precise timing of application or perhaps using pulsed treatment rather than continual application thus reducing the cost. In addition, the concentration of simple sugars in onions cv. SS1 treated with 1-MCP was elevated, implying that that 1-MCP treatment has a positive impact on flavour in this cultivar. Therefore, further investigation should be made into the utilisation of this the use of 1-MCP to manipulate sugar content.
Action points for growers
There are no recommended changes to current grower practice at this stage.However, the results from this project have formed the foundation of a recent successful application to DEFRA HortLink entitled ‘HL0181 – Sustaining UK fresh onion supply be improving consumer acceptability, quality and availability’. This project will investigate the effects of reducing the temperature used in the curing process, and the optimisation of novel postharvest treatements, on bulb quality and storability.
© 2006 Horticultural Development Council
7
1.0CHAPTER ONE
Introduction
1.1 Project background
Onion (Allium cepa) is an important crop that is grown worldwide. Cultivars adapted to temperate climates require long days for bulb initiation; therefore the summer crop must be stored over the winter. A major cause of loss of stored onions is re-growth in the form of a green sprout that eventually protrudes from the neck of the bulb. Maleic hydrazide (MH) is a synthetic sprout suppressant that inhibits sprout growth, but leaves a residue in the bulb. Concerns from retailers and consumers about residues in foodstuffs are increasing, so the future for the use of MH is uncertain, and other methods of sprout suppression will need to be sought. In the past, work to improve onion storage potential has concentrated on breeding, cultural practices and optimisation of the storage environment, with relatively little attention paid to the mechanisms behind onion bulb dormancy.
This project was funded by the Horticultural Development Council (HDC; CP 20) to investigate alternative targets for possible manipulation to control sprouting in store.
1.2 Aim and objectives
1.2.1 Aim
The aim of this project was to determine how the biochemical and physical changes occurring in stored onion bulbs influence the storage potential of UK-grown bulbs, in relation to the possibilities for improved storage of onions.
© 2006 Horticultural Development Council
8
© 2006 Horticultural Development Council
9
1.2.2 Objectives1
To determine if differences exist in the initial concentrations and/or rate of degradation of abscisic acid (ABA) in bulbs of onion cultivars with different storage potential.
To determine if the remobilisation of carbohydrates is affected by, and correlated with, the concentration of ABA in the bulb.
To verify the effect, if any, on storage potential of bulb ABA concentration using a chemical analogue of ABA.
To determine the effect of an ethylene inhibitor on onion storage life. To determine the effect of the transition between controlled
atmosphere storage and air on bulbs of onion cultivars with different storage potential.2
To relate the observations made to the potential to influence onion storage life by changes in horticultural practices.
1.3 Structure of the science section
The science section is arranged into seven chapters. Chapter 2 is a review of existing literature. First, it describes the lifecycle of the onion plant and its importance as a crop species. The current strategies used to delay sprouting are then outlined. After this, the pre- and postharvest factors that affect onion storage life are described, followed by a consideration of the biochemical and physical changes that occur within stored onion bulbs as targets for manipulation to increase onion storage life.
The initial concentration and the rate of degradation of ABA during storage of onion cultivars with different storage lives had not been compared previously. Chapter 3 details the temporal changes in ABA concentration and other quality traits during controlled atmosphere (CA) storage of onion bulbs
1 Objectives revised under agreement.2 Additional objective.
© 2006 Horticultural Development Council
10
of three cultivars with contrasting storage potential. Controlled atmosphere was used to extend to viable sampling period.
Synthetic analogues of ABA that resist degradation are available. The effect of synthetic analogues of abscisic acid on onion dormancy has not previously been investigated. Chapter 4 describes experiments aimed at increasing endogenous bulb ABA concentration via the application of exogenous ABA and an ABA analogue (PBI-365; 8’-methylene ABA methyl ester) in the form of a pre-harvest foliar spray (six cultivars) or a postharvest bulb soak (one cultivar only). An extended range of six cultivars were tested and onions from this study were stored at a range of temperatures (4, 12 or 20ºC) to ensure that sprout growth would progress fully in all cultivars allowing measurements to be taken from bulbs at all physiological stages.
Literature concerning the effects of the plant growth regulator ethylene on stored onions is limited and conflicting, and more investigation is required to determine the role of ethylene in onion bulb dormancy. Chapter 5 reports an experiment to investigate the effect of the use of 1-methylcyclopropene (1-MCP), an inhibitor of ethylene perception, as a postharvest treatment of short storing onion cv. SS1 bulbs on sprout growth, quality characteristics, non-structural carbohydrates and ABA.
Controlled atmosphere is used to extend storage life of onions, however, upon removal from CA storage, the time to sprouting is accelerated. It is therefore essential that the onions from CA reach the consumer within a certain time constraint as shelf-life can be compromised. Chapter 6 describes the effect of the transition between CA and air storage on ABA concentration, quality characteristics, respiration rate and non-structural carbohydrate concentration in onion bulbs of three cultivars with contrasting storage potential. In addition the effect of the curing process on bulb ABA concentration is discussed.
Chapter 7 is a general discussion which integrates the results from previous chapters, proposes recommendations for future research, and
© 2006 Horticultural Development Council
11
considers the implications of the results in terms of the considerations for onion growers.
© 2006 Horticultural Development Council
12
2.0 CHAPTER TWO
Literature Review
2.1 Allium cepa L.
The common onion (Allium cepa L.) belongs to the genus Allium (family Alliaceae). The Allium genus comprises over 700 botanical species distributed throughout the temperate, warm temperate, boreal and tropical (mountainous areas only) zones of the world, predominantly in the Northern Hemisphere. Species within the genus are mostly perennial, bulbous plants. Their life cycles exhibit a variety of responses to seasonal and climatic changes according to the environment in which they live; consistent with the ecological diversification that has accompanied the evolution of Alliums (Fritsch and Friesen, 2002). For example, summer dormant species are adapted to dry summers and winter dormant species are adapted to cold regions (Brewster, 1994). Onions belong to the subgenus Allium and the section Cepa. The onion has been cultivated for around 5000 years and no longer exists as a wild species (Brewster, 1994). The direct wild ancestor of onion is not known. Wild species in the section Cepa are adapted to grow in sites with a shallow soil layer such as rock crevices, stony slopes and river banks (Fritsch and Friesen, 2002). Wild Alliums have a long annual growth cycle (spring to winter) and take between three and ten years to reach flowering maturity.
2.2 Economic importance of the onion crop in the UK
Onions (Allium cepa L.) grown in the UK are produced for human consumption. Onions, leeks (Allium porrum L.) and shallots (Allium cepa L. Aggregatum Group) account for 4.3% of overall fruit and vegetable consumption in the UK (DEFRA, 2003). As well as being sold for the fresh
© 2006 Horticultural Development Council
13
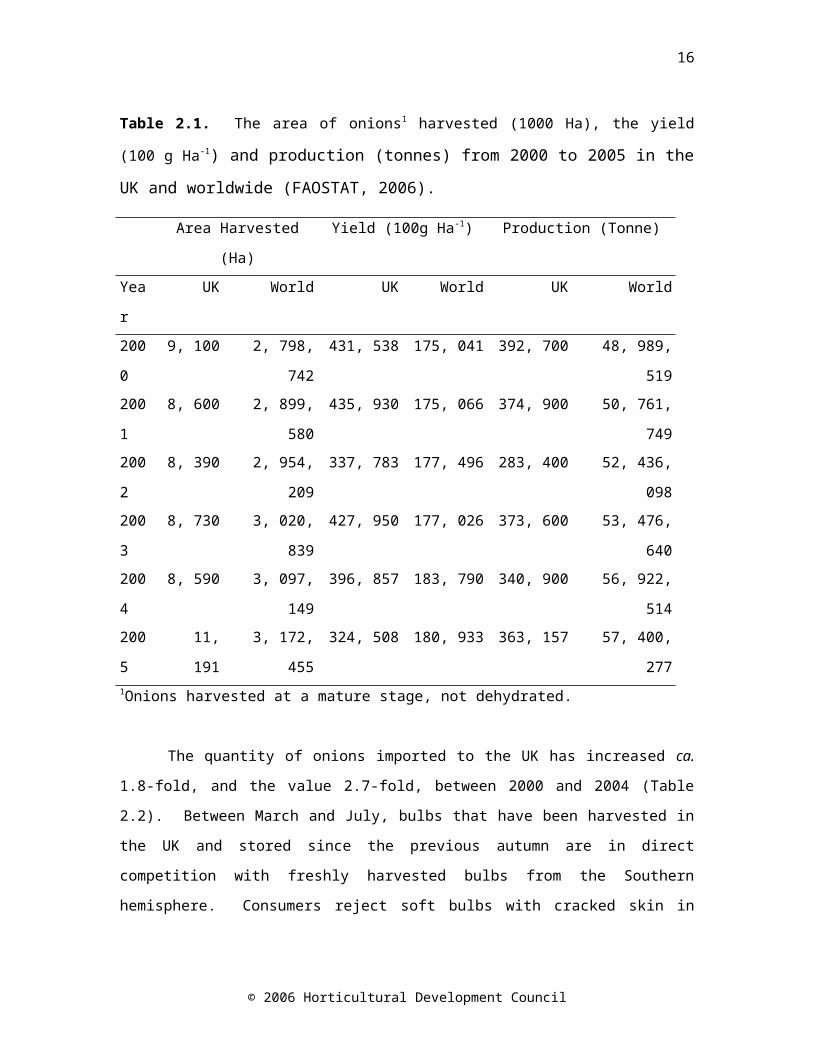
market, onions are components in a wide variety of processed foods. Onions are the most economically important Allium crop, with their value to the producer rising from £100 per tonne in 2000 to £156 per tonne in 2003 (FAOSTAT, 2006). An area of just over 11, 000 hectares of onions was harvested in the UK in 2005, accounting for 0.63% of worldwide production (Table 2.1).
Table 2.1. The area of onions1 harvested (1000 Ha), the yield (100 g Ha-1)
and production (tonnes) from 2000 to 2005 in the UK and worldwide (FAOSTAT, 2006).
Area Harvested (Ha) Yield (100g Ha-1) Production (Tonne)
Year UK World UK World UK World
2000
9, 100 2, 798, 742 431, 538 175, 041 392, 700 48, 989, 519
2001
8, 600 2, 899, 580 435, 930 175, 066 374, 900 50, 761, 749
2002
8, 390 2, 954, 209 337, 783 177, 496 283, 400 52, 436, 098
2003
8, 730 3, 020, 839 427, 950 177, 026 373, 600 53, 476, 640
2004
8, 590 3, 097, 149 396, 857 183, 790 340, 900 56, 922, 514
2005
11, 191 3, 172, 455 324, 508 180, 933 363, 157 57, 400, 277
1Onions harvested at a mature stage, not dehydrated.
The quantity of onions imported to the UK has increased ca. 1.8-fold, and the value 2.7-fold, between 2000 and 2004 (Table 2.2). Between March and July, bulbs that have been harvested in the UK and stored since the previous autumn are in direct competition with freshly harvested bulbs from the Southern hemisphere. Consumers reject soft bulbs with cracked skin in
© 2006 Horticultural Development Council

14
favour of imported bulbs. It is important for UK growers to compete at this time of year, so that this valuable market share is not lost to imports.
© 2006 Horticultural Development Council

15
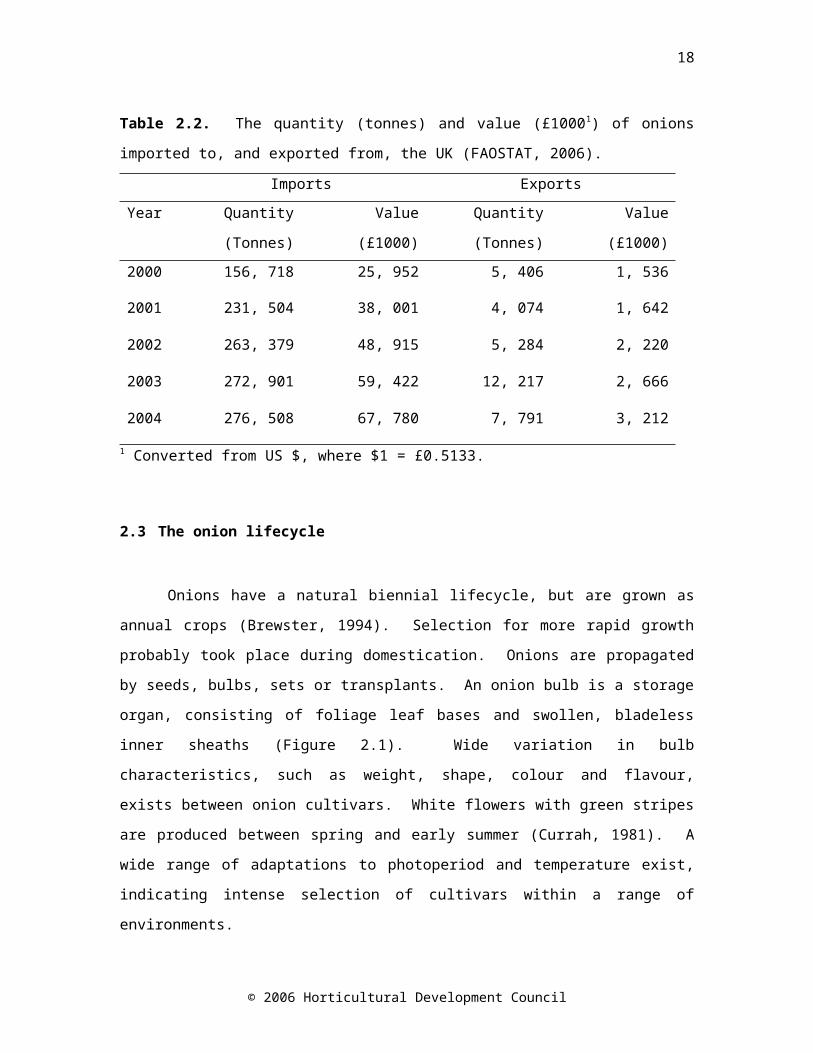
Table 2.2. The quantity (tonnes) and value (£10001) of onions imported to, and exported from, the UK (FAOSTAT, 2006).
Imports ExportsYear Quantity
(Tonnes)Value
(£1000)Quantity (Tonnes)
Value(£1000)
2000 156, 718 25, 952 5, 406 1, 536
2001 231, 504 38, 001 4, 074 1, 642
2002 263, 379 48, 915 5, 284 2, 220
2003 272, 901 59, 422 12, 217 2, 666
2004 276, 508 67, 780 7, 791 3, 212
1 Converted from US $, where $1 = £0.5133.
2.3 The onion lifecycle
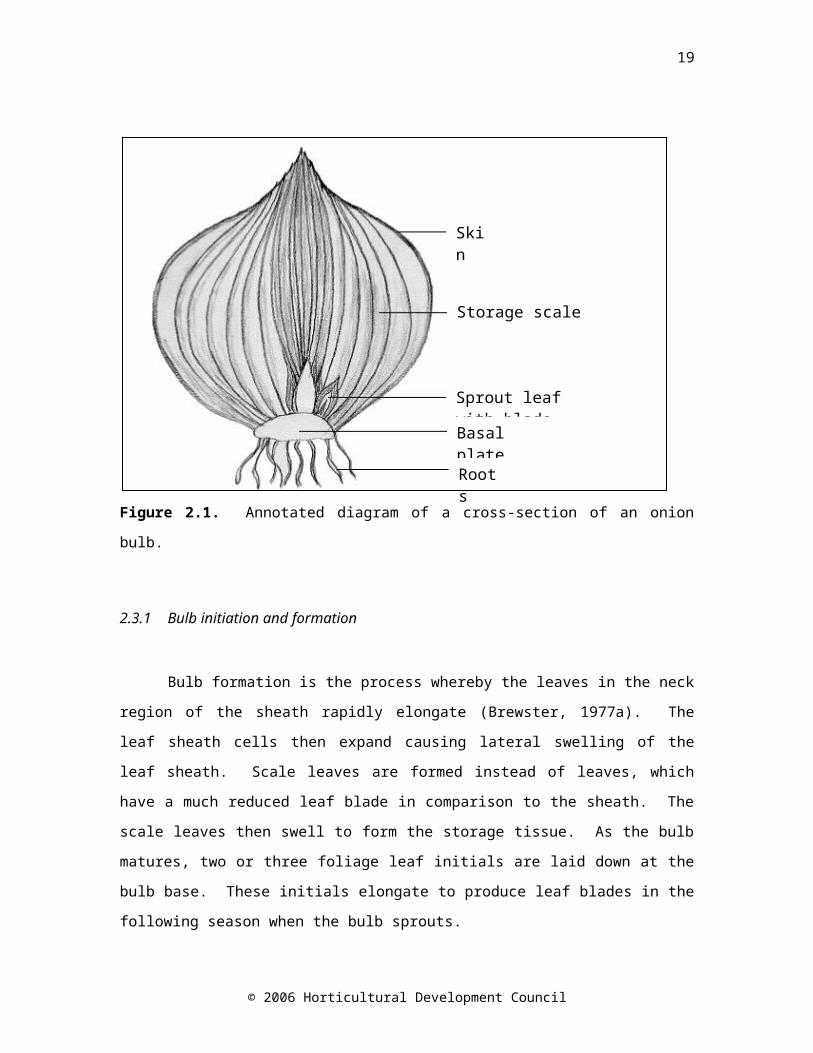
Onions have a natural biennial lifecycle, but are grown as annual crops (Brewster, 1994). Selection for more rapid growth probably took place during domestication. Onions are propagated by seeds, bulbs, sets or transplants. An onion bulb is a storage organ, consisting of foliage leaf bases and swollen, bladeless inner sheaths (Figure 2.1). Wide variation in bulb characteristics, such as weight, shape, colour and flavour, exists between onion cultivars. White flowers with green stripes are produced between spring and early summer (Currah, 1981). A wide range of adaptations to photoperiod and temperature exist, indicating intense selection of cultivars within a range of environments.
© 2006 Horticultural Development Council
16
Figure 2.1. Annotated diagram of a cross-section of an onion bulb.
2.3.1 Bulb initiation and formation
Bulb formation is the process whereby the leaves in the neck region of the sheath rapidly elongate (Brewster, 1977a). The leaf sheath cells then expand causing lateral swelling of the leaf sheath. Scale leaves are formed instead of leaves, which have a much reduced leaf blade in comparison to the sheath. The scale leaves then swell to form the storage tissue. As the bulb matures, two or three foliage leaf initials are laid down at the bulb base. These initials elongate to produce leaf blades in the following season when the bulb sprouts.
Bulb formation in onion plants occurs when both a threshold day length and accumulated thermal time have been reached (Lancaster et al., 1996). In the case of two closely related cultivars commonly grown in New Zealand (Pukekohe Longkeeper and Early Longkeeper), these thresholds are ca. 13.5
© 2006 Horticultural Development Council
Skin
Storage scale
Sprout leaf with blade
Basal plate
Roots
17
hours and 590 degree days respectively. Threshold values will vary according to cultivar, however the thermal time threshold is thought to be linked with the requirement for a minimum number of leaves to be initiated prior to bulbing. If the threshold thermal time is reached before critical day length then bulbing is delayed and subsequent bulbs have larger diameters and more leaves. Conversely, the threshold day length can be reached before threshold thermal time has accumulated, and in this case bulbing is delayed until the thermal time requirements have been met. Light spectral quality interacts with day length (Brewster, 1990). Short-day onions form bulbs under short day lengths at low latitudes; however their behaviour is typical of other onions in that bulbing accelerates with increased day length (Wickramasinghe et al., 2000). Far-red light, and to a lesser extent blue light, promote bulbing, whereas red light inhibits it (Kahane et al., 1992). Once bulbing has been initiated, temperature (including night temperature) is positively correlated with the rate of bulb development in an inductive day length (Brewster, 1990; Wheeler et al., 1998).
2.3.2 Onion bulb dormancy
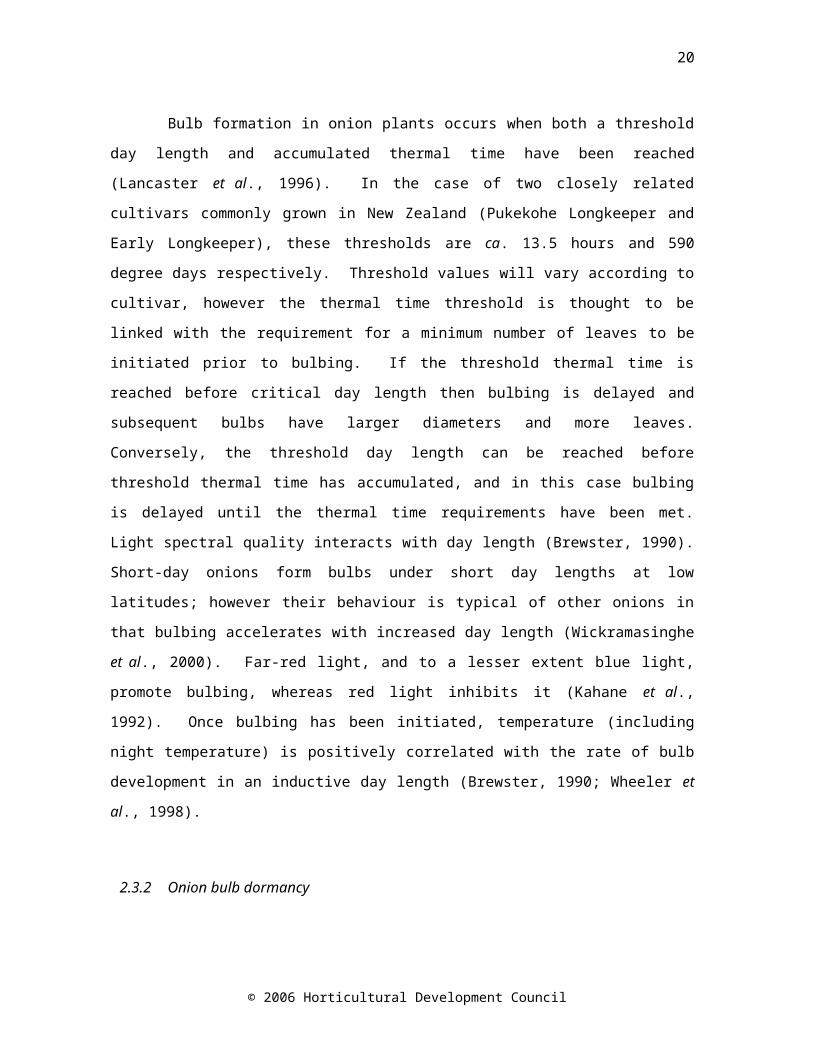
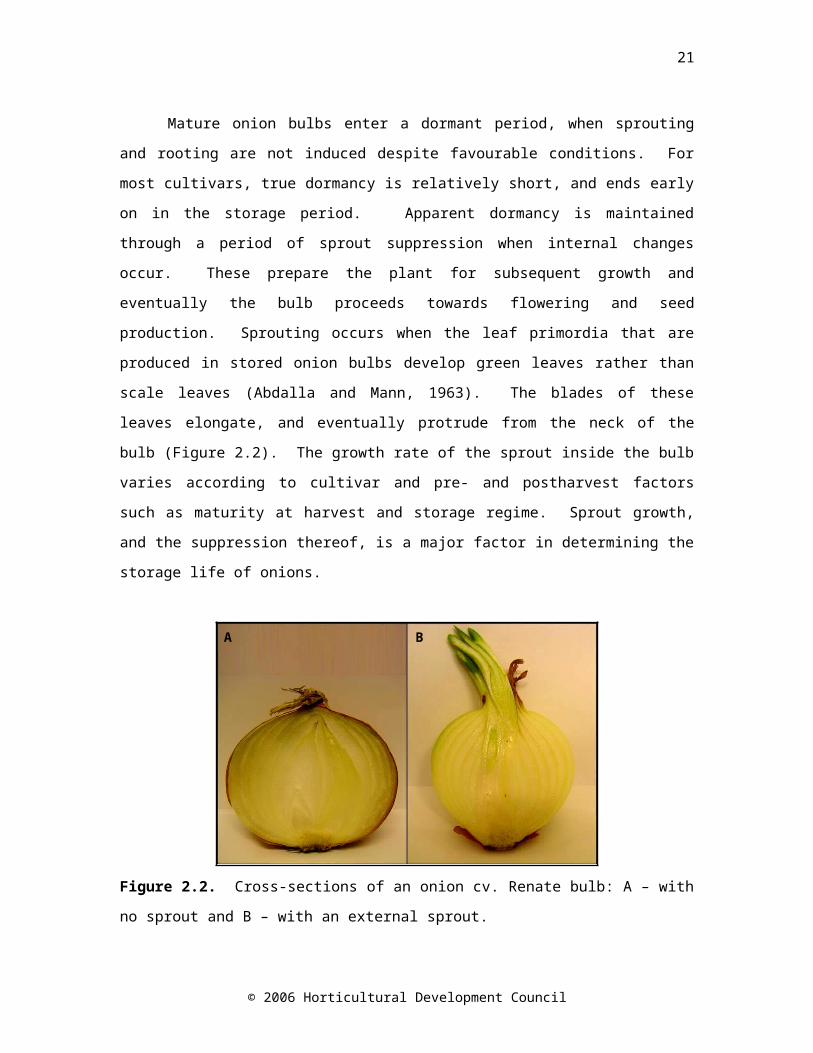
Mature onion bulbs enter a dormant period, when sprouting and rooting are not induced despite favourable conditions. For most cultivars, true dormancy is relatively short, and ends early on in the storage period. Apparent dormancy is maintained through a period of sprout suppression when internal changes occur. These prepare the plant for subsequent growth and eventually the bulb proceeds towards flowering and seed production. Sprouting occurs when the leaf primordia that are produced in stored onion bulbs develop green leaves rather than scale leaves (Abdalla and Mann, 1963). The blades of these leaves elongate, and eventually protrude from the neck of the bulb (Figure 2.2). The growth rate of the sprout inside the bulb varies according to cultivar and pre- and postharvest factors such as
© 2006 Horticultural Development Council
18
maturity at harvest and storage regime. Sprout growth, and the suppression thereof, is a major factor in determining the storage life of onions.
Figure 2.2. Cross-sections of an onion cv. Renate bulb: A – with no sprout and B – with an external sprout.
Bulbs with roots sprout earlier in dry storage than those whose roots have been removed (Miedema, 1994b). Therefore, the root system may provide substances that promote sprout growth or elongation. Cultivar differences in time to sprouting in store are more pronounced in de-rooted bulbs than in rooted bulbs (Miedema, 1994b). Cytokinins produced in the roots stimulate cell division in the sprout meristem or increase the sink activity of the sprout. Wounding of the growth plate also promotes sprouting and may do so by facilitating gas exchange and promoting respiration.
2.4 Quality attributes of marketable onions
The aim of onion bulb storage is to meet consumer demands for extended availability of onions whilst maintaining product quality. The principal biological factors leading to onion bulb deterioration during storage are respiration, resumption of growth and pathogen attack.
© 2006 Horticultural Development Council
A B
19
Class I onions must not show any signs of external sprouting (Commission Regulation 1508/2001/EEC). Early signs of external shoot growth are permitted in Class II onions provided that the number or weight does not exceed 10% per unit of presentation. Bulbs with watery scale and bacterial or fungal rots are deemed unfit for marketing.
2.5 Strategies to delay sprouting
Storage life of onions depends on many factors such as cultivar and pre- and postharvest treatment. Long storing cultivars are available and are characterised by high dry matter content. New varieties of less pungent low dry matter onions grown for the fresh market for raw consumption are becoming more popular, but generally do not store very well (Hurst et al., 1985). Research to develop strategies to delay sprouting has been focused on crop husbandry, the characteristics of the storage environment and breeding programmes.
2.6 Pre-harvest factors that affect storage life
Pre-harvest treatment and conditions in the field have an important role to play in affecting storage life. These include pre-harvest nutrition, temperature during the growing season, application of maleic hydrazide, crop maturity at harvest and the harvesting process.
2.6.1 Pre-harvest nutrition
Reduced nitrogen fertilisation caused onions cv. Hyton to mature later, with a later harvest date and reduced yield (Sorensen and Grevsen, 2001). Nitrogen deficiency also slightly reduced shelf-life. Drought-stressed onions matured earlier with increased dry matter concentration but reduced yield
© 2006 Horticultural Development Council
20
(Sorensen and Grevsen, 2001). A 75% water deficit in the top 25 cm soil profile was reported to reduce postharvest sprouting; however in these experiments storage of bulbs from all treatments was ended on the same date despite different harvest dates. This meant that, although samples were taken simultaneously, the time in storage was not the same. Therefore, reduced sprouting could have been due to the later harvest date and, consequently, shorter storage time.
Sulphur nutrition impacts on dry weight and bulb quality. Onions grown in a hydroponic system with high sulphur nutrition were firmer than those grown with low sulphur nutrition, and had a higher fresh weight (Lancaster et al., 2001). As greater bulb dry matter is correlated with improved storage attributes it is possible that sulphur fertilisation could improve storage life, although with the increasing demand for less pungent onions (see section 2.9.2) it is unlikely that this strategy would be adopted by growers.
2.6.2 Growing season temperature
Storage potential varies between crops harvested in different years; even when identical cultural, drying and storage regimes are followed. This is presumably due to climatic variation between growing seasons (Rutherford and Whittle, 1982). Higher temperatures during the growing season reduce storage life (Rutherford and Whittle, 1982; Wheeler et al., 1998; Sorensen and Grevsen, 2001). Wheeler et al. (1998) concluded that although the time until onset of sprouting (first visible sprout) was not affected by growing season temperature, the rate of increase in the number of sprouted bulbs increased with growing season temperature. However, a linear function was used to describe the relationship between the numbers of bulbs sprouted and the duration of storage, and onset of sprouting was calculated by extrapolation. A bulb was classed as sprouted after emergence of a visible sprout, therefore this method did not allow for differences that may exist
© 2006 Horticultural Development Council

21
between the sprout growth rate inside the bulb and the growth rate outside the bulb, and so the estimated time of onset of sprouting may not have been precise.
2.6.3 Maleic hydrazide
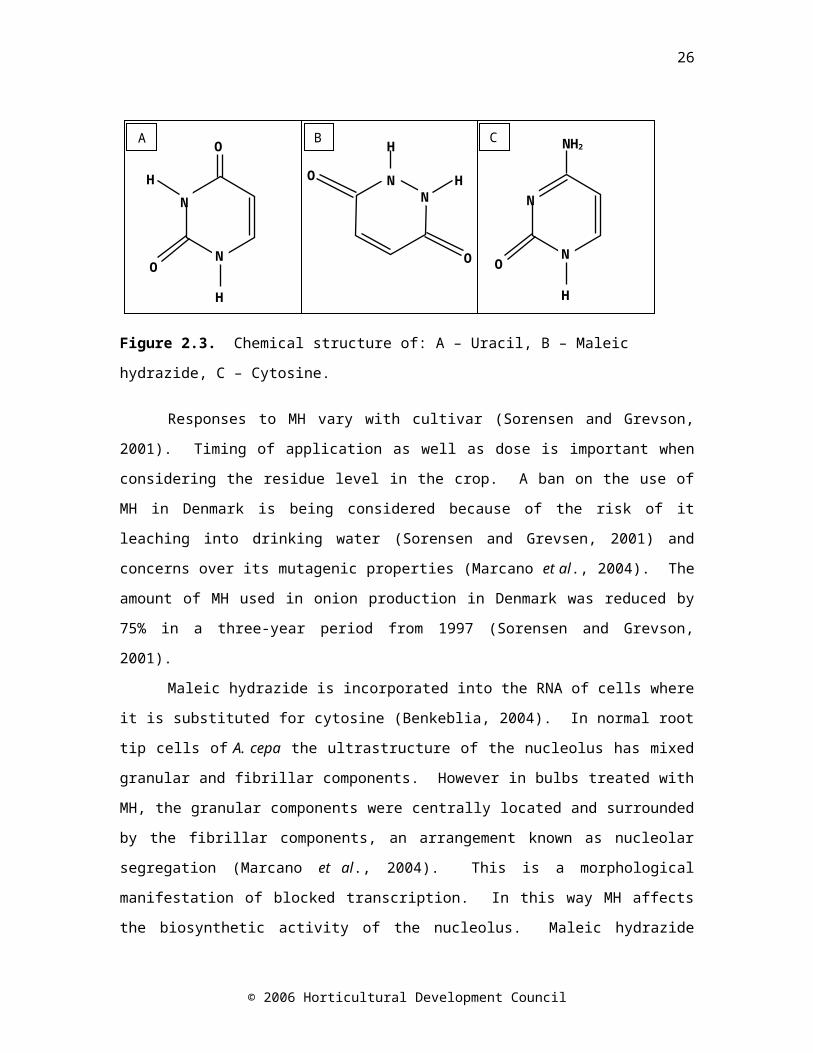
Maleic hydrazide (1,2-dihydro-3,6-pyridazinedione; MH) is a chemical isomer of uracil that is applied as a pre-harvest spray to inhibit subsequent sprouting of bulbs in store (Figure 2.3).
Figure 2.3. Chemical structure of: A – Uracil, B – Maleic hydrazide, C – Cytosine.
Responses to MH vary with cultivar (Sorensen and Grevson, 2001). Timing of application as well as dose is important when considering the residue level in the crop. A ban on the use of MH in Denmark is being considered because of the risk of it leaching into drinking water (Sorensen and Grevsen, 2001) and concerns over its mutagenic properties (Marcano et al., 2004). The amount of MH used in onion production in Denmark was
© 2006 Horticultural Development Council
A B C
N
N
NH2
H
O
NN
H
HO
O
N
N
O
H
O
H
22
reduced by 75% in a three-year period from 1997 (Sorensen and Grevson, 2001).
Maleic hydrazide is incorporated into the RNA of cells where it is substituted for cytosine (Benkeblia, 2004). In normal root tip cells of A. cepa the ultrastructure of the nucleolus has mixed granular and fibrillar components. However in bulbs treated with MH, the granular components were centrally located and surrounded by the fibrillar components, an arrangement known as nucleolar segregation (Marcano et al., 2004). This is a morphological manifestation of blocked transcription. In this way MH affects the biosynthetic activity of the nucleolus. Maleic hydrazide caused a dose dependent reduction in the mitotic index (the mitotic index allows estimation of the frequency of cell division) compared to untreated bulbs whereby the mitotic index remains constant. The effect of MH concentration was 1.93-fold higher than the effect of the time of exposure. Maleic hydrazide was also capable of breaking chromosomes. However, MH had no effect on sugar and organic acid composition of onion bulbs cv. Sentinel (Salama et al., 1990).
2.6.4 Crop maturity at harvest
The developmental stage of the crop at harvest impacts on both yield and storage potential. The consensus in Europe and the USA is that the optimum harvest time for storage onions is at 80-90% tops down, sacrificing some yield for a greater number of intact skins (Gubb and MacTavish, 2002). If bulbs are harvested too soon the water content in foliage leaves and the neck is too high, which results in increased susceptibility to pathogen attack. Early harvested bulbs may not be dormant and would therefore be unsuitable for storage purposes. Maturity stage at harvest can influence initial bulb weight, respiration and incidence of sprouting, decay and cumulative weight loss. Rutherford and Whittle (1982) found that bulbs harvested early, dried and stored in the same manner as bulbs harvested later, had lower
© 2006 Horticultural Development Council
23
carbohydrate levels, which were reduced further during sprouting, which occurred earlier.
2.6.5 Harvesting process
Physical damage to onion bulbs during harvesting must be minimised, especially for softer, less pungent onions, because wounding, particularly of the basal plate, causes accelerated sprout growth (Miedema, 1994b) and increases storage losses due to rotting (Herold et al., 1998). Undercutting is usually performed prior to mechanised lifting. The aerial parts and roots are removed before onions are stored in bulk, which aids airflow among the bulbs. In temperate countries, the crop is then moved directly into a heated, forced-air ventilation store for immediate curing (Gubb and MacTavish, 2002).
2.7 Postharvest factors that affect storage life
Postharvest treatments and storage conditions have a significant impact on storage life. These include curing and drying, irradiation, nitrous oxide treatment, and aspects of the storage environment including temperature, gaseous composition of the atmosphere, and humidity.
2.7.1 Curing and drying
Onions for storage are cured and dried after harvest (O’Connor, 1979; Gubb and MacTavish, 2002). It is important that the skin integrity, firmness, colour and flavour are maintained during curing. The purpose of curing is to dry the thin outer layers of the bulb to form one or more complete outer skins. These outer skins act as a barrier against water loss and infection from fungal pathogens such as Botrytis allii (neck rot) (Maude et al., 1984), Aspergillus niger (black mould) and Fusarium oxysporum (basal rot), and
© 2006 Horticultural Development Council
24
bacterial pathogens such as Erwinia carotovora (soft rot) (Fenwick and Hanley, 1985). Curing is complete when the necks have dried out and are tightly closed, and the skins have an attractive colour (O’Connor, 1979). The time this takes depends on the temperature and relative humidity of the forced ventilating air and the maturation stage of the bulbs. Standard practice is to dry the bulbs in bulk stores using air at 30ºC. After three to five days the temperature is lowered to 24ºC and relative humidity (RH) to 70-75% to complete the curing process. The crop is then slowly cooled to the desired storage temperature.
2.7.2 Irradiation
Irradiation is not popular for food use in many countries, but is an effective method of long-term sprout control and reducing chemical residues (Gubb and MacTavish, 2002). Use of irradiation depends on consumer acceptance, the practicality of treating large volumes, and economics (Kleinkopf et al., 2003).
Ionising radiation (60Co source at a dose of 150 Gy) decreased the respiration rate of onions cv. Rouge Amposta, probably through degeneration of meristematic cells and the death of the sprout caused by the γ-radiation, which slows down the complete respiratory pathway including glycolysis (Benkeblia et al., 2002). After 24 weeks storage at 20C, 5% of irradiated bulbs had sprouted, compared with 75% of non-irradiated bulbs. However, refrigerated storage at 4C for 24 weeks was as effective as ionising radiation in inhibiting sprout growth.
In general ascorbic acid and carbohydrate levels were higher in onion cv. Valencia sintética bulbs irradiated 30 days postharvest at 20C with a 60Co source at a dose of 50 Gy, and stored in warehouse conditions (6 to 32 C and 40-50% RH) for ca. 43 weeks (Croci et al., 1995). This may have been due to increased ease in extracting these substances because of the irradiation or a delay in their metabolism.
© 2006 Horticultural Development Council
25
2.7.3 Nitrous oxide
Nitrous oxide (N2O) is similar to carbon dioxide in terms of relative stability and high solubility in water, and is permitted for food use. Benkeblia and Varoquaux (2003) investigated the possibility of using nitrous oxide to extend the storage period of onions cv. Rouge Amposta. Nitrous oxide has been reported to cause reversible inhibition of oxygen consumption by mitochondria and respiration, to have anti-ethylene effects and to inhibit some bacteria and fungi. Respiration rates in bulbs treated for five days with 50 kPa, 80 kPa and 100 kPa N2O and subsequently stored at 18±0.1ºC and 65±1% RH, were half that of the untreated bulbs, whereas the respiration rate of bulbs treated for 10 and 15 days was approximately 0.8-fold less than that of the untreated bulbs (Benkeblia and Varoquaux, 2003). Five days treatment decreased rots, whereas ten and fifteen days of treatment increased rots. Total soluble sugars were less in untreated bulbs. There was no effect on visible sprouting, but internal sprouting was not assessed.
2.7.4 Storage environment
Temperature, humidity and gaseous atmosphere can be manipulated to increase the storage life of onion bulbs. The most important of these is temperature. The storage regime chosen depends on the cultivar, target storage period and cost.
2.7.4.1 Storage temperature
Temperature has a profound effect on the dormancy period and storage life of onion bulbs. In general, sprouting is inhibited both by low and by high temperatures, and encouraged at intermediate temperatures
© 2006 Horticultural Development Council
26
(Abdalla and Mann, 1963; Brewster, 1977b; Miedema, 1994a; Ernst et al., 1999). Different cultivars respond differentially to temperature (Gubb and MacTavish, 2002). The optimum temperature range for sprouting in dry storage is 10-20ºC for most cultivars, with some cultivars displaying a sharp optimum while others have a broader range. Moisture loss is greater at temperature ranges <10ºC and >27ºC.
In developed temperate countries, such as the UK, onions are kept in large, specialised stores. Ventilation is forced, and temperature is usually maintained around 5ºC, but can be as low as -1ºC. In warm climates, such as the tropics, high temperature storage is a practical option, but involves a compromise between sprouting losses and rotting losses (Ko et al., 2002). High temperature storage conditions are generally 25-30ºC and 60–75% RH. Ventilation of storage bins to reduce fluctuations in temperature and humidity reduced the rate of external sprouting, bacterial infection and dehydration over 31 weeks of high temperature storage in red onion cv. Baftain bulbs (Brice et al., 1995). The high temperature inhibition of sprouting may be related to the dormancy observed in hot seasons in some wild Alliums (Gubb and MacTavish, 2002). Short-term (three weeks) high temperature postharvest treatments of 30 and 35ºC significantly reduced the number of days to sprouting in dry storage at 15ºC, when compared to those exposed to postharvest temperature treatments of 15 and 25ºC, which in turn were not significantly different from one another (Miedema, 1994a). This indicates that exposure of onion bulbs to high temperatures during curing and drying may reduce the level of dormancy and therefore reduce storage time.
Short-term (two or three weeks) chilling treatments at 0 or 9 C decreased the time to sprouting in onion cv. Rouge Amposta bulbs subsequently stored at 18C, with the 9C treatment for three weeks having the greatest effect – 100% of bulbs in this treatment group had sprouted after 4-5 weeks, but after 8 weeks only 20% of non-chilled bulbs had sprouted (Benkeblia and Selselet-Attou, 1999a). The chilled bulbs also generally had a lower concentration of soluble sugars. Therefore, it is important that the
© 2006 Horticultural Development Council
27
chilling treatment is maintained long-term in order to extend storage life. Short-term chilling treatment may mimic the conditions that a dormant onion would experience over winter, with the return to a higher temperature being equivalent to the onset of spring and a trigger for release from dormancy.
2.7.4.2 Controlled atmosphere storage
Controlled atmosphere (CA) storage involves manipulating the oxygen and carbon dioxide concentrations in the storage environment in addition to the temperature (Gubb and MacTavish, 2002). Low oxygen storage inhibits sprouting, decreases the incidence of neck rot and reduces weight loss. However, very low oxygen concentrations (0.7%) can cause high rates of sprouting after removal from storage, as well as off-odours and tissue breakdown. Also, high carbon dioxide concentrations (>10%) for short-term storage can cause accelerated softening, rooting and a putrid odour. A storage atmosphere consisting of 5% CO2 and 3% O2 has been found to yield a good percentage of marketable bulbs and maintain quality (Adamicki and Kepka, 1974; Smittle, 1988).
2.7.4.3 Humidity
The relative humidity of the storage environment is a compromise between maintaining a level below that at which pathogens are encouraged and above that at which water is rapidly lost from the bulbs (Hole et al., 2000). The outer skins that protect against water loss tend to crack and fall off at <55% RH, and pathogen attack is encouraged at >80% RH, therefore 55-80% RH is desirable in the storage environment. When the water content of the skin is in equilibrium with the water vapour pressure of the surrounding atmosphere, water will be adsorbed or desorbed depending on the relative pressure. Changes in humidity, therefore, have an impact on the properties of onion skins. This is significant as the ability of onion bulbs to withstand
© 2006 Horticultural Development Council
28
physical abuse during postharvest and post storage handling depends on the mechanical properties of the skins. Hole et al. (2000) found that humidification increased the resistance of skins to breaking. Compliant skins are better able to withstand the rigours of commercial handling. Manipulation of humidity to condition skins reversibly prior to post storage handling may have a positive impact on bulb quality.
2.8 Alternative strategies to delay sprouting
Increasing pressure from both consumers and retailers to provide food with little or no chemical residues means that the continuing use of MH to extend onion storage life is far from certain, and alternative strategies must be explored. In order to identify potential targets for manipulation to suppress sprouting in store, it is useful to examine what changes occur in stored onion bulbs.
2.9 Changes occurring in onion bulbs during storage and sprouting
Many characteristics change during storage including water content, and the concentration of flavour compounds, carbohydrates, minerals and plant growth regulators. Changes in these characteristics are likely to be linked with respiration and remobilisation of carbohydrates to provide energy for the growing sprout. All nutrients required for growth of the sprout must come from within the bulb; therefore changes in certain key characteristics could be used to predict the onset of sprouting. Peaks and troughs in certain substances are known to coincide with sprouting but there is currently no biochemical assay that anticipates sprouting.
2.9.1 Mitotic activity
© 2006 Horticultural Development Council
29
Control of cell division in the shoot meristem does not appear to be a key regulatory process in bulb dormancy and sprouting (Carter et al., 1999). Expression of histone 2A, a cell cycle regulated gene whose expression pattern is linked with cell division activity, is barely detectable in the leaf tissue at the end of the growing period, indicating minimal mitotic activity, and the concentration in the bulb was about 2.5-fold greater than that in the root (Carter et al., 1999). Expression levels in all parts of the bulb (outer, middle and inner) decreased from 100 days before harvest until harvest time. During storage, expression levels remained constantly low in the outer and mid bulb but levels in the inner bulb peaked at 140–160 days postharvest, coinciding with the appearance of external sprouts, and decreased thereafter. A peak in expression of histone 2A appeared at the same time point (March to April) in cultivars with varying storage potential, and did not correspond with the developmental stage of the bulbs. Similarly, after studying mitotic divisions in the shoot apex of onion cv. Excel bulbs, Abdalla and Mann (1963) concluded that as sprouting depends on the elongation of leaves initiated before harvest; cell division in the shoot apex is unlikely to be related to sprout growth. Indeed, onion bulbs are morphologically active throughout storage (Dahlhelm and Matjeko, 1990). The genetic basis of control of sprout leaf elongation is not known, but will play a large part in the determination of storage capacity.
2.9.2 Flavour precursors and pungency
Onions, and other Alliums, are eaten for their unique taste and the medicinal properties of their flavour compounds (Randle, 1997; Griffiths et al., 2002). The flavour compounds are secondary metabolites whose biosynthesis involves the metabolism of cysteine and glutathione, which are essential pathways for uptake of sulphur and detoxification (Jones et al., 2004). Sulphate is taken up by the roots, reduced to sulphite and assimilated into cysteine. The tripeptide glutathione is formed and converted into S-2-
© 2006 Horticultural Development Council
30
carboxypropyl glutathione which is metabolised through many γ-glutamyl peptides, terminating in S-alk(en)yl-L-cysteine sulphoxide (ACSO) synthesis (Block, 1992; Kopsell and Randle, 1997). The ACSOs make up 1-5% of the dry mass of an onion bulb (Jones et al., 2004), representing major biosynthetic activity. The role of flavour compounds is something of a mystery. Putative roles include storage of sulphur (Lancaster et al., 2001) and carbon, and defence (Jones et al., 2004). When onions are grown at low sulphur nutrition, sulphur is preferentially partitioned into ACSOs in the cell contents (Randle et al., 1995; Lancaster et al., 2001).
It is the ACSOs that are responsible for the characteristic flavour and odour of onions. Intact onion cells have no flavour, but when cells are disrupted the vacuolar enzyme alliinase (S-alk(en)yl-L-cysteine sulphoxide lyase) hydrolyses the flavour precursors (ACSOs) present in the cytoplasm. The products of this reaction are pyruvate, ammonia and unstable alk(en)yl sulphenic acids (Uddin and MacTavish, 2003), which spontaneously condense in pairs to form thiosulphinates that contribute to perceived flavour (Briggs and Goldman, 2002) (Figure 2.4). The three major ACSOs present in onion are methyl (MCSO), propyl (PCSO) and 1-propenyl (PRENCSO) cysteine sulphoxide. PRENCSO gives rise to the lachrymatory factor, thiopropanal S-oxide (Lancaster et al., 1998; Kopsell et al., 1999). The production of the lachrymatory factor was thought to be spontaneous, but further investigation has revealed that it is specifically synthesised by an enzyme known as lachrymatory factor synthase (Imai et al., 2002).
The composition and concentration of ACSOs determines the nature and intensity of flavour and odour. Total ACSO content is also positively correlated with enzymatically produced pyruvate (Kopsell et al., 1999). Variations in flavour between cultivars, and changes that may occur in flavour during storage, are due to the differences and differential changes in the ACSOs present in bulbs and their alliinase activity.
© 2006 Horticultural Development Council
31
Figure 2.4. Simplified pathway of flavour production in onion bulb tissue.
A highly significant correlation exists between threshold olfactory perception (the minimum concentration of onion juice in water that could be detected by 70% of the judges) and enzymatically produced pyruvic acid (Schwimmer and Weston, 1961; Schwimmer and Guadagni, 1962). This suggested that the same enzyme system that produces volatile odour compounds when the cells of onion are disrupted, also gives rise to pyruvic acid, and that pyruvic acid concentration was a good indicator of pungency. Selection for less enzymatically produced pyruvate resulted in a milder onion (Havey and Randle, 1996; Havey, 1999). Relative pungency is dependent on
© 2006 Horticultural Development Council
alliinase
S
2 R
NH2
COOHO
2 NH3
COOH
O
22 R
S
HO
+ +
R S
+ 2 H2O
S-alk(en)yl –L-cysteine sulphoxides
Sulphenic acids Pyruvic acid Ammonia
S
O
Thiosulphinates
32
both genetic and environmental factors (Havey and Randle, 1996; Havey, 1999). It is possible for pungency to increase, decrease or stay the same during storage (Uddin and MacTavish, 2003).
2.9.3 Carbohydrates
Water-soluble carbohydrates in onion bulbs include glucose, fructose and sucrose, and a series of oligosaccharides called fructans (Darbyshire and Henry, 1978), and constitute 60-80% of the dry weight (Rutherford and Whittle, 1982). During storage at 15-16˚C, fructose levels increased with time (Salama et al., 1990) and fructan levels decreased (Suzuki and Cutliffe, 1989; Ernst et al., 1998). The decrease in fructan concentration was shown to begin two weeks prior to harvest in onion cv. Rijnsberger Hysam, possibly due to the use of storage carbohydrates in respiration to compensate for reduced photosynthetic ability due to the loss of green leaves (Pak et al., 1995). Fructan content in onion bulbs tended to decrease during refrigerated, ambient atmosphere (Suzuki and Cutliffe, 1989; Pak et al., 1995; Ernst et al., 1998; Benkeblia et al., 2000), and low oxygen storage (Ernst et al., 2003). Fructose concentration was higher in the outer scales of the bulb than the inner scales (Darbyshire and Henry, 1978; Salama et al., 1990), similarly, Salama et al. (1990) found that glucose concentration was higher in the outer scales than in the inner scales; however Darbyshire and Henry (1978) and Pak et al. (1995) found no difference. A maximum soluble sugar concentration occurred between five and eight weeks after harvest (Salama et al., 1990; Benkeblia et al., 2002). Postharvest, sucrose synthase activity decreased very slightly in the shoot, and increased in the bulb base, while activity in the inner and outer scales was consistently low (Pak et al., 1995).
It has been postulated that carbohydrate content is correlated with storage life. Suzuki and Cutliffe (1989) found a significant, but not large, positive correlation between fructan content and percent marketable bulbs in eight onion cultivars stored at 6-10C for four months. Higher fructose
© 2006 Horticultural Development Council
33
content at harvest was correlated with extended storage life in onion cv. Robusta bulbs stored at 4C for three months (Rutherford and Whittle, 1982). This is in agreement with a lower proportion of bulbs sprouting per day in bulbs with higher carbohydrate concentrations at harvest, as observed by Wheeler et al., (1998).
The pattern of changes in total soluble sugar content of onion cv. Rouge Amposta bulbs is similar at 4, 10 and 20C, with a maximum concentration occurring at approximately seven weeks storage (Benkeblia et al., 2002). The maximum soluble sugar concentration was less in the bulbs stored at 4C, as were the concentrations of tetra, penta and hepta saccharides, probably due to decreased enzymatic hydrolysis of fructan polymers by depolymerases. The similarity in the pattern of change in total soluble sugars at different temperatures suggests that the catabolism of carbohydrates is more dependent on physiological stage than temperature. In contrast, fructose concentration was higher in onion cv. Sentinel bulbs stored at 0 and 15ºC than in those stored at 30ºC, suggesting that hydrolysis of fructans increased at low temperatures (Salama et al., 1990). A net increase in total sugars was observed at 0ºC, and a net decrease observed at 15 and 30ºC.
2.9.4 Fresh weight and water loss
Water accounts for 80-93% of the fresh weight of freshly harvested onions. The actual amount depends on cultivar and growing conditions. Water loss during curing and drying is rapid and is around 5% of fresh weight (Gubb and MacTavish, 2002). Water loss continues throughout storage because of evaporation and low-level respiration.
2.9.5 Respiration
© 2006 Horticultural Development Council
34
Staining with the redox reagent 2,3,5-triphenyl tetrazolium chloride, which is reduced to an insoluble red formazan derivative in tissues of high metabolic activity, revealed a changing pattern of respiration activity during storage (Carter et al., 1999). At harvest (mid-October) staining was pale and confined to the meristematic region, indicative of a low metabolic rate and a high level of dormancy. In January, an increase in metabolic rate was indicated by increased staining of the root tips. In March and April rapid metabolic activity occurred in the meristem regions at the base of each growing shoot and in growing sprout leaves. After sprout emergence, staining intensity decreased, representing a return to a lower metabolic rate.
The Q10 of a respiration rate represents the increase in the respiration rate produced by raising the temperature by 10°C. Benkeblia et al. (2000) observed that the Q10 of onion cv. Rouge Amposta bulbs O2 and CO2
respiration rates were 1.67 and 1.84 respectively. The respiration rate of oxygen increased throughout storage, doubling within 15 weeks at 20C and 20 weeks at 10C. At 4C the increase was only slight. Respiration rate is dependent on the physiological state of the bulb (Ogata, 1961; Benkeblia et al., 2000). The respiration rate of a sprouted bulb is greater than that of a non-sprouted bulb sampled simultaneously.
2.9.6 Plant growth regulators
During over winter storage in the UK a gradual change in the relative composition of plant growth regulators occurs as the levels of growth inhibitors drop and the levels of growth promoters rise. Hormone activity in onions cvs. Rijnsberger (long-storing) and Lancastrian (short-storing) bulbs was measured by Thomas (1969) and Thomas and Isenberg (1972). The following pattern existed (Figure 2.5); gibberellins (GAs) had a first peak in December, followed by peaks of cytokinins and auxins. High auxin activity persisted as sprouting continued. A second GA peak was accompanied by sprouting in March. This GA peak was more likely to be an effect of sprouting
© 2006 Horticultural Development Council
35
rather than a cause, as GA activity was low in both non-sprouted and internally sprouted bulbs (Thomas, 1969; Yamazaki et al., 2002) and application of exogenous GAs and auxin failed to stimulate sprouting (Thomas, 1969).
Abscisic acid (ABA) has been identified as an inhibitory substance in onion bulbs (Tsukamoto et al., 1969). The concentrations of inhibitors in bulbs with internal signs of sprouting were low when compared with the levels in non-sprouting or fully sprouted bulbs. More inhibitor was present in the long-storing cultivar at the beginning of the storage period than in the short-storing cultivar (Thomas, 1969).
Storage time
Nov Dec Jan Feb Mar Apr May
Hor
mon
e ac
tivity
(AB
U)
0
2
4
6
8
10
12
14
Spro
utin
g (%
)0
20
40
60
80
100
GibberellinAuxinCytokininAbscisic acidSprouting
Figure 2.5. Percentage sprouting and hormone activity of onions cv. Rijnsberger stored at 5-8°C (Thomas and Isenberg, 1972).
Therefore before an external sprout is visible, important internal changes occur. The roles and mode of action of plant growth regulators are unknown, but it is probably a complex phenomenon involving the combined action of several endogenous hormones (Gubb and MacTavish, 2002).
© 2006 Horticultural Development Council
36
Continuous exposure of onion bulbs to ethylene in store has recently been put forward as a method of sprout suppression (Johnson, 2006). However, there are conflicting reports on the effect of ethylene during storage. Abdel-Rahman and Isenberg (1974) observed that onion cv. Elba Globe bulbs produced ethylene at much greater concentrations at the end of dormancy than at the beginning. In contrast, Benkeblia and Selselet-Attou (1999b) found little variation in the ethylene production by onions cv. Rouge Amposta. Ethephon (2-chloroethylphosphonic acid, CEPA) degrades to form ethylene in an alkaline solution (Yang, 1969). Application of ethephon to plants has been effective in causing responses characteristic of ethylene treatment (Benkeblia and Selselet-Attou, 1999b). A combination of cold storage (9°C for three weeks) and the injection of 1 ml of a 100 mg l -1 solution of ethephon into the centre of the bulb caused onion cv. Rouge Amposta bulbs stored at 18°C to sprout earlier (50% sprouting after 2 months, 100% after 4 months) than those treated with ethephon alone and untreated controls (50% sprouting after 3 months, 100% after 6 months). It is likely that it was the effect of the chilling treatment that reduced the storage life of the bulbs; however, as no bulbs were subjected to chilling alone, this cannot be proven. Injection of bulbs with ethephon alone had no effect on sprouting, but when applied in combination with exogenous ABA it reduced the effect of ABA on the dormant period (Abdel-Rahman and Isenberg, 1974).
Abscisic acid is a naturally occurring phytohormone. The ABA biosynthesis pathway (Figure 2.6) begins in chloroplasts and other plastids with the cleavage of a C40 carotenoid precursor to form xanthoxin. In the cytoplasm, xanthoxin is converted to ABA via abscisic alcohol (Cutler and Krochko, 1999; Taylor et al., 2005). ABA has many physiological effects, many related to the response to water and cold-stress, including bulb and seed dormancy, inhibition of germination, stomatal closure and inhibition of cell elongation. The amount of ABA in the plant is a balance between synthesis and degradation. Plant development, environmental conditions such as drought stress, and other growth regulators affect these processes.
© 2006 Horticultural Development Council
37
Figure 2.6. The synthesis of abscisic acid (ABA) from xanthoxin in higher plants. Solid arrows indicate the major pathway, dashed arrows indicate a minor pathway, AB=abscisic (Cutler and Krochko, 1999).
The predominant pathway for ABA metabolism is hydroxylation at the 8’ position, catalysed by the enzyme abscisic acid 8’-hydroxylase, to give 8’-hydroxy-ABA which is unstable and readily converts to phaseic acid (PA). In turn, PA can be reduced to dihydrophaseic acid (Cutler and Krochko, 1999; Nambara and Marion-Poll, 2005) (Figure 2.7). Phaseic acid has little hormonal activity in most assays and can be isolated, whereas 8’-hydroxy-ABA still has some hormonal action but can not be easily isolated due to its instability.
© 2006 Horticultural Development Council
Xanthoxin
AB-aldehyde
ABAAB-alcohol
38
Figure 2.7. Metabolism of abscisic acid (ABA).
Endogenous ABA is found in all onion tissues viz. leaf, growing tip, bulb and leaf sheath (Matsubara and Kimura, 1991), and accumulates in all tissues during the growing period. The actual concentration of ABA varies according to plant age and tissue type.
The endogenous ABA concentration is affected by tissue water status and is high in water-stressed plants. During bulb formation storage molecules accumulate, which facilitates changes in tissue water status. Allium wakegi (a cross between Japanese bunching onion and shallot) plants do not form bulbs under short day conditions, and the endogenous ABA concentration remained low when plants were subjected to short days - a maximum concentration of 5 ng g-1 FW compared to a maximum concentration of 20 ng g-1 FW in plants subjected to long day conditions was observed (Yamazaki et al., 1999a). The ABA concentration increased during bulb development, reaching a maximum two weeks after harvest: a rise from 1 ng g-1 FW to 13 ng g-1 FW over two months. This change was associated with changes in water status during bulb formation (Yamazaki et al., 2002). However, in vitro studies do not support the theory that ABA is the primary cause of bulbing; addition of exogenous ABA (0.1-5 mg l -1) to in vitro cultured
© 2006 Horticultural Development Council
ABA
8’-hydroxy-ABA
Phaseic acid
Dihydrophaseic acid
39
onion plants did not induce bulbing, although the number of leaves decreased (Matsubara and Kimura, 1991). In addition, fluridone (an inhibitor of ABA biosynthesis) treatment of A. wakegi plants reduced endogenous ABA concentration, but did not inhibit bulb scale formation or affect leaf sheaf ratio (ratio of leaf sheath length to the length the oldest unexpanded leaf) relative to untreated control plants (Yamazaki et al., 1999a).
Abscisic acid has been associated with dormancy in onions and other plants with storage organs such as potato (Suttle and Hultstrand, 1994; Destefano-Beltrán et al., 2006a; Destefano-Beltrán et al., 2006b). Current understanding is that ABA is synthesised in the leaves and translocated to the bulb throughout growth. Treatments to prematurely kill off the aerial parts of onion plants resulted in increased sprouting of bulbs in store (Thomas and Isenberg, 1972), perhaps due to a reduction in accumulation of ABA in the bulb because ABA cannot be translocated from dead leaves. Bulb ABA concentration reached a maximum shortly after harvest (Yamazaki et al., 2002). Onions are harvested when the aerial parts of the plant have fallen and would be expected to be less metabolically active. This may suggest that ABA can be synthesised in other parts of the onion plant when the aerial parts have been removed or ceased to be metabolically active.
2.10Conclusions
The pre- and postharvest factors affecting onion bulb storage life and the biochemical and physical changes that occur in stored onion bulbs have been considered. Most research concerned with extending onion storage life has concentrated on breeding programmes, crop husbandry and optimisation of the storage environment in terms of temperature, humidity and the concentrations of oxygen and carbon dioxide. If an alternative method to the use of the synthetic sprout suppressant maleic hydrazide is to be identified, then further study of the physiology behind onion bulb dormancy and storage life is required. The information gained from these investigations has the
© 2006 Horticultural Development Council
40
potential to identify novel targets for manipulation to improve onion storage potential.
© 2006 Horticultural Development Council
41
3.0 CHAPTER THREE
Temporal changes in abscisic acid concentration and quality characteristics during controlled atmosphere storage of onion
bulbs of three cultivars with contrasting storage potential
3.1 Abstract
Onion bulbs (Allium cepa L.) of cultivars with long, medium and short storage lives, viz. Renate, Ailsa Craig and SS1, respectively, were stored in controlled atmosphere (CA) conditions (3% CO2; 5% O2; 2ºC). Bulb abscisic acid (ABA) concentration, pyruvate, fructans, total soluble solids (TSS) and firmness were measured throughout storage.
In all cultivars, bulb ABA concentration declined exponentially during storage. The greatest decrease in ABA concentration occurred during the first 80 days of storage. The pattern of decline was similar for the long, medium and short-storing onion bulbs, although onion cv. SS1 bulbs had the lowest initial ABA concentration. Onion bulb ABA concentration at harvest (measured on a fresh weight basis) may prove to be an indicator of storage life. The ABA concentration at harvest (DW) may be indicative of a greater difference in sprouting during storage between cv. SS1 and the other cultivars than between cvs. Renate and Ailsa Craig.
It is hypothesised that the storage potential of bulbs of different onion cultivars is inversely related to the time at which they reach a minimal ABA content. Thus, the storage life of short-storing cultivars (e.g. cv. SS1) might be prolonged by reducing the rate of ABA degradation, and this could help extend the period for supplying these onions from temperate regions. Onion bulbs of cvs. Renate, Ailsa Craig and SS1 were characterised by high, intermediate and low concentrations of pyruvate, fructan and total soluble solids, respectively.
© 2006 Horticultural Development Council
42
3.2 Introduction
The aim of onion bulb storage is to meet consumer demand for extended availability of onions whilst maintaining product quality. The principal biological factors leading to onion bulb deterioration are respiration, resumption of growth and pathogen attack. In onion bulbs a dormant period, when sprouting and rooting can not be induced, is followed by a period of internal changes that prepare the bulb for breaking of dormancy and subsequent growth. Out of storage, the bulb then proceeds towards flowering and seed production (Komochi, 1990).
Many biochemical characteristics change during storage. These include changes in water content, the concentrations of flavour-related compounds (Uddin and MacTavish, 2003), organic acids (Salama et al., 1990), carbohydrates (Rutherford and Whittle, 1982; Jaime et al., 2001; Benkeblia et al., 2005a), plant growth regulators (Thomas and Isenberg, 1972) and phenolics (Benkeblia, 2000). Biochemical changes during storage are likely to be linked with respiration. All nutrients required for growth of the sprout must come from within the bulb; therefore, changes in certain key characteristics might be used to predict the onset of sprouting.
Onions are eaten for their unique taste and the supposed health giving properties of their sulphur containing flavour compounds, S-alk(en)yl-L-cysteine sulphoxides (ACSOs). Total ACSO content is positively correlated with enzymatically produced pyruvate (Kopsell et al., 1999), which in turn is positively correlated with pungency (Schwimmer and Weston, 1961; Crowther et al., 2005).
Abscisic acid has been associated with dormancy in onions (Matsubara and Kimura, 1991). The absolute concentration of ABA varies according to plant age and tissue type, and is also influenced by environmental challenges such as drought stress prior to the falling of green leaves at bulb maturity. The postharvest concentration of ABA in the bulb basal leaf sheath has been positively correlated with the number of days to sprouting in A. wakegi Araki L., a cross between Japanese bunching onion and shallot (Yamazaki et al., 2002). Ranges of ABA
© 2006 Horticultural Development Council
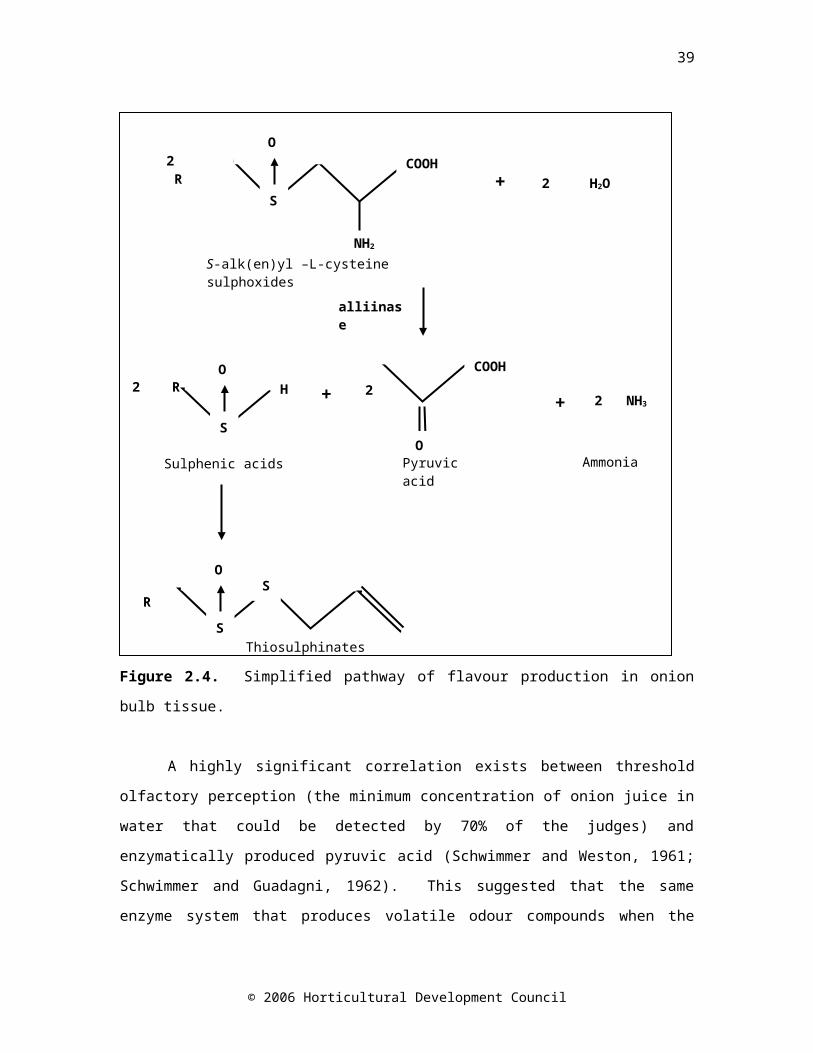
43
concentrations in onion and related species have been reported by other authors (Table 3.1), however the changes in ABA concentration in onion bulbs of cultivars with different storage potentials have not been investigated.
The aim of this study was to detail the changes in onion bulb ABA concentration, as well as characteristics associated with quality (fructan, pyruvate, total soluble solids (TSS) and firmness), in three onion cultivars with different storage potentials. The relationship between these changes and the onset of sprouting was identified with the aim of identifying a biochemical predictor of sprouting incidence or a potential target for biochemical or genetic manipulation to delay sprouting.
© 2006 Horticultural Development Council
44
Table 3.1. The maximum and minimum abscisic acid (ABA) concentrations reported previously in bulbs of onions and related species.
Tissue
Range of ABA
concentrations
(ng g-1 FW)
Days in
store
Storage conditions
Extraction methodQuantification
methodReference
A. cepa cv. Awaji Chūkodaka
lyophilised central bulb tissue
9 - 1 0 - 30 25°C Zones on thin-layer paper chromatogram eluted with acetone :
methanol(9:1, v/v)
Gas chromatography
with electron capture detector
Matsubara and Kimura
(1991)
A. wakegi cv. Araki whole bulb
tissue
13 - 6 14 - 42
In a room at ambient
temperature
Extraction with 80% (v/v) acetone, followed by clean up and semi-
preparative HPLC
As above Yamazaki et al.
(1995)
© 2006 Horticultural Development Council
45
A. wakegi cv. Araki whole bulb
tissue
33 - 10 14 - 42
Hung in plastic nets under an outdoor
shelter in Japan
As above As above Yamazaki et al.
(1999b) Yamazaki
et al. (2002)
© 2006 Horticultural Development Council
46
3.3 Materials and methods
3.3.1 Plant material and storage regime
Short, intermediate and long-storing onion (Allium cepa L.) cultivars; SS1, Ailsa Craig and Renate, respectively, were spring-drilled on 18 March 2003 in four rows per bed using a tape seeder at a rate of 35 seeds m -1
and grown in a sandy loam soil field at FB Parrish & Son (Beds., UK) using standard agronomic practices. Two treatments of additional sulphur and/or calcium at rates of 100 kg ha-1 of sulphur and 300 kg ha-1 of calcium were applied in four combinations including a negative control. Sulphur, in the form of agricultural gypsum, was applied uniformly over the plot area at the time of drilling. Calcium was applied evenly by hand in the form of 77% calcium chloride (CaCl2) flakes (Kemira, Cheshire). Onion bulbs were harvested (cv. SS1 on 19 August 2003; cvs. Renate and Ailsa Craig on 2 September 2003) into standard 25 kg plastic nets and dried in bin driers with ambient air for five weeks (cv. SS1) and three weeks (cvs. Ailsa Craig and Renate) as per standard practice in the UK. The dry aerial parts and roots were removed, and any diseased or damaged bulbs discarded prior to storage. Bulbs were held under industry standard controlled atmosphere (CA) conditions (3 % CO2 and 5 % O2; Smittle, 1988) using an Oxystat 2 CA system, attached to an Oxystat 2002 Controller, and Type 770 fruit store analyser (David Bishop Instruments, Sussex, UK). This system was self-calibrating every 24 hr against 5% CO2 in N2 (British Oxygen Co., Surrey, UK). Bulbs were stored at 2 ± 1°C inside two rigid polypropylene fumigation chambers (88 x 59 x 59 cm). Relative humidity was not measured.
3.3.2 Experimental design
The experiment was conducted as a completely randomised design with the assumption that the storage containers were identical and the
© 2006 Horticultural Development Council
47
samples were taken randomly. Bulbs were divided equally between the two storage containers. Bulbs were removed from storage at regular intervals. Samples of cv. Renate were taken after 0, 40, 111, 166, 188, 209 and 230 days, cv. Ailsa Craig after 0, 26, 53, 81, 111 and 129 days, and cv. SS1 after 0, 14, 26, 40, 53, 66 and 81 days. At each sampling date (except time 0) for each cultivar, three bulbs from each treatment (+Ca-S, +Ca+S, -Ca+S and -Ca-S) were sampled from each storage chamber. At sampling time 0, four sets of six bulbs were sampled. Samples from each set of three bulbs from each sampling time and treatment were combined and lyophilised prior to ABA, fructan and mineral analysis (except at time 0 where sets of 6 bulbs were combined); therefore, values represent the mean of the replicates for each sampling date and cultivar. Mineral analysis was carried out on samples from cv. Renate: days 0, 40 and 230, cv. Ailsa Craig: days 0, 81 and 129, and cv. SS1: days 0, 40 and 81. Dry weight measurements were made on lyophilised samples. The growth of a green sprout within the bulb indicated the end of the storage period for marketable onion bulbs. Incidence of sprouting was recorded and expressed as the ratio of the height of the first appearing green leaves inside the bulb as a percentage of the bulb height.
3.3.3 Sample preparation
Onion bulbs were sliced vertically in half from the neck to the base. A ca. 5 mm thick equatorial slice was cut from the middle of each half. Juice was expressed from the equatorial slice using a hand-operated press (Randle and Bussard, 1993) and allowed to stand for 15 min. A sample of juice was collected in a 1.5 ml Eppendorf tube and frozen at -20°C for pyruvate and TSS measurements. In addition, a section was cut from a basal quarter of the bulb (Thomas and Isenberg, 1972) and was snap-frozen in liquid nitrogen and kept at -40°C until the sample was lyophilised (Edwards Super Modulo, Sussex, UK) for mineral analysis, fructan and ABA assays.
© 2006 Horticultural Development Council
48
3.3.4 Quantification of total fructans
Total fructan concentration in ground lyophilised bulb tissue was measured using a fructan assay kit (Megazyme, Co. Wicklow, Republic of Ireland) according to the manufacturer’s instructions (AOAC method 999.03, AACC method 32.32, O'Donoghue et al., 2004). The assay uses highly purified specific enzymes to hydrolyse sucrose, starch and fructans. The sample is first incubated with sucrase to hydrolyse sucrose to fructose and glucose. These reducing sugars are then reduced to sugar alcohols with alkaline NaBH4 solution, which is then neutralised with acetic acid. The sample is incubated with fructanase to hydrolyse fructans to fructose and glucose, which are subsequently measured by the PAHBAH (p-hydroxybenzoic acid hydrazide) method.
3.3.5 Pyruvate assay for assessment of pungency
Total pyruvate concentration was measured as an indicator of pungency based on the method of Schwimmer and Weston (1961) adapted for microplates (T. Crowther, Warwick HRI, pers. comm.). Frozen onion juice was allowed to thaw. The liquid was separated from the semi-solid matter by centrifugation at 8000 rpm for 4 min (Desaspeed MH-2, Sarstedt, Leics., UK). A 100 μl sample of onion juice (200 μl when analysing cv. SS1) was placed in a 10 ml tube to which 4 ml (3.9 ml when analysing cv. SS1) 0.375% (v/v) trichloroacetic acid solution was added. A lower dilution factor is required for accurate analysis of low pungency cultivars, such as cv. SS1, due to the low pyruvate concentrations present. A 30 μl aliquot of the sample solution was added to a microplate well (Cellstar 96, Greiner Bio-One, Gloucs., UK) in quadruplicate. Then, 50 μl of a 0.0025% (v/v) solution of 2, 4-dinitrophenylhydrazine in 2N HCl (Spa Contract Synthesis, Warks. UK) was added to each well. The microplate was incubated at 37°C for 10 min, and 150 μl 6N NaOH was added to each well. The absorbance of the samples was immediately read at 450 nm using a microplate reader (BP808, Biohit, Devon, UK) along with
© 2006 Horticultural Development Council
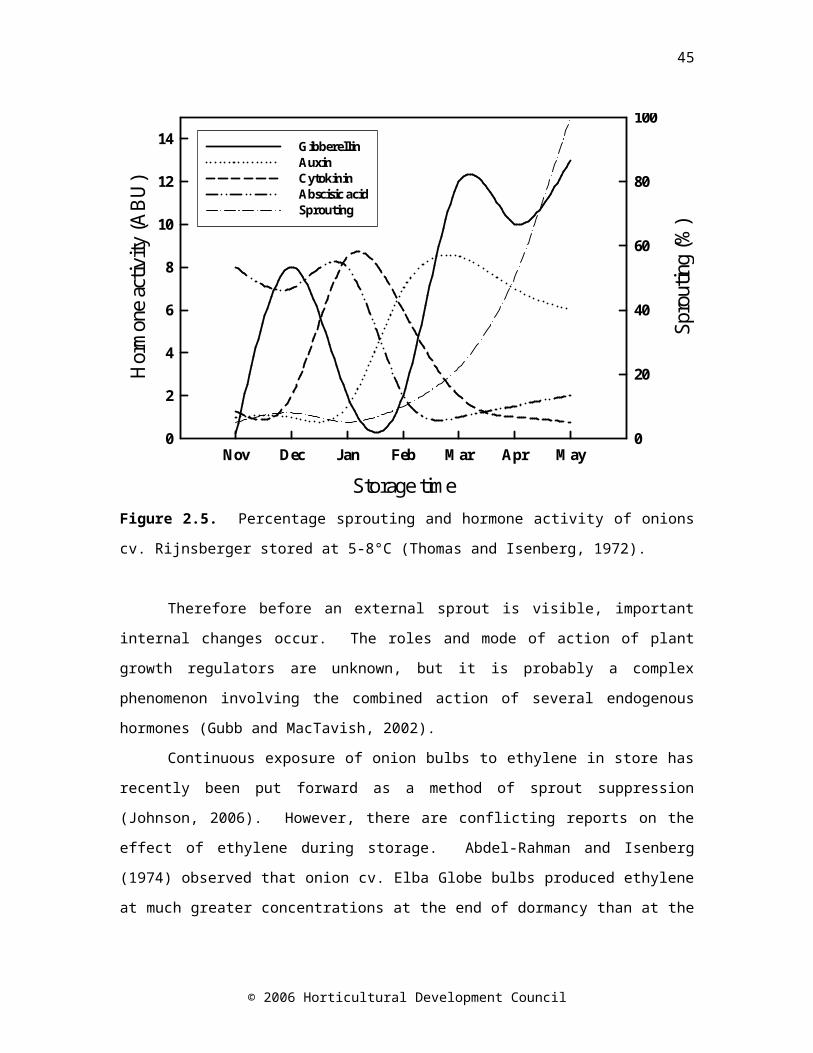
49
blanks (empty wells). The concentration of pyruvate in the sample, expressed as μmol g-1 FW, was calculated using a calibration curve constructed using the absorbance of a range of pyruvic acid standards (1, 2, 4, 8, 12 and 16 μmol ml-1) assayed in eight replicates with each batch.
3.3.6 Bulb firmness and total soluble solids assessments
The firmness of each onion bulb was assessed according to Lancaster et al. (2001) with slight modifications. A 10 mm flat head probe was mounted onto the crosshead of an Instron Series IX 4301 Universal Testing Machine (Instron, Bucks., UK) fitted with a 0.1 kN load cell. The onion bulb was placed horizontally in a V-shaped rest. A compression program was set to perform a 3 mm extension at a crosshead speed of 50 mm min-1. The gradient of the linear zone of the force-deformation curve indicated the resistance to pressure, and, therefore, bulb firmness. The mean of two measurements were used for analysis, with the second measurement taken at right angles to the first.
The TSS content of thawed onion juice was measured using a digital hand held refractometer (Palette 100, Atago Co. Ltd., Tokyo, Japan).
3.3.7 Mineral analysis
Mineral concentrations were measured in ground, lyophilised bulb tissue. The samples were ashed and then digested with 1 ml concentrated nitric acid (ADAS, 1985). The intensity of ion response was measured by ICP-AES (Inductively coupled plasma – atomic emission spectroscopy; Ultima 2, Jobin Yvon, London, UK) and concentrations were determined by comparison with external standards. Results were expressed as total ion concentrations of boron, iron, copper, calcium, magnesium, potassium, manganese, sodium, zinc, phosphorus and sulphur.
© 2006 Horticultural Development Council
50
3.3.8 Abscisic acid (ABA) quantification
Abscisic acid was quantified using a radio-immuno assay (RIA) according to Quarrie et al. (1988) with some modifications (the assay was validated according to Dorffling and Tietz (1983) and Rosher et al. (1985), see Appendix A). All reagents were purchased from Sigma (Dorset, UK) unless otherwise stated. Ground lyophilised bulb tissue (50 mg) was extracted overnight in 1:20 parts tissue to sterile distilled water (SDW) at 4°C in the dark on a suspension mixer (802/TW, Luckham Ltd., Sussex, UK). Extracted samples were vortexed and then centrifuged at 3000 rpm (MSE Mistral 2000, Sanyo Gallenkamp, Leics., UK) for 10 min at 4°C.
A solution of DL-cis, trans-[G-3H] ABA (Amersham International, Bucks., UK) in 100% ethanol was diluted 10-fold in SDW and frozen at -20°C in 500 μl aliquots. This stock solution was diluted further to 4.8 μl ml-1 in phosphate buffered saline (PBS; 50 mM NaH2PO4 adjusted to pH 6.0 with 50 mM Na2HPO4, and 100 mM NaCl) containing 5 mg ml-1 bovine γ-globulin to act as a co-precipitant with the cell line supernatant monoclonal antibody for (+)-ABA, MAC252 (Barrieu and Simonneau, 2000). MAC252 was diluted 1:1000 in PBS containing 5 mg ml-1 bovine serum albumin and 4 mg ml-1 soluble polyvinylpyrrolidone (MW 40000) to enhance binding of the antibody. Incubations were carried out in duplicate. A 50 μl sample or ABA standard, 100 μl 3H ABA, 100 μl MAC252, and 200 μl 100% PBS were added to 2 ml microtubes with push-in caps (Sarstedt, Leics., UK), and incubated in the dark at 4°C for 45 min. Then, to precipitate the antibody 500 μl saturated (NH4)2SO4 was added. The tubes were closed, inverted and incubated at room temperature for 30 min. The precipitated antibodies were pelleted by centrifugation for 4 min at 8800 g (Eppendorf Centrifuge 5413, Eppendorf UK Ltd., Cambs., UK). The pellet was washed with 1 ml 50% saturated (NH4)2SO4 (v/v), and re-centrifuged. One hundred μl SDW was added and the mixture was left for 10 min before vortexing to resuspend the pellet. EcoScint H (1.2 ml; National Diagnostics, E. Yorks., UK) was added to convert β-radiation emitted by the bound 3H ABA into light. The tubes were placed inside 20 ml plastic screw top scintillation vials (National Diagnostics), wiped with a damp cloth to remove static, and counted on a 3H program in a liquid
© 2006 Horticultural Development Council
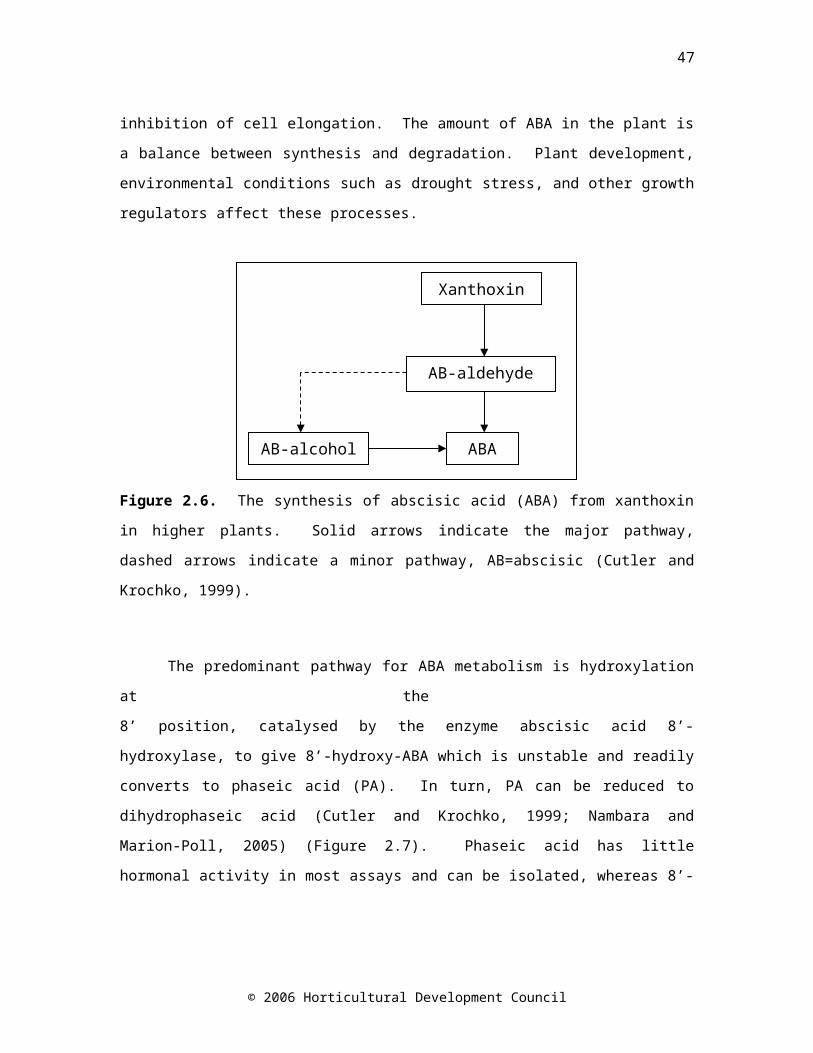
51
scintillation counter (LS 6000TA, Beckman Coulter Ltd., Bucks., UK). Concentrations of ABA were calculated from the radioactivity (counts per minute) present in the pellets. The calibration curve was produced from two replicates of five unlabelled ABA standards ranging from 62.5 to 2000 pg per tube assayed with each batch.
© 2006 Horticultural Development Council
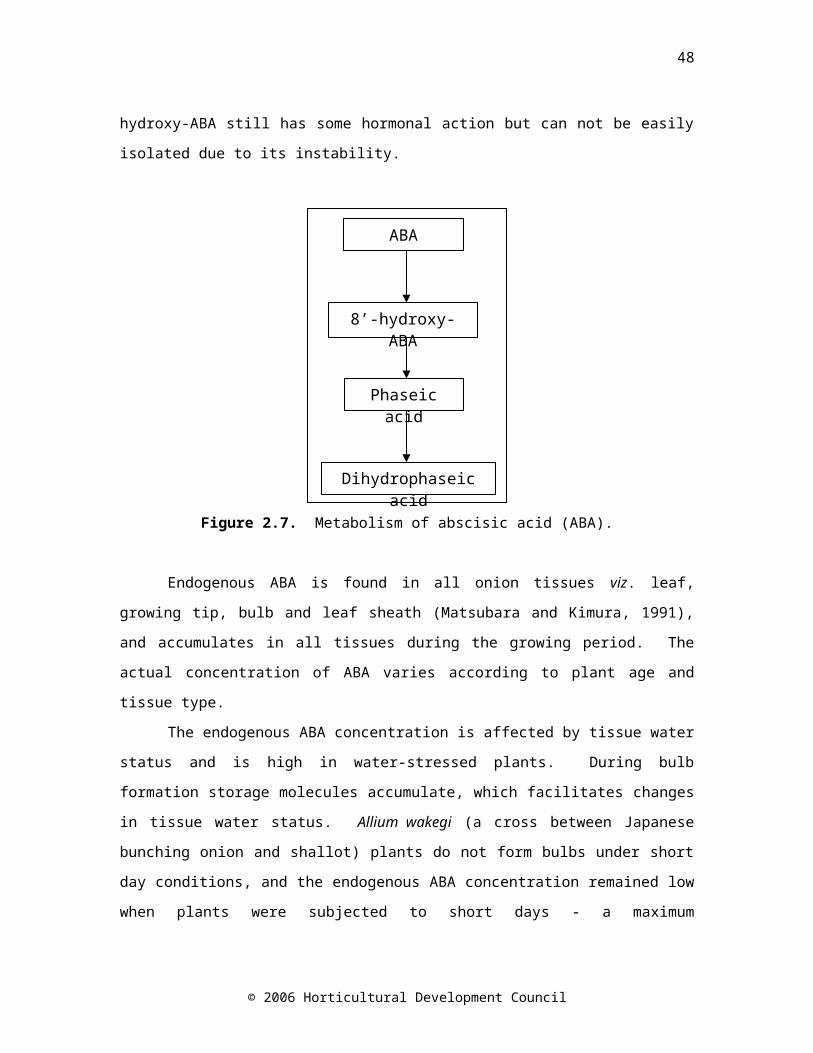
52
3.3.9 Statistical analysis
All statistical analyses were carried out using Genstat for Windows Version 7.1.0.198 (VSN International Ltd., Herts., UK). Least significant difference values (LSD; P=0.05) were calculated for mean separation using critical values of t for two-tailed tests. Non-linear regression against an exponential standard curve was used to model the change in ABA concentration over time.
3.4 Results
The application of additional calcium and sulphur to onion plants in the field did not affect total bulb sulphur or calcium concentrations. The mineral treatments had non-significant and/or inconsistent effects on the other parameters measured and the main effects identified by ANOVA were due to cultivar and storage time. Therefore, the relationship between temporal changes in quality characteristics, ABA and fructan and the onset of sprout growth in each cultivar are presented.
3.4.1 Mineral concentrations
The variation in mineral content between cultivars was greater than the variation due to time (Figure 3.1). All elements measured except for calcium were present in significantly different (P<0.005) concentrations in onion cvs. Renate, Ailsa Craig and SS1 bulbs. There was no consistent pattern according to which cultivar had the highest and lowest concentration of each element, although cv. Ailsa Craig did not have the highest concentration of any of the elements measured. Total sulphur concentration was greatest in cv. SS1, followed by cv. Ailsa Craig and the least in cv. Renate. To enable comparison with other published data on the elemental composition of onions, the data was calculated on a fresh weight basis using the mean dry weights of each cultivar (Table 3.2).
© 2006 Horticultural Development Council
53
Cultivar
Renate Ailsa Craig SS1
Bor
on (
g g-
1 D
W)
0
10
20
30
40
Cultivar
Renate Ailsa Craig SS1
Cal
cium
(g
g-1 D
W)
03000
4000
5000
6000
Cultivar
Renate Ailsa Craig SS1
Cop
per
(g
g-1 D
W)
05
10
15
20
25
30
35
40
45
Cultivar
Renate Ailsa Craig SS1
Iron
(g
g-1 D
W)
0
20
40
60
Cultivar
Renate Ailsa Craig SS1
Pota
ssiu
m (
g g-1
DW
)
015000
20000
Cultivar
Renate Ailsa Craig SS1
Mag
nesiu
m (
g g-
1 D
W)
0
400
600
800
1000
Cultivar
Renate Ailsa Craig SS1
Man
gane
se (
g g-
1 D
W)
0
10
15
20
Cultivar
Renate Ailsa Craig SS1
Sodi
um (
g g-
1 D
W)
0200
400
600
800
1000
1200
Cultivar
Renate Ailsa Craig SS1
Phos
phor
us (
g g-
1 D
W)
01500
2000
2500
Cultivar
Renate Ailsa Craig SS1
Sulp
hur
(g
g-1
DW
)
03000
4000
5000
6000
Cultivar
Renate Ailsa Craig SS1
Zinc
(g
g-1
DW
)
020
30
40
Figure 3.1. Elemental content of onion cvs. Renate, Ailsa Craig and SS1 bulbs shortly after harvest (day 0, black bars, n=4), and at early (light grey bars, n=8) and late (dark grey bars, n=8) time points during controlled atmosphere storage (cv. Renate: days 40 and 230, cv. Ailsa Craig: days 81 and 129, and cv. SS1: days 40 and 81). Standard error bars are shown.
© 2006 Horticultural Development Council
54
Table 3.2. The mean elemental composition of onion cvs. Renate, Ailsa Craig and SS1 bulbs (n=20) compared with data for raw and sweet onions from the USDA database (U.S. Department of Agriculture, 2004).
Element
Cultivar
RenateAilsa Craig
SS1 Raw onion1
Sweet onion1
Concentration (μg g-1 FW)Boron 5.80 0.65 1.16Calcium 603.44 453.35 292.24 220 200Copper 5.81 0.79 1.28 0.38 0.56
Iron 7.03 3.40 3.12 1.9 2.6Potassium 2708.48 1876.44 1492.38 1440 1190Magnesium
108.09 74.17 63.90 100 90
Manganese
2.34 1.31 1.14 1.32 0.76
Sodium 145.68 51.86 38.40 30 80Phosphorus
292.53 198.58 159.21 270 270
Sulphur 679.73 506.62 382.10Zinc 4.54 2.80 2.66 1.6 1.3
Blank cells – no data available1Data from USDA database (U.S. Department of Agriculture, 2004).
3.4.2 Sprout growth
Sprout length increased significantly during storage in onion cvs. Renate (P=0.009), Ailsa Craig (P=0.03) and SS1 (P<0.001) bulbs (Figure 3.2). The use of CA extends storage life of onion bulbs; however, as relative humidity was high within the storage chambers, disease often ended storage life before sprouting occurred. This was most pronounced in onion cvs. Ailsa Craig and SS1 bulbs.
© 2006 Horticultural Development Council

55
Time (days)
0 50 100 150 200
Firm
ness
(N m
m-1
)
15
25
0
10
20
30
Spro
ut le
ngth
(% o
f bul
b he
ight
)
0
10
20
30
40
50
60
Tota
l sol
uble
solid
s (%
)
0
4
6
8
Figure 3.2. Changes in the physical parameters; sprout length (expressed as a percentage of bulb height), total soluble solids and firmness (N mm-1), in bulbs of onion cvs. Renate (▲), Ailsa Craig (●) and SS1 (■) during controlled atmosphere storage. Drop down arrows indicate the final sample taken. LSD (P=0.05) bars are shown, symbols correspond to cultivar; n=24.
© 2006 Horticultural Development Council
56
3.4.3 Dry weight
Dry weight changed significantly (P<0.001) over time in onion cv. Renate bulbs. However this was due to a very high dry weight measurement taken on day 209. No other differences between means were significant, strongly suggesting that this high value might be anomalous and not biologically significant. Dry weight did not change significantly in cvs. Ailsa Craig or SS1, therefore, the overall means are representative of the differences in dry weight between the cultivars. The mean dry weights were cv. Renate: 147 ± 5.83 mg g-1 FW, cv. Ailsa Craig: 100 ± 1.84 mg g-1 FW and cv. SS1: 71 ± 1.72 mg g-1 FW, and were significantly different (P<0.001).
3.4.4 Total soluble solids
Total soluble solid (TSS) concentration changed significantly (P<0.001) over time in bulbs of cvs. SS1 (P<0.001), Ailsa Craig (P<0.001) and Renate (P=0.002) (Figure 3.2). In all cultivars, a maximum TSS concentration occurred in the first 40 days of CA storage. There was a difference in the pattern of change in the TSS concentration of onions cv. Renate and the other two cultivars. A net 1.1-fold increase occurred in bulbs of cv. Renate (P=0.002) between the beginning and end of storage, but no net difference was observed in cv. Ailsa Craig. A net decrease to 0.7-fold of the original TSS concentration occurred in bulbs of cv. SS1. The TSS concentration did not change significantly (P<0.05) after 111 days of storage in bulbs of onion cvs. Renate and Ailsa Craig, and after 53 days in cv. SS1. The TSS concentration was much greater in bulbs of cv. Renate than cvs. Ailsa Craig or SS1.
3.4.5 Firmness
© 2006 Horticultural Development Council
57
There was a significant difference (P<0.001) in the firmness (N mm-
1) of bulbs of cvs. Renate, Ailsa Craig and SS1 when analysed together before storage. The bulbs of cv. Renate were 1.3-fold and 2-fold firmer than those of cvs. Ailsa Craig and SS1, respectively. This pattern persisted throughout storage (Figure 3.2). The firmness of bulbs of cvs. Ailsa Craig and SS1 changed significantly over time (P<0.001). In all cultivars the greatest decrease in firmness occurred between the beginning of CA storage and the first sampling date.
3.4.6 Pyruvate
Pyruvate concentration changed significantly (P<0.001) over time in bulbs of cvs. Ailsa Craig and Renate, and cv. SS1 (P=0.001) (Figure 3.3). The pyruvate concentration in bulbs of cvs. Renate and SS1 showed a net increase of 1.9-fold and 1.2-fold, respectively, over the storage period. In contrast, a net 1.9-fold decrease in pyruvate was observed in bulbs of cv. Ailsa Craig. A sigmoidal pattern of change in pyruvate concentration occurred in bulbs of cvs. Renate and SS1. Two peaks in pyruvate concentration occurred during the storage period, with the first occurring in the middle of storage time and the second at the end of storage. Throughout storage, the pyruvate concentration of bulbs cv. Alisa Craig was consistently higher than that of bulbs cv. SS1. When all cultivars were analysed together before bulbs were placed into storage (day 0), onion cv. Alisa Craig bulbs had a significantly (P=0.003) greater pyruvate concentration (6.73 μmol g-1 FW) than bulbs of cv. SS1 (3.57 μmol g-1 FW).
© 2006 Horticultural Development Council
58
Time (days)
0 50 100 150 200
AB
A (n
g g-1
DW
)
050
100
150
200
250
300
Pyru
vate
(m
ol g
-1 FW
)
02
4
6
8
Tota
l fru
ctan
(m
g g-1
DW
)
0
50
100
150
200
250
300
Figure 3.3. Changes in the biochemical parameters; pyruvate, total fructan, and ABA concentrations, in bulbs of onion cvs. Renate (▲), Ailsa Craig (●) and SS1 (■) during controlled atmosphere storage. Drop down arrows indicate the final sample taken. LSD bars (P=0.05) are shown, symbols correspond to cultivar. LSD bar A is for comparison of time zero with all other times, bar B is for comparison of all times except time zero. Pyruvate: n=24, fructan and ABA: time zero n=4, all other times n=8.
© 2006 Horticultural Development Council
AB AB AB
AB AB AB
59
3.4.7 Total fructans
The fructan content in bulb samples at day 0 was significantly different (P<0.001) in each of the three cultivars tested (Figure 3.3). Bulbs cv. Renate had the highest proportion of fructan per gram dry weight (285.0 ± 20.84 mg g-1 DW), followed by cvs. Ailsa Craig (131.3 ± 28.11 mg g-1 DW) and SS1 (31.0 ± 7.24 mg g-1 DW). Fructan concentration significantly (P<0.001) changed over time in onion cv. Renate bulbs. The decrease was most rapid between day 40 and day 111, and no other differences between fructan concentration during storage were significant. Fructan content of cvs. Ailsa Craig and SS1 bulbs did not change significantly during storage.
3.4.8 Abscisic acid
Bulb ABA concentration declined significantly during storage for all cultivars (Renate and Ailsa Craig P<0.001; SS1 P=0.003; Figure 3.3; Table 3.3). The initial ABA concentrations in onion cv. Ailsa Craig (298 ng g -1
DW) and cv. Renate (288 ng g-1 DW) bulbs, were significantly greater (LSD (P=0.05) = 162.1) than that present in onion cv. SS1 bulbs (116 ng g -1
DW). When analysed together for days 0, 26, 53 and 81, cultivar accounted for the majority of the variation in bulb ABA concentration between cvs. SS1 and Ailsa Craig (P<0.001). When analysed together with cvs. Renate (days 0 and 40) or Ailsa Craig (days 0, 26, 53 and 81), ABA concentration in cv. SS1 was always significantly lower (P<0.001).
© 2006 Horticultural Development Council
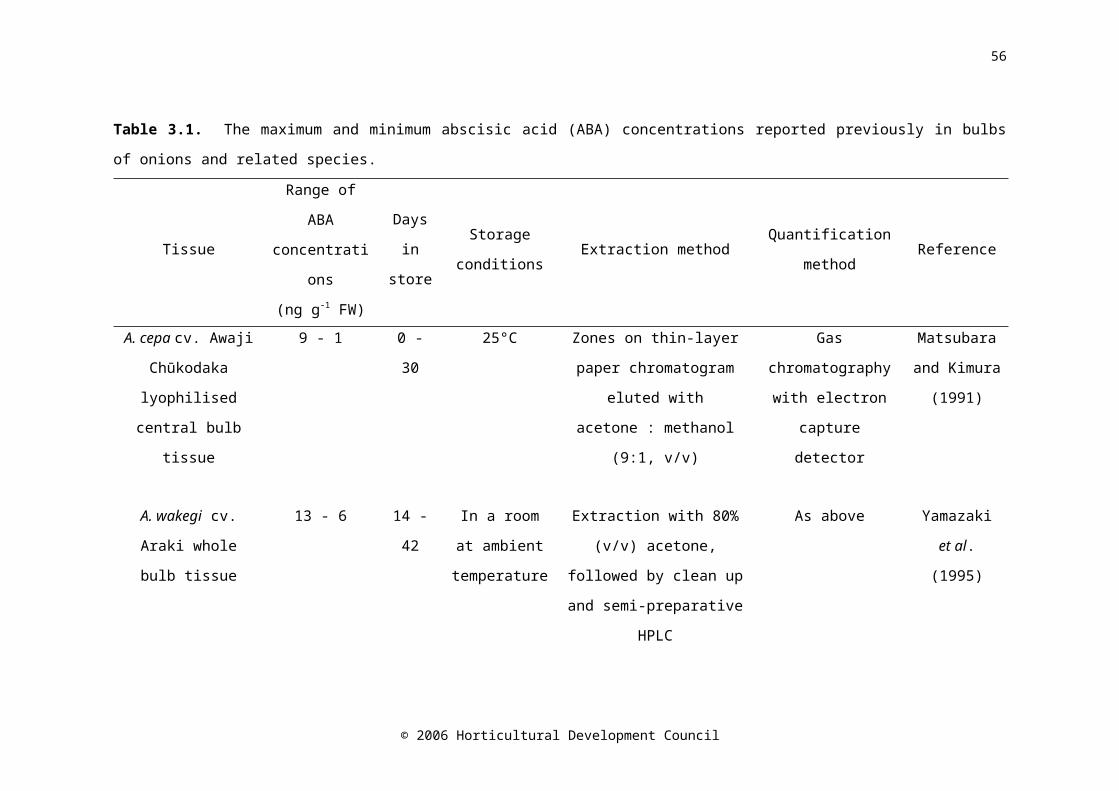
60
Table 3.3. The maximum and minimum abscisic acid concentrations on a dry weight (± S.E.) and fresh weight basis recorded in onion cvs. SS1, Ailsa Craig and Renate bulbs at the beginning and end of storage (Time zero: n=4, all other times: n=8).
Cultivar
ABA concentration(ng g-1 DW)
ABA concentration(ng g-1 FW)1
Maximum Minimum Maximum Minimum
SS1 116.02
(13.25)42.83
(9.37)8.22
(4.8)3.03
(1.79)Ailsa Craig 297.92
(17.23)54.14
(12.18)29.82
(12.8)5.44
(2.3)Renate 287.72
(21.24)92.75
(15.02)42.32
(22.0)13.65
(7.1)1 Values calculated from mean DW for each cultivar; cv. Renate: 147 ± 5.83 mg g-1 FW, cv. Ailsa Craig: 100 ± 1.84 mg g-1 FW and cv. SS1: 71 ± 1.72 mg g-1 FW.2 Measured at day 0. 3 Measured at day 66. 4 Measured at day 129. 5
Measured at day 209.
In order to describe the relationship between storage time (x) and ABA concentration (y), non-linear regression was applied to the data. For all cultivars the relationship could be described by a negative exponential function (equation 1), where R is a measure of the rapidity of the decline in ABA concentration (if R is close to 1 the decline will be slow, and as R approaches zero the rate of decline will increase). The minimum ABA concentration (when x=∞) is given by A, and the ABA concentration when x=0 is given by A+B. The ABA concentration at time x is given by y.
y = (A + B)Rx (1)
An alternative form of equation 1, is equation 2 where K = -log(R).
y = (A + B)e-Kx (2)
© 2006 Horticultural Development Council
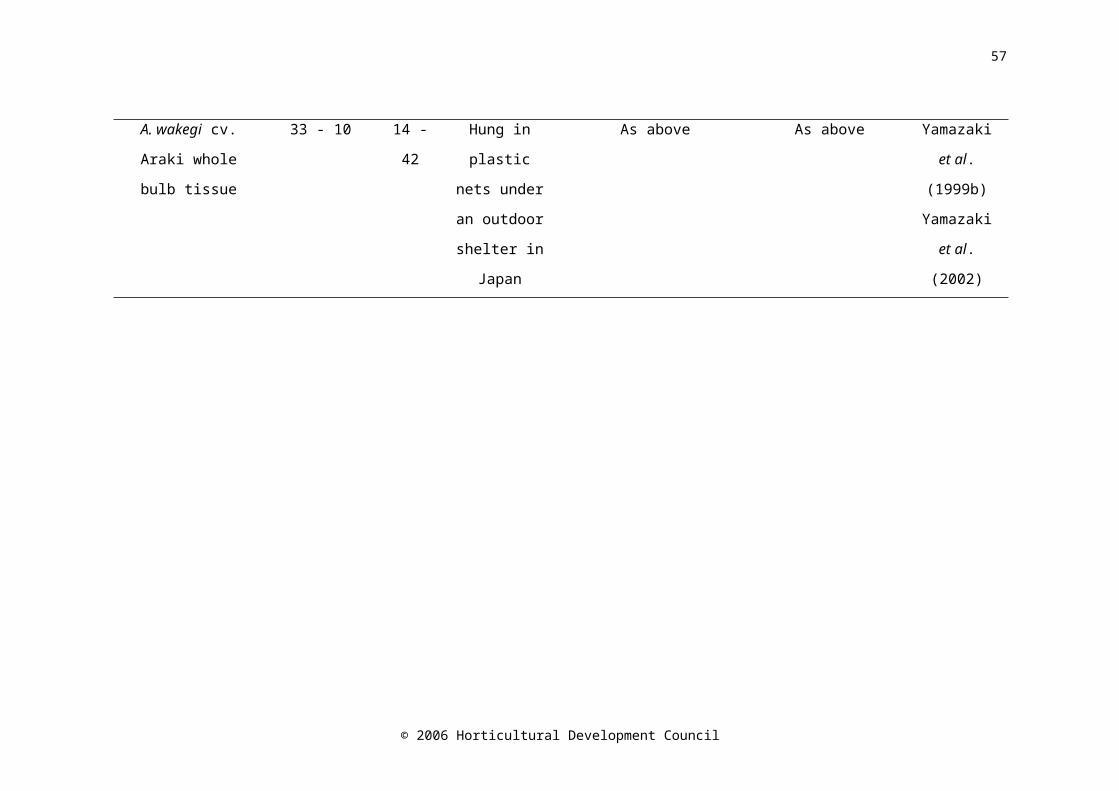
61
The data for cvs. Ailsa Craig and Renate closely fitted an exponential function (P<0.001). The data for cv. SS1 also fitted an exponential function (P=0.036), but less closely. Grouped regression analysis of the curves describing the decline in bulb ABA concentration in cvs. SS1, Ailsa Craig and Renate over time showed that 98.0% of the variation between the curves was accounted for by allowing separate linear parameters (i.e. A and B), and that the same value of R could be used to describe each of the curves (P<0.001) (Table 3.4).
© 2006 Horticultural Development Council
62
Table 3.4. The parameters (± S.E.) of the exponential functions (y = (A + B)Rx) describing the change in ABA concentration during storage (days) in onion cvs. SS1, Ailsa Craig and Renate bulbs.
ParameterGrouped regression Individual regression
Renate(n=7)
Ailsa Craig (n=6)
SS1(n=7)
Renate(n=7)
Ailsa Craig (n=6)
SS1(n=7)
R 0.97 ± 0.002 0.97 ± 0.003 0.98 ± 0.004 0.98 ± 0.022B 184.62 262.92 68.22 184.7 ± 7.94 263.9 ± 14.8 75.6 ± 39.54
A 102.02 39.12 45.22 102.9 ± 3.69 37.3 ± 12.1 35.9 ± 42.94
Percentage variance1
98.0 98.9 98.7 71.1
Half life3 (days) 26.2 ± 1.90 24.8 ± 3.01 27.1 ± 4.13 35.0 ± 39.54
1Percentage variance = 100*(1-((residual mean square)/(total mean square))) = adjusted R2 value expressed as a percentage. 2Standard error = 9.97. 3Half life = log (0.5) / log (R). 4The large standard errors are representative of the poorer fit of the data for cv. SS1 to the regression, compared with the data for cvs. Ailsa Craig and Renate.
© 2006 Horticultural Development Council
63
The time taken for the ABA concentration to decrease by half of that present before storage (‘half life’), A + (B/2), can be calculated using equation 3, which is derived from equation 2.
half life = log (0.5) / log (R) (3)
The half lives were calculated from each individual regression, and an overall half life was also calculated from the common R parameter derived from the combined regression analysis. The common R value was 26.2 ± 1.90 days (Table 3.4).
3.5 Discussion
The sulphur and calcium treatments, applied at the time of drilling, did not affect bulb sulphur or calcium content. Other authors have found that sulphur treatments did not affect dry matter (O'Donoghue et al., 2004), carbohydrates or TSS (Lancaster et al., 2001). Field, hydroponic and tissue culture trials worldwide have shown that attempting the manipulation of the sulphur content of onions by varying the sulphur supply during growth has mixed results and is highly dependent on factors such as cultivar, the extent of variation of sulphur supply, and other seasonal and environmental influences (Randle, 1992; Randle et al., 1993; Hamilton et al., 1998; Kopsell et al., 1999; Lancaster et al., 2001; Coolong et al., 2004; O'Donoghue et al., 2004). In general, manipulation of the sulphur supply has an effect on parameters such as firmness, pungency, ACSOs and dry matter when the treatment is applied constantly e.g. in a hydroponic system, or when applied in the field towards the end of the growing season when bulbing has been initiated.
Onion cv. SS1 bulbs had a greater concentration of total sulphur than cv. Ailsa Craig and Renate. This is perhaps surprising as cv. SS1 was the least pungent of the three cultivars, and pungency is determined by the
© 2006 Horticultural Development Council
64
availability of sulphur-containing flavour precursors (ACSOs). However, all mineral analyses were performed on lyophilised tissue. When the concentrations are calculated on a fresh weight basis (using the mean dry weight percentage), free sulphur concentration was least in cv. SS1 bulbs (Table 3.2). Free mineral content should not change over the storage period and therefore the different concentrations recorded at different storage durations is more likely to represent the natural variation within the population than real changes in mineral concentration. Onion cv. Ailsa Craig bulbs showed the greatest variability over time, and this could be attributed to the fact that it is a ‘garden’ variety rather than a commercially grown cultivar. The data from the USDA database (U.S. Department of Agriculture, 2004) is comparable with that recorded in this investigation; however, onion cv. Renate bulbs contained approximately 2-fold the concentration of calcium, copper, iron, potassium and sodium. The onion cultivar used to obtain data for the USDA database is unknown; it is possible that it is a lower dry matter cultivar than cv. Renate which would explain these results.
Dry matter content is the primary characteristic of onion bulb quality, determining, in part, the end use (e.g. as salad, cooking or dehydrated onions), storage life, pungency and firmness (Sinclair et al., 1995a). Onions with high dry matter content tend to be much firmer and store for longer periods before shoot growth and disease incidence deplete the number of marketable bulbs (Darbyshire and Henry, 1979; Rutherford and Whittle, 1982; Suzuki and Cutliffe, 1989). Ranking the cultivars by dry matter from the highest to the lowest (cv. Renate > cv. Ailsa Craig > cv. SS1), matches the ranking in terms of storage life from longest to shortest. Similarly, the greater the dry matter content, the firmer the bulb (Figure 3.2).
Total soluble solids is defined as the total of all the solids that dissolve in water, including sugars, salts, protein and organic acids, and the refractometer reading is the sum total of these. Thus, TSS is not a direct measure of sugar content and is unrelated to the perceived sweetness of some onion cultivars (Crowther et al., 2005). Onion cv. SS1 bulbs are marketed as having a sweet flavour and are intended to be consumed raw,
© 2006 Horticultural Development Council
65
but have a lower TSS concentration than cv. Renate bulbs. High dry matter bulbs are able to accumulate higher TSS concentrations without taking up more water because of their ability to synthesise and store highly polymerised fructans (Sinclair et al., 1995b). Net TSS concentration did not change between the beginning and end of storage in bulbs of cvs. Renate and Ailsa Craig, which is consistent with the observations by Rutherford and Whittle (1982) on Rijnsberger-type onions stored at 4°C. A peak in TSS concentration occurred between ca. 4 and 6 weeks in all cultivars, followed by a general decline towards the end of the storage period. This is comparable to the peaks observed by other authors after 6 - 8 weeks storage at 4, 10 and 20°C in cv. Rouge Amposta bulbs (Benkeblia et al., 2002) and at 5 weeks at 0, 15 and 30°C in cv. Sentinel bulbs (Salama et al., 1990); both of these peaks being followed by a decline until the end of the storage period (24 and 20 weeks, respectively).
Pyruvate is a reliable indicator of pungency, and is a stable product from the hydrolysis of alk(en)yl cysteine sulphoxides (ACSOs) by the enzyme alliinase that occurs when onion cells are disrupted. The activity of alliinase has been shown to decrease at low O2 (2%) and high CO2 (8%) concentrations (Uddin and MacTavish, 2003). Thus, changes in pyruvate concentration during storage could be due to differences in availability of ACSOs or in the activity of alliinase. The cultivars used in this study can be ranked in order of pungency using the mean pyruvic acid concentration (Schwimmer and Weston, 1961; Crowther et al., 2005) taken across the entire storage period; cv. Renate > cv. Ailsa Craig > cv. SS1. The pyruvate concentration of bulbs cv. Ailsa Craig decreased over the storage period. This is consistent with the findings of others, who reported a decrease in the pyruvate concentration in bulbs of cv. Hysam after 9 weeks in CA storage (either 2 % O2, 2% CO2 or 2% O2, 8% CO2) (Uddin and MacTavish, 2003) or various long-day onion cultivars stored at 5°C for 24 weeks (Kopsell and Randle, 1997). In contrast, pyruvate concentration increased overall in cvs. Renate and SS1 during storage, which is in agreement with that observed for bulbs cv. Hysam stored under ambient
© 2006 Horticultural Development Council
66
atmosphere conditions for 9 weeks (Uddin and MacTavish, 2003) and in bulbs cv. Granex-Grano bulbs stored at 4°C for 24 weeks (Hurst et al., 1985).
Onion cultivars characterised by low dry matter content tend to accumulate simple sugars such as glucose and fructose during bulb formation, whereas those characterised by high dry matter tend to accumulate more fructans. A positive relationship between fructan content at harvest and storage life has been reported (Suzuki and Cutliffe, 1989; O'Donoghue et al., 2004). Supporting this relationship, bulb fructan concentration before storage was greatest in the cultivar with the longest storage potential, cv. Renate, and least in the cultivar with the shortest storage potential, cv. SS1.
The rate of fructan metabolism was reduced in bulbs of onion cv. Sherpa stored under low oxygen concentrations at 2°C compared to ambient atmosphere, with the effect being greater at 0.5% O2 than 1.0% O2 (Ernst et al., 2003). The oxygen concentration of 5% used in the present study may explain the earlier decrease in fructan concentration at ca. 16 weeks rather than 36 weeks in bulbs cv. Renate by allowing metabolism of fructans earlier in the storage period. However, the CO2 concentration was 10-fold greater in the present study suggesting that the inhibitory effect of high CO2
concentration on respiration was overcome by the high O2 concentration. Fructan concentration would be expected to decrease over time as fructans are enzymatically hydrolysed to fructose (Hurst et al., 1985). Fructan content in onion bulbs has been shown to decrease during refrigerated ambient atmosphere storage (Suzuki and Cutliffe, 1989; Pak et al., 1995; Ernst et al., 1998; Benkeblia et al., 2000), or low oxygen storage (Ernst et al., 2003). However, in the experiments reported here, bulb fructan concentration only decreased significantly in cv. Renate bulbs. High fructan concentration may protect against tissue damage caused by anaerobic respiration under low oxygen conditions (Ernst et al., 2003). Onion cv. Renate bulbs have a high fructan concentration, and would, therefore, have been well suited to low oxygen conditions, and, thus, some hydrolysis of fructans to simple sugars could have occurred. The different patterns of change in fructan
© 2006 Horticultural Development Council
67
concentration could be due to a different response of each cultivar to CA conditions.
Information on changes in parameters such as carbohydrates, fructans and pungency in different onion cultivars is relatively abundant, if sometimes conflicting; but few detailed studies on the changes and effects of plant growth regulators on the storage life of onions have been conducted. Nevertheless, postharvest decrease in ABA concentration in a relative of onion, A. wakegi, has been correlated with a loss of dormancy (Yamazaki et al., 1995; Yamazaki et al., 1999a; Yamazaki et al., 1999b; Yamazaki et al., 2002).
The bulb ABA concentration declined exponentially during storage in all three onion cultivars studied here (Figure 3.3). A rapid initial decline in ABA concentration was not observed in bulbs of cv. SS1, and the exponential function fitted the data for cv. SS1 less well than for cvs. Ailsa Craig and Renate. Bulbs of cv. SS1 were harvested 14 days earlier than bulbs of cvs. Ailsa Craig and Renate, but were placed into storage at the same time. Therefore, a rapid decline in ABA concentration may have occurred during the period between harvesting and the beginning of storage. The half life of ABA in bulbs of cvs. Renate, Ailsa Craig and SS1 was calculated to be approximately 26 days, providing further evidence that a significant decrease in ABA concentration could have occurred in SS1 in those first 14 days. Assuming an exponential decrease in the ABA concentration with the parameters listed in Table 3.4, the data can be extrapolated to estimate the ABA concentration in bulbs cv. SS1 14 days prior to the first measurement as 136 ng g-1 DW based on the individual regression, and 149 ng g -1 DW based on the grouped regression. These estimated data should be treated with caution; however, these estimated ABA concentrations for bulbs cv. SS1 are approximately 2-fold less than that present in cvs. Ailsa Craig and Renate at day 0.
The maximum and minimum ABA concentrations recorded in this investigation on lyophilised samples were converted to concentrations on a fresh weight basis, and can be compared to those reported by other authors
© 2006 Horticultural Development Council
68
(Table 3.1; Table 3.3). Matsubara and Kimura (1991) reported that the ABA concentration in the outer enlarged leaf of onion bulbs decreased rapidly from ca. 9 ng g-1 to ca. 1 ng g-1 FW after one month of ambient storage under shelter in Japan. This is comparable to the maximum and minimum ABA concentrations found in onion bulbs cv. SS1 (Table 3.3). Yamazaki et al. (1995) observed a slight increase in the ABA concentration in A. wakegi cv. Kiharabansei No. 1 in ambient storage from 11 ng g-1 FW to 13 ng g-1 FW in the first two weeks after harvest, followed by a rapid decrease to 6 ng g -1 FW over the next four weeks. Yamazaki et al. (1999b) and Yamazaki et al. (2002) reported a maximum concentration of ca. 33 ng g-1 FW in A. wakegi cv. Kiharabansei No. 1 two weeks after harvest, which decreased to ca. 10 ng g-1
FW after four weeks. This decline is closer to the ABA concentration observed in onion cvs. Ailsa Craig and Renate bulbs recorded in the present study (Figure 3.3). The ABA concentration on a fresh weight basis accentuated the differences between cultivars; (Table 3.3) the maximum concentration in bulbs of cv. Renate was 1.4 and 5.2-fold greater than that in bulbs of cvs. Ailsa Craig and SS1, respectively.
ABA concentration (DW) at day 0 was least in bulbs cv. SS1, the shortest storing cultivar, and was ca. 2.5-fold greater in bulbs cvs. Ailsa Craig and Renate. In this experiment, decreasing ABA concentration appeared to be related to an increase in sprouting. Sprouting in bulbs of cvs. SS1 and Ailsa Craig seemed to occur at a lower bulb ABA concentration (ca. 75 ng g-1
DW and 65 ng g-1 DW, respectively) than in bulbs of cv. Renate (ca. 115 ng g-1
DW). The disparity in minimum ABA concentration between cultivars may indicate that bulbs of cvs. Renate, Ailsa Craig and SS1 have different threshold ABA concentrations for the onset of sprouting. This does not necessarily indicate the presence of a biological connection between ABA concentration and sprouting, although an in vitro study has shown that treatment of basal, equatorial and near apical onion bulb tissue with 10 -4 M ABA inhibited nucleolar activation, which supports a role for ABA in inhibition of cell elongation (Karagiannis and Pappelis, 1994). The control of cell elongation is important in the storage life onions as cell division is not closely
© 2006 Horticultural Development Council
69
linked to dormancy (Carter et al., 1999). Diminution in ABA concentration was likely to be caused by degradation of the compound, rather than movement within the bulb, as the regulation of physiological processes is at the primary level of de novo synthesis of relevant enzymes for ABA synthesis rather than redistribution (Finkelstein and Rock, 2002).
3.6 Conclusion
Onion bulb abscisic acid (ABA) concentration decreased exponentially during storage, and was concomitant to the decline in storage potential. The similarity in the half lives for all of the cultivars provides evidence that it is not necessarily the rate of decline in ABA concentration that is important. Onion bulb ABA concentration at harvest (measured on a fresh weight basis) may prove to be an indicator of storage life. The ABA concentration at harvest (DW) may be indicative of a greater difference in sprouting during storage between cv. SS1 and the other cultivars than between cv. Renate and cv. Ailsa Craig.
Maximising onion bulb ABA concentration prior to storage, and/or inhibition of the degradation of ABA by cultural, environmental or genetic manipulation may delay sprouting and extend storage life. It follows that prolonging the storage life of short-storing cultivars (e.g. cv. SS1) through elevating ABA concentration and/or delaying the rate of decline in ABA concentration might help increase the period for supply of these onions.
© 2006 Horticultural Development Council
70
4.0 CHAPTER FOUR
Neither pre- nor postharvest application of exogenous abscisic acid (ABA) or an ABA analogue affects endogenous ABA
concentration of onion bulbs.
4.1 Abstract
Bulb abscisic acid (ABA) concentration has been shown to decrease in stored onions, and onset of sprouting to occur at minimal ABA concentration. It was postulated that increasing pre-storage bulb ABA concentration could increase storage life by inhibiting sprout growth. Chemical analogues of ABA that have enhanced biological activity and that resist degradation are available and are becoming commercially viable. Exogenous ABA and an ABA analogue (8’-methylene ABA methyl ester; PBI-365) were applied as a pre-harvest foliar spray to six onion cultivars (viz. Carlos, Dinaro, Hysam, Red Baron, Renate and SS1) with contrasting storage potential and as a postharvest bulb soak to one cultivar (viz. Hysam). Quality markers including pyruvate, total soluble solids and firmness were monitored during storage. Neither method increased endogenous bulb ABA concentration. Bulb ABA concentration decreased during storage and onset of sprouting occurred at a minimal ABA concentration. This was followed by a subsequent increase in ABA concentration as sprout growth continued. No straightforward relationship between ABA and carbohydrate metabolism could be determined, it was therefore postulated that ABA either plays a role in the regulation of cell elongation rather than cell division, or that minimal ABA concentration could be a trigger for remobilisation of carbohydrates to provide energy for the growing sprout. Total soluble solids (%) concentration was a poor indicator of total simple sugars (fructose + glucose + sucrose). The results suggest that change in refractive index was largely due to simple sugars in low dry matter cultivars, and to fructans in high dry matter cultivars.
© 2006 Horticultural Development Council
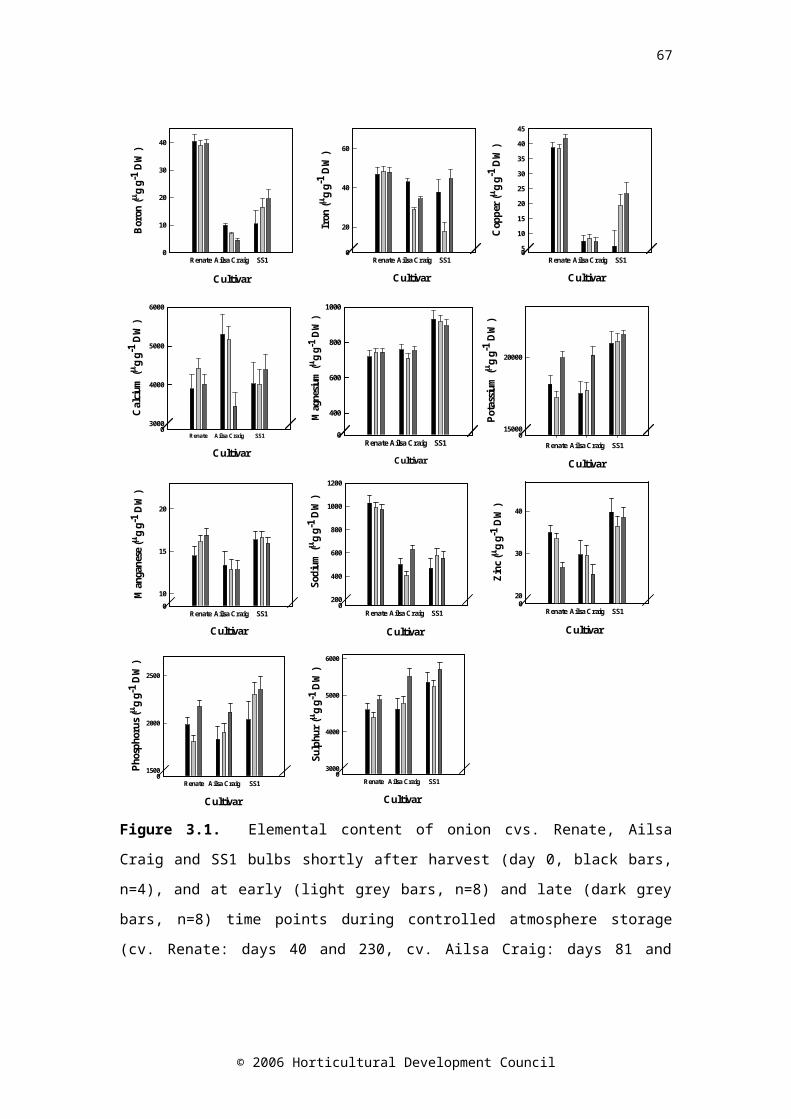
71
4.2 Introduction
Abscisic acid (ABA) has been associated with dormancy in onions. The ABA concentration in onion bulbs decreased throughout controlled atmosphere storage (Chapter 3; Chope et al., 2006), and minimal ABA concentration was associated with the onset of sprouting in onion cvs. Renate, Ailsa Craig and SS1 bulbs. The ABA concentration in Allium wakegi, a relative of onion, reached a maximum shortly after harvest (Yamazaki et al., 2002), and the concentration of free endogenous ABA in the bulb basal leaf sheath immediately after harvest was positively correlated with the number of days to sprouting (Yamazaki et al., 2002). Furthermore, plants of Allium wakegi that received fluridone (an inhibitor of ABA biosynthesis) as an aqueous soil treatment had reduced amounts of ABA in all parts of the plant and the application of 25 or 125 µM fluridone decreased the number of days to sprouting from 45 days to 29 and 15 days, respectively (Yamazaki et al., 1999a). Cell division is not closely linked with dormancy (Carter et al., 1999), so the control of cell elongation, rather than cell division, is important in suppression of sprout growth. There is evidence that ABA inhibits cell elongation (Karagiannis and Pappelis, 1994), which provides further support for the hypothesis proposed in Chapter 3 that increasing the concentration of ABA in the crop before storage or decreasing the rate of degradation of ABA during storage could prolong storage potential by suppressing sprout growth.
If ABA concentration is linked with control of dormancy then it is also likely that it is linked with carbohydrate metabolism, as carbon and nitrogen containing compounds must be remobilised to provide energy for the growing sprout. Although the postharvest changes in carbohydrate concentrations in onion bulbs have already been studied in detail (Table 6.1), no data on the relationship between ABA and carbohydrates are available. Onion bulb quality characteristics must be monitored to ensure that product standard is not compromised.
Abscisic acid is costly to purchase and is light-sensitive, and therefore chemical analogues of ABA that have similar biological activity, but are less expensive to produce, and not degraded as readily are
© 2006 Horticultural Development Council
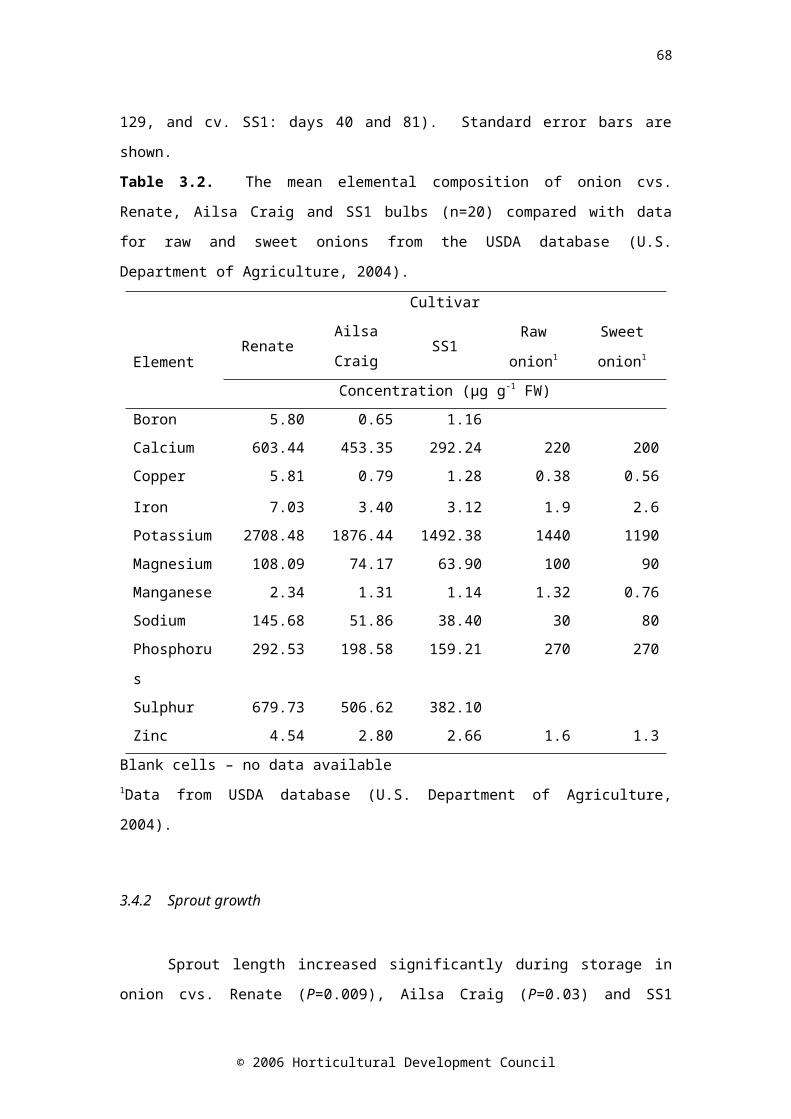
72
desirable. Analogues of ABA that are resistant to degradation could extend the storage life of onions and help elucidate the role of ABA in sprout suppression. 8’-methylene ABA methyl ester (PBI-365) is a chemical analogue of ABA which has been shown to act similarly to ABA in inducing stomatal closure in cut roses (Pompodakis and Joyce, 2003). 8’-methylene ABA methyl ester is chemically identical to ABA apart from the presence of a methylene group at the 8’ position, and the presence of an ester group instead of the carboxylic acid group (Figure 4.1). The presence of a methyl group at the 8C position of the ABA molecule has been shown to sterically hinder binding of the molecule with ABA-8’-hydroxylase, thus resisting degradation (Abrams et al., 1997). 8’-methylene ABA methyl ester possesses this methyl group and so should also resist degradation.
Figure 4.1. A. 8'-methylene abscisic acid methyl ester. B. (+)-abscisic acid.
Current understanding is that ABA is synthesised in the leaves of the onion plant and translocated to the bulb via the phloem (Hartung et al., 2002) as it reaches maturity. It therefore follows that a foliar application of exogenous ABA may also be translocated in this manner. Maleic hydrazide is known to have high phloem mobility (Price et al., 1975). It is applied to the crop prior to harvest, and can be subsequently detected within the bulb (Pesticide Residue Committee, 2006). This suggests that the timing of MH application could also be suitable for treatment with the hormone. Increasing the amount of endogenous ABA could also be attempted by dipping harvested bulbs in solutions of the
© 2006 Horticultural Development Council
BA
H3COOC
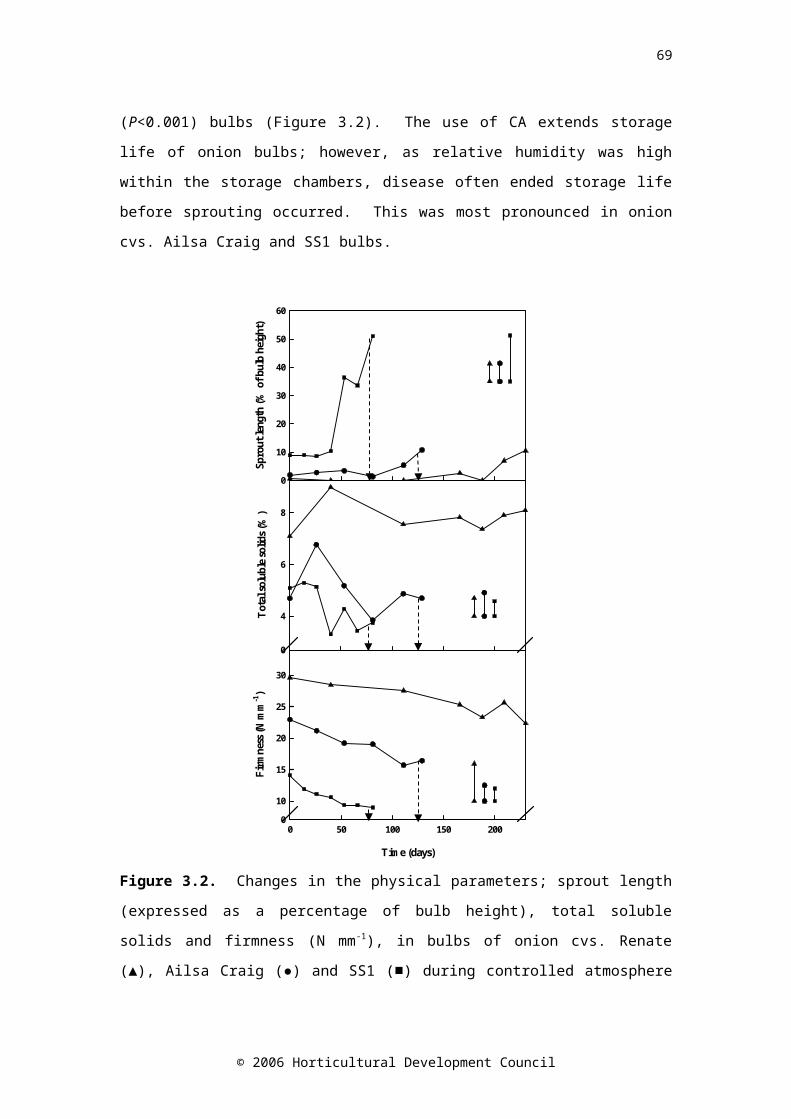
73
hormone or analogue prior to storage. This method may be more efficient as there is direct contact with the bulb.
This study investigated the effects of the application of ABA and an ABA analogue (8’-methylene ABA methyl ester; PBI-365) as pre-harvest foliar field treatments or postharvest dip treatments on the physical and biochemical changes occurring during storage in onion bulbs of various cultivars with differing storage potential.
© 2006 Horticultural Development Council

74
4.3 Materials and methods
4.3.1 Plant material
Six onion (Allium cepa L.) cultivars viz. SS1, Carlos, Dinaro, Renate, Red Baron and Hysam were spring-drilled on 23 March 2004 in four rows per bed using a tape seeder at a rate of 18 seeds m-1 and grown in coarse loamy soil at Warwick HRI (Warks., UK) using standard agronomic practices. The cultivars were selected according to storage potential (NIAB, 2000) and can be divided into long (Renate, Hysam, Red Baron), medium (Carlos, Dinaro) and short storing (SS1) cultivars (Table 4.1).
Table 4.1. The estimated storage life (months) of onion cvs. Carlos, Dinaro, Hysam, Red Baron, Renate and SS1 (Tim Crowther, Warwick HRI, pers. comm.).Storage temperature(°C)
Cultivar
Carlos Dinaro Hysam Red Baron
Renate SS1
4 4-5 4-5 6 5-6 6 1-212 2-3 2-3 2-3 2 2-3 0.5-120 2 2 1-2 1 1-2 0-0.5
4.3.2 Experiment 1 – Pre-harvest foliar spray method
The following treatments (Table 4.2) were prepared and applied to the crop on 17 August 2004 using a knapsack sprayer with three flat fan tip standard 110° nozzles (B.C.P.C. nozzle code F110/1.60/3; Lurmark, Cambs., UK).
© 2006 Horticultural Development Council
75
Table 4.2. Treatments applied to the onion plants in the field.
TreatmentApplication rate
(l ha-1)Plot area
(m2)Total volume
applied (l)ABAa (10-4 M) 550 126 6.93PBI-365a (10-4 M) 314.2 126 3.95Li-700 (0.5% v/v)
550 126 6.93
Water 550 126 6.93a aqueous solution including 0.5% (v/v) Li-700
Since ABA is photosensitive, the treatments were applied at dusk. The leaves of onion plants have a thick, waxy cuticle which represents a barrier to any chemical applied to them. An adjuvant (Li-700, Loveland Industries Ltd., Cambs., UK) was used to aid the movement of ABA and PBI-365 (8’-methylene ABA methyl ester) into the leaf mesophyll tissue. Abscisic acid penetrates the leaf cuticle more effectively at a pH below the pKa (pH 4.8) (Blumenfield and Bukovac, 1972). Li-700 is a penetrating, translocating and acidifying adjuvant and a 0.5% (w/w) solution is pH 4.05. All treatments (except the water control) contained 0.5% (v/v) Li-700. A 2 m buffer zone was left between treatment plots. The weather conditions in the week following the treatment were recorded (Table 4.3).
© 2006 Horticultural Development Council
76
Table 4.3. Weather conditions in the week following pre-harvest treatment.
Date
Maximum temp. (ºC)
Minimum temp. (ºC)
Sunshine(hours)
Wind speed Rainfall (mm)
17/08/2004
24.6 15.4 0.0 Moderate 1.2
18/08/2004
22.2 16.5 3.8 Gentle 1.5
19/08/2004
23.4 12.1 9.6 Fresh 0.0
20/08/2004
21.7 12.5 4.8 Moderate 10.1
21/08/2004
20.0 10.8 11.4 Light 0.0
22/08/2004
21.3 9.8 4.8 Gentle 18.3
23/08/2004
20.9 13.1 4.3 Gentle 7.4
24/08/2004
20.6 13.5 4.4 Gentle 1.1
4.3.3 Harvest procedure
Onion bulbs were forked on 31 August 2004, and lifted and topped on 3 September 2004. On 6 September 2004 the onion bulbs were loaded into standard 25 kg plastic nets and dried in bin driers with hot air (ca. 30°C) for ten days, after which ambient air was blown through the crop for two weeks as per standard practice in the UK. The dry aerial parts and roots were removed and any diseased or damaged bulbs discarded prior to storage.
4.3.4 Experiment 2 - Postharvest bulb dip method
© 2006 Horticultural Development Council
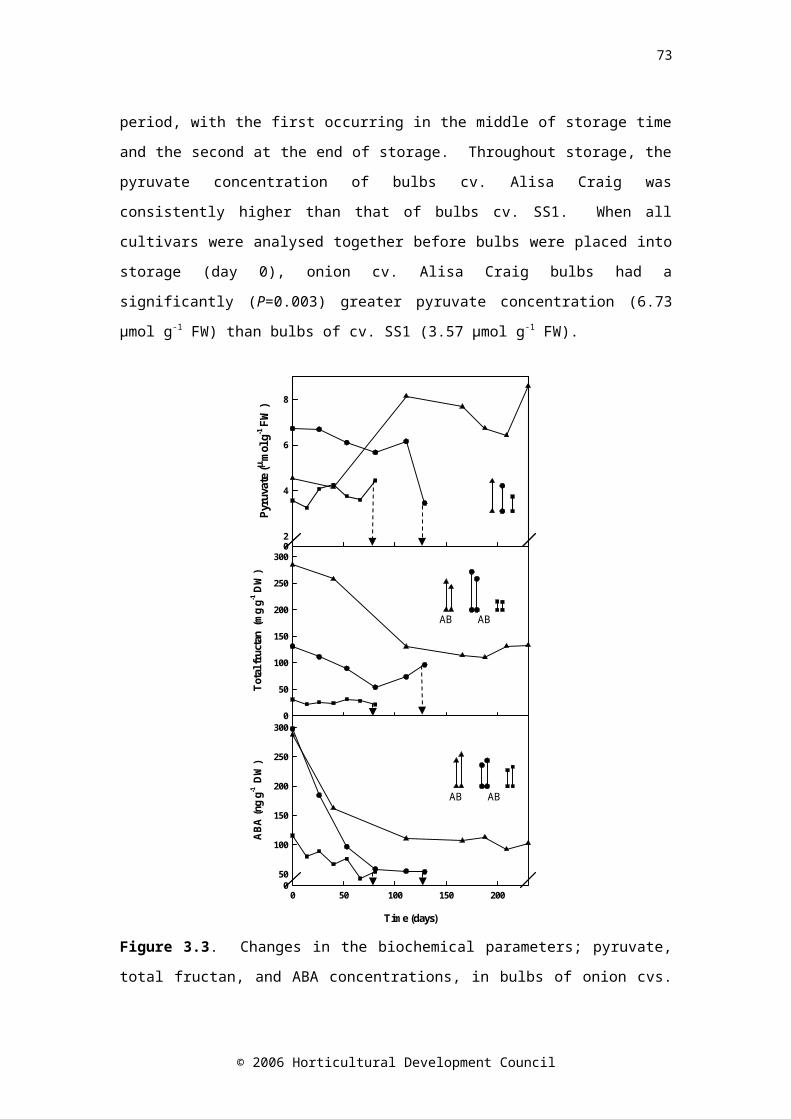
77
Harvested onion cv. Hysam bulbs were soaked in aqueous solutions of 10-4 M ABA, 10-4 M PBI-365 or water (control). Both ABA and PBI-365 were dissolved in 2.5 ml ethanol and then made up to 2.5 l with sterile distilled water, and these solutions also contained 0.5% Li-700. Bulbs were then placed into the bin driers along with the rest of the harvest.
4.3.5 Storage regime and experimental design
Bulbs were stored in air at 4°C, 12°C or 20°C. Relative humidity was not measured. The experiment was conducted as a completely randomised design. Bulbs were removed from storage at regular intervals. For experiment 1 (pre-harvest foliar spray), samples were taken after 0, 53, 109, 186, 215 and 243 days storage at 4°C, after 0, 26, 39, 53, 81 and 109 days storage at 12°C, and after 0, 7, 26, 39, 67 and 98 days storage at 20°C. Five bulbs were sampled at each time point for each treatment and cultivar for sprout length, pyruvate, total soluble solids (TSS), ABA and firmness measurements, and three bulbs of cvs. Renate, Red Baron and SS1 for fructose, glucose, sucrose and fructan concentration. For experiment 2 (postharvest bulb dip), bulbs were sampled after 0, 53, 186 and 215 days storage at 4°C, after 0, 26, 81 and 109 days storage at 12°C, and after 0, 7, 26 and 67 days storage at 20°C with three bulbs per treatment and per time point. Carbohydrate concentrations were not measured in these samples.
4.3.6 Sample preparation
Onion bulbs were sliced vertically in half from the neck to the base. A ca. 5 mm thick equatorial slice was cut from the middle of each half. Juice was expressed from the equatorial slice using a hand-operated press (Randle and Bussard, 1993) and allowed to stand for 15 min. A sample of juice was collected in a 1.5 ml Eppendorf tube and frozen at -20°C for pyruvate and TSS measurements. In addition, a section was cut from a
© 2006 Horticultural Development Council

78
longitudinal wedge of the bulb and was snap-frozen in liquid nitrogen and kept at -40°C until the sample was lyophilised (Edwards Super Modulo, Sussex, UK) for use in fructan, ABA and NSC assays.
© 2006 Horticultural Development Council
79
4.3.7 Physical assessments
All physical measurements were carried out as described in Chapter 3. Briefly, dry weight measurements were made on lyophilised samples. Incidence of sprouting was recorded and expressed as the height of the first green leaves appearing inside the bulb as a percentage of the bulb height. Bulb firmness (N mm-1) was measured using an Instron Series IX materials testing machine (Instron, Bucks., UK) according to the method of Lancaster et al. (2001) with slight modifications.
4.3.8 Biochemical assessments
The concentrations of ABA, pyruvate and TSS were measured as described in Chapter 3. Briefly, ABA was measured by radioimmunoassay (RIA), and pyruvate concentration by colorimetric assay. Total soluble solid content (%) was measured using a digital hand held refractometer (Palette 100, Atago Co. Ltd., Tokyo, Japan). Non-structural carbohydrates (NSC) were quantified using HPLC as described below.
4.3.8.1 NSC extraction
Onion bulbs were extracted according to O’Donoghue et al. (2004) with slight modifications (F. Davis and L. A. Terry, Cranfield University, unpublished method). Freeze-dried onion powder (150 mg) was combined with 3 ml of 62.5:37.5 HPLC grade methanol: water (v/v) and mixed well. This method was adopted in preference to the ethanol reflux method (Kahane et al., 2001) due to better recovery of target analytes (F. Davis and L. A. Terry, Cranfield University, unpublished data). Vials of the slurry were placed in a shaking water bath at 55ºC for 15 mins. They were removed briefly and shaken for 20 s every 5 min to prevent layering, and then left to cool. The cooled samples were filtered through a 0.2 μm
© 2006 Horticultural Development Council

80
Millex-GV syringe driven filter unit (Millipore Corporation, MA, USA) and stored at -40ºC until required.
4.3.8.2 NSC quantification
Non-structural carbohydrates were then quantified according to O’Donoghue et al. (2004) with modifications using a HPLC system comprising a P580 pump and GINA 50 autosampler (Dionex, CA, USA). Extracts were diluted 1:10 (v/v) with HPLC grade water immediately before analysis. The diluted extract (20 µl) was injected into a Rezex RCM monosaccharide Ca+ size exclusion column of 300 mm x 7.8 mm diameter, 8 μm particle size (Phenomenex, CA, USA; Part no. 00H-0130-K0) with a Carbo-Ca2+ security guard cartridge of 4 mm x 3mm diameter (Phenomenex; Part no. AJ0-4493). The mobile phase was HPLC grade water at a flow rate of 0.6 ml min-1. Column temperature was held at 75°C using a Dionex STH column thermostat. Eluted carbohydrates were monitored by an evaporative light scattering detector (ELSD 2420, Waters, MA, USA) connected to the Dionex system using a UCI-50 universal chromatography interface. The presence and abundance of fructose, glucose and sucrose were automatically calculated against external standards using Chromeleon version 4.6 software (Dionex). Assays were performed in triplicate.
4.3.9 Statistical analysis
The data was analysed using analysis of variance (ANOVA) tests for each temperature separately. All statistical analyses were performed using Genstat for Windows Version 7.1.0.198 (VSN International Ltd., Herts., UK). Least significant difference values (LSD; P = 0.05) were calculated for means separation using critical values of t for two-tailed tests. Data for sprout growth (Experiment 1) and ABA concentration (Experiments 1 and 2) were subjected to a log transformation to satisfy
© 2006 Horticultural Development Council
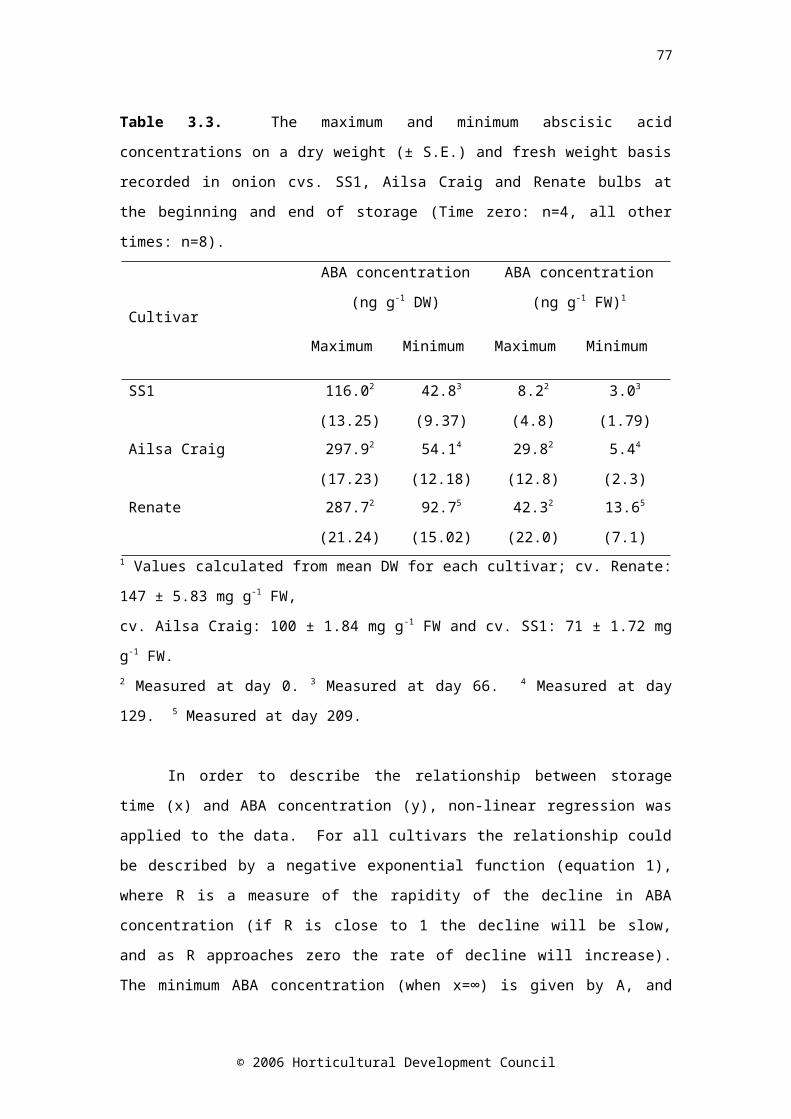
81
the assumptions of ANOVA. Statistical comparisons were made using the transformed means before they were back-transformed to arithmetic numbers for presentation and discussion. Tests for correlations between variables were made using Pearson’s Rank Correlation. Correlations are presented with the Pearson’s Correlation Coefficient (r) and P value based on a two-tailed test.
© 2006 Horticultural Development Council
82
4.4 Results
4.4.1 Experiment 1 - Consequences of a pre-harvest foliar spray of ABA or PBI-365
The onion bulbs in this experiment were exposed to four pre-harvest treatments: the application of 10-4 M ABA in 0.5% (v/v) Li-700, 10-4
M PBI-365 in 0.5% Li-700, 0.5% (v/v) Li-700 or water and three storage temperatures: 4°C, 12°C or 20°C. There was no consistent effect of pre-harvest treatment on any of the parameters measured. The main effects identified by ANOVA were due to cultivar and storage time. Therefore, the relationship between temporal changes in quality characteristics, bulb ABA concentration and bulb NSC concentration and the onset of sprout growth are presented.
© 2006 Horticultural Development Council
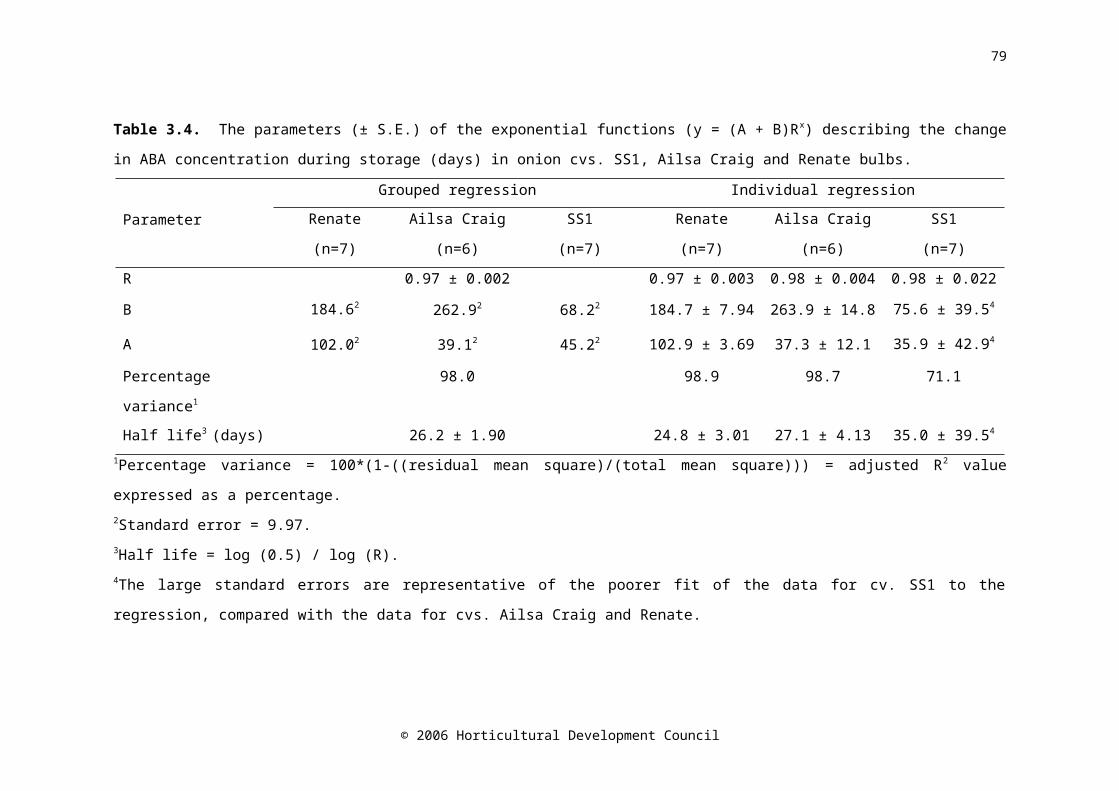
83
4.4.1.1 Pre-storage cultivar characteristics
Each cultivar was ranked according to the mean pre-storage ABA concentration, and the quality characteristics of dry weight, TSS, pungency and firmness (Table 4.4). Onions cv. SS1 consistently and significantly occupied the lowest rank, dividing the cultivars into two distinct groups – cvs. Carlos, Dinaro, Hysam, Red Baron and Renate constituting one, and cv. SS1 forming the second. Dry weight was positively correlated with TSS concentration (0.668; P<0.001), and weakly with firmness (0.400, P<0.001) and pyruvate concentration (0.278, P=0.002). The TSS concentration was positively correlated with firmness (0.525, P<0.001) and weakly with pyruvate concentration (0.429, P<0.001). Firmness was also positively but weakly correlated with pyruvate concentration (0.203, P=0.03). To summarise, bulbs with a high dry weight tended to be firm and to have high TSS and pyruvate concentrations. Before storage, there was a main effect of cultivar on ABA concentration (P<0.001).
The three cultivars (Renate, Red Baron and SS1) that were analysed for NSCs were also ranked according to the mean pre-storage concentrations (Table 4.5). The pre-storage mean sucrose concentration was significantly greater (P<0.001) in cvs. Red Baron and Renate than cv. SS1. Conversely, pre-storage fructose and glucose concentrations were significantly greater (P<0.001) in cv. SS1 than cv. Renate, and least in cv. Red Baron. Before storage, onions cv. SS1 had the greatest mean concentration of total sugars (P<0.001), followed by Renate and finally Red Baron. Onions cv. Red Baron had the highest mean total fructan concentration (P>0.001), followed by cvs. Renate and SS1.
© 2006 Horticultural Development Council
84
Table 4.4. The ranking of the cultivars Carlos, Dinaro, Hysam, Red Baron, Renate and SS1 according to mean pre-storage measurements (n=20) of dry weight, total soluble solids, pungency, firmness and abscisic acid.
Rank Dry weight(mg g-1 FW)
Total soluble solids(%)
Pyruvate(μmol g-1 FW)
Firmness(N mm-1)
Abscisic acid(ng g-1 DW)
Cultivar Value Cultivar Value Cultivar Value Cultivar Value Cultivar Value1 Red
Baron140.1a Red
Baron10.21a Dinaro 6.41ª Renate 39.64ª Renate 215.28
(2.333ª)1
2 Carlos 125.9b Dinaro 9.36b Carlos 6.36ª Dinaro 36.74ªb
Dinaro 191.87(2.283a)
3 Dinaro 125.6b Renate 9.31b Hysam 5.32b Red Baron
36.51ªb
Hysam 178.24(2.251ab
)4 Hysam 125.1b Carlos 9.06b Red
Baron5.04b Hysam 36.19ª
b
Red Baron
132.74(2.123bc
)5 Renate 118.7c Hysam 9.00b Renate 5.02b Carlos 33.73b Carlos 129.42
(2.112c)6 SS1 73.0d SS1 4.77c SS1 3.68c SS1 16.36c SS1 110.41
(2.043c)LSD(P=0.05) 9.45 0.6067 0.711 6.154 0.12842
© 2006 Horticultural Development Council
85
abcd Different letters of superscript indicate significant difference (P>0.05). 1 Values in brackets are log transformed means, back transformed means are shown above. 2 LSD for log transformed means.
© 2006 Horticultural Development Council
86
Table 4.5. The ranking of the cultivars Red Baron, Renate and SS1 according to mean pre-storage measurements (n=12) of glucose, sucrose, fructose and fructan concentration.
Rank Glucose (mg g-1 DW)
Sucrose(mg g-1 DW)
Fructose(mg g-1 DW)
Total sugars (F+G+S)
(mg g-1 DW)
Fructan(mg g-1 DW)
Cultivar Value Cultivar Value Cultivar Value Cultivar Value Cultivar Value1 SS1 286.1a Renate 169.0a SS1 276.9ª SS1 643ª Red
Baron340.3ª
2 Renate 175.8b Red Baron
153.4a Renate 65.3b Renate 410 b Renate 220.7b
3 Red Baron
159.4b SS1 79.5b Red Baron
33.3c Red Baron
346c SS1 19.8c
LSD (P=0.05) 21.85 42.81 18.84 54.3 35.11abc Different letters of superscript indicate significant difference (P>0.05)
© 2006 Horticultural Development Council
87
4.4.1.2 Sprout growth
Analysis of variance tests were performed on data for sprout length measured as a percentage of bulb height. Binomial regression analysis was also performed on the proportion of analysed bulbs that had begun to sprout, and allowed the estimation of the time when 50% of the bulbs from each sample had sprouted. As there were no consistent differences between the treatments, the mean for each cultivar at each storage temperature was estimated from the binomial curves (Table 4.6). Sprout length increased during storage at all temperatures (P<0.001; Figure 4.2).
Table 4.6. The time (days) taken for 50% of the bulbs to sprout at each storage temperature.
Storage temperature(ºC)
Cultivar
Carlos Dinaro HysamRed
BaronRenate SS1
4 105 102 107 50 99 3012 82 75 77 65 76 1020 100 90 65 45 10 7
© 2006 Horticultural Development Council
88
ABA
Spro
ut le
ngth
(% b
ulb
heig
ht)
10
20
304050
100
200
300400500
PBI-365
Li-700
0 50 100 150 200 25010
20
304050
100
200
300400500 Water
0 50 100 150 200 250
ABA PBI-365
Li-700
0 20 40 60 80 100
Water
Time (days)
0 20 40 60 80 100
ABA PBI-365
X Data
0 20 40 60 80 100Li-700
0 20 40 60 80 100
Water
0 20 40 60 80 100
Figure 4.2. Sprout length of onion cvs. Carlos (●), Dinaro (○), Hysam (▼), Red Baron (), Renate (■) and SS1 (□) treated with a pre-harvest spray of 10-4 M ABA in 0.5% (v/v) Li-700, 10-4 M PBI-365 in 0.5% (v/v) Li-700, 0.5% (v/v) Li-700 or water and stored at 4°C for 243 days, 12°C for 109 days or 20°C for 98 days (n=5). LSD bars (P=0.05) are shown based on 321, 193 and 120 d.f for 4°C, 12°C and 20°C respectively.
© 2006 Horticultural Development Council
4°C 12°C 20°C
89
4.4.1.3 Firmness
In onion bulbs stored at 4°C and 12°C, firmness decreased with time in storage (P<0.001) (Figure 4.3). At 20°C, there was also a significant effect of storage time (P<0.001), however this was only due to the decrease in firmness of cv. SS1, as firmness did not change in other cultivars.
4.4.1.4 Dry weight
The dry weight of onion bulbs decreased during storage at all temperatures (4°C, 12°C and 20°C; P<0.001; Figure 4.4). In all cases the main cause of the variation was due to differences between cultivars, with increasingly smaller effects of day and treatment.
© 2006 Horticultural Development Council
90
ABA
0 50 100 150 200 2500
10
20
30
40
50
60 PBI-365
Li-700
0 50 100 150 200 250
Firm
ness
(N m
m-1
)
0
10
20
30
40
50
60 Water
0 50 100 150 200 250
PBI-365
Li-700
Time (days)
0 20 40 60 80 100
Water
0 20 40 60 80 100
ABA ABA
0 20 40 60 80 100
PBI-365
Li-700
0 20 40 60 80 100
Water
0 20 40 60 80 100
Figure 4.3. Firmness (N mm-1) of onion cvs. Carlos (●), Dinaro (○), Hysam (▼), Red Baron (), Renate (■) and SS1 (□) treated with a pre-harvest spray of 10-4 M ABA in 0.5% (v/v) Li-700, 10-4 M PBI-365 in 0.5% (v/v) Li-700, 0.5% (v/v) Li-700 or water and stored at 4°C for 243 days, 12°C for 109 days or 20°C for 98 days (n=5). LSD bars (P=0.05) are shown based on 526, 556 and 551 d.f for 4°C, 12°C and 20°C respectively.
© 2006 Horticultural Development Council
4°C 12°C 20°C
91
ABA
Dry
Wei
ght (
mg
g-1 F
W)
030
60
90
120
150
Li-700
0 50 100 150 200 2500
30
60
90
120
150
PBI-365
Water
0 50 100 150 200 250
ABA
Li-700
0 20 40 60 80 100
PBI-365
0 20 40 60 80 100Water
Time (days)0 20 40 60 80 100
PBI-365ABA
0 20 40 60 80 100Li-700
0 20 40 60 80 100
Water
0 20 40 60 80 100
Figure 4.4. Dry weight of onion cvs. Carlos (●), Dinaro (○), Hysam (▼), Red Baron (), Renate (■) and SS1 (□) treated with a pre-harvest spray of 10-4 M ABA in 0.5% (v/v) Li-700, 10-4 M PBI-365 in 0.5% (v/v) Li-700, 0.5% (v/v) Li-700 or water and stored at 4°C for 243 days, 12°C for 109 days or 20°C for 98 days (n=5). LSD bars (P=0.05) are shown based on 525, 558 and 555 d.f for 4°C, 12°C and 20°C respectively.
© 2006 Horticultural Development Council
4°C 12°C 20°C
92
4.4.1.5 Total soluble solids
The general trend for the change in TSS concentration during storage at 4°C was for a decrease from the beginning of storage until day 53 to 109, followed by a subsequent increase, resulting in no net change (P<0.001; Figure 4.5). In onion bulbs stored at 12°C, TSS concentration decreased to a minimum in the middle of storage (day 53) and then increased again towards the end of storage (P<0.001). During storage at 20°C, TSS concentration slightly decreased over time, with a small decrease in the middle of the storage period, followed by a smaller increase (P<0.001). Throughout storage at all temperatures there was a main effect of cultivar (P<0.001), with cv. Red Baron having the highest TSS concentration, and cv. SS1 the lowest.
4.4.1.6 Pyruvate concentration
Pyruvate concentration changed during storage at all temperatures (P<0.001), and there was a net increase in mean pyruvate concentration during the storage period (Figure 4.6). However the pungency of bulbs cv. SS1 stored at 12°C or 20°C decreased, while that of bulbs cv. Red Baron increased. The pyruvate concentration of onion bulbs stored at 20°C reached a maximum in the middle of storage (day 39) in bulbs of cvs. Carlos, Renate, Dinaro and Hysam.
© 2006 Horticultural Development Council

93
PBI-365
Tot
al S
olub
le S
olid
s (%
)
Li-700
0 50 100 150 200 2500
2
4
6
8
10
12Water
0 50 100 150 200 250
ABA
0
2
4
6
8
10
12 ABA
Time (days)
PBI-365
Li-700
0 20 40 60 80 100
Water
0 20 40 60 80 100
ABA PBI-365
Li-700
0 20 40 60 80 100
Water
0 20 40 60 80 100
Figure 4.5. Total soluble solids concentration of onion cvs. Carlos (●), Dinaro (○), Hysam (▼), Red Baron (), Renate (■) and SS1 (□) treated with a pre-harvest spray of 10 -4 M ABA in 0.5% (v/v) Li-700, 10-4 M PBI-365 in 0.5% (v/v) Li-700, 0.5% (v/v) Li-700 or water and stored at 4°C for 243 days, 12°C for 109 days or 20°C for 98 days (n=5). LSD bars (P=0.05) are shown based on 526, 558 and 557 d.f. for 4°C, 12°C and 20°C respectively.
© 2006 Horticultural Development Council
4°C 12°C 20°C
94
ABA
0
2
4
6
8
10PBI-365
Pyru
vate
(m
ol g
-1 F
W)
Li-700
0 50 100 150 200 2500
2
4
6
8
10Water
0 50 100 150 200 250
Li-700
Time (days)
0 20 40 60 80 100
Water
0 20 40 60 80 100
ABA PBI-365 ABA PBI-365
Li-700
0 20 40 60 80 100
Water
0 20 40 60 80 100
Figure 4.6. Pyruvate concentration of onion cvs. Carlos (●), Dinaro (○), Hysam (▼), Red Baron (), Renate (■) and SS1 (□) treated with a pre-harvest spray of 10-4 M ABA in 0.5% (v/v) Li-700, 10-4 M PBI-365 in 0.5% (v/v) Li-700, 0.5% (v/v) Li-700 or water and stored at 4°C for 243 days, 12°C for 109 days or 20°C for 98 days (n=5). LSD bars (P=0.05) are shown based on 526, 559 and 557 d.f. for 4°C, 12°C and 20°C respectively.
© 2006 Horticultural Development Council
4°C 12°C 20°C
95
4.4.1.7 Non-structural carbohydrates
Non-structural carbohydrates (fructose, glucose, sucrose and total fructans) were measured in three of the six cultivars; Red Baron, Renate and SS1. The relative amounts of individual carbohydrates varied between these cultivars.
Fructose concentration in onions cv. SS1 stored at 4ºC decreased during storage (Figure 4.7). Fructose concentration was stable during storage at 12ºC in cvs. Renate and Red Baron, but decreased 2.2-fold in cv. SS1. There was a slight (1.4-fold) increase in fructose concentration in cvs. Renate and Red Baron, and a net decrease (1.2-fold) in cv. SS1, during storage at 20ºC. Fructose concentration decreased between day 7 and 26 in cv. SS1 and then increased again until the end of storage.
The concentration of sucrose in onion bulbs cv. Red Baron stored at 4ºC remained stable during storage (Figure 4.8), but there was a slight increase in sucrose concentration of onions cv. Renate (from 175.8 to 206.0 mg g-1 DW) and a decrease in onions cv. SS1 (from 220.3 to 209.4 mg g-1 DW). When cvs. Renate and Red Baron were stored at 12ºC, sucrose concentration generally increased (P<0.001) between day 0 and day 26. There was a decrease (P<0.001) in sucrose concentration between days 39 and 81 during storage at 12ºC in cv. SS1. Sucrose concentration tended to increase (P<0.001) during storage at 20ºC in cvs. Red Baron and Renate by 1.3- and 1.4-fold, respectively, whereas sucrose concentration in cv. SS1 decreased 1.3-fold during storage, although this was not significant.
Glucose concentration in onions stored at 4ºC changed differently in different cultivars. It decreased with time in cv. SS1, increased in cv. Renate, and was stable in Red Baron (Figure 4.9). The concentration of glucose remained stable in both cvs. Renate and Red Baron stored at 12ºC, but decreased 2.4-fold in cv. SS1. Glucose concentration was relatively stable during storage at 20ºC in cv. Renate. In cv. Red Baron, glucose concentration decreased between days 0 and 7, then increased between days 7 and 67, before decreasing again between day 67 and day 98. In cv. SS1, glucose concentration decreased between day 7 and 26, and then increased to the end of storage.
© 2006 Horticultural Development Council
96
ABA
0 50 100 150 200 2500
100
200
300
400PBI-365
Li-700
0 50 100 150 200 250
Fruc
tose
(mg
g-1 D
W)
0
100
200
300
400Water
0 50 100 150 200 250
PBI-365
Li-700
Time (days)
0 20 40 60 80 100
Water
0 20 40 60 80 100
ABA ABA
0 20 40 60 80 100
PBI-365
Li-700
0 20 40 60 80 100
Water
0 20 40 60 80 100
Figure 4.7. Fructose concentration of onion cvs. Red Baron (●), Renate (○) and SS1 (▼) treated with a pre-harvest spray of 10-4 M ABA in 0.5% (v/v) Li-700, 10-4 M PBI-365 in 0.5% (v/v) Li-700, 0.5% (v/v) Li-700 or water and stored at 4°C for 243 days, 12°C for 109 days or 20°C for 98 days (n=3). LSD bars (P=0.05) are shown based on 120, 136 and 132 d.f. for 4°C, 12°C and 20°C respectively.
© 2006 Horticultural Development Council
4°C 12°C 20°C
97
ABA
0 50 100 150 200 2500
100
200
300
400
Red Baron 4 Sucrose 1 Renate 4 Sucrose 1 SS1 4 Sucrose 1 LSD Sucrose 4 X vs LSD Sucrose 4 Y
PBI-365
Li-700
0 50 100 150 200 250
Sucr
ose
(mg
g-1 D
W)
0
100
200
300
400Water
0 50 100 150 200 250
PBI-365
Li-700
Time (days)
0 20 40 60 80 100
Water
0 20 40 60 80 100
ABA ABA
0 20 40 60 80 100
PBI-365
Li-700
0 20 40 60 80 100
Water
0 20 40 60 80 100
Figure 4.8. Sucrose concentration of onion cvs. Red Baron (●), Renate (○) and SS1 (▼) treated with a pre-harvest spray of 10-4 M ABA in 0.5% (v/v) Li-700, 10-4 M PBI-365 in 0.5% (v/v) Li-700, 0.5% (v/v) Li-700 or water and stored at 4°C for 243 days, 12°C for 109 days or 20°C for 98 days (n=3). LSD bars (P=0.05) are shown based on 120, 136 and 132 d.f. for 4°C, 12°C and 20°C respectively.
© 2006 Horticultural Development Council
4°C 12°C 20°C
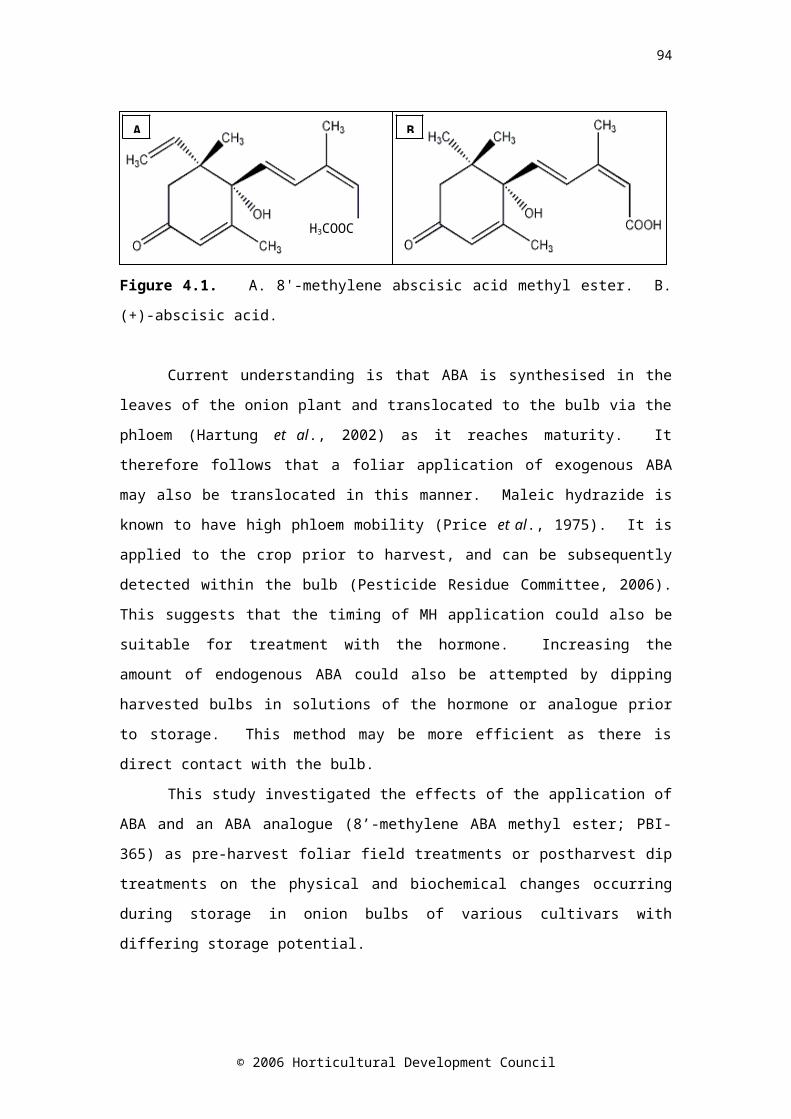
98
ABA
0 50 100 150 200 2500
100
200
300
400PBI-365
Li-700
0 50 100 150 200 250
Glu
cose
(mg
g-1 D
W)
0
100
200
300
400Water
0 50 100 150 200 250
PBI-365
Li-700
Time (days)
0 20 40 60 80 100
Water
0 20 40 60 80 100
ABA ABA
0 20 40 60 80 100
PBI-365
Li-700
0 20 40 60 80 100
Water
0 20 40 60 80 100
Figure 4.9. Glucose concentration of onion cvs. Red Baron (●), Renate (○) and SS1 (▼) treated with a pre-harvest spray of 10-4 M ABA in 0.5% (v/v) Li-700, 10-4 M PBI-365 in 0.5% (v/v) Li-700, 0.5% (v/v) Li-700 or water and stored at 4°C for 243 days, 12°C for 109 days or 20°C for 98 days (n=3). LSD bars (P=0.05) are shown based on 120, 136 and 132 d.f. for 4°C, 12°C and 20°C respectively.
© 2006 Horticultural Development Council
4°C 12°C 20°C
99
Total sugar concentration was calculated as the sum of the fructose, glucose and sucrose concentrations. In general, total sugars increased in Renate and Red Baron during storage at all temperatures, but decreased in cv. SS1 (Figure 4.10). There was a slight increase in total sugar concentration in cvs. Renate and Red Baron, and a 1.9-fold decrease in cv. SS1 stored at 12ºC. There was little change in total sugar concentration in cv. Red Baron during storage at 20ºC, a net increase (P<0.001) in cv. Renate, but a net decrease in cv. SS1. Total sugar concentration in cv. SS1 decreased between day 0 and day 26, and then increased to the end of storage, day 67. Where a significant correlation between total sugars and TSS existed, it was negative and usually weak for cvs. Renate (4ºC and 20ºC no correlation; 12ºC -0.440 P>0.001) and Red Baron (4ºC -0.488 P>0.001; 12ºC -0.330 P=0.005; 20ºC -0.453 P>0.001), and positive for cv. SS1 (4ºC and 20ºC no correlation; 12ºC 0.656 P>0.001).
The ratio of monosaccharide to disaccharide content was calculated. There was no change in the ratio of monosaccharide to disaccharide in onions cv. Red Baron and Renate during storage at 4, 12 or 20ºC; however the ratio decreased in cv SS1 during storage at 4ºC, and changed erratically during storage 12 and 20ºC. In general there was a higher ratio of monosaccharide to disaccharide in onions cv. SS1 than cvs. Renate or Red Baron (Figure 4.11).
© 2006 Horticultural Development Council

100
ABA
0 50 100 150 200 2500
200
400
600
800PBI-365
Li-700
0 50 100 150 200 250
Tot
al su
gars
(mg
g-1 D
W)
0
200
400
600
800Water
0 50 100 150 200 250
PBI-365
Li-700
Time (days)
0 20 40 60 80 100
Water
0 20 40 60 80 100
ABA ABA
0 20 40 60 80 100
PBI-365
Li-700
0 20 40 60 80 100
Water
0 20 40 60 80 100
Figure 4.10. Total sugars (glucose + sucrose + fructose) concentration of onion cvs. Red Baron (●), Renate (○) and SS1 (▼) treated with a pre-harvest spray of 10-4 M ABA in 0.5% (v/v) Li-700, 10-4 M PBI-365 in 0.5% (v/v) Li-700, 0.5% (v/v) Li-700 or water and stored at 4°C for 243 days, 12°C for 109 days or 20°C for 98 days (n=3). LSD bars (P=0.05) are shown based on 120, 136 and 132 d.f. for 4°C, 12°C and 20°C respectively.
© 2006 Horticultural Development Council
4°C 12°C 20°C
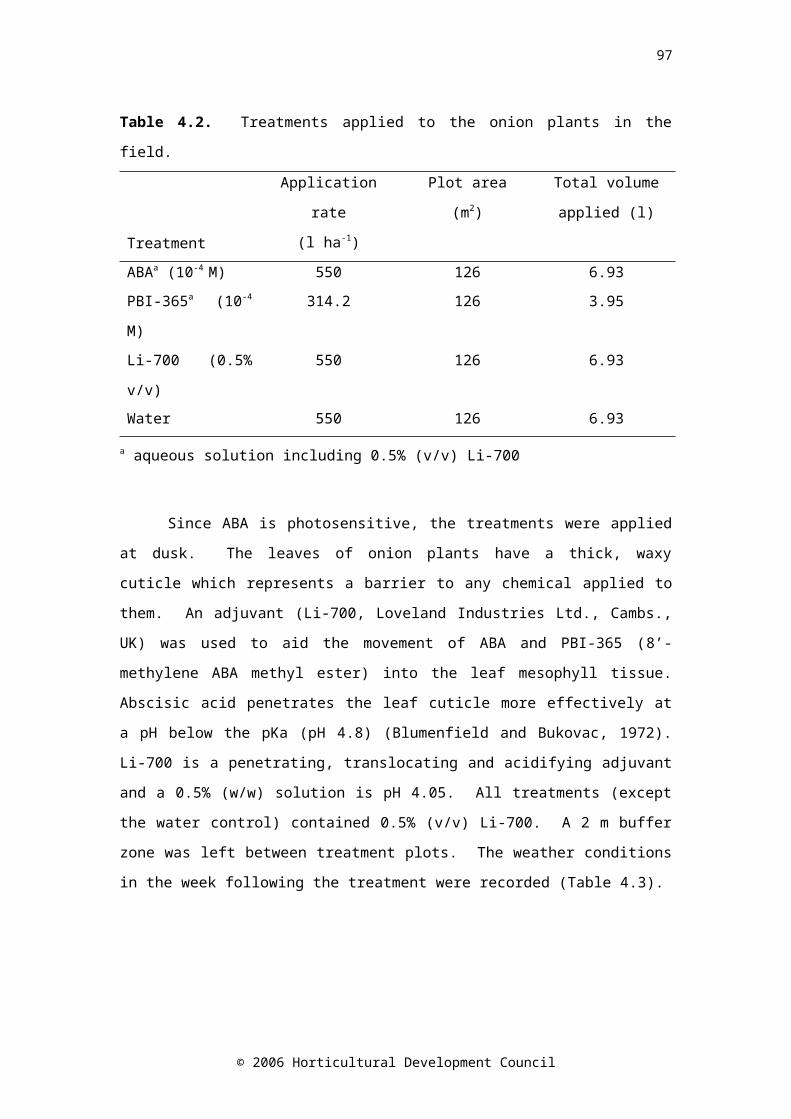
101
ABA
0 50 100 150 200 2500
5
10
15
20PBI-365
Li-700
0 50 100 150 200 250
(Fru
ctos
e +
Glu
cose
) / S
ucro
se
0
5
10
15
20Water
0 50 100 150 200 250
PBI-365
Li-700
Time (days)
0 20 40 60 80 100
Water
0 20 40 60 80 100
ABA ABA
0 20 40 60 80 100
PBI-365
Li-700
0 20 40 60 80 100
Water
0 20 40 60 80 100
Figure 4.11. Ratio of monosaccharide : disaccharide ((fructose+glucose)/sucrose) of onion cvs. Red Baron (●), Renate (○) and SS1 (▼) treated with a pre-harvest spray of 10-4 M ABA in 0.5% (v/v) Li-700, 10-4 M PBI-365 in 0.5% (v/v) Li-700, 0.5% (v/v) Li-700 or water and stored at 4°C for 243 days, 12°C for 109 days or 20°C for 98 days (n=3). LSD bars (P=0.05) are shown based on 120, 136 and 132 d.f. for 4°C, 12°C and 20°C respectively.
© 2006 Horticultural Development Council
4°C 12°C 20°C
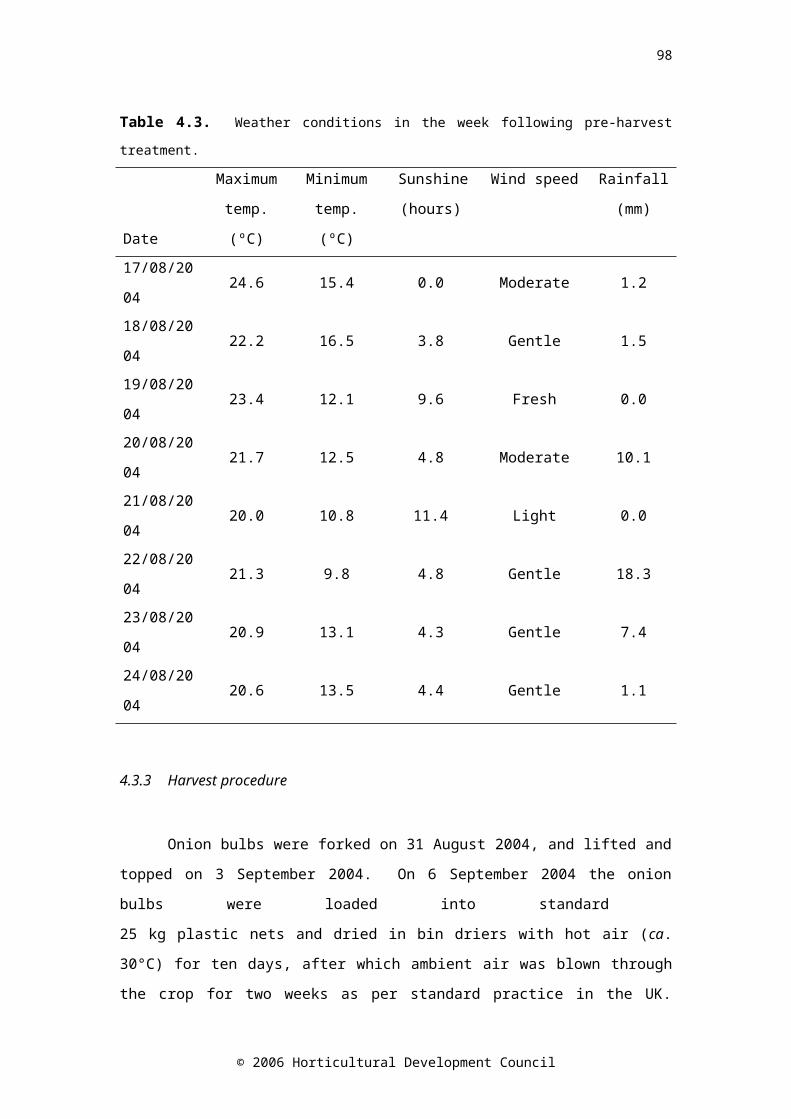
102
Fructan concentration decreased in cvs. Red Baron and Renate stored at 4ºC, but increased in cv. SS1 (Figure 4.12). There was no significant change in the fructan concentration in cvs. SS1 or Renate during storage at 12ºC, although there was a peak at days 39 and 53, respectively, but fructan concentration decreased during storage in Red Baron (P<0.001). There was very little change in the fructan concentration in cvs. Renate and Red Baron stored at 20ºC, whilst the fructan concentration in cv. SS1 increased.
Fructan concentration was strongly negatively correlated with fructose (4ºC -0.805; 12ºC -0.812; 20ºC -0.818; P<0.001) and glucose (4ºC -0.591; 12ºC -0.503; 20ºC -0.705; P<0.001) concentration and positively correlated with sucrose concentration (4ºC 0.331, P=0.002; 12ºC 0.565, P<0.001; 20ºC 0.279, P<0.001). Fructose concentration was positively correlated with glucose (4ºC 0.795, 12ºC 0.790, 20ºC 0.856; P<0.001) and negatively correlated with sucrose (4ºC -0.443, 12ºC -0.465, 20ºC -0.511; P<0.001), and there was a negative correlation between sucrose and glucose (4ºC -0.569, 12ºC -0.183, 20ºC -0.400; P<0.001). To summarise, onions containing a high fructan concentration contained less fructose and glucose and more sucrose.
Where a significant correlation existed, the relationship between TSS and fructan concentration was positive in cvs. Renate (4ºC 0.232 P=0.049; 12ºC no correlation; 20ºC 0.253 P=0.033) and Red Baron (4ºC and 12ºC no correlation; 20ºC 0.414 P<0.001) and negative in cv. SS1 (4ºC -0.439 P=0.007; 12ºC and 20ºC no correlation).
© 2006 Horticultural Development Council
103
ABA
0 50 100 150 200 2500
100
200
300
400PBI-365
Li-700
0 50 100 150 200 250
Tota
l fru
ctan
(mg
g-1 D
W)
0
100
200
300
400Water
0 50 100 150 200 250
PBI-365
Li-700
Time (days)
0 20 40 60 80 100
Water
0 20 40 60 80 100
ABA ABA
0 20 40 60 80 100
PBI-365
Li-700
0 20 40 60 80 100
Water
0 20 40 60 80 100
Figure 4.12. Total fructan concentration of onion cvs. Red Baron (●), Renate (○) and SS1 (▼) treated with a pre-harvest spray of 10-4 M ABA in 0.5% (v/v) Li-700, 10-4 M PBI-365 in 0.5% (v/v) Li-700, 0.5% (v/v) Li-700 or water and stored at 4°C for 243 days, 12°C for 109 days or 20°C for 98 days (n=3). LSD bars (P=0.05) are shown based on 120, 136 and 134 d.f. for 4°C, 12°C and 20°C respectively.
© 2006 Horticultural Development Council
4°C 12°C 20°C
104
4.4.1.8 Abscisic acid
Bulb ABA concentration decreased during storage (P<0.001) at all temperatures (Figure 4.13). There was no consistent effect of pre-harvest treatment on ABA concentration. In most cases, a decrease in ABA concentration was followed by an increase towards the end of the storage period. The increase in ABA concentration was preceded by the time to 50% sprouting. There were no correlations between ABA concentration and sprout growth when analysed over the entire storage period, however, when only the data up until 50% sprouting for each cultivar was analysed, there was a significant negative correlation between ABA concentration and sprout growth at 4ºC (-0.193; P<0.001), 12ºC (-0.164; P<0.001) and 20ºC (-0.088; P=0.021).
© 2006 Horticultural Development Council
105
ABA
0 50 100 150 200 250
AB
A (n
g g-1
DW
)
304050
100
200
300400500600 PBI-365
Li-700
0 50 100 150 200 250304050
100
200
300400500600 Water
0 50 100 150 200 250
PBI-365
Li-700
Time (days)
0 20 40 60 80 100
Water
0 20 40 60 80 100
ABA ABA
0 20 40 60 80 100
PBI-365
Li-700
0 20 40 60 80 100
Water
0 20 40 60 80 100
Figure 4.13. Abscisic acid concentration of onion cvs. Carlos (●), Dinaro (○), Hysam (▼), Red Baron (), Renate (■) and SS1 (□) treated with a pre-harvest spray of 10 -4 M ABA in 0.5% (v/v) Li-700, 10-4 M PBI-365 in 0.5% (v/v) Li-700, 0.5% (v/v) Li-700 or water and stored at 4°C for 243 days, 12°C for 109 days or 20°C for 98 days (n=5). LSD bars (P=0.05) are shown based on 524, 556 and 554 d.f for 4°C, 12°C and 20°C respectively.
© 2006 Horticultural Development Council
4°C 12°C 20°C
106
4.4.2 Experiment 2- Consequences of postharvest bulb dip into solutions of ABA or PBI-365
The onion bulbs in this experiment were exposed to three postharvest treatments – the application of 10-4 M ABA in 0.5% (v/v) Li-700, 10-4 M PBI-365 in 0.5% (v/v) Li-700 or water, and three storage temperatures – 4°C, 12°C or 20°C. There was no consistent significant effect of postharvest treatment on any of the parameters measured. The main effects identified by ANOVA were due to storage time. Therefore the relationship between temporal changes in quality characteristics and ABA concentration and the onset of sprout growth are presented.
4.4.2.1 Sprout growth
Sprout length increased significantly (P<0.001) during storage at 4ºC and sprouting began between day 53 and day 186 (Figure 4.14). Sprout length increased during storage at 12ºC (P<0.001) and 20ºC (P=0.008).
© 2006 Horticultural Development Council
107
0 50 100 150 200
Spro
ut le
ngth
(% o
f bul
b he
ight
)
0
20
40
60
80
100
120
140
Time (days)
0 20 40 60 80 100 0 20 40 60
Figure 4.14. Sprout growth of onion cv. Hysam bulbs treated with a postharvest soak in 10-4 M ABA in 0.5% (v/v) Li-700 (●), 10-4 M PBI-365 in 0.5% (v/v) Li-700 (▼) or water (○) and stored at 4°C for 215 days, 12°C for 109 days or 20°C for 67 days (n=3). LSD bars (P=0.05) are shown based on 39 d.f.
4.4.2.2 Firmness and dry weight
Firmness decreased significantly during storage at all temperatures (4ºC P<0.001, 12ºC P=0.003, 20ºC P=0.018; Figure 4.15). Dry weight decreased significantly during storage at all temperatures (4ºC P=0.001; 12ºC and 20ºC P<0.001; Figure 4.15), with significant decreases occurring between day 0 and day 53, and day 183 and day 215 at 4ºC, and between day 0 and day 26 at 12ºC. Firmness was positively correlated with pyruvate concentration (0.419; P=0.047) and TSS (0.504; P=0.014) in onions stored at 4ºC. There was a positive correlation between TSS and dry weight (0.613, P=0.034) in onions stored at 12ºC.
© 2006 Horticultural Development Council
4°C 12°C 20°C
108
0 50 100 150 200
Dry
Wei
ght (
mg
g-1 F
W)
0
20
40
60
80
100
120
140
160
Time (days)
0 20 40 60 80 100 0 20 40 60
Firm
ness
(N m
m-1
)
0
10
20
30
40
50
60
Figure 4.15. Firmness and dry weight of onion cv. Hysam bulbs treated with a postharvest soak in 10-4 M ABA in 0.5% (v/v) Li-700 (●), 10-4 M PBI-365 in 0.5% (v/v) Li-700 (▼) or water (○) and stored at 4°C for 215 days, 12°C for 109 days or 20°C for 67 days (n=3). LSD bars (P=0.05) are shown based on: firmness - 35, 36 and 35 d.f for 4°C, 12°C and 20°C respectively, dry weight - 39 d.f.
4.4.2.3 Total soluble solids and pyruvate concentration
The TSS concentration of onion bulbs stored at 4ºC or 20ºC did not change during storage or with treatment (Figure 4.16), while TSS changed during storage at 12ºC with a significant (P<0.001) decrease occurring between days 26 and 81.
Pyruvate concentration did not change significantly during storage at 4ºC, 12ºC or 20ºC (Figure 4.16). Total soluble solids content was positively
© 2006 Horticultural Development Council
4°C 12°C 20°C
4°C 12°C 20°C
109
correlated with pyruvate concentration (0.532, P=0.009) in onions stored at 4ºC.
0 50 100 150 200
Pyru
vate
(m
ol g
-1 F
W)
0
2
4
6
8
Time (days)
0 20 40 60 80 100 0 20 40 60
Tot
al so
lubl
e so
lids (
%)
0
2
4
6
8
10
Figure 4.16. Total soluble solids and pyruvate concentration of onion cv. Hysam bulbs treated with a postharvest soak in 10-4 M ABA in 0.5% (v/v) Li-700 (●), 10-4 M PBI-365 in 0.5% (v/v) Li-700 (▼) or water (○) and stored at 4°C for 215 days, 12°C for 109 days or 20°C for 67 days (n=3). LSD bars (P=0.05) are shown based on 39 d.f.
4.4.2.4 Abscisic acid
Bulb ABA concentration decreased during storage at 4ºC (Figure 4.17) and was negatively correlated with sprout length (-0.362; P=0.009). Similarly, ABA decreased during storage at 12ºC (P<0.001), but then increased between day 81 and 109, although this was not significant. Treatment did not have an effect, but there was a weak negative, although
© 2006 Horticultural Development Council
4°C 12°C 20°C
4°C 12°C 20°C

110
non-significant, correlation, between ABA and sprout length (-0.148). Again, ABA decreased significantly during storage at 20ºC (P<0.001) and there was no difference between treatments. Bulb ABA concentration was negatively, but not significantly, correlated with sprout length (-0.339) during storage at 20ºC.
0 20 40 600 50 100 150 200 250
AB
A (n
g g-1
DW
)
10
20
304050
75100
150200250300400
Time (days)
0 20 40 60 80 100
Figure 4.17. ABA concentration of onion cv. Hysam bulbs treated with a postharvest soak in 10-4 M ABA in 0.5% (v/v) Li-700 (●), 10-4 M PBI-365 in 0.5% (v/v) Li-700 (▼) or water (○) and stored at 4°C for 215 days, 12°C for 109 days or 20°C for 67 days (n=3). LSD bars (P=0.05) are shown based on 39, 38 and 39 d.f. for 4°C, 12°C and 20°C respectively.
4.5 Discussion
Storage of onion bulbs grown in temperate regions and harvested in the summer can supply the locally-grown product almost all year round. Consumer demand for a residue-free product means that extended storage in the future will have to be accomplished without the use of the synthetic sprout suppressant maleic hydrazide. However, it is essential for the quality of onion bulbs to be maintained throughout storage. The following characteristics can be used to assess onion bulb quality: dry weight, firmness, pyruvate concentration, total soluble solids and carbohydrate concentration.
© 2006 Horticultural Development Council
4°C 12°C 20°C
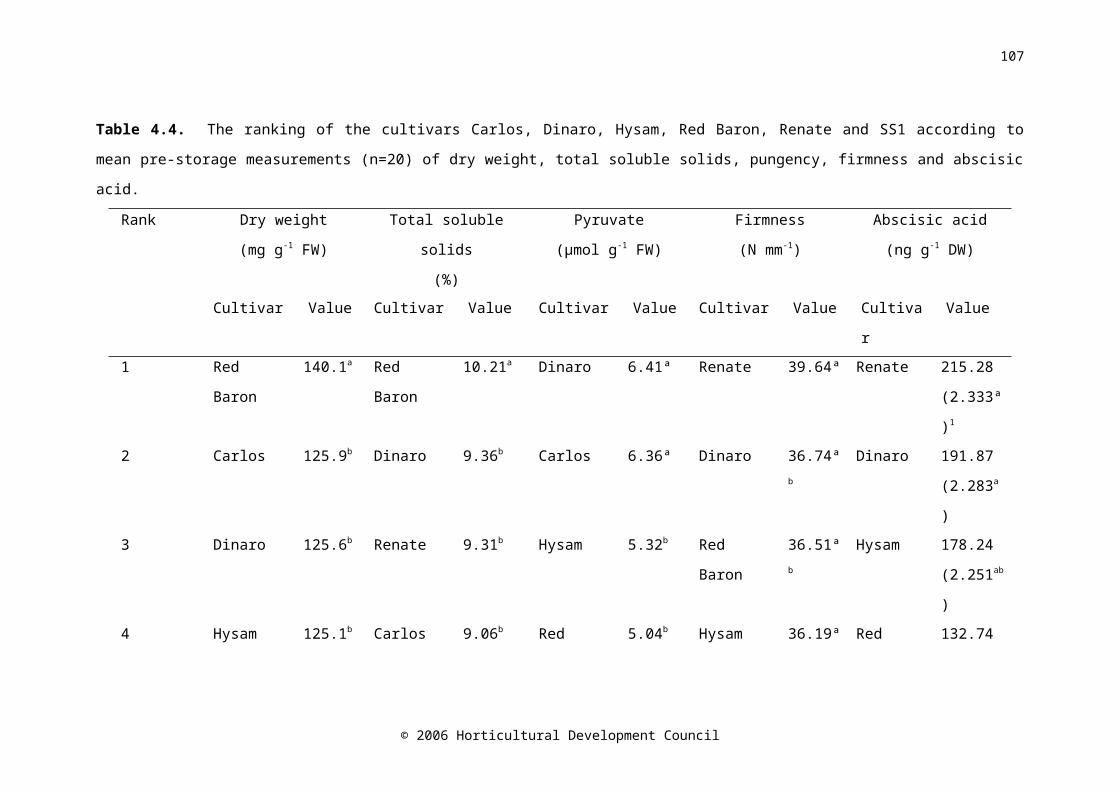
111
These characteristics differed both between cultivars and during storage at different temperatures (4ºC, 12ºC and 20ºC). By contrast, the ABA and ABA analogue treatments applied to the onions had no consistent effect on the parameters measured, and the reasons for this are considered.
Firm onions are desirable and firmness was positively correlated with dry weight. Both firmness and dry weight decreased during storage, which was likely to be due to water loss in store. In general, the decrease was most pronounced in onions cv. SS1. Mild (low pungency) onions like cv. SS1 tend to have a thinner outer skin, and also have less outer skin layers than the other cultivars in the current study, allowing water to be lost more easily from the bulb.
Pyruvate concentration is an indicator of the pungency of an onion bulb. Pungency is an important characteristic, particularly for cultivars such as cv. SS1 that are intended to be marketed as mild onions, commanding a price premium, and whose pyruvate concentration must fall below the pre-defined limit of 4 µmol g-1 FW (Crowther et al., 2005). An understanding of the factors that affect this parameter and how it changes during storage is therefore desirable. There was a trend for an increase in pyruvate concentration during storage, meaning that onions removed from store will generally be more pungent than freshly harvested bulbs, similarly, pyruvate concentration increased in onion cv. Rouge Amposta increased during 22 weeks storage at 20°C, but there was no net change in those stored at 4°C (Benkeblia, 2000).
As has been previously observed (Chapter 3), a minimum in TSS content occurred around the middle of the storage period, and this was most pronounced in those onions stored at 4 and 12ºC. The TSS concentration proved to be a poor indicator of total sugar (glucose + sucrose + fructose) concentration, with a positive relationship between TSS and total sugars existing in the low dry matter cultivar (SS1), and a negative relationship in the high dry matter cultivars (Red Baron and Renate). The opposite was true for the relationship with fructans, which indicates that the most likely cause
© 2006 Horticultural Development Council
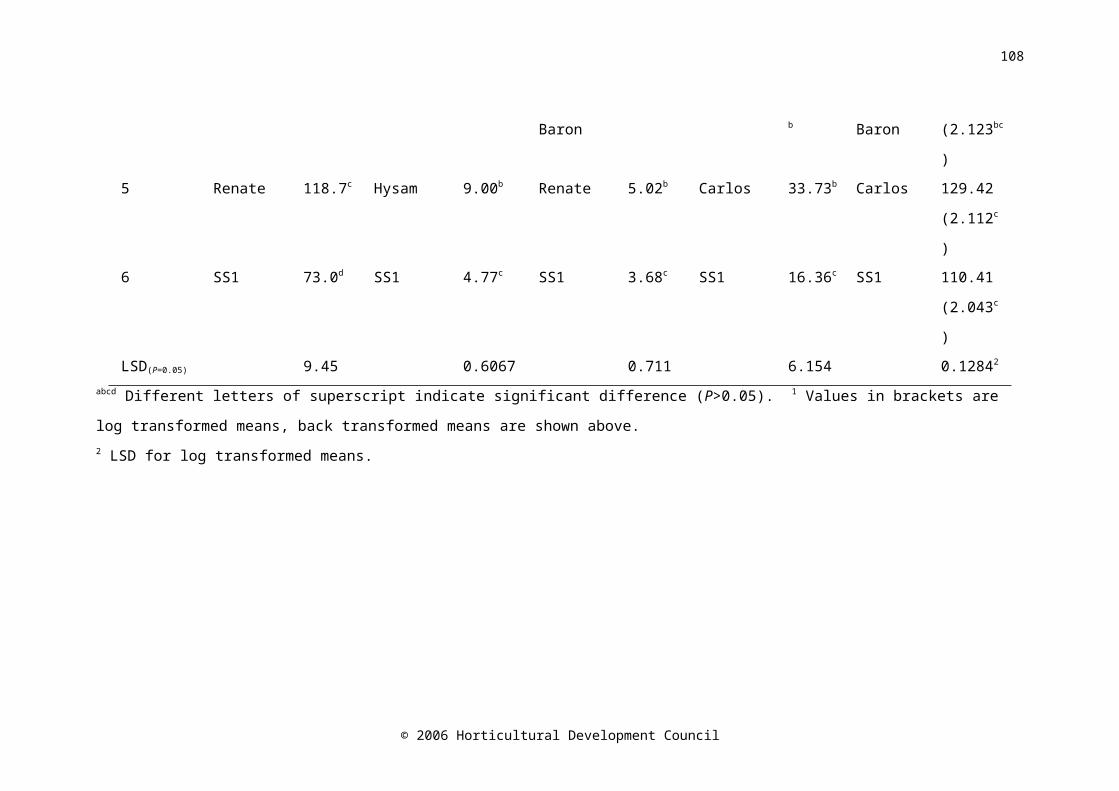
112
of the change in refractive index was fructans in the high dry matter cultivars, and simple sugars in the low dry matter cultivar.
It has been proposed that the ABA concentration of onion bulbs is linked with storage potential (Chapter 3; Chope et al., 2006). Sprouting in store occurred later in onion bulbs with higher concentrations of ABA before storage and onset of sprouting was associated with minimal ABA concentration in agreement with results reported in Chapter 3. Similarly, ABA concentration decreased during storage of onions from experiment 1 at all temperatures, followed by a subsequent increase. The subsequent increase, which was not observed in Chapter 3, was thought to be due to synthesis of ABA by the growing sprout. There was no correlation between ABA and sprout length in the onions in experiment 1 (pre-harvest foliar spray). This was probably because the bulbs in this experiment were allowed to form external or advanced sprouts, and explains why ABA was not observed to increase in bulbs from experiment 2 (postharvest bulb soak), and in Chapter 3. Therefore, ABA concentration decreased until the sprout began to grow, when the ABA concentration began to rise. This confounds any linear correlations applied to the data. When the analysis was restricted to data collected up to 50% sprouting, a negative correlation was identified, which, combined with the similar relationship for bulbs cv. Hysam in the postharvest experiment, supports the hypothesis proposed in Chapter 3 that sprouting occurs at minimal ABA concentration. In the current study, the portion of the bulb sampled was a wedge of tissue taken from top to bottom, therefore, the changes observed in ABA concentration were not due to movement vertically within the bulb, but were a result of real changes in the total amount of ABA present.
There were no linear correlations between ABA concentration and non-structural carbohydrate concentration. All energy and nutrients required by the growing sprout in a stored onion must be sourced from within the bulb. A decrease in carbon reserves would therefore be expected to occur in conjunction with an increase in sprout growth. If ABA concentration is not related to the decrease in carbohydrate concentration, but is, as has been
© 2006 Horticultural Development Council
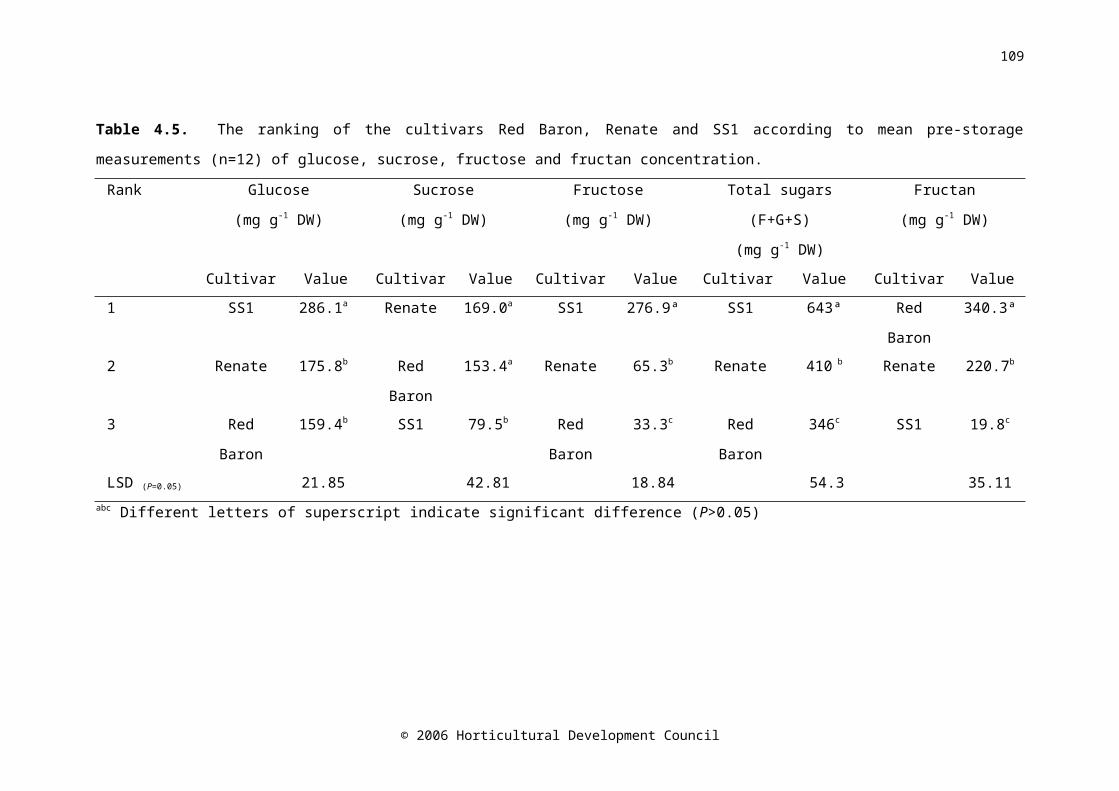
113
shown, correlated with storage life, it is important to consider why this might be. It could be that the carbohydrates measured are not the preferred carbon source for the sprout. Alternative energy sources are other carbon containing compounds such as the flavour precursors, S-alk(en)yl cysteine sulphoxides (ACSOs).
An in vitro study showed that treatment of basal, equatorial and near apical tissue with 10-4 M ABA inhibited nucleolar activation, which supports a role for ABA in inhibition of cell elongation (Karagiannis and Pappelis, 1994). Therefore, ABA could be involved in sprout growth by cell expansion, rather than cell division, which would not necessarily be expected to have a large effect on remobilisation of carbohydrates. An alternative explanation is that minimal ABA concentration is the trigger for the rate of sprout growth to increase. If this is the case then ABA concentration would not be expected to have a linear relationship with NSC concentration because it is the actual growth of the sprout that requires energy, not the trigger that begins the cascade.
The concentrations of fructans, sucrose, glucose and sucrose were determined in three of the six cultivars from experiment 1. Renate and Red Baron are high dry matter cultivars, and SS1 is a low dry matter cultivar. High dry matter cultivars tend to accumulate fructans during bulb formation which allows limited water uptake, and in this study, fructan was positively correlated with sucrose, and negatively correlated with fructose and glucose. All relationships between sugars are consistent with those reported previously (Jaime et al., 2001).
A decrease in total fructan concentration was coincidental with an increase in fructose concentration in onions of all cultivars stored at 4ºC and in cv. Red Baron stored at 20ºC. It is probable that the decrease in fructan was accompanied by an increase in fructose due to the metabolism of fructan into fructose and sucrose. The pattern of change in sucrose concentration in onions of all cultivars during storage at 4ºC was the inverse of the pattern of change in fructan concentration. This is likely to be due to the conversion of
© 2006 Horticultural Development Council
114
the freed fructose, from metabolism of fructans, into sucrose, which can then be used as energy by the growing sprout.
The time at which an internal sprout had begun to grow in 50% of bulbs of a particular cultivar was extrapolated from the binomial analysis. The time to 50% sprouting was followed by an increase in fructan concentration in onion bulbs cv. SS1 during storage at all temperatures. An increase in fructan concentration during storage in onions cv. SS1 was also observed in Chapter 5, and was attributed to the synthesis of fructans by the growing sprout. However, onset of sprouting was preceded by a decrease in fructan concentration in cvs. Renate and Red Baron stored at all temperatures, after which fructan concentration continued to decrease. Fructans represent a major carbohydrate reserve in onion bulbs cv. Renate and Red Baron, but only constitute a minor reserve in cv. SS1. The rate of the decrease in fructan concentration was greatest at 4ºC and least at 20ºC.
A sharp increase in fructose concentration preceded the time to 50% sprouting, followed by little change to the end of storage in onions cv. Red Baron stored at 4ºC, however, in onions cv. Renate, fructose increased steadily throughout storage. There was little change in fructose concentration during storage in onions cvs. Renate and Red Baron during storage at 12ºC and 20ºC. In onions cv. SS1 stored at all temperatures sprouting was followed by a decrease in fructose concentration. This represents the increased importance of free fructose as an energy source for onions cv. SS1 as they do not have fructan reserves to breakdown. A peak in glucose concentration was observed before breaking of dormancy in onions cv. Rouge Amposta stored at 18ºC (Benkeblia and Selselet-Attou, 1999b) and this was also observed in onions cv. Renate during storage at 4 and 12ºC, but not in cvs. Red Baron or SS1. This suggests that the peak in glucose concentration may be a cultivar-specific phenomenon.
Fructan is depolymerised into fructose, which is then converted to sucrose with the addition of glucose. Therefore, before sprouting occurs, no net loss of fructan would be expected, as when sucrose is abundant it is used as a fructosyl acceptor and so is made into fructan again. However, when
© 2006 Horticultural Development Council
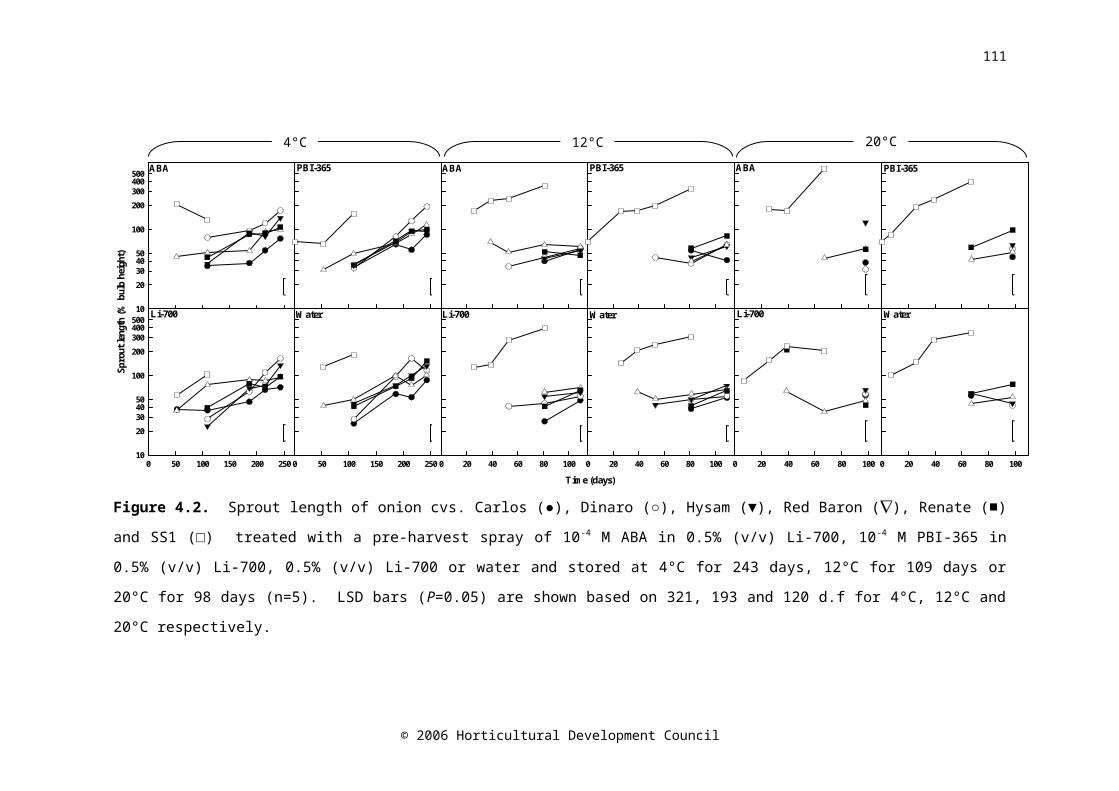
115
sprout growth has begun, sucrose is transported to the sprout where it is metabolised. Therefore, total fructan concentration would decrease in conjunction with an increase in the concentration of fructose and sucrose. Sucrose concentration increased early in the storage period at all temperatures in cv. Renate which is consistent with observations made on onion cv. Tenshin stored at 10 and 20°C (Benkeblia et al., 2005a).
The results of the current study show that the treatments applied to the crop had no consistent effect on the endogenous ABA concentration of onion bulbs. This could have been due to any of a number of reasons. It could be that the exogenous ABA or analogue did not successfully penetrate the leaf cuticle in the case of the pre-harvest treatment, or the outer skins in the case of the postharvest treatment. In field tests, the efficacy of ABA application can be diminished by rain (Zaharia et al., 2005). Four days after the pre-harvest treatment, 10.1 mm of rain fell, and 18.3 mm six days after. This may have had a detrimental effect on leaf penetration. Sprouting in dormant bulbs of Allium wakegi was delayed by 35 days by soaking in an aqueous solution of 100 μM ABA two weeks after harvest, however, endogenous ABA concentration was not measured (Yamazaki et al., 1999b). The concentration of endogenous ABA in bulbs of Allium wakegi was increased by soaking in 500 μM ABA (Yamazaki et al., 1999a), but the bulbs were not dried following treatment as bulbs in experiment 2 were. It may have been that the ABA did penetrate the outer leaves, but was depleted during the drying process.
The foliar spray of exogenous ABA may have entered the leaves but was not translocated to the bulb and therefore the concentration of ABA was not greater in the ABA-treated bulbs than the control bulbs. This may be because it was metabolised quickly in the leaf. Finally, the ABA may have entered the bulb, but was metabolised very quickly following entry to the bulb.
Alternative strategies to increase endogenous ABA concentration in onion bulbs using ABA or ABA analogues may be via injection into the bulb tissue (Abdel-Rahman and Isenberg, 1974) or as a root drench under
© 2006 Horticultural Development Council
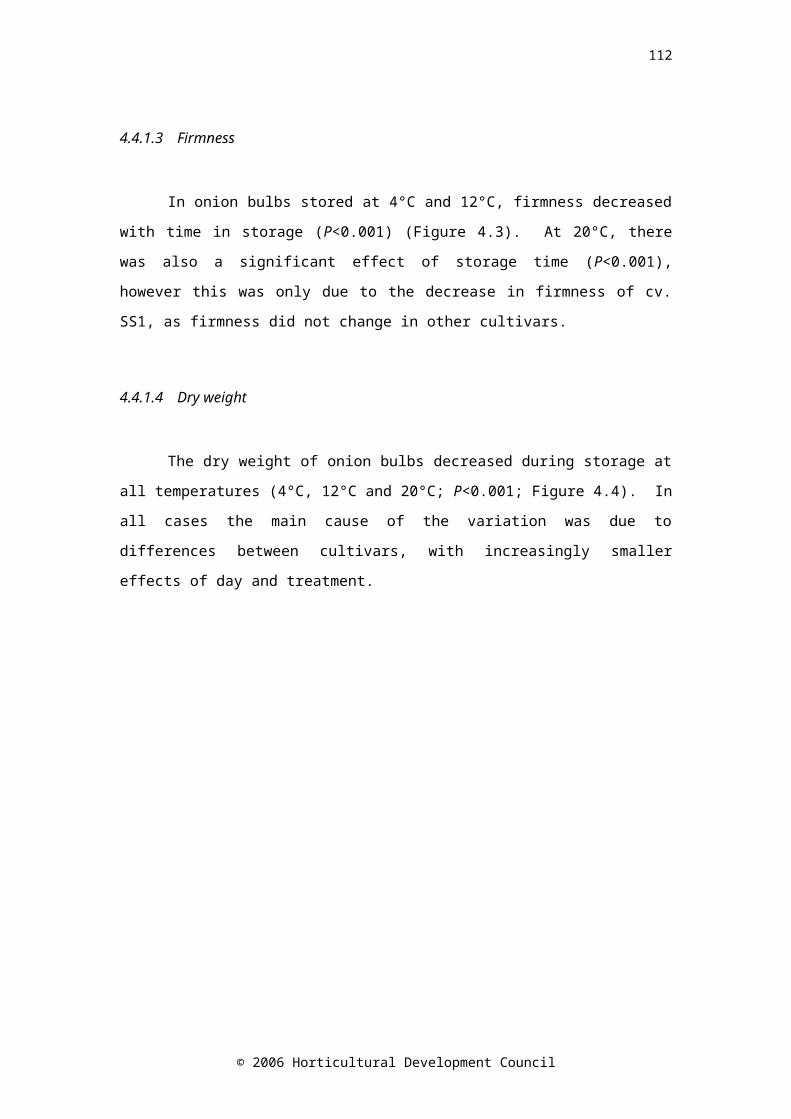
116
controlled conditions such as a greenhouse. However, these methods are not suitable for commercial practice.
4.6 Conclusion
It may be of little benefit to attempt to increase endogenous ABA concentration by the application of exogenous ABA, either pre- or postharvest, unless a more efficient method can be found. The physiology of onion plants means that they present barriers to the influx of exogenous chemicals which must be overcome. This said, the results of this study provide further evidence that ABA plays an important role in onion storage life. A decrease in ABA concentration was correlated with an increase in sprout length; however, no clear relationship between ABA concentration and carbohydrate metabolism was elucidated. This suggests that ABA may play a role in the suppression of cell elongation rather than cell division, and so is not directly related to remobilisation of non-structural carbohydrates (simple sugars and fructans), or as is perhaps more likely, minimal ABA concentration is a trigger in a cascade that results in an increase in the rate of sprout growth.
Efforts to manipulate ABA concentration in onions should be continued, but it may be more profitable to concentrate efforts to maximise endogenous ABA prior to storage using cultural methods such as adapting the curing and drying practice.
© 2006 Horticultural Development Council
117
5.0 CHAPTER FIVE
The effect of 1-methylcyclopropene (1-MCP) on the physical and biochemical characteristics of onion cv. SS1 bulbs during storage
5.1 Abstract
There is a paucity of information on the role of ethylene in onion bulb dormancy, and the available literature is conflicting. Onion cv. SS1 bulbs were treated with 1 µl l-1 1-methylcyclopropene (1-MCP) for 24 hr at 20°C and then stored at 4, 12 or 20°C. Sprout growth was reduced in onions treated with 1-MCP and stored at 4 or 12°C, but not when stored at 20°C. Greater concentrations of sucrose, glucose and fructose were measured in 1-MCP-treated bulbs stored at 12°C as compared with untreated bulbs. Dry weight was also maintained in onions treated with 1-MCP. ABA concentration before storage has previously been shown to be correlated with storage life, but there were no differences in the ABA concentration between 1-MCP-treated and untreated bulbs. It appeared that 1-MCP reduced the rate of carbon utilisation. The mechanism by which this occurred is unknown.
5.2 Introduction
The storage life of onion bulbs is limited by the rate of elongation of the sprout inside the bulb. Maleic hydrazide, a synthetic sprout suppressant, is used to extend storage life. However, pressure from retailers and consumers to reduce or eliminate chemical residues in food is increasing, and therefore other methods to prolong storage life of bulbs are necessary, particularly for low-pungency cultivars such as SS1 that command a premium price, but have an inherently short storage life. A better understanding of the mechanisms involved in onion bulb dormancy would assist in the identification of potential targets for manipulation of storage life.
© 2006 Horticultural Development Council

118
During over-winter storage of onion bulbs a gradual change in the relative composition of plant growth regulators occurs as the concentrations of growth inhibitors drop and those of growth promoters rise. The concentrations of inhibitors in bulbs with internal signs of sprouting are low when compared with the levels in non-sprouting or fully sprouted bulbs (Thomas, 1969). The variation in the concentration of gibberellins, cytokinins, auxins (Thomas, 1969; Thomas and Isenberg, 1972) and abscisic acid (Chapters 3 and 4), have been measured in stored onion bulbs. The peaks in growth substances are thought to be responsible for floral initiation under cold conditions (first gibberellin peak), cell multiplication (cytokinins) and the initiation of sprout growth (auxins). Onion bulb ABA concentration decreased during postharvest storage and onset of sprouting occurred at minimal ABA concentration (Chapters 3 and 4).
Ethylene is a plant growth regulator that is clearly fundamental to the postharvest physiology of many fresh produce types; however the literature on the role of ethylene in onion bulb dormancy and storage life is far from comprehensive. There are conflicting reports on how ethylene affects onion storage life. The observation that onion cv. Elba Globe bulbs produced ethylene at much greater amounts (actual amounts not specified) at the end of dormancy than at the beginning (Abdel-Rahman and Isenberg, 1974) suggests that ethylene may have a role in sprouting. In contrast, Benkeblia and Selselet-Attou (1999b) found little variation in ethylene production (range of 4.4 – 4.6 nmol kg-1 hr-1) of onion cv. Rouge Amposta bulbs during six months storage at 18°C and 70% RH. The dichotomy between these findings implies that production of ethylene by onion bulbs is likely to be cultivar dependent and that further investigation is required.
Ethylene perception can be blocked using 1-methylcyclopropene (1-MCP), which binds to ethylene binding proteins, thereby preventing ethylene from exerting its effects (Blankenship and Dole, 2003). 1-MCP is approved for food use in several countries, and has been tested on a range of climacteric and non-climacteric fresh produce and cut flowers (Watkins and Miller, 2005; Watkins, 2006).
© 2006 Horticultural Development Council
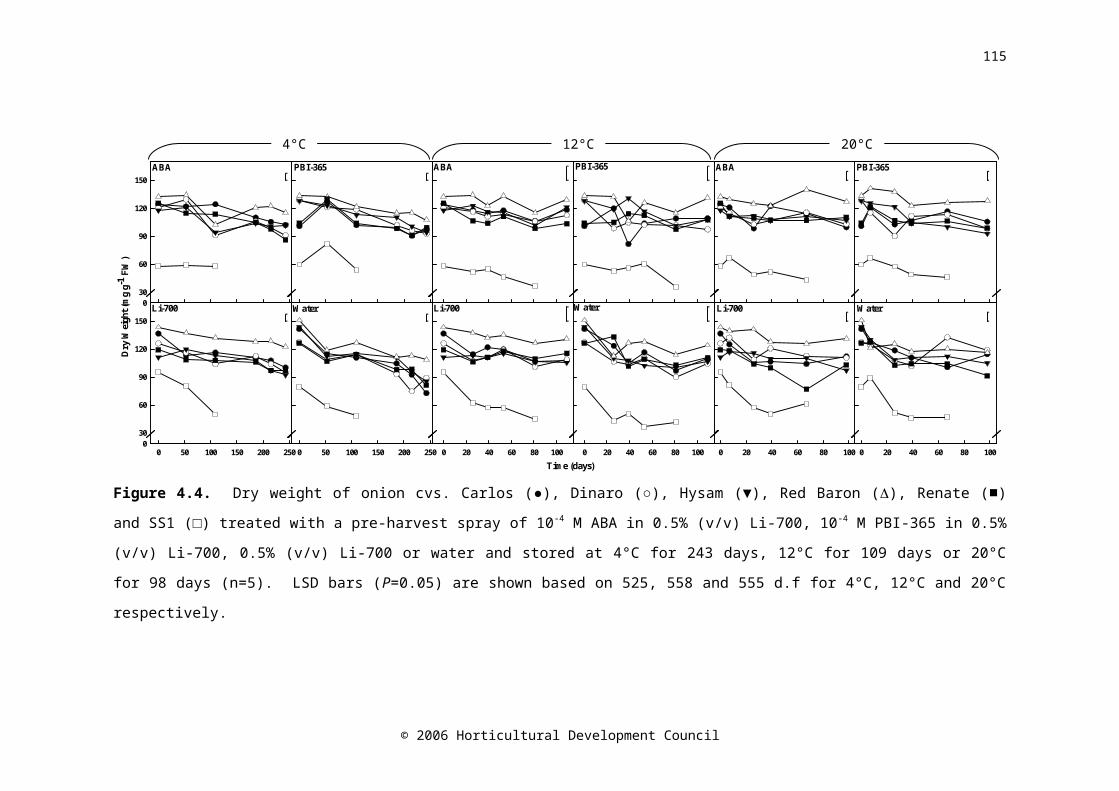
119
The aim of this study was to investigate the effect of 1-MCP on sprouting in onions cv. SS1, in order to assess its potential as a treatment to delay sprout growth and/or as a tool to explore the role of ethylene in onion dormancy. The changes in onion bulb ABA concentration, as well as characteristics associated with quality (pyruvate, total soluble solids (TSS) and firmness) and the changes in non-structural carbohydrates (NSC) were measured.
5.3 Materials and methods
5.3.1Plant material and storage regime
Onions cv. SS1 were grown from seeds drilled at a rate of 18 seeds m -1
in March 2004 at Warwick HRI (Warks., UK). Pesticides were applied according to commercial practice. Maleic hydrazide was not applied. Plants were harvested at 80-90% tops down in early September. Onions were placed into 25 kg nets and loaded into bin driers. Hot air (ca. 30°C) was blown through the onions for nine days, followed by ambient air for a further two weeks (as per commercial practice). The dry aerial parts and roots were removed, and any diseased or damaged bulbs discarded prior to storage.
5.3.2Application of 1-MCP
Onions bulbs were placed in cardboard trays inside rigid polypropylene fumigation chambers (88 x 59 x 59 cm). A 1-MCP evolving solution was prepared by adding 1.80 g SmartFresh (Rohm and Haas, Philadelphia, USA) to a 50 ml conical flask, and sealing with a SubaSeal (Fisher, Leics., UK), then 20 ml distilled water at 50ºC was injected into the flask through the seal (Dauny et al., 2003). The flask was immediately opened and placed in the chamber with the onion bulbs. The chamber was closed with a moat of water
© 2006 Horticultural Development Council
120
providing an air tight seal. This process achieved initial concentrations of 0.962 µl l-1 1-MCP within the chamber. The chamber was kept sealed for 24 hr at 20ºC.
5.3.31-MCP quantification
The concentration of 1-MCP was quantified by flame ionisation gas chromatography (GC model 8340, EL980 FID and DP800 integrator, Carlo Erba Instruments, Herts., UK). Oven and detector temperatures were set at 100ºC and 250ºC, respectively. The 2 m x 4 mm stainless steel column was packed with Chromosorb PAW mesh range 80-100, liquid phase OV1701 30% loading (Jones Chromatography, Mid Glamorgan, UK). The carrier gas was helium (British Oxygen Company (BOC) Gases, Surrey, UK) at a flow rate of 38 ml min-1. Calibration of 1-MCP was carried out against 10.7 μl l-1 isobutane (BOC) (Sisler and Serek, 1997). The concentration of 1-MCP was 0.962 μl l-1 after 2 hr.
5.3.4Storage conditions and sampling regime
Following exposure to 1-MCP, the bulbs were removed from the boxes and stored at three temperatures; 4, 12 or 20ºC. Bulbs were removed for sampling before 1-MCP treatment (baseline (day 0), n=5). Samples were taken after 53 and 109 days from the 4ºC storage treatment, after 26, 39 and 53 days from the 12ºC storage treatment and after 7, 26 and 39 days from the 20ºC storage treatment. For all samples after the baseline, n=5 for untreated bulbs and n=10 for 1-MCP-treated bulbs.
© 2006 Horticultural Development Council
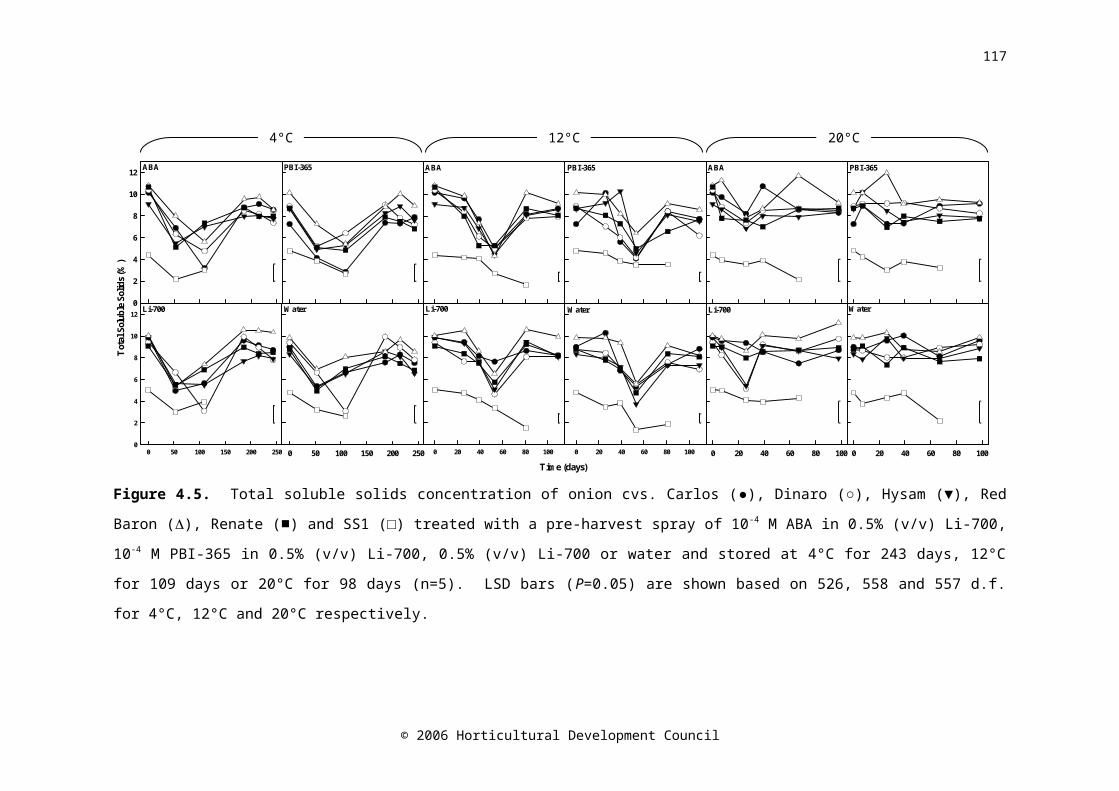
121
5.3.5Sample preparation
Juice was expressed from a ca. 5 mm equatorial slice using a hand-operated press (Randle and Bussard, 1993) then frozen at -20°C for pyruvate and TSS measurements. A longitudinal section cut from each bulb was snap-frozen in liquid nitrogen and kept at -40°C until the sample was lyophilised (Edwards Super Modulo, Sussex, UK) in preparation for fructan, NSC and ABA assays.
5.3.6Physical assessments
The following physical assessments were made according to the methods reported in Chapter 3: sprout growth, firmness and dry weight. Briefly, sprout growth was recorded and expressed as the height of the first appearing green leaves inside the bulb as a percentage of bulb height; bulb firmness (N mm-1) was measured using an Instron Series IX materials testing machine (Instron, Bucks., UK) according to the method of Lancaster et al. (2001) with slight modifications, and dry weight was measured on lyophilised samples.
5.3.7Biochemical assessments
The following biochemical assessments were made: ABA concentration, pyruvate concentration, concentration of NSCs and TSS. Abscisic acid concentration, pyruvate concentration and TSS (%) were measured according to the methods reported in Chapter 3. Briefly, ABA concentration was measured by radioimmunoassay, pyruvate by absorbance assay, fructan by enzyme assay and TSS by the use of a handheld refractometer (Palette 100, Atago Co. Ltd., Tokyo, Japan). Fructose, glucose and sucrose were measured using HPLC as described in Chapter 4.
© 2006 Horticultural Development Council
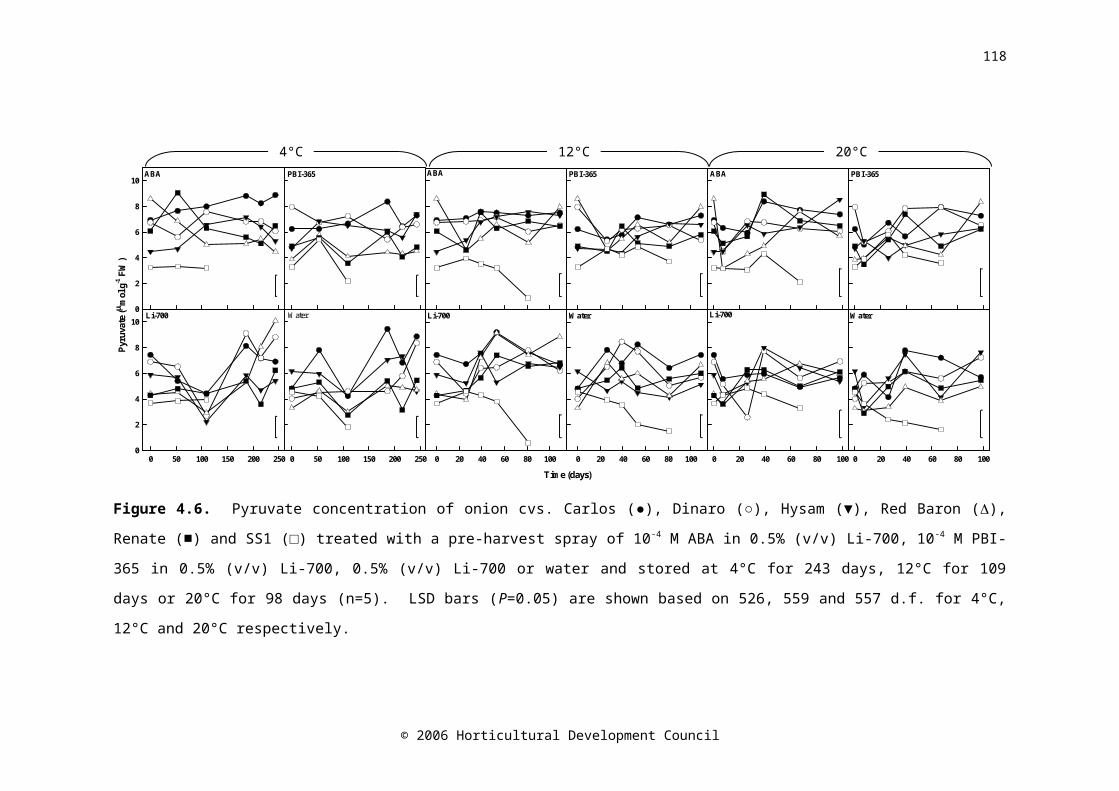
122
5.3.8Statistical analyses
All statistical analyses were carried out using Genstat for Windows Version 7.1.0.198 (VSN International Ltd., Herts., UK). Analysis of variance (ANOVA) was performed on the data specifying a nested treatment structure of a common baseline (observation before 1-MCP treatment at day 0 was the starting point for both treated and control bulbs), plus a factorial combination of storage time and chemical treatment for each temperature separately. Least significant difference values (LSD; P=0.05) were calculated from each analysis, for comparison of appropriate treatment means, using critical values of t for two-tailed tests.
5.4 Results
5.4.1 Effect of 1-MCP on physical properties of onion bulbs
Treatment with 1-MCP had an effect on the physical properties of onion cv. SS1 bulbs, with the effect varying according to storage temperature.
5.4.1.1 Sprout growth
Sprout length increased with time in both untreated and 1-MCP-treated bulbs stored at 4ºC (P=0.07), 12ºC (P<0.001) and 20ºC (P=0.023) (Figure 5.1). The overall mean sprout length expressed as a percentage of bulb height was smaller (P=0.021) in the onions treated with 1-MCP (157% of bulb height) than in the control onions (222% of bulb height) stored at 12ºC. Similarly, in onions stored at 4ºC, sprout length was also less in bulbs treated with 1-MCP (111% of bulb height) compared to the untreated bulbs (156% of bulb height), however this was not significant (P=0.121). Conversely, in
© 2006 Horticultural Development Council
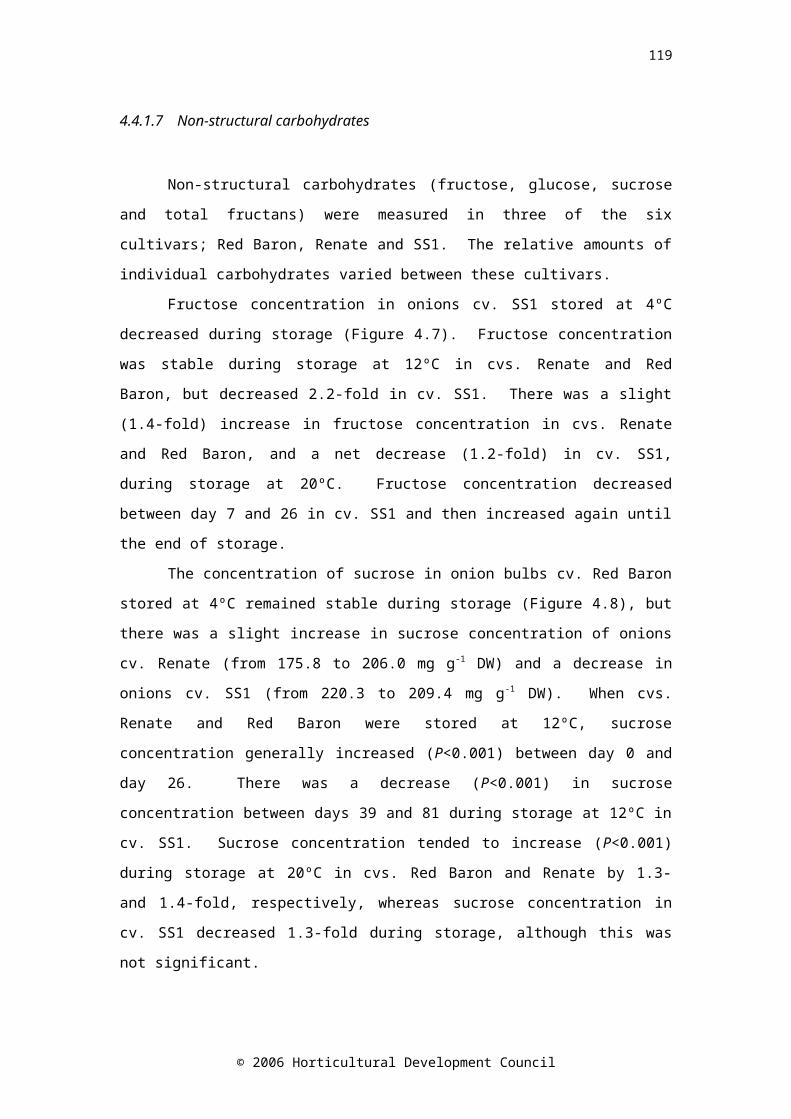
123
onions stored at 20ºC, sprout length was greater in bulbs treated with 1-MCP (237% of bulb height) compared with the untreated bulbs (177% of bulb height), however this was also not significant (P=0.246).
0 20 40 60 80 100
Spro
ut le
ngth
(% b
ulb
heig
ht)
0
50
100
150
200
250
300
Time (days)
0 10 20 30 40 50 0 10 20 30 40
Figure 5.1. Sprout length in onions treated with 1 µl l-1 1-MCP at 20ºC for 24 hours (open symbols) and untreated onions (controls, closed symbols) stored at 4ºC for 109 days, 12ºC for 53 days or 20ºC for 39 days. Controls n=5, 1-MCP n=10. LSD bars (P=0.05) A=5,5; B=10,5; C=10,10.
5.4.1.2 Firmness and dry weight
Firmness of onions decreased (4ºC P<0.001, 12ºC P=0.038, 20ºC P=0.001) under each storage temperature regime (Figure 5.2). Bulbs treated with 1-MCP and stored at 12ºC were 1.4-fold firmer (N mm-1) (P=0.051) than untreated bulbs.
© 2006 Horticultural Development Council
4°C 12°C 20°C
A B C A B C A B C
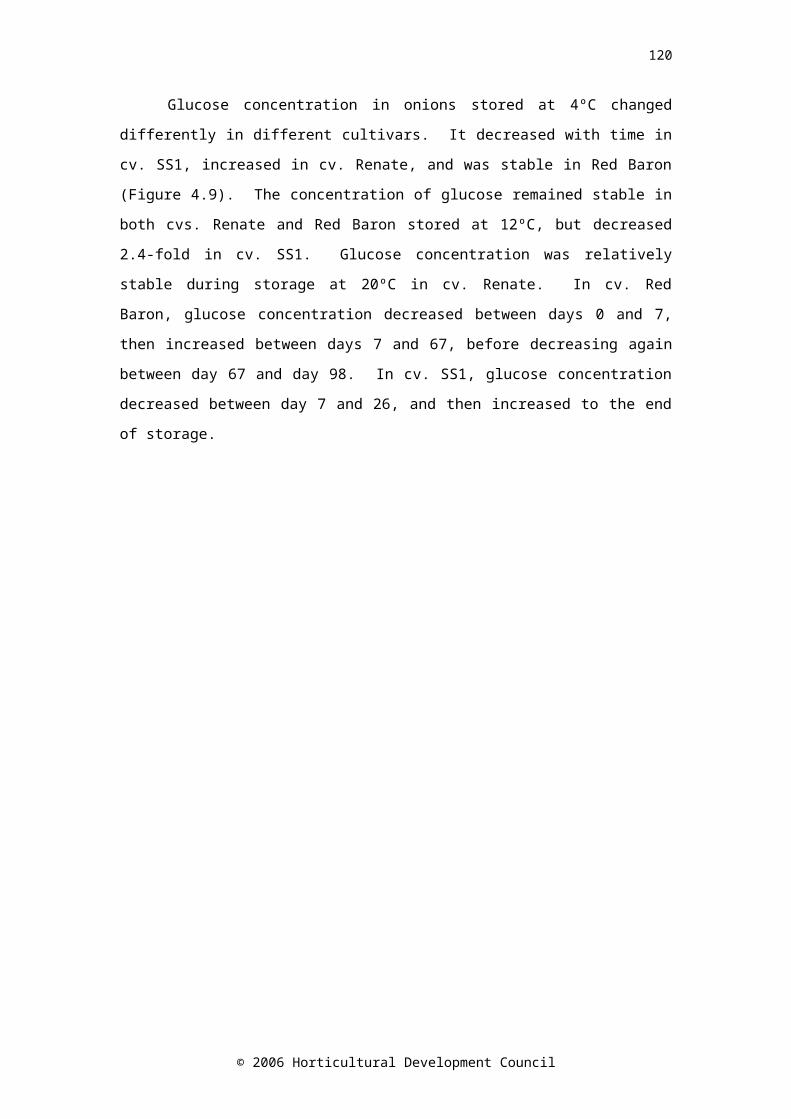
124
0 10 20 30 40
Time (days)
0 10 20 30 40 500 20 40 60 80 100
Firm
ness
(N m
m-1
)
0
5
10
15
20
25
30
0 20 40 60 80 100
Dry
Wei
ght (
mg
g-1 F
W)
0
20
40
60
80
100
Time (days)
0 10 20 30 40 50 0 10 20 30 40
Figure 5.2. Firmness and dry weight of onions treated with 1 µl l -1 1-MCP at 20ºC for 24 hours (open symbols) and untreated onions (controls, closed symbols) stored at 4ºC for 109 days, 12ºC for 53 days or 20ºC for 39 days. Controls n=5, 1-MCP n=10. LSD bars (P=0.05) A=5,5; B=10,5; C=10,10.
The dry weight of bulbs stored at 4ºC decreased during storage (P=0.042), with those bulbs treated with 1-MCP having a greater mean dry weight (71.5 mg g-1 FW) than untreated bulbs (53.5 mg g-1 FW) (P=0.094). This was due to a delayed decrease in dry weight in the 1-MCP-treated bulbs (Figure 5.2). The dry weight of bulbs stored at 12ºC decreased significantly (P<0.001) between days 0 and 26, but did not change significantly after that. However, the mean dry weight of 1-MCP-treated bulbs (65.7 mg g-1 FW) was greater (P<0.001) than that of untreated bulbs (43.3 mg g-1 FW). There was a significant (P=0.007)
© 2006 Horticultural Development Council
4°C 12°C 20°C
A B C A B C A B C
4°C 12°C 20°C
A B C A B C A B C
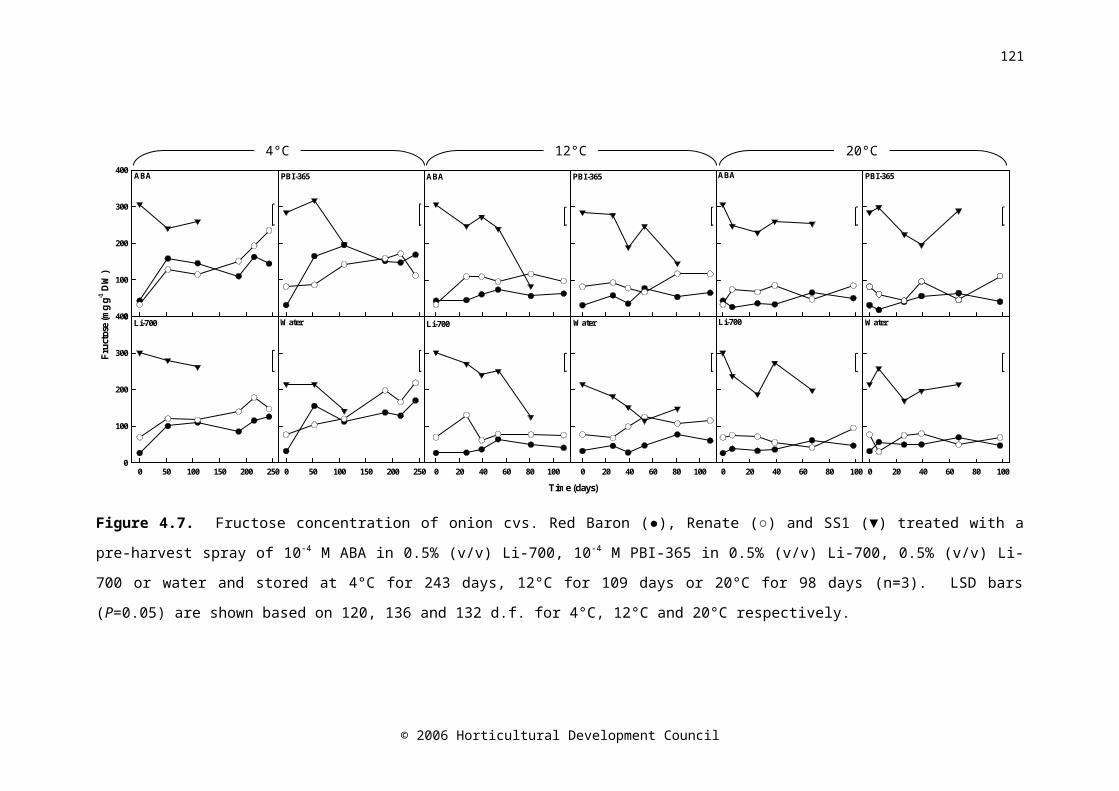
125
decrease in dry weight during storage at 20ºC, and while 1-MCP-treated bulbs maintained a stable dry weight during storage, that of untreated bulbs decreased, with the greatest decrease occurring between days 7 and 26 (P<0.001).
5.4.2 Effect of 1-MCP on biochemical properties of onion bulbs
Treatment with 1-MCP affected biochemical properties of onion cv. SS1 bulbs, with the effect, particularly on non-structural carbohydrates, varying according to storage temperature.
5.4.2.1 Total soluble solids and pungency
The TSS % decreased over time in onion bulbs stored at 4ºC (P=0.002) and 12ºC (P<0.001), and the overall mean was higher (4ºC P=0.01; 12ºC P<0.001) in 1-MCP-treated bulbs than untreated bulbs (Fiure 5.3). In bulbs stored at 4ºC this was mainly due to the observations made at day 53, and mirrors the pattern for changes in dry weight at this temperature. There were no significant main effects or interactions identified by ANOVA on the data for onions stored at 20ºC.
The pungency (as determined by pyruvate concentration) of onion bulbs stored at 4ºC decreased (P<0.001) during storage, but there was no difference between 1-MCP-treated and untreated bulbs (Figure 5.3). Similarly, pyruvate concentration decreased during storage in bulbs stored at 12C (P=0.002), however, 1-MCP-treated bulbs had a greater mean pyruvate concentration than untreated bulbs (P=0.003). Pyruvate concentration again decreased significantly (P=0.005) between day 0 and day 7 in bulbs stored at 20ºC, and mean pyruvate concentration was greater (P<0.05) in treated than untreated bulbs.
© 2006 Horticultural Development Council
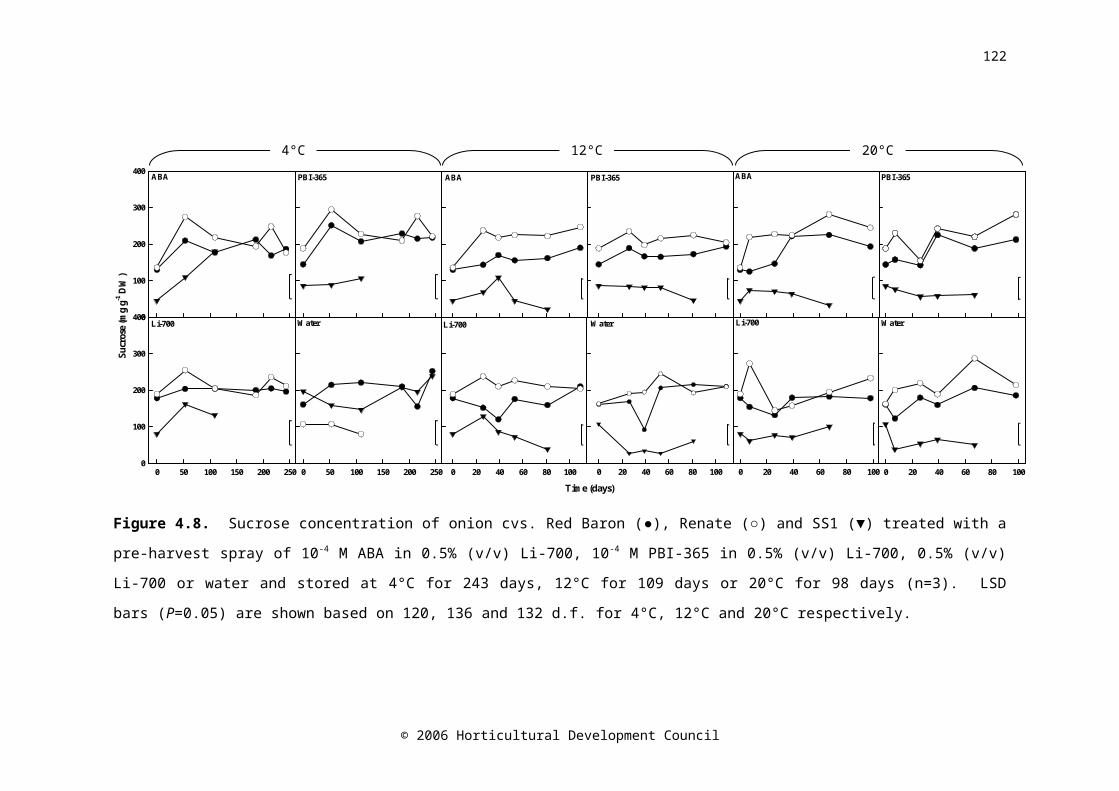
126
0 10 20 30 40
Time (days)
0 10 20 30 40 500 20 40 60 80 100
Pyru
vate
( m
ol g
-1FW
)
0
1
2
3
4
5
6
7
0 10 20 30 40
Time (days)
0 10 20 30 40 500 20 40 60 80 100
Tot
al S
olub
le S
olid
s (%
)
0
1
2
3
4
5
6
Figure 5.3. Total soluble solids (%) and pyruvate concentration of onions treated with 1 µl l-1 1-MCP at 20ºC for 24 hours (open symbols) and untreated onions (controls, closed symbols) stored at 4ºC for 109 days, 12ºC for 53 days or 20ºC for 39 days. Controls n=5, 1-MCP n=10. LSD bars (P=0.05) A=5,5; B=10,5; C=10,10.
5.4.2.2 Abscisic acid
In the onions stored at both 4ºC and 12ºC, ABA concentration changed significantly over time (P=0.034 and P<0.001, respectively). The concentration of ABA decreased from that present before the 1-MCP treatment (day 0) until the middle of the storage period, before increasing again towards the end of the storage period (Figure 5.4). The pattern of change was similar for both treated and untreated bulbs, and there was no
© 2006 Horticultural Development Council
4°C 12°C 20°C
A B C A B C A B C
4°C 12°C 20°C
A B C A B C A B C
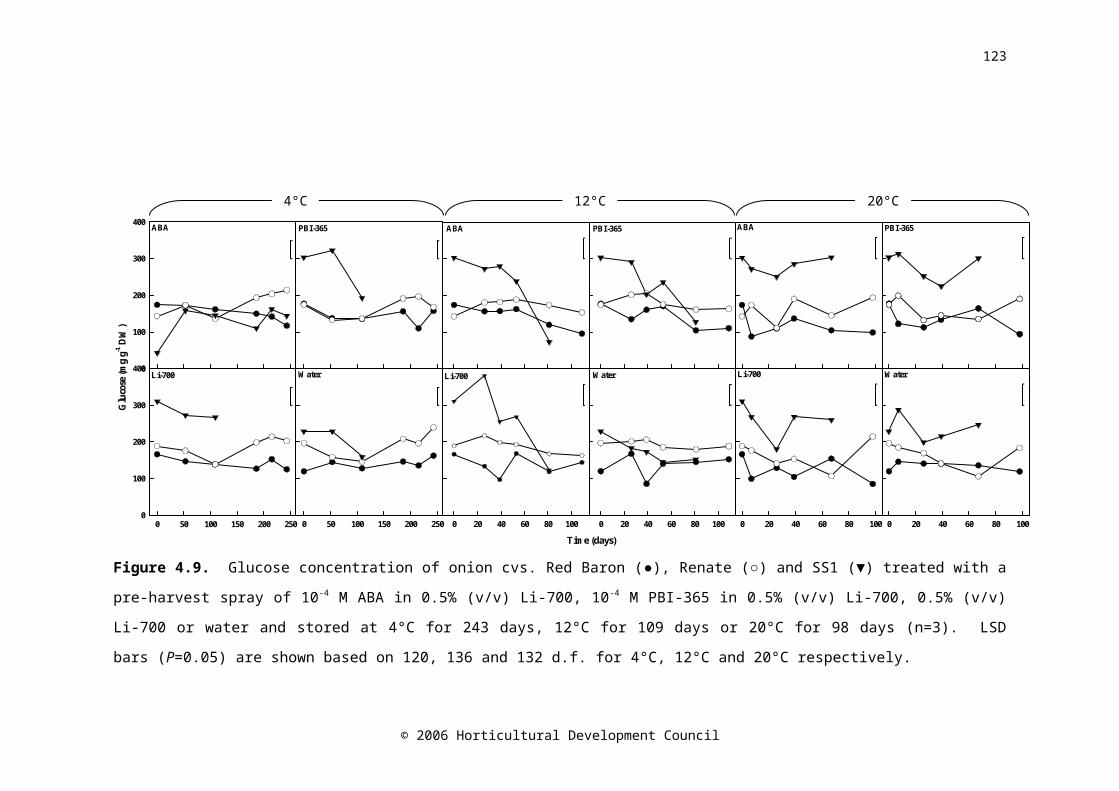
127
significant difference in the mean ABA concentrations between treated and untreated bulbs. Onion bulbs stored at 20ºC and treated with 1-MCP had a higher (P=0.008) overall mean ABA concentration (166 ng g -1 DW) than untreated bulbs (91 ng g-1 DW). After day 7, the ABA concentration in 1-MCP-treated bulbs increased, whilst in untreated controls it continued to decline.
0 10 20 30 40
Time (days)
0 10 20 30 40 500 20 40 60 80 100
AB
A (n
g g-1
DW
)
0
50
100
150
200
250
Figure 5.4. ABA concentration in onions treated with 1 µl l-1 1-MCP at 20ºC for 24 hours (open symbols) and untreated onions (controls, closed symbols) stored at 4ºC for 109 days, 12ºC for 53 days or 20ºC for 39 days. Controls n=5, 1-MCP n=10. LSD bars (P=0.05) A=5,5; B=10,5; C=10,10.
5.4.2.3 Non-structural carbohydrates
Onion bulbs cv. SS1 were characterised by similar concentrations of fructose and glucose, with a comparatively low concentration of sucrose (approximately 2-4 fold less than glucose or fructose), which is in general agreement with Terry et al. (2005) and F. Davis and L. A. Terry (Cranfield University, unpublished), using the Kahane et al. (2001) or modified O’Donoghue et al. (2004)–based extraction methods, respectively. The sucrose concentration decreased between day 0 and all other times in 1-MCP-treated onions stored at 12ºC (P<0.001) and all bulbs stored at 20ºC (P=0.011). The only effect of treatment with 1-MCP was observed in onions stored at 12ºC, where onions treated with 1-MCP had a greater (P<0.001)
© 2006 Horticultural Development Council
4°C 12°C 20°C
A B C A B C A B C

128
sucrose concentration than untreated controls (Figure 5.5). Glucose concentration decreased significantly in onions held at 4ºC (P<0.001), 12ºC (P=0.088) and 20ºC (P<0.001). Glucose concentration was greater (P<0.001) in 1-MCP-treated onions stored at 12ºC compared with untreated bulbs. Fructose concentration decreased significantly during storage at all three temperatures (4ºC P<0.001; 12ºC P=0.061; 20ºC P<0.001). There were no main effects or interactions between 1-MCP treatment and time.
0 20 40 60 80 100
Glu
cose
(mg
g-1 D
W)
0
50
100
150
200
250
300
350
Time (days)
0 10 20 30 40 50 0 10 20 30 40
0 10 20 30 40
Time (days)
0 10 20 30 40 500 20 40 60 80 100
Fruc
tose
(mg
g-1 D
W)
0
50
100
150
200
250
300
350
0 20 40 60 80 100
Sucr
ose
(mg
g-1 D
W)
0
50
100
150
200
250
300
350
Time (days)
0 10 20 30 40 50 0 10 20 30 40
© 2006 Horticultural Development Council
4°C 12°C 20°C
20°C12°C4°C
4°C 12°C 20°C
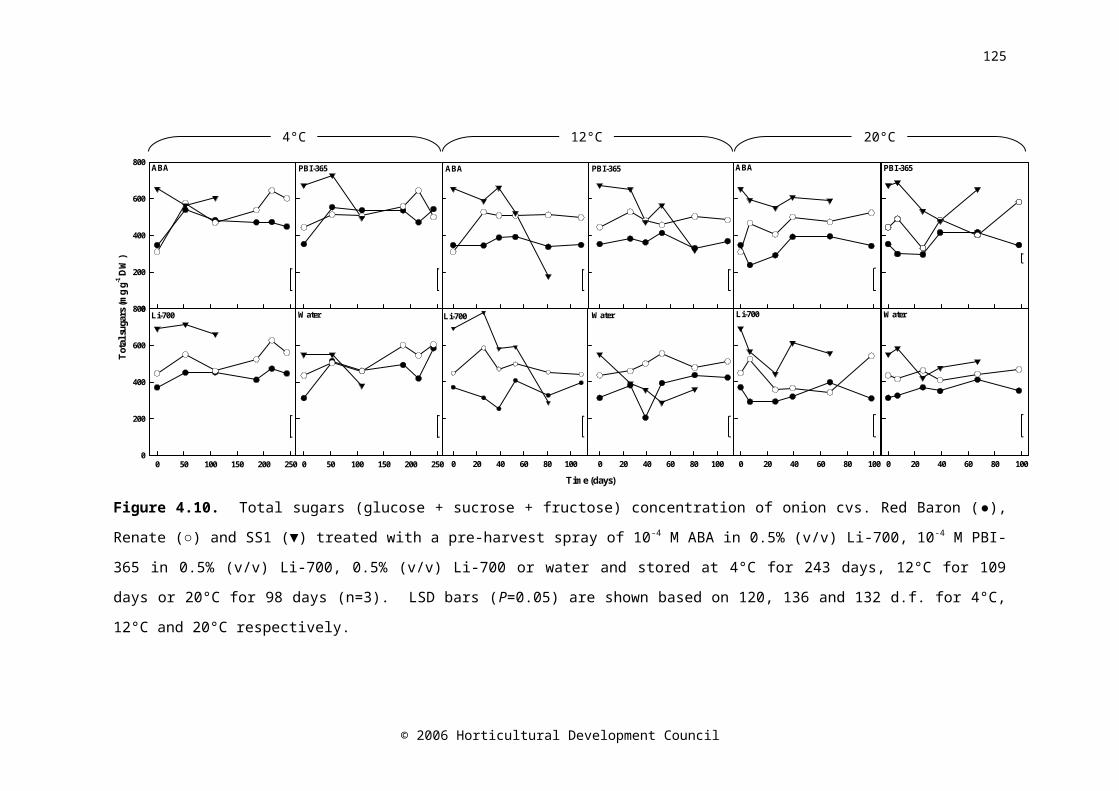
129
Figure 5.5. Sucrose, glucose and fructose concentrations in onions treated with 1 µl l-1 1-MCP at 20ºC for 24 hours (open symbols) and untreated onions (controls, closed symbols) stored at 4ºC for 109 days, 12ºC for 53 days or 20ºC for 39 days. Controls n=5, 1-MCP n=10. LSD bars (P=0.05) A=5,5; B=10,5; C=10,10.
The ratio of monosaccharides (viz. fructose and glucose) to disaccharide (sucrose) was calculated to demonstrate how the composition of the soluble sugars varied with time (Figure 5.6). In onions stored at 4 and 20ºC the ratio was not affected by either treatment with 1-MCP or storage time, however in onions held at 12ºC there was a significant change (P=0.003) in the sugar composition over time, with an increase in the proportion of fructose and glucose compared to sucrose occurring between days 39 and 53 from 10.1 to 20.0 mg g-1 DW in untreated bulbs and from 8.0 to 31.3 mg g-1 DW in 1-MCP-treated bulbs.
The total concentration of simple sugars was calculated by adding together the concentrations of fructose, glucose and sucrose (Figure 5.6). The total sugar concentration decreased over time for onions held at each temperature (4ºC P<0.001; 12ºC P=0.012; 20ºC P<0.001), and the overall mean concentration of total sugars was approximately 2-fold greater (P<0.001) in 1-MCP-treated onions held at 12ºC than the untreated onions.
As reported previously (Chapters 3 and 4) onions cv. SS1 have a far lower fructan concentration than cultivars characterised by higher dry matter and greater pyruvate concentration. The mean fructan concentration in onions stored at 4ºC increased between day 0 and all other times (P=0.068), but there were no other significant changes in the fructan concentration during storage or due to 1-MCP treatment, however, in general, fructan concentration increased during storage at all temperatures (Figure 5.6).
© 2006 Horticultural Development Council
A B C A B C A B CA B C A B C A B C
A B C A B C A B C
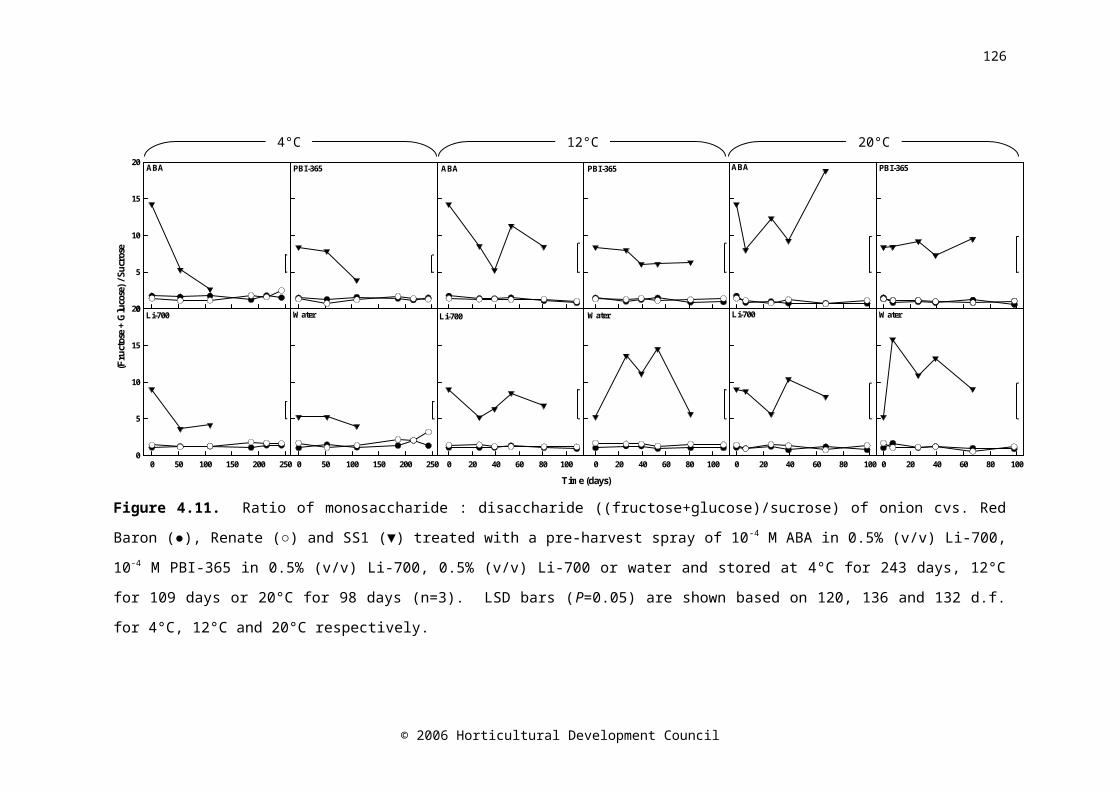
130
0 10 20 30 40
Time (days)
0 10 20 30 40 500 20 40 60 80 100
(Fru
ctos
e +
Glu
cose
) / S
ucro
se
0
10
20
30
40
0 10 20 30 40
Time (days)
0 10 20 30 40 500 20 40 60 80 100
Tot
al fr
ucta
n (m
g g-1
DW
)
0
10
20
30
40
50
60
70
0 10 20 30 40
Time (days)
0 10 20 30 40 500 20 40 60 80 100
Tot
al s
ugar
s (m
g g-1
DW
)
0
100
200
300
400
500
600
700
800
Figure 5.6. Ratio of monosaccharide : disaccharide (fructose+glucose/sucrose), total sugar (sucrose+glucose+fructose) and total fructan concentration in onions treated with 1 µl l-1 1-MCP at 20ºC for 24 hours (open symbols) and untreated onions (controls, closed symbols) stored at 4ºC for 109 days, 12ºC for 53 days or 20ºC for 39 days. Controls n=5, 1-MCP n=10. LSD bars (P=0.05) A=5,5; B=10,5; C=10,10.
© 2006 Horticultural Development Council
4°C 12°C 20°C
A B C A B C A B C
4°C 12°C 20°C
A B C A B C A B C
4°C 12°C 20°C
A B C
A B C A B C
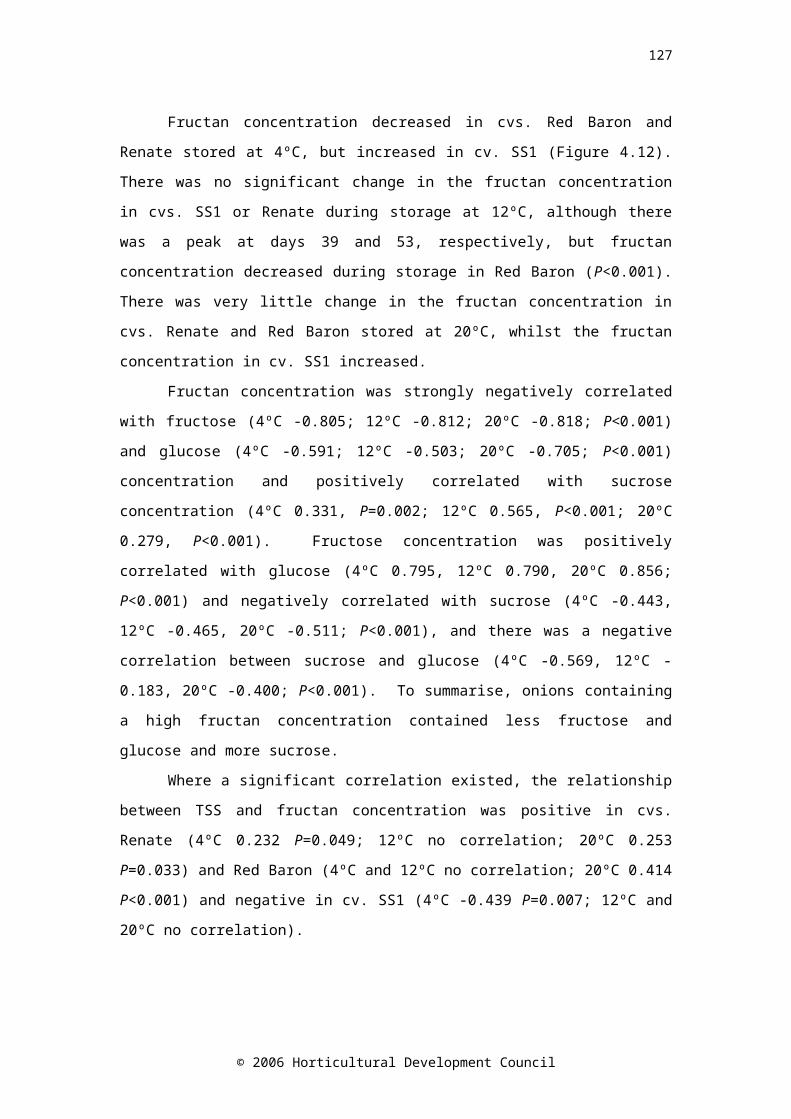
131
5.5 Discussion
Treating onion cv. SS1 bulbs with a single exposure of 1-MCP gas at 20ºC delayed sprout growth in onions stored at 4 and 12ºC, but not at 20ºC. This may be because the 1-MCP treatment was not sufficient to counteract the sprout promoting effect of the 20ºC storage conditions. In contrast with the results reported here, 1-MCP (1 µl l-1) had no effect on sprouting (L.A. Terry, Cranfield University, unpublished data) in a high dry matter, high pungency cultivar. The influx of 1-MCP into a tissue is dependent on the chemical composition of that tissue, for example lipid-rich avocados adsorb 1-MCP more readily and retain it for longer periods of time than apples (Dauny et al., 2003). The presence of a physical barrier is also likely to have an effect. The outer skin of low dry matter onions including cv. SS1 is typically thin and consists of only one or two layers, whereas high dry matter cultivars have many layers of thick, tough outer skins that form an effective barrier to water loss. It is possible that while the thin skins of cv. SS1 onions provided little challenge to the influx of 1-MCP gas, the thicker skin of high dry matter cultivars represented a significant obstacle. The delayed sprout growth observed in this study suggests that 1-MCP is able to penetrate the outer skin and inner layers of the onion to act on the meristematic growing point inside the bulb where the sprout is initiated. Both physiological age of the commodity and the temperature at which it is applied can alter the efficacy of 1-MCP treatment (Blankenship and Dole, 2003). The onions used in this study were of a short storing cultivar, therefore, it is likely that they were at a different physiological age or maturity stage than the high dry matter onions used previously (L. A. Terry, Cranfield University, unpublished data).
It has previously been shown that sprouting in onion bulbs occurs when endogenous ABA reaches a minimum concentration (Chapters 3 and 4). There was no difference in the ABA concentration between 1-MCP-treated and untreated bulbs stored at 4 or 12°C, yet sprout growth was delayed. The
© 2006 Horticultural Development Council
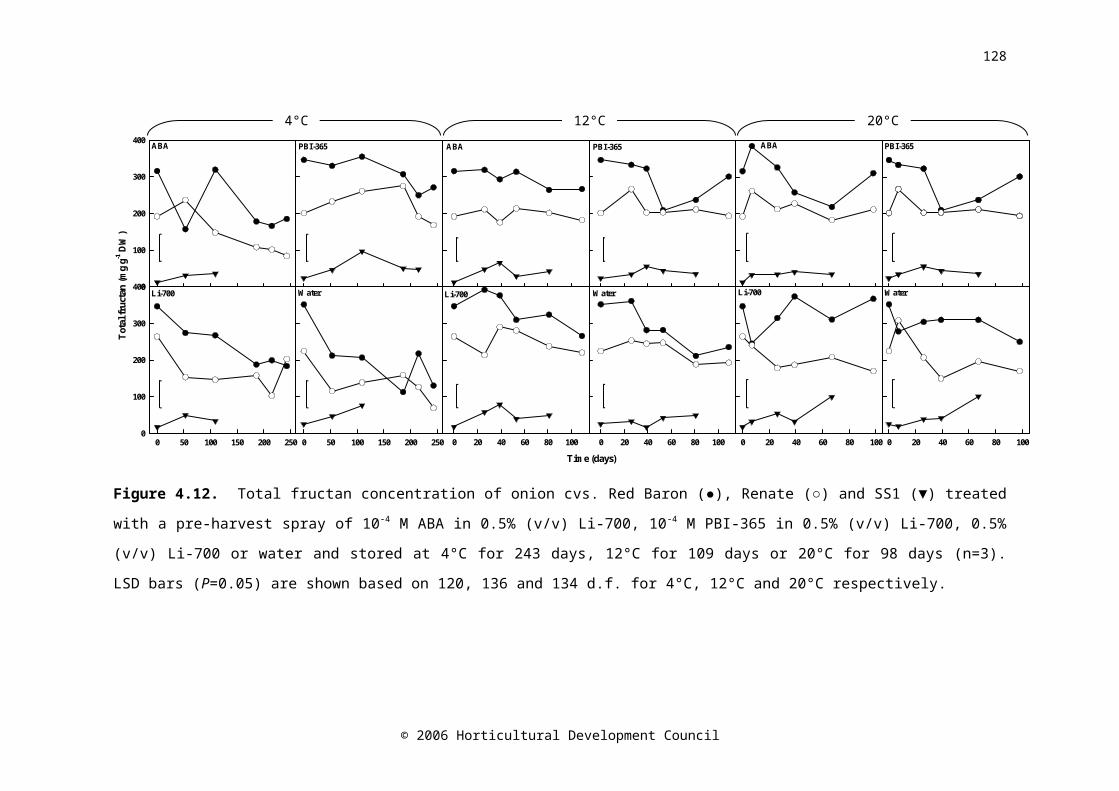
132
general trend was for a decrease in ABA concentration between the beginning of storage and the second sampling time, followed by a subsequent increase. Minimum ABA concentration was related to the onset of sprouting (Figure 5.4), and the subsequent increase is believed to be due to synthesis of ABA by the growing sprout (Chapter 4). However, the lack of difference in ABA concentration between treated and untreated bulbs leads to the conclusion that the mechanism by which 1-MCP delays sprouting is not mediated by ABA. Similarly, an experiment on potatoes demonstrated that ABA concentration temporarily decreased 4-fold after a single 24 hr exposure to 1.74 µmol l-1 ethylene. After a few hours the ABA concentration returned to a value similar to that measured before ethylene treatment (Coleman, 1998). Therefore, in the present study it is possible that 1-MCP treatment induced a transient decrease in ABA concentration, which was not detected due to the sampling schedule.
The non-structural carbohydrate profile of the onions in this study was typical of low-pungency cultivars, being characterised by low fructan concentration, (20-70 mg g-1 DW), and high concentrations of monosaccharides compared to disaccharides (Terry et al., 2005). Benkeblia et al. (2005a) have suggested that an increase in sucrose concentration acts as a trigger for release from dormancy and the onset of sprouting. However, there was no evidence from the study reported here to support this hypothesis (Figure 5.5) as sucrose concentration remained stable throughout storage. There was little difference in the overall mean sugar compositions between onions stored at different temperatures. This is consistent with Benkeblia et al. (2004) who stated that the metabolism of sucrose into glucose and fructose catalysed by the enzyme invertase is largely independent of temperature. The ratio of monosaccharides to disaccharide tended to increase, particularly towards the end of storage (Figure 5.6), explained by the observed decrease in glucose and fructose (Figure 5.5). The decrease in sugar concentration coincided with an increase in sprout length, suggesting that sugars were metabolised to provide energy for the growing sprout.
© 2006 Horticultural Development Council
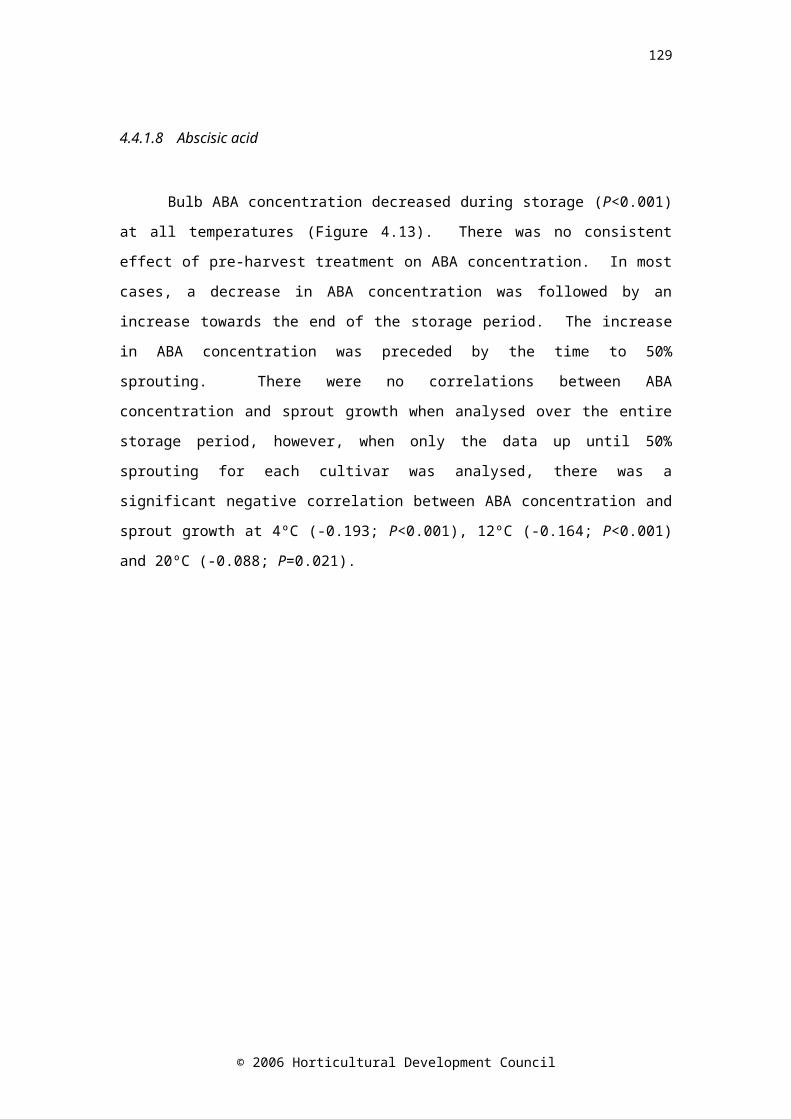
133
The concentrations of glucose, sucrose and sucrose were greater in onions treated with 1-MCP and stored at 12°C. The sugar concentrations decreased between day 0 and day 26 in untreated bulbs to an amount approximately 2-fold less than that in 1-MCP-treated bulbs (Figure 5.5). Higher levels of fructose and glucose have been positively correlated with greater taste preference in onion (e.g. sweetness and likeability) and thus, the use of 1-MCP may have implications on final bulb nutritional value and consumer acceptability (F. Davis and L. A. Terry, Cranfield University, unpublished).
Fry colour is an important quality characteristic for potatoes, with a light colour being desirable. Fry colour darkening is caused by the metabolism of starch into reducing sugars, and this process was increased under conditions of continuous ethylene exposure in store which increased the respiration rate (Daniels-Lake et al., 2005). Prange et al. (2005) discovered that the application of 0.9 µl l-1 1-MCP for 24h at 9°C to potatoes before exposure to continuous ethylene at 4 µl l -1 reduced fry colour darkening, but did not interfere with ethylene induced sprout control. These results could lead to the following conclusions. Either, as the authors hypothesise, the effect of 1-MCP is dependent on the target tissue, and the tuber eye tissue of potatoes where the sprout is initiated, is more metabolically active than the cortex, where sugars are metabolised. Therefore, turnover of ethylene binding sites could potentially be more rapid and thus, 1-MCP exerts less effect on the tuber eye tissue. Alternatively 1-MCP might act on pathways other than those concerned with ethylene perception, thus not affecting ethylene-induced inhibition of sprout elongation, but reducing metabolism of sugars, as observed in the current study in onions stored at 12°C. This second theory is further corroborated by Pruski et al. (2006), who applied 4 µl l-1 1-MCP to seed potatoes for 48 hr followed by continuous exposure to 4 µl l-1 ethylene. There was no difference in ethylene-induced sprout control between tubers treated with 1-MCP followed by ethylene or tubers only treated with ethylene. However, following subsequent planting, the average weight of tubers per plant was
© 2006 Horticultural Development Council
134
reduced in 1-MCP-treated potatoes. If it is indeed the case that 1-MCP has an effect mediated by mechanisms other than those pertaining to the inhibition of ethylene perception, this must be taken into consideration when using 1-MCP as a tool to explore ethylene function.
Many authors have reported a decrease in fructan concentration during storage of onions (Rutherford and Whittle, 1982; Suzuki and Cutliffe, 1989; Ernst et al., 1998; Hansen, 1999), although Pak et al. (1995) observed an increase in fructan concentration in the bulb base, and Benkeblia et al. (2002) reported a 2-fold increase in total fructan concentration in onions cv. Rouge Amposta, stored at 10 and 20°C for 24 weeks by which time 50 and 75% respectively of the bulbs had sprouted, but a 0.7-fold decrease in onions stored at 4°C where only 5% of bulbs had sprouted. In the study reported here, fructan concentration tended to increase during storage, with a 2-fold increase between the beginning and end of storage at 4°C (109 days), and an increase of approximately 0.75-fold at 12°C and 20°C (53 and 39 days respectively). In the current study, sprout growth had occurred between day 0 and the second sampling date and so the results recorded could reflect the synthesis of fructans by the sprout, as fructan concentration has been shown to increase in the sprout of onions cv. Hysam (Pak et al., 1995). Low dry weight cultivars such as cv. SS1 tend to have low concentrations of fructans, but few studies have detailed the changes in fructan concentration during storage in these onions. It is possible that the synthesis of fructans in the bulb base during storage is greater than the metabolism in the inner and outer scales, resulting in a net increase. It is important to remember that although there are changes occurring in fructan concentration during storage, the concentration of these large carbohydrates are minimal compared with that of the simple sugars, glucose, fructose and sucrose.
Stored onions must be free from green sprouts. Any treatment that reduces sprout growth and extends storage life, but has a detrimental effect on bulb quality is of questionable utility. However, in the onions stored at 12ºC, where sprout growth was reduced, there was no negative impact on bulb quality by 1-MCP.
© 2006 Horticultural Development Council
135
Firmness decreased with time during storage at all temperatures and 1-MCP-treated onions were generally more firm than untreated bulbs. Dry weight (mg g-1 FW) was also generally greater in 1-MCP-treated than untreated bulbs. Similarly, fresh weight loss in tulip bulbs was promoted by continuous exposure to 0.3 Pa ethylene for 29 days, but this effect was prevented by a pre-treatment with 1 µl l -1 1-MCP for 16 hr at 20ºC (de Wild et al., 2002). Another important quality characteristic, particularly for mild onions, is low pungency (Abayomi et al., 2006), so it is essential the effect of any treatment on the pyruvate concentration is assessed. Pyruvate concentration decreased over time and the pyruvate concentration of 1-MCP-treated onions stored at 12 and 20ºC was only ca. 1 µmol g-1 FW greater than that of untreated bulbs. Pyruvate concentration at the end of storage did not exceed the value recorded at the beginning of storage.
Onion bulbs are non-climacteric, and have a low sensitivity to ethylene. They produce ethylene slowly and in low concentrations (<0.1 μl kg-1 FW hr-1
at 20°C) (Suslow, 1998). Reducing the concentration of ethylene that accumulates around produce in store has been used to extend the storage life of other non-climacteric fruits and vegetables such as Chinese cabbage and orange (Wills et al., 1999). It is possible that the storage life of onion may be extended similarly by inhibiting ethylene perception.
The literature on the role of ethylene in onion bulb dormancy is limited. Onion bulbs cv. Rouge Amposta subjected to a combination of a chilling treatment (9°C for three weeks) and ethephon (a substance that spontaneously degrades to form ethylene) treatment (1 ml of 100 mg l-1
ethephon solution injected into bulb centre) and stored at 18°C sprouted earlier (50% sprouting at 2 months, 100% at 4 months) than bulbs subjected to ethephon treatment without chilling and controls (no chilling or ethephon) (50% sprouting at 3 months, 100% at 6 months), and sprouting was slightly delayed in bulbs treated with silver thiosulphate solution (an inhibitor of ethylene action) without chilling (50% sprouting at 4 months, 100% at 6 months; Benkeblia and Selselet-Attou, 1999b). It is possible that the effect of chilling treatment reduced the storage life of the bulbs as this had been
© 2006 Horticultural Development Council
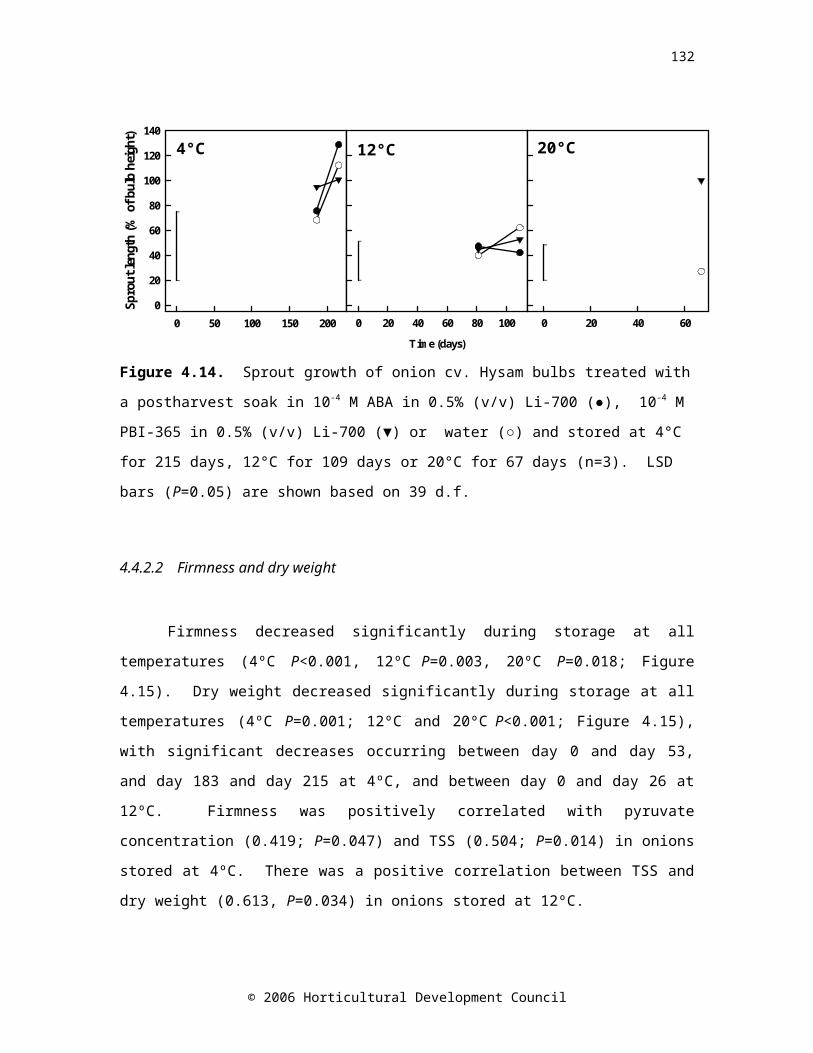
136
shown to break dormancy; however, as no bulbs were subjected to chilling alone, this cannot be proven. In another experiment, injection of bulbs with ethephon alone had no effect on sprouting, but when applied in combination with exogenous ABA it partly alleviated the inhibitory effect of ABA on sprouting (Abdel-Rahman and Isenberg, 1974). These results suggest that treatment with ethylene encourages sprouting, and therefore the removal of ethylene from the storage environment, or the blocking of its effects may reduce sprout growth, and supports the findings of the study reported here. Furthermore, sprouting was accelerated in potatoes exposed to ethylene (0.02-20 µl l-1) for 8 to 72 hours, yet continuous exposure to 2 µl l-1 ethylene inhibited sprouting. Upon removal from the continuous ethylene treatment sprouting occurred at a rate similar to that of potatoes treated with a single dose of ethylene (Rylski et al., 1974). The authors hypothesised that a single exposure to ethylene diminished the rest or dormant period, but continuous exposure to ethylene inhibited elongation of the sprout. Although there are obvious differences between onions and potatoes, parallels could perhaps be drawn in the involvement of ethylene in dormancy and inhibition of sprout elongation. Both onions and potatoes produce minimal concentrations of ethylene, but as potatoes responded to ethylene concentrations of 2 µl l -1, the involvement of the accumulation of endogenous ethylene in store cannot be ruled out. Recently, continuous application of ethylene in commercial onion stores has been shown to retard sprout growth (Johnson, 2006). The current study has shown that a single treatment with 1-MCP can reduce sprout growth in onions subsequently stored at 4 or 12°C, but not at 20°C. The inhibition of ethylene perception at the beginning of storage may have slightly prolonged the dormant period, thus delaying sprout growth. The activity of a molecule as an inhibitor depends on the length of time that it remains bound to the receptor (Sisler, 2006), therefore the lack of inhibition of sprout growth observed in onions stored at 20°C could be explained by a reduction in the time 1-MCP molecules spent bound to the ethylene binding protein at this higher temperature, or to increased production of new binding sites, and therefore a reduction in its effectiveness as an inhibitor. It is
© 2006 Horticultural Development Council
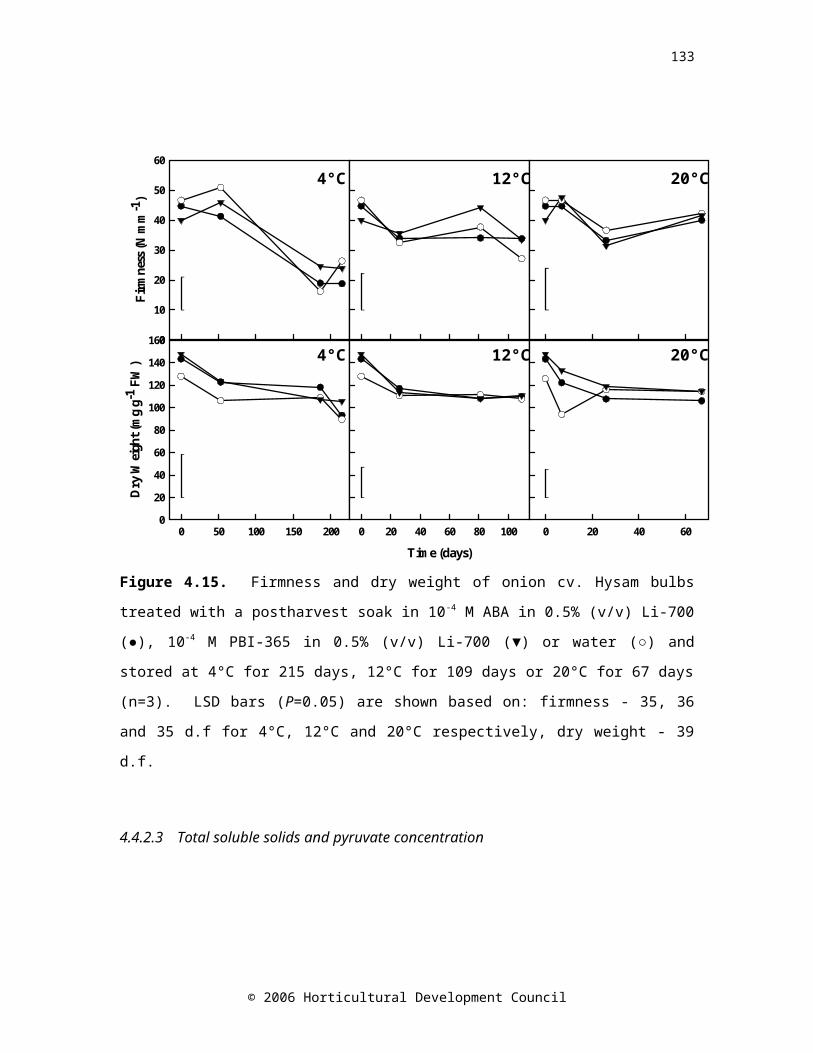
137
important to note that ethylene was not measured, nor was exogenous ethylene applied, in the study reported here. It is possible that the mode of action of 1-MCP is not directly due to its inhibition of ethylene perception. It appears that1-MCP treatment reduced the rate of carbon utilisation in onion cv. SS1 bulbs stored at 12°C by an unknown mechanism.
5.6 Conclusion
The dichotomy of the effects of ethylene and 1-MCP in onion provide a case for further investigation and suggest that the interactions of 1-MCP and ethylene on ABA metabolism, carbon utilisation and sprouting in onions is far from simple. It is likely that more than one pathway is involved, and that interactions between cultivar, physiological age and storage temperature occur.
© 2006 Horticultural Development Council
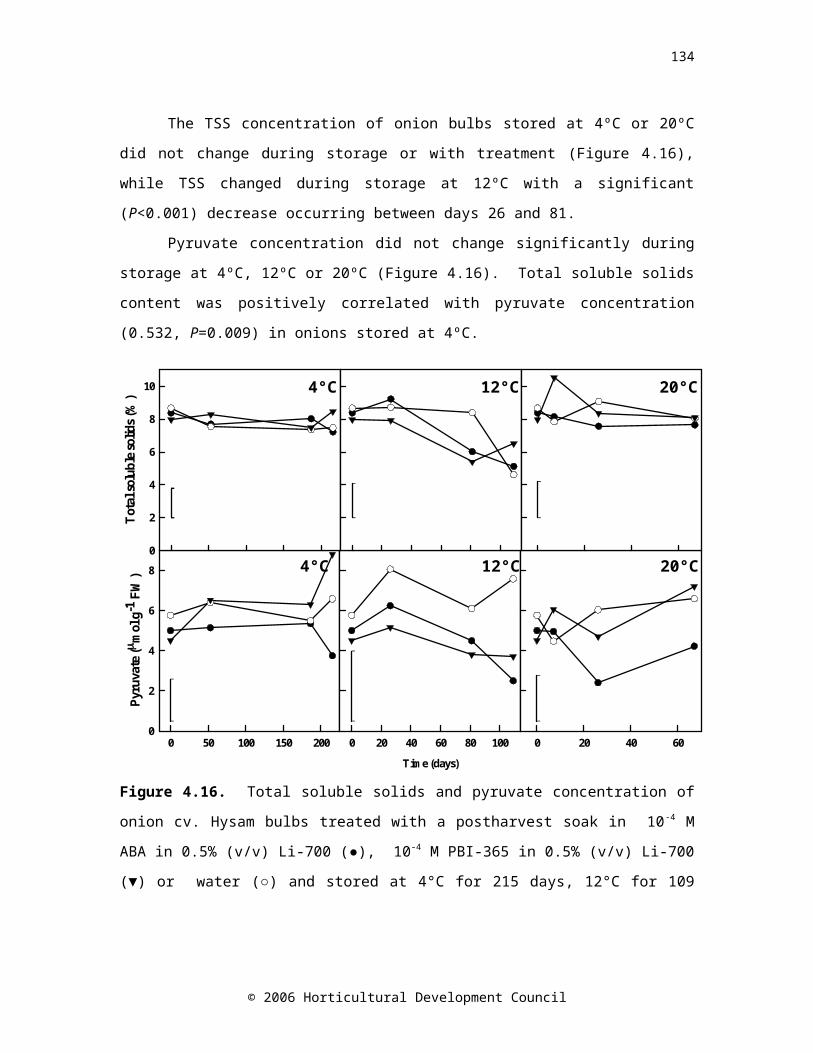
138
6.0 CHAPTER SIX
The effect of the transition between controlled atmosphere and air storage on bulbs of onion cultivars SS1, Carlos and Renate.
6.1 Abstract
Controlled atmosphere (CA) storage is used to prolong onion storage life; however detrimental effects on shelf-life have been reported. The effect of the transition between CA (5% CO2, 3% O2) and air (and vice versa) on onion cvs. Renate, Carlos and SS1 in terms of the respiration rate, sprout growth, dry weight, firmness, pungency, total soluble solids, abscisic acid concentration and non-structural carbohydrate composition was assessed. Removal of bulbs from CA storage resulted in an immediate increase in the respiration rate (measured in air), which then reverted to a lower rate following subsequent storage under air conditions for 21 days. In some cultivars, this could be sufficient to trigger the onset of sprouting and thus account for the detrimental effect of CA storage on shelf-life. Delaying the start of CA storage of onions cv. SS1 for 21 days was as effective in suppressing sprout growth as CA storage for 42 days. Further investigation into the use of CA storage in this manner in relation to the optimum time to begin CA conditions could decrease the cost of CA storage without compromising storage life. Abscisic acid concentration has been associated with storage life of onions. There was a significant decrease in the ABA concentration between the time of harvest and the beginning of storage. This is likely to be due to the effects of curing and suggests that curing is having a detrimental effect on storage potential.
6.2 Introduction
The use of controlled atmosphere (CA) in the storage environment is a ubiquitous method for extending the storage life of fresh produce. However, if misused, off-odours caused by anaerobic respiration can develop when oxygen concentration is not maintained within the tolerance limits of the commodity (Kader, 2004). Controlled atmophere storage is
© 2006 Horticultural Development Council
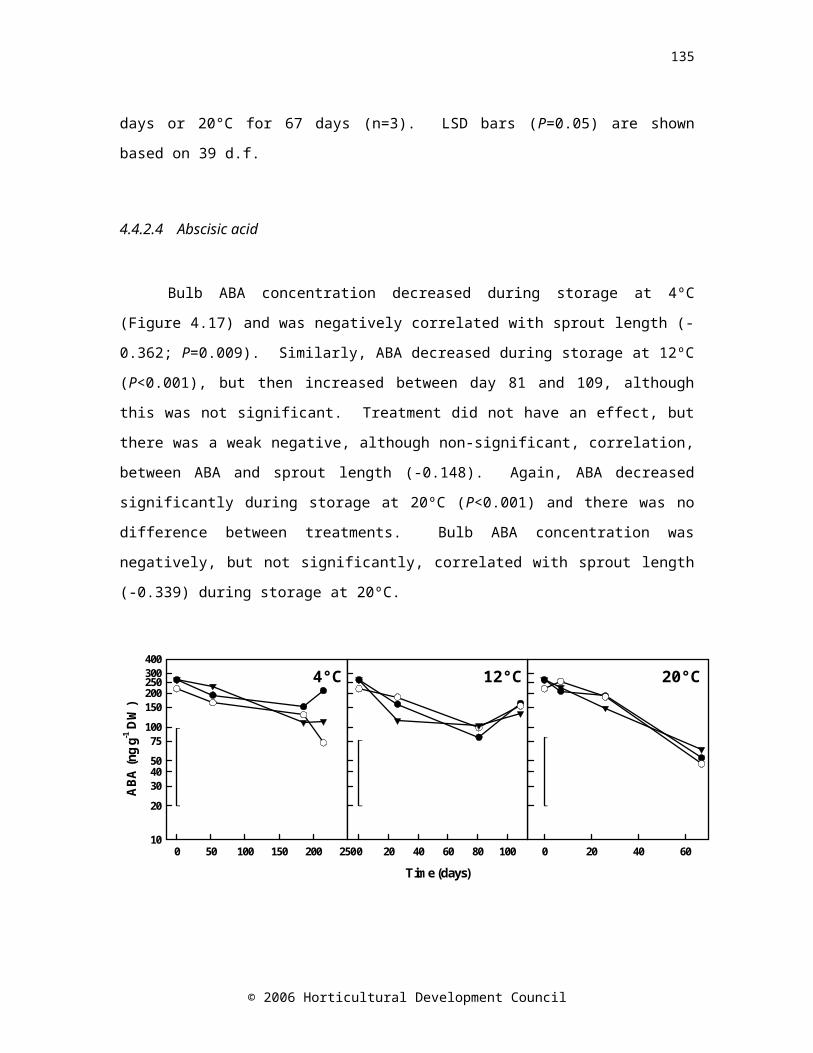
139
relatively expensive compared with regular refrigerated air storage, but adds value to the crop by extending the marketing season for the product. An atmosphere consisting of 5% CO2 and 3% O2 has been recommended for mild onion cv. Granex bulbs (Smittle, 1988). Low oxygen storage inhibits sprouting of onion bulbs, and reduces weight loss (Yoo and Pike, 1996; Praeger et al., 2003). It can, however, have a detrimental effect on the quality of sweet onions, through an increase in pungency, although this is not as great as the increase observed in air-stored bulbs (Smittle, 1988), and can limit subsequent shelf-life with sprouting accelerating three weeks after removal from CA storage (Sumner, 2000). A similar reduction in shelf-life has been observed in CA-stored, high pungency (long-storing) cultivars (D. O’Connor, Allium and Brassica Centre, pers. comm.).
Water-soluble carbohydrates constitute 60-80% of the dry weight of onion bulbs (Rutherford and Whittle, 1982), and comprise glucose, fructose and sucrose, and a series of oligosaccharides called fructans (Darbyshire and Henry, 1978). Fructose concentration is higher in the outer scales than the inner scales, whilst sucrose and glucose are evenly distributed throughout the scales (Darbyshire and Henry, 1978; Salama et al., 1990; Hansen, 1999). A maximum soluble sugar concentration (fructose + glucose + sucrose) occurs between five and eight weeks after harvest (Salama et al., 1990; Benkeblia et al., 2002). Fructose concentration increases over the storage period (Salama et al., 1990), while fructan concentration in onion bulbs tends to decrease (Suzuki and Cutliffe, 1989; Pak et al., 1995; Ernst et al., 1998; Benkeblia et al., 2000). The decrease in fructan concentration has been shown to begin two weeks prior to harvest in onion cv. Rijnsberger Hysam (Pak et al., 1995). In general, fructans tend to be metabolised during the storage period, accounting for the increase in fructose concentration observed. Soluble sugars are required to provide energy for sprout growth, and so the concentration of soluble sugars decreases concomitant to respiration rate increasing when sprouting occurs (Rutherford and Whittle, 1982). Changes in carbohydrates during onion storage have been summarised in Table 6.1.
© 2006 Horticultural Development Council
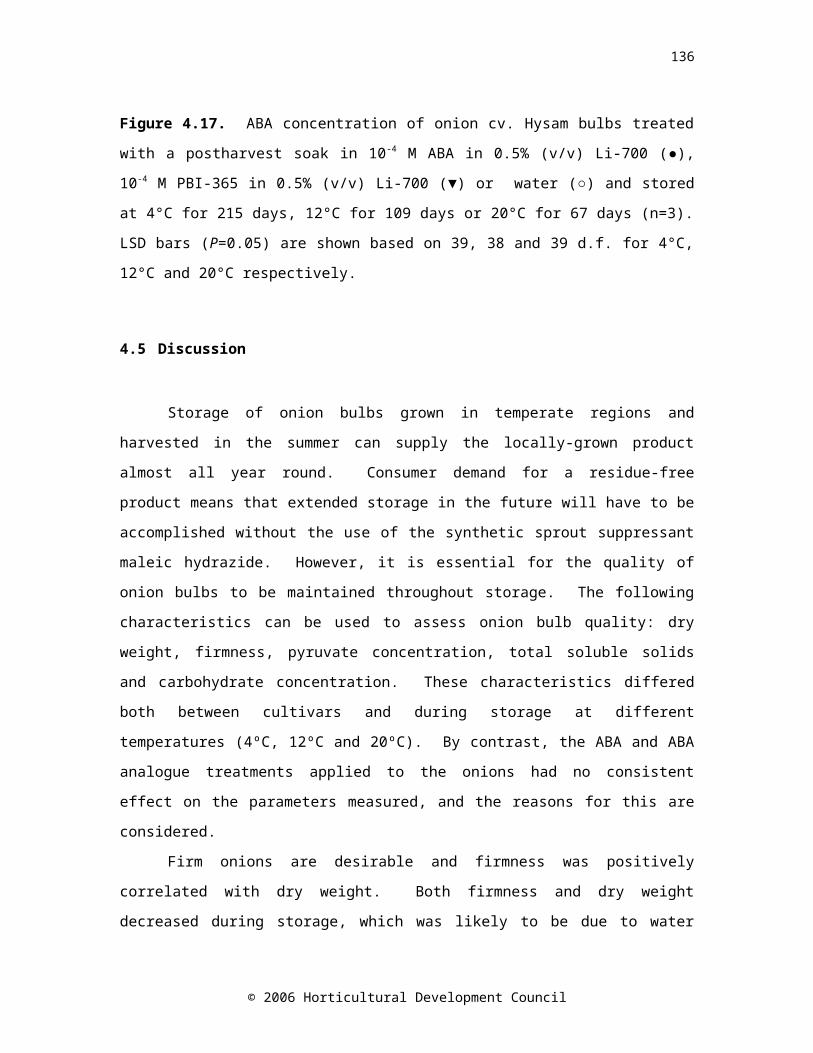
140
Table 6.1. Summary of the changes in carbohydrate composition of onion bulbs during storage.NSC1 analytes and extraction method
Cultivar Storage conditions
Storage duration
Effect Reference
Fructoseb,x
Glucosea,x
Fructanb,x
Cream Gold Syn.2 Pukekohe LongkeeperH
NA3 Recently harvested
Fructan towards the centre of the bulb Fructose towards the centre of the bulbFructan DP4 inversely correlated with its concentration Glucose and sucrose similar in all leaf bases
Darbyshire and Henry (1978)
Fructosex
Glucosebx
Sucrosebx
Rijnsberger RobustaH
4˚C 24 weeks Total soluble sugars before sprouting Total soluble sugars during sprouting Sucrose in inner scales Sucrose in outer scales Fructose over storage
Rutherford and Whittle (1982)
Total carbohydratesbx
Granex-GranoL 1, 4 or 21˚C
24 weeks Total CHOs5 at 1°C up to 4 weeks then stable Total CHOs at 4°C up to 8 weeks Total CHOs at 21°C to 8 weeks, to 13 weeks. to end of storage
Hurst et al. (1985)
Fructoseay Glucoseay
Variety of cultivars (n=8)
6-10˚C 8 weeks Fructans over storage Sucrose over storage
Suzuki and
© 2006 Horticultural Development Council
141
Sucroseay
Fructandy
Range of DM Cutliffe (1989)
Fructoseex Glucoseex
Sucroseex
SentinelL 0˚C15˚C30˚CRange of RH
20 weeks RH had no effect on the carbohydrates measured Fructose at 0˚C and 15˚C Glucose in first 5 weeks at 0˚C and 15˚C Glucose after 5 weeks at 0˚C and 15˚C, from harvest at 30˚C Total sugars up to 5 weeks Total sugars after 5 weeks Fructose and glucose towards centre of the bulb
Salama et al. (1990)
Fructoseax
Glucoseax
Sucroseax
Fructan6ax
HysamH
HystarH
CenturianH
16˚C 15 weeks Glucose and sucrose in the inner and outer scales Fructans in the inner and outer scales Fructose 4-fold in the inner and outer scales Fructans in the bulb base Sucrose, glucose and fructose in the bulb base
Pak et al. (1995)
Glucoseay Valencia sintéticaH 3-32˚C 42 weeks Glucose until 120 days Glucose after 120 days
Croci et al. (1995)
Fructancy Variety of cultivars (n=6)
Un-specifie
12 weeks Total fructans during storage Ernst et al. (1998)
© 2006 Horticultural Development Council
142
Range of DM dGlucosedy
Soluble sugarsdy
Rouge AmpostaH 18˚C 8 weeks Total soluble sugars (F+G+S) 0.5-fold up to 6 weeks Total soluble sugars (F+G+S) after 6 weeks Glucose and fructose preceding sprouting
Benkeblia and Selselet-Attou (1999a)
Sucrosedx
Glucosedx
Fructosedx
Fructandx
HyduroH 1°C 28 weeks Fructan towards centre of the bulb Fructose and glucose towards centre of the bulb Sucrose towards centre of the bulb Fructan between weeks 10 and 18 of storage Fructose and sucrose between weeks 3 and 18 of storage
Hansen (1999)
Fructosedx
Fructandx
HysamH None Shortly after harvest
High fructan associated with high sucrose and low fructose Fructan DP inversely correlated with its concentration Fructan from bulb base to top of the bulb Fructan and sucrose towards centre of the bulb Free fructose towards centre of the bulb
Jaime et al. (2000)
Fructosedx
Glucosedx
Variety of cultivars (n=5)
0˚C; 60-65% RH
24 weeks Free fructose after 24 weeks Free glucose and sucrose after 24 weeks
Jaime et al. (2001)
© 2006 Horticultural Development Council
143
Sucrosedx Range of DMFructosedy
Glucosedy
Sucrosedy
Fructandx
Rouge AmpostaH 4˚C10˚C20˚C
24 weeks Soluble sugars up to 6-8 weeks storage. Soluble sugars from 6-8 weeks to end of storage. Total fructans by 20% at 4˚C. Total fructans 2-fold at 10˚C and 20˚C.
Benkeblia et al. (2002)
Fructosecy
Glucosecy
Sucrosecy
Fructancy
Rijnsberger SherpaH
2˚C21% O2
1% O2
0.5% O2
36 weeks WSC7 with decreasing oxygen concentration. Fructan with decreasing oxygen concentration.DP of fructans higher after low oxygen storage than in control
Ernst et al. (2003)
Fructosedy
Glucosedy
Sucrosedy
Rouge AmpostaH 20˚C 8 weeks Total soluble sugars up to sprouting Total soluble sugars after sprouting
Benkeblia and Shiomi (2004)
Fructosedx
Glucosedx
Sucrosedx
TenshinH 10˚C20˚C
25 weeks Fructose, glucose and sucrose up to 4 weeks Fructose, glucose and sucrose after 4 weeks Fructose, glucose and sucrose gradually after 7 weeks
Benkeblia et al. (2004)
Sucrosedx Fructandx
TenshinH 10˚C20˚C
24 weeks Sucrose 1.5-fold in first 4 weeks at 10˚C Sucrose 2-fold in first 4 weeks at 20˚C Sucrose 4.4-fold between weeks 4 and 7 at 10˚C Sucrose 4-fold between weeks 4 and 7 at 20˚C
Benkeblia et al. (2005a)
© 2006 Horticultural Development Council
144
Sucrose between weeks 7 and 18 Fructan in first 8 weeks, then stable
Fructosedx
Fructandx
TenshinH 15˚C 24 weeks Fructose after 8 weeks, then stable between 10 and 18 weeks Fructose after 18 weeks Fructose between 20 and 24 weeks Fructan and total carbohydrates steadily after 5 weeks
Benkeblia et al. (2005b)
1NSC=Non-structural carbohydrates. 2 Syn.=Synonym. 3NA=Not applicable. 4 DP = Degree of polymerisation.5
CHOs=Carbohydrates. 6Calculated as total carbohydrate minus sucrose, glucose and fructose. 7WSC = Water Soluble CarbohydratesaColorimetric method. bEnzymatic method. cHigh Performance Anion Exchange Chromatography method. dHPLC method. dGC-FID method xEthanol extraction. yWater extraction.HHigh dry matter, LLow dry matter = Increased; = Decreased; = No change
© 2006 Horticultural Development Council
145
The biochemical changes that take place in a stored onion bulb are likely to be associated with respiration and the remobilisation of carbohydrates, as all nutrients required for growth of the sprout must come from within the bulb. The concentration of the plant growth regulator abscisic acid (ABA) decreases during storage in onions held under CA (Chapter 3) or ambient atmosphere (Chapter 4) conditions and it has been postulated that a minimal ABA concentration coincides with the onset of sprout growth.
The transition between CA and air is likely to be a cause of stress to the onion bulb. Therefore, elucidating the changes, in terms of the quality, biochemistry and respiration rate, which occur when onion bulbs are moved from CA to air storage environments and vice versa will provide insight into the response of onion bulbs to these conditions.
6.3 Materials and methods
6.3.1Plant material
Onion cultivars characterised by high dry matter and high pungency (Renate and Carlos) and low dry matter and low pungency (SS1) were grown from seeds drilled at a rate of 18 seeds m-1 in March 2005 at Warwick HRI (Warks., UK). Pesticides were applied according to commercial practice. Plants were harvested at 80-90% tops down in early September. Onions were placed into 25 kg nets and loaded into bin driers. For curing and drying, hot air (ca. 30°C) was blown through the onions for nine days, followed by ambient air for a further two weeks (as per commercial practice). The dry aerial parts and roots were removed, and any diseased or damaged bulbs discarded prior to storage.
6.3.2Controlled atmosphere transition treatment
Onions cvs. Renate, Carlos and SS1 bulbs (n=180) were stored at 2°C under controlled atmosphere (CA; 5% CO2 and 3% O2) or air (ca.
© 2006 Horticultural Development Council
146
0.003% CO2 and 21% O2) conditions (Chope et al., 2006). Atmospheres were maintained using an Oxystat 2 CA system, attached to an Oxystat 2002 Controller, and Type 770 fruit store analyser (David Bishop Instruments, Sussex, UK). This system was self-calibrating every 24 hr against 5% CO2, 95% N2 (British Oxygen Co., Surrey, UK). Bulbs were stored at 2±1°C in cardboard trays inside rigid polypropylene fumigation chambers (88 x 59 x 59 cm) for a total of six weeks. Relative humidity inside the chambers was not controlled, but was measured using data loggers (TinyTalk TK-0302, Gemini Data Loggers, W. Sussex, UK) and was recorded as 95-100% throughout storage (data not shown). No root growth was observed.
6.3.3Experimental design
The experiment was considered to be arranged as a completely randomised design with the assumption that the storage chambers were identical and that the samples for each treatment combination were selected randomly from the harvested onions for each cultivar. Treatments comprised all combinations of three cultivars (Carlos, Renate and SS1) and eight storage treatments. The storage treatments included two baseline controls; at the time of harvest (n=12; respiration rate not measured), and immediately before storage (n=16; respiration rate n=8). The other storage treatments were; assessment after 21 days storage in either CA or air (n=8; respiration rate n=4), and assessment after 42 days storage for bulbs stored under four different regimes (all combinations of either CA or air storage for the first 21 days, and CA or air storage for the last 21 days – i.e. some bulbs stored in the same conditions throughout, and some swapped from one storage regime to the other after 21 days; n=4; respiration rate n=2). Respiration rate was calculated from the rate of CO2 production by ca. 4-5 bulbs (n=48 per cultivar). All other assays were carried out on individual bulbs (n=60 per cultivar).
6.3.4Sample preparation
© 2006 Horticultural Development Council
147
Juice was expressed from a ca. 5 mm equatorial slice using a hand-operated press (Randle and Bussard, 1993) then frozen at -20°C for pyruvate and total soluble solids (TSS) measurements. A longitudinal wedge was cut from each bulb and was snap-frozen in liquid nitrogen and kept at -40°C until the sample was lyophilised (Edwards Super Modulo, Sussex, UK) for use in non–structural carbohydrate (including fructan), and ABA assays.
6.3.5Physical assessments
The following physical assessments were made: sprout growth, firmness, dry weight and respiration rate. Sprout growth, firmness and dry weight were measured according to the methods reported in Chapter 3. Briefly, sprout growth was recorded and expressed as the height of the first appearing green leaves inside the bulb as a percentage of the bulb height, firmness (N mm-1) was measured using an Instron Series IX materials testing machine (Instron, Bucks., UK) according to the method of Lancaster et al. (2001) with slight modifications, and dry weight was measured on lyophilised samples. Respiration rate was measured using gas chromatography as described below.
6.3.5.1 Measurement of respiration rate
The respiration rate was assessed as the rate of CO2 production under air conditions at 5ºC. For respiration measurement, 4-5 onions were removed from the polypropylene storage chambers and the weight recorded. They were immediately placed into 2 l jars with air tight lids fitted with a septum and the jars were sealed for ca. 2 hr. After this incubation period, gas samples were removed with repeated full withdrawal-injection displacements of a 30 ml plastic syringe. The gas sample was immediately analysed for CO2 using gas chromatography (GC model 8340, DP800 integrator, Carlo Erba Instruments, Herts., UK) with hot wire detection (Budu and Joyce, 2003). The hot wire detector was operated at 120ºC and the oven at 80ºC. The 2 m long by 4 mm column was packed with 60-80 mesh size Porapak Q (Jones Chromatography, Mid
© 2006 Horticultural Development Council
148
Glamorgan, UK). The GC was calibrated with 10% CO2 (10% CO2, 2% O2, 88% N2; Certified Standard from British Oxygen Co.). Respiration rate was calculated as mmol CO2 kg-1 hr-1.
6.3.6Biochemical assessments
The following biochemical assessments were made: ABA concentration, pyruvate concentration, concentration of non-structural carbohydrates and TSS. The ABA concentration, pyruvate concentration and TSS (%) were measured according to the methods reported in Chapter 3. Briefly, ABA was measured by radioimmunoassay, pyruvate by absorbance assay, total fructan by enzyme assay and TSS by the use of a handheld refractometer (Palette 100, Atago Co. Ltd., Tokyo, Japan). Fructose, glucose and sucrose were measured using HPLC as described in Chapter 4.
6.3.7Statistical analyses
All statistical analyses were carried out using Genstat for Windows Version 7.1.0.198 (VSN International Ltd., Herts., UK). Analysis of variance was performed on the data as specified in the experimental design section, extracting information about the differences between cultivars and storage regime/times, and the interactions between these factors. A nested factorial treatment structure allowed the separate assessment of the differences between the baseline treatments and the stored treatments, between different timings of sampling (21 or 42 days), between different storage regimes (CA or air), the different combinations of storage regimes, and the interactions between these factors. Least significant difference values (LSD; P=0.05) were calculated for comparison of appropriate treatment means, using critical values of t for two-tailed tests.
© 2006 Horticultural Development Council
149
6.4 Results
6.4.1 Effect of the transition between CA and air storage on physical characteristics of onion bulbs
The respiration rates for onion cvs. Carlos and Renate were significantly (P<0.001) greater than SS1 (Carlos 0.0999, Renate 0.1045 and SS1 0.1655 mmol CO2 kg-1 hr-1). There was a significant effect of the storage conditions in the first 21 days in cv. SS1, where onion bulbs that had been stored in CA had a significantly (P=0.023) higher respiration rate (0.2137) than those stored in air (0.1372 mmol CO2 kg-1 hr-1) (Figure 6.1). Respiration rate was measured at the end of the storage period. At this time point there was a main interaction of the storage treatment for days 21 to 42, where irrespective of the storage treatment applied in days 0 to 21, onions removed from CA storage had a greater (P<0.001) respiration rate (when measured in air) (0.1822) than those removed from air storage (0.0702 mmol CO2 kg-1 hr-1).
© 2006 Horticultural Development Council
150
Day 0
CA P1
Air P1
CA/CA
CA/Air
Air/CA
Air/Air
Res
pira
tion
Rat
e (m
mol
CO
2 kg-1
hr-1
)
0.0
0.1
0.2
0.3
0.4
Figure 6.1. The respiration rate of onions cvs. Carlos ( CA/CARA/AARA/CARA/RA
), Renate (CA/CARA/AARA/CARA/RA
) and SS1 (
CA/CARA/AARA/CARA/RA) recorded before storage (Day 0), after 21 days
storage in CA (CA P1) or air (Air P1) and after CA for 42 days (CA/CA), CA for 21 days followed by air for 21 days (CA/Air), air for 21 days followed by CA for 21 days (Air/CA) and air for 42 days (Air/Air). Day 0 n=8, CA P1 and Air P1 n=4; CA/CA, CA/Air, Air/CA and Air/Air n=2. LSD bars (P=0.05) A=2,2; B=4,2; C=4,4 are shown.
No sprout growth was observed in onions cv. Carlos during the entire storage period, however, sprouting (sprout length 8.2 % of bulb height) was observed in onions cv. Renate after 42 days under air conditions. Sprout growth had occurred after 42 days in all treatments for cv. SS1 (Figure 6.2). Sprout growth was greatest (P<0.001) in onions cv. SS1 stored in air for 42 days (83.17% of bulb height) and least in those stored in air followed by CA (42.35% of bulb height). There was no significant difference between those stored for 42 days in CA or those stored in CA followed by air.
© 2006 Horticultural Development Council
A B C
151
Storage treatment
CA/CA CA/Air Air/CA Air/Air
Spro
ut le
ngth
(% o
f bul
b he
ight
)
0
10
20
30
40
50
60
70
80
90
100
Figure 6.2. The sprout length of onion cv. SS1 expressed as a percentage of bulb height after storage in; CA for 42 days (CA/CA), CA for 21 days followed by air for 21 days (CA/Air), air for 21 days followed by CA for 21 days (Air/CA) and air for 42 days (Air/Air); n=4. LSD bar (P=0.05) is shown.
There was a main effect of cultivar on firmness. Onion cvs. Carlos and Renate, 51.03 and 55.33 N mm-1, respectively, were significantly (P<0.001) firmer than onions cv. SS1 at 26.31 N mm-1 (Table 2). Firmness decreased significantly during storage (P=0.05) in onions cv. SS1 between days 0 and 42. There were no differences in firmness between different storage treatments.
There was also a main effect of cultivar on dry weight. The dry weight of onion cvs. Carlos and Renate, 139.72 mg g-1 FW and 128.79 mg g-1 FW, respectively, was greater (P<0.001) than that of onions cv. SS1, 71.11 mg g-1 FW. There were no main effects or interactions of storage treatment (Table 6.2).
© 2006 Horticultural Development Council
152
Table 6.2. The firmness (N mm-1) and dry weight (mg g-1 FW) of onion cvs. Carlos, Renate and SS1 measured at harvest, before storage (Day 0), after 21 days storage in CA (CA P1) or air (Air P1) and after CA for 42 days (CA/CA), CA for 21 days followed by air for 21 days (CA/Air), air for 21 days followed by CA for 21 days (Air/CA) and air for 42 days (Air/Air). Firmness LSD (P=0.05) 12,16=5.903; 8,4=9.466. Dry weight LSD (P=0.05) 12,16=7.941; 8,4=12.733.
Cultivar
Storage Treatment
Harvest
(n=12)
Day 0(n=16)
CA P1Day 21(n=8)
Air P1Day 21(n=8)
CA/CADay 42(n=4)
CA/AirDay 42(n=4)
Air/CADay 42(n=4)
Air/AirDay 42(n=4)
Firmness(N mm-1)
Carlos 47.54 51.03 51.50 49.52 48.49 42.88 50.19 50.63Renate
49.55 55.33 52.44 49.71 52.14 55.36 47.51 48.16
SS1 27.04 26.31 24.45 20.81 20.39 12.09 15.54 17.83LSD0.0
56.310 5.465 7.723 10.930
Dry Weight(mg g-1 FW)
Carlos 133.72 139.08 139.09 147.01 144.11 141.82 140.23 139.99Renate
126.86 126.86 125.15 133.49 128.94 130.05 134.44 133.14
SS1 58.08 69.31 78.53 77.35 77.56 82.86 70.88 72.14
LSD0.0 8.489 7.352 10.397 14.704
© 2006 Horticultural Development Council
153
5
© 2006 Horticultural Development Council
154
6.4.2Effect of the transition between CA and air storage on biochemical characteristics of onion bulbs
There was a main effect on cultivar on TSS. The TSS % was significantly different (P<0.001) between cultivars, and can be ranked in order from highest to lowest: Carlos (11.71)>Renate (10.26)>SS1 (5.473 %). At day 21, onions cv. Carlos stored under CA conditions had a lower TSS % (P>0.001) than those stored under air conditions; this situation was reversed at day 42 (Table 6.3). The TSS % of onions cv. SS1 stored for 42 days in air had the highest TSS concentration (P>0.001), while the opposite was true for onions cv. Renate.
There was a significant (P<0.001) main effect of cultivar in terms of pyruvate concentration (Table 6.3), with Carlos having the highest pyruvate concentration (8.39) followed by Renate (7.83) and SS1 (5.00 μmol g-1 FW). Onion cv. SS1 bulbs stored under air conditions for the first half of the storage period had a significantly (P=0.002) higher mean pyruvate concentration at the end of the storage period than those stored under CA conditions for the first 21 days. There were no other interactions identified by ANOVA in the pyruvate concentration, according to time and storage treatment.
© 2006 Horticultural Development Council
155
Table 6.3. The total soluble solids (TSS) concentration (%) and pyruvate concentration (μmol g -1 FW) of onion cvs. Carlos, Renate and SS1 measured at harvest, before storage (Day 0), after 21 days storage in CA (CA P1) or air (Air P1) and after CA for 42 days (CA/CA), CA for 21 days followed by air for 21 days (CA/Air), air for 21 days followed by CA for 21 days (Air/CA) and air for 42 days (Air/Air). TSS LSD (P=0.05) 12,16=0.8538; 8,4=1.3691. Pyruvate LSD (P=0.05) 12,16=1.049; 8,4=1.682.
Cultivar
Storage Treatment
Harvest(n=12)
Day 0(n=16)
CA P1 Day 21(n=8)
Air P1 Day 21(n=8)
CA/CA Day 42(n=4)
CA/Air Day 42(n=4)
Air/CA Day 42(n=4)
Air/Air Day 42(n=4)
Total soluble solids (%)
Carlos 12.033 11.706 11.175 12.463 12.025 10.825 11.775 10.875Renate
11.792 10.206 9.375 9.788 10.375 11.100 10.200 7.700
SS1 5.408 5.156 5.588 5.475 5.200 4.825 4.925 8.175LSD0.0
50.9127 0.7904 1.178 1.5808
Pyruvate (µmol g-1 FW)
Carlos 9.57 8.07 8.62 7.58 9.13 9.16 9.06 8.13Renate
9.73 6.67 6.80 8.07 7.76 8.07 9.07 6.93
SS1 4.90 4.30 4.49 6.19 4.30 4.97 5.74 6.74LSD0.0
50.121 0.971 1.373 1.942
© 2006 Horticultural Development Council
156
In cvs. Carlos and Renate, the simple sugar present in the greatest concentration was glucose (range: 125-275; Carlos mean: 183.1; Renate mean: 179.4 mg g-1 DW), followed by sucrose (range: 50-125; Carlos mean: 71.6; Renate mean: 96.4 mg g-1 DW) with small amounts of fructose (range: 25-75; Carlos mean: 39.8; Renate mean: 38.8 mg g-1 DW). The sugar composition of onions cv. SS1 was dominated by glucose and fructose present in high concentrations (range: 150-375; mean glucose: 304.4; mean fructose: 244.7 mg g-1 DW), with amounts of sucrose comparable with that in Carlos and Renate (range: 25-125; mean: 80.4 mg g-1 DW).Sucrose concentration increased significantly (P<0.001) between harvest and the beginning of storage in cvs. Renate and SS1, by 1.7- and 2.6-fold, respectively (Figure 6.3). The sucrose concentration of all cultivars increased (P<0.001) over time between harvest and the end of the storage period.
There was a main effect of cultivar on fructose concentration, with onions cv. SS1 containing approximately 8-fold more fructose (P<0.001) than cvs. Renate and Carlos. Fructose concentration in onions cv. Carlos and SS1 decreased (P<0.001) between harvest and the beginning of storage (Figure 6.3). After 21 days storage in CA conditions the fructose concentration in onions cv. SS1 was significantly higher (P=0.0039) than after 21 days in air. A similar pattern was observed in cv. Carlos, although this was not significant. Regardless of the storage conditions for the first 21 days, onions cv. SS1 stored in air between days 21 and 42 had a higher fructose concentration (P=0.004) than those stored in CA; again a similar pattern was observed in cv. Carlos but this was not significant. The lowest fructose concentration (P=0.05) among onions cv. SS1 was found in those stored in CA conditions for 42 days.
© 2006 Horticultural Development Council
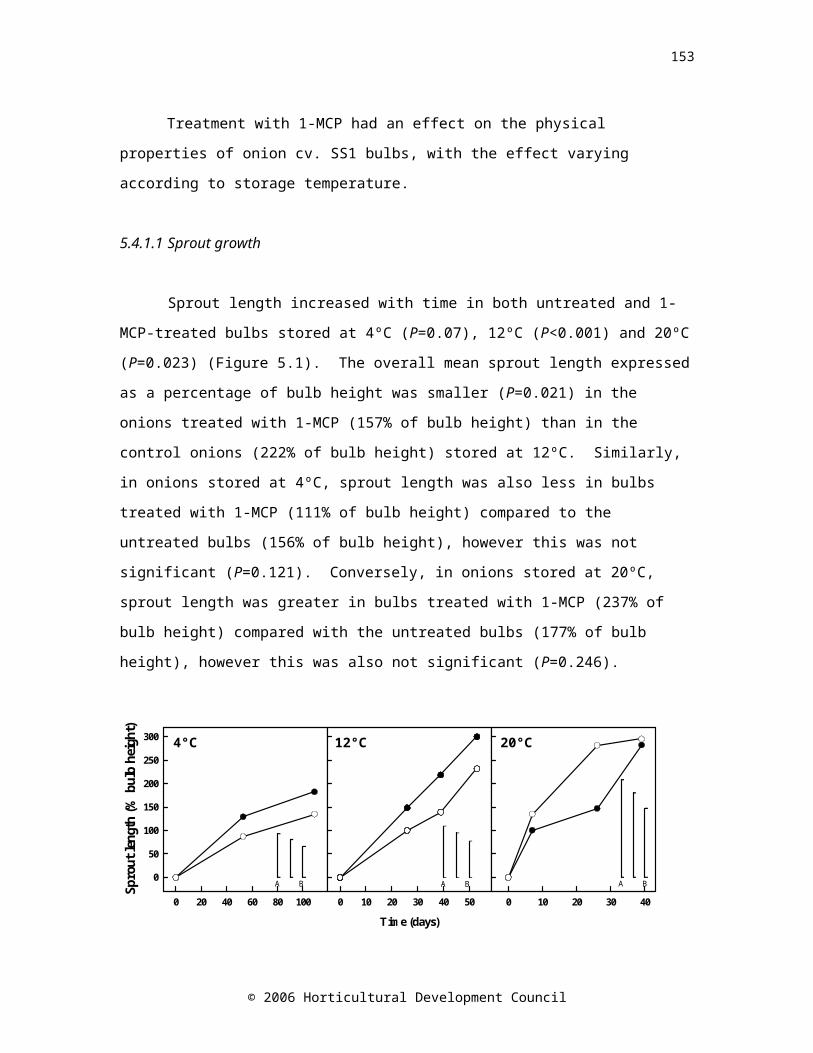
157
Harve
stDay
0CA P1
Air P1
CA/CA
CA/Air
Air/CA
Air/Air
Fruc
tose
(mg
g-1 D
W)
0
100
200
300
400
Harve
stDay
0CA P1
Air P1
CA/CA
CA/Air
Air/CA
Air/Air
Sucr
ose
(mg
g-1 D
W)
0
100
200
300
400
Harve
stDay
0CA P1
Air P1
CA/CA
CA/Air
Air/CA
Air/Air
Glu
cose
(mg
g-1 D
W)
0
100
200
300
400
Figure 6.3. The sucrose, glucose and fructose concentration of onion cvs. Carlos ( CA/CARA/AARA/CARA/RA
), Renate (CA/CARA/AARA/CARA/RA
) and SS1 (
CA/CARA/AARA/CARA/RA)
measured at harvest, before storage (Day 0), after 21 days storage in CA (CA P1) or air (Air P1) and after CA for 42 days (CA/CA), CA for 21 days followed by air for 21 days (CA/Air), air for 21 days followed by CA for 21 days (Air/CA) and air for 42 days (Air/Air). Harvest n=12, Day 0 n=16, CA P1 and Air P1 n=8; CA/CA, CA/Air, Air/CA, Air/Air n=4. LSD bars (P=0.05) A=4,4; B=8,4; C=8,8 are shown.
© 2006 Horticultural Development Council
A B CA B C A B C
158
Glucose concentration varied significantly with cultivar (P<0.001) with onions cv. SS1 having the highest concentration (304.4 mg g-1 DW) followed by cvs. Carlos (183.1 mg g-1 DW) and Renate (179.4 mg g-1 DW). The glucose concentration of both cvs. Renate and SS1 decreased significantly (P<0.001) between harvest and the beginning of storage (Figure 6.3). After 21 days storage in CA conditions onions cv. SS1 had a greater (P=0.003) glucose concentration than those stored in air conditions. The greatest (P=0.003) glucose concentration at the end of storage in onions cv. Renate was in those stored in air conditions for 42 days, being at least 2-fold greater than that recorded for any other storage treatment.
Onions cv. SS1 had a 2-fold greater (P<0.001) mean total sugar (sucrose + glucose + fructose) concentration than cvs. Renate and Carlos (Figure 6.4). The total sugar concentration in onions cv. SS1 decreased significantly (P<0.001) between harvest and the beginning of storage. Whatever the storage treatment in the second half of storage, the mean total sugar concentration at 42 days in onions cv. SS1 stored in CA for the first half of the storage period was greater (P<0.001) than in those stored in air for the first 21 days. The general trend for changes in mean total sugar concentration varied with cultivar, with a peak at day 21 in cv. Renate, no change over storage in cv. Carlos and a decrease until day 21 in cv. SS1 followed by an increase to day 42.
© 2006 Horticultural Development Council
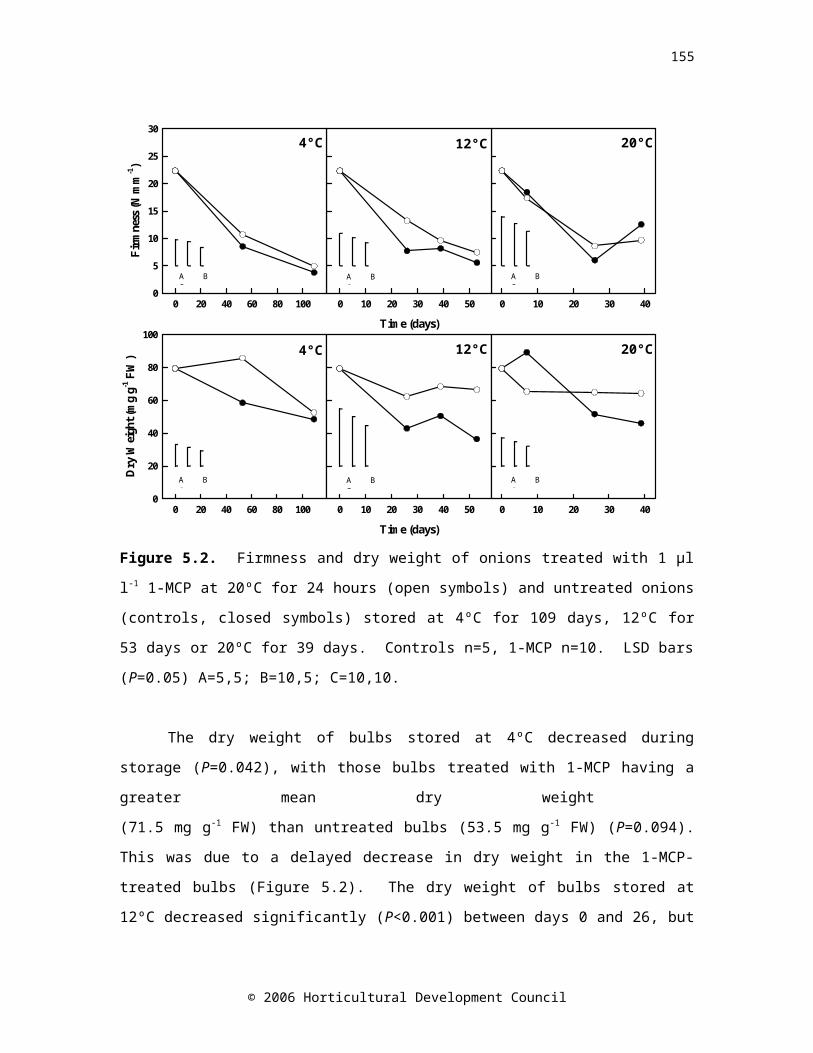
159
Harve
stDay
0CA P1
Air P1
CA/CA
CA/Air
Air/CA
Air/Air
Tot
al s
ugar
s (m
g g-1
DW
)
0
200
400
600
800
2D Graph 3
Harve
stDay
0CA P1
Air P1
CA/CA
CA/Air
Air/CA
Air/Air
(Fru
ctos
e+G
luco
se) /
Suc
rose
0
5
10
15
20
25
30
2D Graph 3
Harve
stDay
0CA P1
Air P1
CA/CA
CA/Air
Air/CA
Air/Air
Fruc
tan
(mg
g-1 D
W)
0
100
200
300
400
2D Graph 2
Figure 6.4. The total sugar (glucose, sucrose and fructose), monosaccharide to disaccharide ratio, and total fructan concentration of onion cv. Carlos ( CA/CA
RA/AARA/CARA/RA
), Renate (CA/CARA/AARA/CARA/RA
) and SS1 (
CA/CARA/AARA/CARA/RA) measured at harvest, before storage (Day 0), after 21
days storage in CA (CA P1) or air (Air P1) and after CA for 42 days (CA/CA), CA for 21 days followed by air for 21 days (CA/Air), air for 21 days followed by CA for 21 days (Air/CA) and air for 42 days (Air/Air). Harvest n=12, Day 0 n=16, CA P1 and Air P1 n=8; CA/CA, CA/Air, Air/CA, Air/Air n=4. LSD bars (P=0.05) A=4,4; B=8,4; C=8,8 are shown.
© 2006 Horticultural Development Council
A B CA B C
A B C
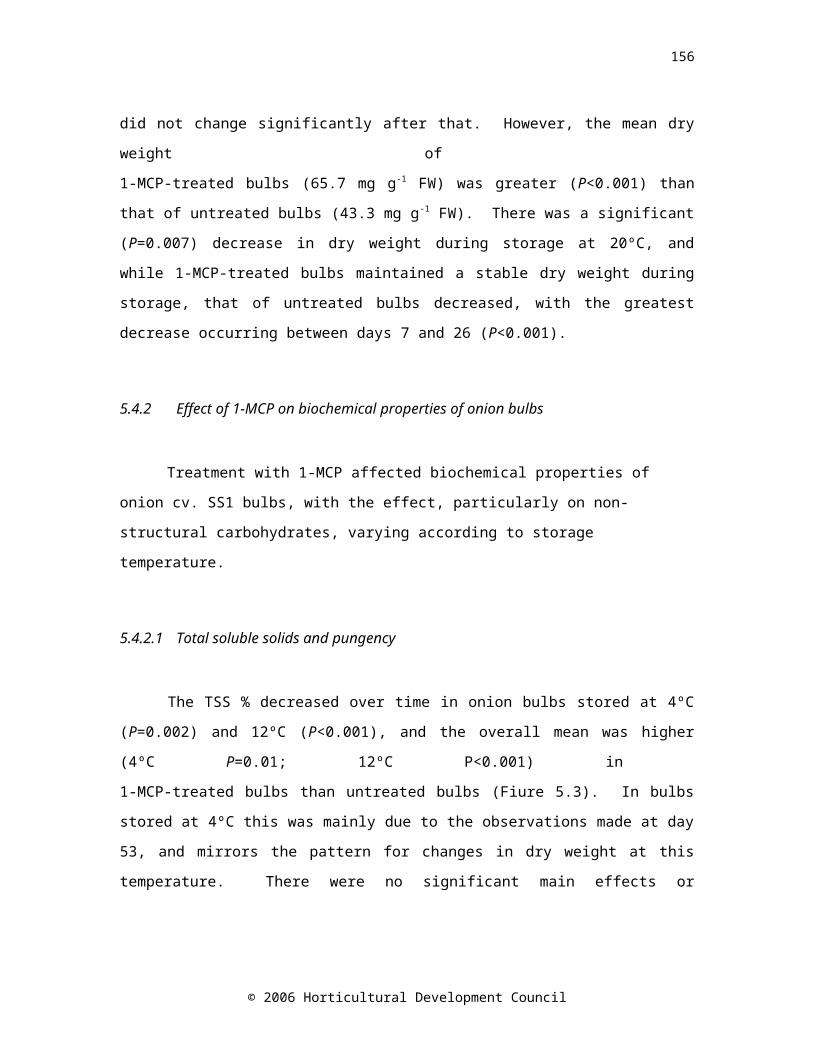
160
The ratio of monosaccharides (fructose and glucose) to disaccharide (sucrose) was calculated. There was a main effect of cultivar (P<0.001) with onions cv. SS1 being dominated by fructose and glucose, and therefore having a much higher mean ratio (10.66) than Carlos (3.41) or Renate (2.55) (Figure 6.4). There was a 3.2-fold decrease (P<0.001) in the ratio between harvest and the beginning of storage in onions cv. SS1. Storage conditions did not have an effect on the mono- to disaccharide ratio.
There was a significant (P<0.001) main effect of cultivar in terms of the fructan concentration (Figure 6.4). The cultivar means were as follows: Carlos (306.3) Renate (264.0) and SS1 (46.3 mg g-1 DW). Fructan concentration decreased between harvest and the beginning of storage in cvs. Renate and Carlos. When these cultivars were stored in air conditions for the first 21 days, the fructan concentration was greater (P=0.046) than those stored in CA for the first 21 days, however there was no such difference corresponding with the conditions in the second half of the storage period.
The mean ABA concentration was greatest in cvs. Renate and Carlos than in cv. SS1 (P=0.003). The ABA concentration for each cultivar at the time of harvest was greater in cvs. Renate and SS1 than Carlos, however between harvest and the beginning of storage (i.e. curing period), the ABA concentration decreased 1.5-fold in cv. Renate, and 2.6-fold in SS1, while there was no change in cv. Carlos (Figure 6.5). This meant that the ABA concentration measured before storage was greater in cvs. Carlos and Renate than SS1. There were no interactions between storage treatment and time or cultivar.
© 2006 Horticultural Development Council
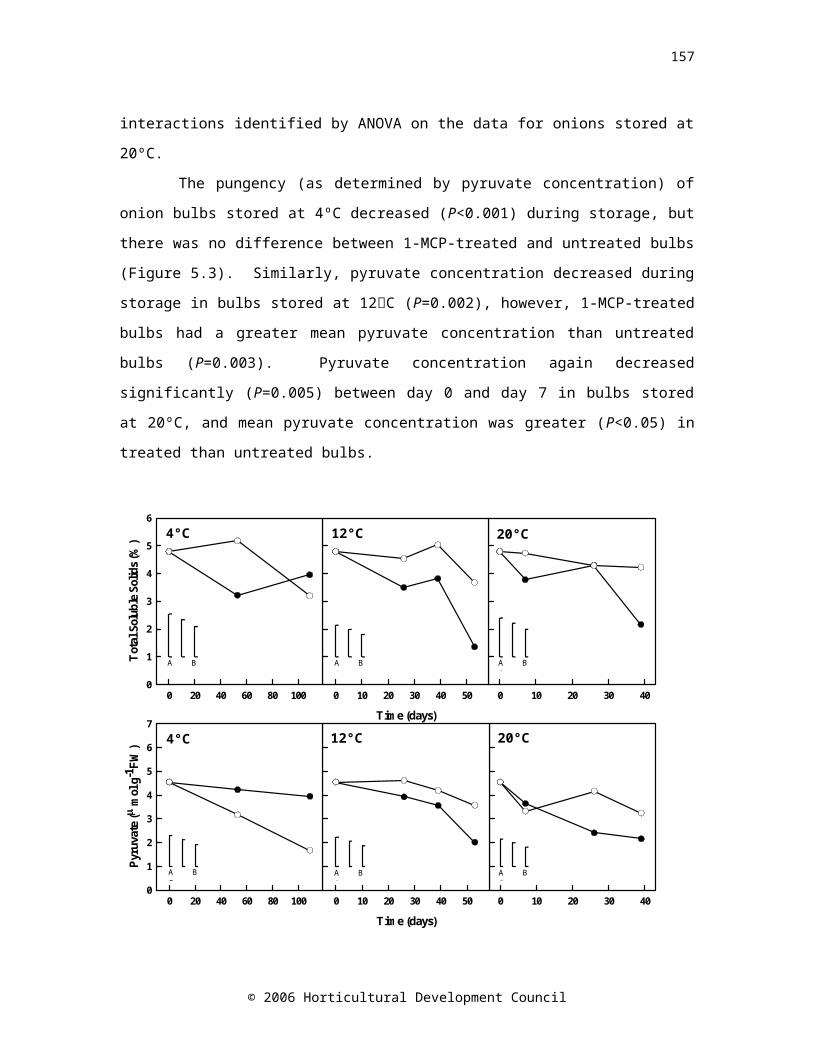
161
Harvest
Day 0CA P1
Air P1
CA/CA
CA/Air
Air/CA
Air/Air
AB
A (n
g g-1
DW
)
0
50
100
150
200
250
2D Graph 4
Figure 6.5. The ABA concentration of onion cvs. Carlos ( CA/CARA/AARA/CARA/RA
), Renate (CA/CARA/AARA/CARA/RA) and SS1 (
CA/CARA/AARA/CARA/RA) measured at harvest, before storage (Day 0), after 21 days
storage in CA (CA P1) or air (Air P1) and after CA for 42 days (CA/CA), CA for 21 days followed by air for 21 days (CA/Air), air for 21 days followed by CA for 21 days (Air/CA) and air for 42 days (Air/Air). Harvest n=12, Day 0 n=16, CA P1 and Air P1 n=8; CA/CA, CA/Air, Air/CA, Air/Air n=4. LSD bars (P=0.05) A=4,4; B=8,4; C=8,8 are shown.
6.5 Discussion
This study was undertaken to document the changes, both biochemical and physical, that occurred in onions bulbs of different cultivars on the transition between controlled atmosphere and air. The cultivars chosen differed from one another, with Renate and Carlos being firm, pungent bulbs, characterised by high dry weight and TSS %, and bulbs cv. SS1 being less firm with a milder flavour, and low dry weight and TSS %. There are also distinctive NSC profiles that separate cv. SS1 from cvs. Carlos and Renate.
© 2006 Horticultural Development Council
A B C
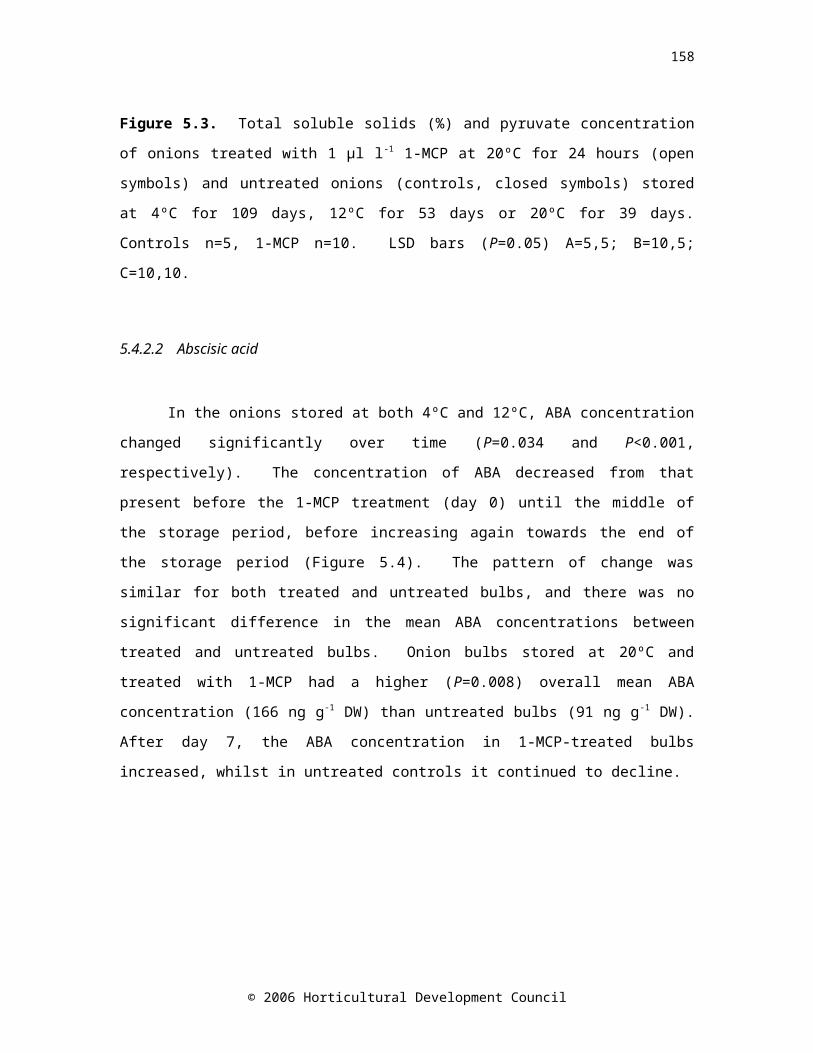
162
The mean respiration rate of onions cv. SS1 (0.1655) was significantly greater than that of Carlos (0.0966) or Renate (0.1045 mmol CO2 kg-1 hr-1). The respiration rates of cvs. Carlos and Renate are similar to that reported in the literature for onions cv. Rouge Amposta (high dry matter), stored at 4ºC for 6 weeks (0.08 mmol CO2 kg-1 hr-1) (Benkeblia, 2004). Short-storing onions such as cv. SS1 would be expected to have a higher respiration rate than long-storing cultivars because respiration rate tends to be negatively correlated with storage life. Respiration determines the rate of metabolic processes which in turn have a direct impact on eating quality characteristics such as firmness, sugar content, pungency and overall flavour (Crowther et al., 2005; Terry et al., 2005).
There is evidence to suggest that once onions are removed from CA storage, the shelf-life is limited. Only 5% of onions cv. Walla Walla (low dry matter) stored in air for six months had sprouted after a subsequent shelf-life of 2 weeks at 20ºC, compared with 20-55% of onions stored under low oxygen conditions (0.7-1.4%) with 0.05% CO2 (Sitton et al., 1997). However, some authors have claimed that CA storage extends shelf-life. Onions cv. Sherpa (high dry matter) stored in 1 or 0.5% O2 with <0.3% CO2 at 2ºC had an improved shelf-life (when tested for 3 weeks at 18ºC after 9, 27, and 36 weeks storage) compared with those stored in air (Praeger et al., 2003) and onions cv. Granex stored in 5% CO2 with 3% O2 at room temperature or 5ºC for 20 weeks, or in 5% CO2 with 3% O2 at 1ºC for 24 weeks had a greater percentage of marketable bulbs after 2 weeks at 27ºC than those stored in air (Smittle, 1988). Only 3 to 10% of onions cv. Rumba (high dry matter) stored in CA (0.5, 1 or 2% O2 with 3% CO2 at 0ºC) for 36 weeks had sprouted after 3 weeks at 20ºC, compared with 40% of air-stored bulbs (Adamicki, 2005). However, in all cases, the air- and CA-stored bulbs were subjected to a shelf-life test after the same storage duration, meaning that there were a lower proportion of marketable bulbs from the air-stored control treatment. The comparison was, therefore, being made between onion bulbs at different maturity stages or depths of dormancy.
© 2006 Horticultural Development Council
163
In all cultivars in this study, CA conditions during the second period of storage resulted in a greater respiration rate at the end of storage than air for the second period (Figure 6.1). The respiration rates of all of the onions in this study were measured in air. Therefore, the respiration rate measured for onions removed from CA storage may include the immediate effect of the transition between CA and air. In general, the effect of removing the onions from CA storage was to increase respiration rate on exposure to air. In contrast, when onions (unspecified Japanese cultivar) were exposed to high carbon dioxide concentrations (60% CO2, 20% O2, 20% N2) for 24h and then transferred back to air, there was no significant change in the respiration rate in terms of oxygen uptake (Kubo et al., 1990). In our study, respiration rate was represented by the rate of production of carbon dioxide, so that the higher respiration rates after CA storage could be said to be due to the diffusion of CO2 out of the onion bulb tissue to equilibrate with the new environment. However, if this was the case, then a higher respiration rate would have also been recorded after 21 days in CA – this was only the true for cv. SS1. The increase in respiration rate may only be a temporary effect, as measurements were taken within 2 hours of the transition. The increase in the respiration rate observed on the transition from CA to air may only be transient, but depending on the cultivar and the developmental stage of the bulbs, particularly of short-storing cultivars, it may be sufficient to trigger the onset of sprout growth.
Onions cv. SS1 stored in CA for the preceding 21 days had smaller sprouts than those stored in air, but respiration rate (measured in air) was higher in those bulbs stored in CA. Similarly, sprouting was observed in onions cv. Renate stored in air for 42 days, yet respiration rate still followed the pattern above. It has been reported that the respiration rate of sprouted onions cv. Rouge Amposta bulbs was 0.06 mmol kg-1 hr-1 and 0.08 mmol kg-1
hr-1 in unsprouted onions (Benkeblia et al., 2000). This difference is small, and it is therefore possible that the impact of the transition between CA and air was large and masked the respiration increase associated with of sprouting.
© 2006 Horticultural Development Council
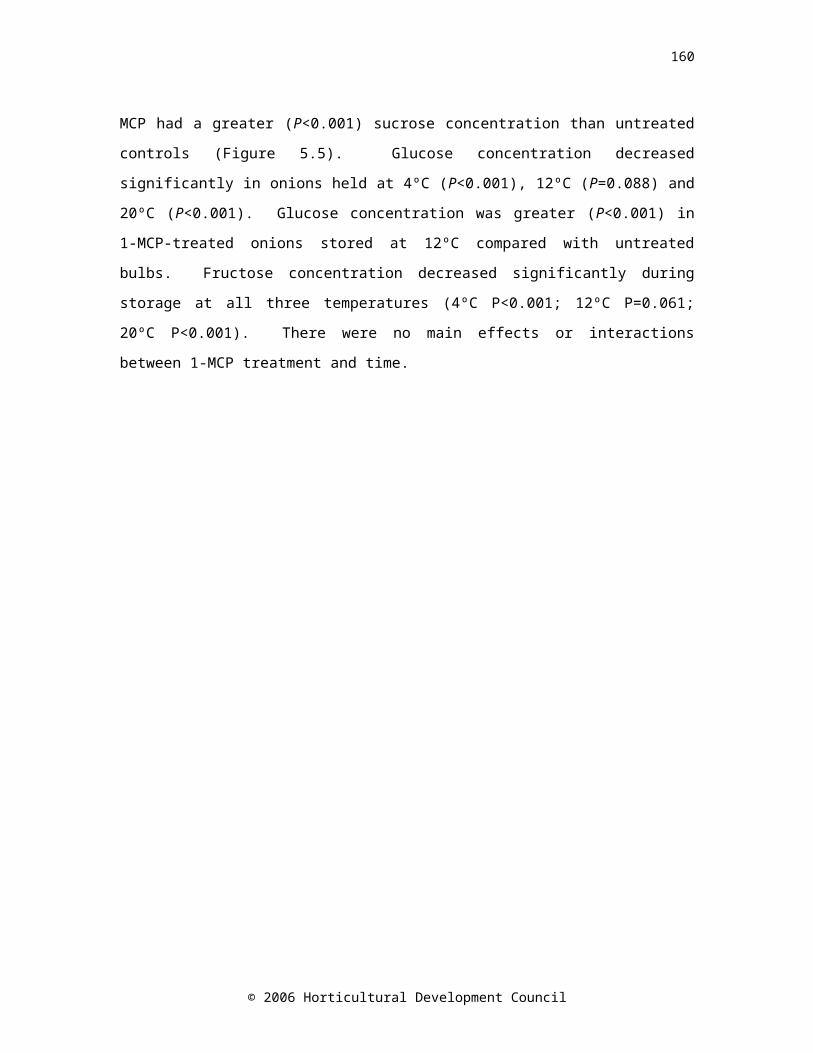
164
Sprout suppression in cv. SS1 was achieved to statistically similar levels by the three combinations of CA/CA, CA/air and air/CA (Figure 6.2). In fact, the most effective treatment was air/CA. This is important, as it suggests that there is potential to delay the use of CA storage for a period of time without compromising sprout suppression, thus not only reducing monetary costs of storage, but reducing the impact of CA storage on the environment. When any storage treatment is assessed it is essential that maintenance of bulb quality characteristics is paramount. In this investigation, there was no main effect of the storage treatments on firmness or dry weight (Table 6.2). Similarly, there was no difference in the dry weight of onions cv. Sherpa stored under CA conditions (0.5% O2 and <0.3% CO2) and air-stored controls after 9 weeks, although after 36 weeks the DW of CA-stored onions was greater (Praeger et al., 2003). Pungency of low dry matter onions such as cv. SS1 that are marketed as mild and suitable for consumption raw is an important quality characteristic. Therefore, growers must be aware of any effect that postharvest handling may have on pungency. The effect of storage treatments on pungency varies with cultivar, but has not been clearly defined. Pyruvate concentration in onion bulbs cv. Hysam (high dry matter) decreased after nine weeks storage at 0.5ºC in CA conditions (2% O2, 2% CO2 and 2% O2, 8% CO2) whereas the pyruvate concentration of bulbs cv. Hysam in air storage increased (Uddin and MacTavish, 2003). Pyruvate concentration of onions cv. Granex (low dry matter) increased from 2.60 μmol g-1 FW over 26 weeks storage to 5.18 in air but only to 3.85 in CA (5% CO2 and 3% O2) at 1°C (Smittle, 1988). Although not statistically different, onions cv. SS1 stored in CA for 42 days had a lower pyruvate concentration than those stored in air for 42 days (Table 6.3). If the storage period was longer then this difference may have widened.
Glucose, sucrose and fructose contribute to the overall taste preference. Glucose concentration has been negatively correlated with perceived bitterness in onion (Terry et al., 2005). Indeed, the concentration of glucose and fructose were correlated with perceived sweetness and likeability
© 2006 Horticultural Development Council
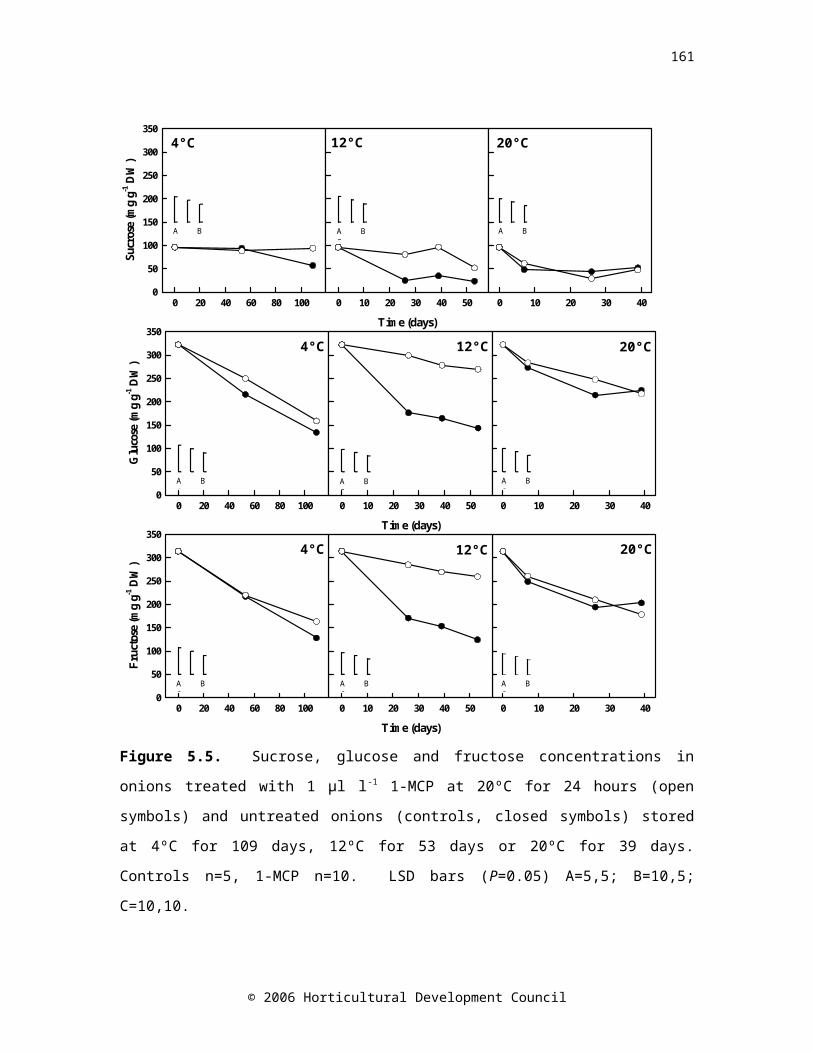
165
as adjudged by taste panellists, whilst sucrose did not appear to affect sweetness (Terry et al., 2005). Non-structural carbohydrate concentrations recorded in this investigation (Figure 6.4) are comparable with other reports (Table 6.1). Total sugars were greater in cv. SS1 (440-780 mg g-1 DW) than cvs. Carlos and Renate (300-400 mg g-1 DW) yet the TSS % of onions cvs. Carlos and Renate was consistently ca. 2-fold greater than cv. SS1 despite having lower NSC concentrations (Table 6.3). The TSS % was measured on fresh juice and NSC measured on lyophilised material, but even when total sugars were expressed per fresh weight, the concentration in cv. SS1 was greater than or equal to that in other cultivars. This contradiction shows that TSS concentration is not a good measure of the overall sugar concentration, and therefore should not be used to assess perceived sweetness. The TSS value is likely to be affected by other substances in the onion juice other than simple NSCs, such as fructan, organic acids and proteins.
In the study reported here, sucrose concentration was observed to increase in all cultivars over storage; an effect that has also been noted by Suzuki and Cutliffe (1989). Rutherford and Whittle (1982) stated that total sugars did not change before sprouting, but decreased during sprouting, but Benkeblia and Shiomi (2004) found that total sugars increased up to the time of sprouting. The changes in total sugars during storage in the study reported here varied with cultivar (Figure 6.4). The decrease in total sugar concentration in cv. SS1 between days 0 and 21, followed by an increase between days 21 and 42 is similar to that recorded by Hurst et al. (1985) in onions cv. Granex-Grano, a low dry matter cultivar. No sprout growth occurred in cv. Carlos, and there was also no change in total sugar concentration over storage. Increases in the concentrations of glucose and fructose (Benkeblia and Selselet-Attou, 1999a) have been associated with the onset of sprouting, and indeed in the study reported here, the glucose concentration was highest in sprouted bulbs. In general there was no significant effect of treatment on the NSC concentrations measured. This could be because although there were differences in the respiration rates
© 2006 Horticultural Development Council
166
when measured in air, these differences could be due to a stress response rather than the mean respiration rate over storage. Therefore, there may have been little difference in the mean respiration rates of onions stored in CA or air, and correspondingly little difference in the carbon utilisation.
Changes in the sugar composition were associated with the time between harvesting and the beginning of storage, with an increase in sucrose and a decrease in fructose and glucose, suggesting that the current curing process may affect flavour. In particular, the ratio of monosaccharides to disaccharide in onions cv. SS1 changed from 27.08 to 8.24 during this period (Figure 6.4), mainly caused by the reduction in fructose and glucose, rather than the increase in sucrose (Figure 6.3). The implication of the reduction in monosaccharides is that flavour may be detrimentally affected by curing and that the curing regime should perhaps be adapted to prevent sugar degradation.
Fructans are storage carbohydrates that are metabolised during storage. Typically, larger fructans decrease in concentration with a corresponding increase in fructans with smaller degrees of polymerisation (Benkeblia and Shiomi, 2006). Fructans of all sizes were measured together using the assay employed in this investigation (O’Donoghue et al., 2004), therefore the decrease in the fructan concentration in cvs. Carlos and Renate between harvest and the beginning of storage represents a reduction in total fructan content (Figure 6.4). A decrease in fructan concentration during long-term storage (up to six months) has been observed in many high dry matter cultivars (Ernst et al., 1998; Hansen, 1999; Benkeblia et al., 2002). Fructan concentration did not change over storage in the study reported here, perhaps because the storage period of six weeks was too short for significant metabolism of fructans to occur. In general, the fructan concentration was not affected by CA conditions, which was also the case in onions cv. Granex stored at 3% O2 and 5% CO2 (Smittle, 1988). Total fructan concentration measured after 21 days of storage was greater in air-stored bulbs than CA-stored onion cv. Renate bulbs, however, long-term (36 weeks) low oxygen storage of onions cv. Sherpa caused an increase in fructan concentration
© 2006 Horticultural Development Council
167
compared with air-stored controls (Ernst et al. 2003; Table 6.1). Ernst et al. (2003) postulated that fructans act as protection against the negative effects of low oxygen storage.
Bulb ABA concentration was not affected by the storage treatment, however, it is reported for the first time here that the ABA concentration in onions cv. SS1 significantly decreased, and a smaller decrease in cv. Renate occurred, between harvest and the beginning of storage. This represents the effect of the curing process on the biochemical characteristics of the bulb. Onion bulbs are dried and cured after harvest to tighten the skin around the neck which helps to protect them against pathogen attack (e.g. Botrytis allii causing neck rot), and to obtain an attractive skin finish (i.e. caramelisation of non-structural carbohydrates resulting in browner skins). Decreasing ABA concentration has been associated with onset of sprouting in a range of onion cultivars (Chapters 3, 4 and 5), and it was postulated that the ABA concentration before storage was positively correlated with storage life. There was no change in the ABA concentration of cv. Carlos during this time, and no sprouting was observed in this cultivar. This hypothesis can therefore be refined as ABA concentration at harvest seems to be a better indicator of storage potential. Furthermore, these results strongly indicate that the curing process (hot air, 30ºC, for nine days followed by ambient air for 2 weeks) is having an adverse effect on storage life as well as sugar composition, particularly in short-storing cultivars such as SS1.
6.6 Conclusion
Removal of bulbs from CA storage resulted in an immediate increase in respiration rate, which then returned to a lower rate after return to air conditions for 21 days. This is likely to represent a stress reaction, and in some cultivars such as the short-storing cv. SS1, could be sufficient to trigger the onset of sprouting and may account for the detrimental effect of CA storage on subsequent shelf-life reported by others. Further investigation
© 2006 Horticultural Development Council

168
into the delayed use of CA storage in terms of the optimum time to commence CA conditions would be beneficial.
The method of curing onion bulbs in the UK has changed little in the last 30 years, and is based on practices determined after experimentation on cultivars commercially important in the 1970s. Ongoing breeding programmes have continued to produce new cultivars, which means that the current practice may not be the most suitable and could in fact have an adverse effect on the storage life. The evidence for this comes from the decline in non-structural carbohydrate and ABA concentrations that were observed between harvesting and the beginning of storage. If best-practice in curing was re-evaluated (i.e reduced temperature and duration), there is the potential to increase storage life and to reduce energy costs.
© 2006 Horticultural Development Council
169
7.0 CHAPTER SEVEN
General discussion and conclusions
7.1 Discussion
Consumer demand for year-round supply of high quality onion bulbs has led to increasing competition from imports from the Southern Hemisphere during the months from March to September. There is increasing hostility from both consumers and retailers towards the use of synthetic chemicals in the production of food crops that leave a residue in the final product. This pressure to eliminate residues in food means that the future of the use of maleic hydrazide (MH) to suppress sprout growth in stored onions is uncertain. The loss of the principle method of sprout suppression in stored onions currently employed in the UK and other temperate countries will mean that onion growers may lose market share to foreign imports. This has highlighted the need for increasing the understanding of the mechanisms of onion bulb dormancy in order to generate new ideas for markers of storage potential and targets for manipulation in order to extend storage life.
Onion bulb dormancy is composed of two processes; dormancy induction and sprout suppression (Chapter 2, Section 2.3.3). Dormancy induction occurs in the field soon after maturation (Brewster, 1977b). The transition from true dormancy to sprout suppression follows, and it is the maintenance of this subsequent period of sprout suppression that is important in determining storage life. If an onion plant were left to over-winter in the field, once the true dormant period was over, the leaves laid down in the centre of the bulb just before harvest would begin to elongate as soon as environmental conditions were suitable. The same process can occur in stored onions and so it is essential that onions are stored in a dark, well ventilated environment to protect the bulbs from exposure to conditions
© 2006 Horticultural Development Council
170
conducive to sprout growth such as light and moisture. The mechanisms that bring about the breaking of true dormancy are likely to be initiated by a physiological trigger from inside the bulb, rather than an environmental cue. The state of sprout suppression is likely to be maintained by a combination of physiological processes and environmental cues.
Abscisic acid has been identified as part of the inhibitor complex present in onion bulbs (Tsukamoto et al., 1969) and has been demonstrated to play a functional role in maintenance of dormancy/sprout suppression in Allium wakegi (a cross between Japanese bunching onion and shallot) through the application of exogenous ABA and fluridone, an inhibitor of ABA biosynthesis (Yamazaki et al., 1999b). Application of 5 x 10⁻⁴ M (1M = 264.3 g l-1) exogenous ABA to A. wakegi bulbs increased the number of days to sprouting, whilst application of 0.25 x 10⁻⁴ M fluridone accelerated sprouting. Other studies have related a reduction in ABA concentration with loss of dormancy in onion (Matsubara and Kimura, 1991) and A. wakegi (Yamazaki et al., 1999a, Yamazaki et al., 1999b, Yamazaki et al., 1995). Soaking excised shoot apices of onion cv. Spartan Banner for one hour in ca.10-4 M ABA inhibited shoot growth relative to a water-soaked control (Mahotiere et al., 1976). It was postulated that ABA is of importance in controlling dormancy and sprout suppression, and thus storage life, in onion bulbs. To test this hypothesis, novel work to investigate the changes in bulb ABA concentration occurring during storage in onion (Allium cepa) cultivars with contrasting storage potential, and changes in other important biochemical and physical characteristics was undertaken in this thesis.
It was initially shown in Chapter 3 that ABA concentration in onion bulbs decreased during controlled atmosphere storage (3% CO2, 5% O2; 2ºC) in onion cultivars representing a range of storage potentials (Figure 3.3), and that the onset of sprouting occurred at minimal ABA concentration, ca. 50-120 ng g-1 DW (Chope et al., 2006). Onion bulbs of the early maturing cultivar (cv. SS1), which were subjected to a longer drying period than the other cultivars in the study, had a lower ABA concentration relative to the other cultivars prior to storage. It is possible that the reduction in ABA
© 2006 Horticultural Development Council
171
concentration was due to the extended exposure to high temperature during the drying period; however it may have been a factor of time. There was no universal threshold ABA concentration at which the onset of sprouting occurred in each cultivar. This could be a consequence of differences in sensitivity to ABA between cultivars. In dormant (cv. Kiharabansei No. 1) and non-dormant (cv. Ginoza) A. wakegi cultivars, ABA concentration increased during bulb development, reaching a maximum shortly after harvest and subsequently decreasing throughout the storage period (Yamazaki et al., 1999a). The maximum ABA concentration was lower in the dormant cultivar (26 ng g-1 FW) than the non-dormant cultivar (33 ng g-1 FW) of A. wakegi suggesting that the dormant cultivar responded to ABA at a lower concentration than the non-dormant one. In addition, sprouting in the dormant cultivar could be delayed by 35 days by soaking bulbs in an aqueous solution of 10-5 M ABA two weeks after harvest, whereas 10-4 M ABA was required to delay sprouting by 18 days in the non-dormant cultivar.
The rate of exponential decline in ABA concentration was similar in three cultivars with contrasting storage potential (cvs. SS1, Renate and Ailsa Craig) (Chapter 3; Chope et al., 2006), and therefore may not be as useful in predicting storage potential as the amount present before storage. Thus, it was suggested in Chapter 3 that increasing the preharvest ABA concentration in short storing cultivars could be a management strategy to delay sprouting in store.
Attempts to increase endogenous ABA concentration were made via application of exogenous ABA and an ABA analogue (8’-methylene ABA methyl ester; PBI-365) either as a preharvest foliar spray or as a postharvest bulb soak (Chapter 4). These experiments failed to increase endogenous ABA concentration, and so it was concluded that these methods of application of ABA or ABA analogues to onion crops in the field or to bulbs after harvest was not practical. Non-structural carbohydrates (fructose, glucose, suctose and total fructan) were measured in this study. Sprout growth requires energy and would therefore be expected to be associated with changes in carbohydrate metabolism. No straightforward relationships between non-
© 2006 Horticultural Development Council
172
structural carbohydrates (glucose, fructose, sucrose and total fructan) and ABA concentration could be identified in this thesis, leading to the conclusion that minimal ABA concentration could be a trigger for remobilisation of carbohydrates to provide energy for the growing sprout.
It is important that the quality of onion bulbs is maintained during storage so that a satisfactory product can be delivered to the consumer. A range of quality measurements can be made, including dry weight, firmness, TSS, and pyruvate concentration. Onion bulb dry weight was found to decrease during long-term storage which is in agreement with the literature (Hurst et al., 1985; Pak et al., 1995; Hansen, 1999). Firmness also decreased during storage (Chapters 3, 4 and 5), and was positively correlated with dry weight (Chapter 4). The decrease in dry weight and firmness was more pronounced in onions cv. SS1, probably due to fewer, thinner, layers of outer skin on onions of this cultivar which provided a less effective barrier to loss of water from the bulb.
Pyruvate concentration is used as an indicator of pungency of onion bulbs (Schwimmer and Weston, 1961; Schwimmer and Guadagni, 1962), and it is particularly important for mild onion cultivars which are marketed as an value-added product. However, onion flavour is complex and not simply determined by pungency; sweetness is also important (Crowther et al., 2005). Pyruvate concentration generally increased during storage, and so it is important that pungency is determined at the time of removal from storage as well as after harvest. The TSS % is commonly used as a measure of sugar content. Low dry matter onions (cv. SS1) tend to have a lower TSS % than high dry matter onions, but contain more glucose, sucrose and fructose, whereas high dry matter onions contain less glucose, sucrose and fructose, and are dominated by fructans. Therefore, TSS % is a very poor indicator of glucose, sucrose and fructose concentration, and consequently, of perceived sweetness (F. Davis and L. A. Terry, Cranfield University, unpublished data).
Recently, investigations have further elucidated the physiological control of dormancy in potatoes (Destefano-Beltrán et al., 2006a; Destefano-Beltrán et al., 2006b) and many parallels can be drawn between conclusions
© 2006 Horticultural Development Council
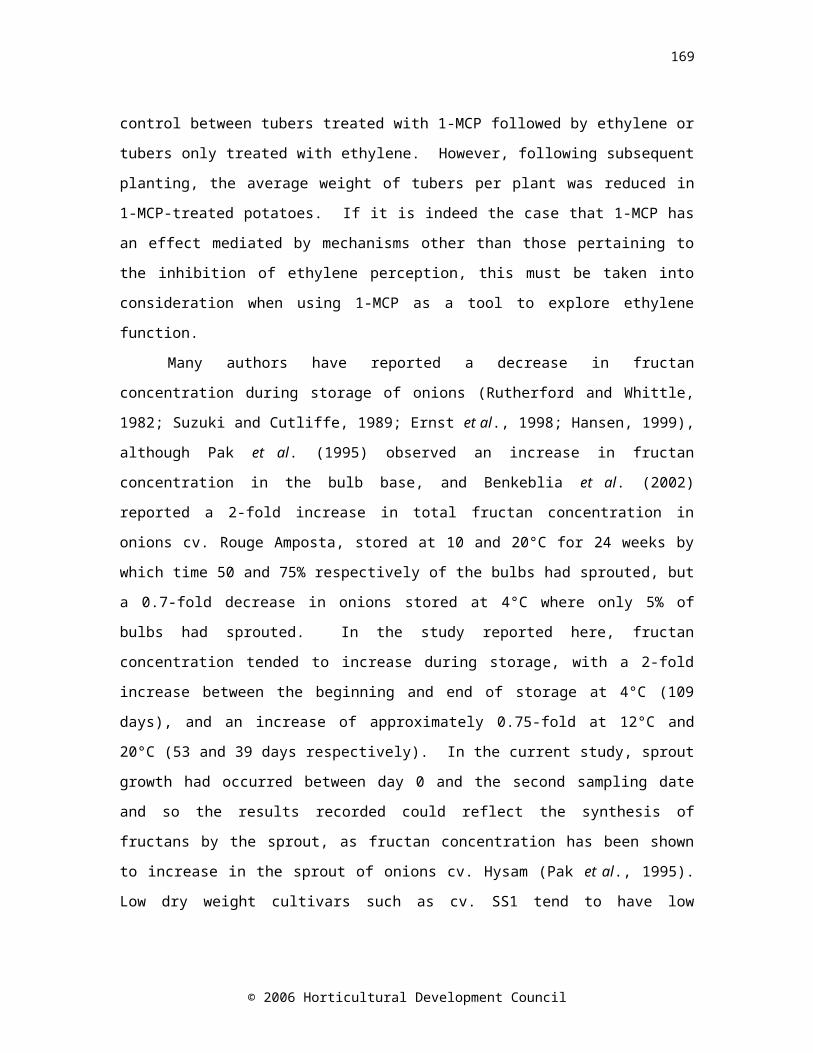
173
from these studies and the results presented in this thesis. Before comparisons between onion and potato can be made it is important to consider the similarities and differences between the two fresh produce types that may have implications on interpretation. Onions and potatoes both form underground storage organs (bulb and tuber) that undergo a dormant period when no growth can occur, and are important crop species comprising various cultivars displaying a range of potential storage lives. Storage life can be influenced by both pre- and postharvest factors, and the role of hormones in control of dormancy and sprouting is considered to be of importance. However, onions have a single growing point at the base of the bulb and potatoes have more than one growing point (eye) (Figure 7.1). Where onions have multiple layers of skin, potatoes only have one epidermis which is fused to the cortex. Onion bulbs store fructans whereas potato tubers store starch. Taking into account these similarities and differences between the two crops will allow considered conclusions to be drawn from studies concerning dormancy control.
Figure 7.1. Cross-section of a potato tuber.
© 2006 Horticultural Development Council
Inner medulla
Vascular ring eyeCortex
Periderm
Outer medulla
Bud or eye
EpidermisSkin
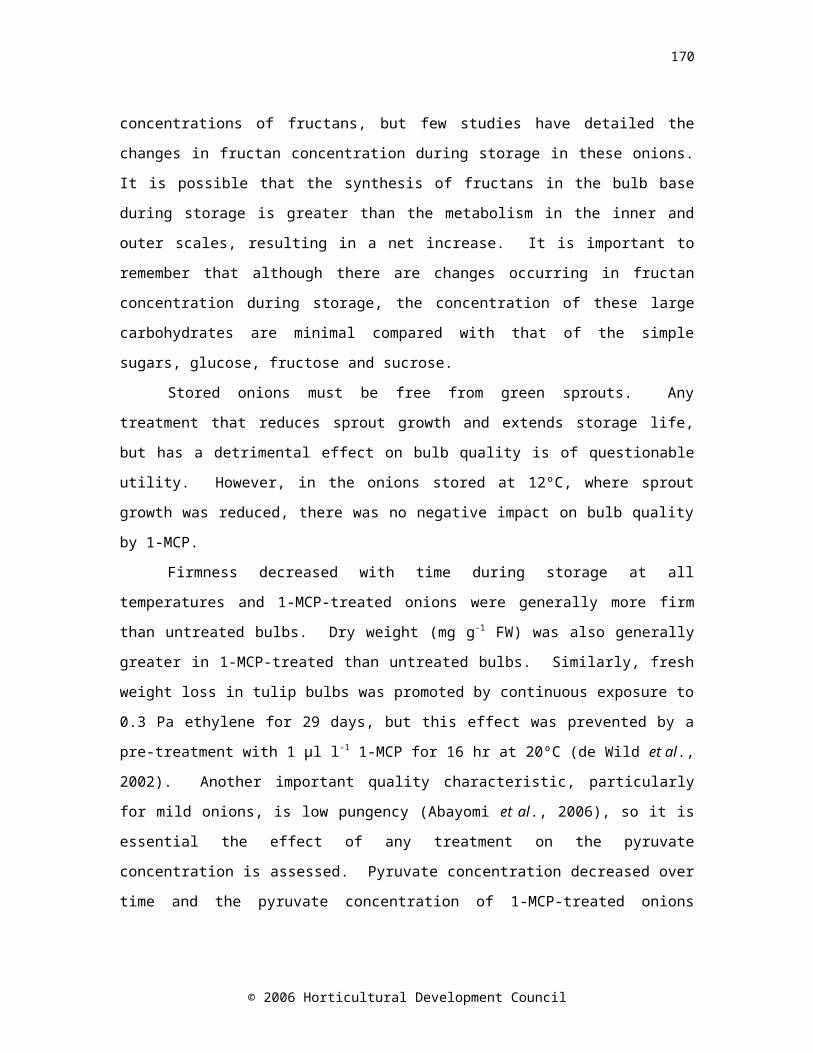
174
Links between ABA and dormancy/sprout suppression have been identified in potatoes (Suttle and Hultstrand, 1994; Destefano-Beltrán et al., 2006b). The ABA concentration in inner medulla tissue was greatest in freshly harvested potatoes (350-440 pmol g-1 FW), and declined during storage to 210-280 pmol g-1 FW after 24 weeks (Biemelt et al., 2000). The authors found no correlation between free ABA concentration and break of dormancy. However, ABA concentration was only measured after 6 and 24 weeks, so the results can only demonstrate that there is no universal threshold for ABA concentration in potatoes before sprouting occurs. It is also likely that this is the case in onions, as the minimal ABA concentration reached during storage before the occurrence of sprouting differed with cultivar (Chapters 3, 4, 5 and 6).
It is likely that dormancy and sprout suppression are under the control of a combination of factors, and in onions the role of ethylene in these processes is unknown. The interaction between ABA and ethylene depends on the tissue type and developmental stage. In Arapidopsis seeds (Beaudoin et al., 2000) and maize leaves (Voisin et al., 2006), ABA and ethylene act antagonistically, but in Arabidopsis roots they work synergistically (Beaudoin et al., 2000). A single dose of the ethylene perception inhibitor 1-MCP (1-methylcyclopropene) was shown to reduce sprout growth in short storage onions cv. SS1 (Chapter 5, Figure 5.1). The ABA concentration in treated and untreated bulbs was not different (Chapter 5, Figure 5.4). However, it was observed that higher concentrations of glucose, fructose and sucrose were maintained in 1-MCP-treated bulbs stored at 12°C (Chapter 5, Figure 5.5). Further investigation of the mechanism by which this occurred would be valuable, particularly since systems to maintain low levels of ethylene in onion stores have recently been marketed as a revolutionary new method to suppress sprout growth in stored onions (Johnson, 2006). The contrast between the use of ethylene to extend storage commercially, and the use of an inhibitor of ethylene perception to extend storage in the studies reported
© 2006 Horticultural Development Council
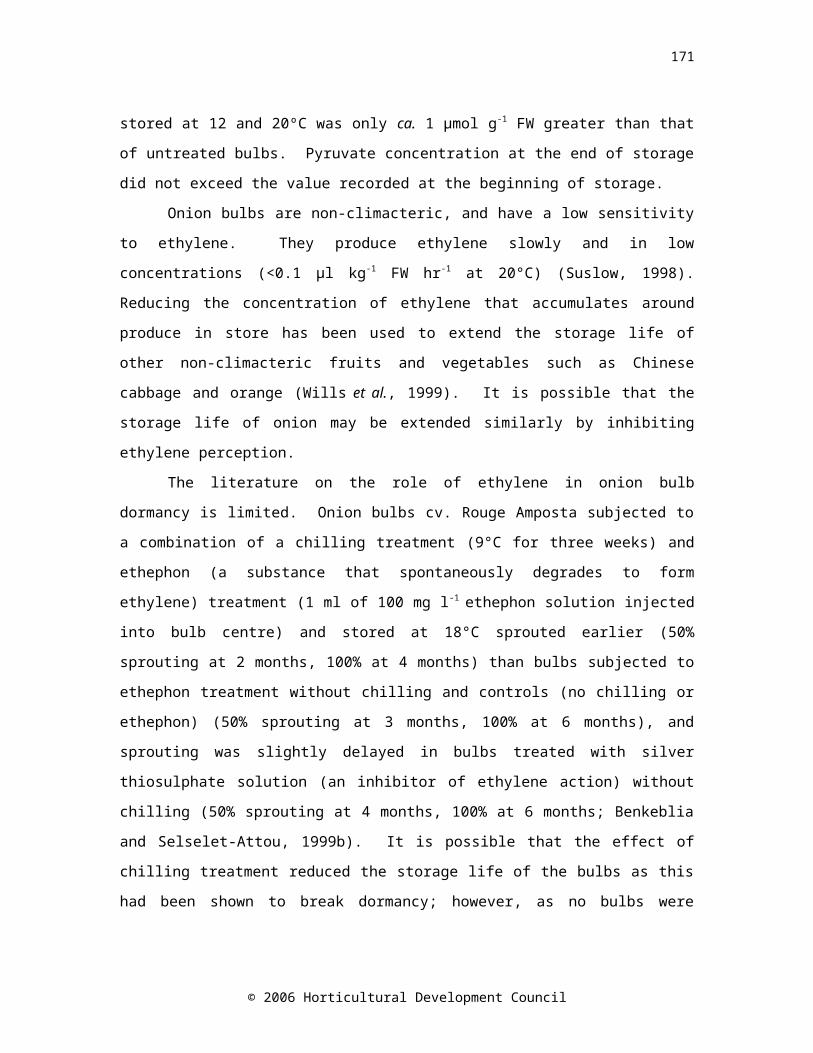
175
in this thesis demonstrates that there may be a dichotomy in the role that ethylene has to play in onion dormancy.
Potatoes are also low producers of ethylene (<0.1 µl kg -1 hr-1 at 20ºC), and have low sensitivity to ethylene (Suslow and Voss, 2002), but continuous (23-33 weeks) exposure to ethylene (4 µl l-1) has been shown to be an effective method of sprout control in potatoes (Prange et al., 2005). Increasing the concentration of ethylene to 40 µl l-1 increased inhibition of sprout growth, but not enough to justify the additional costs of applying this chemical in a commercial environment (Daniels-Lake et al., 2005). Exposure of stored potatoes to ethylene has the undesired side-effect of darkening the fry colour upon processing. This is caused by an accumulation of fructose and glucose in tubers stored in the presence of ethylene. Fry colour darkening can be prevented by application of 1-MCP (0.9 µl l-1) prior to ethylene exposure and at subsequent monthly or bimonthly intervals (Daniels-Lake et al., 2005). Thus, 1-MCP reduces the rate of ethylene-induced sugar accumulation in potato tubers. This contrasts with results reported in Chapter 5 where 1-MCP (1 µl l-1) treated onions stored at 12°C maintained a higher concentration of carbohydrates, probably due to reduced carbohydrate catabolism compared with untreated controls. It would be useful to study the carbohydrate concentration in onions bulbs exposed to continuous ethylene in store. If, as in potatoes, the sugar concentration rises then this could have a positive impact on taste perception and could be used as a marketing tool. Although ethylene can be used as a method of sprout control for potatoes, it reduces the true dormant period (defined by the number of days from planting to shoot emergence) in comparison with control tubers stored in air, or exposed to 1-MCP (1 µl l -1; 48 hr) at the beginning of storage (Pruski et al., 2006). Taken together, this suggests that ethylene breaks dormancy, but suppresses sprout elongation, and that 1-MCP may act differentially on different tissues, or impact on metabolic pathways other than those concerned with ethylene.
Both ABA and ethylene play a vital role in onion bulb dormancy and if understood in more detail there would be the potential to manipulate these
© 2006 Horticultural Development Council
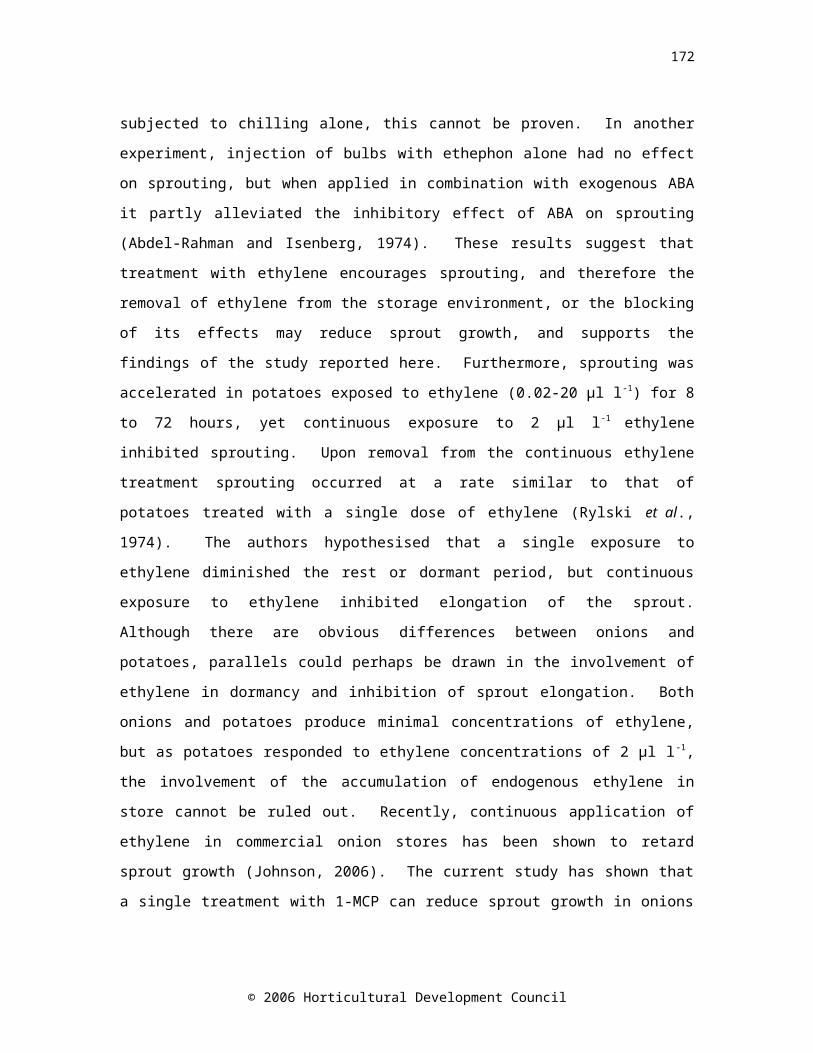
176
parameters in order extend to storage life. Onions are regarded as non-climacteric. Ripening in climacteric produce, such as bananas, is rapid and under the direct and obvious control of ethylene. The onset of ripening is a defined event and is marked by an increase in respiration and the evolution of ethylene gas. In non-climacteric produce ripening is a continuous but gradual process not related to an obvious or large ethylene burst, therefore, ethylene concentration was not measured in the 1-MCP study (Chapter 5). It would be a logical extension to this work to investigate the effects of 1-MCP on a range of cultivars and to monitor ethylene concentration throughout storage. In addition, measuring equipment with the sufficient resolution to detect ethylene concentrations in the parts per billion to parts per trillion range could yield interesting results since the threshold for ethylene action is thought to be well below 0.005 µl l-1 (Wills et al., 1999). The dichotomy between the effect of ethylene and 1-MCP has wider implications for other non-climacteric produce that produce low concentrations of ethylene and have previously been thought to be little affected by its presence in store. Indeed ethylene concentrations as low as 0.01 µl l-1 have been shown to reduce the storage life of Chinese cabbage stored at 0 and 20°C, oranges stored at 2.5°C, and a range of leafy vegetables including broccoli and chives stored at 5 and 20°C (Wills et al., 1999). Similarly by measuring ethylene concentration in the range of parts per billion, the ripening of strawberry fruit in vivo has been shown to have distinct patterns of ethylene production and regulation associated with different developmental stages, including an increase in ethylene production towards the end of the ripening process that corresponded with an increase in respiration rate (Ianetta et al., 2006).
Ethylene is involved in the wound response (Ecker, 1995; Wang et al., 2002). Wounding of the basal plate caused onion cv. Balstora and Hyton bulbs to sprout sooner than intact bulbs (Miedema, 1994b), and there is anecdotal evidence that a wounded onion in store will cause those around it to sprout (David O’Connor, Allium and Brassica Centre, pers. comm.). It is possible that this is due to the increased ethylene production caused by the wound response, although other physiological changes are also induced by
© 2006 Horticultural Development Council
177
this type of stress. Perhaps the use of the low dry matter, low pungency cultivar SS1 is the key to the results obtained in Chapter 5: onions cv. SS1 were found to have a lower ABA concentration than any other of the cultivars examined (Chapters 3, 4, 5 & 6), and it could be that this property i.e. low ABA concentration, allowed the onion bulb to respond to 1-MCP. Ethylene production by whole grapefruit was increased four days after treatment with 1-MCP (0.05 µl l-1 kg-1 hr-1) compared with untreated controls (0.005 µl l-1 kg-1
hr-1) (Mullins et al., 2000). However, the increase in ethylene production was observed soon after 1-MCP treatment and may therefore have been a transient effect. The authors concluded that as ethylene biosynthesis is under negative feedback control, the increase in ethylene concentration was caused by 1-MCP binding to ethylene binding proteins, thus blocking the negative feedback effect of ethylene on its own biosynthesis and leading to uncontrolled ethylene production. If 1-MCP also increases ethylene production in onions, this could explain the sprout inhibiting effect of 1-MCP as although 1-MCP binds to ethylene binding proteins, it is possible that more binding proteins can be produced, thus allowing perception of ethylene (Dauny et al., 2003). Alternatively, 1-MCP could bind to ethylene binding proteins in non-target tissue (i.e. non-meristematic tissue), causing elevated ethylene biosynthesis is these tissues which was perceived by ethylene binding proteins in the meristematic tissue. The biosynthesis and signal transduction of ethylene is discussed later (Section 7.2).
The effects of ethylene depend on the rate of various metabolic reactions and so keeping produce at low temperatures and low oxygen concentrations will reduce the response (Saltveit, 1999). Carbon dioxide is an inhibitor of ethylene biosynthesis (de Wild et al., 1999). As onion storage life is extended by CA storage, but is also extended by the use of continuous ethylene, it would be advantageous to monitor the levels of ethylene produced by onions in CA storage. It has been shown that the ethylene production of yellow onions bulbs was greater, 0.14 µl kg -1 hr-1, after short-term (<24 hr) exposure to 30% CO2 and 20% O2 than air, 10% CO2 and 20% O2 or 20% CO2 and 20% O2, 0.11 µl kg-1 hr-1 (Pal and Buescher, 1993). The
© 2006 Horticultural Development Council

178
authors concluded that this was probably an early response to physiological injury caused by the very high carbon dioxide concentrations. They detected no difference between air and the 10% and 20% CO2 atmospheres. However, Kubo et al. (1990) found no difference in the ethylene production of onion bulbs (unspecified Japanese cultivar) before and after exposure to 60% CO2
for 24 hr at 25°C, and recorded both rates as ‘trace’. It may be that the use of more sensitive equipment, such as laser photoacoustic spectroscopy (Ianetta et al., 2006), to measure the ethylene concentration would reveal small, but significant differences in ethylene production, during postharvest storage of onion bulbs.
Controlled atmosphere is used to extend onion storage life. It is thought this extension is due to a decrease in respiration rate. However, when onions are removed from CA storage, shelf-life can be compromised (David O’Connor, Allium and Brassica Centre, pers. comm.). When onion bulbs are transferred from CA storage into air, respiration rate is increased in comparison with those stored in air continuously (Chapter 6, Figure 6.1), however, the increase in respiration rate was not accompanied by a decrease in sugar concentrations. Is was therefore suggested that the increase in respiration rate (measured 2 hr after transition) was a transient response to the stress of being moved from CA into air, and that this may be sufficient to trigger the onset of sprout growth, particularly in short-storing onion, such as cv. SS1. Delaying the start of controlled atmosphere storage for 3 weeks was as effective at inhibiting sprout growth in onion cv. SS1 bulbs as 6 weeks continual CA storage (Chapter 6, Figure 6.2). The implications of this finding are discussed in Section 7.3. The study reported in Chapter 6 yielded additional results; ABA assays carried out on bulb samples immediately after harvest revealed a significant decrease in ABA concentration between the time of harvest and the beginning of storage (Chapter 6, Figure 6.5). This result strongly suggested that the high temperatures to which the onion bulbs were exposed during the curing period may have been responsible for a decrease in ABA concentration. If the hypothesis holds true that ABA concentration at harvest is correlated with storage life, then current curing
© 2006 Horticultural Development Council
179
techniques could be having a detrimental effect on storage life and/or dormancy. Furthermore, short-term (three weeks) high temperature postharvest treatments of 30-35ºC significantly reduced the number of days to sprouting in dry storage at 15ºC, when compared to those exposed to postharvest temperature treatments of 15-25ºC (Miedema, 1994a).
The question remains as to how to increase the endogenous ABA concentration in the bulb, since it is difficult achieve this via exogenous application (Chapter 4), and would also negate the issue of whether an exogenously applied hormone has the same effect as the endogenous hormone (Nemhauser et al., 2002). Also known as the drought hormone, ABA concentrations increase during periods of water stress. Irrigation could be withheld prior to bulb maturity, although this method may be impractical as it would have to be balanced with the decrease in yield that would occur as a result, and the occurrence of rainfall cannot be controlled. Drought-stressed onions (75% water deficit in the top 25 cm soil profile) matured earlier with increased dry matter concentration and reduced yield (Sorensen and Grevsen, 2001), but postharvest sprouting was inhibited compared to non-drought stressed bulbs. Bulb ABA concentration was not measured, but the increased storage life could have been due to elevated ABA concentration. Increased salinity and pH also have a role in increasing ABA concentration, but again there are considerations to be made concerning the most desirable growing conditions for the optimum crop yield and quality. This also implies that different soil types are likely to affect ABA concentration in onion bulbs prior to storage. It may be that harvest could be timed to optimise ABA concentration by testing the ABA concentration throughout growth. However, this is likely to be too costly as the only methods currently available for measuring ABA must be performed by trained personnel in the laboratory. The most likely solution may be to alter the curing practice (Section 7.3).
7.2 Recommendations for future experimental work
© 2006 Horticultural Development Council
180
In the future, the challenge of extending the storage life of onion bulbs without the use of sprout suppressants could be tackled using a genetic or molecular biological approach. This might involve identifying candidate genes involved in quality traits important to both growers and consumers and determining whether these traits could be separated from traits associated with the capacity for long-term storage. If this was possible, then marker assisted breeding programmes could be developed to produce new cultivars with desirable traits, such as low pungency (which is currently linked with poor storage life), which would maintain high quality over a longer storage period.
Genomes within the Alliums are large (King et al., 1998). Onions are diploid (2n=16), with an estimated nuclear genome size of 15 290-15 797 Mbp per 1C, and a 2C DNA amount of 31.69 - 33.2 pg (Arumuganathan and Earle, 1991; Ricroch and Brown, 1997). This is 6, 16 and 107 times larger than maize, tomato and Arabidopsis, respectively (King et al., 1998). The guanine-cytosine (GC) content is a characteristic of a genome which is sometimes used to classify organisms taxonomically. Genes tend to have a higher GC content than the rest of the genome. The GC content of the A. cepa genome is ca. 37% (Kirk et al., 1970, Ricroch and Brown, 1997). There is a paucity of public genetic information on onion or any other Allium crops. Some key genes in the sulphur assimilation pathway have been cloned (McCallum et al., 2002) and recently, a set of over 10 000 onion expressed sequence tags has become available (Kuhl et al., 2004). However, biochemical and molecular investigation are required before the exact function of these genes and the proteins they encode can be assigned (Jones et al., 2004).
Some genetic studies have already been carried out in onions. A low density genetic map has been produced consisting of 116 markers on 12 linkage groups and covering 1064 cM, with an average distance of 9.2 cM between loci (King et al., 1998). Significant positive, genetic and phenotypic correlations have been found among total soluble solids, dry matter, pungency and onion induced anti-platelet activity (Galmarini et al., 2001).
© 2006 Horticultural Development Council
181
More recently, the map has been expanded to include an extra 10 markers and now spans more 1907 cM and all eight chromosomes (Martin et al., 2005). This genetic map has been used with quantitative trait loci (QTL) analysis to identify a locus (Frc) that affects bulb fructan content to chromosome 8 (McCallum et al., 2006).
Advances in the field of molecular biology have meant that higher throughput techniques, such as microarrays are available. It would be beneficial to assess molecular markers of sprout suppression and dormancy in conjunction with physical and biochemical traits, as this will further elucidate the genetic mechanisms underlying these physiological processes. Microarray technology would allow simultaneous screening of thousands of onion genes. The expression of these genes could then be compared with desirable bulb traits. In addition, this technique would reveal classes of genes whose expression alters during different environmental, temporal or spatial conditions.
There are two possible approaches to producing a microarray chip suitable for this use. Highly detailed genetic information on model plants is available in public databases. Nevertheless, there is a limit to the validity of the application of data from model plants to crop species (Havey, 2004). Genetic resources for other important crop species, such as rice, are also available, however there are important differences between the Poales to which rice belongs, and the Asparagales, to which onion belongs (Kuhl et al., 2004) which mean that a microarray constructed using sequences from rice would be unlikely to be a total success. The second option would be to construct an onion-specific microarray. There are 11,726 unique sequences available on the TIGR database (The Institute for Genomic Research, 2003), of which 3838 have tentative consensus (TC) status, and have been allocated unique 70-mer oligonucleotide sequence suitable for construction of microarrays (Richmond and Somerville, 2000). This collection of 3838 oligonucleotides could be expanded by mining genomic databases, and adding specific genes related to dormancy such as ABA and ethylene metabolism and signaling, and carbohydrate metabolism. In cases where
© 2006 Horticultural Development Council
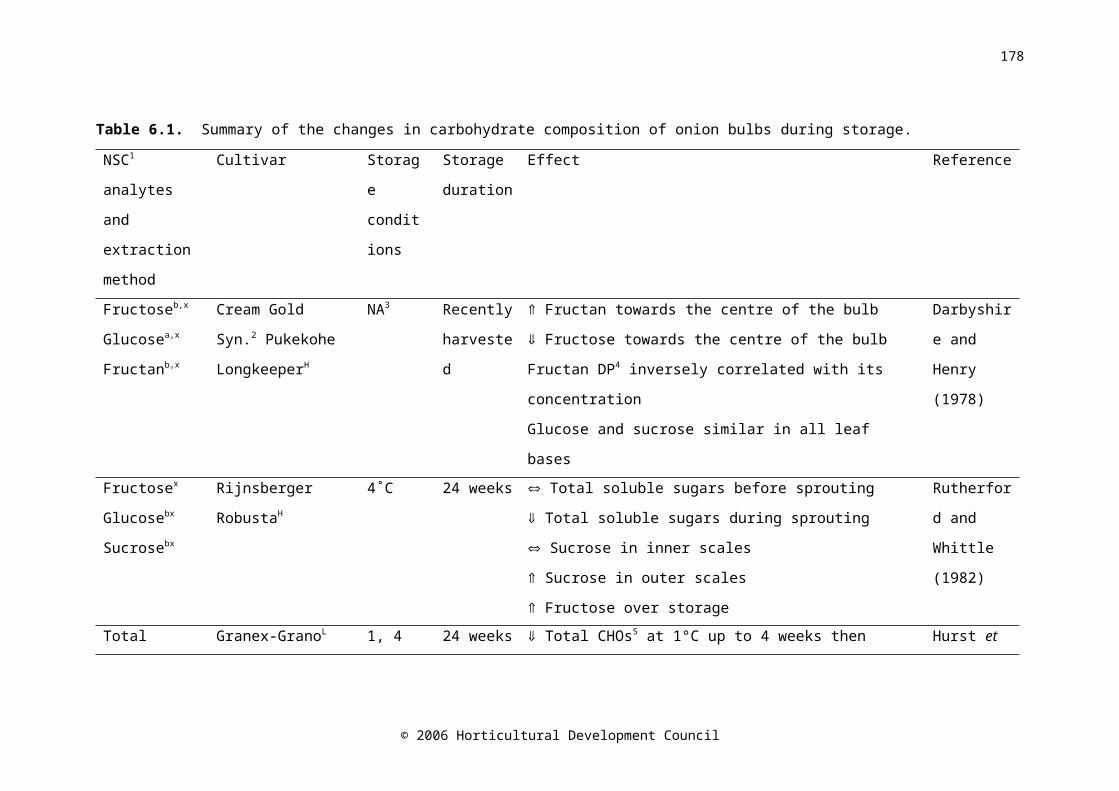
182
these target genes could not be located on public databases, genes identified by RT-PCR using degenerate primers designed from sequences aligned from other monocotyledonous species could be added. Microarray analysis should be accompanied by detailed metabolomic profiling, as it is likely that post-transcriptional regulation of proteins occurs.
A complex chemical profile including substances such as ABA and ABA metabolites, compounds concerned with sulphur and carbohydrate metabolism as well as the parameters measured in the current study (pyruvate, fructan, fructose, glucose, sucrose, TSS) would allow the application of chemometrics to the gene expression data. Chemometrics is a statistical technique whereby the chemical data collected can be related to the physiological state (Prazen, 2005). In this way it is anticipated that the use of metabolomic profiling in conjunction with microarray technology could identify the factors that are important in the transition from dormancy induction to sprout suppression. The onset of sprouting occurs at different times in different cultivars, and there is also considerable variation within cultivars. In potatoes this issue was overcome with the use of bromoethane (BE) which chemically induced premature breaking of dormancy (Destefano-Beltrán et al., 2006a). If a similar treatment could be applied to onions then this would be advantageous as it would be possible to control when the break of dormancy occurred. However, consideration would have to be made as to whether the chemically-induced dormancy break occurred via the same mechanisms as the natural process.
Potentially, diagnostic microarray chips based on a reduced number of specific sets of genes that were related to specific physiological stages and/or quality traits could be developed. Mass production of these slides would reduce the costs involved. Diagnostic tests that could predict sprouting would be beneficial for growers to predict both the storage life and the shelf life of the crop. The chip could also be used as a replacement in the future for time consuming full biochemical and physical profiling, but microarray analysis would need to be carried out in the laboratory. If sets of genes that were differentially expressed on sprouting were identified then transcription
© 2006 Horticultural Development Council
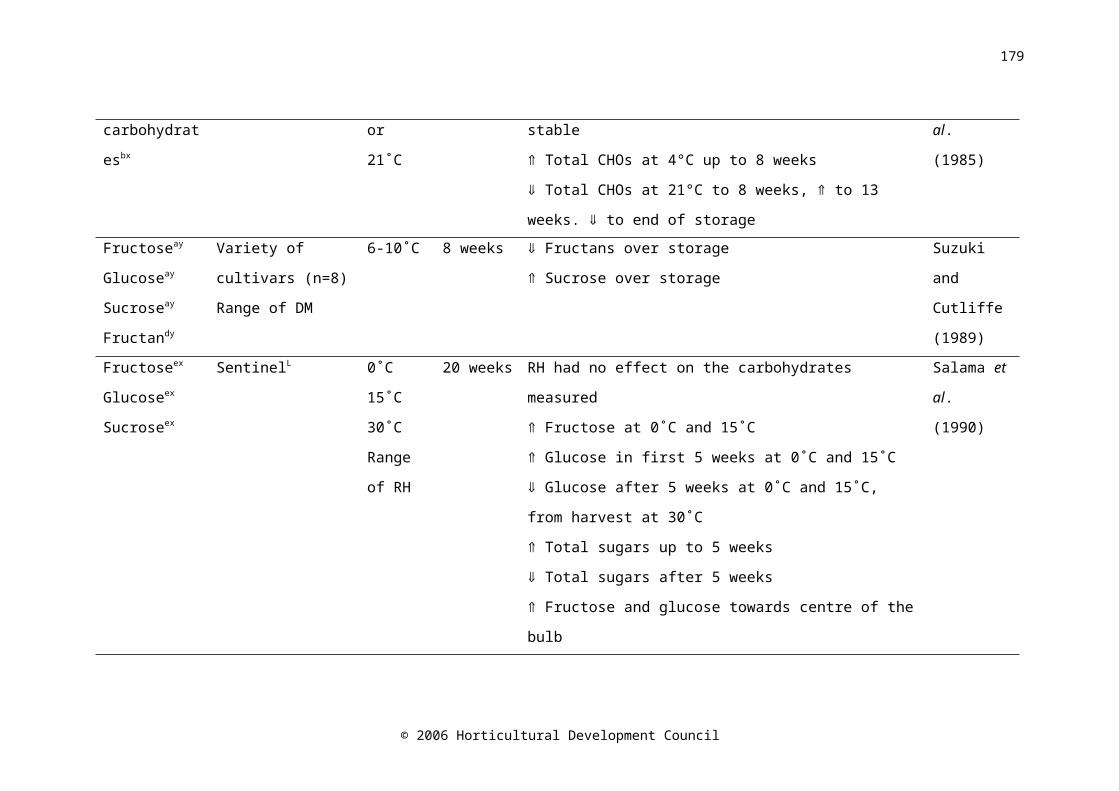
183
factors that control the initial stages of meristematic activity could be targets for genetic modification. However, this approach may be problematic, because if re-growth was delayed indefinitely then seeds or sets could not be produced from the modified bulbs. Also there is still considerable consumer hostility towards genetically modified crops.
Abscisic acid has clearly been identified as playing an important role in onion storage (Chapters 3, 4, 5 and 6). Therefore, the mechanisms controlling ABA concentration within the bulb during the different physiological stages in stored onions should be investigated in more detail. The concentration of ABA in any system is a result of a balance between transport, synthesis and catabolism (Taylor et al., 2005; Zaharia et al., 2005). An onion bulb is essentially a closed system, and so transport is unlikely to be a factor. The pathways involved in ABA biosynthesis and catabolism have been discussed in Chapter 2, Section 2.9.6, but in order to understand the molecular mechanisms, the genes and enzymes involved in ABA biosynthesis and catabolism must be studied in more detail (Figure 7.2). The information from Arapidopsis in terms of the biosynthetic pathway can be applied to other plant species, as both the pathway and the genes involved are highly conserved in angiosperms (Xiong and Zhu, 2003).
© 2006 Horticultural Development Council
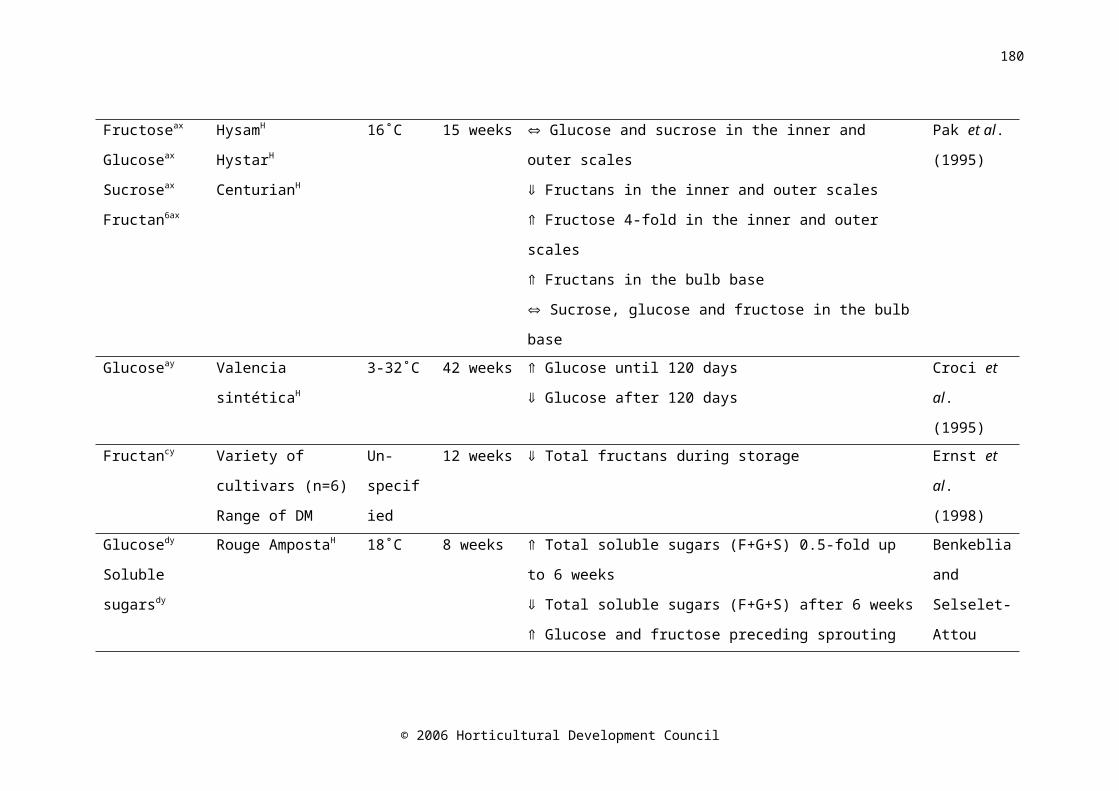
184
Figure 7.2. Summary of the pathways involved in ABA biosynthesis and catabolism. Dashed arrow indicates export of xanthoxin from the plastid to the cytosol. ZEP=zeaxanthin epoxydase, NCED=nine cis-epoxycarotenoid dioxygenase; SDR=short chain alcohol dehydrogenase/reductase; AAO=abscisic aldehyde dehydrogenase; ABA=abscisic acid; PA=phaseic acid; DPA=dihydrophaseic acid (Nambara and Marion-Poll, 2005; Taylor et al., 2005).
© 2006 Horticultural Development Council
NCED
zeaxanthin
xanthoxin
xanthoxin
SDR
abscisic aldehyde
9´ cis-epoxycarotenoids(9´ cis-neoxanthin)(9´ cis-violaxanthin)
ABAAAO
violaxanthin
ZEP
8’-OH-ABA
PA
ABA 8´-hydoxylase
DPA
PLASTID CYTOSOL
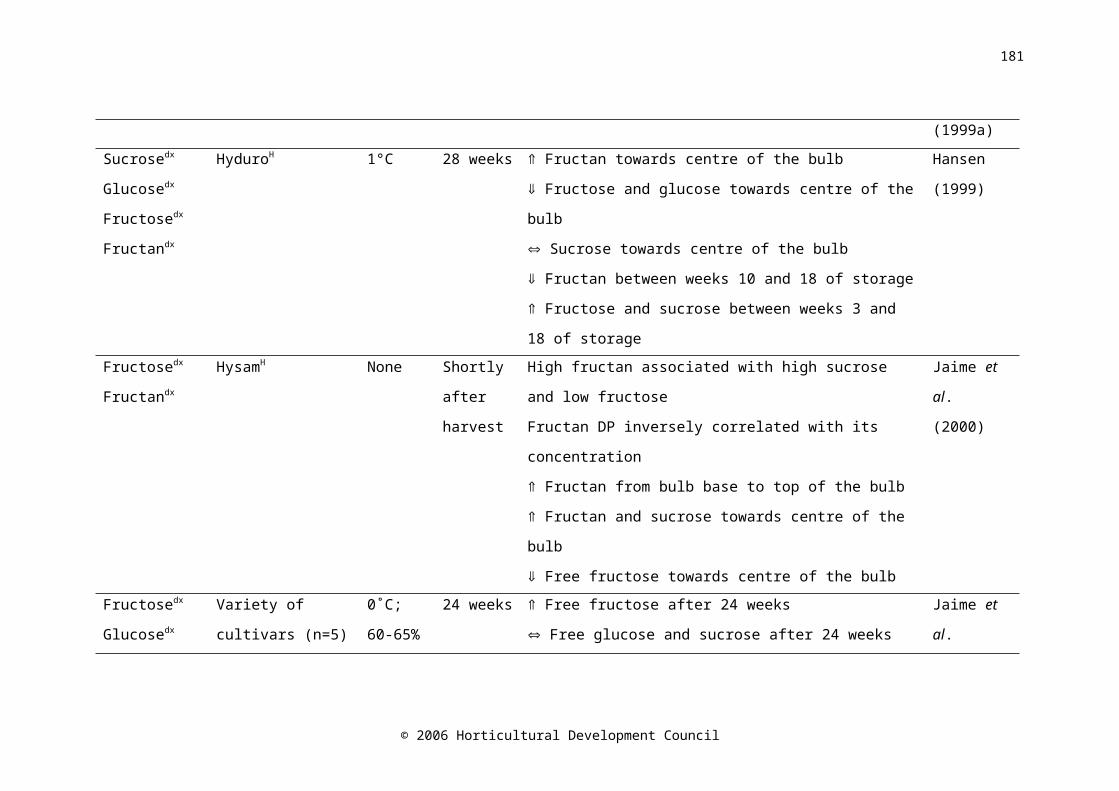
185
The first 15C intermediate in the ABA biosynthesis pathway is xanthoxin, whose synthesis begins with the cleavage of a 40C oxygenated carotenoid precursor and ends with the conversion of 9’-cis-neoxanthin to xanthoxin which is catalysed by nine-cis-epoxycarotenoid dioxygenase (NCED) (Xiong and Zhu, 2003). The formation of xanthoxin takes place within the plastid, from where it is exported into the cytosol. All remaining steps in the pathway occur in the cytoplasm (Taylor et al., 2005). The reaction catalysed by NCED is thought to be the key rate limiting step (Thompson et al., 2000). Early reactions in the pathway to ABA biosynthesis are important to maintain a supply of precursors, so in order to increase ABA biosynthesis in non-photosynthetic tissue, the over-expression of genes controlling the NCED pathway may need to be combined with the over-expression of upstream pathways. A short chain alcohol dehydrogenase/reductase (SDR) catalyses the conversion of xanthoxin to abscisic aldehyde. In Arabidopsis seeds SDR is induced by sugar but not by osmotic stress or ABA (Xiong and Zhu, 2003). Nine NCED related sequences have been identified in Arapidopsis, of which five are probably involved in ABA metabolism (Nambara and Marion-Poll, 2005).
The catabolism of ABA can be split into two categories; hydroxylation and conjugation, of which the former is the most important (Nambara and Marion-Poll, 2005). Hydroxylation is followed by further inactivation, and the major source is hydroxylation at the C8 position. The main ABA catabolites are phaseic acid (PA) and dihydrophaseic acid (DPA). Phaseic acid has minimal biological activity, whereas DPA has none.
In unstressed plants, the vascular tissue is likely to be the main site of ABA biosynthesis, which is then transported to target cells such as stomata (Nambara and Marion-Poll, 2005), or in the case of onions, to the bulb tissue throughout growth. In seeds, dormancy loss is due to a suppression of de novo synthesis and activation of catabolism and this is also likely to be the case in bulbs. The genes and proteins involved in ABA biosynthesis are better characterised than those associated with its degradation. Recently, Arabidopsis thalinana CYP707A genes have been shown to encode (+)-ABA-
© 2006 Horticultural Development Council
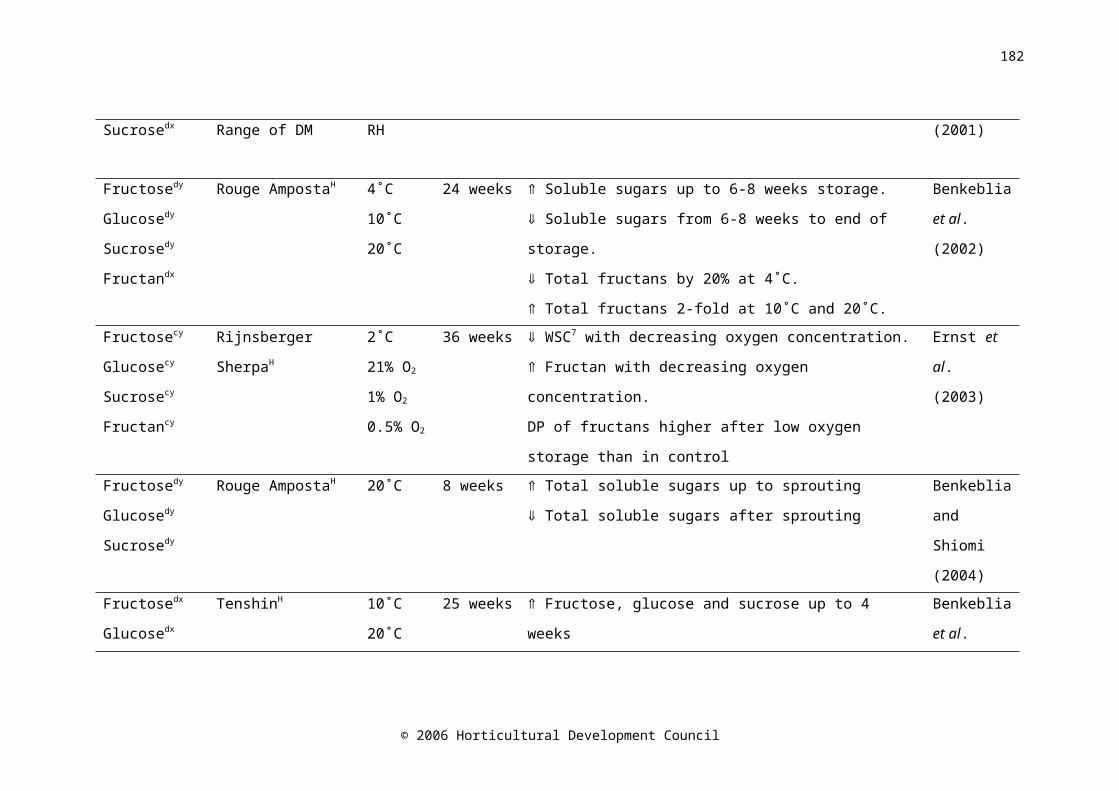
186
8’hydroxylase, which is capable of catalysing the hydroxylation of ABA to 8’-hydroxy ABA when expressed in in vitro cell culture systems (Saito et al., 2004). This multi-gene family exists in many monocotyledons and dicotyledons (Saito et al., 2004). This means that the chances of cloning this gene family from onion, for use in constructing a microarray, will be high.
In light of the results from Chapter 5, further investigation of the genes involved in ethylene metabolism would also be useful. The ethylene biosynthesis pathway is well characterised and is summarised in Figure 7.3. Ethylene is a simple hydrocarbon that is synthesized from methionine. The first committed step in ethylene biosynthesis is the conversion of S-adenosyl-L-methionine (SAM) into 1-amino-cyclopropane-1-carboxylic acid (ACC) catalysed by ACC synthase (Ecker, 1995). This is also thought to be the key rate limiting step. The final stage is the oxidation of ACC by ACC oxidase which results in the production of ethylene along with cyanide and carbon dioxide. Cyanide is detoxified by conversion to β-cyanoalanine by β-cyanoalanine synthase. A pool of methionine is maintained by the conversion of 5’-methylthioadenosine (MTA), produced from the SAM synthase reaction, back into methionine (Wang et al., 2002).
© 2006 Horticultural Development Council
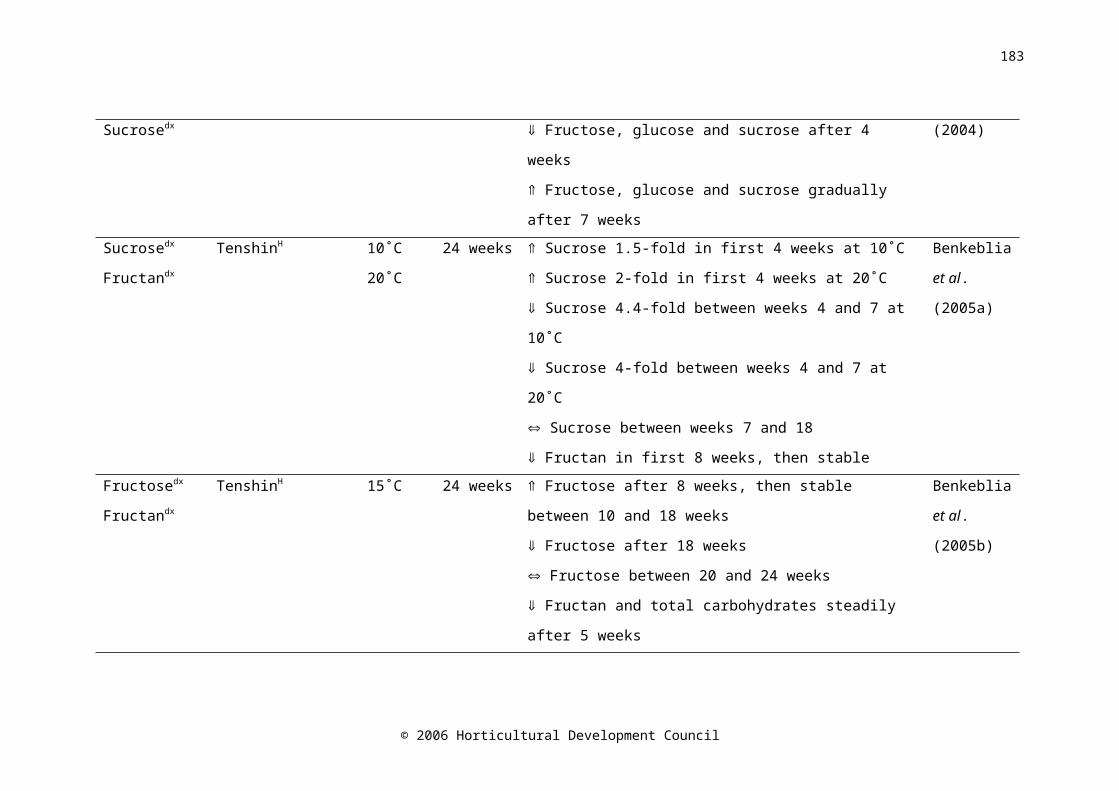
187
Figure 7.3. Simplified pathway of ethylene biosynthesis. SAM=S-adenosyl-L-methionine, MTA=5’-methylthioadenosine, ACC=1-amino-cyclopropane-1-carboxylic acid (Ecker, 1995; Wang et al., 2002).
The ACS (ACC synthase) genes are part of a multi gene family, and many ACS genes from different plant species have been identified and cloned (Wang et al., 2002). Both positive and negative feedback mechanisms for the regulation of ethylene biosynthesis have been identified (Saltveit, 1999). It is likely that the explanation for different feedback mechanisms is due to differential regulation of different genes in the family (Wang et al., 2002). For example, negative feedback occurs in non-climacteric fruit, and positive feedback occurs in climacteric fruit (Saltveit, 1999). Different genes could be expressed in different tissues and at different times, thus allowing for spatial and temporal variation (Wang et al., 2002). There is also evidence of post-transcriptional regulation. This emphasizes the importance of making biochemical measurements, such as ethylene and ABA concentration, in
© 2006 Horticultural Development Council
Methionine
SAM + MTA
ACC
Ethylene + CO2 + HCN
Protein synthesis
SAM synthase
ACC synthase
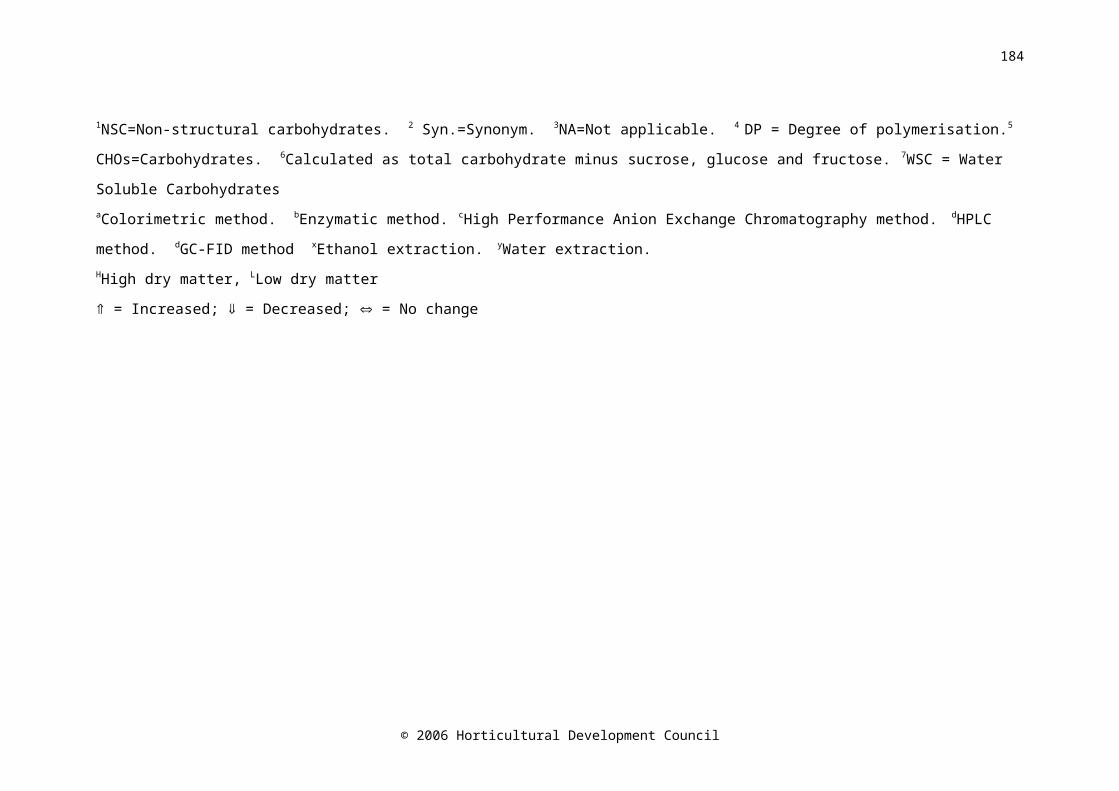
188
conjunction with genetic analysis. Ethylene perception is via membrane localized proteins, of which five have been identified in Arabidopsis thaliana.
The importance of ABA in onion bulb dormancy has been shown, and the evidence for this would be further strengthened through the use of inhibitors of ABA activity or the use of compounds that inhibit breakdown of ABA. Recently, new inhibitors of ABA degradation have been discovered and developed including competitive inhibitors that are powerful ABA agonists and suicide substrates (Cutler et al., 2000). Unicazole inhibits degradation of ABA 8’-hydroxylase, but also other cytochrome P450 enzymes such as those involved in gibberellin synthesis (Saito et al., 2006). However Araki et al. (2006) have developed a non-azole inhibitor of ABA 8’-hydroxylase which has the additional benefits of specificity and having no ABA-like activity (Araki et al., 2006). Tools to investigate the effects of reduced ABA concentration include abamine (ABA biosynthesis inhibitor with an amine moiety) which inhibits NCED by competitive inhibition (Han et al., 2004), and the more potent and specific abamineSG (Kitahata et al., 2006).
As the use of a microarray allows the analysis of many genes at once, and physiological processes are likely to be a result of the interaction of many factors, then it would be useful to also study the genes involved with the metabolism of other plant hormones including auxin, cytokinins and gibberellins (Kuraishi et al., 1989; Mahotiere et al., 1989; Miedema and Kamminga, 1994; Yamazaki et al., 2002). Resources for this type of study are being built up in the form of lists of genes that are up- or down regulated by the application of these hormones (Nemhauser et al., 2006).
7.3 Implications for growers
In light of rising energy costs (the cost of commercial electricity increased by ca. 50%, and gas by ca. 65% between 2005 and 2006; Department of Trade and Industry, 2006) any reduction in the amount of gas and electricity used in the curing, drying and storage of onions would be
© 2006 Horticultural Development Council
189
desirable to industry. Current UK practice aims to remove surface moisture within three days of loading the store by heating at 30ºC, followed by a further ten days at 24ºC (RH not to exceed 75%). The crop is then allowed to cool to approximately 15ºC, with ventilation, for a few days until the necks are tight and dry. The temperature can then be slowly reduced until the desired long-term storage temperature is reached. The curing and drying procedure is based on a method developed in the 1970s (Shipway, 1977; O’Connor and Shipway, 1978), and therefore the research that formed the basis of this procedure was carried out on cultivars that are very different from those used today. Thus, it is likely that alterations to current methods, such as a reduction in the temperature and duration of the curing and drying periods would deliver benefits in the form of energy savings and reduced carbon emissions, while still producing onion bulbs of a satisfactory quality standard. As previously mentioned, the concentration of ABA at the beginning of the storage period appeared to be a good marker of storage potential of onion bulbs. Bulb ABA concentration decreased during curing, and therefore ABA concentration would be a very useful parameter to monitor during different curing and drying regimes. This could then lead to the breeding of improved onion cultivars that perform better under more efficient curing regimes.
The role of ethylene in sprouting is complex and of current interest because ethylene generating systems are currently being installed in commercial onion storage facilities (Johnson, 2006). Continual long-term exposure to ethylene (10 µl l-1) has been shown to be effective in reducing sprouting in stored onion bulbs. This contrasts with the results presented here for onion cv. SS1 bulbs treated with the ethylene inhibitor 1-MCP. The involvement of ethylene in onion bulb dormancy certainly requires further investigation and suggests that there are several mechanisms involved. The introduction of new cultural practices such as altering the curing regime may influence the effect of ethylene on onion quality. While there is a wealth of literature on the role of ethylene in climacteric produce, there is little on that of ethylene (or 1-MCP) in non-climacteric systems. It is recommended that 1-
© 2006 Horticultural Development Council
190
MCP be used as a tool to help elucidate the mechanisms by which continual exposure to ethylene reduces sprout growth in some onion cultivars. It is also likely that this research would have the potential to increase the efficiency and optimise the application of ethylene to the crop either in terms of more precise timing of application or perhaps using pulsed treatment rather than continual application thus reducing the cost.
The finding that the respiration rate of onion bulbs increased on transfer from CA to air (Chapter 6) has implications for the shelf-life of onions following CA storage. Removal of onions from storage in environments with continual elevated ethylene concentrations may have a similar effect on respiration rate. Monitoring of the respiration rate in onions stored in these conditions and then transferred to air would help to detail how shelf-life is affected following ethylene treatment. It was shown in Chapter 6 that storage of onions cv. SS1 in air for three weeks, followed by three weeks CA storage achieved a level of sprout suppression equal to that achieved using six weeks continuous CA storage. Further investigation into the effects of the delaying the start of CA storage has the potential to reduce the costs associated with this storage method while not compromising on effectiveness.
7.4 Project conclusions
The project objectives were set out in Chapter 1, Section 1.2.2. A brief summary of the conclusions of the project in terms of the objectives is below.
To determine if differences exist in the initial concentrations and/or rate of degradation of abscisic acid (ABA) in bulbs of onion cultivars with different storage potential. There was a difference in the ABA concentration recorded before storage in long and medium-storing onions (cvs. Renate and Ailsa Craig) and short-storing onions (cv. SS1).
© 2006 Horticultural Development Council
191
The rate of degradation during storage was the same for each cultivar (Chapter 3).
To determine if the remobilisation of carbohydrates is affected by, and correlated with, the concentration of ABA. No straightforward relationship between ABA concentration and the remobilisation of NSCs (glucose, sucrose, fructose and total fructan) could be identified (Chapters 4, 5 and 6). It was postulated that minimal ABA concentration acted as a trigger for remobilization of carbohydrates.
To verify the effect, if any, on storage potential of bulb ABA concentration using a chemical analogue of ABA. An analogue of ABA (8’-methylene ABA methyl ester; PBI-365) was applied as a preharvest foliar spray and postharvest bulb soak, however, endogenous bulb ABA concentration was not affected, and there was no consistent effect of treatment on storage life or any of the quality parameters measured.
To determine the effect of an ethylene inhibitor on onion storage life. An ethylene perception inhibitor (1-MCP) was applied to onions cv. SS1, and reduced sprout growth when bulbs were subsequently stored at 4 or 12°C (Chapter 5).
To determine the effect of the transition between controlled atmosphere storage and air on bulbs of onion cultivars with different storage potential. Respiration rate of three cultivars (viz. Renate, Carlos and SS1) increased on removal from CA storage. Glucose concentration was found to be highest in sprouted bulbs cv. SS1 (Chapter 6).
To relate the observations made to the potential to influence storage life by changes in horticultural practices. Curing was suggested to have detrimental effects on ABA concentration and therefore also on storage life. Therefore it was recommended that current curing practices be investigated and altered (Chapters 6 and 7). Delaying the start of CA storage of onions cv. SS1 by three weeks was found to be as effective at controlling sprout growth as six weeks continuous CA storage. This has the potential to reduce the costs associated with CA
© 2006 Horticultural Development Council
192
storage (Chapters 6 and 7). Recently, elevated ethylene has been used to prolong the storage life of stored onions. This contrasts with the work on 1-MCP reported here, and so investigation into the mode of action of 1-MCP is recommended, along with further testing of 1-MCP (Chapters 5 and 7).
© 2006 Horticultural Development Council
193
TECHNOLOGY TRANSFER
Results from this project have been presented, published and submitted for publication as follows:
Articles in grower publications: Chope, G. A. (2004). Better onions in store. HDC News, July. Chope, G. A. (2005). Storing onions: the physiology of dormancy. The
Vegetable Farmer, November, 25-26.
Presentations at grower events: Onion and Carrot Conference, Cambridge, November 2003 Onion and Carrot Conference, Peterborough, November 2007
Presentations at scientific conferences: Chope, G. A., Terry, L. A. and White, P. J. (2005). Temporal changes in
abscisic acid concentration in onion bulbs during controlled atmosphere storage. In: Frutic 05, Information and technology for sustainable fruit and vegetable production, 12-16 September 2005, Montpellier, France. Oral presentation.
A poster was presented at the Advances in Applied Biology (AAB) Centennial Conference – Advances in Applied Biology: Providing New Opportunities for Consumers and Producers in the 21st Century. 15-17 December 2004, Oxford.
Publications in scientific journals: Chope, G. A., Terry, L. A. and White, P. J. Neither pre- nor postharvest
application of exogenous abscisic acid (ABA) or an ABA analogue affects endogenous ABA concentration of onion bulbs. Plant Growth Regulation. Accepted for publication on 18 January 2007.
Chope, G. A., Terry, L. A. and White, P. J. (2007). The effect of 1-methylcyclopropene (1-MCP) on the physical and biochemical
© 2006 Horticultural Development Council

194
characteristics of onion cv. SS1 bulbs during storage. Postharvest Biology and Technology. In press.
Davis, F., Terry, L. A., Chope, G. A. and Faul, C. J. The effect of extraction procedure on measured sugar concentrations in onion (Allium cepa L.) bulbs. Journal of Agricultural and Food Chemistry. Submitted on 3 November 2006.
Chope, G. A., Terry, L. A. and White, P. J. (2007). The effect of the transition between controlled atmosphere and regular atmosphere storage on bulbs of onion cultivars SS1, Carlos and Renate. Postharvest Biology and Technology. In press.
The results from this project have formed the foundation of a recent successful application to DEFRA HortLINK entitled ‘HL0182 - Sustaining UK fresh onion supply by improving consumer acceptability, quality and availability’.
© 2006 Horticultural Development Council
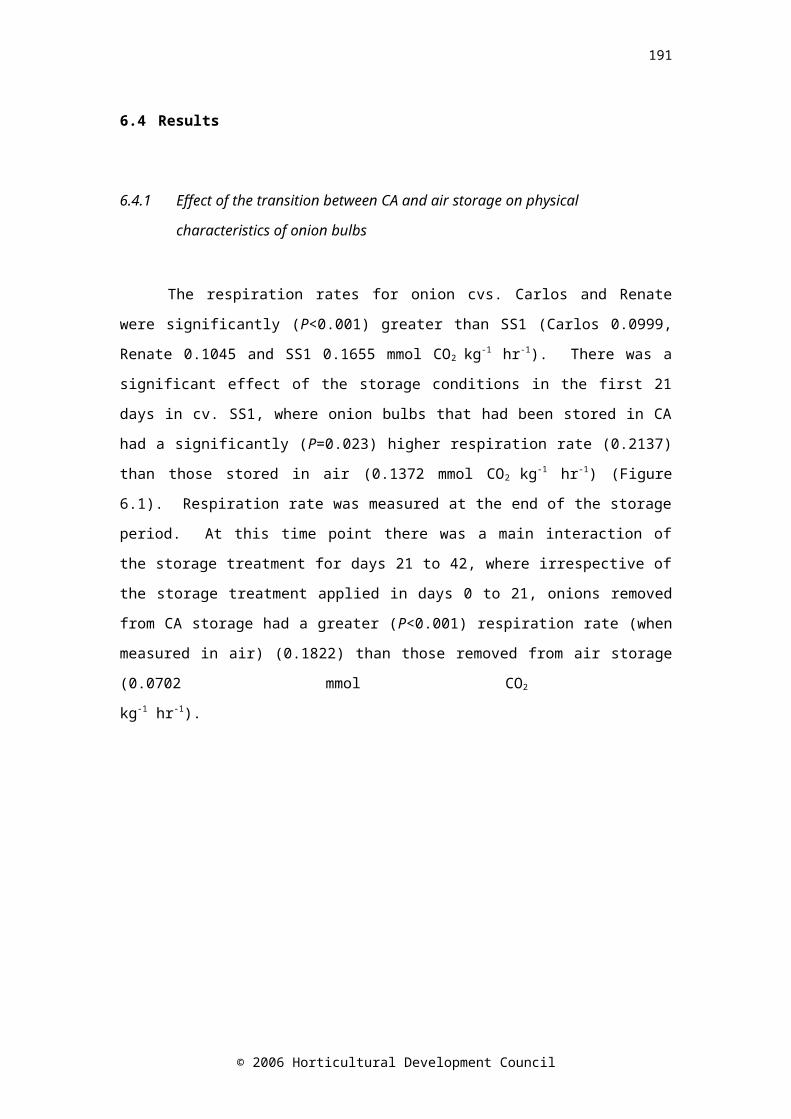
195
GLOSSARY
< less than> greater than≤ less than or equal to≥ greater than or equal to% per cent= equals°C degree Celsiusβ betaγ gammaμl microlitreμM micromolarμmol micromoles1-MCP 1-methycyclopropeneAACC American Association of Cereal ScientistsAAO abscisic aldehyde dehydrogenaseABA abscisic acidABU arbitrary unitACC 1-amino-cyclopropane-1-carboxylic acidACSO S-alk(en)yl-L-cysteine sulphoxideADAS Agricultural Development and Advisory ServiceANOVA Analysis of VarianceAOAC Association of Analytical Communities BCPC British Crop Production CouncilBOC British Oxygen CompanyCA controlled atmosphereca. approximatelyCa calciumCaCl2 calcium chlorideCEPA 2- chloroethylphosphonic acidCHO carbohydrate
© 2006 Horticultural Development Council
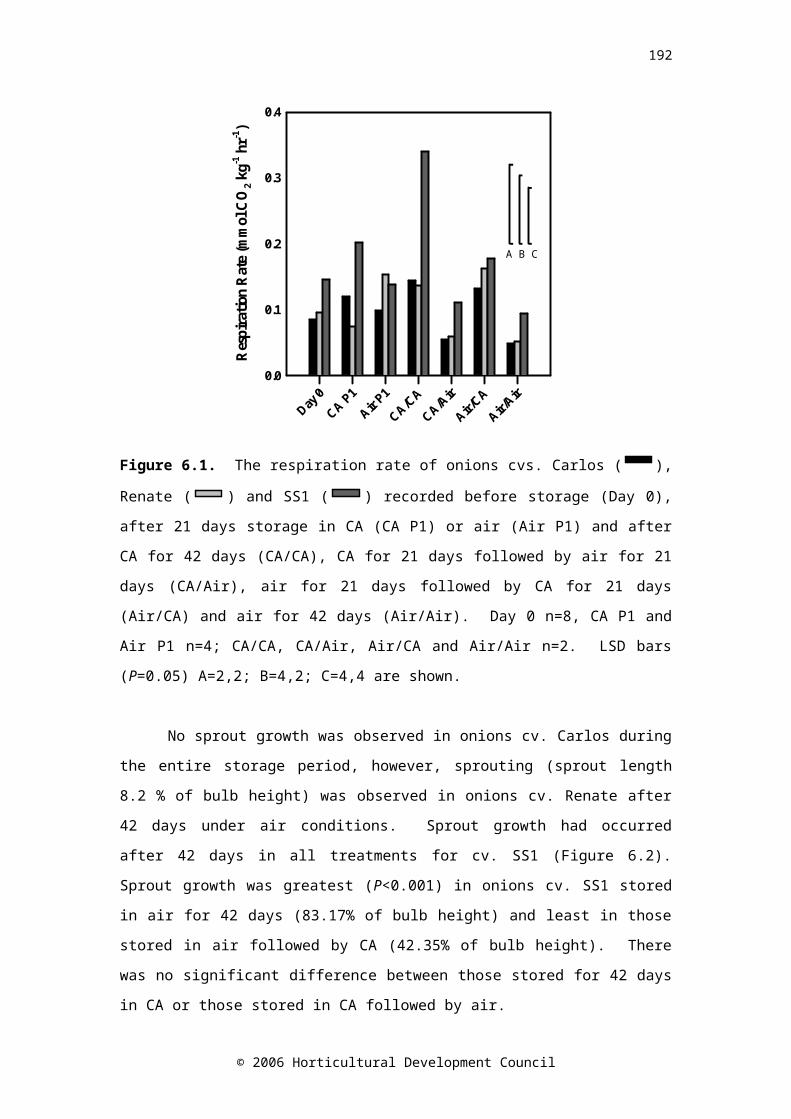
196
cm centimetrecM centi MorganCo CobaltCO2 carbon dioxidecv. cultivarDEFRA Department for Environment Food and Rural Affairsde novo anewd.f. degrees of freedomDP degree of polymerisationDPA dihydrophaseic acidDW dry weightEEC European Economic CommunityELSD Evaporative Light Scattering Dectectoret al. and othersFAO Food and Agriculture Organisation of the United NationsFID Flame Ionisation DetectionFW fresh weightg gramGA gibberellinGC Gas ChromatographyGC guanine-cytosineGy Gray unithr hours3H tritiumha hectareHCl hydrochloric acidHDC Horticultural Development CouncilHPLC High Performance Liquid ChromatographyICP-AES Inductively Coupled Plasma – Atomic Emission Spectroscopyin vitro outside a living organism in vivo inside a living organism
© 2006 Horticultural Development Council
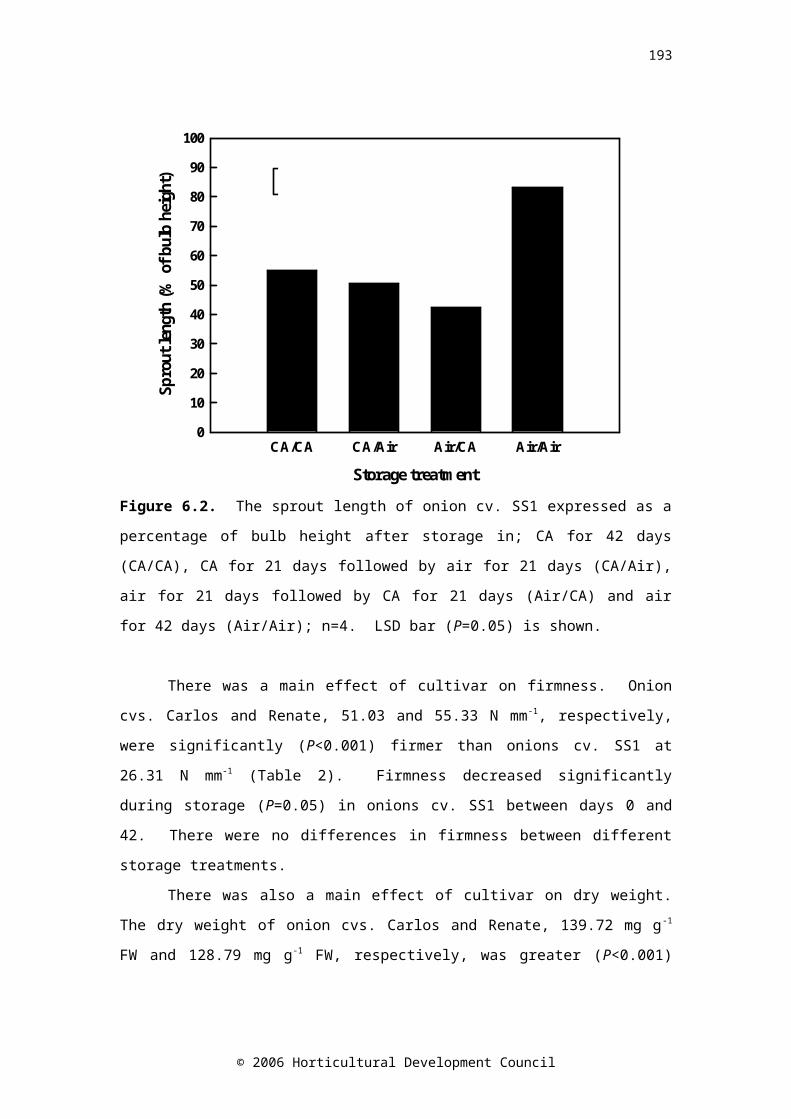
197
kg kilogramkN kiloNewtonkPa kiloPascall litreLSD least significant differenceM molaritym metreMAC monoclonal antibodyMAFF Ministry of Agriculture, Fisheries and FoodMbp mega base pairsMCSO methyl S-alk(en)yl-L-cysteine sulphoxidemg milligramMH maleic hydrazide min minuteml millilitremm millimetremM millimolarMTA 5’-methylthioadenosineMW molecular weightN normalityN2 nitrogenNA not applicableNaBH4 sodium borohydrideNaCl sodium chlorideNa2HPO4 di-sodium hydrogen orthophosphateNaH2PO4 sodium di-hydrogen orthophosphateNaOH sodium hydroxideNCED nine cis-epoxycarotenoid dioxygenaseng nanogram(NH4)2SO4 ammonium sulphateNSC non-structural carbohydratenm nanometre
© 2006 Horticultural Development Council
198
nmol nanomoleN2O nitrous oxideO2 oxygenP probabiltityPA phaseic acidPAHBAH p-hydroxybenzoic acid hydrazidePBI-365 8’-methylene ABA methyl esterPBS phosphate buffered salinePCSO propyl S-alk(en)yl-L-cysteine sulphoxidepg picogramPRENCSO 1-propenyl S-alk(en)yl-L-cysteine sulphoxideQ10 increase in the respiration rate produced by raising the
temperature by 10°CRIA Radio-immunoassayRH relative humidityRNA ribonucleic acidrpm revolutions per minuteRR respiration rateRT-PCR Reverse transcription – polymerase chain reactionS sulphurSAM S-adenosyl-L-methionineSDR short chain alcohol dehydrogenase/reductaseSDW sterile distilled waterS.E. standard errorSS1 SupasweetSyn. synonymTLC thin layer chromatographyTSS total soluble solidsUK United KingdomUS United StatesUSA United States of AmericaUSDA United States Department of Agriculture
© 2006 Horticultural Development Council
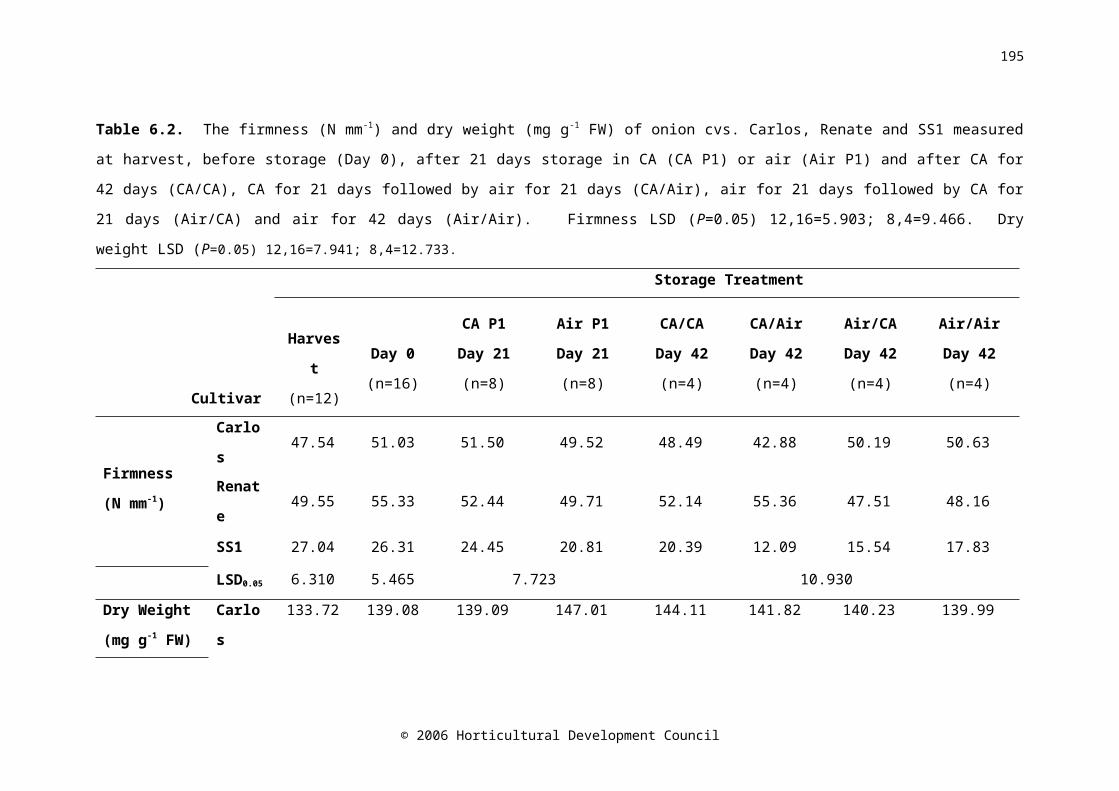
199
viz. namelyv/v volume by volumew/w weight by weightWSC water soluble carbohydrateZEP zeaxanthin epoxydase
REFERENCES
Abayomi, L. A., Terry, L. A., White, S. F. and Warner, P. J. (2006). Development of a disposable pyruvate biosensor to determine pungency in onions (Allium cepa L.). Biosensors and Bioelectronics, 21, 2176-2179.
Abdalla, A. A. and Mann, L. K. (1963). Bulb development in the onion (Allium cepa L.) and the effect of storage temperature on bulb rest. Hilgardia, 35, 85-112.
Abdel-Rahman, M. and Isenberg, F. M. R. (1974). The role of exogenous plant growth regulators in the dormancy of onion bulbs. Journal of Agricultural Science, 82, 113-116.
Abrams, S. R., Rose, P. A., Cutler, A. J., Balsevich, J. J., Lei, B. and Walker-Simmons, M. K. (1997). 8’-Methylene abscisic acid. An effective and persistent analogue of abscisic acid. Plant Physiology, 114, 89-97.
Adamicki, F. (2005). Effects of pre-harvest treatments and storage conditions on quality and shelf-life of onions. In: Guangshu, L. (Ed.) Proceedings of the Fourth International Symposium on Edible Alliaceae, Beijing, China, 21-26 April 2004, ISHS Acta Horticulturae 688, 26-33.
Adamicki, F. and Kepka, A. K. (1974). Storage of onions in controlled atmospheres. Acta Horticulturae, 38, 53-74.
ADAS. (1985). The analysis of agricultural materials, MAFF Reference book 427. HMSO, London.
Araki, Y., Miyawaki, A., Miyashita, T., Mizutani, M., Hirai, N. and Todoroki, Y. (2006). A new non-azole inhibitor of ABA 8'-hydroxylase: Effect of the hydroxyl group substituted for geminal methyl groups in the six-membered ring. Bioorganic and Medicinal Chemistry Letters, 16, 3302-3305.
© 2006 Horticultural Development Council
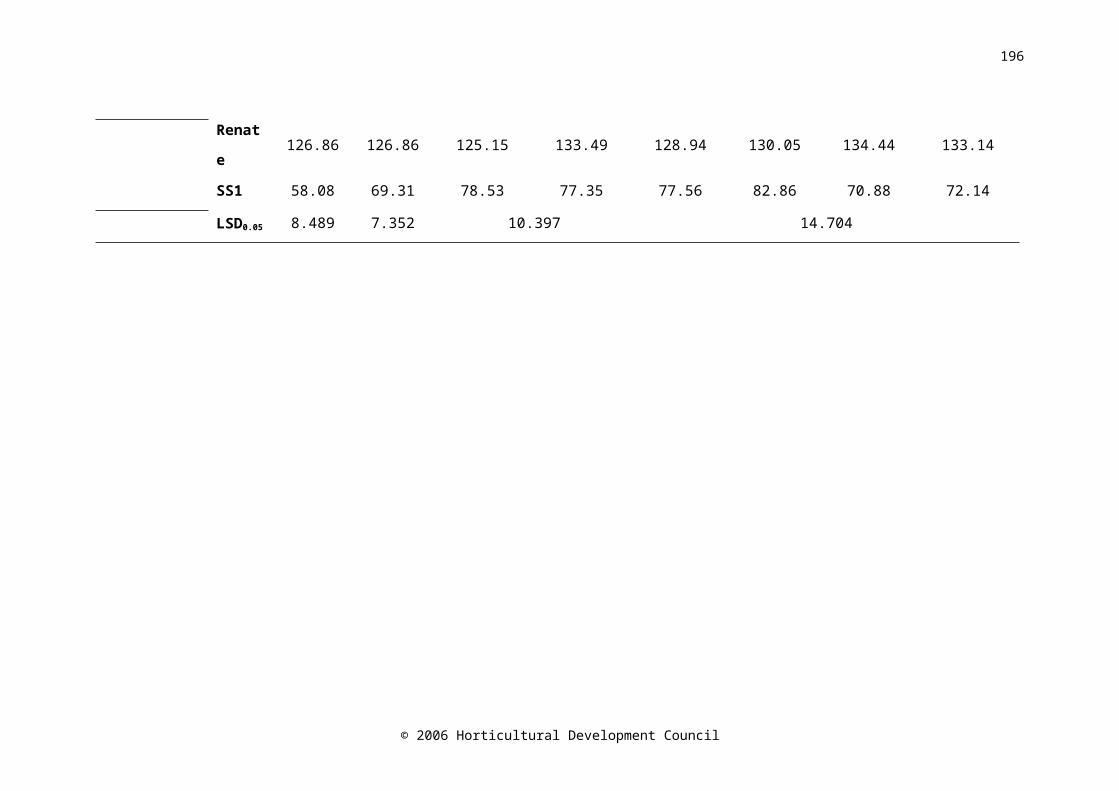
200
Arumuganathan, K. and Earle, E. D. (1991). Nuclear DNA content of some important plant species. Plant Molecular Biology Reporter, 9, 208-218.
Barrieu, P. and Simonneau, T. (2000). The monoclonal antibody MAC252 does not react with the (-) enantiomer of abscisic acid. Journal of Experimental Botany, 51, 305-307.
Beaudoin, N., Serizet, C., Gosti, F. and Giraudat, J. (2000). Interactions between abscisic acid and ethylene signalling cascades. Plant Cell, 12, 1103-1115.
Benkeblia, N. (2000). Phenylalanine ammonia-lyase, peroxidase, pyruvic acid and total phenolics variations in onion bulbs during long-term storage. Food Science and Technology - Lebensmittel-Wissenschaft und Technologie, 33, 112-116.
Benkeblia, N. (2004). Effect of maleic hydrazide on respiratory parameters of stored onion bulbs (Allium cepa L.). Brazilian Journal of Plant Physiology, 16, 47-52.
Benkeblia, N., Onodera, S., Yoshihira, T., Kosaka, S. and Shiomi, N. (2004). Effect of temperature on soluble invertase activity, and glucose, fructose and sucrose status of onion bulbs (Allium cepa) in store. International Journal of Food Science and Nutrition, 55, 325-331.
Benkeblia, N., Onodera, S. and Shiomi, N. (2005a). Variation in 1-fructo-exohydrolase (1-FEH) and 1-kestose-hydrolysing (1-KH) activities and fructo-oligosaccharide (FOS) status in onion bulbs. Influence of temperature and storage time. Journal of the Science of Food and Agriculture, 85, 227-234.
Benkeblia, N., Ueno, K., Onodera, S. and Shiomi, N. (2005b). Variation of fructooligosaccharides and their metabolizing enzymes in onion bulb (Allium cepa L. cv. Tenshin) during long-term storage. Journal of Food Science, 70, S208-S214.
Benkeblia, N. and Selselet-Attou, G. (1999a). Effects of low temperatures on changes in oligosaccharides, phenolics and peroxidase in inner bud of onion Allium cepa L. during break of dormancy. Acta Agriculturae Scandinavica Section B - Soil and Plant Science, 49, 98-102.
Benkeblia, N. and Selselet-Attou, G. (1999b). Role of ethylene on sprouting of onion bulbs (Allium cepa L.). Acta Agriculturae Scandinavica Section B - Soil and Plant Science, 49, 122-124.
Benkeblia, N. and Shiomi, N. (2004). Chilling effect on soluble sugars, respiration rate, total phenolics, peroxidase activity and dormancy of onion bulbs. Scientia Agricola, 61, 281-285.
© 2006 Horticultural Development Council
201
Benkeblia, N. and Shiomi, N. (2006). Hydrolysis kinetic parameters of DP 6, 7, 8, and 9-12 fructooligosaccharides (FOS) of onion bulb tissues. Effect of temperature and storage time. Journal of Agricultural and Food Chemistry, 54, 2587-2592.
Benkeblia, N. and Varoquaux, P. (2003). Effect of nitrous oxide (N2O) on respiration rate, soluble sugars and quality attributes of onion bulbs Allium cepa cv. Rouge Amposta during storage. Postharvest Biology and Technology, 30, 161-168.
Benkeblia, N., Varoquaux, P., Gouble, B. and Selselet-Attou, G. (2000). Respiratory parameters of onion bulbs (Allium cepa) during storage. Effects of ionising radiation and temperature. Journal of the Science of Food and Agriculture, 80, 1772-1778.
Benkeblia, N., Varoquaux, P., Shiomi, N. and Sakai, H. (2002). Storage technology of onion bulbs cv. Rouge Amposta: effects of irradiation, maleic hydrazide and carbamate isopropyl, N-phenyl (CIP) on respiration rate and carbohydrates. International Journal of Food Science and Technology, 37, 169-175.
Biemelt, S., Hajirexaei, M., Hentschel, E. and Sonnewald, U. (2000). Comparative analysis of abscisic acid content and starch degradation during storage of tubers harvested from different potato varieties. Potato Research, 43, 371-382.
Blankenship, S. M. and Dole, J. M. (2003). 1-methylcyclopropene: A review. Postharvest Biology and Technology, 28, 1-25.
Block, E. (1992). The organosulphur chemistry of the genus Allium - implications for the organic chemistry of sulphur. Angewandte Chemie International Edition in English, 31, 1135-1178.
Blumenfield, A. and Bukovac, M. J. (1972). Cuticular penetration of abscisic acid. Planta, 107, 261-268.
Brewster, J. L. (1977a). The physiology of the onion. Part 1. Horticultural Abstracts, 47, 17-23.
Brewster, J. L. (1977b). The physiology of the onion. Part 2. Horticultural Abstracts, 47, 103-112.
Brewster, J. L. (1990). Physiology of crop growth and bulbing. In: Rabinowitch, H. D. and Brewster, J. L. (Eds.) Onions and Allied Crops. Volume 1. Botany, Physiology and Genetics, CRC Press, Florida.
© 2006 Horticultural Development Council
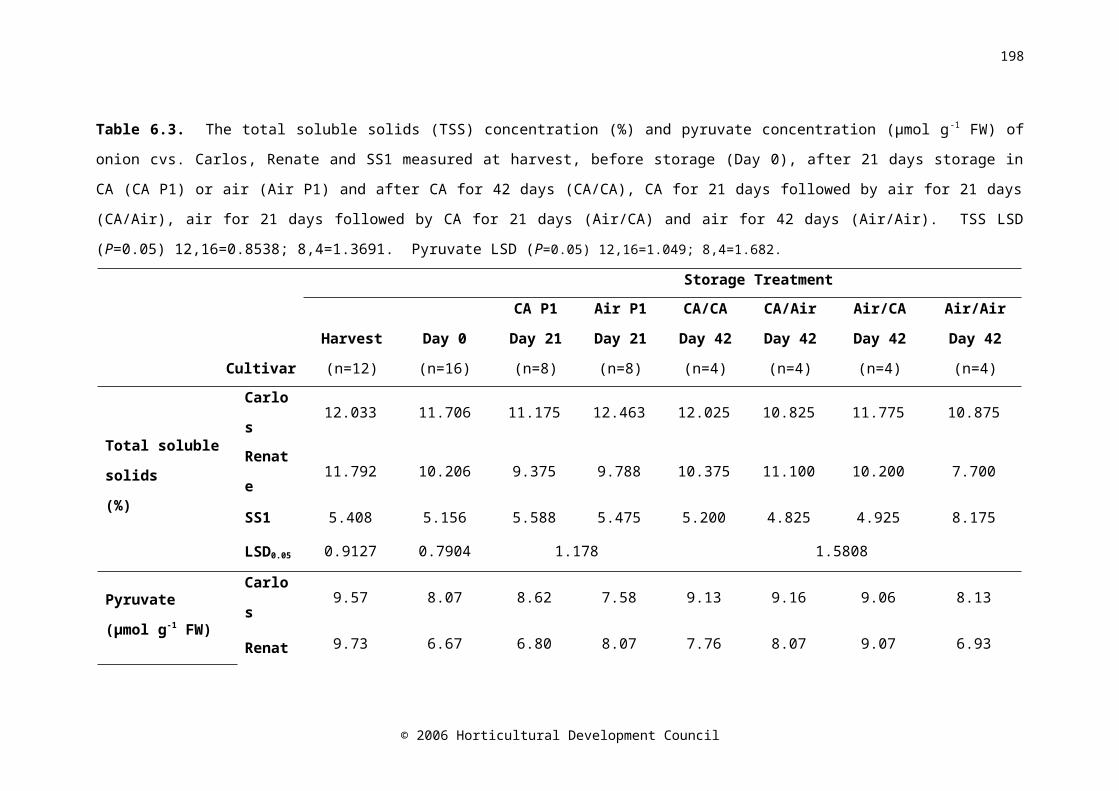
202
Brewster, J. L. (1994). Onions and other Vegetable Alliums, CABI Publishing. Wallingford.
Brice, J. R., Bisbrown, A. J. K. and Curd, L. (1995). Onion storage trials at high ambient temperature in the Republic of Yemen. Journal of Agricultural and Engineering Research, 62, 185-192.
Briggs, W. H. and Goldman, I. L. (2002). Variation in economically and ecologically important traits in onion plant organs during reproductive development. Plant Cell and Environment, 25, 1031-1037.
Budu, A. S. and Joyce, D. C. (2003). Effect of 1-methylcyclopropene on the quality of minimally processed pineapple fruit. Australian Journal of Experimental Agriculture, 43, 177-184.
Carter, C. E., Partis, M. D. and Thomas, B. (1999). The expression of histone 2A in onion (Allium cepa) during the onset of dormancy, storage and emergence from dormancy. New Phytologist, 143, 461-470.
Chope, G. A., Terry, L. A. and White, P. J. (2006). Effect of controlled atmosphere storage on abscisic acid concentration and other biochemical attributes of onion bulbs. Postharvest Biology and Technology, 39, 233-242.
Coleman, W. K. (1998). Carbon dioxide, oxygen and ethylene effects on potato tuber dormancy release and sprout growth. Annals of Botany, 82, 21-27.
Coolong, T. W., Kopsell, D. A., Kopsell, D. E. and Randle, W. M. (2004). Nitrogen and sulphur influence nutrient usage and accumulation in onion. Journal of Plant Nutrition, 27, 1667-1686.
Croci, C. A., Banek, S. A. and Curzio, O. A. (1995). Effect of gamma irradiation and extended storage on chemical quality in onion (Allium cepa L). Food Chemistry, 54, 151-154.
Crowther, T., Collin, H. A., Smith, B., Tomsett, A. B., O'Connor, D. and Jones, M. G. (2005). Assessment of the flavour of fresh uncooked onions by taste panels and analysis of flavour precursors, pyruvate and sugars. Journal of the Science of Food and Agriculture, 85, 112-120.
Currah, L. (1981). Onion flowering and seed production. Scientific Horticulture, 32, 26-46.
Cutler, A. J. and Krochko, J. E. (1999). Formation and breakdown of ABA. Trends in Plant Science, 4, 472-478.
© 2006 Horticultural Development Council
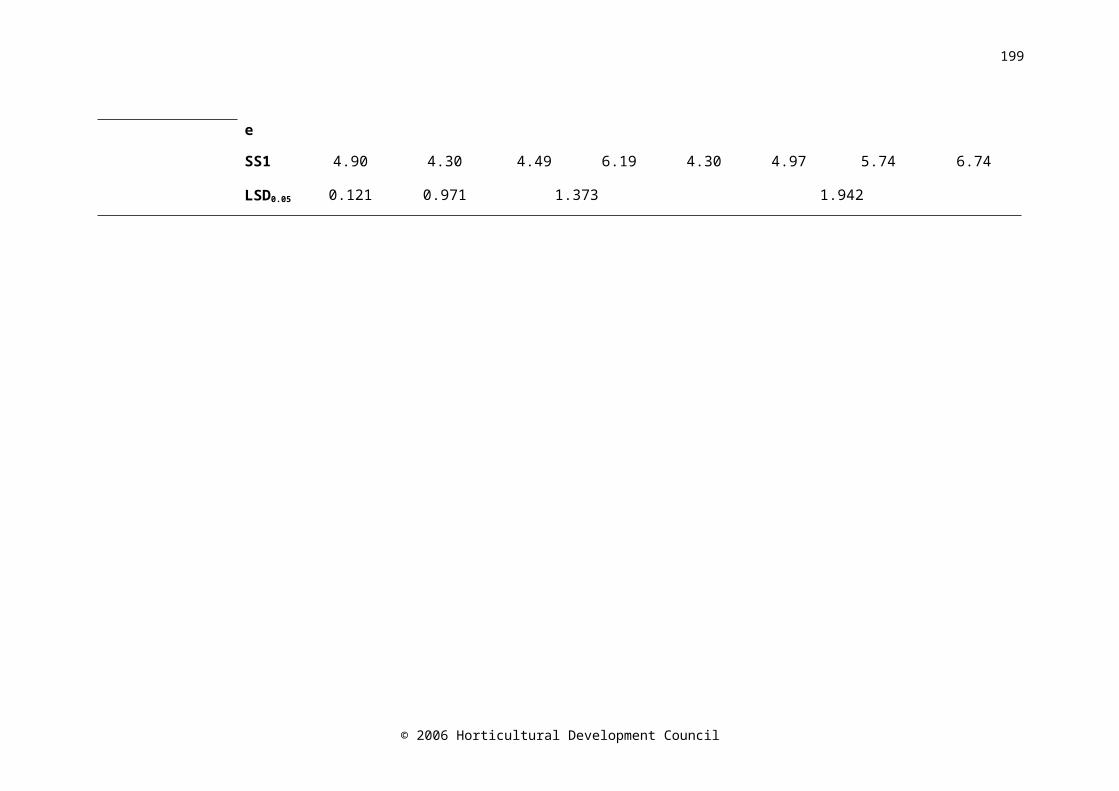
203
Cutler, A. J., Rose, P. A., Squires, T. M., Loewen, M. K., Shaw, A. C., Quail, J. W., Krochko, J. E. and Abrams, S. R. (2000). Inhibitors of abscisic acid 8'-hydroxylase. Biochemistry, 39, 13614-13624.
Dahlhelm, D. and Matjeko, C. (1990). Relations between the physiological state of onions and an effective sprout inhibition by irradiation. Radiation Physics and Chemistry, 36, 651-656.
Daniels-Lake, B. J., Prange, R. K., Nowak, J., Asiedu, S. K. and Walsh, J. R. (2005). Sprout development and processing quality changes in potato tubers stored under ethylene: 1. Effects of ethylene concentration. American Journal of Potato Research, 82, 389-397.
Darbyshire, B. and Henry, R. J. (1978). The distribution of fructans in onions. New Phytologist, 81, 29-34.
Darbyshire, B. and Henry, R. J. (1979). The association of fructans with high percentage dry weight in onion cultivars suitable for dehydrating. Journal of the Science of Food and Agriculture, 30, 1035-1038.
Dauny, P. T., Joyce, D. C. and Gamby, C. (2003). 1-Methylcyclopropene influx and efflux in 'Cox' apple and 'Hass' avocado fruit. Postharvest Biology and Technology, 29, 101-105.
DEFRA. (2003). Family food in 2001/2002, National Statistics, London.
© 2006 Horticultural Development Council
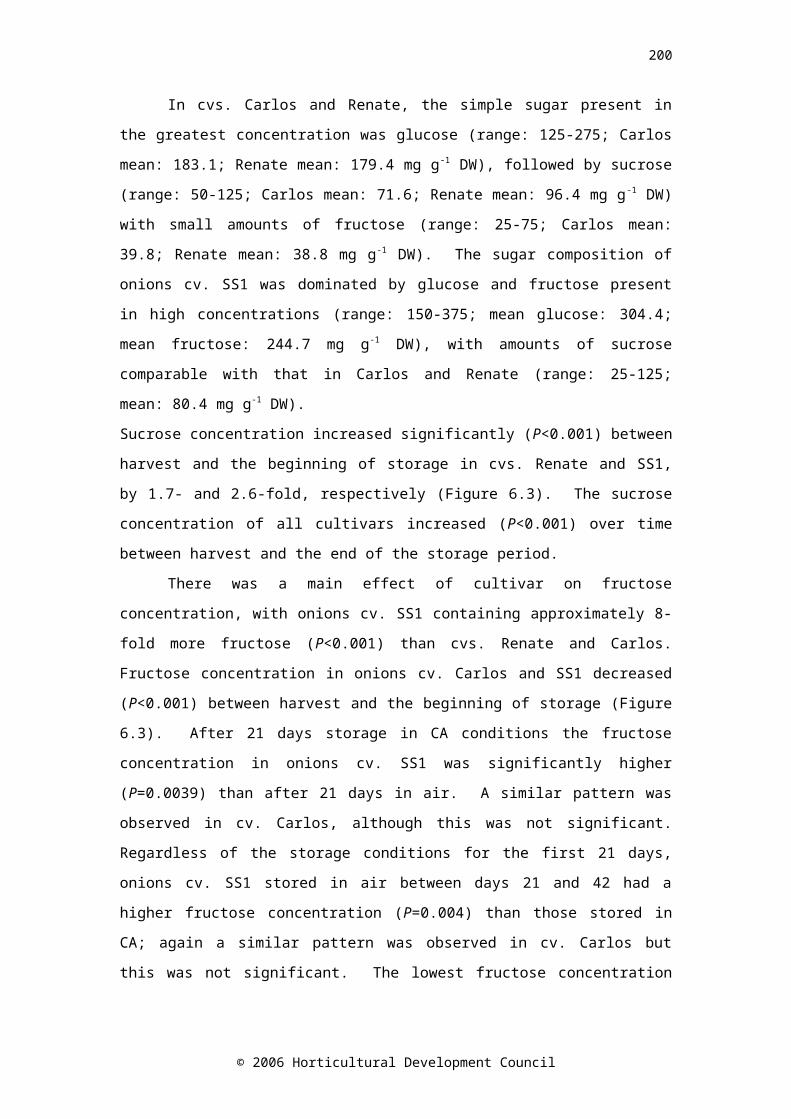
204
Department of Trade and Industry. (2006). Statistical press release – Energy statistics. [online]. Government news network. Available at:http://www.gnn.gov.uk/environment/detail.asp?ReleaseID=210961&NewsAreaID=2. (Accessed: 10 October 2006).
Destefano-Beltrán, L., Knauber, D., Huckle, L. and Suttle, J. (2006a). Chemically forced dormancy termination mimics natural dormancy progression in potato tuber meristems by reducing ABA content and modifying expression of genes involved in regulating ABA synthesis and metabolism. Journal of Experimental Botany, 57, 2879-2886.
Destefano-Beltrán, L., Knauber, D., Huckle, L. and Suttle, J. C. (2006b). Effects of postharvest storage and dormancy status on ABA content, metabolism, and expression of genes involved in ABA biosynthesis and metabolism in potato tuber tissues. Plant Molecular Biology, 61, 687-697.
de Wild, H. P. J., Gude, H. and Peppelenbos, H. W. (2002). Carbon dioxide and ethylene interactions in tulip bulbs. Physiologia Plantarum, 114, 320-326.
Dorffling, K. and Tietz, D. (1983). Methods for the detection and estimation of abscisic acid and related compounds. In: Addicott, F. (Ed.) Abscisic Acid, Preager Publishers, New York.
Ecker, J. R. (1995). The ethylene signal transduction pathway in plants. Science, 268, 667-675.
Ernst, M. K., Bufler, G., Röske, M., Ritzkowski, M., Metzger, C. and Liebig, H-P. (1999). Cultivar and temperature effects on starch in the primary thickening meristem of onion bulbs. Journal of Horticultural Science and Biotechnology, 74, 588-593.
Ernst, M. K., Chatterton, N. J., Harrison, P. A. and Matitschka, G. (1998). Characterization of fructan oligomers from species of the genus Allium L. Journal of Plant Physiology, 153, 53-60.
Ernst, M. K., Praeger, U. and Weichmann, J. (2003). Effect of low oxygen storage on carbohydrate changes in onion (Allium cepa var. cepa) bulbs. European Journal of Horticultural Science, 68, 59-62.
FAOSTAT. (2006). Food and Agriculture Organisation of the United Nations - Agricultural Data (Classic). [online] Available at: http://faostat.fao.org/site/395/default. (Accessed: 19 July 2006).
Fenwick, G. R. and Hanley, A. B. (1985). The genus Allium - Part 1. CRC Critical Reviews in Food Science and Nutrition, 22, 199-271.
© 2006 Horticultural Development Council

205
Finkelstein, R. R. and Rock, C. D. (2002). Abscisic acid biosynthesis and response. In: Somerville, C.R. and Meyerowitz, E. M. (Eds.) The Arabidopsis Book, American Society of Plant Biologists, Rockville, MD, USA.
Fritsch, R. M. and Friesen, N. (2002). Evolution, domestication and taxonomy. In: Rabinowitch, H. D. and Currah, L. (Eds.) Allium Crop Science: Recent Advances. CABI Publishing, Wallingford.
Galmarini, C. R., Goldman, I. L. and Havey, M. J. (2001). Genetic analyses of correlated solids, flavor, and health-enhancing traits in onion (Allium cepa L.). Molecular Genetics and Genomics, 265, 543-551.
Griffiths, G., Trueman, L., Crowther, T., Thomas, B. and Smith, B. (2002). Onions - A global benefit to health. Phytotherapy Research, 16, 603-615.
Gubb, I. and MacTavish, H. S. (2002). Onion pre- and postharvest considerations. In: Rabinowitch, H. D. and Currah, L. (Eds.) Allium Crop Science: Recent Advances. CABI Publishing, Wallingford.
Hamilton, B. K., Yoo, K. S. and Pike, L. M. (1998). Changes in pungency of onions by soil type, sulphur nutrition and bulb maturity. Scientia Horticulturae, 74, 249-256.
Han, S.-Y., Kitahata, N., Sekimata, K., Saito, T., Kobayashi, M., Nakashima, K., Yamaguchi-Shinozaki, K., Shinozaki, K., Yoshida, S. and Asami, T. (2004). A novel inhibitor of 9-cis-epoxycarotenoid dioxygenase in abscisic acid biosynthesis in higher plants. Plant Physiology, 135, 1574-1582.
Hansen, S. L. (1999). Content and composition of dry matter in onion (Allium cepa L.) as influenced by developmental stage at time of harvest and long-term storage. Acta Agriculturae Scandinavica Section B - Soil and Plant Science, 49, 103-109.
Hartung, W., Sauter A., and Hose, E. (2002). Abscisic acid in the xylem: where does it come from, where does it go to? Journal of Experimental Botany, 53, 27-32
Havey, M. J. (1999). Advances in new Alliums. In: Janick, J. (Ed.) Perspectives on New Crops and New Uses, ASHS Press, Alexandria, Virginia.
Havey, M. J. (2004). Application of genomic technologies to crop plants: opportunities and challenges. Crop Science, 44, 1893-1919.
© 2006 Horticultural Development Council
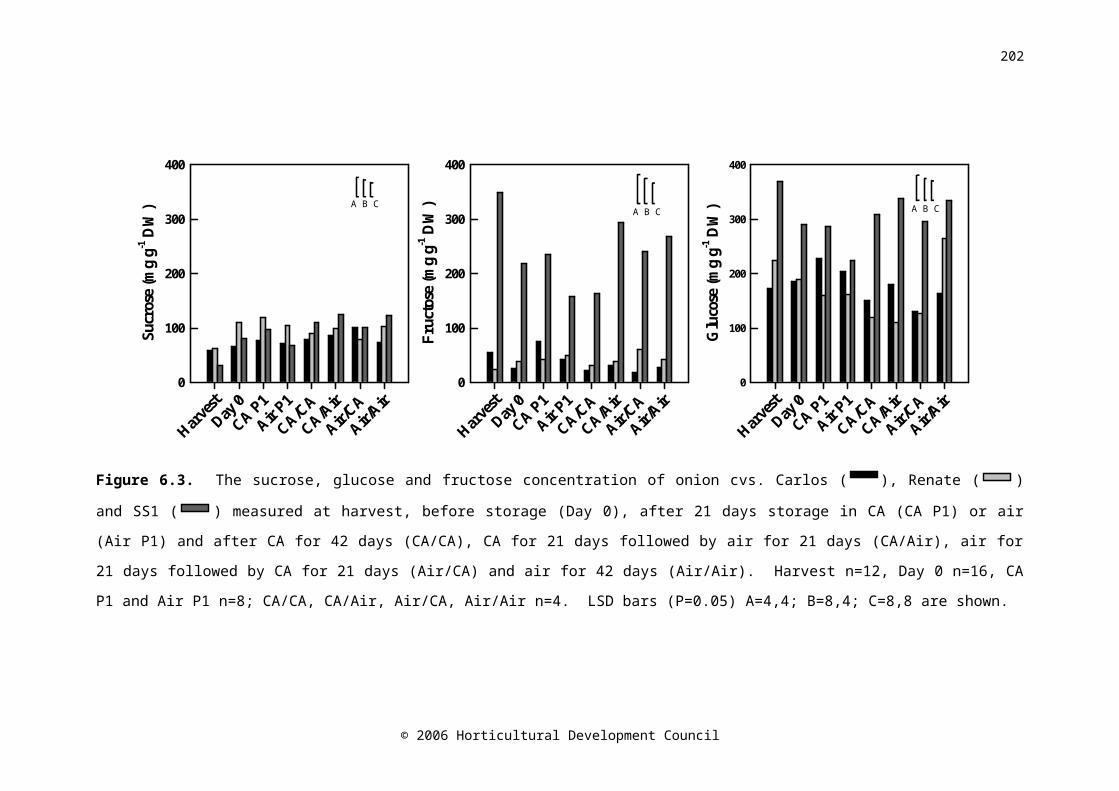
206
Havey, M. J. and Randle, W. M. (1996). Combining abilities for yield and bulb quality among long- and intermediate-day open-pollinated onion populations. Journal of the American Society for Horticultural Science, 121, 604-608.
Herold, B., Oberbarnscheidt, B. and Geyer, M. (1998). Mechanical load and its effect on bulb onions due to harvest and post-harvest handling. Journal of Agricultural and Engineering Research, 71, 373-383.
Hole, C. C., Drew, R. L. K. and Gray, D. (2000). Humidity and the mechanical properties of onion skins. Postharvest Biology and Technology, 19, 229-237.
Hurst, W. C., Shewfelt, R. L. and Schuler, G. A. (1985). Shelf-life and quality changes in summer storage onions (Allium cepa). Journal of Food Science, 50, 761-763.
Iannetta, P. P. M., Laarhoven, L. J., Medina-Escobar, N., James, E. K., Mcmanus, M. T., Davies, H. V. and Harren, F. J. M. (2006). Ethylene and carbon dioxide production by developing strawberries show a correlative pattern that is indicative of ripening climacteric fruit. Physiologia Plantarum, 127, 247-259.
Imai, S., Tsuge, N., Tomotake, M., Nagatome, Y., Sawada, H., Nagata, T. and Kumagai, H. (2002). Plant biochemistry: An onion enzyme that makes the eyes water. Nature, 419, 685.
Jaime, L., Martinez, F., Martin-Cabrejas, M. A., Molla, E., Lopez-Andreu, F. J., Waldren, K. W. and Esteban, R. M. (2000). Study of total fructan and fructooligosaccharide content in different onion tissues. Journal of the Science of Food and Agriculture, 81, 177-182.
Jaime, L., Martin-Cabrejas, M. A., Molla, E., Lopez-Andreu, F J. and Esteban, R. M. (2001). Effect of storage on fructan and fructooligosaccharide of onion (Allium cepa L.). Journal of Agricultural and Food Chemistry, 49, 982-988.
Johnson, J. (2006). Onion storage revolution? The Vegetable Farmer, 2, 25-26.
Jones, M. G., Hughes, J., Tregova, A., Milne, J., Tomsett, A. B. and Colin, H. A. (2004). Biosynthesis of the flavour precursors of onion and garlic. Journal of Experimental Botany, 55, 1903-1918.
Kader, A. A. (2004). Controlled atmosphere storage. In: Gross, K. C., Wang, C. Y. and Saltveit, M. E. (Eds.) Agricultural Handbook Number 66. The Commercial Storage of Fruits, Vegetables and Florist and Nursery
© 2006 Horticultural Development Council
207
Stocks. [online]. USDA. Available at: http://www.ba.ars.usda.gov/hb66/. (Accessed: 25 May 2005).
Kahane, R., Delaserve, B. T. and Rancillac, M. (1992). Bulbing in long-day onion (Allium cepa L) cultured in vitro - comparison between sugar feeding and light induction. Annals of Botany, 69, 551-555.
Kahane, R., Vialle-Guerin, E., Boukema, I., Tzanoudakis, D., Bellamy, C., Chamaux, C. and Kik, C. (2001). Changes in non-structural carbohydrate composition during bulbing in sweet and high-solid onions in field experiments. Environmental and Experimental Botany, 45, 73-83.
Karagiannis, C. S. and Pappelis, A. J. (1994). Effect of abscisic acid, gibberellic acid, indoleacetic acid, and kinetin on selective ribosomal cistron regulation in quiescent and senescent onion leaf base tissue. Mechanisms of Ageing and Development, 76, 145-155.
King, J. J., Bradeen, J. M., Bark, O., McCallum, J. A. and Havey, M. J. (1998). A low-density genetic map of onion reveals a role for tandem duplication in the evolution of an extremely large diploid genome. Theoretical and Applied Genetics, 96, 52-62.
Kirk, J. T. O., Rees, H. and Evans, G. (1970). Base composition of nuclear DNA within genus Allium. Heredity, 25, 507-512.
Kitahata, N., Han, S. Y., Noji, N., Saito, T., Kobayashi, M., Nakano, T., Kuchitsu, K., Shinozaki, K., Yoshida, S., Matsumoto, S., Tsujimoto, M. and Asami, T. (2006). A 9-cis-epoxycarotenoid dioxygenase inhibitor for use in the elucidation of abscisic acid action mechanisms. Bioorganic and Medicinal Chemistry, 14, 5555-5561.
Kleinkopf, G. E., Oberg, N. A. and Olsen, N. L. (2003). Sprout inhibition in storage: current status, new chemistries and natural compounds. American Journal of Potato Research, 80, 317-327.
Komochi, S. (1990). Bulb dormancy and storage. In: Rabinowitch, H. D. and Brewster, J. L. (Eds.) Onions and Allied Crops, I. Botany, Physiology and Genetics, CRC Press, Florida.
Ko, S-K., Chany, W-N., Wang, J-F., Cherng, S-J. and Shanmugasundaram, S. (2002). Storage variability among short-day onion cultivars under high temperature and high relative humidity, and its relationship with disease incidence and bulb characteristics. Journal of the American Society for Horticultural Science, 127, 848-854.
© 2006 Horticultural Development Council
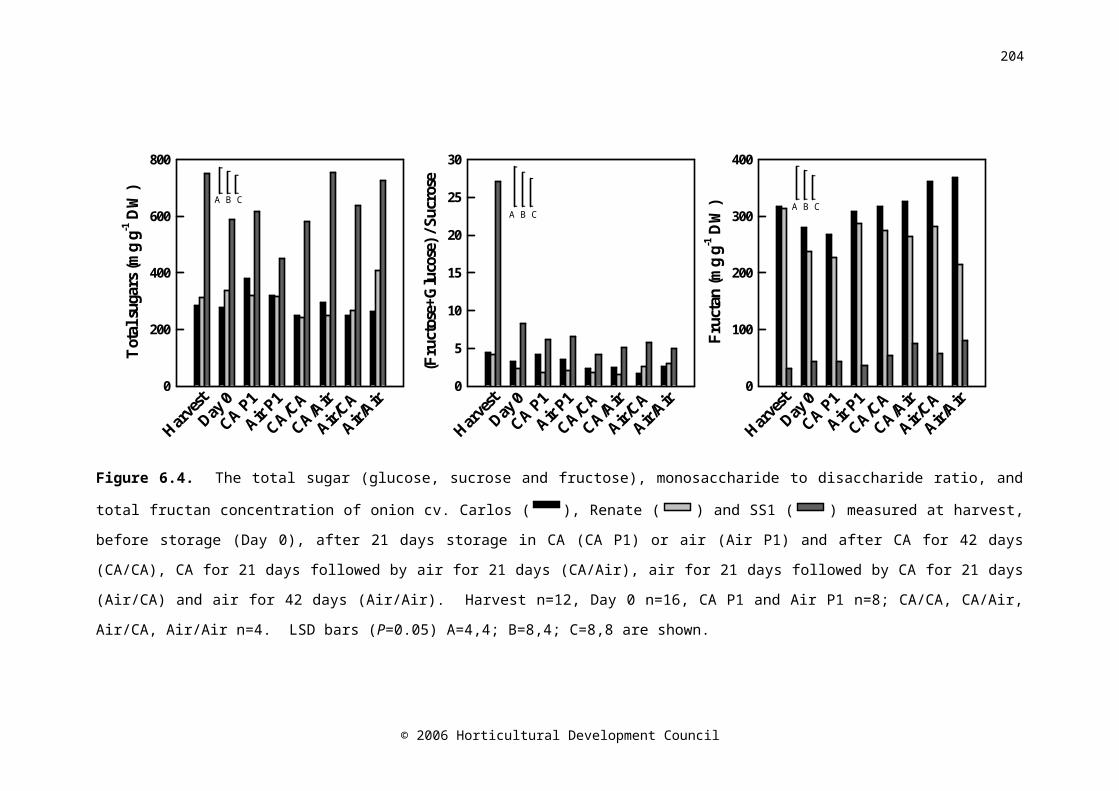
208
Kopsell, D. E. and Randle, W. M. (1997). Short-day onion cultivars differ in bulb selenium and sulphur accumulation which can affect bulb pungency. Euphytica, 96, 385-390.
Kopsell, D. E., Randle, W. M. and Eiteman, M. A. (1999). Changes in the S-alk(en)yl cysteine sulfoxides and their biosynthetic intermediates during onion storage. Journal of the American Society for Horticultural Science, 124, 177-183.
Kubo, Y., Inaba, A. and Nakamura, R. (1990). Respiration and C2H4 production in various harvested crops held in CO2-enriched atmospheres. Journal of the American Society for Horticultural Science, 115, 975-978.
Kuhl, J. C., Cheung, F., Yuan, Q., Martin, W., Zewdie, Y., McCallum, J., Catanach, A., Rutherford, P., Sink, K. C., Jenderek, M., Prince, J. P., Town, C. D. and Havey, M. J. (2004). A unique set of 11,108 onion expressed sequence tags reveals expressed sequence and genomic differences between the monocot orders Asparagales and Poales. The Plant Cell, 16, 114-125.
Kuraishi, S., Yamashita, D., Sakurai, N. and Hasegawa, S. (1989). Changes of abscisic acid and auxin as related to dormancy breaking of Allium wakegi bulblets by vacuum infiltration and BA treatment. Journal of Plant Growth Regulation, 8, 3-9.
Lancaster, J. E., Farrant, J. and Shaw, M. L. (2001). Sulfur nutrition affects cellular sulfur, dry weight distribution, and bulb quality in onion. Journal of the American Society for Horticultural Science, 126, 164-168.
Lancaster, J. E., Shaw, M. L. and Randle, W. M. (1998). Differential hydrolysis of alk(en)yl cysteine sulphoxides by alliinase in onion macerates: flavour implications. Journal of the Science of Food and Agriculture, 78, 367-372.
Lancaster, J. E., Triggs, C. M., De Ruiter, J. M. and Gandar, P. W. (1996). Bulbing in onions: Photoperiod and temperature requirements and prediction of bulb size and maturity. Annals of Botany, 78, 423-430.
Mahotiere, S., Herner, R. C. and Dennis, F. G. (1976). Effects of applied growth substances on growth of shoot apices excised from onions in rest. Journal of the American Society for Horticultural Science, 101, 211-213.
Marcano, L., Carruyo, I., Del Campo, A. and Montiel, X. (2004). Cytotoxicity and mode of action of maleic hydrazide in root tips of Allium cepa L. Environmental Research, 94, 221-226.
© 2006 Horticultural Development Council
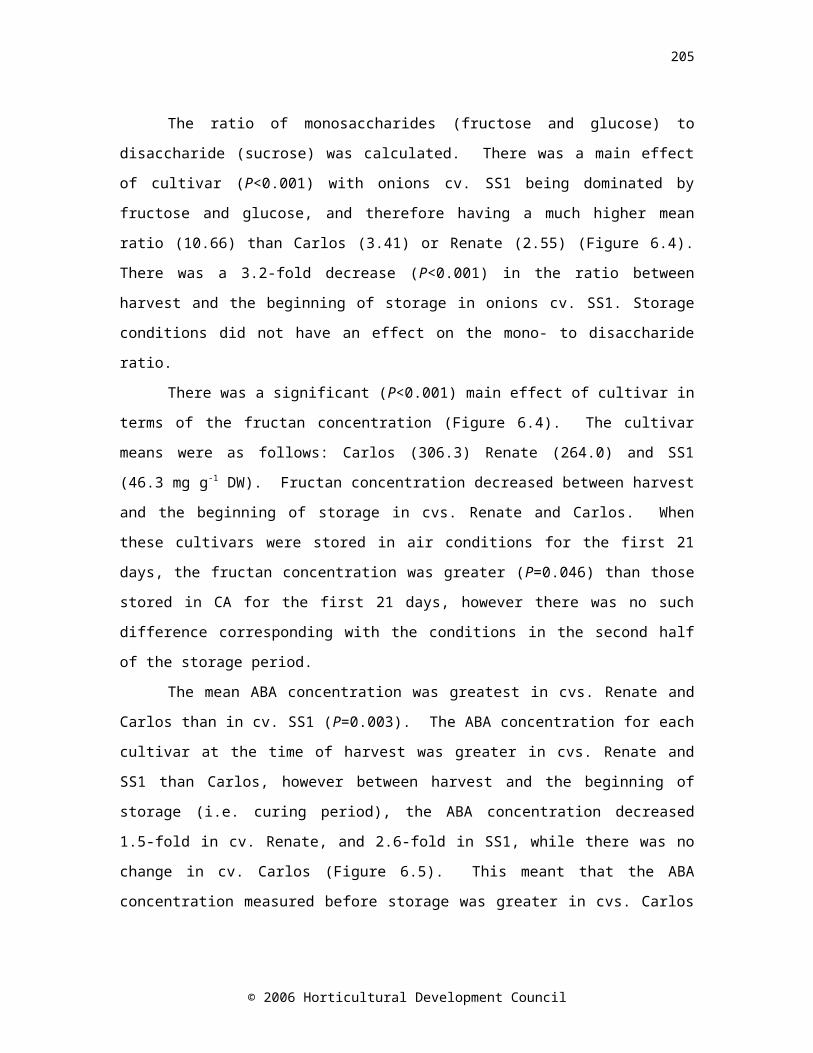
209
Martin, W. J., McCallum, J., Shigyo, M., Jakse, J., Kuhl, J. C., Yamane, N., Pither-Joyce, M., Gokce, A. F., Sink, K. C., Town, C. D. and Havey, M. J. (2005). Genetic mapping of expressed sequences in onion and in silico comparisons with rice show scant colinearity. Molecular Genetics and Genomics, 274, 197-204.
Matsubara, S. and Kimura, I. (1991). Changes of ABA content during bulbing and dormancy and in vitro bulbing in onion plant. Journal of the Japanese Society for Horticultural Science, 59, 757-762.
Maude, R. B., Shipway, M. R., Presly, A. H. and O’Connor, D. (1984). The effects of direct harvesting and drying systems on the incidence and control of neck rot (Botrytis allii) in onions. Plant Pathology, 33, 263-268.
McCallum, J., Clarke, A., Pither-Joyce, M., Shaw, M., Butler, R., Brash, D., Scheffer, J., Sims, I., Van Heusden, S., Shigyo, M. and Havey, M. (2006). Genetic mapping of a major gene affecting onion bulb fructan content. Theoretical and Applied Genetics, 112, 958-967.
McCallum, J., Pither-Joyce, M. and Shaw, M. L. (2002). Sulfur deprivation and genotype affect gene expression and metabolism of onion roots. Journal of the American Society for Horticultural Science, 127, 583-589.
Miedema, P. (1994a). Bulb dormancy in onion. I. The effects of temperature and cultivar on sprouting and rooting. Journal of Horticultural Science, 69, 29-39.
Miedema, P. (1994b). Bulb dormancy in onion. III. The influence of the root system, cytokinin and wounding on sprout emergence. Journal of Horticultural Science, 69, 47-52.
Miedema, P. and Kamminga, G. C. (1994). Bulb dormancy in onion. II. The role of cytokinins in high temperature bulb imposed sprout inhibition. Journal of Horticultural Science, 69, 41-45.
Mullins, E. D., McCollum, T. G. and McDonald, R. E. (2000). Consequences on ethylene metabolism of inactivating the ethylene receptor sites in diseased non-climacteric fruit. Postharvest Biology and Technology, 19, 155-164.
Nambara, E. and Marion-Poll, A. (2005). Abscisic acid biosynthesis and catabolism. Annual Review of Plant Biology, 56, 165-185.
Nemhauser, J. L., Hong, F. X. and Chory, J. (2006). Different plant hormones regulate similar processes through largely nonoverlapping transcriptional responses. Cell, 126, 467-475.
© 2006 Horticultural Development Council
210
NIAB. (2000). Vegetable variety handbook, National Institute of Agricultural Botany.
O'Connor, D. (1979). Onion Storage. Grower Books, London.
O’Connor, D. B. and Shipway, M. R. (1978). Bulb onions. The direct lifting/store drying system. Horticultural Technical Notes, ADAS. (unpublished).
O'Donoghue, E. M., Somerfield, S. D., Shaw, M., Bendall, M., Hedderly, D., Eason, J. and Sims, I. (2004). Evaluation of carbohydrates in Pukekohe Longkeeper and Grano cultivars of Allium cepa. Journal of Agricultural and Food Chemistry, 52, 5383-5390.
Ogata, K. (1961). Physiological studies on the storage of onion bulb. Bulletin of the University of Osaka Prefecture: Series B: Agriculture and Biology, 11, 99-120.
Pak, C., Vanderplas, L. H. W. and Deboer, A. D. (1995). Importance of dormancy and sink strength in sprouting of onions (Allium cepa) during storage. Physiologia Plantarum, 94, 277-283.
Pal, R. K. and Buescher, R. W. (1993). Respiration and ethylene evolution of certain fruits and vegetables in response to carbon dioxide in controlled atmosphere storage. Journal of Food Science and Technology, 30, 29-32.
Pesticide Residue Committee. (2006). Pesticide residues monitoring report 2005. Quarter ended September 2005. [online]. Available at: http://www.pesticides.gov.uk/uploadedfiles/Web_Assets/PRC/PRC_Q3_2005.pdf (Accessed: 14 August 2006).
Pompodakis, N. E.and Joyce, D. C. (2003). Abscisic acid analogue effects on the vase life and leaf crisping of cut Baccara roses. Australian Journal of Experimental Agriculture, 43, 425-428.
Praeger, U., Ernst, M. K. and Weichmann, J. (2003). Effects of ultra low oxygen storage on postharvest quality of onion bulbs (Allium cepa L. var. cepa). European Journal of Horticultural Science, 68, 14-19.
Prange, R. K., Daniels-Lake, B. J., Jeong, J-C. and Binns, M. (2005). Effects of ethylene and 1-methylcyclopropene on potato tuber sprout control and fry color. American Journal of Potato Research, 82, 123-128.
Prazen, .B. (2005). Chemometrics glossary of terms. [online]. Chemometrics and Informatics, Jon Wiley and Sons, Ltd. Available at:
© 2006 Horticultural Development Council
211
http://www.spectroscopynow.com/coi/cda/detail.cda?id=10118&type=EducationFeature&chId=9&page=1. (Accessed: 2 September 2006).
Price, C. E., Boatman, S. G. and Boddy, B. J. (1975). The uptake and translocation of 1-methylpyridinium chloride and related model compounds in wheat. Journal of Experimental Botany, 26, 521-532.
Pruski, K., Prange, R. K., Daniels-Lake, B. J., Nowak, J., Astatkie, T. and Ronis, D. H. (2006). Growth-room and field studies with seed tubers treated with ethylene and 1-methylcyclopropene (1-MCP) during storage. American Journal of Potato Research, 83, 149-160.
Quarrie, S. A., Whitford, P. N., Appleford, N. E .J., Wang, T. L., Cook, S. K., Henson, I. E. and Loveys, B. R. (1988). A monoclonal antibody to (S)-abscisic acid: its characterisation and use in a radioimmunoassay for measuring abscisic acid in crude extracts of cereal and lupin leaves. Planta, 173, 330-339.
Randle, W. M. (1992). Sulphur nutrition affects nonstructural water-soluble carbohydrates in onion germplasm. Hortscience, 27, 52-55.
Randle, W. M. (1997). Onion flavour chemistry and factors influencing flavour chemistry. In: Risch, S., J. and Ho, C.-T. (Eds.) Spices: Flavour chemistry and antioxidant properties. American Chemical Society, Washington.
Randle, W. M. and Bussard, M. L. (1993). Streamlining onion pungency analyses. Hortscience, 28, 60.
Randle, W. M., Bussard, M. L. and Warnock, D. F. (1993). Ontogeny and sulphur fertility affect leaf sulphur in short-day onions. Journal of the American Society for Horticultural Science, 118, 762-765.
Randle, W. M., Lancaster, J. E., Shaw, M. L., Sutton, K. H., Hay, R. L. and Bussard, M. L. (1995). Quantifying onion flavor compounds responding to sulfur fertility - sulfur increases levels of alk(en)yl cysteine sulfoxides and biosynthetic intermediates. Journal of the American Society for Horticultural Science, 120, 1075-1081.
Richmond, T. and Somerville, S. (2000). Chasing the dream: plant EST microarrays. Current Opinion in Plant Biology, 3, 108-116.
Ricroch, A. and Brown, S. C. (1997). DNA base composition of Allium genomes with different chromosome numbers. Gene, 205, 255-260.
Rosher, P. H., Jones, H. G. and Hedden, P. (1985). Validation of a radioimmunoassay for (+)-abscisic acid in extracts of apple and sweet pepper tissue using high-pressure liquid chromatography and
© 2006 Horticultural Development Council
212
combined gas chromatography-mass spectrometry. Planta, 165, 91-99.
Rutherford, R. and Whittle, R. (1982). The carbohydrate composition of onions during long term cold storage. Journal of Horticultural Science, 57, 249-356.
Rylski, I., Rappaport, L., Pratt, H. K. (1974). Dual effects of ethylene on potato dormancy and sprout growth. Plant Physiology, 53, 658-662.
Saito, S., Hirai, N., Matsumoto, S., Ohigashi, H., Ohta, D., Sakata, K. & Mizutani, M. (2004). Arapidopsis CYP707As encode (+)-abscisic acid 8'-hydroxylase, a key enzyme in the oxidative catabolism of abscisic acid. Plant Physiology, 134, 1439-1449.
Saito, S., Okamoto, M., Okamoto, M., Kushiro, T., Koshiba, T., Kamiya, Y., Hirai, N., Todoroki, Y., Sakata, K., Nambara, E. & Mizutani, M. (2006). A plant growth retardant, uniconazole, is a potent inhibitor of ABA catabolism in Arabidopsis. Bioscience Biotechnology and Biochemistry, 70, 1731-1739.
Salama, A. M., Hicks, J. R. and Nock, J. F. (1990). Sugar and organic acid changes in stored onion bulbs treated with maleic hydrazide. Hortscience, 25, 1625-1628.
Saltveit, M. E. (1999). Effect of ethylene on quality of fresh fruits and vegetables. Postharvest Biology and Technology, 15, 279-292.
Schwimmer, S. and Guadagni, D.G. (1962). Relation between olfactory threshold concentration and pyruvic acid content of onion juice. Journal of Food Science, 27, 94.97.
Schwimmer, S. and Weston, W. J. (1961). Enzymatic development of pyruvic acid in onion as a measure of pungency. Agricultural and Food Chemistry, 9, 301-304.
Shipway, M. R. (1977). Dry bulb onions: effects of various handling and drying practices. Kirton Experimental Horticulture Station: Fourteenth Report 1977, 53-57.
Sinclair, P. J., Blakeney, A. B. and Barlow, E. W. R. (1995a). Relationships between bulb dry matter content, soluble solids concentration and non-structural carbohydrate composition in the onion. Journal of the Science of Food and Agriculture, 69, 203-209.
Sinclair, P. J., Neeson, R. J. and Barlow, E. W. R. (1995b). Osmotic potential and soluble solids concentration in onion (Allium cepa) bulbs. Journal of the Science of Food and Agriculture, 69, 211-214.
© 2006 Horticultural Development Council
213
Sisler, E. C. (2006). The discovery and development of compounds counteracting ethylene at the receptor level. Biotechnology Advances, 24, 357-367.
Sisler, E. C. and Serek, M. (1997). Inhibitors of ethylene responses in plants at the receptor level: Recent developments. Physiologia Plantarum, 100, 577-582.
Sitton, J. W., Fellman, J. K., Patterson, M. E. (1997). Effects of low-oxygen and high-carbon dioxide atmospheres on postharvest quality, storage and decay of 'Walla Walla' sweet onions. In: Saltveit, M. E. (Ed.) Proceedings of the VII International Controlled Atmosphere Research Conference, Davis, CA, 13-18 July 1997, Postharvest Horticulture Series, 18, 20-25.
Smittle, D. A. (1988). Evaluation of storage methods for 'Granex' onions. Journal of the American Society for Horticultural Science, 133, 877-880.
Sorensen, J. N. and Grevsen, K. (2001). Sprouting in bulb onions (Allium cepa L.) as influenced by nitrogen and water stress. Journal of Horticultural Science and Biotechnology, 76, 501-506.
Sumner, P. E. (2000). Vidalia onion CA storage requirements. College of Agricultural and Environmental Sciences, University of Georgia.
Suslow, T. (1998). Onion Dry. Recommendations for maintaining postharvest quality. Department of Vegetable Crops, University of California.
Suslow, T. V. and Voss, R. (2002). Potato: (Immature early crop). Department of Vegetable Crops, University of California.
Suttle, J. and Hultstrand, J. F. (1994). Role of endogenous abscisic acid in potato microtuber dormancy. Plant Physiology, 105, 891-896.
Suzuki, M. and Cutliffe, J. (1989). Fructans in onion bulbs in relation to storage life. Canadian Journal of Plant Science, 69, 1327-1333.
Taylor, I. B., Sonneveld, T., Bugg, T. D. H. and Thompson, A. J. (2005). Regulation and manipulation of the biosynthesis of abscisic acid, including the supply of xanthophyll precursors. Journal of Plant Growth Regulation, 24, 253-273.
Terry, L. A., Law, K. A., Hipwood, K. J. and Bellamy, P. H. (2005). Non-structural carbohydrate profiles in onion bulbs influence taste preference. In: Frutic 05, Information and technology for sustainable
© 2006 Horticultural Development Council
214
fruit and vegetable production, 12-16 September 2005, Montpellier, France.
The Institute for Genomic Research. (2003). TIGR A. cepa Gene Index. [online]. Available at: http://www.tigr.org/tigr-scripts/tgi/T_index.cgi?species=onion. (Accessed: 23 August 2006).
Thomas, T. H. (1969). The role of growth substances in the regulation of onion bulb dormancy. Experimental Botany, 20, 124-137.
Thomas, T. H. and Isenberg, F. M. R. (1972). Hormone physiology of onion bulbs during dormancy. Experimental Horticulture, 23, 48-51.
Thompson, A. J., Jackson, A. C., Symonds, R. C., Mulholland, B. J., Dadswell, A. R., Blake, P. S., Burbidge, A. and Taylor, I. B. (2000). Ectopic expression of a tomato 9-cis-epoxycarotenoid dioxygenase gene causes over-production of abscisic acid. Plant Journal, 23, 363-374.
Tsukamoto, Y., Fujita, M., Inaba, T. and Asahira, T. (1969). Changes of growth promoting substances and abscisic acid during the dormancy in onion. Memoirs of the Research Institute for Food Science, Kyoto University, 30, 24-27.
Uddin, M. and MacTavish, H. S. (2003). Controlled atmosphere and regular storage-induced changes in S- alk(en)yl-L-cysteine sulfoxides and alliinase activity in onion bulbs (Allium cepa L. cv. Hysam). Postharvest Biology and Technology, 28, 239-245.
U.S. Department of Agriculture. (2004). USDA nutrient database for standard reference. Vol. 2004. [online]. Available at: http://www.nal.usda.gov/fnic/foodcomp (Accessed: 20 October 2004).
Voisin, A. S., Reidy, B., Parent, B., Rolland, G., Redondo, E., Gerentes, D., Tardieu, F. and Muller, B. (2006). Are ABA, ethylene or their interaction involved in the response of leaf growth to soil water deficit? An analysis using naturally occurring variation or genetic transformation of ABA production in maize. Plant Cell and Environment, 29, 1829-1840.
Wang, K. L. C., Li, H. and Ecker, J. R. (2002). Ethylene biosynthesis and signalling networks. Plant Cell, 14, S131-S151.
Watkins, C. B. (2006). The use of 1-methylcyclopropene (1-MCP) on fruits and vegetables. Biotechnology Advances, 24, 389-409.
Watkins, C. B. and Miller, W. B. (2005). A summary of physiological processes or disorders in fruits, vegetables and ornamental products that are delayed or decreased, increased, or unaffected by application of 1-methylcyclopropene (1-MCP). [online]. Department of
© 2006 Horticultural Development Council
215
Horticulture, Cornell University, Ithaca, New York. Available at: http://www.hort.cornell.edu/department/faculty/watkins/ethylene/index.htm. (Accessed: 4 December 2005).
Wheeler, T. R., Daymond, A. J., Ellis, R. H., Morison, J. I. L. and Hadley, P. (1998). Postharvest sprouting of onion bulbs grown in different temperature and CO2 environments in the UK. Journal of Horticultural Science and Biotechnology, 73, 750-754.
Wickramasinghe, U. L., Wright., C. J. and Currah, L. (2000). Bulbing responses of two cultivars of red tropical onions to photoperiod, light integral and temperature under controlled growth conditions. Journal of Horticultural Science and Biotechnology, 75, 304-311.
Wills, R. B. H., Ku, V. V. V., Shohet, D. and Kim, G. H. (1999). Importance of low ethylene levels to delay senescence of non-climacteric fruits and vegetables. Australian Journal of Experimental Agriculture, 39, 221-224.
Xiong, L. and Zhu, J-K. (2003). Regulation of abscisic acid biosynthesis. Plant Physiology, 133, 29-36.
Yamazaki, H., Nishijima, T. and Koshioka, M. (1995). Changes in abscisic acid content and water status in bulbs of Allium wakegi Araki throughout the year. Journal of the Japanese Society for Horticultural Science, 64, 589-598.
Yamazaki, H., Nishijima, T., Koshioka, M. and Miura, H. (2002). Gibberellins do not act against abscisic acid in the regulation of bulb dormancy of Allium wakegi Araki. Plant Growth Regulation, 36, 223-229.
Yamazaki, H., Nishijima, T., Yamato, Y., Koshioka, M. and Miura, H. (1999a). Involvement of abscisic acid (ABA) in bulb dormancy of Allium wakegi Araki I. Endogenous levels of ABA in relation to bulb dormancy and effects of exogenous ABA and fluridone. Plant Growth Regulation, 29, 189-194.
Yamazaki, H., Nishijima, T., Yamato, Y., Hamano, M., Koshioka, M. and Miura, H. (1999b). Involvement of abscisic acid in bulb dormancy of Allium wakegi Araki. II. A comparison between dormant and nondormant cultivars. Plant Growth Regulation, 29, 195-200.
Yang, S. F. (1969). Ethylene evolution from 2-Chlorophosphonic acid. Plant Physiology, 44, 1023-1024.
Yoo, K. S. and Pike, L. M. (1996). Controlled-atmosphere storage suppresses leaf growth and flowering in onion bulbs. Hortscience, 31, 875.
© 2006 Horticultural Development Council
216
Zaharia, L. I., Walker-Simmon, M. K., Rodriguez, C. N., and Abrams, S. R. (2005). Chemistry of abscisic acid, abscisic acid catabolites and analogs. Journal of Plant Growth Regulation, 24, 274-284.
© 2006 Horticultural Development Council
217
A. APPENDIX
Validation of the abscisic acid radio-immunoassay
A.1 Introduction
The radio-immunoassay was validated for onion bulb tissue. Thin layer chromatography of samples and standards was used to investigate the spread of immuno-reactivity of samples on the TLC plate compared to that of pure ABA. A spike dilution test was performed as a method of detecting interference in crude onion extracts. A range of serial dilutions of onion bulb extract were spiked with known amounts of ABA to generate a series of plots of ABA detected against ABA added. In the absence of interference the lines generated should be parallel. The absolute values obtained where the plots intercept the y-axis should decrease in concert with the increase, and in proportion with the dilution factor (Rosher et al., 1985).
A.2 Materials and methods
A.2.1Experiment 1 - Thin layer chromatography of abscisic acid
Standards and samples were prepared as follows: Plate 1: 20 μl each of 4 x 10⁴ pg ml-1 ABA solution and sample (Ailsa Craig, day 0, S-Ca-) were lyophilised and rehydrated with 10 μl of 100 % methanol. Plate 2: 50 μl each of 5 x 10³, 1 x 10⁴, 2 x 10⁴, 4 x 10⁴, 5 x 10⁵, 5 x 10⁷ and 5 x 10⁹ pg ml-1 (+)-ABA solution were lyophilised and rehydrated with 15 μl of 100% methanol. The concentration of ABA in samples eluted from TLC plates was determined by radio-immunoassay (as described in Chapter 3, section 3.3.8).
Twenty cm x 20 cm TLC plates (Merck, Darmstadt, Germany) were cleaned by three runs in 100% (v/v) methanol followed by two runs in
© 2006 Horticultural Development Council
218
chloroform prior to activation by heating to 120°C for one hour (Dorffling and Tietz, 1983). The running solvent was 100 ml of 10:1:1 (v/v/v) isopropanol : ammonia : water. The plates were developed (n=1) in the dark. The silica was scraped off the plate in 1.5 cm sections in each lane. Samples on plate 1 were eluted twice in 300 μl of 80% (v/v) methanol (Dorffling and Tietz, 1893); samples on plate 2 were eluted overnight at 4°C in the dark with 300 μl of 80% (v/v) methanol, followed by a 6 hour second elution step. The silica was removed by centrifugation. The supernatant was lyophilised and then rehydrated with 120 μl (plate 1) or 160 μl (plate 2) of sterile distilled water.
A.2.2Spike dilution
Various combinations of cultivar, frozen and lyophilised tissues, water and methanol extractions, and purification processes were used (Table A.1). All initial extractions were performed as in Chapter 3, section 3.3.8. Controls were sterile distilled water in place of tissue extract. Linear regression models using Genstat for Windows Version 7.1.0.198 (VSN International Ltd., Herts., UK) were applied to the plots of ABA detected against ABA added obtained from the spike dilution assays.
A.3 Results and discussion
A.3.1Experiment 1 – Thin layer chromatography
The Rf value of ABA in the TLC running solvent is 0.6 (Dorffling and Tietz, 1983), therefore the ABA in the sample should have travelled 7.8 cm along the plate. No distinct peak in ABA concentration was observed in the sample eluted from this zone of plate 1 (Figure A.1). Radio-immunoassay of this crude onion extract detected 573.5 pg ABA per 50 μl of extract, therefore ca. 230 pg was loaded onto the TLC plate. Approximately 120 pg ABA was
© 2006 Horticultural Development Council
219
detected in the zone covering the Rf value of ABA indicating that the elution step was inefficient.
Distance on plate (cm)
0.0-1.
5
1.6-3.
0
3.1-4.
5
4.5-6.
0
6.1-7.
5
7.6-9.
0
9.1-10
.5
10.6-
12.0
AB
A d
etec
ted
(pg)
0
20
40
60
80
100
120
140
Figure A.1. ABA detected by radio-immunoassay in samples eluted from a thin layer chromatogram of crude onion extract dissolved in methanol.
The sensitivity of the assay was investigated by plotting the amount of ABA detected in the samples eluted from the Rf zone on a TLC plate (plate 2) loaded with a range of known amounts of ABA, against the mean ABA detected in each zone eluted from the plate (the background) (Figure A.2). ABA detected in the appropriate Rf zone can only be distinguished from the background when >1500 pg ABA is loaded onto the plate. This explains why a distinct peak in ABA concentration was not observed in the samples eluted from the crude onion extract thin layer chromatogram, as the relatively tiny amount of ABA in the sample would not have been distinguished from the background.
© 2006 Horticultural Development Council
220
ABA added (pg)
10-1 100 101 102 103 104 105 106 107 108
AB
A d
etec
ted
(pg)
0
10000
20000
30000
40000
Figure A.2. ABA detected in the samples eluted from the appropriate R f
zone of a thin layer chromatogram of known amounts of ABA dissolved in methanol (open symbols) and the mean ABA detected by radio-immunoassay in each zone – the background (closed symbols).
A.3.2Experiment 2 – Spike dilution
Linear regression analysis of the plots of ABA added against ABA detected from the spike dilution showed that the most appropriate model (P<0.001) was that where all of the lines share the same gradient - 0.8932 (s.e. 0.0238) ABA added / ABA detected, but have different y-intercepts (Table A.1).
© 2006 Horticultural Development Council
221
Table A.1. The y-intercept of each dilution factor and the control from the spike dilution assay,
derived from a linear regression model with a common gradient and different y-intercepts.
Assay No. Dilution factor
Y intercept (pg ABA)
S.E.1
1,2,6 Control 24.9 11.26 1RP 214.3* 20.52 2RM 129.6* 20.55 2A 181.6* 22.36 2RP 83.1** 20.51 3R 260.5* 20.55 3A 168.9* 22.32 4RM 19.7 20.53 4A 26.1 20.55 4A 116.8* 22.37 5A 111.9* 22.33 6A -2.3 20.57 10A 74.6** 22.33 14A -16.4** 20.54 20LR 247.7* 20.67 20A 70.7** 22.31 24R 30.6 20.54 300LR 33.3 20.64 800LR 34.3 20.6
1 S.E. = standard error of the difference between the intercept of the reference level (control) and each dilution factor. L Samples were lyophilised (all other samples were frozen tissue). * p = <0.001, ** p = ≤0.05. P values represent the significance of the difference between the intercept of the reference level (control) and each dilution factor. M ABA was extracted from fresh tissue using 100% (v/v) methanol at a ratio of 1ml methanol to 1g of tissue. The sample was lyophilised and then rehydrated with sterile distilled water. P Samples purified following extraction; ABA extract acidified to pH 3 with an equal volume of citrate phosphate buffer. 2 ml of the extract, followed by 5 ml 30% methanol, was loaded onto a reversed phase SepPak C18 Plus cartridge (Waters Ltd., Herts., UK) primed with a strong solvent (5 ml 100% methanol) followed by a weak solvent (5 ml 5% acetic acid) under gravity.
© 2006 Horticultural Development Council
222
The ABA was then eluted from the column with 5 ml 60% methanol. The eluate was lyophilised and rehydrated with sterile distilled water. Samples taken from onion cv. A Ailsa Craig or R Renate bulb.
All of the lines shared a common gradient, indicating that the assay successfully detected ABA in the sample and that nothing in the onion sample interfered with the measurements. A gradient close to, but less than, one suggests that the assay is not quite 100% efficient. The Y intercept should represent the amount of ABA in 25 μl of onion extract. The control intercept should be zero, all other intercepts were greater than the control apart from the two negative intercepts and one other which was not significantly different from the control. The samples with negative intercepts were assayed in the same batch, suggesting that was an experimental error in this batch. The higher the dilution factor, the lower the intercept should be, but the highest intercept was given by dilution factor 20. However, these samples were extracted from dry tissue and as onions have high water content, ABA would be much more concentrated in a dry sample. The methanol extraction used in assay no. 2 seems to have been less efficient at extracting ABA. The Y intercept of dilution factors of ≥24 were not significantly different from the mean, this may be expected as the initial ABA concentration of a highly diluted sample before the addition of the spike would be negligible and therefore make the intercept very similar to the control.
A.4 Conclusion
The ABA RIA appeared to be capable of measuring the ABA concentration in crude lyophilised onion extract without the need for further purification of the sample.
© 2006 Horticultural Development Council
223
B. APPENDIX
Statistical tables
B.1 ANOVA tables for Chapter ThreeTables B.1-3. Effect of preharvest calcium and sulphur treatments, and time during postharvest controlled atmosphere storage on sprout growth in onion cvs. Ailsa Craig, Renate and SS1 (Section 3.4.2, Figure 3.2A).
Table B.1. Ailsa Craig.Source of variation d.f. s.s. m.s. v.r. F pr.Day 5 1761.5 352.3 2.51 0.034Calcium 1 243 243 1.73 0.191Sulphur 1 15.9 15.9 0.11 0.737Day.Calcium 5 1022.1 204.4 1.46 0.21Day.Sulphur 5 353.5 70.7 0.5 0.773Calcium.Sulphur 1 39.8 39.8 0.28 0.596Day.Calcium.Sulphur 5 1155.6 231.1 1.65 0.153Residual 120 16857.2 140.5 Total 143 21448.6
Table B.2. Renate.Source of variation d.f. (m.v.) s.s. m.s. v.r. F pr.Days 6 2497.75 416.29 3.73 0.009Calcium 1 258.44 258.44 2.32 0.141Sulphur 1 5.77 5.77 0.05 0.822Days.Calcium 6 856.09 142.68 1.28 0.304Days.Sulphur 6 978.42 163.07 1.46 0.233Calcium.Sulphur 1 17.53 17.53 0.16 0.695Days.Calcium.Sulphur 6 244.65 40.77 0.37 0.893Residual 138 -2 9790.98 173.91
Total 165 -214632.0
9
© 2006 Horticultural Development Council
224
Table B.3. SS1.Source of variation d.f. (m.v.) s.s. m.s. v.r. F pr.Day 6 57604.4 9600.7 10.68 <.001Calcium 1 97.6 97.6 0.11 0.742Sulphur 1 1278 1278 1.42 0.235Day.Calcium 6 3255.4 542.6 0.6 0.727Day.Sulphur 6 5941.6 990.3 1.1 0.363Calcium.Sulphur 1 3071 3071 3.42 0.066Day.Calcium.Sulphur 6 1919.3 319.9 0.36 0.906
Residual 184 -4165338.
2 898.6
Total 211 -4234611.
5
Tables B.4-7. Effect of preharvest calcium and sulphur treatments, and time during postharvest controlled atmosphere storage on dry weight in onion cvs. Ailsa Craig, Renate and SS1 (Section 3.4.3).
Table B.4. All cultivars.Source of variation d.f. (m.v.) s.s. m.s. v.r. F pr.
Variety 21175.63
2 587.816 75.54 <.001Residual 106 -3 824.89 7.782
Total 108 -31964.57
9
Table B.5. Ailsa Craig.Source of variation d.f. (m.v.) s.s. m.s. v.r. F pr.Days 3 7.6419 2.5473 2.83 0.074Calcium 1 0.2228 0.2228 0.25 0.626Sulphur 1 3.1062 3.1062 3.45 0.083Days.Calcium 3 1.5733 0.5244 0.58 0.636Days.Sulphur 3 4.6778 1.5593 1.73 0.203Calcium.Sulphur 1 0.1938 0.1938 0.22 0.649Days.Calcium.Sulphur 3 1.5361 0.512 0.57 0.644Residual 15 -1 13.5099 0.9007 Total 30 -1 31.5995
Table B.6. Renate.Source of variation d.f. s.s. m.s. v.r. F pr.Days 5 625.335 125.067 25.11 <.001Calcium 1 0.656 0.656 0.13 0.72Sulphur 1 0.226 0.226 0.05 0.833Days.Calcium 5 9.093 1.819 0.37 0.867Days.Sulphur 5 7.566 1.513 0.3 0.906Calcium.Sulphur 1 0.096 0.096 0.02 0.891Days.Calcium.Sulphur 5 4.935 0.987 0.2 0.96
© 2006 Horticultural Development Council
225
Residual 24 119.524 4.98 Total 47 767.43
© 2006 Horticultural Development Council
226
Table B.7. SS1.Source of variation d.f. (m.v.) s.s. m.s. v.r. F pr.Days 3 3.253 1.0843 3.29 0.052Calcium 1 0.0171 0.0171 0.05 0.823Sulphur 1 0.456 0.456 1.38 0.259Days.Calcium 3 0.5955 0.1985 0.6 0.624Days.Sulphur 3 2.3426 0.7809 2.37 0.114Calcium.Sulphur 1 0.0496 0.0496 0.15 0.704Days.Calcium.Sulphur 3 0.1087 0.0362 0.11 0.953Residual 14 -2 4.6103 0.3293 Total 29 -2 10.3725
Tables B.8-10. Effect of preharvest calcium and sulphur treatments, and time during postharvest controlled atmosphere storage on total soluble solids in onion cvs. Ailsa Craig, Renate and SS1(Section 3.4.4, Figure 3.2B).
Table B.8. Ailsa Craig.Source of variation d.f. s.s. m.s. v.r. F pr.Days 5 112.184 22.437 11.3 <.001Calcium 1 4.731 4.731 2.38 0.125Sulphur 1 4.445 4.445 2.24 0.137Days.Calcium 5 8.314 1.663 0.84 0.526Days.Sulphur 5 18.095 3.619 1.82 0.114Calcium.Sulphur 1 0.918 0.918 0.46 0.498Days.Calcium.Sulphur 5 13.396 2.679 1.35 0.249Residual 120 238.352 1.986 Total 143 400.434
Table B.9. Renate.Source of variation d.f. (m.v.) s.s. m.s. v.r. F pr.Days 6 53.348 8.891 3.76 0.002Calcium 1 0.539 0.539 0.23 0.634Sulphur 1 3.925 3.925 1.66 0.2Days.Calcium 6 13.328 2.221 0.94 0.469Days.Sulphur 6 38.945 6.491 2.74 0.015Calcium.Sulphur 1 0.79 0.79 0.33 0.564Days.Calcium.Sulphur 6 11.027 1.838 0.78 0.589Residual 139 -1 328.785 2.365 Total 166 -1 450.377
© 2006 Horticultural Development Council
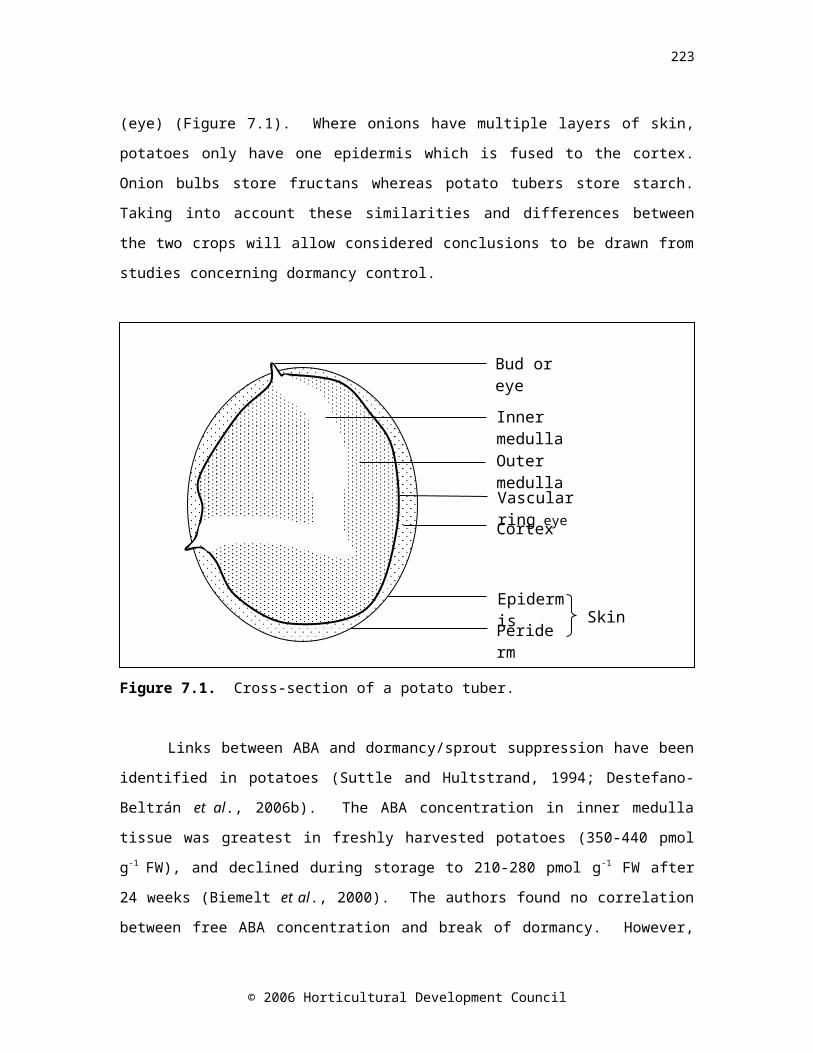
227
Table B.10. SS1.Source of variation d.f. s.s. m.s. v.r. F pr.Days 6 104.651 17.442 12.06 <.001Calcium 1 0.001 0.001 0 0.985Sulphur 1 0.251 0.251 0.17 0.677Days.Calcium 6 16.251 2.708 1.87 0.09Days.Sulphur 6 17.78 2.963 2.05 0.063Calcium.Sulphur 1 1.993 1.993 1.38 0.242Days.Calcium.Sulphur 6 5.49 0.915 0.63 0.704Residual 140 202.462 1.446 Total 167 348.879
Tables B.11-.14. Effect of preharvest calcium and sulphur treatments, and time during postharvest controlled atmosphere storage on firmness in onion cvs. Ailsa Craig, Renate and SS1 (Section 3.4.5, Figure 3.2C).
Table B.11. All cultivars.
Source of variation d.f. s.s. m.s. v.r. F pr.
Cultivar 20.00193
480.00096
74 62.63 <.001
Calcium 13.024E-
053.024E-
05 1.96 0.17Sulphur 1 5.47E-06 5.47E-06 0.35 0.556Cultivar.Calcium 2 7.77E-06 3.88E-06 0.25 0.779
Cultivar.Sulphur 20.00003
751.875E-
05 1.21 0.309Calcium.Sulphur 1 0 0 0 1Cultivar.Calcium.Sulphur 2 5.87E-06 2.94E-06 0.19 0.828
Residual 360.00055
61.545E-
05
Total 470.00257
76
Table B.12. Ailsa Craig.Source of variation d.f. s.s. m.s. v.r. F pr.
Day 50.00078
120.00015
62 13.78 <.001Calcium 1 1.46E-06 1.46E-06 0.13 0.72Sulphur 1 5E-08 5E-08 0 0.947
Day.Calcium 59.153E-
051.831E-
05 1.61 0.162
Day.Sulphur 59.347E-
051.869E-
05 1.65 0.153Calcium.Sulphur 1 2.97E-06 2.97E-06 0.26 0.61Day.Calcium.Sulphur 5
6.194E-05
1.239E-05 1.09 0.368
Residual 1120.00126
971.134E-
05
Total 1350.00230
24
© 2006 Horticultural Development Council
228
Table B. 13. Renate.Source of variation d.f. s.s. m.s. v.r. F pr.
Days 60.00091
730.00015
29 2.15 0.052
Calcium 10.00010
760.00010
76 1.51 0.221
Sulphur 10.00017
720.00017
72 2.49 0.117
Days.Calcium 60.00055
349.223E-
05 1.3 0.263
Days.Sulphur 60.00025
484.247E-
05 0.6 0.732
Calcium.Sulphur 11.334E-
051.334E-
05 0.19 0.666Days.Calcium.Sulphur 6
0.0004891
8.151E-05 1.15 0.339
Residual 1320.00938
737.112E-
05
Total 1590.01190
01
Table B.14. SS1.Source of variation d.f. (m.v.) s.s. m.s. v.r. F pr.Days 6 4.41E-04 7.35E-05 11.94 <.001Calcium 1 3.42E-05 3.42E-05 5.55 0.02Sulphur 1 4.66E-06 4.66E-06 0.76 0.385Days.Calcium 6 2.65E-05 4.42E-06 0.72 0.636Days.Sulphur 6 7.23E-05 1.21E-05 1.96 0.074Calcium.Sulphur 1 1.86E-05 1.86E-05 3.02 0.084Days.Calcium.Sulphur 6 1.13E-05 1.88E-06 0.31 0.933Residual 177 -3 1.09E-03 6.16E-06 Total 204 -3 1.69E-03
Tables B.15-18. Effect of preharvest calcium and sulphur treatments, and time during postharvest controlled atmosphere storage on pyruvate concentration in onion cvs. Ailsa Craig, Renate and SS1 (Section 3.4.6,Figure 3.3A).
Table B.15. Pre-storage, all cultivars. Source of variation d.f. s.s. m.s. v.r. F pr.Variety 2 125.344 62.672 19.15 0.003Calcium 1 5.515 5.515 1.69 0.199Sulphur 1 14.681 14.681 4.49 0.038Variety.Calcium 2 13.523 6.761 2.07 0.136Variety.Sulphur 2 3.995 1.998 0.61 0.546Calcium.Sulphur 1 0.264 0.264 0.08 0.777Variety.Calcium.Sulphur 2 1.417 0.709 0.22 0.806Residual 60 196.375 3.273 Total 71 361.115
© 2006 Horticultural Development Council
229
Table B.16. Ailsa Craig.Source of variation d.f. s.s. m.s. v.r. F pr.Days 5 176.606 35.321 13.42 <.001Calcium 1 4.827 4.827 1.83 0.178Sulphur 1 36.875 36.875 14.01 <.001Days.Calcium 5 38.827 7.765 2.95 0.015Days.Sulphur 5 42.311 8.462 3.21 0.009Calcium.Sulphur 1 11.326 11.326 4.3 0.04Days.Calcium.Sulphur 5 17.633 3.527 1.34 0.252Residual 120 315.937 2.633 Total 143 644.342
Table B.17. Renate.Source of variation d.f. (m.v.) s.s. m.s. v.r. F pr.Days 6 424.517 70.753 13.41 <.001Calcium 1 2.783 2.783 0.53 0.469Sulphur 1 26.178 26.178 4.96 0.028Days.Calcium 6 15.227 2.538 0.48 0.822Days.Sulphur 6 30.653 5.109 0.97 0.449Calcium.Sulphur 1 4.382 4.382 0.83 0.364Days.Calcium.Sulphur 6 14.516 2.419 0.46 0.838Residual 139 -1 733.383 5.276
Total 166 -11251.62
8
Table B.18. SS1.Source of variation d.f. s.s. m.s. v.r. F pr.Days 6 26.072 4.345 3.91 0.001Calcium 1 12.835 12.835 11.55 <.001Sulphur 1 0.237 0.237 0.21 0.645Days.Calcium 6 6.459 1.076 0.97 0.449Days.Sulphur 6 11.149 1.858 1.67 0.132Calcium.Sulphur 1 0.928 0.928 0.83 0.363Days.Calcium.Sulphur 6 7.276 1.213 1.09 0.371Residual 140 155.636 1.112 Total 167 220.592
Tables B.19-22. Effect of preharvest calcium and sulphur treatments, and time during postharvest controlled atmosphere storage on total fructan concentration in onion cvs. Ailsa Craig, Renate and SS1 (Section 3.4.7, Figure 3.3B).
Table B.19. Pre-storage, all cultivars.Source of variation d.f. s.s. m.s. v.r. F pr.
© 2006 Horticultural Development Council
230
Variety 2 1309.26 654.63 55.54 <.001Residual 9 106.07 11.79 Total 11 1415.33
© 2006 Horticultural Development Council
231
Table B.20. Ailsa Craig.Source of variation d.f. s.s. m.s. v.r. F pr.Days 5 233.31 46.66 1.48 0.242Calcium 1 391.81 391.81 12.39 0.002Sulphur 1 17.01 17.01 0.54 0.472Days.Calcium 5 53.81 10.76 0.34 0.882Days.Sulphur 5 40.64 8.13 0.26 0.931Calcium.Sulphur 1 22.41 22.41 0.71 0.41Days.Calcium.Sulphur 5 63.24 12.65 0.4 0.843Residual 20 632.25 31.61 Total 43 1454.49
Table B.21. Renate.Source of variation d.f. s.s. m.s. v.r. F pr.Days 6 1951.59 325.27 18.73 <.001Calcium 1 334.42 334.42 19.25 <.001Sulphur 1 442.26 442.26 25.46 <.001Days.Calcium 6 69.95 11.66 0.67 0.674Days.Sulphur 6 157.12 26.19 1.51 0.218Calcium.Sulphur 1 330.78 330.78 19.04 <.001Days.Calcium.Sulphur 6 219.18 36.53 2.1 0.09Residual 24 416.85 17.37Total 51 3922.14
Table B.22. SS1.Source of variation d.f. (m.v.) s.s. m.s. v.r. F pr.Day 6 6.871 1.145 0.55 0.767Calcium 1 31.389 31.389 14.98 <.001Sulphur 1 8.289 8.289 3.96 0.059Day.Calcium 6 15.382 2.564 1.22 0.33Day.Sulphur 6 18.654 3.109 1.48 0.228Calcium.Sulphur 1 6.19 6.19 2.95 0.099Day.Calcium.Sulphur 6 24.727 4.121 1.97 0.112Residual 23 -1 48.189 2.095 Total 50 -1 158.441
Table B.23-. Effect of preharvest calcium and sulphur treatments, and time during postharvest controlled atmosphere storage on abscisic acid concentration in onion cvs. Ailsa Craig, Renate and SS1 (Section 3.4.8, Figure 3.3C).
Table B.23-28. Pre-storage, all cultivars.Source of variation d.f. s.s. m.s. v.r. F pr.Variety 2 83588 41794 4.07 0.055
© 2006 Horticultural Development Council
232
Residual 9 92387 10265 Total 11 175976
© 2006 Horticultural Development Council
233
Table B.24. Ailsa Craig.Source of variation d.f. s.s. m.s. v.r. F pr.Days 5 256930 51386 43.28 <.001Calcium 1 4067 4067 3.43 0.079Sulphur 1 53 53 0.04 0.835Days.Calcium 5 42337 8467 7.13 <.001Days.Sulphur 5 57347 11469 9.66 <.001Calcium.Sulphur 1 209 209 0.18 0.679Days.Calcium.Sulphur 5 3285 657 0.55 0.734Residual 20 23747 1187Total 43 387977
Table B.25. RenateSource of variation d.f. s.s. m.s. v.r. F pr.Days 6 134489 22415 12.42 <.001Calcium 1 8 8 0 0.947Sulphur 1 12563 12563 6.96 0.014Days.Calcium 6 16079 2680 1.48 0.226Days.Sulphur 6 7376 1229 0.68 0.667Calcium.Sulphur 1 6 6 0 0.956Days.Calcium.Sulphur 6 20485 3414 1.89 0.124Residual 24 43329 1805 Total 51 234334
Table B.26. SS1.Source of variation d.f. (m.v.) s.s. m.s. v.r. F pr.Days 6 20024.8 3337.5 4.75 0.003Calcium 1 2538.2 2538.2 3.62 0.07Sulphur 1 12155.3 12155.3 17.31 <.001Days.Calcium 6 12247.3 2041.2 2.91 0.029Days.Sulphur 6 5900.4 983.4 1.4 0.257Calcium.Sulphur 1 5379.3 5379.3 7.66 0.011Days.Calcium.Sulphur 6 12676.8 2112.8 3.01 0.025Residual 23 -1 16148 702.1 Total 50 -1 85437.7
© 2006 Horticultural Development Council
234
Table B.27. Ailsa Craig v SS1.
Source of variation d.f. s.s. m.s. v.r. F pr.Variety 1 51340 51340 40.96 <.001Days 3 141323 47108 37.58 <.001Calcium 1 14854 14854 11.85 0.002Sulphur 1 3032 3032 2.42 0.133Variety.Days 3 53081 17694 14.12 <.001Variety.Calcium 1 2086 2086 1.66 0.209Days.Calcium 3 27627 9209 7.35 0.001Variety.Sulphur 1 5759 5759 4.59 0.042Days.Sulphur 3 40083 13361 10.66 <.001Calcium.Sulphur 1 2546 2546 2.03 0.167Variety.Days.Calcium 3 10006 3335 2.66 0.071Variety.Days.Sulphur 3 21026 7009 5.59 0.005Variety.Calcium.Sulphur 1 2054 2054 1.64 0.213Days.Calcium.Sulphur 3 7052 2351 1.88 0.161Variety.Days.Calcium.Sulphur 3 648 216 0.17 0.914Residual 24 30083 1253Total 55 412599
Table B.28. Renate v SS1.
Source of variation d.f. s.s. m.s. v.r. F pr.Variety 1 87900 87900 76.64 <.001Days 1 40125 40125 34.98 <.001Calcium 1 1515 1515 1.32 0.284Sulphur 1 2651 2651 2.31 0.167Variety.Days 1 7710 7710 6.72 0.032Variety.Calcium 1 3638 3638 3.17 0.113Days.Calcium 1 3803 3803 3.32 0.106Variety.Sulphur 1 8184 8184 7.14 0.028Days.Sulphur 1 162 162 0.14 0.717Calcium.Sulphur 1 5528 5528 4.82 0.059Variety.Days.Calcium 1 387 387 0.34 0.577Variety.Days.Sulphur 1 306 306 0.27 0.62Variety.Calcium.Sulphur 1 1187 1187 1.04 0.339Days.Calcium.Sulphur 1 155 155 0.13 0.723Variety.Days.Calcium.Sulphur 1 2454 2454 2.14 0.182Residual 8 9176 1147 Total 23 174880
© 2006 Horticultural Development Council
235
Table B.29-39. Effect of preharvest calcium and sulphur treatments, and time during postharvest controlled atmosphere storage on elemental composition in onion cvs. Ailsa Craig, Renate and SS1 (Section 3.4.1, Figure 3.1).
Table B.29. Boron, all cultivars.
Source of variation d.f. s.s. m.s. v.r. F pr.
Variety 211443.6
9 5721.85 147.27 <.001Days 2 8.34 4.17 0.11 0.899Calcium 1 64.54 64.54 1.66 0.21Sulphur 1 17.43 17.43 0.45 0.509Variety.Days 4 303.09 75.77 1.95 0.135Variety.Calcium 2 84.63 42.31 1.09 0.353Days.Calcium 2 14.54 7.27 0.19 0.831Variety.Sulphur 2 2.34 1.17 0.03 0.97Days.Sulphur 2 973.66 486.83 12.53 <.001Calcium.Sulphur 1 21.55 21.55 0.55 0.464Variety.Days.Calcium 4 31.87 7.97 0.21 0.933Variety.Days.Sulphur 4 1581.52 395.38 10.18 <.001Variety.Calcium.Sulphur 2 25.8 12.9 0.33 0.721Days.Calcium.Sulphur 2 20.19 10.09 0.26 0.773Variety.Days.Calcium.Sulphur 4 18.38 4.6 0.12 0.975Residual 24 932.44 38.85Total 59 15544
Table B.30. Calcium , all cultivars.
Source of variation d.f. (m.v.) s.s. m.s. v.r. F pr.Variety 2 1844574 922287 0.99 0.386Days 2 4091468 2045734 2.2 0.133Calcium 1 181852 181852 0.2 0.662Sulphur 1 3644077 3644077 3.91 0.059
Variety.Days 41313340
8 3283352 3.53 0.021Variety.Calcium 2 2583158 1291579 1.39 0.269Days.Calcium 2 78166 39083 0.04 0.959Variety.Sulphur 2 1932761 966381 1.04 0.37Days.Sulphur 2 1926739 963369 1.03 0.371Calcium.Sulphur 1 1941150 1941150 2.08 0.162Variety.Days.Calcium 4 4449664 1112416 1.19 0.339Variety.Days.Sulphur 4 2936317 734079 0.79 0.544Variety.Calcium.Sulphur 2 1067050 533525 0.57 0.571Days.Calcium.Sulphur 2 1494150 747075 0.8 0.46Variety.Days.Calcium.Sulphur 3 -1 4717217 1572406 1.69 0.196
Residual 242234419
9 931008
Total 58 -16513652
1
© 2006 Horticultural Development Council
236
Table B.31. Copper, all cultivars.
Source of variation d.f. (m.v.) s.s. m.s. v.r. F pr.
Variety 210449.9
8 5224.99 112.53 <.001Days 2 435.1 217.55 4.69 0.019Calcium 1 20.65 20.65 0.44 0.511Sulphur 1 0.08 0.08 0 0.968Variety.Days 4 474.48 118.62 2.55 0.065Variety.Calcium 2 14.72 7.36 0.16 0.854Days.Calcium 2 60.67 30.33 0.65 0.529Variety.Sulphur 2 3.58 1.79 0.04 0.962Days.Sulphur 2 1646.36 823.18 17.73 <.001Calcium.Sulphur 1 21.06 21.06 0.45 0.507Variety.Days.Calcium 4 85.63 21.41 0.46 0.764Variety.Days.Sulphur 4 2391.64 597.91 12.88 <.001Variety.Calcium.Sulphur 2 132.16 66.08 1.42 0.261Days.Calcium.Sulphur 2 66.93 33.46 0.72 0.497Variety.Days.Calcium.Sulphur 3 -1 63.24 21.08 0.45 0.717Residual 24 1114.35 46.43
Total 58 -116878.4
1 Table B.32. Iron, all cultivars.
Source of variation d.f. (m.v.) s.s. m.s. v.r. F pr.Variety 2 2140.66 1070.33 14.36 <.001Days 2 10.08 5.04 0.07 0.935Calcium 1 333.58 333.58 4.48 0.045Sulphur 1 303.25 303.25 4.07 0.055Variety.Days 4 780.9 195.23 2.62 0.06Variety.Calcium 2 474.07 237.03 3.18 0.06Days.Calcium 2 187.25 93.63 1.26 0.303Variety.Sulphur 2 40.51 20.26 0.27 0.764Days.Sulphur 2 376.68 188.34 2.53 0.101Calcium.Sulphur 1 257.42 257.42 3.45 0.075Variety.Days.Calcium 4 148.27 37.07 0.5 0.738Variety.Days.Sulphur 4 293.39 73.35 0.98 0.435Variety.Calcium.Sulphur 2 120.67 60.34 0.81 0.457Days.Calcium.Sulphur 2 29.59 14.79 0.2 0.821Variety.Days.Calcium.Sulphur 3 -1 21.61 7.2 0.1 0.961Residual 24 1789.01 74.54 Total 58 -1 7073.26
© 2006 Horticultural Development Council
237
Table B.33. Potassium, all cultivars.
Source of variation d.f. (m.v.) s.s. m.s. v.r. F pr.
Variety 29973624
24986812
1 21.26 <.001
Days 25078870
82539435
4 10.82 <.001Calcium 1 1085722 1085722 0.46 0.503Sulphur 1 1082 1082 0 0.983
Variety.Days 41431711
5 3579279 1.53 0.226
Variety.Calcium 23035754
61517877
3 6.47 0.006
Days.Calcium 21447366
8 7236834 3.08 0.064Variety.Sulphur 2 454467 227234 0.1 0.908
Days.Sulphur 25297139
12648569
6 11.29 <.001
Calcium.Sulphur 11089955
01089955
0 4.65 0.041
Variety.Days.Calcium 41468734
2 3671836 1.57 0.216
Variety.Days.Sulphur 42887881
3 7219703 3.08 0.035
Variety.Calcium.Sulphur 21238065
5 6190327 2.64 0.092Days.Calcium.Sulphur 2 8288456 4144228 1.77 0.192Variety.Days.Calcium.Sulphur 3 -1
10346971 3448990 1.47 0.248
Residual 245630650
9 2346105
Total 58 -14032712
59
Table B.34. Magnesium, all cultivars.
Source of variation d.f. (m.v.) s.s. m.s. v.r. F pr.Variety 2 405817 202909 36.04 <.001Days 2 978 489 0.09 0.917Calcium 1 22302 22302 3.96 0.058Sulphur 1 4661 4661 0.83 0.372Variety.Days 4 17356 4339 0.77 0.555Variety.Calcium 2 29760 14880 2.64 0.092Days.Calcium 2 5271 2635 0.47 0.632Variety.Sulphur 2 21703 10851 1.93 0.167Days.Sulphur 2 31067 15534 2.76 0.083Calcium.Sulphur 1 21496 21496 3.82 0.062Variety.Days.Calcium 4 5606 1402 0.25 0.907Variety.Days.Sulphur 4 23268 5817 1.03 0.41Variety.Calcium.Sulphur 2 3189 1595 0.28 0.756Days.Calcium.Sulphur 2 1356 678 0.12 0.887Variety.Days.Calcium.Sulphur 3 -1 8218 2739 0.49 0.695Residual 24 135104 5629 Total 58 -1 723793
© 2006 Horticultural Development Council
238
Table B.35. Manganese, all cultivars.
Source of variation d.f. (m.v.) s.s. m.s. v.r. F pr.Variety 2 133.077 66.539 14.28 <.001Days 2 6.674 3.337 0.72 0.499Calcium 1 0.174 0.174 0.04 0.848Sulphur 1 5.871 5.871 1.26 0.273Variety.Days 4 28.619 7.155 1.54 0.224Variety.Calcium 2 2.417 1.208 0.26 0.774Days.Calcium 2 2.628 1.314 0.28 0.757Variety.Sulphur 2 35 17.5 3.76 0.038Days.Sulphur 2 29.226 14.613 3.14 0.062Calcium.Sulphur 1 5.727 5.727 1.23 0.279Variety.Days.Calcium 4 5.127 1.282 0.28 0.891Variety.Days.Sulphur 4 31.752 7.938 1.7 0.182Variety.Calcium.Sulphur 2 20.754 10.377 2.23 0.13Days.Calcium.Sulphur 2 10.704 5.352 1.15 0.334Variety.Days.Calcium.Sulphur 3 -1 5.382 1.794 0.39 0.765Residual 24 111.796 4.658Total 58 -1 418.038
Table B.36. Sodium, all cultivars.
Source of variation d.f. (m.v.) s.s. m.s. v.r. F pr.Variety 2 2833311 1416656 79.56 <.001Days 2 49373 24686 1.39 0.269Calcium 1 21063 21063 1.18 0.288Sulphur 1 45252 45252 2.54 0.124Variety.Days 4 188811 47203 2.65 0.058Variety.Calcium 2 65 32 0 0.998Days.Calcium 2 41789 20895 1.17 0.326Variety.Sulphur 2 113652 56826 3.19 0.059Days.Sulphur 2 211869 105935 5.95 0.008Calcium.Sulphur 1 3038 3038 0.17 0.683Variety.Days.Calcium 4 121769 30442 1.71 0.181Variety.Days.Sulphur 4 226688 56672 3.18 0.031Variety.Calcium.Sulphur 2 5348 2674 0.15 0.861Days.Calcium.Sulphur 2 52238 26119 1.47 0.251Variety.Days.Calcium.Sulphur 3 -1 172702 57567 3.23 0.04Residual 24 427347 17806 Total 58 -1 4514028
© 2006 Horticultural Development Council
239
Table B.37. Phosphorus, all cultivars.
Source of variation d.f. s.s. m.s. v.r. F pr.Variety 2 1097061 548530 6.96 0.004Days 2 790056 395028 5.01 0.015Calcium 1 232835 232835 2.95 0.099Sulphur 1 20153 20153 0.26 0.618Variety.Days 4 326201 81550 1.03 0.41Variety.Calcium 2 51078 25539 0.32 0.726Days.Calcium 2 156788 78394 0.99 0.385Variety.Sulphur 2 183695 91847 1.17 0.329Days.Sulphur 2 1394608 697304 8.85 0.001Calcium.Sulphur 1 54131 54131 0.69 0.415Variety.Days.Calcium 4 119420 29855 0.38 0.821Variety.Days.Sulphur 4 1187750 296937 3.77 0.016Variety.Calcium.Sulphur 2 197623 98811 1.25 0.303Days.Calcium.Sulphur 2 120212 60106 0.76 0.477Variety.Days.Calcium.Sulphur 4 223224 55806 0.71 0.594Residual 24 1891359 78807 Total 59 8046192
Table B.38. Sulphur, all cultivars.
Source of variation d.f. s.s. m.s. v.r. F pr.Variety 2 6711232 3355616 13.27 <.001Days 2 4336825 2168413 8.57 0.002Calcium 1 1102659 1102659 4.36 0.048Sulphur 1 4460 4460 0.02 0.895Variety.Days 4 614981 153745 0.61 0.661Variety.Calcium 2 302287 151144 0.6 0.558Days.Calcium 2 503535 251768 1 0.384Variety.Sulphur 2 1242240 621120 2.46 0.107Days.Sulphur 2 1098535 549268 2.17 0.136Calcium.Sulphur 1 454973 454973 1.8 0.192Variety.Days.Calcium 4 234640 58660 0.23 0.918Variety.Days.Sulphur 4 335960 83990 0.33 0.854Variety.Calcium.Sulphur 2 520359 260180 1.03 0.373Days.Calcium.Sulphur 2 242235 121117 0.48 0.625Variety.Days.Calcium.Sulphur 4 1953817 488454 1.93 0.138Residual 24 6069929 252914
Total 592572866
7
© 2006 Horticultural Development Council
240
Table B.39. Zinc, all cultivars.
Source of variation d.f. (m.v.) s.s. m.s. v.r. F pr.Variety 2 1088.71 544.36 16.56 <.001Days 2 200.57 100.28 3.05 0.066Calcium 1 24.96 24.96 0.76 0.392Sulphur 1 267.44 267.44 8.13 0.009Variety.Days 4 173.07 43.27 1.32 0.292Variety.Calcium 2 154.93 77.46 2.36 0.116Days.Calcium 2 73.59 36.79 1.12 0.343Variety.Sulphur 2 203.87 101.93 3.1 0.063Days.Sulphur 2 463.26 231.63 7.04 0.004Calcium.Sulphur 1 86.64 86.64 2.64 0.118Variety.Days.Calcium 4 197 49.25 1.5 0.234Variety.Days.Sulphur 4 129.7 32.43 0.99 0.434Variety.Calcium.Sulphur 2 354 177 5.38 0.012Days.Calcium.Sulphur 2 5.79 2.89 0.09 0.916Variety.Days.Calcium.Sulphur 3 -1 93.43 31.14 0.95 0.433Residual 24 789.14 32.88 Total 58 -1 4036.46
B.2 Non-linear regression analysis for Chapter ThreeTables B.40-42. Non-linear regression analysis of the relationship between ABA concentration and time in controlled atmosphere storage (Section 3.4.8, Table 3.4).
Table B.40. Ailsa Craig.
Response variate: ABAExplanatory: DaysFitted Curve: A + B*(R**X)Constraints: R < 1
d.f. s.s. m.s. v.r. F pr.Regression 2 48020.9 24010.5 187.89 <.001Residual 3 383.4 127.8Total 5 48404.3 9680.9
Percentage variance accounted for 98.7Standard error of observations is estimated to be 11.3
© 2006 Horticultural Development Council
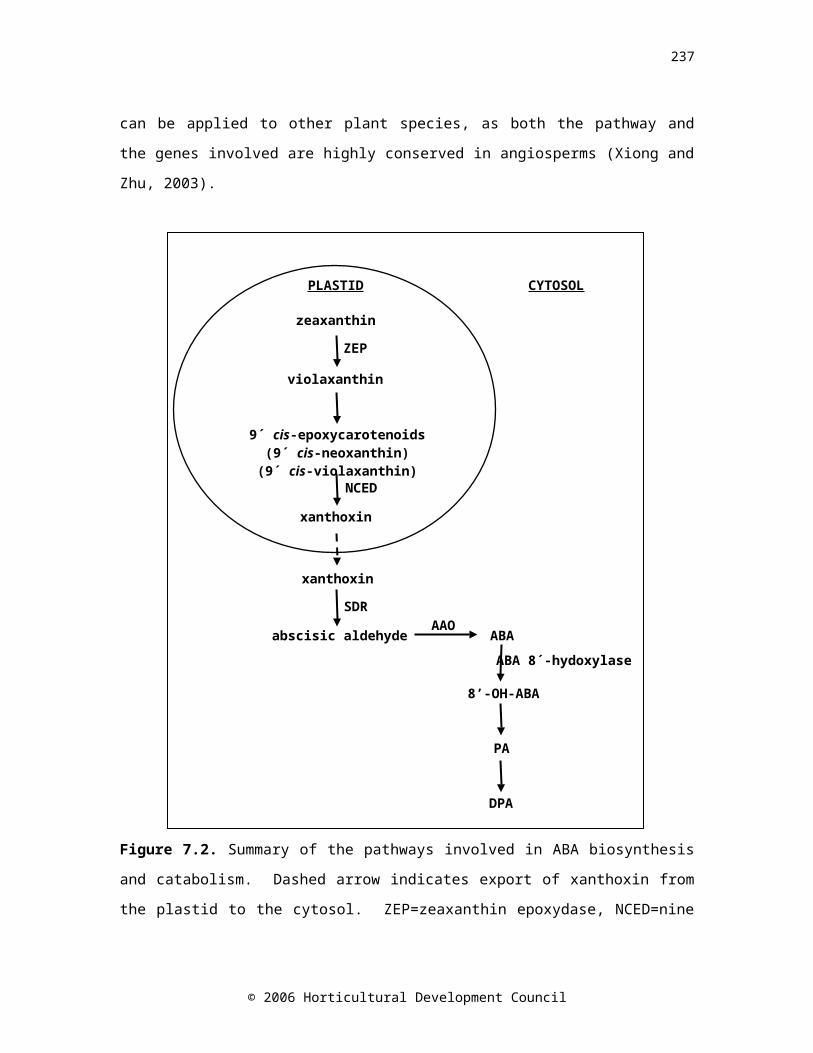
241
Table B.41. Renate.
Response variate: ABAExplanatory: DaysFitted Curve: A + B*(R**X)Constraints: R < 1
d.f. s.s. m.s. v.r. F pr.Regression 2 28411.1
14205.55 271 <.001
Residual 4 209.7 52.42Total 6 28620.8 4770.13
Table B.42. SS1.
Response variate: ABAExplanatory: DaysFitted Curve: A + B*(R**X)Constraints: R < 1
d.f. s.s. m.s. v.r. F pr.Regression 2 2802.2 1401.1 8.6 0.036Residual 4 651.6 162.9Total 6 3453.8 575.6
Percentage variance accounted for 71.7
B.3 ANOVA tables for Chapter FourTables B.43-48. Effect of pre-harvest (Section 4.4.1.2, Table 4.6, Figure 4.2) or postharvest (Section 4.4.2.1, Figure 4.14) application of exogenous ABA or an ABA analogue, and time during postharvest storage at 4, 12 or 20ºC on sprout growth (log transformed values for preharvest application data) in onion cvs. Carlos, Dinaro, Hysam, Red Baron, Renate and SS1.
Table B.43. Pre-harvest application - 4°C.Source of variation d.f. (m.v.) s.s. m.s. v.r. F pr.
Cultivar 518.3813
8 3.67628 135.08 <.001
Day 525.2556
2 5.05112 185.6 <.001Treatment 3 1.19507 0.39836 14.64 <.001Cultivar.Day 14 -11 2.31009 0.16501 6.06 <.001Cultivar.Treatment 15 1.22022 0.08135 2.99 <.001Day.Treatment 12 -3 1.24182 0.10348 3.8 <.001Cultivar.Day.Treatment 39 -36 1.3508 0.03464 1.27 0.136
© 2006 Horticultural Development Council
242
Residual 322 -254 8.76319 0.02721
Total 415 -30425.7675
7
Table B.44. Pre-harvest application - 12°C.Source of variation d.f. (m.v.) s.s. m.s. v.r. F pr.
Cultivar 549.2639
8 9.8528 413.64 <.001
Day 520.9164
9 4.1833 175.62 <.001Treatment 3 0.7415 0.24717 10.38 <.001Cultivar.Day 8 -17 0.93575 0.11697 4.91 <.001Cultivar.Treatment 15 1.328 0.08853 3.72 <.001Day.Treatment 12 -3 1.40707 0.11726 4.92 <.001Cultivar.Day.Treatment 16 -59 0.48475 0.0303 1.27 0.218Residual 194 -382 4.62104 0.02382
Total 258 -46126.2811
5
Table B.45. Pre-harvest application - 20°C.Source of variation d.f. (m.v.) s.s. m.s. v.r. F pr.
Cultivar 527.3235
2 5.4647 134.32 <.001
Day 527.6972
4 5.53945 136.15 <.001Treatment 3 1.06179 0.35393 8.7 <.001Cultivar.Day 5 -20 5.02802 1.0056 24.72 <.001Cultivar.Treatment 15 5.00458 0.33364 8.2 <.001Day.Treatment 11 -4 3.78713 0.34428 8.46 <.001Cultivar.Day.Treatment 0 -75 0.0537 Residual 121 -455 4.92292 0.04069
Total 165 -55420.9562
6
Table B.46. Postharvest application - 4°C. Source of variation d.f. s.s. m.s. v.r. F pr.
Days 3126326.
7 42108.9 66.69 <.001Treatment 2 272.5 136.3 0.22 0.807Days.Treatment 6 2831.4 471.9 0.75 0.615Residual 39 24626.2 631.4
Total 50154056.
8 Table B.47. Postharvest application - 12°C.Source of variation d.f. s.s. m.s. v.r. F pr.Days 3 13930.4 4643.5 17.75 <.001Treatment 2 728.2 364.1 1.39 0.261
© 2006 Horticultural Development Council
243
Days.Treatment 6 2669.7 445.0 1.70 0.147Residual 39 10202.3 261.6 Total 50 27530.6
© 2006 Horticultural Development Council
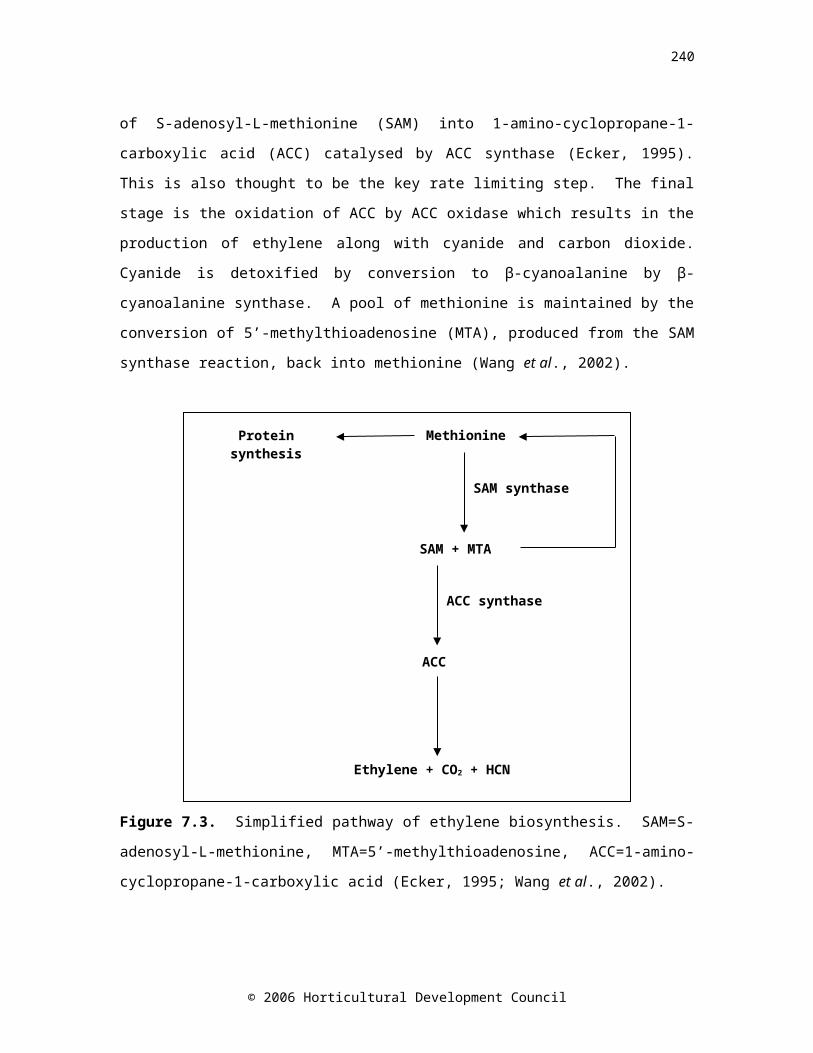
244
Table B.48. Postharvest application - 20°C.Source of variation d.f. s.s. m.s. v.r. F pr.Days 3 2767.5 922.5 4.51 0.008 Treatment 2 427.8 213.9 1.05 0.361Days.Treatment 6 1390.5 231.7 1.13 0.361 Residual 39 7975.1 204.5Total 50 12560.9
Tables B.49-55. Effect of pre-harvest (Section 4.4.1.3, Figure 4.3) or postharvest (Section 4.4.2.2, Figure 4.15) application of exogenous ABA or an ABA analogue, and time during postharvest storage at 4, 12 or 20ºC on firmness of onion cvs. Carlos, Dinaro, Hysam, Red Baron, Renate and SS1.
Table B.49. Pre-harvest application – Pre-storage.Source of variation d.f. s.s. m.s. v.r. F pr.Cultivar 5 7156.16 1431.23 14.89 <.001Treatment 3 48.72 16.24 0.17 0.917Cultivar.Treatment 15 1549.59 103.31 1.07 0.39Residual 96 9226.46 96.11
Total 11917980.9
4
Table B.50. Pre-harvest application - 4°C. Source of variation d.f. (m.v.) s.s. m.s. v.r. F pr.Day 5 42267.3 8453.46 165.7 <.001
Cultivar 549642.7
2 9928.54 194.61 <.001Treatment 3 64.13 21.38 0.42 0.739Day.Cultivar 22 -3 3007.46 136.7 2.68 <.001Day.Treatment 15 495.97 33.06 0.65 0.835Cultivar.Treatment 15 1528.76 101.92 2 0.014Day.Cultivar.Treatment 66 -9 3826.07 57.97 1.14 0.226
Residual 526 -5026835.5
6 51.02
Total 657 -6291340.1
2
Table B.51. Pre-harvest application - 12°C.Source of variation d.f. (m.v.) s.s. m.s. v.r. F pr.
Day 510040.2
1 2008.04 28.93 <.001
Cultivar 584172.0
2 16834.4 242.53 <.001Treatment 3 244.42 81.47 1.17 0.319Day.Cultivar 24 -1 6209.23 258.72 3.73 <.001Day.Treatment 15 1444.39 96.29 1.39 0.148Cultivar.Treatment 15 976.78 65.12 0.94 0.521Day.Cultivar.Treatm 72 -3 6553.64 91.02 1.31 0.052
© 2006 Horticultural Development Council
245
ent
Residual 556 -2038593.5
9 69.41
Total 695 -24127520.
49 Table B.52. Pre-harvest application - 20°C.Source of variation d.f. (m.v.) s.s. m.s. v.r. F pr.Day 5 2698.3 539.66 6.79 <.001
Cultivar 583213.5
816642.7
2 209.3 <.001Treatment 3 307.42 102.47 1.29 0.277Day.Cultivar 24 -1 5822.08 242.59 3.05 <.001Day.Treatment 15 981.36 65.42 0.82 0.652Cultivar.Treatment 15 1285.38 85.69 1.08 0.374Day.Cultivar.Treatment 72 -3 8627.57 119.83 1.51 0.007
Residual 551 -2543813.8
7 79.52
Total 690 -29130092.
56
Table B.53. Postharvest application - 4°C.Source of variation d.f. (m.v.) s.s. m.s. v.r. F pr.Days 3 6985.44 2328.48 39.46 <.001Treatment 2 136.07 68.04 1.15 0.327Days.Treatment 6 429.44 71.57 1.21 0.323Residual 35 -4 2065.44 59.01Total 46 -4 8981.11
Table B.54. Postharvest application - 12°C.Source of variation d.f. (m.v.) s.s. m.s. v.r. F pr.Days 3 1187.44 395.81 5.55 0.003Treatment 2 28.82 14.41 0.2 0.818Days.Treatment 6 432.35 72.06 1.01 0.434Residual 36 -3 2568.82 71.36 Total 47 -3 4012.54
Table B.55. Postharvest application - 20°C.Source of variation d.f. (m.v.) s.s. m.s. v.r. F pr.Days 3 1075.93 358.64 3.8 0.018Treatment 2 91.68 45.84 0.49 0.619Days.Treatment 6 110.27 18.38 0.19 0.976Residual 35 -4 3301.62 94.33 Total 46 -4 4515.26
© 2006 Horticultural Development Council
246
Tables B.56-62. Effect of pre-harvest (Section 4.4.1.4, Figure 4.4) or postharvest (Section 4.4.2.2, Figure 4.15) application of exogenous ABA or an ABA analogue, and time during postharvest storage at 4, 12 or 20ºC on dry weight of onion cvs. Carlos, Dinaro, Hysam, Red Baron, Renate and SS1.
Table B.56. Pre-harvest application – Pre-storage.Source of variation d.f. s.s. m.s. v.r. F pr.Cultivar 5 536.884 107.377 47.41 <.001Treatment 3 66.491 22.164 9.79 <.001Cultivar.Treatment 15 89.094 5.94 2.62 0.002Residual 96 217.445 2.265Total 119 909.914
Table B.57. Pre-harvest application - 4°C.Source of variation d.f. (m.v.) s.s. m.s. v.r. F pr.Day 5 690.93 138.186 98.9 <.001
Cultivar 52758.08
8 551.618 394.8 <.001Treatment 3 45.482 15.161 10.85 <.001Day.Cultivar 22 -3 57.228 2.601 1.86 0.01Day.Treatment 15 150.758 10.051 7.19 <.001Cultivar.Treatment 15 91.629 6.109 4.37 <.001Day.Cultivar.Treatment 66 -9 167.845 2.543 1.82 <.001Residual 525 -51 733.537 1.397
Total 656 -633263.96
7
Table B.58. Pre-harvest application - 12°C.Source of variation d.f. (m.v.) s.s. m.s. v.r. F pr.Day 5 357.488 71.498 47.83 <.001
Cultivar 54049.29
8 809.86 541.78 <.001Treatment 3 41.737 13.912 9.31 <.001Day.Cultivar 24 -1 52.651 2.194 1.47 0.071Day.Treatment 15 77.188 5.146 3.44 <.001Cultivar.Treatment 15 80.546 5.37 3.59 <.001Day.Cultivar.Treatment 72 -3 212.508 2.952 1.97 <.001Residual 558 -18 834.103 1.495Total 697 -22 5074.76
Table B.59. Pre-harvest application - 20°C.Source of variation d.f. (m.v.) s.s. m.s. v.r. F pr.Day 5 411.385 82.277 36.21 <.001
Cultivar 53591.42
7 718.285 316.1 <.001Treatment 3 31.761 10.587 4.66 0.003Day.Cultivar 24 -1 93.714 3.905 1.72 0.019
© 2006 Horticultural Development Council
247
Day.Treatment 15 83.097 5.54 2.44 0.002Cultivar.Treatment 15 88.541 5.903 2.6 <.001Day.Cultivar.Treatment 72 -3 208.739 2.899 1.28 0.072
Residual 555 -211261.15
4 2.272
Total 694 (25) 5024.72
8
Table B.60. Postharvest application - 4°C.Source of variation d.f. s.s. m.s. v.r. F pr.Days 3 132.396 44.132 6.25 0.001Treatment 2 17.533 8.766 1.24 0.3Days.Treatment 6 9.506 1.584 0.22 0.966Residual 39 275.477 7.064 Total 50 434.912
© 2006 Horticultural Development Council
248
Table B.61. Postharvest application - 12°C.Source of variation d.f. s.s. m.s. v.r. F pr.Day 3 89.25 29.75 8.41 <.001Treatment 2 4.21 2.105 0.59 0.557Days.Treatment 6 7.896 1.316 0.37 0.892Residual 39 137.988 3.538Total 50 239.343
Table B.62. Postharvest application - 20°C.Source of variation d.f. s.s. m.s. v.r. F pr.Days 3 66.349 22.116 7.31 <.001Treatment 2 8.879 4.439 1.47 0.243Days.Treatment 6 9.92 1.653 0.55 0.769Residual 39 117.931 3.024Total 50 203.078
Tables B.63-69. Effect of pre-harvest (Section 4.4.1.5, Figure 4.5) or postharvest (Section 4.4.2.3, Figure 4.16) application of exogenous ABA or an ABA analogue, and time during postharvest storage at 4, 12 or 20ºC on total soluble solids content of onion cvs. Carlos, Dinaro, Hysam, Red Baron, Renate and SS1.
Table B.63. Pre-harvest application – Pre-storage.Source of variation d.f. s.s. m.s. v.r. F pr.
Cultivar 5374.729
4 74.9459 80.22 <.001Treatment 3 26.8402 8.9467 9.58 <.001Cultivar.Treatment 15 29.7182 1.9812 2.12 0.015Residual 96 89.692 0.9343
Total 119520.979
9
Table B.64. Pre-harvest application - 4°C.Source of variation d.f. (m.v.) s.s. m.s. v.r. F pr.
Day 51268.19
2 253.638 156.86 <.001
Cultivar 51156.29
2 231.258 143.02 <.001Treatment 3 58.048 19.349 11.97 <.001Day.Cultivar 22 -3 123.791 5.627 3.48 <.001Day.Treatment 15 97.007 6.467 4 <.001Cultivar.Treatment 15 82.113 5.474 3.39 <.001Day.Cultivar.Treatment 66 -9 183.663 2.783 1.72 <.001Residual 526 -50 850.511 1.617
Total 657 -623575.99
3
© 2006 Horticultural Development Council
249
Table B.65. Pre-harvest application - 12°C.Source of variation d.f. (m.v.) s.s. m.s. v.r. F pr.
Day 51095.46
5 219.093 126.1 <.001
Cultivar 51990.65
3 398.131 229.15 <.001Treatment 3 51.227 17.076 9.83 <.001Day.Cultivar 24 -1 221.16 9.215 5.3 <.001Day.Treatment 15 48.579 3.239 1.86 0.024Cultivar.Treatment 15 60.364 4.024 2.32 0.003Day.Cultivar.Treatment 72 -3 176.25 2.448 1.41 0.019Residual 558 -18 969.499 1.737
Total 697 -224314.53
9
Table B.66. Pre-harvest application - 20°C.Source of variation d.f. (m.v.) s.s. m.s. v.r. F pr.Day 5 112.053 22.411 8.51 <.001
Cultivar 52524.56
9 504.914 191.66 <.001Treatment 3 6.121 2.04 0.77 0.509Day.Cultivar 24 -1 59.935 2.497 0.95 0.535Day.Treatment 15 110.487 7.366 2.8 <.001Cultivar.Treatment 15 52.81 3.521 1.34 0.175Day.Cultivar.Treatment 72 -3 262.27 3.643 1.38 0.026
Residual 557 -191467.37
1 2.634
Total 696 (23)4189.90
2
Table B.67. Postharvest application - 4°C.Source of variation d.f. s.s. m.s. v.r. F pr.Days 3 4.253 1.418 0.91 0.446Treatment 2 0.429 0.214 0.14 0.872Days.Treatment 6 6.383 1.064 0.68 0.666Residual 39 60.933 1.562 Total 50 71.997
Table B.68. Postharvest application - 12°C.Source of variation d.f. s.s. m.s. v.r. F pr.Days 3 85.589 28.53 13.38 <.001Treatment 2 3.827 1.914 0.9 0.416Days.Treatment 6 28.504 4.751 2.23 0.061Residual 39 83.133 2.132Total 50 201.053
Table B.69. Postharvest application - 20°C.Source of d.f. s.s. m.s. v.r. F pr.
© 2006 Horticultural Development Council
250
variationDays 3 5.069 1.69 0.7 0.556Treatment 2 4.505 2.252 0.94 0.4Days.Treatment 6 18.942 3.157 1.31 0.274Residual 39 93.668 2.402 Total 50 122.184
© 2006 Horticultural Development Council
251
Tables B.70-76. Effect of pre-harvest (Section 4.4.1.6, Figure 4.6) or postharvest (Section 4.4.2.3, Figure 4.16) application of exogenous ABA or an ABA analogue, and time during postharvest storage at 4, 12 or 20ºC on pyruvate concentration of onion cvs. Carlos, Dinaro, Hysam, Red Baron, Renate and SS1.
Table B.70. Pre-harvest application – Pre-storage.Source of variation d.f. s.s. m.s. v.r. F pr.Cultivar 5 102.724 20.545 16.01 <.001Treatment 3 30.81 10.27 8 <.001Cultivar.Treatment 15 143.951 9.597 7.48 <.001Residual 96 123.212 1.283Total 119 400.697
Table B.71. Pre-harvest application - 4°C.Source of variation d.f. (m.v.) s.s. m.s. v.r. F pr.Day 5 248.391 49.678 28.17 <.001Cultivar 5 696.901 139.38 79.03 <.001Treatment 3 60.834 20.278 11.5 <.001Day.Cultivar 22 -3 131.563 5.98 3.39 <.001Day.Treatment 15 224.365 14.958 8.48 <.001Cultivar.Treatment 15 233.357 15.557 8.82 <.001Day.Cultivar.Treatment 66 -9 458.395 6.945 3.94 <.001Residual 526 -50 927.621 1.764
Total 657 -622830.78
4
Table B.72. Pre-harvest application - 12°C.Source of variation d.f. (m.v.) s.s. m.s. v.r. F pr.Day 5 121.153 24.231 11.92 <.001Cultivar 5 907.863 181.573 89.33 <.001Treatment 3 53.861 17.954 8.83 <.001Day.Cultivar 24 -1 213.67 8.903 4.38 <.001Day.Treatment 15 93.887 6.259 3.08 <.001Cultivar.Treatment 15 95.684 6.379 3.14 <.001Day.Cultivar.Treatment 72 -3 386.57 5.369 2.64 <.001
Residual 559 -171136.19
9 2.033
Total 698 -212905.29
2
Table B.73. Pre-harvest application - 20°C.Source of variation d.f. (m.v.) s.s. m.s. v.r. F pr.Day 5 277.903 55.581 18.69 <.001Cultivar 5 541.042 108.208 36.38 <.001Treatment 3 91.59 30.53 10.26 <.001Day.Cultivar 24 -1 167.093 6.962 2.34 <.001Day.Treatment 15 44.563 2.971 1 0.455
© 2006 Horticultural Development Council
252
Cultivar.Treatment 15 117.893 7.86 2.64 <.001Day.Cultivar.Treatment 72 -3 441.334 6.13 2.06 <.001
Residual 557 -191656.73
8 2.974
Total 696 -233302.41
7
Table B.74. Postharvest application - 4°C.Source of variation d.f. s.s. m.s. v.r. F pr.Days 3 12.19 4.063 1.9 0.146Treatment 2 23.536 11.768 5.5 0.008Days.Treatment 6 38.564 6.427 3 0.016Residual 39 83.445 2.14 Total 50 157.734
Table B.75. Postharvest application - 12°C.Source of variation d.f. s.s. m.s. v.r. F pr.Days 3 26.418 8.806 1.48 0.235Treatment 2 64.184 32.092 5.39 0.009Days.Treatment 6 24.638 4.106 0.69 0.659Residual 39 232.02 5.949 Total 50 347.259
Table B.76. Postharvest application - 20°C.Source of variation d.f. s.s. m.s. v.r. F pr.Days 3 16.037 5.346 2.15 0.11Treatment 2 23.534 11.767 4.73 0.015Days.Treatment 6 32.383 5.397 2.17 0.067Residual 39 97.119 2.49 Total 50 169.073
Tables B.77-83. Effect of pre-harvest (Section 4.4.1.8, Figure 4.13) or postharvest (Section 4.4.2.4, Figure 4.17) application of exogenous ABA or an ABA analogue, and time during postharvest storage at 4, 12 or 20ºC on ABA concentration (log transformed values) of onion cvs. Carlos, Dinaro, Hysam, Red Baron, Renate and SS1.
Table B.77. Pre-harvest application – Pre-storage.Source of variation d.f. (m.v.) s.s. m.s. v.r. F pr.Cultivar 5 1.29814 0.25963 6.2 <.001Treatment 3 0.94817 0.31606 7.55 <.001Cultivar.Treatment 15 2.13696 0.14246 3.4 <.001Residual 95 -1 3.97644 0.04186Total 118 -1 8.31377
© 2006 Horticultural Development Council
253
Table B.78. Pre-harvest application - 4°C.Source of variation d.f. (m.v.) s.s. m.s. v.r. F pr.Cultivar 5 3.09795 0.61959 17.75 <.001Day 5 6.81252 1.3625 39.03 <.001Treatment 3 0.33244 0.11081 3.17 0.024Cultivar.Day 24 -1 2.48683 0.10362 2.97 <.001Cultivar.Treatment 15 1.44231 0.09615 2.75 <.001Day.Treatment 15 3.24317 0.21621 6.19 <.001Cultivar.Day.Treatment 72 -3 4.31179 0.05989 1.72 <.001
Residual 554 -2219.3398
3 0.03491
Total 693 -2639.0655
3 Table B.79. Pre-harvest application -12°C.Source of variation d.f. (m.v.) s.s. m.s. v.r. F pr.Cultivar 5 0.53298 0.1066 2.95 0.012Day 5 9.59459 1.91892 53.15 <.001Treatment 3 0.42604 0.14201 3.93 0.009Cultivar.Day 24 -1 3.39555 0.14148 3.92 <.001Cultivar.Treatment 15 0.853 0.05687 1.57 0.076Day.Treatment 15 2.85841 0.19056 5.28 <.001Cultivar.Day.Treatment 72 -3 6.48551 0.09008 2.49 <.001
Residual 556 -2020.0748
9 0.03611
Total 695 -2443.8928
5 Table B.80. Pre-harvest application - 20°C.Source of variation d.f. (m.v.) s.s. m.s. v.r. F pr.Cultivar 5 2.62507 0.52501 11.71 <.001Day 5 5.28595 1.05719 23.57 <.001Treatment 3 0.91999 0.30666 6.84 <.001Cultivar.Day 22 -3 1.44693 0.06577 1.47 0.079Cultivar.Treatment 15 1.37557 0.0917 2.04 0.011Day.Treatment 15 7.32645 0.48843 10.89 <.001Cultivar.Day.Treatment 66 -9 6.47004 0.09803 2.19 <.001
Residual 524 -5223.5030
2 0.04485
Total 655 -6446.5358
8
Table B.81. Postharvest application - 4°C.Source of variation d.f. s.s. m.s. v.r. F pr.Days 3 0.65722 0.21907 5.75 0.002Treatment 2 0.21475 0.10737 2.82 0.072Days.Treatment 6 0.30367 0.05061 1.33 0.268
© 2006 Horticultural Development Council
254
Residual 39 1.48702 0.03813 Total 50 2.66266
© 2006 Horticultural Development Council
255
Table B.82. Postharvest application - 12°C.Source of variation d.f. (m.v.) s.s. m.s. v.r. F pr.Days 3 1.03533 0.34511 12.27 <.001Treatment 2 0.01765 0.00882 0.31 0.733Days.Treatment 6 0.14711 0.02452 0.87 0.525Residual 38 -1 1.06914 0.02814Total 49 -1 2.23386
Table B.83. Postharvest application - 12°C.Source of variation d.f. s.s. m.s. v.r. F pr.Days 3 3.37413 1.12471 36.97 <.001Treatment 2 0.0016 0.0008 0.03 0.974Days.Treatment 6 0.11881 0.0198 0.65 0.689Residual 39 1.18643 0.03042 Total 50 4.68097
Tables B.84-87. Effect of pre-harvest (Section 4.4.1.7, Figure 4.8) application of exogenous ABA or an ABA analogue, and time during postharvest storage at 4, 12 or 20ºC on sucrose concentration of onion cvs. Red Baron, Renate and SS1.
Table B.84. Pre-harvest application – Pre-storage.Source of variation d.f. s.s. m.s. v.r. F pr.Cultivar 2 54850 27425 14.17 <.001Treatment 3 11571 3857 1.99 0.142Cultivar.Treatment 6 4180 697 0.36 0.897Residual 24 46458 1936Total 35 117058
Table B.85. Pre-harvest application - 4°C.Source of variation d.f. (m.v.) s.s. m.s. v.r. F pr.Cultivar 2 325929 162965 96.15 <.001Day 5 94191 18838 11.11 <.001Treatment 3 13688 4563 2.69 0.049Cultivar.Day 7 -3 50336 7191 4.24 <.001Cultivar.Treatment 6 24402 4067 2.4 0.032Day.Treatment 15 33647 2243 1.32 0.199Cultivar.Day.Treatment 21 -9 35641 1697 1 0.467Residual 120 -24 203384 1695Total 179 -36 706294
© 2006 Horticultural Development Council
256
Table B.86. Pre-harvest application - 12°C.Source of variation d.f. (m.v.) s.s. m.s. v.r. F pr.Cultivar 2 733291 366645 318.54 <.001Day 5 28874 5775 5.02 <.001Treatment 3 5167 1722 1.5 0.218Cultivar.Day 9 -1 47122 5236 4.55 <.001Cultivar.Treatment 6 9761 1627 1.41 0.214Day.Treatment 15 40165 2678 2.33 0.005Cultivar.Day.Treatment 27 -3 35629 1320 1.15 0.298Residual 136 -8 156537 1151Total 203 -12 1011370
Table B.87. Pre-harvest application -20°C.Source of variation d.f. (m.v.) s.s. m.s. v.r. F pr.Cultivar 2 764670 382335 280.2 <.001Day 5 60444 12089 8.86 <.001Treatment 3 3522 1174 0.86 0.463Cultivar.Day 9 -1 56496 6277 4.6 <.001Cultivar.Treatment 6 9568 1595 1.17 0.327Day.Treatment 15 54365 3624 2.66 0.002Cultivar.Day.Treatment 27 -3 50276 1862 1.36 0.128Residual 132 -12 180115 1365Total 199 -16 1112576
Tables B.88-91. Effect of pre-harvest (Section 4.4.1.7, Figure 4.9) application of exogenous ABA or an ABA analogue, and time during postharvest storage at 4, 12 or 20ºC on glucose concentration of onion cvs. Red Baron, Renate and SS1.
Table B.88. Pre-harvest application – Pre-storage.Source of variation d.f. s.s. m.s. v.r. F pr.
Cultivar 2113907.
6 56953.8 84.73 <.001Treatment 3 8946.3 2982.1 4.44 0.013Cultivar.Treatment 6 15955.2 2659.2 3.96 0.007Residual 24 16132.9 672.2 Total 35 154942
Table B.89. Pre-harvest application - 4°C.Source of variation d.f. (m.v.) s.s. m.s. v.r. F pr.
Cultivar 2 320335160167.
5 177.18 <.001Day 5 44810.5 8962.1 9.91 <.001Treatment 3 11035.3 3678.4 4.07 0.009Cultivar.Day 7 -3 58574.3 8367.8 9.26 <.001
© 2006 Horticultural Development Council
257
Cultivar.Treatment 6 39303.7 6550.6 7.25 <.001Day.Treatment 15 21313.7 1420.9 1.57 0.092Cultivar.Day.Treatment 21 -9 38325.1 1825 2.02 0.01
Residual 120 -24108480.
3 904
Total 179 -36549842.
3
© 2006 Horticultural Development Council
258
Table B.90. Pre-harvest application - 12°C.Source of variation d.f. (m.v.) s.s. m.s. v.r. F pr.Cultivar 2 254427 127214 105.3 <.001Day 5 133473 26695 22.1 <.001Treatment 3 22628 7543 6.24 <.001Cultivar.Day 9 -1 119556 13284 11 <.001Cultivar.Treatment 6 54967 9161 7.58 <.001Day.Treatment 15 44461 2964 2.45 0.003Cultivar.Day.Treatment 27 -3 62077 2299 1.9 0.009Residual 136 -8 164297 1208Total 203 -12 836391
Table B.91. Pre-harvest application - 20°C.Source of variation d.f. (m.v.) s.s. m.s. v.r. F pr.Cultivar 2 725867 362933 282.84 <.001Day 5 44185 8837 6.89 <.001Treatment 3 6157 2052 1.6 0.193Cultivar.Day 9 -1 66768 7419 5.78 <.001Cultivar.Treatment 6 22714 3786 2.95 0.01Day.Treatment 15 29170 1945 1.52 0.108Cultivar.Day.Treatment 27 -3 39188 1451 1.13 0.315Residual 132 -12 169378 1283Total 199 -16 970976
Tables B.92-95. Effect of pre-harvest (Section 4.4.1.7, Figure 4.7) application of exogenous ABA or an ABA analogue, and time during postharvest storage at 4, 12 or 20ºC on fructose concentration of onion cvs. Red Baron, Renate and SS1. Table B.92. Pre-harvest application – Pre-storage.Source of variation d.f. s.s. m.s. v.r. F pr.
Cultivar 2420656.
8210328.
4 420.53 <.001Treatment 3 3608.9 1203 2.41 0.092Cultivar.Treatment 6 17411.2 2901.9 5.8 <.001Residual 24 12003.6 500.1
Total 35453680.
5
Table B.93. Pre-harvest application - 4°C.Source of variation d.f. (m.v.) s.s. m.s. v.r. F pr.Cultivar 2 685931 342965 272.61 <.001Day 5 105439 21088 16.76 <.001Treatment 3 12583 4194 3.33 0.022Cultivar.Day 7 -3 159039 22720 18.06 <.001
© 2006 Horticultural Development Council
259
Cultivar.Treatment 6 63411 10569 8.4 <.001Day.Treatment 15 44058 2937 2.33 0.006Cultivar.Day.Treatment 21 -9 43491 2071 1.65 0.05Residual 120 -24 150972 1258Total 179 -36 996723
Table B.94. Pre-harvest application - 12°C.Source of variation d.f. (m.v.) s.s. m.s. v.r. F pr.
Cultivar 21080149
.9 540075 588.06 <.001Day 5 28340.5 5668.1 6.17 <.001Treatment 3 18335.8 6111.9 6.65 <.001Cultivar.Day 9 -1 147458 16384.2 17.84 <.001Cultivar.Treatment 6 50825.9 8471 9.22 <.001Day.Treatment 15 32005.8 2133.7 2.32 0.006Cultivar.Day.Treatment 27 -3 49352.2 1827.9 1.99 0.006
Residual 136 -8124901.
9 918.4Total 203 -12 1380055
Table B.95. Pre-harvest application - 20°C.Source of variation d.f. (m.v.) s.s. m.s. v.r. F pr.
Cultivar 21732032
.6866016.
3 928.6 <.001Day 5 16871.4 3374.3 3.62 0.004Treatment 3 9317.4 3105.8 3.33 0.022Cultivar.Day 9 -1 46141.6 5126.8 5.5 <.001Cultivar.Treatment 6 24044.5 4007.4 4.3 <.001Day.Treatment 15 8777.8 585.2 0.63 0.848Cultivar.Day.Treatment 27 -3 47209.7 1748.5 1.87 0.011
Residual 132 -12123103.
8 932.6
Total 199 -161686087
.7
Table B.96-99. Effect of pre-harvest (Section 4.4.1.7, Figure 4.1.1) application of exogenous ABA or an ABA analogue, and time during postharvest storage at 4, 12 or 20ºC on the ratio of monosaccharide to disaccharide in onion cvs. Red Baron, Renate and SS1.
Table B.96. Pre-harvest application – Pre-storage.Source of variation d.f. s.s. m.s. v.r. F pr.Cultivar 2 489.62 244.81 35.28 <.001Treatment 3 46.709 15.57 2.24 0.109Cultivar.Treatment 6 80.009 13.335 1.92 0.118Residual 24 166.553 6.94Total 35 782.89
© 2006 Horticultural Development Council
260
© 2006 Horticultural Development Council
261
Table B.97. Pre-harvest application - 4°C.Source of variation d.f. (m.v.) s.s. m.s. v.r. F pr.Cultivar 2 770.691 385.345 183.3 <.001Day 5 72.254 14.451 6.87 <.001Treatment 3 14.591 4.864 2.31 0.079Cultivar.Day 7 -3 161.282 23.04 10.96 <.001Cultivar.Treatment 6 31.998 5.333 2.54 0.024Day.Treatment 15 46.917 3.128 1.49 0.12Cultivar.Day.Treatment 21 -9 87.102 4.148 1.97 0.012Residual 120 -24 252.266 2.102
Total 179 -361247.53
5
Table B.98. Pre-harvest application - 12°C.Source of variation d.f. (m.v.) s.s. m.s. v.r. F pr.
Cultivar 22455.13
41227.56
7 203.23 <.001Day 5 36.209 7.242 1.2 0.313Treatment 3 51.629 17.21 2.85 0.04Cultivar.Day 9 -1 59.528 6.614 1.1 0.371Cultivar.Treatment 6 86.111 14.352 2.38 0.033Day.Treatment 15 107.487 7.166 1.19 0.29Cultivar.Day.Treatment 27 -3 212.056 7.854 1.3 0.166Residual 136 -8 821.487 6.04
Total 203 -123537.30
5 Table B.99. Pre-harvest application - 20°C.Source of variation d.f. (m.v.) s.s. m.s. v.r. F pr.
Cultivar 23872.87
51936.43
7 213.22 <.001Day 5 4.835 0.967 0.11 0.991Treatment 3 70.123 23.374 2.57 0.057Cultivar.Day 9 -1 33.542 3.727 0.41 0.928Cultivar.Treatment 6 145.728 24.288 2.67 0.018Day.Treatment 15 151.185 10.079 1.11 0.354Cultivar.Day.Treatment 27 -3 282.391 10.459 1.15 0.293
Residual 132 -121198.78
5 9.082
Total 199 -165200.20
8
Tables B.100-103. Effect of pre-harvest (Section 4.4.1.7, Figure 4.10) application of exogenous ABA or an ABA analogue, and time during postharvest storage at 4, 12 or 20ºC on total sugar concentration of onion cvs. Red Baron, Renate and SS1.
Table B.100. Pre-harvest application - Pre-storage.
© 2006 Horticultural Development Council
262
Source of variation d.f. s.s. m.s. v.r. F pr.Cultivar 2 583942 291971 70.34 <.001Treatment 3 35082 11694 2.82 0.061Cultivar.Treatment 6 45744 7624 1.84 0.134Residual 24 99621 4151Total 35 764389
Table B.101. Pre-harvest application - 4°C.Source of variation d.f. (m.v.) s.s. m.s. v.r. F pr.Cultivar 2 753348 376674 71.04 <.001Day 5 315669 63134 11.91 <.001Treatment 3 69056 23019 4.34 0.006Cultivar.Day 7 -3 328085 46869 8.84 <.001Cultivar.Treatment 6 172512 28752 5.42 <.001Day.Treatment 15 165006 11000 2.07 0.016Cultivar.Day.Treatment 21 -9 162518 7739 1.46 0.105Residual 120 -24 636301 5303Total 179 -36 2232816
Table B,102. Pre-harvest application - 12°C.Source of variation d.f. (m.v.) s.s. m.s. v.r. F pr.Cultivar 2 957525 478763 97.47 <.001Day 5 295044 59009 12.01 <.001Treatment 3 99156 33052 6.73 <.001Cultivar.Day 9 -1 790890 87877 17.89 <.001Cultivar.Treatment 6 260242 43374 8.83 <.001Day.Treatment 15 243112 16207 3.3 <.001Cultivar.Day.Treatment 27 -3 306526 11353 2.31 <.001Residual 136 -8 668036 4912Total 203 -12 3513190
Table B.103. Pre-harvest application - 20°C.Source of variation d.f. (m.v.) s.s. m.s. v.r. F pr.Cultivar 2 2033163 1016581 177.78 <.001Day 5 191829 38366 6.71 <.001Treatment 3 51821 17274 3.02 0.032Cultivar.Day 9 -1 261028 29003 5.07 <.001Cultivar.Treatment 6 86818 14470 2.53 0.024Day.Treatment 15 114481 7632 1.33 0.19Cultivar.Day.Treatment 27 -3 195984 7259 1.27 0.189Residual 132 -12 754791 5718Total 199 -16 3200907
© 2006 Horticultural Development Council
263
Tables B.104-107. Effect of pre-harvest (Section 4.4.1.7, Figure 4.12) application of exogenous ABA or an ABA analogue, and time during postharvest storage at 4, 12 or 20ºC on total fructan concentration of onion cvs. Red Baron, Renate and SS1.
Table B.104. Pre-harvest application - Pre-storage.Source of variation d.f. s.s. m.s. v.r. F pr.Cultivar 2 629498 314749 181.24 <.001Treatment 3 6493 2164 1.25 0.315Cultivar.Treatment 6 5560 927 0.53 0.777Residual 24 41680 1737Total 35 683231
Table B.105. Pre-harvest application - 4°C.Source of variation d.f. (m.v.) s.s. m.s. v.r. F pr.Cultivar 2 1394673 697337 337.9 <.001Day 5 249568 49914 24.19 <.001Treatment 3 18509 6170 2.99 0.034Cultivar.Day 7 -3 149086 21298 10.32 <.001Cultivar.Treatment 6 24852 4142 2.01 0.07Day.Treatment 15 68498 4567 2.21 0.009Cultivar.Day.Treatment 21 -9 92661 4412 2.14 0.006Residual 120 -24 247647 2064Total 179 -36 1636260
Table B.106. Pre-harvest application - 12°C.Source of variation d.f. (m.v.) s.s. m.s. v.r. F pr.Cultivar 2 2785419 1392710 891.91 <.001Day 5 105098 21020 13.46 <.001Treatment 3 35517 11839 7.58 <.001Cultivar.Day 9 -1 54886 6098 3.91 <.001Cultivar.Treatment 6 19251 3209 2.05 0.063Day.Treatment 15 33006 2200 1.41 0.151Cultivar.Day.Treatment 27 -3 32658 1210 0.77 0.777Residual 136 -8 212363 1561Total 203 -12 2802117
© 2006 Horticultural Development Council
264
Table B.107. Pre-harvest application - 20°C.Source of variation d.f. (m.v.) s.s. m.s. v.r. F pr.Cultivar 2 2640903 1320451 583.39 <.001Day 5 26009 5202 2.3 0.049Treatment 3 6006 2002 0.88 0.451Cultivar.Day 9 -1 84373 9375 4.14 <.001Cultivar.Treatment 6 8801 1467 0.65 0.692Day.Treatment 15 66974 4465 1.97 0.022Cultivar.Day.Treatment 27 -3 95387 3533 1.56 0.052Residual 134 -10 303296 2263Total 201 -14 2882516
B.4 Binomial regression analysis for Chapter Four.Tables B.107-109. Binomial regression analysis of the proportion of bulbs sprouted (Section 4.4.1.2, Table 4.10)
Table B.107. Pre-harvest application - 4°C.Response variate: No_sproutedBinomial totals: No_assessedDistribution: BinomialLink function: LogitFitted terms: Constant + Day + Cultivar + Treatment + Day.Cultivar + Day.Treatment + Cultivar.Treatment + Day.Cultivar.Treatment Summary of analysis
Source d.f.devianc
emean
deviancedeviance
ratioapprox chi
prRegression 47 707.13 15.0452 15.05 <.001Residual 88 41.71 0.474 Total 135 748.84 5.547
Dispersion parameter is fixed at 1.00. Table B.108. Pre-harvest application - 12°C.Response variate: No_sproutedBinomial totals: No_assessedDistribution: BinomialLink function: LogitFitted terms: Constant + Day + Cultivar + Treatment + Day.Cultivar + Day.Treatment + Cultivar.Treatment + Day.Cultivar.Treatment Summary of analysis
Source d.f.devianc
emean
deviancedeviance
ratioapprox chi
pr
© 2006 Horticultural Development Council
265
Regression 47 692.31 14.7299 14.73 <.001Residual 92 48.74 0.5298 Total 139 741.05 5.3313
Dispersion parameter is fixed at 1.00.
Table B.109. Pre-harvest application - 20°C.Response variate: No_sproutedBinomial totals: No_assessedDistribution: BinomialLink function: LogitFitted terms: Constant + Day + Cultivar + Treatment + Day.Cultivar + Day.Treatment + Cultivar.Treatment + Day.Cultivar.Treatment Summary of analysis
Source d.f.devianc
emean
deviancedeviance
ratioapprox chi
prRegression 47 571.64 12.1626 12.16 <.001Residual 88 46.04 0.5232 Total 135 617.68 4.5754
Dispersion parameter is fixed at 1.00.
B.5 Correlation matrices for Chapter FourTable B.110. Experiment 1: Pre-harvest application – Pre-storage, all cultivars (Carlos, Dinaro, Hysam,
Red Baron, Renate,SS1), 4°C (Section 4.4.1.1)Dry
weight 1ABA 0.157 1TSS 0.668 0.055 1
Firmness 0.4 0.174 0.525 1Pyruvate 0.278 -0.042 0.429 0.3 1
Dry weight ABA TSS Firmness Pyruvate
Table B.111. Experiment 1: Pre-harvest application - cv. SS1, 4°C (Sections 4.4.1.7 and 4.4.1.8).Sprout length 1
TSS -0.65 1ABA -0.248 0.068 1
Fructan 0.481 -0.439 -0.047 1Fructose -0.605 0.237 0.136 -0.57 1Glucose -0.66 0.457 0.116 -0.603 0.814 1Sucrose -0.132 -0.076 -0.335 0.016 0.163 -0.143 1
Total sugars -0.66 0.304 -0.01 -0.558 0.936 0.817 0.4 1
Sprout length TSS ABA Fructan
Fructose
Glucose
Sucrose
Total sugars
© 2006 Horticultural Development Council
266
Table B.112. Experiment 1: Pre-harvest application – cv. Renate, 4°C (Sections 4.4.1.7 and 4.4.1.8).Sprout length 1
TSS 0.092 1ABA -0.271 0.117 1
Fructan -0.499 0.232 0.323 1Fructose 0.716 -0.19 -0.217 -0.564 1Glucose 0.547 0.207 0.024 -0.173 0.651 1Sucrose -0.163 -0.337 -0.016 -0.014 -0.003 -0.146 1
Total sugars 0.532 -0.22 -0.127 -0.402 0.824 0.67 0.493 1
Sprout length TSS ABA
Fructan
Fructose
Glucose
Sucrose
Total sugars
Table B.113. Experiment 1: Pre-harvest application – cv. Red Baron, 4°C (Sections 4.4.1.7 and 4.4.1.8).Sprout length 1TSS 0.027 1ABA 0.143 0.078 1Fructan -0.482 0.203 -0.179 1Fructose 0.373 -0.363 0.009 -0.627 1Glucose -0.115 -0.237 -0.081 -0.106 -0.071 1Sucrose 0.153 -0.322 0.056 -0.463 0.384 -0.105 1Total sugars 0.272 -0.488 0.006 -0.68 0.804 0.272 0.739 1
Sprout length TSS ABA
Fructan
Fructose Glucose
Sucrose
Total sugars
Table B.114. Experiment 1: Pre-harvest application – cv. SS1, 12°C (Sections 4.4.1.7 and 4.4.1.8).Sprout length 1
TSS -0.579 1ABA 0.446 -0.406 1
Fructan -0.057 0.13 -0.318 1Fructose -0.707 0.573 -0.532 -0.003 1Glucose -0.697 0.605 -0.528 0.09 0.886 1Sucrose -0.536 0.588 -0.436 0.456 0.452 0.541 1
Total sugars -0.745 0.656 -0.57 0.14 0.94 0.967 0.664 1
Sprout length TSS ABA
Fructan Fructose Glucose
Sucrose
Total sugars
Table B.115. Experiment 1: Pre-harvest application – cv. Renate, 12°C (Sections 4.4.1.7 and 4.4.1.8).Sprout length 1
TSS 0.183 1ABA -0.114 0.297 1
Fructan -0.374-
0.017 0.014 1
Fructose 0.278-
0.321 -0.111 -0.539 1
Glucose -0.343-
0.163 0.01 0.213 0.294 1
Sucrose 0.049-
0.414 -0.262 -0.034 0.403 0
.117 1.000
© 2006 Horticultural Development Council
267
Total sugars 0.039 -0.44 -0.198 -0.192 0.786 0.538 0.8 1Sprout length TSS ABA Fructan Fructose
Glucose
Sucrose
Total sugars
© 2006 Horticultural Development Council
268
Table B.116. Experiment 1: Pre-harvest application – cv. Red Baron, 12°C (Sections 4.4.1.7 and 4.4.1.8).Sprout length 1
TSS -0.056 1ABA -0.177 0.092 1
Fructan -0.55 0.109 0.148 1
Fructose 0.325-
0.379 -0.019 -0.467 1
Glucose -0.203-
0.158 -0.027 -0.055 0.17 1
Sucrose 0.376-
0.205 -0.101 -0.438 0.293 0.142 1Total sugars 0.216 -0.33 -0.079 -0.438 0.594 0.68 0.752 1
Sprout length TSS ABA Fructan Fructose Glucose Sucrose
Total sugars
Table B.117. Experiment 1: Pre-harvest application – cv. SS1, 20°C (Sections 4.4.1.7 and 4.4.1.8).Sprout length 1
TSS -0.376 1
ABA -0.006-
0.114 1Fructan 0.194 0.062 0.043 1
Fructose -0.308 0.1 -0.103 -0.412 1Glucose -0.222 0.094 -0.162 -0.276 0.891 1Sucrose -0.235 0.461 0.01 0.304 -0.059 -0.083 1
Total sugars -0.346 0.257 -0.127 -0.237 0.917 0.906 0.279 1Sprout length TSS ABA Fructan
Fructose Glucose Sucrose
Total sugars
Table B.118. Experiment 1: Pre-harvest application – cv. Renate, 20°C (Sections 4.4.1.7 and 4.4.1.8).
Sprout length 1
TSS -0.151 1ABA -0.199 0.13 1
Fructan -0.308 0.253 0.297 1Fructose 0.088 -0.21 -0.106 -0.252 1Glucose 0.069 0.117 0.046 0.23 0.483 1
Sucrose 0.18-
0.213 -0.202 -0.068 0.341 0.114 1
Total sugars 0.17-
0.156 -0.142 -0.033 0.745 0.64 10.784 1Sprout length TSS ABA Fructan
Fructose Glucose Sucrose
Total sugars
Table B.119. Experiment 1: Preiharvest application – cv. Red Baron, 20°C (Sections 4.4.1.7 and 4.4.1.8).Sprout length 1
TSS 0.012 1ABA -0.149 0.059 1
Fructan -0.083 0.414 0.124 1
Fructose 0.221-
0.303 -0.062 -0.569 1
Glucose -0.207-
0.249 -0.159 -0.42 0.295 1Sucrose 0.334 - -0.234 -0.59 0.396 0.17 1
© 2006 Horticultural Development Council
269
0.422
Total sugars 0.127-
0.453 -0.234 -0.713 0.657 0.733 0.75 1Sprout length TSS ABA Fructan Fructose Glucose Sucrose
Total sugars
© 2006 Horticultural Development Council
270
Table B.120. Experiment 1: Pre-harvest application – up to 50% sprouting, cv. SS1, 4°C (Section 4.4.1.8).Sprout length 1
TSS -0.551 1ABA -0.375 0.158 1
Fructan 0.194-
0.212 -0.269 1Fructose -0.515 0.069 0.25 -0.274 1Glucose -0.563 0.228 0.15 -0.38 0.88 1
Sucrose -0.138-
0.092 -0.254 0.368 -0.089 -0.169 1Total sugars -0.593 0.105 0.088 -0.162 0.892 0.855 0.31 1
Sprout length TSS ABA Fructan Fructose Glucose Sucrose
Total sugars
Table B.121. Experiment 1: Pre-harvest application – up to 50% sprouting, cv. Renate, 4°C (Section 4.4.1.8).
Sprout length 1
TSS -0.284 1ABA -0.363 0.152 1
Fructan -0.306 0.369 0.279 1
Fructose 0.463-
0.658 -0.229 -0.301 1Glucose -0.386 0.193 0.314 0.463 0.053 1
Sucrose -0.03-
0.667 0.047 -0.186 0.373 -0.004 1
Total sugars 0.067-
0.674 0.03 -0.102 0.733 0.368 0.818 1Sprout length TSS ABA Fructan Fructose Glucose Sucrose
Total sugars
Table B.122. Experiment 1: Pre-harvest application – up to 50% sprouting, cv. Red Baron, 4°C (Section 4.4.1.8).
Sprout length 1
TSS -0.282 1
ABA -0.06-
0.004 1Fructan -0.419 0.456 -0.123 1
Fructose 0.52-
0.427 0.162 -0.859 1Glucose -0.27 0.02 -0.234 -0.1 -0.125 1
Sucrose -0.099-
0.653 0.05 -0.536 0.528 -0.047 1
Total sugars 0.168-
0.593 0.048 -0.823 0.831 0.218 0.829 1Sprout length TSS ABA Fructan Fructose Glucose Sucrose
Total sugars
Table B.123. Experiment 1: Pre-harvest application – up to 50% sprouting, cv. SS1, 12°C (Section 4.4.1.8).
Sprout length 1
TSS -0.443 1ABA -0.556 - 1
© 2006 Horticultural Development Council
271
0.062Fructan 0.472 0.125 -0.421 1
Fructose -0.374 0.285 0.197 -0.151 1Glucose -0.186 0.291 -0.015 0.289 0.497 1Sucrose -0.149 0.471 -0.187 0.331 -0.181 0.187 1
Total sugars -0.329 0.484 -0.001 0.247 0.652 0.9 0.434 1
Sprout length TSS ABA Fructan Fructose Glucose Sucrose
Total sugars
© 2006 Horticultural Development Council
272
Table B.124. Experiment 1: Pre-harvest application – up to 50% sprouting, cv. Renate, 12°C (Section 4.4.1.8).
Sprout length 1
TSS 0.121 1ABA -0.078 0.33 1
Fructan -0.26-
0.001 -0.015 1
Fructose 0.258-
0.348 -0.104 -0.493 1
Glucose 0.276-
0.133 -0.017 0.156 0.35 1
Sucrose 0.071-
0.447 -0.258 0.055 0.389 0.185 1
Total sugars 0.067-
0.454 -0.199 -0.14 0.784 0.587 0.803 1
Sprout length TSS ABA Fructan Fructose Glucose Sucrose
Total sugars
Table B.125. Experiment 1: Pre-harvest application – up to 50% sprouting, cv. Red Baron, 12°C (Section
4.4.1.8).Sprout length 1
TSS -0.143 1ABA -0.215 0.142 1
Fructan -0.472 0.099 0.196 1
Fructose 0.347-
0.362 -0.076 -0.465 1
Glucose -0.146-
0.142 -0.107 -0.084 0.262 1Sucrose 0.239 -0.21 -0.118 -0.349 0.325 0.213 1
Total sugars 0.172-
0.307 -0.145 -0.389 0.64 0.713 0.77 1
Sprout length TSS ABA Fructan Fructose Glucose Sucrose
Total sugars
Table B.126. Experiment 1: Pre-harvest application – up to 50% sprouting, cv. SS1, 20°C (Section 4.4.1.8).
Sprout length 1
TSS -0.166 1ABA -0.62 0.008 1
Fructan 0.165 0.226 -0.227 1Fructose -0.2 -0.05 0.181 -0.132 1
Glucose -0.08-
0.102 -0.02 -0.139 0.932 1Sucrose -0.381 0.332 0.13 -0.024 -0.208 -0.246 1
Total sugars -0.306 0.062 0.142 -0.149 0.907 0.888 0.185 1Sprout length TSS ABA Fructan Fructose Glucose Sucrose
Total sugars
Table B.127. Experiment 1: Pre-harvest application – up to 50% sprouting, cv. Renate, 20°C (Section 4.4.1.8).
Sprout length 1
© 2006 Horticultural Development Council
273
TSS -0.151 1ABA -0.199 0.13 1
Fructan -0.308 0.253 0.297 1Fructose 0.088 -0.21 -0.106 -0.252 1Glucose 0.069 0.117 0.046 0.23 0.483 1
Sucrose 0.18-
0.213 -0.202 -0.068 0.341 0.114 1
Total sugars 0.17-
0.156 -0.142 -0.033 0.745 0.641 0.784 1Sprout length TSS ABA Fructan Fructose Glucose Sucrose
Total sugars
© 2006 Horticultural Development Council
274
Table B.128. Experiment 1: Pre-harvest application – up to 50% sprouting, cv. Red Baron, 20°C (Section 4.4.1.8).
Sprout length 1
TSS -0.055 1ABA -0.13 0.079 1
Fructan -0.181 0.387 0.145 1Fructose 0.372 -0.29 -0.072 -0.58 1
Glucose 0.037-
0.195 -0.225 -0.358 0.32 1
Sucrose 0.328-
0.428 -0.255 -0.594 0.38 0.21 1
Total sugars 0.307-
0.421 -0.279 -0.682 0.666 0.733 0.769 1Sprout length TSS ABA Fructan Fructose Glucose Sucrose
Total sugars
Table B.129. Experiment 1: Pre-harvest application – all cultivars (Red Baron, Renate, SS1), 4°C (Section 4.4.1.7).
Fructan 1Fructose -0.805 1Glucose -0.591 0.795 1Sucrose 0.331 -0.443 -0.569 1
Total sugars -0.701 0.883 0.766 -0.053 1
Fructan Fructose Glucose Sucrose
Total sugars
Table B.130. Experiment 1: Pre-harvest application – all cultivars (Red Baron, Renate, SS1), 12°C (Section 4.4.1.7).
Fructan 1Fructose -0.812 1Glucose -0.503 0.79 1Sucrose 0.565 -0.465 -0.183 1
Total sugars -0.461 0.773 0.891 0.144 1
Fructan Fructose Glucose Sucrose
Total sugars
Table B.131. Experiment 1: Pre-harvest application – all cultivars (Red Baron, Renate, SS1), 20°C (Section 4.4.1.7).
Fructan 1Fructose -0.849 1Glucose -0.743 0.868 1Sucrose 0.495 -0.631 -0.5 1
Total sugars -0.73 0.827 0.881 -0.14 1
Fructan Fructose Glucose Sucrose
Total sugars
Table B.132. Experiment 2: Postharvest application (cv. Hysam) - 4°C (Sections 4.4.2.2, 4.4.2.3 and 4.4.2.4).
Firmness 1
© 2006 Horticultural Development Council
275
Dry weight -0.149 1Pyruvate 0.419 0.1 1
Sprout length 0.132 -0.629 -0.083 1
TSS 0.083 0.504 0.532 -0.373 1ABA 0.135 0.087 0.2 -0.362 -0.006 1
Firmness
Dry weight
Pyruvate
Sprout length TSS ABA
© 2006 Horticultural Development Council
276
Table B.133. Experiment 2: Postharvest application (cv. Hysam) - 12°C (Sections 4.4.2.2, 4.4.2.3 and 4.4.2.4).
Firmness 1Dry weight 0.169 1
Pyruvate -0.137 0.189 1Sprout length -0.459 -0.522 0.112 1
TSS 0.358 0.613 0.149 -0.415 1ABA 0.142 0.574 0.222 -0.148 0.128 1
Firmnes
sDry
weight Pyruvat
e Sprout
length TSS ABA
Table B.134. Experiment 2: Postharvest application (cv. Hysam) - 20°C (Sections 4.4.2.2, 4.4.2.3 and 4.4.2.4).
Firmness 1Dry weight -0.39 1
Pyruvate -0.695 -0.37 1Sprout length -0.343 -0.27 0.661 1
TSS -0.718 0.079 0.539 0.05 1ABA -0.392 0.016 0.375 -0.271 0.116 1
Firmness
Dry weight
Pyruvate
Sprout length TSS ABA
B.5 ANOVA tables for Chapter FiveTables B.135-137. Effect of pre-harvest application of 1-MCP, and time during postharvest storage at 4, 12 or 20ºC on sprout growth in onions cv. SS1 (Section 5.4.1.1, Figure 5.1).
Table B.135. 4°C.
Source of variation d.f. s.s. m.s. v.r. F pr.Baseline 1 68184 68184 13.08 0.001Baseline.Time 1 18343 18343 3.52 0.07Baseline.Treatment 1 13256 13256 2.54 0.121Baseline.Time.Treatment 1 58 58 0.01 0.917Residual 30 156344 5211 Total 34 256185
Table B.136. 12°C.
Source of variation d.f. (m.v.) s.s. m.s. v.r. F pr.Baseline 1 143824 143824 19.66 <.001Baseline.Time 2 147171 73585 10.06 <.001Baseline.Treatment 1 42528 42528 5.81 0.021Baseline.Time.Treatment 2 1703 852 0.12 0.89Residual 39 -4 285344 7317Total 45 -4 598802
© 2006 Horticultural Development Council
277
Table B.137. 20°C.
Source of variation d.f. s.s. m.s. v.r. F pr.Baseline 1 212182 212182 7.96 0.007Baseline.Time 2 219093 109547 4.11 0.023Baseline.Treatment 1 36841 36841 1.38 0.246Baseline.Time.Treatment 2 28178 14089 0.53 0.593Residual 43 1145808 26647 Total 49 1642102
Tables B.138-140. Effect of pre-harvest application of 1-MCP, and time during postharvest storage at 4, 12 or 20ºC on firmness of onions cv. SS1 (Section 5.4.1.2, Figure 5.2).
Table B.138. 4°C.
Source of variation d.f. s.s. m.s. v.r. F pr.Baseline 1 973.31 973.31 71.99 <.001Baseline.Time 1 221.41 221.41 16.38 <.001Baseline.Treatment 1 19.15 19.15 1.42 0.243Baseline.Time.Treatment 1 1.7 1.7 0.13 0.725Residual 30 405.6 13.52Total 34 1621.17
Table B.139. 12°C.
Source of variation d.f. (m.v.) s.s. m.s. v.r. F pr.Baseline 1 787.36 787.36 36.59 <.001Baseline.Time 2 153.65 76.82 3.57 0.038Baseline.Treatment 1 87.39 87.39 4.06 0.051Baseline.Time.Treatment 2 32.6 16.3 0.76 0.476Residual 38 -5 817.69 21.52Total 44 -5 1831.82
Table B.140. 20°C.
Source of variation d.f. s.s. m.s. v.r. F pr.Baseline 1 478.23 478.23 9.78 0.003Baseline.Time 2 791.81 395.9 8.09 0.001Baseline.Treatment 1 2.15 2.15 0.04 0.835Baseline.Time.Treatment 2 52.26 26.13 0.53 0.59Residual 43 2103.1 48.91 Total 49 3427.53
© 2006 Horticultural Development Council
278
Tables B.141-143. Effect of pre-harvest application of 1-MCP, and time during postharvest storage at 4, 12 or 20ºC on dry weight of onions cv. SS1 (Section 5.4.1.2, Figure 5.2).
Table B.141. 4°C.
Source of variation d.f. (m.v.) s.s. m.s. v.r. F pr.Baseline 1 8.281 8.281 1.15 0.293Baseline.Time 1 32.592 32.592 4.52 0.042Baseline.Treatment 1 21.616 21.616 3 0.094Baseline.Time.Treatment 1 4.455 4.455 0.62 0.438Residual 29 -1 209.04 7.208 Total 33 -1 275.13
Table B.142. 12°C.
Source of variation d.f. (m.v.) s.s. m.s. v.r. F pr.Baseline 1 20.142 20.142 19.16 <.001Baseline.Time 2 4.095 2.047 1.95 0.156Baseline.Treatment 1 50.321 50.321 47.88 <.001Baseline.Time.Treatment 2 2.89 1.445 1.37 0.265Residual 39 -4 40.988 1.051Total 45 -4 116.833
Table B.143. 20°C.
Source of variation d.f. s.s. m.s. v.r. F pr.Baseline 1 10.73 10.73 5.96 0.019Baseline.Time 2 19.857 9.928 5.52 0.007Baseline.Treatment 1 0.635 0.635 0.35 0.556Baseline.Time.Treatment 2 35.3 17.65 9.81 <.001Residual 43 77.394 1.8Total 49 143.916
Tables B.144-146. Effect of pre-harvest application of 1-MCP, and time during postharvest storage at 4, 12 or 20ºC on total soluble solids content of onions cv. SS1 (Section 5.4.2.1, Figure 5.3).
Table B.144. 4°C.
Source of variation d.f. s.s. m.s. v.r. F pr.Baseline 1 4.576 4.576 3.2 0.084Baseline.Time 1 17.328 17.328 12.13 0.002Baseline.Treatment 1 10.753 10.753 7.52 0.01Baseline.Time.Treatment 1 3.174 3.174 2.22 0.147Residual 30 42.872 1.429 Total 34 78.703
© 2006 Horticultural Development Council
279
Table B.145. 12°C.
Source of variation d.f. (m.v.) s.s. m.s. v.r. F pr.Baseline 1 3.5476 3.5476 4.47 0.041Baseline.Time 2 24.0624 12.0312 15.16 <.001Baseline.Treatment 1 23.3528 23.3528 29.42 <.001Baseline.Time.Treatment 2 3.2247 1.6123 2.03 0.145Residual 39 -4 30.9564 0.7938Total 45 -4 84.7133
Table B.146. 20°C.
Source of variation d.f. s.s. m.s. v.r. F pr.Baseline 1 0.836 0.836 0.7 0.409Baseline.Time 2 0.134 0.067 0.06 0.946Baseline.Treatment 1 0.235 0.235 0.2 0.66Baseline.Time.Treatment 2 3.638 1.819 1.51 0.231Residual 43 51.63 1.201 Total 49 56.473
Tables B.147-149. Effect of pre-harvest application of 1-MCP, and time during postharvest storage at 4, 12 or 20ºC on pyruvate concentration of onions cv. SS1 (Section 5.4.2.1, Figure 5.3). Table B.147. 4°C.
Source of variation d.f. s.s. m.s. v.r. F pr.Baseline 1 15.98 15.98 15.77 <.001Baseline.Time 1 24.498 24.498 24.17 <.001Baseline.Treatment 1 2.235 2.235 2.21 0.148Baseline.Time.Treatment 1 1.492 1.492 1.47 0.235Residual 30 30.405 1.014Total 34 74.61
Table B.148. 12°C.
Source of variation d.f. (m.v.) s.s. m.s. v.r. F pr.Baseline 1 2.4977 2.4977 2.71 0.108Baseline.Time 2 13.8547 6.9274 7.51 0.002Baseline.Treatment 1 9.1677 9.1677 9.94 0.003Baseline.Time.Treatment 2 1.8188 0.9094 0.99 0.382Residual 39 -4 35.9757 0.9225 Total 45 -4 62.9171
© 2006 Horticultural Development Council
280
Table B.149. 20°C.
Source of variation d.f. s.s. m.s. v.r. F pr.Baseline 1 7.0513 7.0513 8.69 0.005Baseline.Time 2 4.0497 2.0249 2.5 0.094Baseline.Treatment 1 7.0616 7.0616 8.71 0.005Baseline.Time.Treatment 2 7.4311 3.7156 4.58 0.016Residual 43 34.8807 0.8112 Total 49 60.4744
Tables B.150-152. Effect of pre-harvest application of 1-MCP, and time during postharvest storage at 4, 12 or 20ºC on abscisic acid concentration of onions cv. SS1 (Section 5.4.2.2, Figure 5.4).
Table B.150. 4°C.
Source of variation d.f. (m.v.) s.s. m.s. v.r. F pr.Baseline 1 17144 17144 4.33 0.046Baseline.Time 1 19662 19662 4.96 0.034Baseline.Treatment 1 18 18 0 0.947Baseline.Time.Treatment 1 320 320 0.08 0.778Residual 29 -1 114850 3960 Total 33 -1 151769
Table B.151. 12°C.
Source of variation d.f. (m.v.) s.s. m.s. v.r. F pr.Baseline 1 3279 3279 0.73 0.397Baseline.Time 2 186991 93495 20.92 <.001Baseline.Treatment 1 54 54 0.01 0.913Baseline.Time.Treatment 2 4684 2342 0.52 0.596Residual 39 -4 174301 4469Total 45 -4 343683
Table B.152. 20°C.
Source of variation d.f. s.s. m.s. v.r. F pr.Baseline 1 907 907 0.12 0.727Baseline.Time 2 1562 781 0.11 0.899Baseline.Treatment 1 56190 56190 7.66 0.008Baseline.Time.Treatment 2 19862 9931 1.35 0.269Residual 43 315366 7334 Total 49 393887
© 2006 Horticultural Development Council
281
Tables B.153-155. Effect of pre-harvest application of 1-MCP, and time during postharvest storage at 4, 12 or 20ºC on sucrose concentration of onions cv. SS1 (Section 5.4.2.3, Figure 5.5).
Table B.153. 4°C.
Source of variation d.f. (m.v.) s.s. m.s. v.r. F pr.Baseline 1 445 445 0.25 0.619Baseline.Time 1 571 571 0.32 0.574Baseline.Treatment 1 1642 1642 0.93 0.342Baseline.Time.Treatment 1 3012 3012 1.71 0.201Residual 29 -1 51110 1762 Total 33 -1 56736
Table B.154. 12°C.
Source of variation d.f. (m.v.) s.s. m.s. v.r. F pr.Baseline 1 5826 5826 3.15 0.084Baseline.Time 2 8547 4274 2.31 0.112Baseline.Treatment 1 23551 23551 12.74 <.001Baseline.Time.Treatment 2 2099 1049 0.57 0.571Residual 39 -4 72074 1848Total 45 -4 111482
Table B.155. 20°C.
Source of variation d.f. (m.v.) s.s. m.s. v.r. F pr.Baseline 1 11034 11034 7.19 0.011Baseline.Time 2 4052 2026 1.32 0.278Baseline.Treatment 1 43 43 0.03 0.867Baseline.Time.Treatment 2 1304 652 0.42 0.657Residual 41 -2 62935 1535 Total 47 -2 79178
Tables B.156-158. Effect of pre-harvest application of 1-MCP, and time during postharvest storage at 4, 12 or 20ºC on glucose concentration of onions cv. SS1 (Section 5.4.2.3, Figure 5.5).
Table B.156. 4°C.
Source of variation d.f. (m.v.) s.s. m.s. v.r. F pr.Baseline 1 70091 70091 36.29 <.001Baseline.Time 1 57418 57418 29.73 <.001Baseline.Treatment 1 5702 5702 2.95 0.096Baseline.Time.Treatment 1 140 140 0.07 0.789Residual 29 -1 56011 1931Total 33 -1 186382
© 2006 Horticultural Development Council
282
Table B.157. 12°C.
Source of variation d.f. (m.v.) s.s. m.s. v.r. F pr.Baseline 1 28961 28961 20.84 <.001Baseline.Time 2 7185 3592 2.59 0.088Baseline.Treatment 1 146502 146502 105.44 <.001Baseline.Time.Treatment 2 294 147 0.11 0.9Residual 39 -4 54187 1389Total 45 -4 235464
Table B.158. 20°C.
Source of variation d.f. (m.v.) s.s. m.s. v.r. F pr.Baseline 1 26608 26608 17.55 <.001Baseline.Time 2 29209 14605 9.63 <.001Baseline.Treatment 1 1440 1440 0.95 0.335Baseline.Time.Treatment 2 2820 1410 0.93 0.403Residual 41 -2 62165 1516Total 47 -2 120299
Tables B.159-161. Effect of pre-harvest application of 1-MCP, and time during postharvest storage at 4, 12 or 20ºC on fructose concentration of onions cv. SS1 (Section 5.4.2.3, Figure 5.5).
Table B.159. 4°C.
Source of variation d.f. (m.v.) s.s. m.s. v.r. F pr.Baseline 1 70621 70621 36.4 <.001Baseline.Time 1 33865 33865 17.46 <.001Baseline.Treatment 1 2455 2455 1.27 0.27Baseline.Time.Treatment 1 1757 1757 0.91 0.349Residual 29 -1 56257 1940Total 33 -1 163298
Table B.160. 12°C.
Source of variation d.f. (m.v.) s.s. m.s. v.r. F pr.Baseline 1 30982 30982 23.48 <.001Baseline.Time 2 7945 3972 3.01 0.061Baseline.Treatment 1 148502 148502 112.55 <.001Baseline.Time.Treatment 2 897 449 0.34 0.714Residual 39 -4 51458 1319Total 45 -4 237971
© 2006 Horticultural Development Council
283
Table B.161. 20°C.
Source of variation d.f. (m.v.) s.s. m.s. v.r. F pr.Baseline 1 42846 42846 36.55 <.001Baseline.Time 2 39719 19859 16.94 <.001Baseline.Treatment 1 9 9 0.01 0.929Baseline.Time.Treatment 2 3309 1655 1.41 0.255Residual 41 -2 48069 1172Total 47 -2 131406
Tables B.162-164. Effect of pre-harvest application of 1-MCP, and time during postharvest storage at 4, 12 or 20ºC on the ratio of monosaccharide to disaccharide in onions cv. SS1 (Section 5.4.2.3, Figure 5.6).
Table B.162. 4°C.
Source of variation d.f. (m.v.) s.s. m.s. v.r. F pr.Baseline 1 14.52 14.52 0.84 0.366Baseline.Time 1 2.08 2.08 0.12 0.731Baseline.Treatment 1 5.56 5.56 0.32 0.574Baseline.Time.Treatment 1 11.76 11.76 0.68 0.416Residual 29 -1 500.29 17.25 Total 33 -1 533.65
Table B.163. 12°C.
Source of variation d.f. (m.v.) s.s. m.s. v.r. F pr.Baseline 1 287 287 1.25 0.271Baseline.Time 2 3179.1 1589.5 6.91 0.003Baseline.Treatment 1 27.8 27.8 0.12 0.73Baseline.Time.Treatment 2 469.9 234.9 1.02 0.369Residual 39 -4 8968.4 230 Total 45 -4 11770.5
Table B.164. 20°C.
Source of variation d.f. (m.v.) s.s. m.s. v.r. F pr.Baseline 1 311.5 311.5 2.8 0.102Baseline.Time 2 523.3 261.7 2.36 0.108Baseline.Treatment 1 59.3 59.3 0.53 0.469Baseline.Time.Treatment 2 129.6 64.8 0.58 0.563Residual 41 -2 4555 111.1 Total 47 -2 5555.3
© 2006 Horticultural Development Council
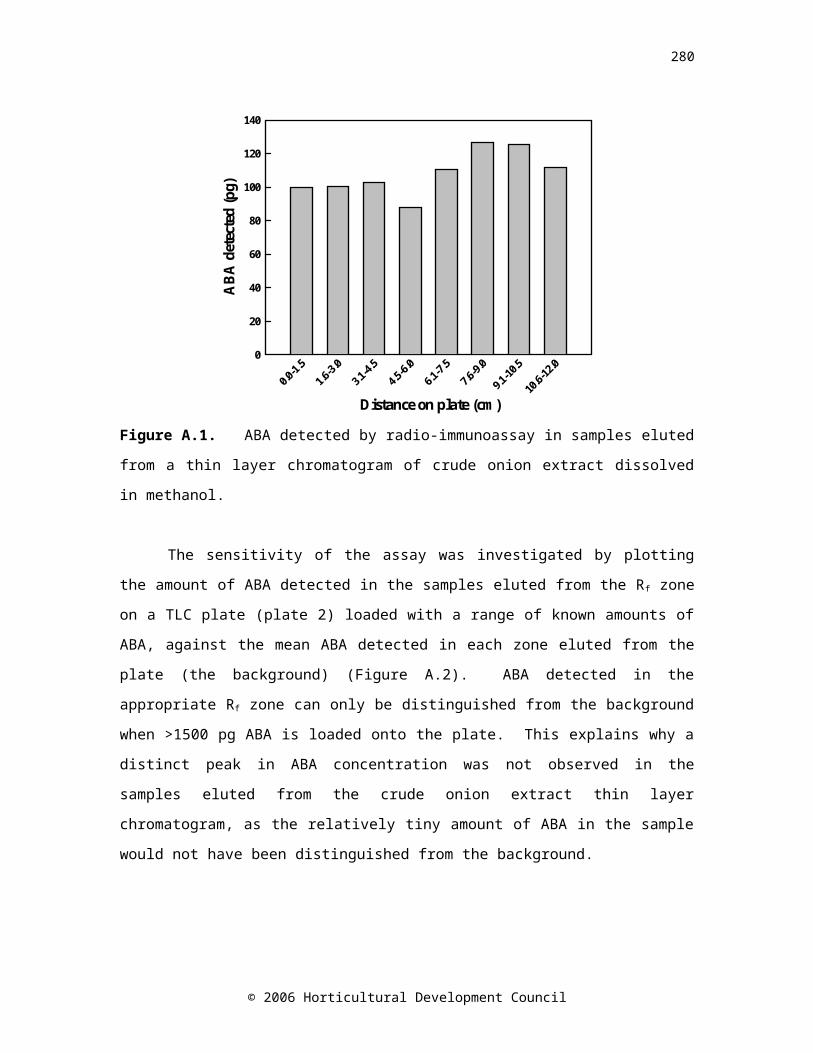
284
Tables B.165-167. Effect of pre-harvest application of 1-MCP, and time during postharvest storage at 4, 12 or 20ºC on total sugar concentration of onions cv. SS1 (Section 5.4.2.3, Figure 5.6).
Table B.165. 4°C.
Source of variation d.f. (m.v.) s.s. m.s. v.r. F pr.Baseline 1 304248 304248 27.16 <.001Baseline.Time 1 200286 200286 17.88 <.001Baseline.Treatment 1 27417 27417 2.45 0.129Baseline.Time.Treatment 1 7218 7218 0.64 0.429Residual 29 -1 324863 11202Total 33 -1 856161
Table B.166. 12°C.
Source of variation d.f. (m.v.) s.s. m.s. v.r. F pr.Baseline 1 178567 178567 31.28 <.001Baseline.Time 2 56366 28183 4.94 0.012Baseline.Treatment 1 849109 849109 148.76 <.001Baseline.Time.Treatment 2 23 11 0 0.998Residual 39 -4 222609 5708Total 45 -4 1303299
Table B.167. 20°C.
Source of variation d.f. (m.v.) s.s. m.s. v.r. F pr.Baseline 1 225774 225774 31.59 <.001Baseline.Time 2 167874 83937 11.74 <.001Baseline.Treatment 1 1185 1185 0.17 0.686Baseline.Time.Treatment 2 11470 5735 0.8 0.455Residual 41 -2 293063 7148Total 47 -2 687628
Tables B.168-170. Effect of pre-harvest application of 1-MCP, and time during postharvest storage at 4, 12 or 20ºC on total fructan concentration of onions cv. SS1 (Section 5.4.2.3, Figure 5.6).
Table B.168. 4°C.
Source of variation d.f. (m.v.) s.s. m.s. v.r. F pr.Baseline 1 4957 4957 3.59 0.068Baseline.Time 1 714 714 0.52 0.478Baseline.Treatment 1 347 347 0.25 0.62Baseline.Time.Treatment 1 186 186 0.13 0.716Residual 29 -1 40056 1381 Total 33 -1 46150
© 2006 Horticultural Development Council
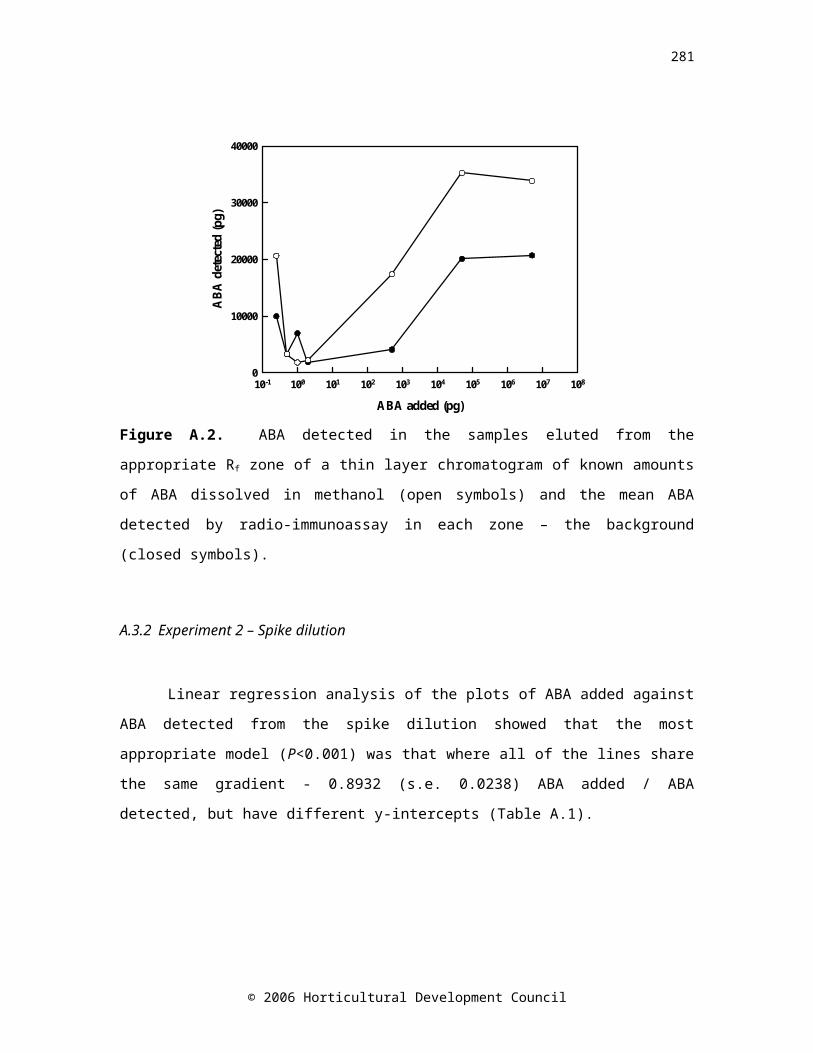
285
Table B.169. 12°C.
Source of variation d.f. (m.v.) s.s. m.s. v.r. F pr.Baseline 1 617 617 1.45 0.235Baseline.Time 2 1374.6 687.3 1.62 0.211Baseline.Treatment 1 895.8 895.8 2.11 0.154Baseline.Time.Treatment 2 1742.3 871.2 2.05 0.142Residual 39 -4 16551.4 424.4 Total 45 -4 20930
Table B.170. 20°C.
Source of variation d.f. s.s. m.s. v.r. F pr.Baseline 1 74.4 74.4 0.21 0.652Baseline.Time 2 795.7 397.9 1.11 0.34Baseline.Treatment 1 8.1 8.1 0.02 0.881Baseline.Time.Treatment 2 28.9 14.4 0.04 0.961Residual 43 15475.3 359.9 Total 49 16382.4
B.6 ANOVA tables for Chapter SixTable B.171. Effect of the transition between CA and air storage on respiration rate of onion cvs. Renate, Carlos and SS1 (Section 6.4.1, Figure 6.1).
Source of variation d.f. s.s. m.s. v.r. F pr.
Cultivar 20.06809
20.03404
6 9.56 <.001Baseline 1 0.00636 0.00636 1.79 0.187
Cultivar.Baseline 20.00092
40.00046
2 0.13 0.879
Baseline.Time 10.00033
60.00033
6 0.09 0.76
Baseline.P1 10.00302
40.00302
4 0.85 0.361
Cultivar.Baseline.Time 20.00155
80.00077
9 0.22 0.804
Cultivar.Baseline.P1 20.02880
90.01440
5 4.05 0.023Baseline.Time.P1 1 0.00231 0.00231 0.65 0.424
Baseline.Time.P2 10.07515
20.07515
2 21.1 <.001
Cultivar.Baseline.Time.P1 2 0.003390.00169
5 0.48 0.624
Cultivar.Baseline.Time.P2 20.00582
80.00291
4 0.82 0.447
Baseline.Time.P1.P2 10.00230
10.00230
1 0.65 0.425Cultivar.Baseline.Time.P1.P2 2
0.008702
0.004351 1.22 0.303
Residual 510.18160
50.00356
1
Total 710.38839
2
© 2006 Horticultural Development Council
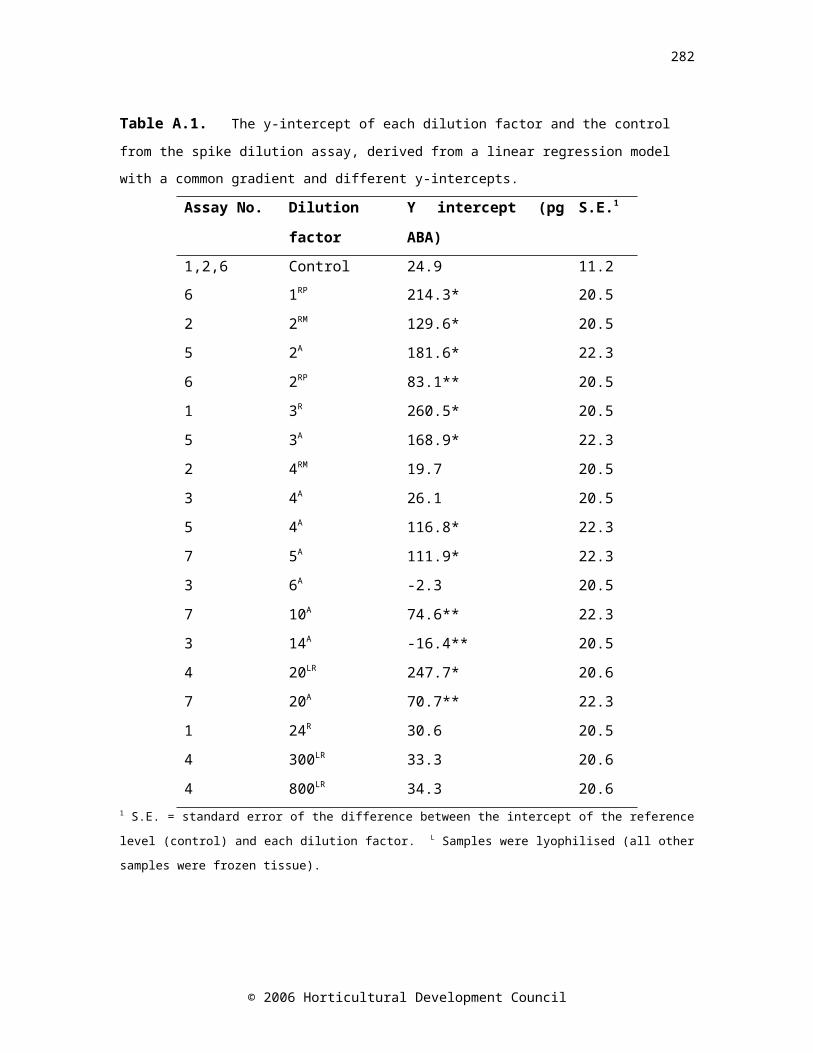
286
Table B.172. Effect of the transition between CA and air storage on sprout growth of onion cvs. Renate, Carlos and SS1 (Section 6.4.1, Figure 6.2).
Source of variation d.f. s.s. m.s. v.r. F pr.Cultivar 2 9125.97 4562.98 115.35 <.001Baseline 2 4467.89 2233.95 56.47 <.001Cultivar.Baseline 4 7985.22 1996.31 50.46 <.001Baseline.Time 1 9574.06 9574.06 242.02 <.001Baseline.P1 1 140.21 140.21 3.54 0.062
Cultivar.Baseline.Time 217111.1
9 8555.6 216.28 <.001Cultivar.Baseline.P1 2 102.36 51.18 1.29 0.277Baseline.Time.P1 1 140.21 140.21 3.54 0.062Baseline.Time.P2 1 679.24 679.24 17.17 <.001Cultivar.Baseline.Time.P1 2 102.36 51.18 1.29 0.277Cultivar.Baseline.Time.P2 2 717.58 358.79 9.07 <.001Baseline.Time.P1.P2 1 977 977 24.7 <.001Cultivar.Baseline.Time.P1.P2 2 1154.32 577.16 14.59 <.001Residual 156 6171.12 39.56
Total 17958448.7
5
Table B.173. Effect of the transition between CA and air storage on firmness of onion cvs. Renate, Carlos and SS1 (Section 6.4.1, Table 6.2).
Source of variation d.f. (m.v.) s.s. m.s. v.r. F pr.
Cultivar 231029.0
215514.5
1 254.45 <.001Baseline 1 -1 588.74 588.74 9.66 0.002Cultivar.Baseline 2 -2 531.53 265.76 4.36 0.015Baseline.Time 1 207.78 207.78 3.41 0.067Baseline.P1 1 109.17 109.17 1.79 0.183Cultivar.Baseline.Time 2 141.34 70.67 1.16 0.317Cultivar.Baseline.P1 2 143.02 71.51 1.17 0.313Baseline.Time.P1 1 10.11 10.11 0.17 0.685Baseline.Time.P2 1 0.17 0.17 0 0.958Cultivar.Baseline.Time.P1 2 96.43 48.22 0.79 0.456Cultivar.Baseline.Time.P2 2 47.28 23.64 0.39 0.679Baseline.Time.P1.P2 1 70.83 70.83 1.16 0.283Cultivar.Baseline.Time.P1.P2 2 89.03 44.51 0.73 0.484Residual 122 -34 7438.59 60.97
Total 142 -3736656.8
1
Table B.174. Effect of the transition between CA and air storage on dry weight of onion cvs. Renate, Carlos and SS1 (Section 6.4.1, Table 6.2).
© 2006 Horticultural Development Council
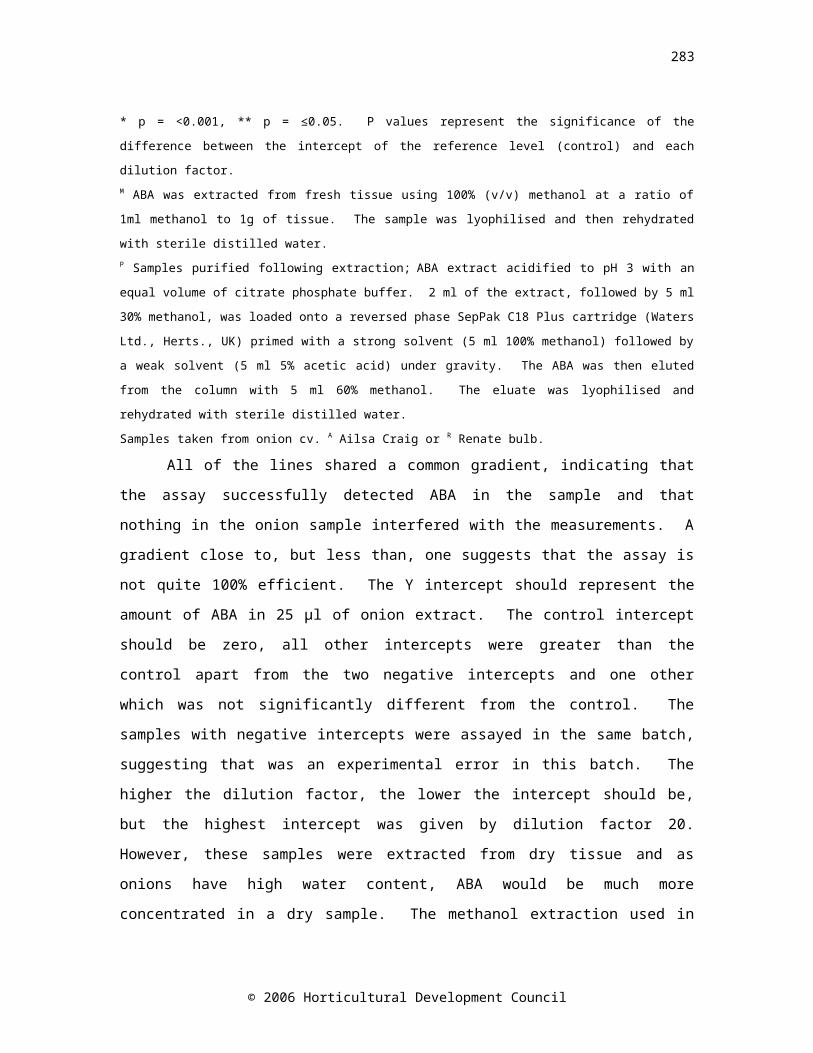
287
Source of variation d.f. (m.v.) s.s. m.s. v.r. F pr.
Cultivar 21630.76
5 815.383 735.82 <.001Baseline 2 29.364 14.682 13.25 <.001Cultivar.Baseline 4 10.694 2.674 2.41 0.051Baseline.Time 1 0.043 0.043 0.04 0.843Baseline.P1 1 0.408 0.408 0.37 0.545Cultivar.Baseline.Time 2 0.916 0.458 0.41 0.662Cultivar.Baseline.P1 2 5.25 2.625 2.37 0.097Baseline.Time.P1 1 3.327 3.327 3 0.085Baseline.Time.P2 1 0.049 0.049 0.04 0.834Cultivar.Baseline.Time.P1 2 0.452 0.226 0.2 0.816Cultivar.Baseline.Time.P2 2 0.446 0.223 0.2 0.818Baseline.Time.P1.P2 1 0.064 0.064 0.06 0.81Cultivar.Baseline.Time.P1.P2 2 0.198 0.099 0.09 0.914Residual 155 -1 171.76 1.108
Total 178 -11851.86
3
Table B.175. Effect of the transition between CA and air storage on total soluble solids content of onion cvs. Renate, Carlos and SS1 (Section 6.4.2, Table 6.3).
Source of variation d.f. s.s. m.s. v.r. F pr.
Cultivar 21279.23
9 639.62 499.34 <.001Baseline 2 15.999 7.999 6.24 0.002Cultivar.Baseline 4 26.185 6.546 5.11 <.001Baseline.Time 1 0.013 0.013 0.01 0.921Baseline.P1 1 1.021 1.021 0.8 0.373Cultivar.Baseline.Time 2 2.614 1.307 1.02 0.363Cultivar.Baseline.P1 2 9.642 4.821 3.76 0.025Baseline.Time.P1 1 2.503 2.503 1.95 0.164Baseline.Time.P2 1 0.333 0.333 0.26 0.611Cultivar.Baseline.Time.P1 2 16.473 8.236 6.43 0.002Cultivar.Baseline.Time.P2 2 15.493 7.746 6.05 0.003Baseline.Time.P1.P2 1 0.163 0.163 0.13 0.722Cultivar.Baseline.Time.P1.P2 2 23.468 11.734 9.16 <.001Residual 156 199.824 1.281Total 179 1592.97
© 2006 Horticultural Development Council
288
Table B.176. Effect of the transition between CA and air storage on pyruvate concentration of onion cvs. Renate, Carlos and SS1 (Section 6.4.2, Table 6.3).
Source of variation d.f. s.s. m.s. v.r. F pr.Cultivar 2 429.837 214.919 111.19 <.001Baseline 2 61.733 30.867 15.97 <.001Cultivar.Baseline 4 33.141 8.285 4.29 0.003Baseline.Time 1 5.069 5.069 2.62 0.107Baseline.P1 1 6.253 6.253 3.23 0.074Cultivar.Baseline.Time 2 1.827 0.914 0.47 0.624Cultivar.Baseline.P1 2 24.306 12.153 6.29 0.002Baseline.Time.P1 1 0.416 0.416 0.22 0.643Baseline.Time.P2 1 0.373 0.373 0.19 0.661Cultivar.Baseline.Time.P1 2 2.899 1.45 0.75 0.474Cultivar.Baseline.Time.P2 2 6.545 3.272 1.69 0.187Baseline.Time.P1.P2 1 3.137 3.137 1.62 0.205Cultivar.Baseline.Time.P1.P2 2 3.871 1.935 1 0.37Residual 156 301.526 1.933 Total 179 880.934
Table B.177. Effect of the transition between CA and air storage on sucrose concentration of onion cvs. Renate, Carlos and SS1 (Section 6.4.3, Figure 6.3).
Source of variation d.f. (m.v.) s.s. m.s. v.r. F pr.Cultivar 2 18927.7 9463.8 14.64 <.001Baseline 2 48255.7 24127.8 37.32 <.001Cultivar.Baseline 4 13330.1 3332.5 5.15 <.001Baseline.Time 1 1267 1267 1.96 0.164Baseline.P1 1 1987 1987 3.07 0.082Cultivar.Baseline.Time 2 10523.6 5261.8 8.14 <.001Cultivar.Baseline.P1 2 1022 511 0.79 0.455Baseline.Time.P1 1 1484.1 1484.1 2.3 0.132Baseline.Time.P2 1 837.6 837.6 1.3 0.257Cultivar.Baseline.Time.P1 2 240.3 120.2 0.19 0.831Cultivar.Baseline.Time.P2 2 2013.8 1006.9 1.56 0.214Baseline.Time.P1.P2 1 59.6 59.6 0.09 0.762Cultivar.Baseline.Time.P1.P2 2 1402.5 701.3 1.08 0.341Residual 154 -2 99558.1 646.5
Total 177 -2200263.
2
© 2006 Horticultural Development Council
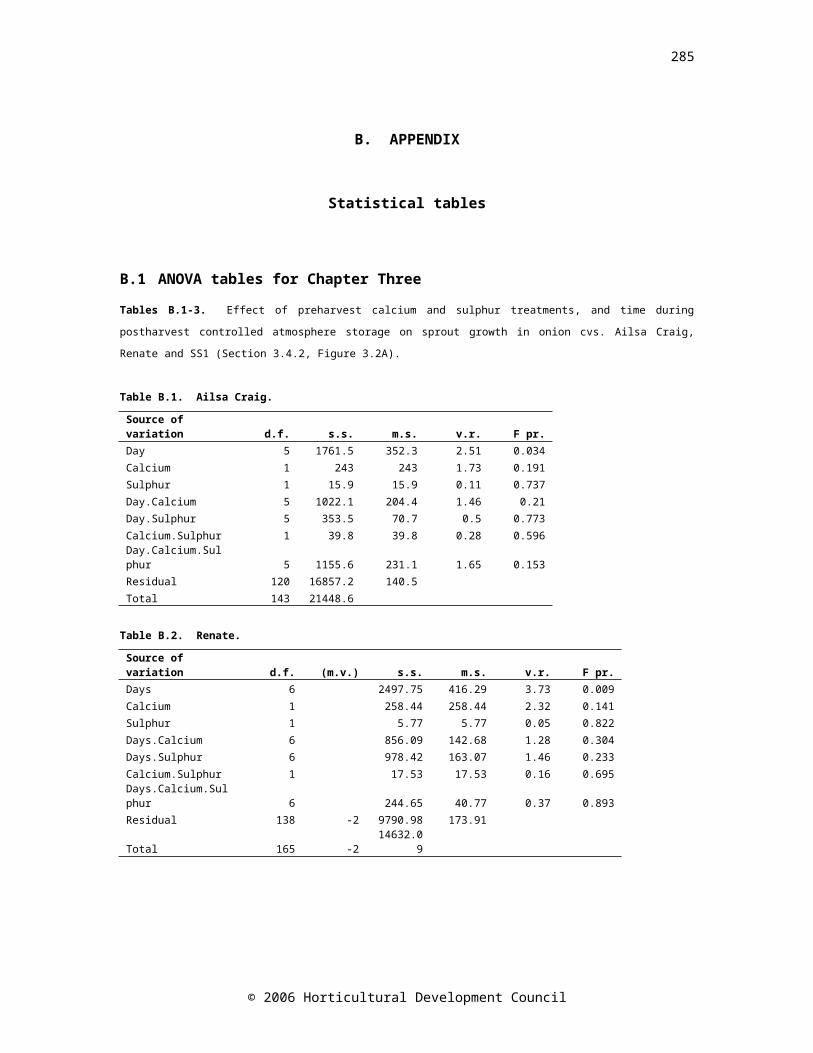
289
Table B.178. Effect of the transition between CA and air storage on fructose concentration of onion cvs. Renate, Carlos and SS1 (Section 6.4.2, Figure 6.3).
Source of variation d.f. (m.v.) s.s. m.s. v.r. F pr.Cultivar 2 1687710 843855 582.07 <.001Baseline 2 55330 27665 19.08 <.001Cultivar.Baseline 4 115411 28853 19.9 <.001Baseline.Time 1 169 169 0.12 0.733Baseline.P1 1 2612 2612 1.8 0.181Cultivar.Baseline.Time 2 25863 12932 8.92 <.001Cultivar.Baseline.P1 2 5870 2935 2.02 0.136Baseline.Time.P1 1 13531 13531 9.33 0.003Baseline.Time.P2 1 8760 8760 6.04 0.015Cultivar.Baseline.Time.P1 2 9572 4786 3.3 0.039Cultivar.Baseline.Time.P2 2 16374 8187 5.65 0.004Baseline.Time.P1.P2 1 5621 5621 3.88 0.051Cultivar.Baseline.Time.P1.P2 2 5491 2746 1.89 0.154Residual 154 -2 223262 1450 Total 177 -2 2163626
Table B.179. Effect of the transition between CA and air storage on glucose concentration of onion cvs. Renate, Carlos and SS1 (Section 6.4.2, Figure 6.3).
Source of variation d.f. (m.v.) s.s. m.s. v.r. F pr.Cultivar 2 606627 303314 277.05 <.001Baseline 2 54127 27063 24.72 <.001Cultivar.Baseline 4 53786 13447 12.28 <.001Baseline.Time 1 13 13 0.01 0.915Baseline.P1 1 620 620 0.57 0.453Cultivar.Baseline.Time 2 62516 31258 28.55 <.001Cultivar.Baseline.P1 2 26569 13285 12.13 <.001Baseline.Time.P1 1 12244 12244 11.18 0.001Baseline.Time.P2 1 22518 22518 20.57 <.001Cultivar.Baseline.Time.P1 2 5238 2619 2.39 0.095Cultivar.Baseline.Time.P2 2 2788 1394 1.27 0.283Baseline.Time.P1.P2 1 8669 8669 7.92 0.006Cultivar.Baseline.Time.P1.P2 2 12887 6443 5.89 0.003Residual 154 -2 168598 1095Total 177 -2 1024754
© 2006 Horticultural Development Council
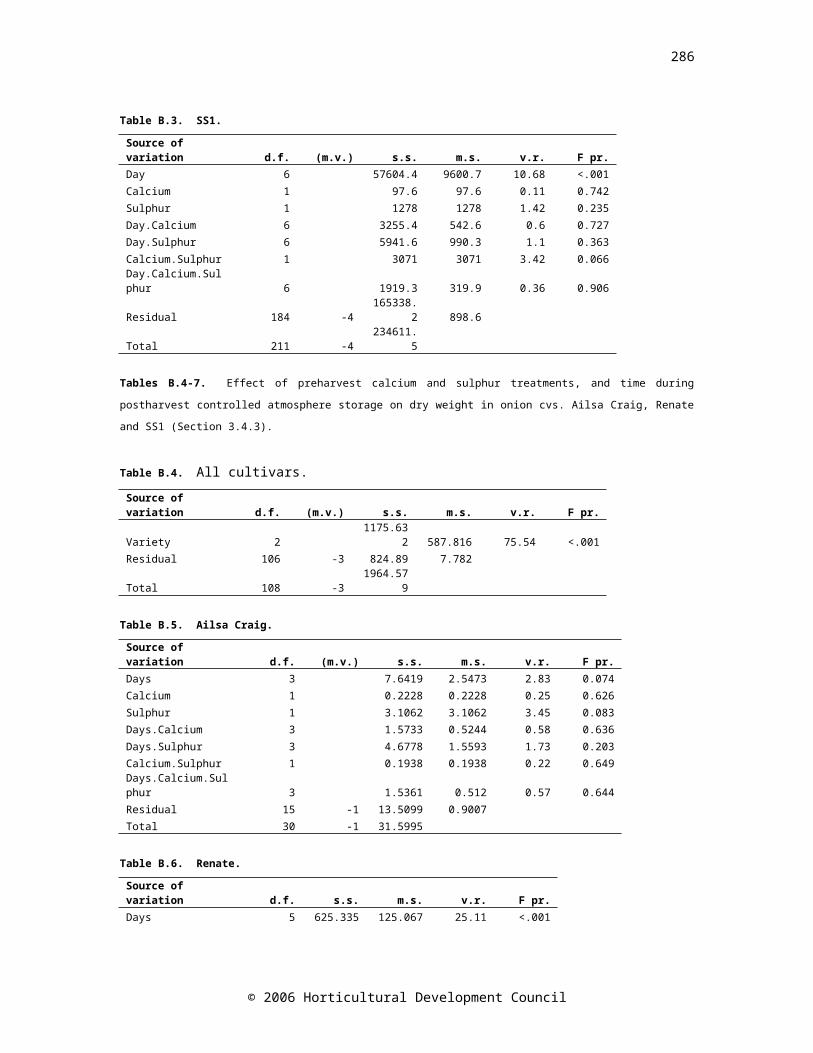
290
Table B.180. Effect of the transition between CA and air storage on the ratio of monosaccharide: disaccharides in onion cvs. Renate, Carlos and SS1 (Section 6.4.2, Figure 6.4).
Source of variation d.f. (m.v.) s.s. m.s. v.r. F pr.Cultivar 2 2381.47 1190.74 86.05 <.001Baseline 2 1862.48 931.24 67.3 <.001Cultivar.Baseline 4 2308.76 577.19 41.71 <.001Baseline.Time 1 18.22 18.22 1.32 0.253Baseline.P1 1 2 2 0.14 0.704Cultivar.Baseline.Time 2 16.97 8.49 0.61 0.543Cultivar.Baseline.P1 2 5.58 2.79 0.2 0.818Baseline.Time.P1 1 1.67 1.67 0.12 0.729Baseline.Time.P2 1 0.68 0.68 0.05 0.824Cultivar.Baseline.Time.P1 2 0.32 0.16 0.01 0.989Cultivar.Baseline.Time.P2 2 0.61 0.31 0.02 0.978Baseline.Time.P1.P2 1 0.04 0.04 0 0.956Cultivar.Baseline.Time.P1.P2 2 3.89 1.95 0.14 0.869Residual 154 -2 2130.9 13.84 Total 177 -2 8715.74
Table B.181. Effect of the transition between CA and air storage on total sugar concentration in onion cvs. Renate, Carlos and SS1 (Section 6.4.2, Figure 6.4).
Source of variation d.f. (m.v.) s.s. m.s. v.r. F pr.Cultivar 2 4233779 2116890 519.9 <.001Baseline 2 58119 29060 7.14 0.001Cultivar.Baseline 4 183854 45964 11.29 <.001Baseline.Time 1 2027 2027 0.5 0.481Baseline.P1 1 14538 14538 3.57 0.061Cultivar.Baseline.Time 2 221267 110634 27.17 <.001Cultivar.Baseline.P1 2 61177 30588 7.51 <.001Baseline.Time.P1 1 70495 70495 17.31 <.001Baseline.Time.P2 1 74299 74299 18.25 <.001Cultivar.Baseline.Time.P1 2 18602 9301 2.28 0.105Cultivar.Baseline.Time.P2 2 20146 10073 2.47 0.088Baseline.Time.P1.P2 1 109 109 0.03 0.87Cultivar.Baseline.Time.P1.P2 2 26642 13321 3.27 0.041Residual 154 -2 627045 4072 Total 177 -2 5574303
© 2006 Horticultural Development Council
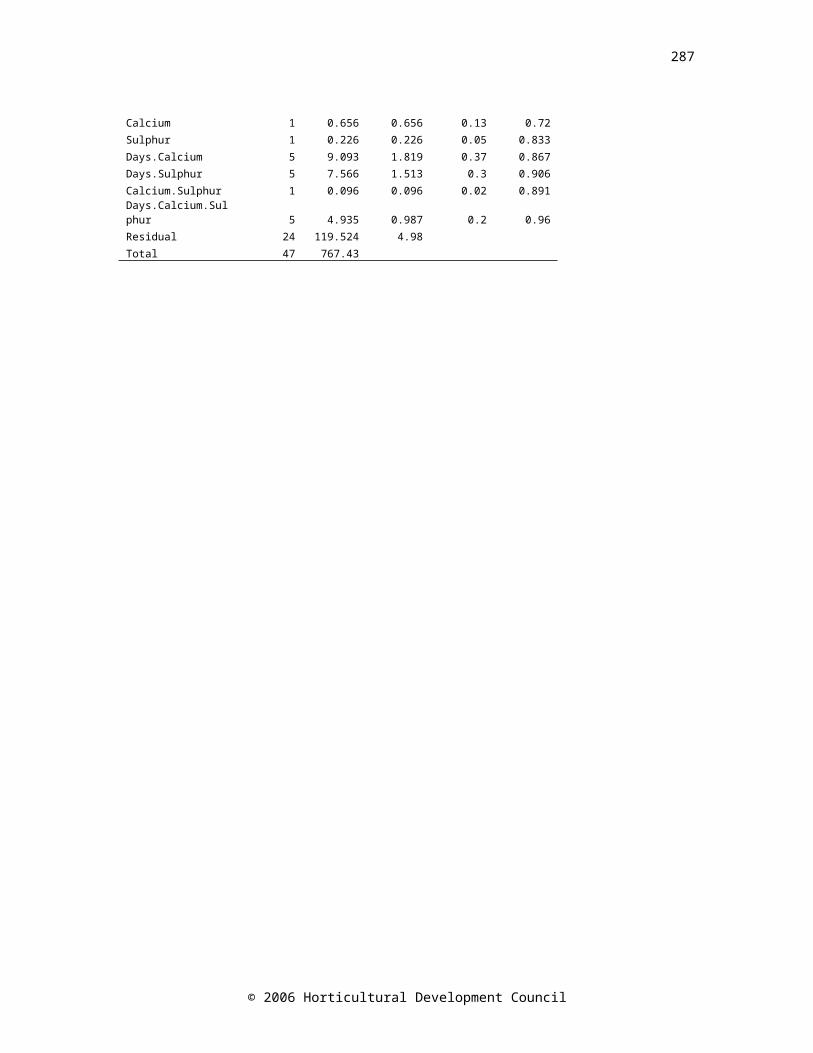
291
Table B.182. Effect of the transition between CA and air storage on total fructan concentration in onion cvs. Renate, Carlos and SS1 (Section 6.4.2, Figure 6.4).
Source of variation d.f. (m.v.) s.s. m.s. v.r. F pr.Cultivar 2 2334507 1167254 669.66 <.001Baseline 2 24104 12052 6.91 0.001Cultivar.Baseline 4 35601 8900 5.11 <.001Baseline.Time 1 18315 18315 10.51 0.001Baseline.P1 1 9680 9680 5.55 0.02Cultivar.Baseline.Time 2 11833 5917 3.39 0.036Cultivar.Baseline.P1 2 7468 3734 2.14 0.121Baseline.Time.P1 1 2970 2970 1.7 0.194Baseline.Time.P2 1 94 94 0.05 0.817Cultivar.Baseline.Time.P1 2 10933 5466 3.14 0.046Cultivar.Baseline.Time.P2 2 8285 4143 2.38 0.096Baseline.Time.P1.P2 1 1093 1093 0.63 0.43Cultivar.Baseline.Time.P1.P2 2 2188 1094 0.63 0.535Residual 155 -1 270172 1743 Total 178 -1 2725545
Table B.183. Effect of the transition between CA and air storage on abscisic acid concentration in onion cvs. Renate, Carlos and SS1 (Section 6.4.2, Figure 6.5).
Source of variation d.f. (m.v.) s.s. m.s. v.r. F pr.Cultivar 2 47231 23616 6.16 0.003Baseline 2 152482 76241 19.9 <.001Cultivar.Baseline 4 83495 20874 5.45 <.001Baseline.Time 1 416 416 0.11 0.742Baseline.P1 1 322 322 0.08 0.772Cultivar.Baseline.Time 2 1846 923 0.24 0.786Cultivar.Baseline.P1 2 1679 839 0.22 0.804Baseline.Time.P1 1 1964 1964 0.51 0.475Baseline.Time.P2 1 505 505 0.13 0.717Cultivar.Baseline.Time.P1 2 7482 3741 0.98 0.379Cultivar.Baseline.Time.P2 2 6289 3144 0.82 0.442Baseline.Time.P1.P2 1 480 480 0.13 0.724Cultivar.Baseline.Time.P1.P2 2 1808 904 0.24 0.79Residual 155 -1 593787 3831 Total 178 -1 894609
© 2006 Horticultural Development Council
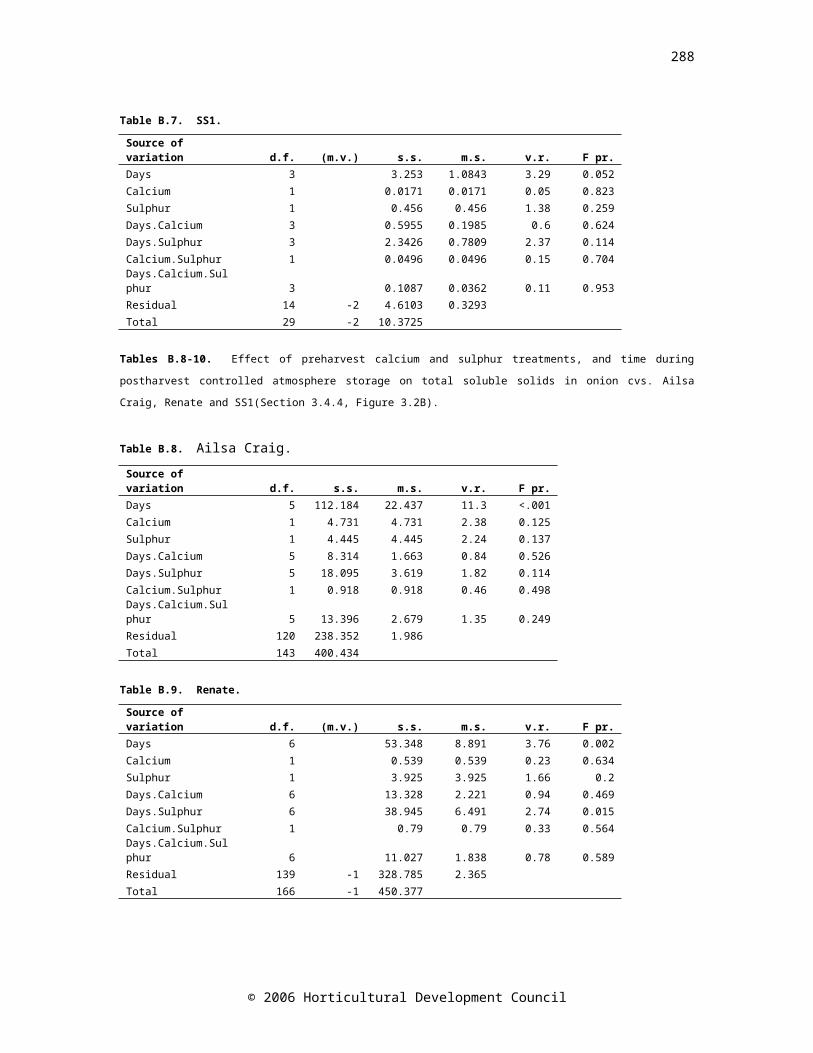
292
C. APPENDIX
Published literature.
Chope, G. A., Terry, L. A., White, P. J., 2006. Effect of controlled atmosphere storage on abscisic acid concentration and other biochemical attributes of onion bulbs. Postharvest Biol. Technol. 39, 233-242.
© 2006 Horticultural Development Council