Embed Size (px)
Citation preview

CRANE CO.
Q4 2017 EARNINGS RELEASE CALL

Forward-Looking Statements - Disclaimer
2 » www.craneco.com
The information in this presentation includes “forward-looking statements” within
the meaning of the Private Securities Litigation Reform Act of 1995. Forward-
looking statements are statements other than historical information or statements
about our current condition. You can identify forward-looking statements by the
use of terms such as “believes,” “contemplates,” “expects,” “may,” “could,”
“should,” “would,” or “anticipates,” other similar phrases, or the negatives of
these terms. We have based the forward-looking statements relating to our
operations on our current expectations, estimates and projections about us and
the markets we serve. We caution you that these statements are not guarantees of
future performance and involve risks and uncertainties. In addition, we have based
many of these forward-looking statements on assumptions about future events
that may prove to be inaccurate. Accordingly, actual outcomes and results may
differ materially from what we have expressed or forecast in the forward-looking
statements. Any differences could result from a variety of factors, including those
detailed on Page 1 of our Annual Report on Form 10-K for 2016 and in our
subsequent disclosures filed with the Securities and Exchange Commission.

3 » www.craneco.com
Summary
Additional Potential Upside from Capital Deployment
Expect double-digit annual adjusted earnings growth for several years:
• Core business executing well with accelerating growth
• Crane Currency EPS accretion*: $0.15 in 2018 growing to $1.00 by 2021
• Tax reform benefits
• Enabling growth investments in near-term
• Full $0.50 annual EPS benefit reading through by 2020
• Proactive repositioning adding $0.30 to adjusted EPS* annually by 2020
• Raised dividend by 6%; first increase since 2014
* Excludes Special Items. Please see non-GAAP Financial Measures tables for details.

Q4 2017 Earnings Summary
4 » www.craneco.com
Q4 2017 Q4 2016 Change
Sales $714 $681 +5%
Operating Profit* $109 $101 +8%
Operating Margin* 15.2% 14.8% +40 bps
Earnings per Share* $1.18 $1.02 +16%
Free Cash Flow** $129 $137 (6%)
($ Millions except per-share amounts)
Q4 2017
Core Growth +1.9%
Acquisitions, net +0.8%
FX Translation +2.1%
Total Sales Change +4.8%
Q4 2017
Loss per Share: GAAP ($0.48)
Impact of Tax Law Change $1.44
Repositioning and Related Items $0.13
M&A Related Items $0.08
Diluted EPS: non-GAAP $1.18
Additional Details
* Excludes Special Items. Please see non-GAAP Financial Measures tables for details. ** Free cash flow is defined as cash provided by operating activities less capital spending. Please see non-GAAP Financial Measures tables for details.

Full-Year 2017 Earnings
5 » www.craneco.com
FY 2017 FY 2016 Change
Sales $2,786 $2,748 +1%
Operating Profit* $423 $398 +6%
Operating Margin* 15.2% 14.5% +70 bps
Earnings per Share* $4.53 $4.23 +7%
Free Cash Flow** $269 $267 +1%
($ Millions except per-share amounts)
FY 2017
Core Growth +1.1%
Acquisitions, net +0.5%
FX Translation (0.2%)
Total Sales Change +1.4%
FY 2017
Diluted EPS: GAAP $2.84
Impact of Tax Law Change $1.44
Repositioning and Related Items $0.13
M&A Related Items $0.11
Diluted EPS: non-GAAP $4.53
Additional Details
* Excludes Special Items. Please see non-GAAP Financial Measures tables for details. ** Free cash flow is defined as cash provided by operating activities less capital spending. Please see non-GAAP Financial Measures tables for details.

Full Year Segment Results
6 » www.craneco.com
Core Growth Segment Margin
2017 2016* 2017* Change
Fluid Handling +2% 12.0% 12.0% -
Payment &
Merchandising
Technologies
+6% 18.2% 20.8% +260 bps
Aerospace & Electronics (7%) 20.1% 21.8% +170 bps
Engineered Materials +7% 19.1% 18.0% (110 bps)
Crane Co. +1% 14.5% 15.2% +70 bps
* Excludes Special Items. Please see non-GAAP Financial Measures tables for details.

Fluid Handling
7 » www.craneco.com
* Excludes Special Items. Please see non-GAAP Financial Measures tables for details.
($ Millions)
Compared to Q3, sequential FX neutral backlog down (3%) and FX neutral orders down (3%)
Compared to Q4 2016, year-over-year FX neutral backlog up +9% and FX neutral orders +9%
Full year 2017 adjusted margins* held at 12.0%, with productivity and 2% core growth offsetting negative mix and material costs inflation
Q4 2017 Q4 2016 Change
Sales $272 $240 +13%
Operating Profit* $31 $28 +12%
Operating Margin* 11.5% 11.6% (10 bps)
Backlog $262 $228 +15%
Q4 2017
Core Growth +6.6%
Acquisitions, net +2.5%
FX Translation +4.0%
Total Sales Change +13.2%
Q4 2017 Highlights

Payment & Merchandising Technologies
8 » www.craneco.com
* Excludes Special Items. Please see non-GAAP Financial Measures tables for details.
($ Millions)
Full year 2017 margins of 20.8%, up 260 bps vs. 2016
Full year 2017 core sales growth of +6.0%, following +8.5% and 6.0% in 2016 and 2015, respectively
Continued strong demand across multiple payment vertical markets
Q4 2017 Q4 2016 Change
Sales $194 $195 -
Operating Profit* $38 $38 (2%)
Operating Margin* 19.4% 19.7% (30 bps)
Q4 2017
Core Growth (2.0%)
Acquisitions, net (0.5%)
FX Translation +2.3%
Total Sales Change (0.1%)
Q4 2017 Highlights

Aerospace & Electronics
9 » www.craneco.com
* Excludes Special Items. Please see non-GAAP Financial Measures tables for details.
($ Millions)
Q4 2017 Q4 2016 Change
Sales $185 $187 (1%)
Operating Profit* $46 $39 +16%
Operating Margin* 24.7% 21.0% +370 bps
Backlog $374 $353 +6%
Q4 2017
Core Growth (1.0%)
FX Translation +0.2%
Total Sales Change (0.8%)
Q4 2017 Highlights
Q4 2017
OE Sales (2%)
Aftermarket Sales +2%
OE / Aftermarket Mix 70%/30%
Full year 2017 margins up 170 bps to 21.8%
OE decline driven by challenging comparisons vs. Space Fence in 2016
Strong commercial spares growth partially offset by lower modernization & upgrade activity

Engineered Materials
10 » www.craneco.com
($ Millions)
Q4 2017 Q4 2016 Change
Sales $63 $60 +5%
Operating Profit $10 $10 (4%)
Operating Margin 15.9% 17.4% (150 bps)
Q4 2017 Highlights
Q4 2017
Core Growth +4.7%
FX Translation -
Total Sales Change +4.7%
Q4 2017
Recreational Vehicle +7%
Building Products +9%
Transportation (17%)
Solid demand in RV and Building Products continues

Cash Flow, Balance Sheet, and Tax
11 » www.craneco.com
* Free cash flow is defined as cash provided by operating activities less capital spending. Please see non-GAAP Financial Measures tables for details.
** Excludes Special Items. Please see non-GAAP Financial Measures tables for details.
Q4 2017 Q4 2016 Better / (Worse)
Cash Provided from Operating Activities $143 $150 ($7)
Capital Expenditures ($15) ($13) ($2)
Free Cash Flow* $129 $137 ($8)
Effective (GAAP) Tax Rate 134.4% 37.2% NM
Non-GAAP (adjusted) Tax Rate** 29.2% 32.5% 330 bps
Total Debt $743 $745 $2
Cash $706 $510 $196
($ Millions)
FY 2017 FY 2016 Better / (Worse)
Cash Provided from Operating Activities $318 $318 -
Capital Expenditures ($49) ($51) $2
Free Cash Flow* $269 $267 $2
* Excludes Special Items. Please see non-GAAP Financial Measures tables for details.
** Free Cash Flow is defined as Cash Provided by Operating Activities, less Capital Spending. Please see non-GAAP Financial Measures Tables for details.
*** Reflects midpoint of guidance range.
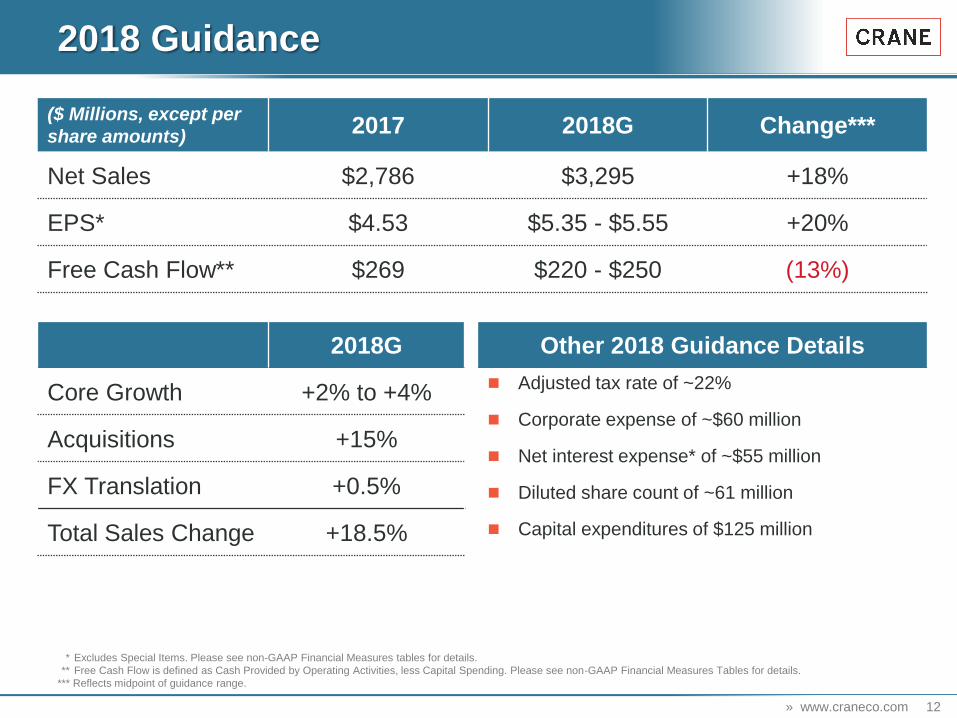
2018 Guidance
12 » www.craneco.com
($ Millions, except per
share amounts) 2017 2018G Change***
Net Sales $2,786 $3,295 +18%
EPS* $4.53 $5.35 - $5.55 +20%
Free Cash Flow** $269 $220 - $250 (13%)
2018G
Core Growth +2% to +4%
Acquisitions +15%
FX Translation +0.5%
Total Sales Change +18.5%
Other 2018 Guidance Details
Adjusted tax rate of ~22%
Corporate expense of ~$60 million
Net interest expense* of ~$55 million
Diluted share count of ~61 million
Capital expenditures of $125 million

2018 Adjusted EPS Guidance
13 » www.craneco.com
0.42
0.50
0.15
0.10
2018G
Midpoint*
Core Business 2017 Adjusted
EPS*
Growth
Investments
Tax Benefit
(0.25)
Crane Currency Repositioning
4.53
5.45
Tax, net of Investments
* Excludes Special Items. Please see non-GAAP Financial Measures tables for details.

2018 Segment Guidance
14 » www.craneco.com
Core Growth Segment Margin
2017 2018G 2017* 2018G*
Fluid Handling +2% +3% 12.0% 13.0%
Payment & Merchandising
Technologies** +6% +2% 20.8% 16.5%
Aerospace & Electronics (7%) +5% 21.8% 21.5%
Engineered Materials +7% +2% 18.0% 18.0%
Crane Co. +1% +2% to +4% 15.2% 14.7%
* Excludes Special Items. Please see non-GAAP Financial Measures tables for details.
** Payment & Merchandising Technologies 2018 segment margin guidance includes an estimate of approximately $45 million of recurring intangible amortization, including $23 million related to
the Crane Currency acquisition (excluding one-time backlog amortization related to Crane Currency)

Jason D. Feldman
Director, Investor Relations
203-363-7329

Appendix
16 » www.craneco.com
* Excludes Special Items. Please see non-GAAP Financial Measures tables for details.
Non-GAAP Information

Non-GAAP Explanation
17 » www.craneco.com
Certain non-GAAP measures have been provided to facilitate comparison with the prior year.
The Company reports its financial results in accordance with U.S. generally accepted
accounting principles (GAAP). However, management believes that non-GAAP financial
measures which exclude certain non-recurring items present additional useful comparisons
between current results and results in prior operating periods, providing investors with a
clearer view of the underlying trends of the business. Management also uses these non-
GAAP financial measures in making financial, operating, planning and compensation
decisions and in evaluating the Company's performance.
In addition, Free Cash Flow provides supplemental information to assist management and
investors in analyzing the Company’s ability to generate liquidity from its operating
activities. The measure of Free Cash Flow does not take into consideration certain other
non-discretionary cash requirements such as, for example, mandatory principal payments
on the Company's long-term debt. Non-GAAP financial measures, which may be
inconsistent with similarly captioned measures presented by other companies, should be
viewed in addition to, and not as a substitute for, the Company’s reported results prepared
in accordance with GAAP.

Non-GAAP Financial Measures
18 » www.craneco.com
(in millions, except per share data) Three Months Ended Twelve Months Ended Percent Change Percent Change
December 31, December 31, December 31, 2017 December 31, 2017
2017 2016 2017 2016 Three Months Twelve Months
Net Sales 714.2$ 681.4$ 2,786.0$ 2,748.0$ 4.8% 1.4%
Operating Profit 90.9 (91.6) 401.9 200.3 (199.2%) 100.7%
Percentage of Sales 12.7% -13.4% 14.4% 7.3%
Special Items impacting Operating Profit:
Asbestos provision 192.4 192.4
Transaction related charges 4.7 - 7.8 -
Repositioning charges, net of gain on property sale 13.0 - 13.0 -
Legal settlement charge - - - 5.0
108.6$ 100.8$ 422.7$ 397.7$ 7.8% 6.3%
Percentage of Sales 15.2% 14.8% 15.2% 14.5%
Net Income Attributable to Common Shareholders (28.7)$ (64.0)$ 171.8$ 122.8$
Per Share (0.48)$ (1.09)$ 2.84$ 2.07$ (55.6%) 37.3%
Asbestos provision - 125.1 - 125.1
Per Share 2.13$ 2.11$
Transaction related charges - Net of Tax 4.6 - 6.7 -
Per Share 0.08$ 0.11$
Repositioning charges, net of gain on property sale - Net of Tax 8.0 - 8.0 -
Per Share 0.13$ 0.13$
Legal settlement charge - Net of Tax - - - 3.3
Per Share 0.05$
Impact of Tax Law Change 87.1 - 87.1 -
Per Share 1.44$ 1.44$
71.0$ 61.1$ 273.6$ 251.1$ 16.1% 8.9%
Per Basic Share 1.20$ 1.04$ 4.61$ 4.30$ 14.9% 7.2%
Per Diluted Share 1.18$ 1.02$ 4.53$ 4.23$
(in thousands) (in thousands)
59,373 58,768
1,041 991
60,414 59,759
Net Income Attributable To Common Shareholders Before Special Items
In the three months ended December 31, 2017 and December 31, 2016, Average Shares Outstanding excluding the effect of diluted stock options were used
to compute the per share amounts since these periods were in a loss position. Had Net Income Attributable To Common Shareholders been reported for these
periods, Average Shares Outstanding would have included the effect of diluted stock options when computing per share amounts (see chart below).
Average Basic Shares Outstanding
Effect of Diluted Stock Options
Average Shares Outstanding including the effect of Stock Options
When considering the effect of dilutive stock options on shares outstanding, Net Income Attributable To Common Shareholders Before Special Items is $1.18
per share and $1.02 per share for the three months ended December 31, 2017 and 2016, respectively.
Special Items Impacting Net Income Attributable to Common Shareholders:
Operating Profit before Special Items

Non-GAAP Financial Measures
19 » www.craneco.com
Segment Information:
Fluid Handling
Payment &
Merchandising
Technologies
Aerospace &
Electronics
Engineered
Materials Corporate Total Company
Net Sales 272.2 194.4 184.9 62.7 - 714.2
Operating Profit - GAAP 20.4 25.4 55.4 10.0 (20.3) 90.9
Transaction related charges 0.4 0.1 - - 4.2 4.7
Repositioning charges, net of gain on property sale 10.6 12.2 (9.8) - - 13.0
Operating Profit before Special Items 31.4 37.7 45.6 10.0 (16.1) 108.6
Percentage of Sales 11.5% 19.4% 24.7% 15.9% 15.2%
Fluid Handling
Payment &
Merchandising
Technologies
Aerospace &
Electronics
Engineered
Materials Corporate Total Company
Net Sales 240.4 194.6 186.5 59.9 - 681.4
Operating Profit - GAAP 28.0 38.4 39.2 10.4 (207.6) (91.6)
Asbestos provision - - - - 192.4 192.4
Operating Profit before Special Items 28.0 38.4 39.2 10.4 (15.2) 100.8
Percentage of Sales 11.6% 19.7% 21.0% 17.4% 14.8%
For the three months ended December 31, 2016
For the three months ended December 31, 2017
CRANE CO.
Non-GAAP Financial Measures
(in millions, except per share data)
Non-GAAP Financial Measures
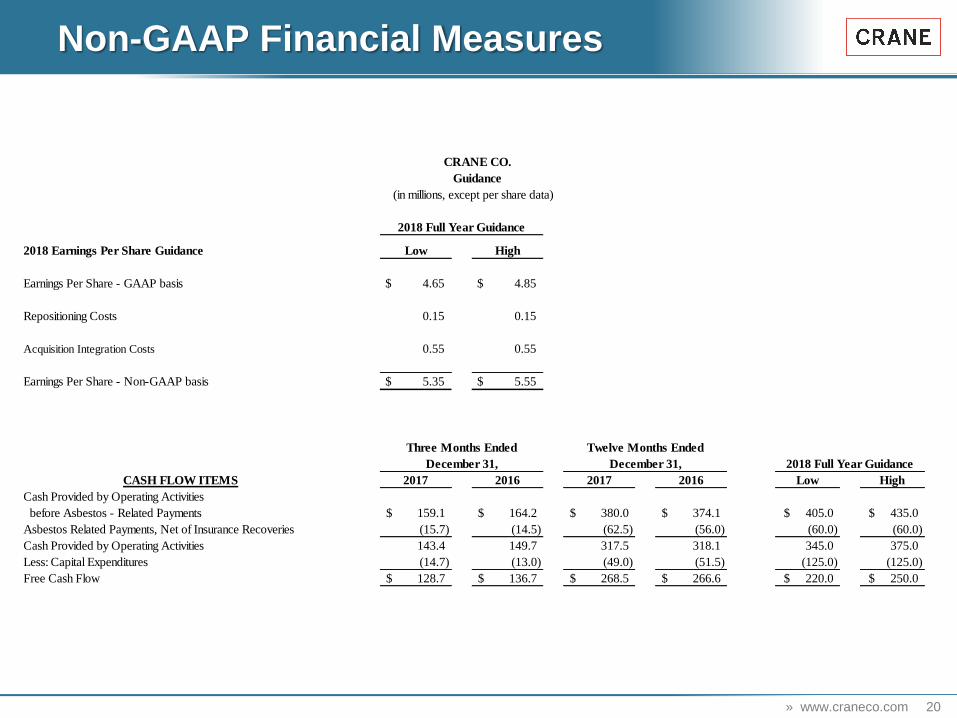
20 » www.craneco.com
2018 Earnings Per Share Guidance Low High
Earnings Per Share - GAAP basis $ 4.65 $ 4.85
0.15 0.15
Acquisition Integration Costs 0.55 0.55
Earnings Per Share - Non-GAAP basis $ 5.35 $ 5.55
Three Months Ended Twelve Months Ended
December 31, December 31,
CASH FLOW ITEMS 2017 2016 2017 2016 Low High
Cash Provided by Operating Activities
before Asbestos - Related Payments 159.1$ 164.2$ 380.0$ 374.1$ 405.0$ 435.0$
Asbestos Related Payments, Net of Insurance Recoveries (15.7) (14.5) (62.5) (56.0) (60.0) (60.0)
Cash Provided by Operating Activities 143.4 149.7 317.5 318.1 345.0 375.0
Less: Capital Expenditures (14.7) (13.0) (49.0) (51.5) (125.0) (125.0)
Free Cash Flow 128.7$ 136.7$ 268.5$ 266.6$ 220.0$ 250.0$
CRANE CO.
Guidance
(in millions, except per share data)
2018 Full Year Guidance
2018 Full Year Guidance
Repositioning Costs