Embed Size (px)
Citation preview

1 » www.craneco.com
CRANE CO. FINANCIAL OVERVIEW
RICHARD MAUE
CHIEF FINANCIAL OFFICER

2 » www.craneco.com
Financial Overview
2018 Outlook
2017 Results
Multi-Year Outlook
Capital Deployment
3 » www.craneco.com
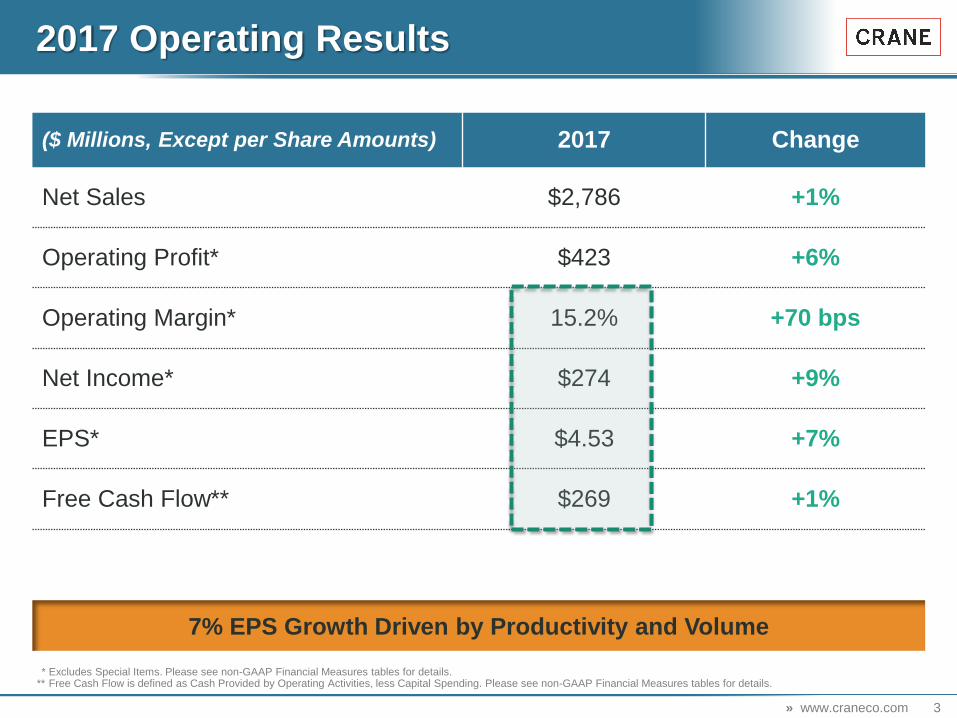
($ Millions, Except per Share Amounts) 2017 Change
Net Sales $2,786 +1%
Operating Profit* $423 +6%
Operating Margin* 15.2% +70 bps
Net Income* $274 +9%
EPS* $4.53 +7%
Free Cash Flow** $269 +1%
2017 Operating Results
* Excludes Special Items. Please see non-GAAP Financial Measures tables for details. ** Free Cash Flow is defined as Cash Provided by Operating Activities, less Capital Spending. Please see non-GAAP Financial Measures tables for details.
7% EPS Growth Driven by Productivity and Volume

4 » www.craneco.com
Financial Overview
2018 Outlook
2017 Results
Multi-Year Outlook
Capital Deployment

5 » www.craneco.com
2018 Guidance
* Excludes Special Items. Please see non-GAAP Financial Measures tables for details. ** Free Cash Flow is defined as Cash Provided by Operating Activities, less Capital Spending. Please see non-GAAP Financial Measures Tables for details. *** Reflects midpoint of guidance range.
($ Millions, Except per
Share Amounts) 2017 2018G Change***
Net Sales $2,786 $3,295 +18%
EPS* $4.53 $5.35–$5.55 +20%
Free Cash Flow** $269 $220–$250 (13%)
2018G
Core Growth +2% to +4%
Acquisitions +15%
FX Translation +0.5%
Total Sales Change +18.5%
Other 2018 Guidance Details
Adjusted tax rate of ~22%
Corporate expense of ~$60 million
Net interest expense* of ~$55 million
Diluted share count of ~61 million
Capital expenditures of $125 million

6 » www.craneco.com
$0.42
$0.50
$0.15
$0.10
2018 Adjusted EPS Guidance
($0.25)
$4.53
$5.45
Tax, net of Investments
2017 Adjusted
EPS*
Core
Business
Tax
Benefit
Growth
Investments
Crane
Currency
Repositioning 2018G
Midpoint*
* Excludes Special Items. Please see non-GAAP Financial Measures tables for details.

7 » www.craneco.com
Financial Performance
* Reflects midpoint of guidance range. ** Excludes Special Items. Please see non-GAAP Financial Measures tables for details.
Organic
Growth +0.6 +9.8% +4.3% +0.0% 0.3% (1.2%) 2.0% 1% 3%
Total Sales ($ Billions) Operating Profit** ($ Millions)
$2.2
$2.5 $2.6 $2.6
$2.9 $2.7 $2.7 $2.8
$3.3
$0.0
$0.5
$1.0
$1.5
$2.0
$2.5
$3.0
$3.5
2010 2011 2012 2013 2014 2015 2016 2017 2018G*
Margin** 11.1% 12.3% 13.0% 14.5% 14.6% 14.3% 14.5% 15.2% 14.7%
$241
$309 $335
$375
$426
$391 $398 $423
$484
$0
$100
$200
$300
$400
$500
2010 2011 2012 2013 2014 2015 2016 2017 2018G*
Solid Long-term Track Record

8 » www.craneco.com
2018 Growth Outlook
Core Growth
% of Crane
(2018G*) 2015 2016 2017 2018G* Comments
33% Fluid
Handling (6%) (6%) +2% +3%
+ Early stages of slow recovery
+ Growth initiatives
37% Payment &
Merchandising Technologies
+6% +9% +6% +2%
+ Strong underlying Payment demand
- Challenging comparisons
22% Aerospace & Electronics
0% +8% (7%) +5%
+ Commercial OE accelerating
+ Microwave project
- Widebody, Cabin, M&U
8% Engineered Materials
+1% +1% +7% +2% +Solid end markets today
- Late in RV cycle
* Reflects midpoint of guidance range.
9 » www.craneco.com
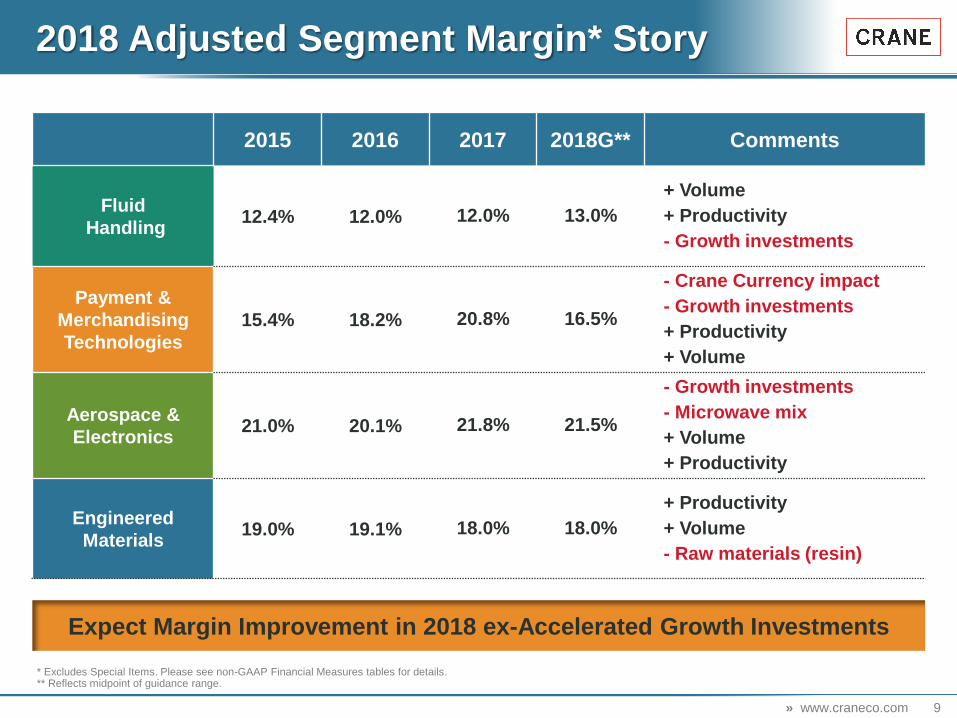
2018 Adjusted Segment Margin* Story
* Excludes Special Items. Please see non-GAAP Financial Measures tables for details. ** Reflects midpoint of guidance range.
2015 2016 2017 2018G** Comments
Fluid
Handling 12.4% 12.0% 12.0% 13.0%
+ Volume
+ Productivity
- Growth investments
Payment &
Merchandising
Technologies
15.4% 18.2% 20.8% 16.5%
- Crane Currency impact
- Growth investments
+ Productivity
+ Volume
Aerospace &
Electronics 21.0% 20.1% 21.8% 21.5%
- Growth investments
- Microwave mix
+ Volume
+ Productivity
Engineered
Materials 19.0% 19.1% 18.0% 18.0%
+ Productivity
+ Volume
- Raw materials (resin)
Expect Margin Improvement in 2018 ex-Accelerated Growth Investments

10 » www.craneco.com
Financial Overview
2018 Outlook
2017 Results
Multi-Year Outlook
Capital Deployment
11 » www.craneco.com
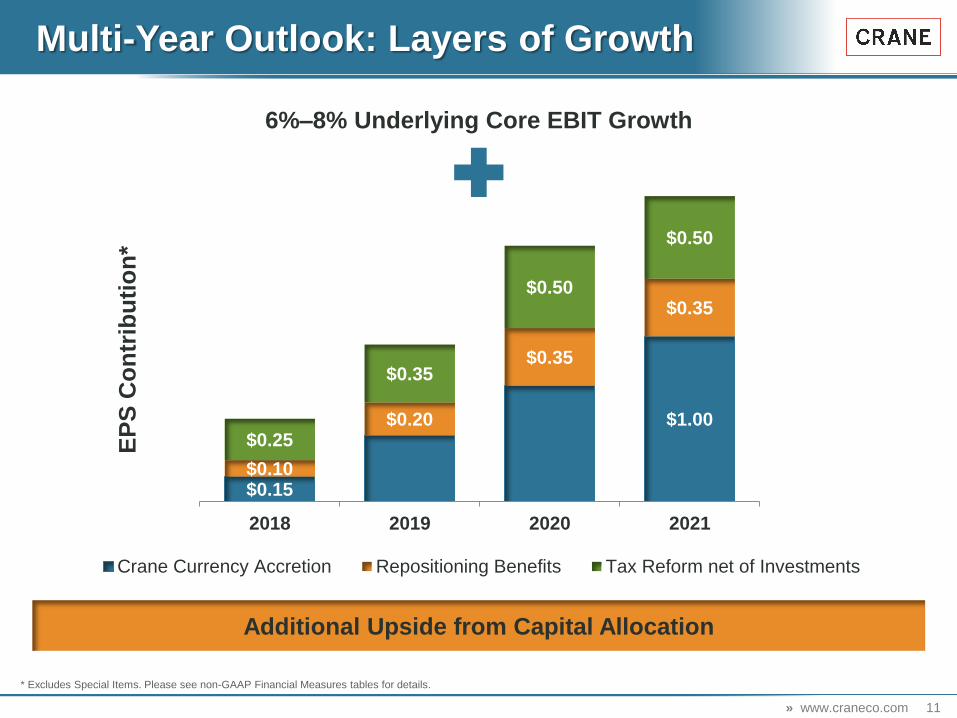
$0.15
$1.00
$0.10
$0.20
$0.35
$0.35
$0.25
$0.35
$0.50
$0.50
2018 2019 2020 2021
EP
S C
on
trib
uti
on
*
Crane Currency Accretion Repositioning Benefits Tax Reform net of Investments
Multi-Year Outlook: Layers of Growth
6%–8% Underlying Core EBIT Growth
Additional Upside from Capital Allocation
* Excludes Special Items. Please see non-GAAP Financial Measures tables for details.

12 » www.craneco.com
Long-Term Financial Expectations by Segment
* Reflects midpoint of guidance range. ** Excludes Special Items. Please see non-GAAP Financial Measures tables for details.
Across-the-Cycle Target 2018G*
Avg. Organic
Growth
Segment
Margin
Organic
Growth
Segment
Margin**
Fluid
Handling +2%–4% 14%–19% +3% 13.0%
Payment &
Merchandising
Technologies
+3%–5% 18%–22% +2% 16.5%
Aerospace &
Electronics +3%–5% 21%–24% +5% 21.5%
Engineered
Materials GDP 12%–16% +2% 18.0%
Expect Long-Term Core EBIT Growth of Approximately 6% to 8%

13 » www.craneco.com
$74
$10
2018 Crane Currency Accretion
($45)
($16)
($3)
Potential Upside from Repeat of a Portion of Large Contract
2018G EBITDA*
@ 18% of
$410m Sales
Depreciation &
Amortization
Interest Expense Tax 2018 Net Income
Contribution
($ millions)
* Excludes Special Items. Please see non-GAAP Financial Measures tables for details.

14 » www.craneco.com
2021 Crane Currency Accretion
$10
$61
$20
$15
$20
($4)
Confident in $1.00 EPS Contribution by 2021
2018 Net
income
Contribution*
Depreciation /
Other
Volume Productivity 2021 Net
Income
Contribution
Malta
($ millions)
* Excludes Special Items. Please see non-GAAP Financial Measures tables for details.

15 » www.craneco.com
Financial Overview
2018 Outlook
2017 Results
Multi-Year Outlook
Capital Deployment

16 » www.craneco.com
Free Cash Conversion Free Cash Conversion
(Excluding Asbestos)
Structural Free Cash Conversion* Improving
* Free Cash Flow is defined as Cash Provided by Operating Activities less Capital Spending. Free Cash Flow conversion is defined as Free Cash Flow divided by adjusted Net Income. Please see non-GAAP Financial Measures tables for details.
Strong Track Record on Operational Free Cash Flow
0%
20%
40%
60%
80%
100%
120%
90%
95%
100%
105%
110%
115%
120%
Average 102%
Average 79%
Average 117%
Average 99%

17 » www.craneco.com
$31
$103
($23)
($25)
($50)
($35)
($35)
2018 Free Cash Flow* Walk
17 » www.craneco.com
2018G Free Cash
Flow
Tax Reform
Core Growth, Working Capital, Other
Interest Expense
and Related Fees
Repositioning and Growth Investments
M&A Integration
Costs
Capex (Crane
Currency Run-Rate)
Capex (Malta,
Repositioning, Investments)
* Free Cash Flow is defined as Cash Provided by Operating Activities less Capital Spending. 2018G reflects midpoint of guidance range.
One-Time Headwinds
$269
$235
2018 Free Cash
Flow
($ millions)
Major Headwinds Are Temporary

18 » www.craneco.com
Capital Deployment Priorities
Focus on Both Organic and Inorganic Growth
Maintain Investment Grade Credit Rating, While Funding:
Internal investments to drive organic growth
» Capital Expenditures
» Research & Development
» Sales & Marketing
Acquisitions to enhance growth
Competitive returns to shareholders
» Target total payout ratio of 40%–50%
• Growing dividends in-line with earnings
• Opportunistic share repurchases
Pension and legacy liability requirements

19 » www.craneco.com
Target Leverage Levels
Committed to Current Investment Grade Rating
Target 2x–3x adjusted debt to EBITDA, excluding Special Items
» Adjusted debt =
• Gross financial debt
• + Pension liability
• + After-tax net asbestos
Deploy cash balances and debt capacity
» Internal investments
» Acquisitions
Repatriation expected to accelerate deleveraging

20 » www.craneco.com
33% 28% 29% 27% 28% 32% 31% 29% 25%
32% 39%
23% 19% 10%
9%
65% 67%
52%
27%
47% 42%
31%
38%
25%
0%
10%
20%
30%
40%
50%
60%
70%
80%
2010 2011 2012 2013 2014 2015 2016 2017 2018G*
Dividend Payout Repurchase Payout
Commitment to Return Cash
20 » www.craneco.com
Will Maintain Dividend Payout Between 25%–30%, but M&A Prioritized Over Repurchases in Recent Years
*2018G based on adjusted EPS guidance midpoint of $5.45 and annual dividend of $1.40
Target Range

21 » www.craneco.com
$2.5–$3.0 Billion Available from 2018–2021
Capital Deployment Potential
21 » www.craneco.com
Additional Value Creation Potential
Dividends
Capital Expenditures
~$1.5B to $2B Available for M&A and/or Repurchases while Retaining Credit Metrics Consistent with Existing Investment Grade Rating
Operating Cash Flow
Repatriated Cash
Incremental Debt Capacity
Capital expenditures
Dividends
M&A and/or repurchases
Sources Uses

22 » www.craneco.com
Summary
22 » www.craneco.com
Disciplined capital allocation with strong free cash flow 3
Record performance 1
Markets improving / relentless focus on productivity 2
Exciting multi-year outlook 4

23 » www.craneco.com