Embed Size (px)
Citation preview
Cranberry Station
Phosphorus in Cranberry Nutrient Management
Carolyn DeMoranvilleUMass Cranberry Station
2Cranberry Station
Why is this important?
3Cranberry Station
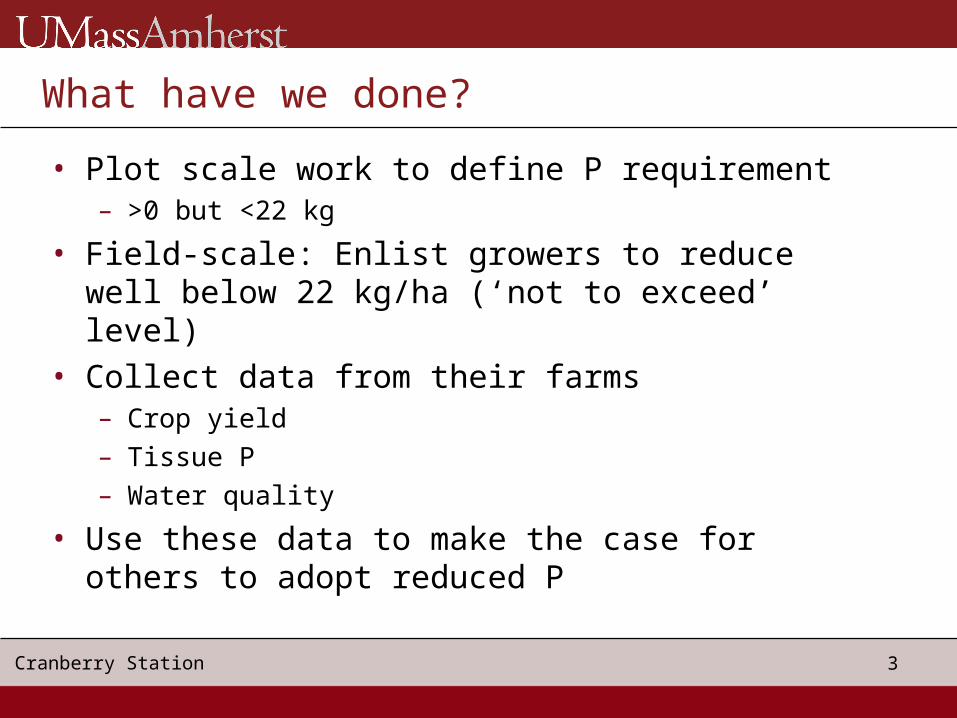
What have we done?
• Plot scale work to define P requirement– >0 but <22 kg
• Field-scale: Enlist growers to reduce well below 22 kg/ha (‘not to exceed’ level)
• Collect data from their farms – Crop yield– Tissue P– Water quality
• Use these data to make the case for others to adopt reduced P
4Cranberry Station
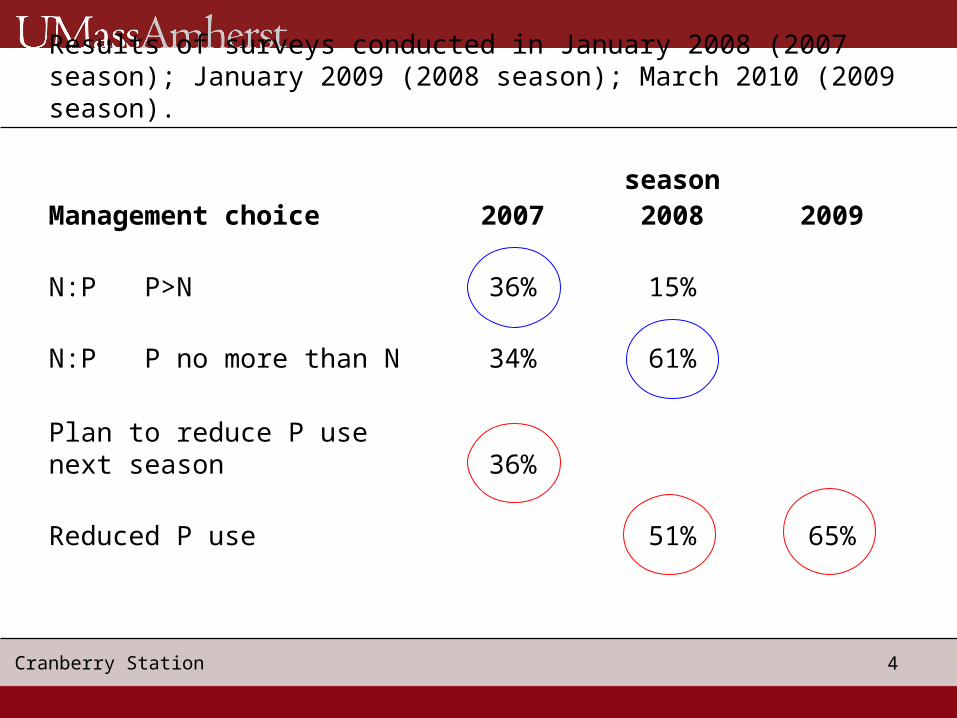
Results of surveys conducted in January 2008 (2007 season); January 2009 (2008 season); March 2010 (2009 season).
seasonManagement choice 2007 2008 2009
N:P P>N 36% 15%
N:P P no more than N 34% 61%
Plan to reduce P use next season 36%
Reduced P use 51% 65%
5Cranberry Station
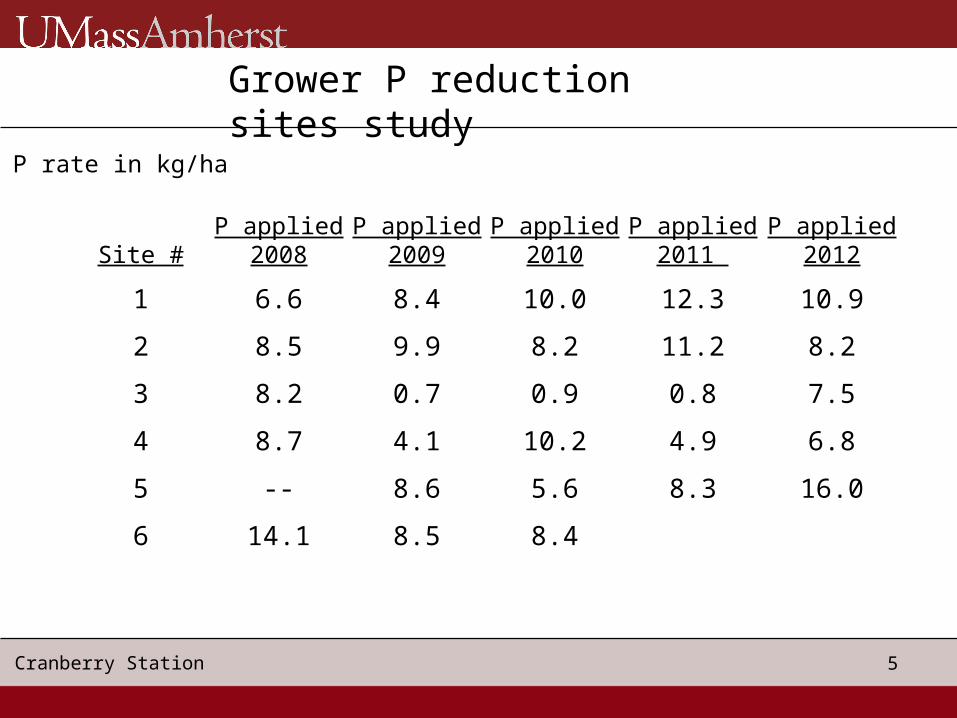
Grower P reduction sites study
P rate in kg/ha
Site #P applied
2008P applied
2009P applied
2010P applied
2011 P applied
2012
1 6.6 8.4 10.0 12.3 10.9
2 8.5 9.9 8.2 11.2 8.2
3 8.2 0.7 0.9 0.8 7.5
4 8.7 4.1 10.2 4.9 6.8
5 -- 8.6 5.6 8.3 16.0
6 14.1 8.5 8.4
6Cranberry Station
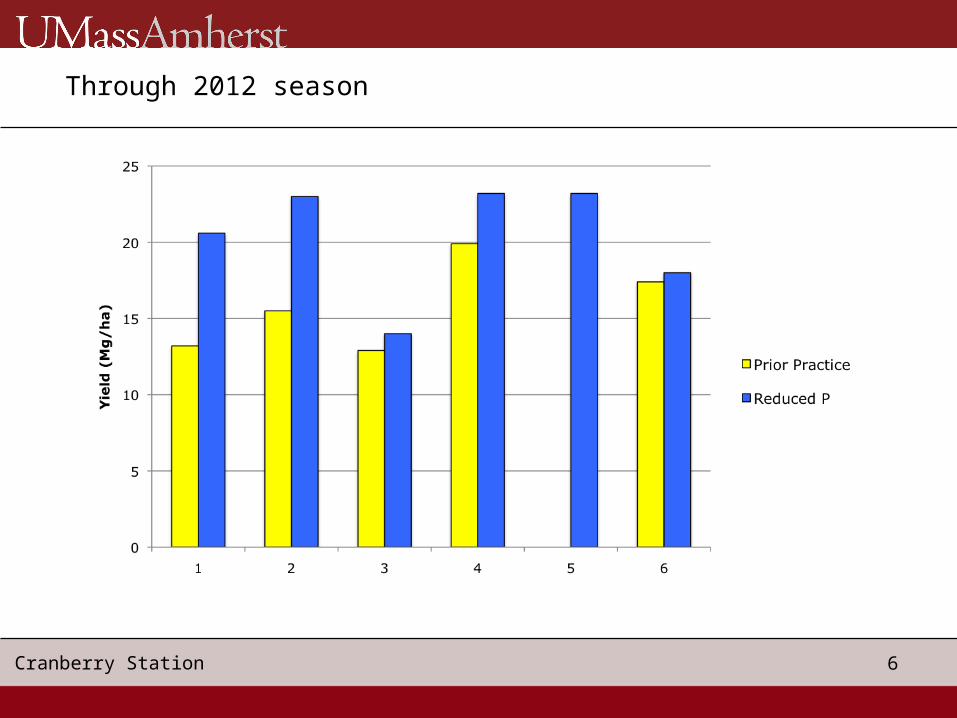
Through 2012 season
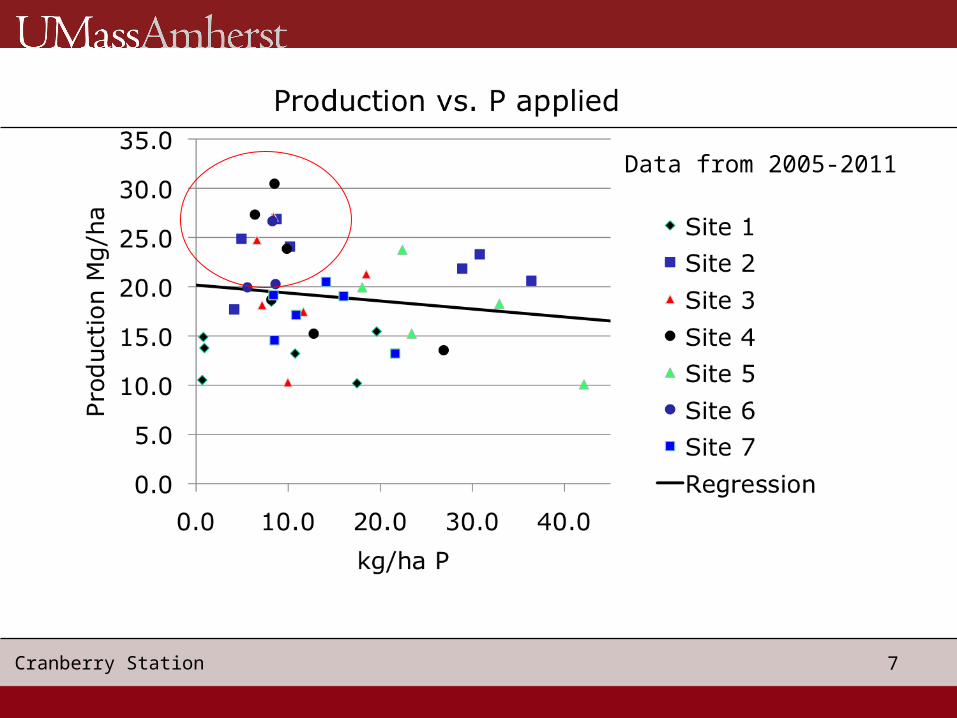
7Cranberry Station
Data from 2005-2011
8Cranberry Station
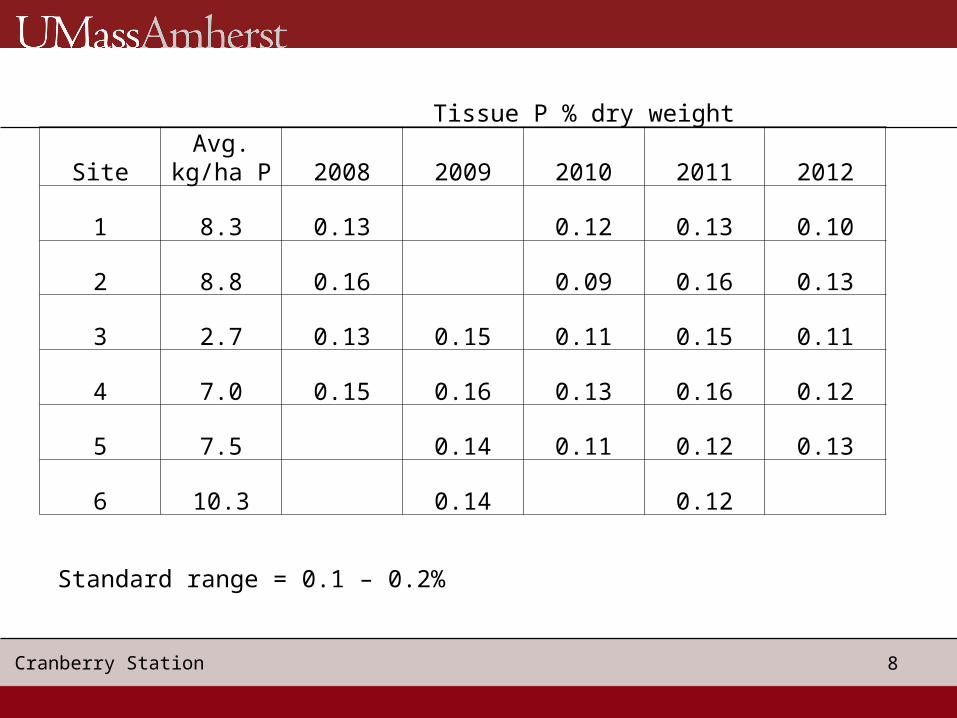
Standard range = 0.1 – 0.2%
Tissue P % dry weight
SiteAvg.
kg/ha P 2008 2009 2010 2011 2012
1 8.3 0.13 0.12 0.13 0.10
2 8.8 0.16 0.09 0.16 0.13
3 2.7 0.13 0.15 0.11 0.15 0.11
4 7.0 0.15 0.16 0.13 0.16 0.12
5 7.5 0.14 0.11 0.12 0.13
6 10.3 0.14 0.12
9Cranberry Station
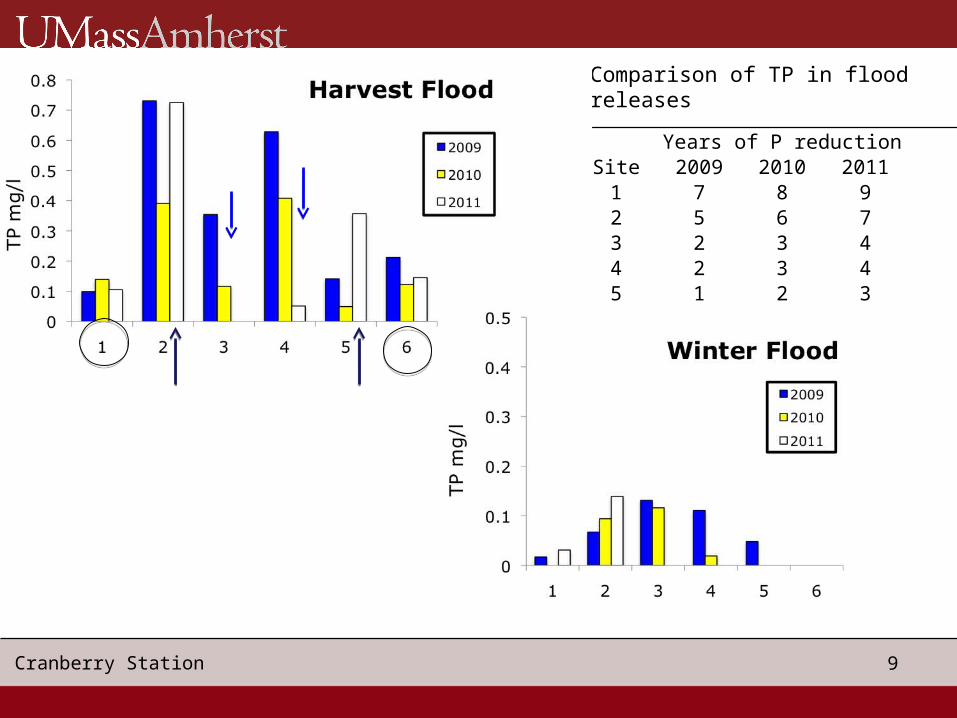
Comparison of TP in floodreleases
Years of P reductionSite 2009 2010 2011
1 7 8 92 5 6 73 2 3 44 2 3 45 1 2 36 3 4 5
10Cranberry Station
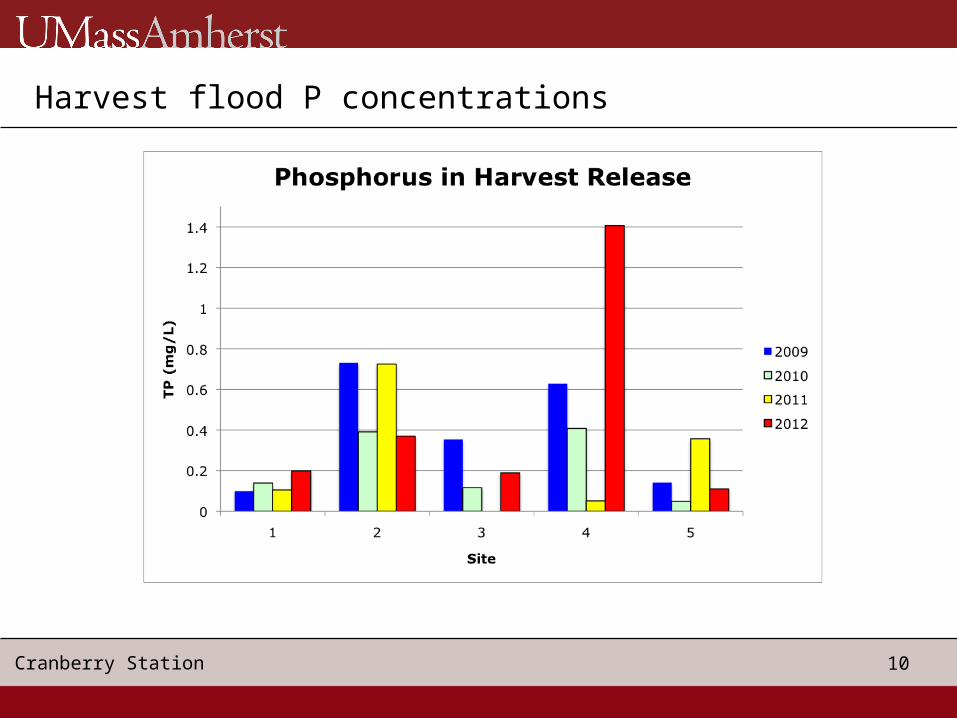
Harvest flood P concentrations
11Cranberry Station
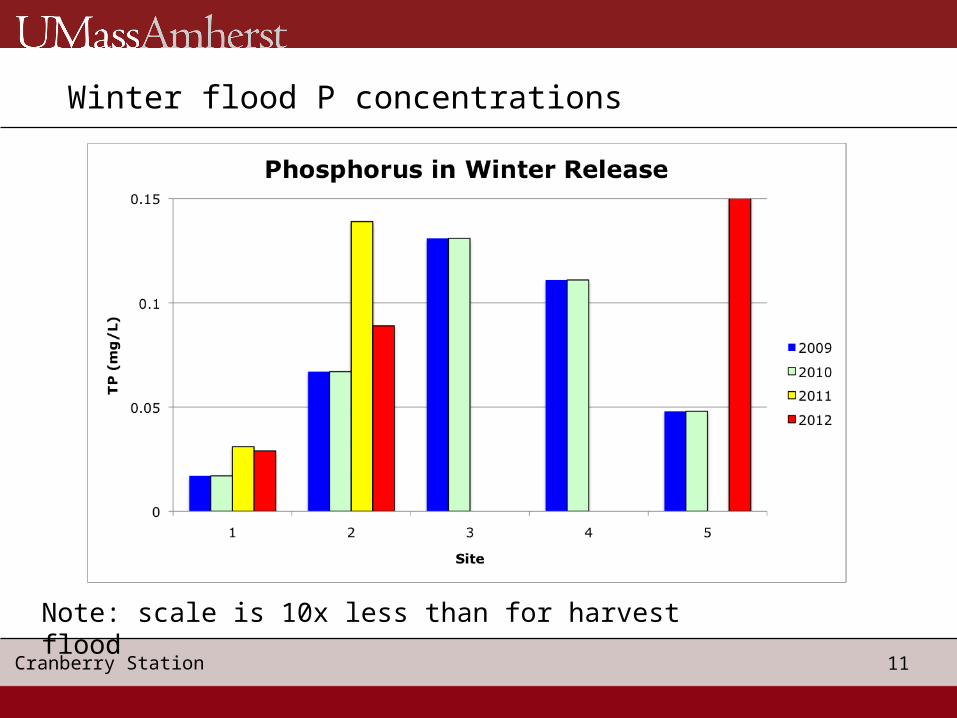
Winter flood P concentrations
Note: scale is 10x less than for harvest flood
12Cranberry Station
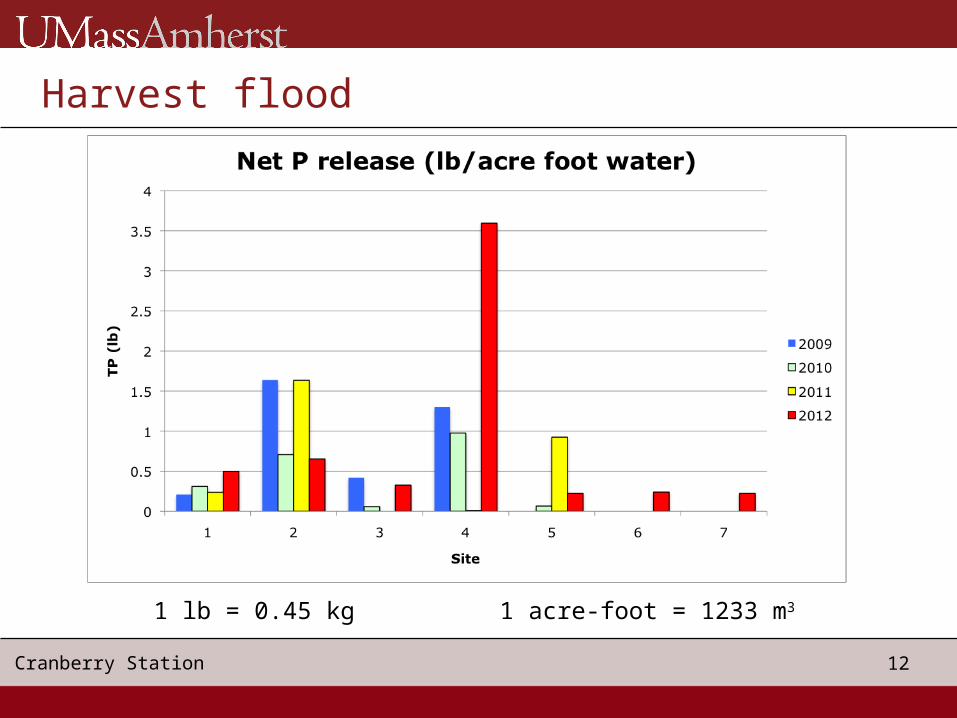
Harvest flood
1 acre-foot = 1233 m31 lb = 0.45 kg
13Cranberry Station
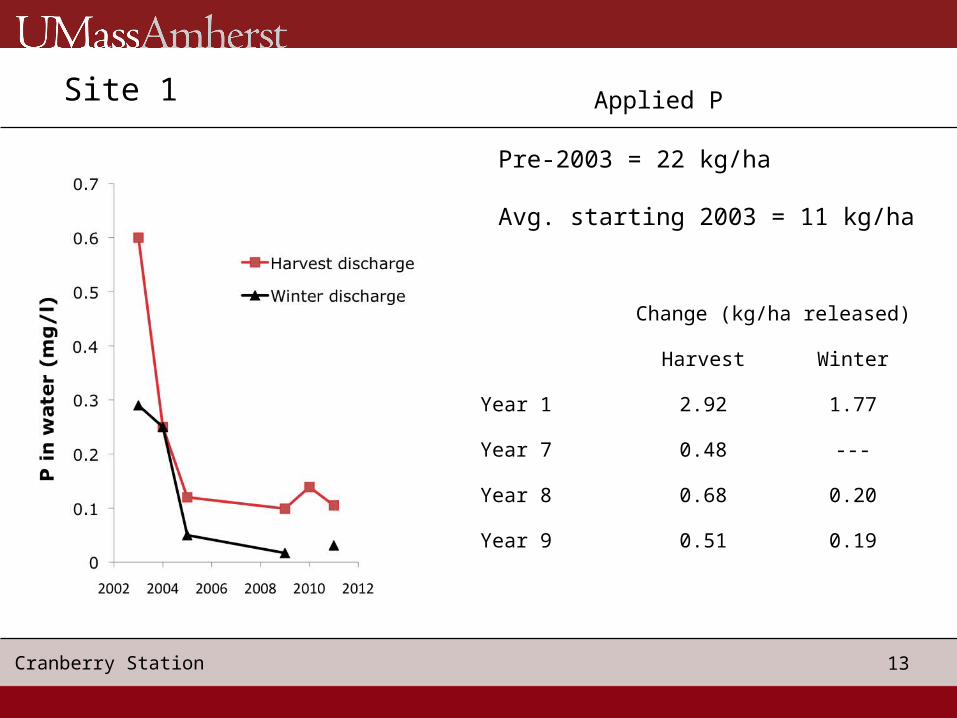
Change (kg/ha released)
Harvest Winter
Year 1 2.92 1.77
Year 7 0.48 ---
Year 8 0.68 0.20
Year 9 0.51 0.19
Applied P
Pre-2003 = 22 kg/ha
Avg. starting 2003 = 11 kg/ha
Site 1
14Cranberry Station
Potential impact
Site 1 Bog is ~25 ha In 2003, the 2 floods (winter/harvest) contained
117 kg P 8 years later, the floods contained 17 kg P 85% reduction
15Cranberry Station
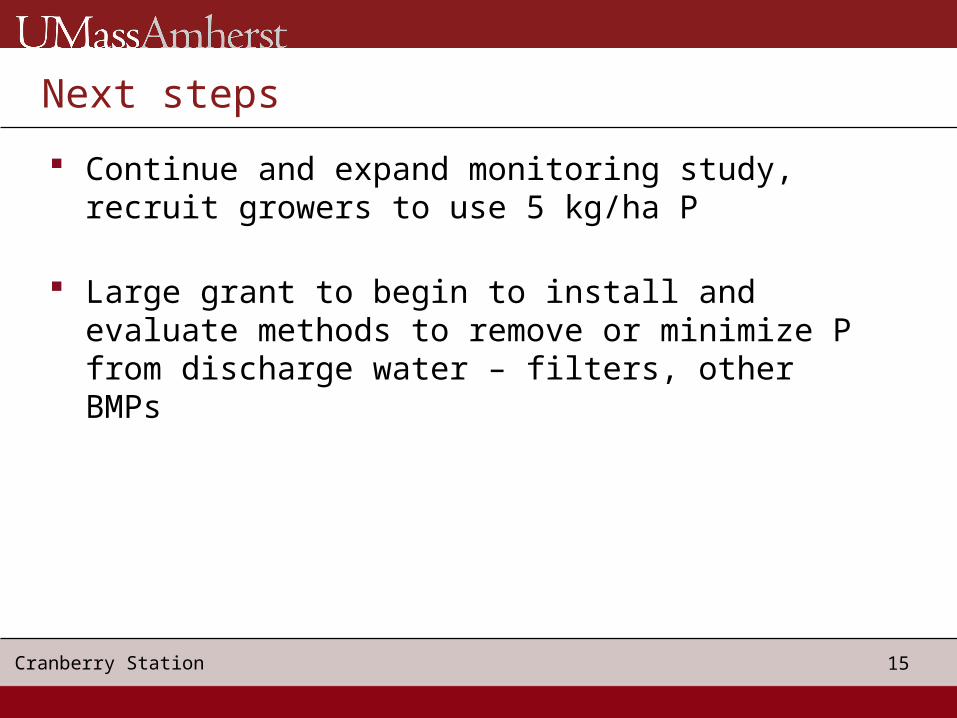
Next steps
Continue and expand monitoring study, recruit growers to use 5 kg/ha P
Large grant to begin to install and evaluate methods to remove or minimize P from discharge water – filters, other BMPs
16Cranberry Station
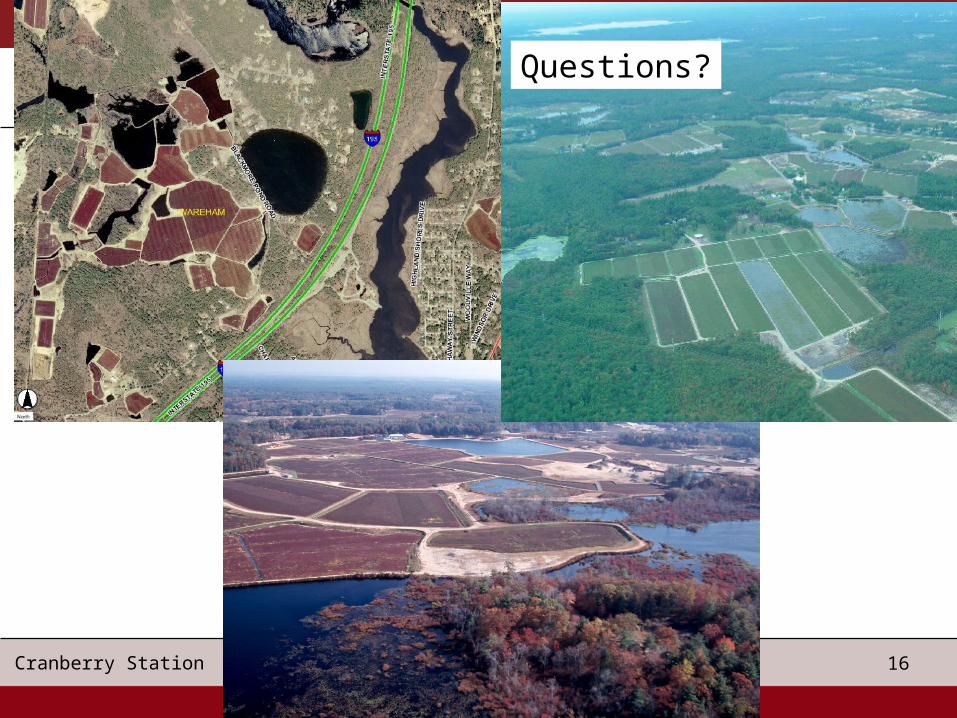
Questions?
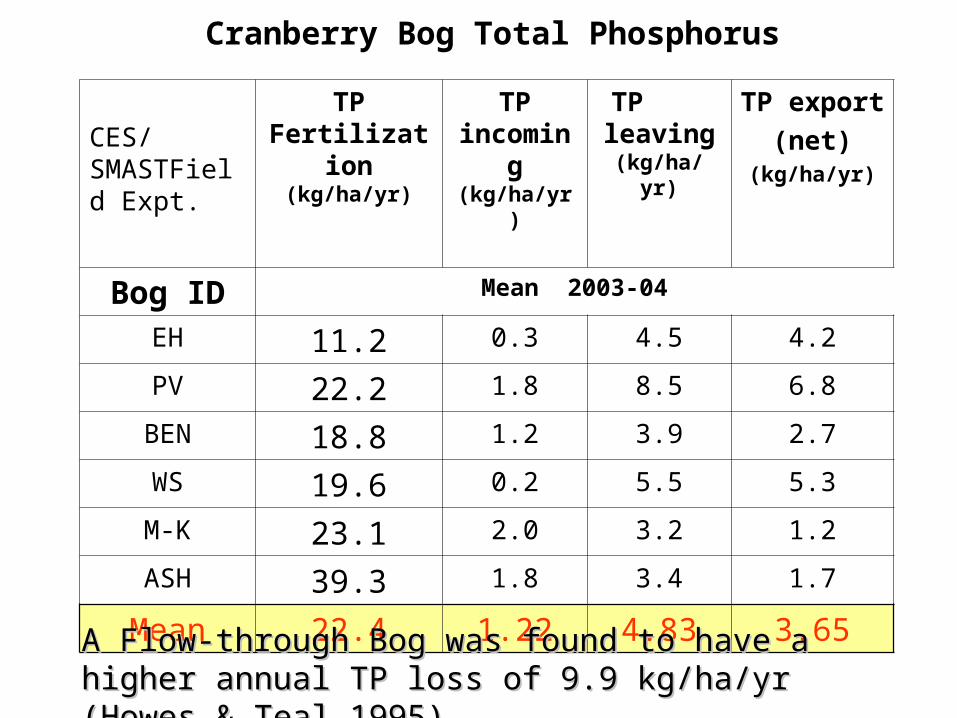
Cranberry Bog Total Phosphorus
CES/SMASTField Expt.
TP Fertilization
(kg/ha/yr)
TPincoming (kg/ha/yr)
TP leaving (kg/ha/yr)
TP export
(net)(kg/ha/yr)
Bog ID Mean 2003-04
EH 11.2 0.3 4.5 4.2
PV 22.2 1.8 8.5 6.8
BEN 18.8 1.2 3.9 2.7
WS 19.6 0.2 5.5 5.3
M-K 23.1 2.0 3.2 1.2
ASH 39.3 1.8 3.4 1.7
Mean 22.4 1.22 4.83 3.65
A Flow-through Bog was found to have a higher A Flow-through Bog was found to have a higher annual TP loss of 9.9 kg/ha/yr (Howes & Teal annual TP loss of 9.9 kg/ha/yr (Howes & Teal 1995)1995)
18Cranberry Station
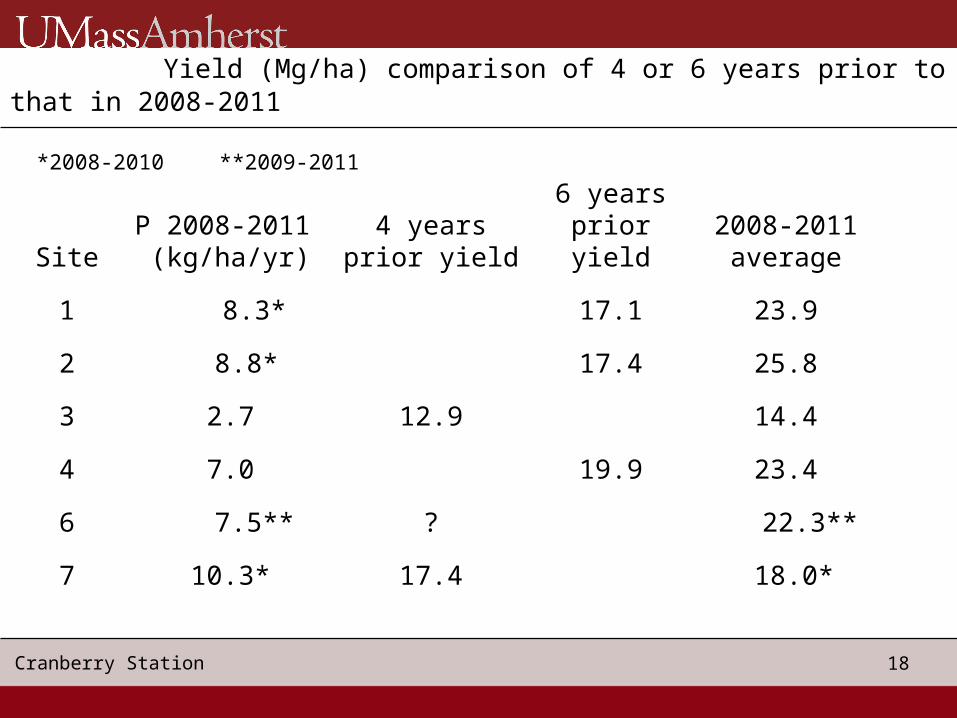
Yield (Mg/ha) comparison of 4 or 6 years prior to that in 2008-2011
SiteP 2008-2011
(kg/ha/yr)4 years prior
yield6 years
prior yield2008-2011
average
1 8.3* 17.1 23.9
2 8.8* 17.4 25.8
3 2.7 12.9 14.4
4 7.0 19.9 23.4
6 7.5** ? 22.3**
7 10.3* 17.4 18.0*
**2009-2011*2008-2010