Embed Size (px)
Citation preview

/ Slide 1
Kaufman Brothers 13th Annual Investor Conference
Craig DeYoung, VP Investor Relations
New York, New York
September 14, 2010

/ Slide 2
Safe Harbor
"Safe Harbor" Statement under the US Private Securities Litigation Reform Act of
1995: the matters discussed in this document may include forward-looking
statements, including statements made about our outlook, realization of backlog, IC
unit demand, financial results, average selling price, gross margin and expenses.
These forward looking statements are subject to risks and uncertainties including,
but not limited to: economic conditions, product demand and semiconductor
equipment industry capacity, worldwide demand and manufacturing capacity
utilization for semiconductors (the principal product of our customer base),
including the impact of general economic conditions on consumer confidence and
demand for our customers’ products, competitive products and pricing, the impact
of manufacturing efficiencies and capacity constraints, the pace of new product
development and customer acceptance of new products, our ability to enforce
patents and protect intellectual property rights, the risk of intellectual property
litigation, availability of raw materials and critical manufacturing equipment, trade
environment, changes in exchange rates and other risks indicated in the risk factors
included in ASML’s Annual Report on Form 20-F and other filings with the US
Securities and Exchange Commission.

/ Slide 3
Agenda
� General update
� ASML Business/Market Overview
� Outlook summary
/ Slide 4
General update

/ Slide 5
General update
� Short term: no change
� No customer has delayed shipment of any tool
� Meeting customer demand remains challenging
� Technology conversions continue in each sector
� Bit capacity grows while minimal wafer capacity added
� Medium term: the business may fluctuate
� Continued urgent demand for tools at ASML customers
BUT:
� General Macroeconomic worries
� Cisco cautious and Intel reduces guidance due to PC demand weakness
� Rumored slowdown at Samsung, TSMC, etc
ASML remains diligent in it’s communication with customers in order to detect
any changes in their short/medium term outlook
/ Slide 6
ASML business/market overview

/ Slide 7
685 629949 919
183
742
763 942
930 844
277
1,069
533
958
934
697
555
548
1,053
955
494
581
2369
0
500
1000
1500
2000
2500
3000
3500
4000
4500
2005 2006 2007 2008 2009 2010
Ne
t sa
les Q4
Q3
Q2
Q1
Total net sales M€
2,529
3,5823,768
Numbers have been rounded for readers’ convenience.
2,954
1,596
Guidance: 2010 sales
to grow 10 -15% above historical peak of
€ 3.8 billion

/ Slide 8
Backlog: Record value with 30% less units, ASP grows 60%+ vs prior peak backlog, not creating “oversupply”
0
500
1000
1500
2000
2500
3000
Ja
n 0
4
Ju
l 04
Ja
n 0
5
Ju
l 05
Ja
n 0
6
Ju
l 06
Ja
n 0
7
Ju
l 07
Ja
n 0
8
Ju
l 08
Ja
n 0
9
Ju
l 09
Ja
n 1
0
Ju
l 10
Ba
cklo
g v
alu
e M
€
0
50
100
150
200
250
300
Backlog value Units
Backlo
g in u
nitsASP 14.6 ASP 23.8
Units
ASPs
148
101

/ Slide 9
Market overview
� Semiconductor unit growth back to historical trend, “catch
up” capacity investments required in all sectors after a long
period of slow capacity growth
� Share of new technology nodes in total semiconductor
market accelerating as shrink continues to enable reduced
chip cost and increased bit growth
� New technologies nodes require much more immersion
layers and litho tool capacity than actual installed base
allows

/ Slide 10
NAND
0
1
2
3
4
5
6
7
8
2008 2009 2010 2011
Imm
ers
ion
Exp
os
ure
s
Snapshot based on average customer product mix (300mm) and layer stacks
DRAM
0
1
2
3
4
5
6
7
8
2008 2009 2010 2011
Imm
ers
ion
Exp
os
ure
s
LOGIC
0
1
2
3
4
5
6
7
8
2008 2009 2010 2011
Imm
ers
ion
Exp
os
ure
s
MPU
0
2
4
6
8
10
12
14
2008 2009 2010 2011
Imm
ers
ion
Exp
os
ure
s
Year
Node 8x,6x 6x,5x 5x,4x 4x,3X
Year
Node 5x,4x 4x,3x 4x,3x 3x,2x
Year
Node 9x,6x 9x,6x 6x,4x 6x,4x
Year
Node 6x,4x 6x,4x 4x,3x 3x,2x
Node transitions consume growing numbers of immersion tools while adding little wafer capacity

/ Slide 11
Technology transitions continue with capacity additions required in 2011 to meet forecasted demand*
Wafe
r S
tart
s [
300
mm
eq
uiv
. K
WS
M]
0
200
400
600
800
1000
1200
1400
16008x nm – 200 mm
9x nm – 200 mm
1XX nm – 200 mm
Max. capacity
6x nm
8x nm
9x nm
2x nm
3x nm
4x nm
5x nm
Q1 Q2 Q3 Q4 Q1 Q2 Q3 Q4 Q1 Q2 Q3 Q4 Q1 Q2 Q3 Q4
2008 2009 2010 2011
Wafe
r S
tart
s [
300
mm
eq
uiv
. K
WS
M]
0
200
400
600
800
1000
1200
1400
16008x nm – 200 mm
9x nm – 200 mm
1XX nm – 200 mm
Max. capacity
6x nm
8x nm
9x nm
2x nm
3x nm
4x nm
5x nm
8x nm – 200 mm
9x nm – 200 mm
1XX nm – 200 mm
Max. capacity
6x nm
8x nm
9x nm
6x nm
8x nm
9x nm
2x nm
3x nm
4x nm
5x nm
2x nm
3x nm
4x nm
5x nm
Q1 Q2 Q3 Q4 Q1 Q2 Q3 Q4 Q1 Q2 Q3 Q4 Q1 Q2 Q3 Q4
2008 2009 2010 2011
DRAM NAND
Wafe
r S
tart
s [
300
mm
eq
uiv
. K
WS
M]
Q1 Q2 Q3 Q4 Q1 Q2 Q3 Q4 Q1 Q2 Q3 Q4 Q1 Q2 Q3 Q4
2008 2009 2010 2011
0
200
400
600
800
1000
1200
1400 5x nm – 200 mm
6x nm – 200 mm
7x nm – 200 mm
Max. capacity
5x nm
6x nm
7x nm
1x nm
2x nm
3x nm
4x nm
5x nm – 200 mm
6x nm – 200 mm
7x nm – 200 mm
Max. capacity
5x nm
6x nm
7x nm
1x nm
2x nm
3x nm
4x nm
5x nm – 200 mm
6x nm – 200 mm
7x nm – 200 mm
Max. capacity
5x nm – 200 mm
6x nm – 200 mm
7x nm – 200 mm
Max. capacity
5x nm
6x nm
7x nm
5x nm
6x nm
7x nm
1x nm
2x nm
3x nm
4x nm
1x nm
2x nm
3x nm
4x nm
Q1 Q2 Q3 Q4 Q1 Q2 Q3 Q4 Q1 Q2 Q3 Q4 Q1 Q2 Q3 Q4
2008 2009 2010 2011
Logic+DSP+MCU
0
100
200
300
400
500
600
700
800
Wafe
r K
WS
M
6x nm
9x nm
130 nm
2x nm
3x nm
4x nm
5x nm
6x nm
9x nm
130 nm
6x nm
9x nm
130 nm
2x nm
3x nm
4x nm
5x nm
*Litho demand in line with Gartner bit growth demand forecast for DRAM 52%, for NAND 76% in 2011.
Logic demand forecast is 17% unit growth in 2011
Source: ASML Simulation model (6/10)
MPU
0
20
40
60
80
100
120
140
Q1 Q2 Q3 Q4 Q1 Q2 Q3 Q4 Q1 Q2 Q3 Q4 Q1 Q2 Q3 Q4
6x nm
9x nm
2x nm
3x nm
4x nm
2008 2009 2010 2011
Wafe
r K
WS
M
6x nm
9x nm
2x nm
3x nm
4x nm
/ Slide 12
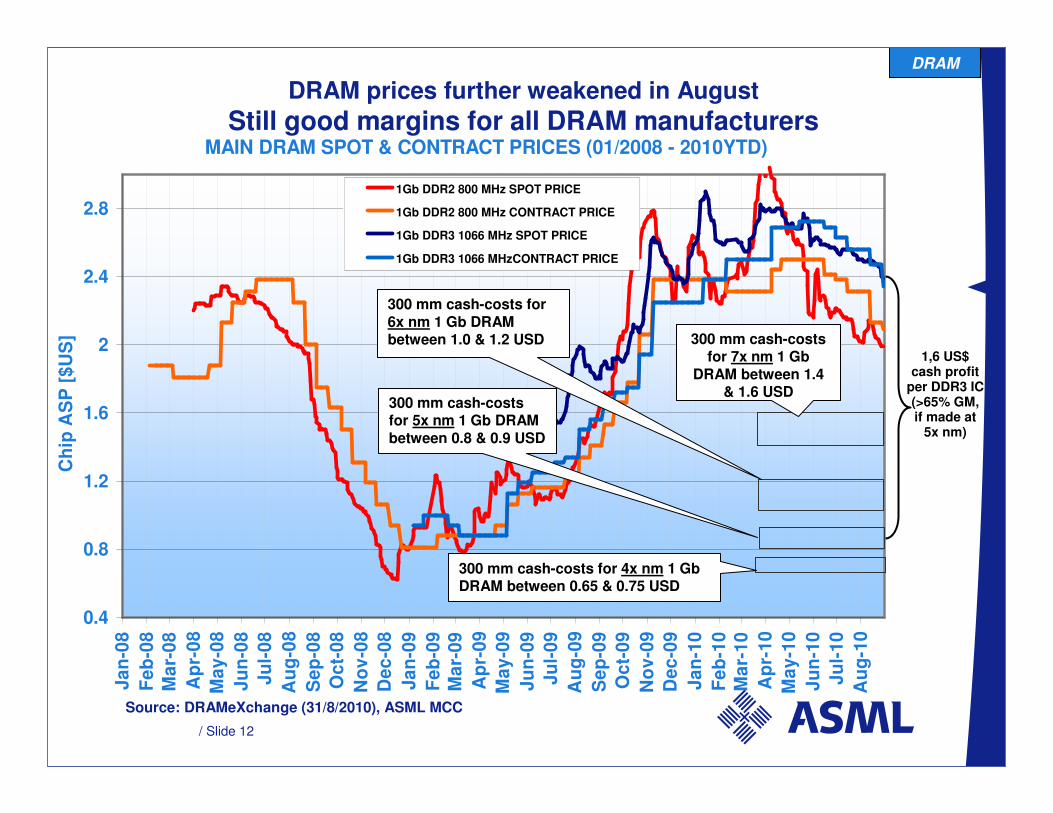
MAIN DRAM SPOT & CONTRACT PRICES (01/2008 - 2010YTD)
0.4
0.8
1.2
1.6
2
2.4
2.8
Ja
n-0
8
Fe
b-0
8
Ma
r-0
8
Ap
r-0
8
Ma
y-0
8
Ju
n-0
8
Ju
l-0
8
Au
g-0
8
Se
p-0
8
Oc
t-0
8
No
v-0
8
De
c-0
8
Ja
n-0
9
Fe
b-0
9M
ar-
09
Ap
r-0
9
Ma
y-0
9
Ju
n-0
9
Ju
l-0
9
Au
g-0
9
Se
p-0
9
Oc
t-0
9
No
v-0
9
De
c-0
9
Ja
n-1
0
Fe
b-1
0M
ar-
10
Ap
r-1
0
Ma
y-1
0
Ju
n-1
0
Ju
l-1
0
Au
g-1
0
Ch
ip A
SP
[$
US
]
1Gb DDR2 800 MHz SPOT PRICE
1Gb DDR2 800 MHz CONTRACT PRICE
1Gb DDR3 1066 MHz SPOT PRICE
1Gb DDR3 1066 MHzCONTRACT PRICE
Source: DRAMeXchange (31/8/2010), ASML MCC
DRAM prices further weakened in August
Still good margins for all DRAM manufacturers
300 mm cash-costs for 5x nm 1 Gb DRAM between 0.8 & 0.9 USD
300 mm cash-costs for 7x nm 1 Gb
DRAM between 1.4 & 1.6 USD
300 mm cash-costs for 6x nm 1 Gb DRAM between 1.0 & 1.2 USD
DRAM
1,6 US$ cash profit
per DDR3 IC (>65% GM, if made at
5x nm)
300 mm cash-costs for 4x nm 1 GbDRAM between 0.65 & 0.75 USD

/ Slide 13
Technology Leadership - Reinforced
Source: ASML
Immersion Lithography:
- Installed Base >160 Systems- leading performance on CD imaging uniformity well below 1 nm and overlay of less than 2 nm-More than 20 NXT installed and producing-38 NXT systems in backlog end Q2 ’10
EUV:- 6 systems shipping thru mid 2011- Taking orders for 2012
NXT:1950i
NXE:3100
/ Slide 14
Outlook summary

/ Slide 15
Outlook summary
� Short term: no change
� Memory customers continue strategic node shrinks and planned capacity addition to meet long term memory demand
� As Foundry sector competition heats up; customers shrink to support growing leading edge demand and add capacity for future
� MPU sector prepares for 22nm ramp consuming increasing quantities of leading edge tools
� Medium term: the business may fluctuate
� Short/Medium term supply/demand issues may present themselves in some sectors
� Long term: sound growth opportunity
� End demand drivers in mobile internet, smart phones, PC’s, tablets, etc…remain solid
� Continued ASP improvement in leading edge tools
� Long term modeling suggests revenue opportunities well beyond current target

/ Slide 16