Embed Size (px)
Citation preview
CRADLE-TO-GATE LIFE CYCLEINVENTORY FOR EXTERIORSTUCCO FINISHES
Prepared by:George J. Venta, P.Eng.VENTA, GLASER & ASSOCIATES
Ottawa, CanadaOctober 2001

DISCLAIMER
Although the ATHENATM Sustainable Materials Institute has doneits best to ensure accurate and reliable information in this report,the Institute does not warrant the accuracy thereof. If notified ofany errors or omissions, the Institute will take reasonable steps tocorrect such errors or omissions.
COPYRIGHT
No part of this report may be reproduced in any form or by anymeans, electronic or mechanical, including photocopying, withoutwritten permission of ATHENATM Sustainable Materials Institute.
Text ©2001 ATHENATM Sustainable Materials Institute.
ATHENATM Sustainable Materials Institute28 St. John Street, P.O. Box 189Merrickville, Ontario, Canada K0G 1N0Tel: 613-269-3795Fax: 613-269-3796E-mail: [email protected]
Preface
This report was commissioned as part of a continuing program to expand the knowledge base ofthe ATHENA™ Sustainable Materials Institute, a not-for-profit organization dedicated to helping thebuilding community meet the environmental challenges of the future.
Our ultimate goal is to foster sustainability by encouraging building designs which will minimizelife cycle environmental impacts. To achieve that goal the Institute has developed ATHENA™, asystem model for assessing the relative life cycle environmental implications of alternative buildingor assembly designs. Intended for use by building designers, researchers and policy analysts,ATHENA™ is a decision support tool which complements and augments other decision supporttools, such as costing models. It provides a wealth of information to help users understand theenvironmental implications of different material mixes or other design changes in all, or parts of, abuilding.
Two of the Institute’s objectives are to increase awareness of the environmental impacts ofbuildings and the built environment, and to provide information and tools to help put theenvironment on a footing with cost and other traditional design criteria. To help achieve theseobjectives and to ensure transparency of our research and data development process, we make all ofour reports available to Institute members.
Institute studies and publications fall into two general categories: investigative or exploratorystudies intended to further general understanding of life cycle assessment as it applies to buildingmaterials and buildings; and individual life cycle inventory studies which deal with specificindustries, product groups or building life cycle stages. All studies in this latter category are firmlygrounded on the principles and practices of life cycle assessment (LCA), and follow our publishedResearch Guidelines, which define boundary or scope conditions and ensure equal treatment of allbuilding materials and products in terms of assumptions, research decisions, estimating methodsand other aspects of the work.
The integration of all inventory data is a primary function of ATHENA™ itself and we thereforecaution that individual industry life cycle study reports may not be entirely stand-alone documentsin the sense that they tell the whole story about an individual set of products. ATHENA™ alsogenerates various composite measures that can be best described as environmental impactindicators, a step toward the ultimate LCA goal of developing true measures of impact on humanand ecosystem health.

Contents
1 . 0 INTRODUCTION . . . . . . . . . . . . . . . . . . . . . . . . . . . . . . . . . . . . . . . . . . . . . . . . . . . . . . . . . . . . . . . . . . . . . . . . . . . . . . . . . . . . 1
1.1 RESEARCH GUIDELINES......................................................................................................... 11.2 REPORT STRUCTURE............................................................................................................. 2
2 . 0 EXTERIOR STUCCO FINISHES – AN OVERVIEW . . . . . . . . . . . . . . . . . . . . . . . . . . . . . . . . . . . . . . . . . 4
2.1 BACKGROUND...................................................................................................................... 42.2 INDUSTRY STRUCTURE.......................................................................................................... 52.3 INDUSTRY STANDARDS ......................................................................................................... 6
3 . 0 RAW MATERIALS. . . . . . . . . . . . . . . . . . . . . . . . . . . . . . . . . . . . . . . . . . . . . . . . . . . . . . . . . . . . . . . . . . . . . . . . . . . . . . . . . 1 0
3.1 RAW MATERIAL REQUIREMENTS.......................................................................................... 103.2 RAW MATERIALS TRANSPORTATION..................................................................................... 12
4 . 0 ENERGY USE. . . . . . . . . . . . . . . . . . . . . . . . . . . . . . . . . . . . . . . . . . . . . . . . . . . . . . . . . . . . . . . . . . . . . . . . . . . . . . . . . . . . . . . 1 3
4.1 CEMENT............................................................................................................................ 134.2 LIME ................................................................................................................................ 154.3 SAND................................................................................................................................ 164.4 ENERGY CONSUMPTION IN STUCCO MIXING............................................................................ 174.5 TOTAL ENERGY – EXTERIOR STUCCO..................................................................................... 17
4.5.1 3-coat PC-based stucco over metal lath.......................................................................... 184.5.2 3-coat PC-based stucco over unit masonry solid stucco base.............................................. 19
5 . 0 ATMOSPHERIC EMISSIONS. . . . . . . . . . . . . . . . . . . . . . . . . . . . . . . . . . . . . . . . . . . . . . . . . . . . . . . . . . . . . . . . . . . . 2 0
5.1 3-COAT STUCCO OVER METAL LATH....................................................................................... 225.1.1 Air emissions from cement production............................................................................ 225.1.2 Air emissions from production of lime ............................................................................ 245.1.3 Air emissions from production of sand............................................................................ 255.1.4 Air emissions from stucco processing............................................................................. 265.1.5 Total air emissions – 3-coat PC stucco over metal lath...................................................... 26
5.2 3-COAT STUCCO OVER UNIT MASONRY SOLID STUCCO BASE...................................................... 295.2.1 Air emissions from cement production............................................................................ 295.2.2 Air emissions from production of lime ............................................................................ 315.2.3 Air emissions from production of sand............................................................................ 335.2.4 Air emissions from stucco processing............................................................................. 335.2.5 Total air emissions – 3-coat PC stucco over unit masonry base........................................... 33
6 . 0 EMISSIONS TO WATER . . . . . . . . . . . . . . . . . . . . . . . . . . . . . . . . . . . . . . . . . . . . . . . . . . . . . . . . . . . . . . . . . . . . . . . . . 3 6
7 . 0 SOLID WASTE . . . . . . . . . . . . . . . . . . . . . . . . . . . . . . . . . . . . . . . . . . . . . . . . . . . . . . . . . . . . . . . . . . . . . . . . . . . . . . . . . . . . . 3 9
ATHENATM
SUSTAINABLE MATERIALS INSTITUTE
CRADLE-TO-GATE LIFE CYCLE INVENTORYFOR EXTERIOR STUCCO FINISHES
1.0 IntroductionThis report presents cradle-to-gate life cycle inventory (LCI) estimates for two typical, widely-used exterior stucco finishes, and explains how the estimates were developed. The work wascommissioned by the ATHENATM1 Institute as part of the continuing series of life cycle studiesbeing done to support the ATHENA environmental decision support model.
ATHENA relies on LCI databases which include estimates of raw material, energy and waterinputs as well as atmospheric emissions, liquid effluents and solid waste outputs per unit ofproduct. The estimates encompass production activities of the individual components from rawmaterials extraction and processing through product manufacturing, including relatedtransportation.
Exterior stucco finishes are produced “on site”, using as their inputs cement, hydraulic lime andfine aggregate (sand), all products for which life cycle inventory data was developed in earlierATHENA studies to various degrees of detail. The estimates developed by Venta, Glaser &Associates for exterior stucco finishes and presented here are therefore based to a large degree onthree earlier ATHENA studies: “Raw Material Balances, Energy Profiles and Environmental UnitFactor Estimates: Cement and Structural Concrete” (1993)2, “Cement and Structural ConcreteProducts: Life Cycle Inventory Update” (1999)3, and “Life Cycle Analysis of Brick and MortarProducts” (1998)4.
1.1 Research GuidelinesTo ensure consistent and compatible approaches for all LCIs, all estimates have to be prepared inaccordance with a set of research guidelines first issued in October, 1992 and subsequentlyrevised as needs dictated. This research protocol defined information requirements andprocedures for the study, such as the following:
• the specific building products;• the content of general and detailed industry descriptions;• the specific energy forms, emissions and effluents of potential interest;• the treatment of secondary building components and assemblies;
1 ATHENATM is a registered trademark of the ATHENATM Sustainable Materials Institute.2 “Raw Material Balances, Energy Profiles and Environmental Unit Factor Estimates: Cement and Structural Concrete”, prepared byCANMET and RADIAN Canada Inc. for ATHENATM Sustainable Materials Institute, 1993.3 “Cement and Structural Concrete Products: Life Cycle Inventory Update”, prepared by Venta, Glaser & Associates for ATHENATM
Sustainable Materials Institute, 1999.4 “Life Cycle Analysis of Brick and Mortar Products”, prepared by Venta, Glaser & Associates for ATHENATM Sustainable Materials Institute,1998.
2 ATHENA INSTITUTE: CRADLE-TO-GATE LCI FOR EXTERIOR STUCCO
• preferred data types and sources (e.g. actual industry data and data fromprocess studies);
• the analysis scope, including system boundaries and limits and the level ofdetail of the analysis;
• geographic divisions;• transportation factors to be included when estimating transportation energy
use; and• a set of standard conventions for dealing with such aspects as non-domestic
production, process feedstocks, in-plant recycling and multiple products.
In addition, the research guidelines provide a set of conversion factors and tables of standardfactors for calculating energy contents and emissions by fuel type.
The analysis limits established for the project in the guidelines are similar to a Level II analysisfor energy studies as determined by the International Federation of Institutes of AdvancedStudies. These limits typically capture about 90% to 95% of the full impacts of an industry.
The life cycle analysis framework and other Institute studies are discussed in detail in otherInstitute publications, especially in the Summary Report, Phases II and III. That documentincludes the most recent (1997) version of the Research Guidelines and we have not, in thisreport, duplicated that material by explaining the rationale for all steps in the research andcalculation process. For example, the Research Guidelines require that empty backhauls beincluded when calculating transportation energy use in certain circumstances. Our calculationstherefore show the addition of such backhaul mileages without explaining why backhauls shouldbe included. We have, however, provided full explanations wherever our calculations do notconform to the guidelines because of data limitations or for other reasons.
1.2 Report StructureThe ATHENA software requires LCI data for the following specific types of exterior stuccofinishes:
• 3-coat Portland cement-based stucco over metal lath stucco base; and• 3-coat Portland cement-based stucco over unit masonry solid stucco base.
The analysis procedures and calculations are described in detail in the relevant sections of thisreport.
The arrangement of the report basically parallels the study structure. Section 2 of the reportprovides the background information regarding the exterior stucco finishes. Sections 3 through 7deal with various aspects of raw material balances, energy consumption and environmental issuesrelated to exterior stucco finishes.
As indicated below, the basic progression involves an overview section followed by a series ofsections dealing with each of the environmental impact areas (e.g. raw material use, energy use,emissions, etc.). Results are presented to show regional variations when available and, as
ATHENA INSTITUTE: CRADLE-TO-GATE LCI FOR EXTERIOR STUCCO 3
necessary, by production stage (e.g. resource extraction, stucco components raw materialstransportation, manufacturing, and transportation).
The report is organized as follows:
Section 2 presents an overview of the exterior stucco finishes, including adescription of the process, and the general nature of resource andenergy use, emissions and other wastes.
Section 3 details raw material use by type of finish on a regional basis, anddiscusses raw material transportation requirements.
Section 4 describes energy use for the finishes and presents the results byregion, process stage, and type of energy used.
Section 5 deals with atmospheric emissions on a regional basis by productionstage, including the analysis method and results.
Section 6 focuses on emissions to water.
Section 7 deals with solid wastes generated by the production of exteriorstucco finishes.
4 ATHENA INSTITUTE: CRADLE-TO-GATE LCI FOR EXTERIOR STUCCO
2.0 Exterior Stucco Finishes – An OverviewThis section provides an overview of the exterior stucco finishes. The basic flow chart for theproduction of exterior stucco finishes is shown and described. Related energy use, as well asemissions, effluents and waste outputs are also briefly discussed as an introduction to a moredetailed description of these aspects and the development of appropriate LCI estimates insubsequent sections.
2.1 BackgroundPlastering finish of wall surfaces is one of the oldest ways of applying coatings and finishing to theoutside of building structures.
Exterior plasters, usually called stuccos, are always cement-based, as opposed to interior plasters,which are mainly gypsum-based. For ease of application and plasticity, exterior stuccos alwayscontain lime in addition to Portland cement. Masonry cements that are a mixture of Portland orblended hydraulic cement and plasticizing materials such as limestone, hydrated or hydraulic lime,can also be used instead of Portland cement.
Traditional stucco is a mix of cement, lime, sand and water. National Building Code of Canada(NBC) and ASTM specifications give ratios of individual dry constituents for different types ofstuccos. Portland cement comprises about 20% of the finished product, and the bulk of the stuccois sand, which has to be clean, sharp and of a good quality/gradation, meeting ASTM C807specifications.
Exterior stucco is usually applied as a three-coat system of the first (scratch), second (brown), andthird (finish) coat over metal lath. The scratch and brown coats are proportioned and mixed on thejob site. The finish coat can be either job-site prepared or supplied premixed, especially ifpigmented. The ratio of the raw materials in each of the three coats is slightly different, becauseeach has a different function in the system. The scratch coat serves as the foundation for the nexttwo coats. It embeds the metal lath reinforcement and should be harder than the brown coat, whichis achieved by using a richer mix. The brown coat is the leveling coat that provides the surface forthe finished wall. It also adds strength and thickness, and in large part determines the quality of thefinish. The finish coat provides the final texture and colour. The total thickness of a three-coatstucco is usually 15 mm to 22 mm.
If a stucco base is sufficiently porous, as for example cast-in-place or precast concrete or unitmasonry, a two-coat work, with only a scratch and a finish coat, is sometimes used.
This study deals only with the following two common systems, as specified by the standards:
• 3-coat Portland cement-based stucco over metal lath stucco base• 3-coat Portland cement-based stucco over unit masonry solid stucco base
ATHENA INSTITUTE: CRADLE-TO-GATE LCI FOR EXTERIOR STUCCO 5
In the case of the metal (galvanized and/or painted steel) lath-containing system, the amount ofmetal lath, accessories and fasteners is provided. The ATHENA software then provides theappropriate LCI data based on separate studies of steel building products.
Data developed for Portland cement and fine aggregate (sand) in the Institute’s 1999 Cement andConcrete study are used as inputs for the stucco LCA. Similarly, energy consumption, atmospheric,liquid and solid emissions developed in the Institute’s Brick and Mortar LCA serve as inputs intothe exterior stucco finishes LCI for hydrated lime.
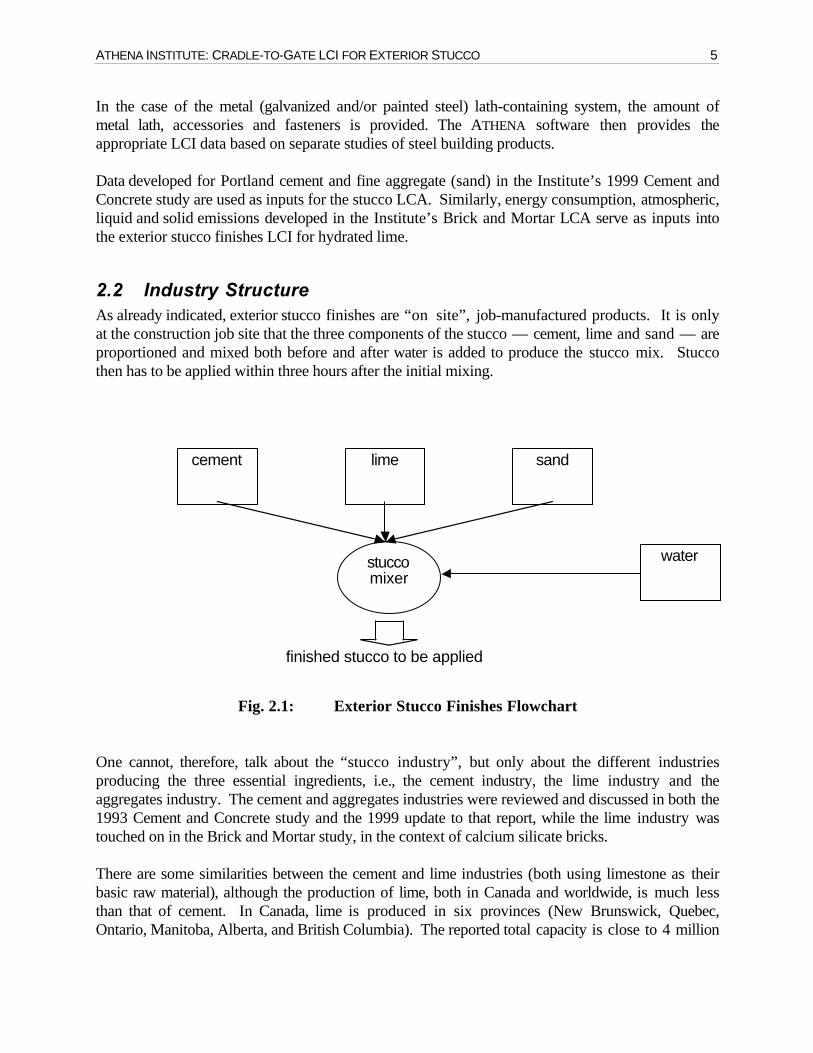
2.2 Industry StructureAs already indicated, exterior stucco finishes are “on site”, job-manufactured products. It is onlyat the construction job site that the three components of the stucco — cement, lime and sand — areproportioned and mixed both before and after water is added to produce the stucco mix. Stuccothen has to be applied within three hours after the initial mixing.
Fig. 2.1: Exterior Stucco Finishes Flowchart
One cannot, therefore, talk about the “stucco industry”, but only about the different industriesproducing the three essential ingredients, i.e., the cement industry, the lime industry and theaggregates industry. The cement and aggregates industries were reviewed and discussed in both the1993 Cement and Concrete study and the 1999 update to that report, while the lime industry wastouched on in the Brick and Mortar study, in the context of calcium silicate bricks.
There are some similarities between the cement and lime industries (both using limestone as theirbasic raw material), although the production of lime, both in Canada and worldwide, is much lessthan that of cement. In Canada, lime is produced in six provinces (New Brunswick, Quebec,Ontario, Manitoba, Alberta, and British Columbia). The reported total capacity is close to 4 million
cement lime sand
waterstuccomixer
finished stucco to be applied
6 ATHENA INSTITUTE: CRADLE-TO-GATE LCI FOR EXTERIOR STUCCO
tonnes/year. The heavily populated and industrialized provinces of Ontario and Quebec produceover 80% of Canada’s total lime output, with Ontario contributing about two-thirds of that total.
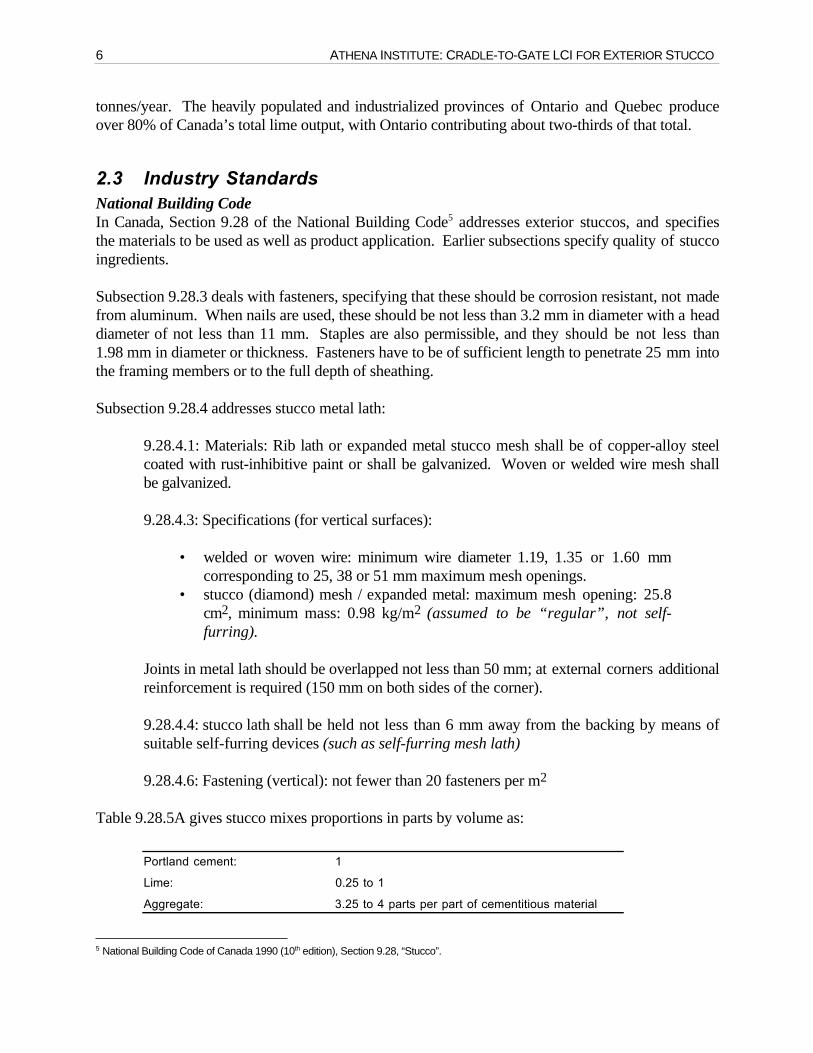
2.3 Industry StandardsNational Building CodeIn Canada, Section 9.28 of the National Building Code5 addresses exterior stuccos, and specifiesthe materials to be used as well as product application. Earlier subsections specify quality of stuccoingredients.
Subsection 9.28.3 deals with fasteners, specifying that these should be corrosion resistant, not madefrom aluminum. When nails are used, these should be not less than 3.2 mm in diameter with a headdiameter of not less than 11 mm. Staples are also permissible, and they should be not less than1.98 mm in diameter or thickness. Fasteners have to be of sufficient length to penetrate 25 mm intothe framing members or to the full depth of sheathing.
Subsection 9.28.4 addresses stucco metal lath:
9.28.4.1: Materials: Rib lath or expanded metal stucco mesh shall be of copper-alloy steelcoated with rust-inhibitive paint or shall be galvanized. Woven or welded wire mesh shallbe galvanized.
9.28.4.3: Specifications (for vertical surfaces):
• welded or woven wire: minimum wire diameter 1.19, 1.35 or 1.60 mmcorresponding to 25, 38 or 51 mm maximum mesh openings.
• stucco (diamond) mesh / expanded metal: maximum mesh opening: 25.8cm2, minimum mass: 0.98 kg/m2 (assumed to be “regular”, not self-furring).
Joints in metal lath should be overlapped not less than 50 mm; at external corners additionalreinforcement is required (150 mm on both sides of the corner).
9.28.4.4: stucco lath shall be held not less than 6 mm away from the backing by means ofsuitable self-furring devices (such as self-furring mesh lath)
9.28.4.6: Fastening (vertical): not fewer than 20 fasteners per m2
Table 9.28.5A gives stucco mixes proportions in parts by volume as:
Portland cement: 1
Lime: 0.25 to 1
Aggregate: 3.25 to 4 parts per part of cementitious material
5 National Building Code of Canada 1990 (10th edition), Section 9.28, “Stucco”.
ATHENA INSTITUTE: CRADLE-TO-GATE LCI FOR EXTERIOR STUCCO 7
Stucco application is discussed in subsection 9.28.6 with the following stipulations:
“Stucco shall be applied with not less than 2 base coats and one finish coat, providing atotal thickness of not less than 15 mm, measured from the face of the lath or face of themasonry where no lath is used. First coat shall be not less than 6 mm. Second coat shall benot less than 6 mm. Finish coat shall be not less than 3 mm.”
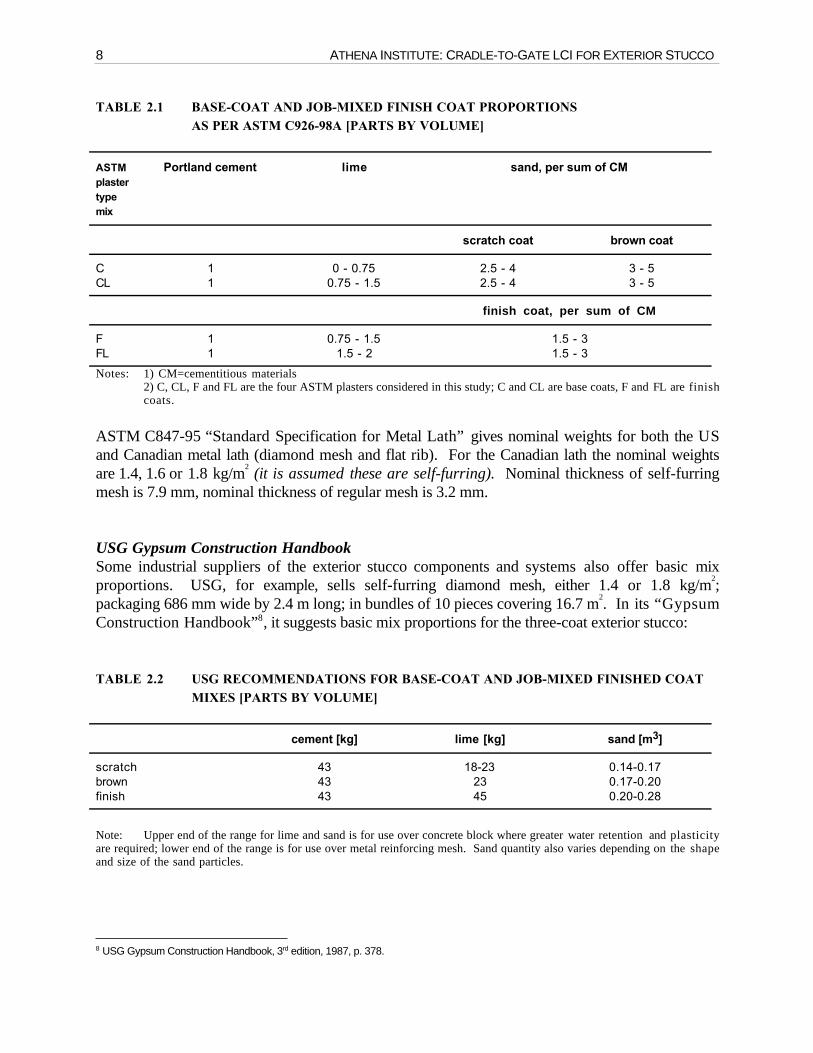
ASTMFurther and more detailed specifications are given by ASTM standards C926-98a6 and C847-957
covering “Application of Portland Cement-Based Plaster”, and “Metal Lath”, respectively.
ASTM C926-98a “Standard Specification for Application of Portland Cement-Based Plaster”differentiates between exterior stucco over metal plaster lath, versus stucco over solid stucco basesuch as concrete masonry (blocks), cast-in-place or precast concrete. For vertical surfaces overmetal stucco base, it specifies minimum thicknesses of 9.5 mm, 9.5 mm, and 3 mm respectively forthe scratch, brown and finish coats, for a total of 22 mm, to ensure proper embedment of the lath.For a solid base, its requirement of 6 mm, 6 mm, and 3 mm for the three coats is the same as thatspecified as minimum by the National Building Code of Canada (Section 9.28, as referencedabove).
Depending on the type of raw materials used (Portland cement, masonry cement, plastic cement,lime) and stucco base (metal lath, high absorption base, such as concrete masonry, or lowabsorption base, such as cast-in-place or precast concrete), ASTM allows various mixes.Considering the two exterior stucco systems selected for use in the ATHENA software, and the rawmaterials commonly used in Canada (i.e., Portland cement and lime), permissible PC/lime mixesand their proportions for both base (scratch and brown) and finish coats, as per ASTM, are shownin Table 2.1.
ASTM C926 also offers weights per cubic meter for the materials considered, factors important fordata conversion. Appropriate densities are 1505 kg/m3 for Portland cement, 640 kg/m3 forhydrated lime, and 1280 kg/m3 for dry sand.
6 ASTM C926-98a, “Standard Specification for Application of Portland Cement-Based Plaster”, Annual Book of ASTM Standards 2000,Volume 04.01.7 ASTM C847-95, “Standard Specification for Metal Lath”, Annual Book of ASTM Standards 2000, Volume 04.01.
8 ATHENA INSTITUTE: CRADLE-TO-GATE LCI FOR EXTERIOR STUCCO
TABLE 2.1 BASE-COAT AND JOB-MIXED FINISH COAT PROPORTIONSAS PER ASTM C926-98A [PARTS BY VOLUME]
ASTMplastertypemix
Portland cement lime sand, per sum of CM
scratch coat brown coat
C 1 0 - 0.75 2.5 - 4 3 - 5CL 1 0.75 - 1.5 2.5 - 4 3 - 5
finish coat, per sum of CM
F 1 0.75 - 1.5 1.5 - 3FL 1 1.5 - 2 1.5 - 3
Notes: 1) CM=cementitious materials2) C, CL, F and FL are the four ASTM plasters considered in this study; C and CL are base coats, F and FL are finishcoats.
ASTM C847-95 “Standard Specification for Metal Lath” gives nominal weights for both the USand Canadian metal lath (diamond mesh and flat rib). For the Canadian lath the nominal weightsare 1.4, 1.6 or 1.8 kg/m
2 (it is assumed these are self-furring). Nominal thickness of self-furring
mesh is 7.9 mm, nominal thickness of regular mesh is 3.2 mm.
USG Gypsum Construction HandbookSome industrial suppliers of the exterior stucco components and systems also offer basic mixproportions. USG, for example, sells self-furring diamond mesh, either 1.4 or 1.8 kg/m
2;
packaging 686 mm wide by 2.4 m long; in bundles of 10 pieces covering 16.7 m2. In its “Gypsum
Construction Handbook”8, it suggests basic mix proportions for the three-coat exterior stucco:
TABLE 2.2 USG RECOMMENDATIONS FOR BASE-COAT AND JOB-MIXED FINISHED COATMIXES [PARTS BY VOLUME]
cement [kg] lime [kg] sand [m3]
scratch 43 18-23 0.14-0.17brown 43 23 0.17-0.20finish 43 45 0.20-0.28
Note: Upper end of the range for lime and sand is for use over concrete block where greater water retention and plasticityare required; lower end of the range is for use over metal reinforcing mesh. Sand quantity also varies depending on the shapeand size of the sand particles.
8 USG Gypsum Construction Handbook, 3rd edition, 1987, p. 378.
ATHENA INSTITUTE: CRADLE-TO-GATE LCI FOR EXTERIOR STUCCO 9
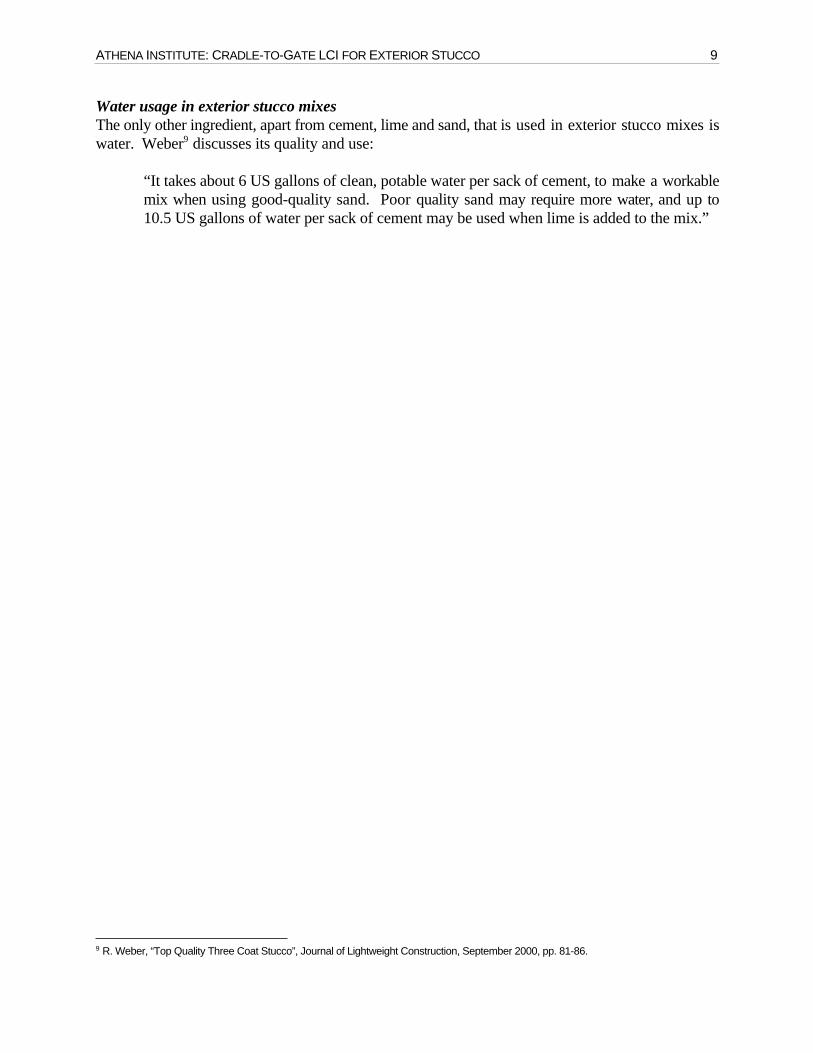
Water usage in exterior stucco mixesThe only other ingredient, apart from cement, lime and sand, that is used in exterior stucco mixes iswater. Weber9 discusses its quality and use:
“It takes about 6 US gallons of clean, potable water per sack of cement, to make a workablemix when using good-quality sand. Poor quality sand may require more water, and up to10.5 US gallons of water per sack of cement may be used when lime is added to the mix.”
9 R. Weber, “Top Quality Three Coat Stucco”, Journal of Lightweight Construction, September 2000, pp. 81-86.
10 ATHENA INSTITUTE: CRADLE-TO-GATE LCI FOR EXTERIOR STUCCO
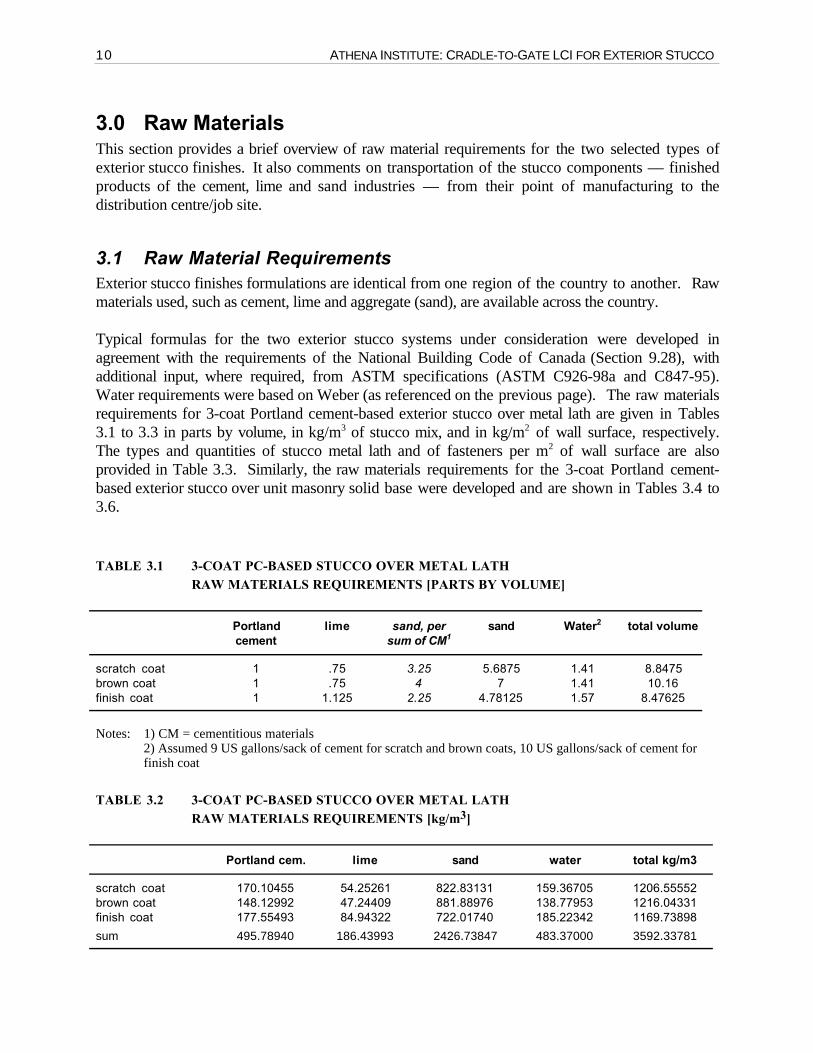
3.0 Raw MaterialsThis section provides a brief overview of raw material requirements for the two selected types ofexterior stucco finishes. It also comments on transportation of the stucco components — finishedproducts of the cement, lime and sand industries — from their point of manufacturing to thedistribution centre/job site.
3.1 Raw Material RequirementsExterior stucco finishes formulations are identical from one region of the country to another. Rawmaterials used, such as cement, lime and aggregate (sand), are available across the country.
Typical formulas for the two exterior stucco systems under consideration were developed inagreement with the requirements of the National Building Code of Canada (Section 9.28), withadditional input, where required, from ASTM specifications (ASTM C926-98a and C847-95).Water requirements were based on Weber (as referenced on the previous page). The raw materialsrequirements for 3-coat Portland cement-based exterior stucco over metal lath are given in Tables3.1 to 3.3 in parts by volume, in kg/m3 of stucco mix, and in kg/m2 of wall surface, respectively.The types and quantities of stucco metal lath and of fasteners per m2 of wall surface are alsoprovided in Table 3.3. Similarly, the raw materials requirements for the 3-coat Portland cement-based exterior stucco over unit masonry solid base were developed and are shown in Tables 3.4 to3.6.
TABLE 3.1 3-COAT PC-BASED STUCCO OVER METAL LATHRAW MATERIALS REQUIREMENTS [PARTS BY VOLUME]
Portlandcement
lime sand, persum of CM1
sand Water2 total volume
scratch coat 1 .75 3.25 5.6875 1.41 8.8475brown coat 1 .75 4 7 1.41 10.16finish coat 1 1.125 2.25 4.78125 1.57 8.47625
Notes: 1) CM = cementitious materials2) Assumed 9 US gallons/sack of cement for scratch and brown coats, 10 US gallons/sack of cement forfinish coat
TABLE 3.2 3-COAT PC-BASED STUCCO OVER METAL LATHRAW MATERIALS REQUIREMENTS [kg/m3]
Portland cem. lime sand water total kg/m3
scratch coat 170.10455 54.25261 822.83131 159.36705 1206.55552brown coat 148.12992 47.24409 881.88976 138.77953 1216.04331finish coat 177.55493 84.94322 722.01740 185.22342 1169.73898
sum 495.78940 186.43993 2426.73847 483.37000 3592.33781
ATHENA INSTITUTE: CRADLE-TO-GATE LCI FOR EXTERIOR STUCCO 11
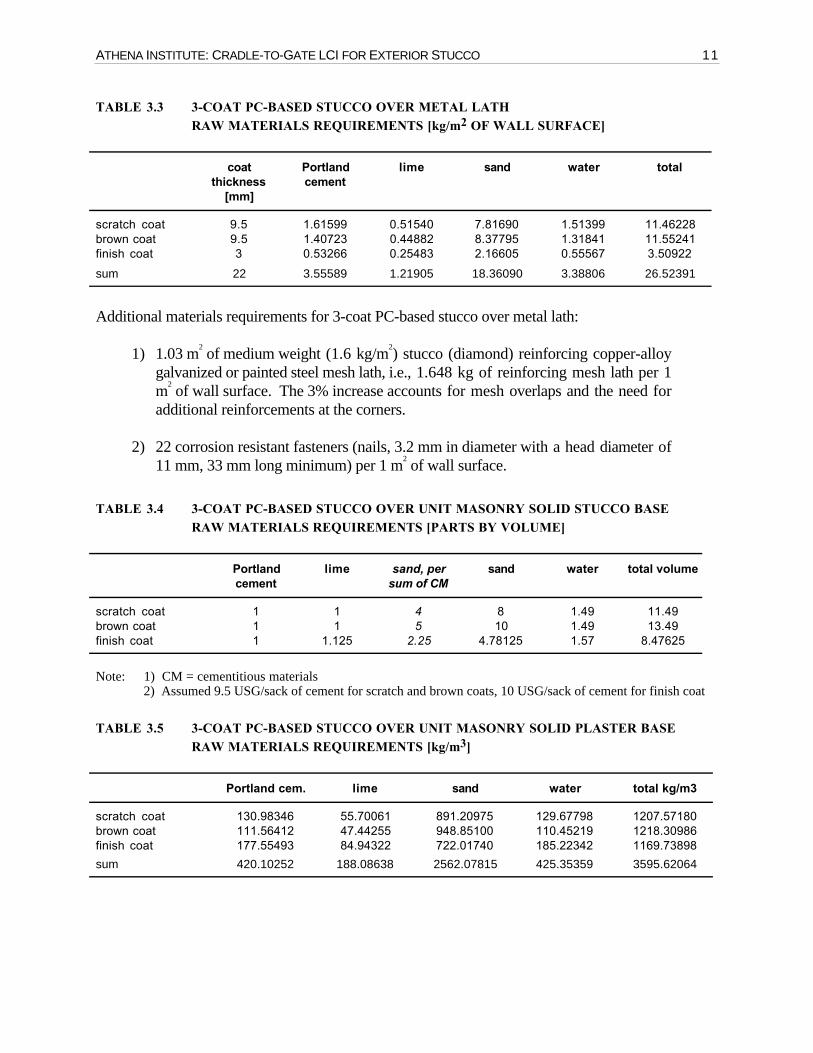
TABLE 3.3 3-COAT PC-BASED STUCCO OVER METAL LATHRAW MATERIALS REQUIREMENTS [kg/m2 OF WALL SURFACE]
coatthickness
[mm]
Portlandcement
lime sand water total
scratch coat 9.5 1.61599 0.51540 7.81690 1.51399 11.46228brown coat 9.5 1.40723 0.44882 8.37795 1.31841 11.55241finish coat 3 0.53266 0.25483 2.16605 0.55567 3.50922
sum 22 3.55589 1.21905 18.36090 3.38806 26.52391
Additional materials requirements for 3-coat PC-based stucco over metal lath:
1) 1.03 m2 of medium weight (1.6 kg/m
2) stucco (diamond) reinforcing copper-alloy
galvanized or painted steel mesh lath, i.e., 1.648 kg of reinforcing mesh lath per 1m
2 of wall surface. The 3% increase accounts for mesh overlaps and the need for
additional reinforcements at the corners.
2) 22 corrosion resistant fasteners (nails, 3.2 mm in diameter with a head diameter of11 mm, 33 mm long minimum) per 1 m
2 of wall surface.
TABLE 3.4 3-COAT PC-BASED STUCCO OVER UNIT MASONRY SOLID STUCCO BASERAW MATERIALS REQUIREMENTS [PARTS BY VOLUME]
Portlandcement
lime sand, persum of CM
sand water total volume
scratch coat 1 1 4 8 1.49 11.49brown coat 1 1 5 10 1.49 13.49finish coat 1 1.125 2.25 4.78125 1.57 8.47625
Note: 1) CM = cementitious materials2) Assumed 9.5 USG/sack of cement for scratch and brown coats, 10 USG/sack of cement for finish coat
TABLE 3.5 3-COAT PC-BASED STUCCO OVER UNIT MASONRY SOLID PLASTER BASERAW MATERIALS REQUIREMENTS [kg/m3]
Portland cem. lime sand water total kg/m3
scratch coat 130.98346 55.70061 891.20975 129.67798 1207.57180brown coat 111.56412 47.44255 948.85100 110.45219 1218.30986finish coat 177.55493 84.94322 722.01740 185.22342 1169.73898
sum 420.10252 188.08638 2562.07815 425.35359 3595.62064
12 ATHENA INSTITUTE: CRADLE-TO-GATE LCI FOR EXTERIOR STUCCO
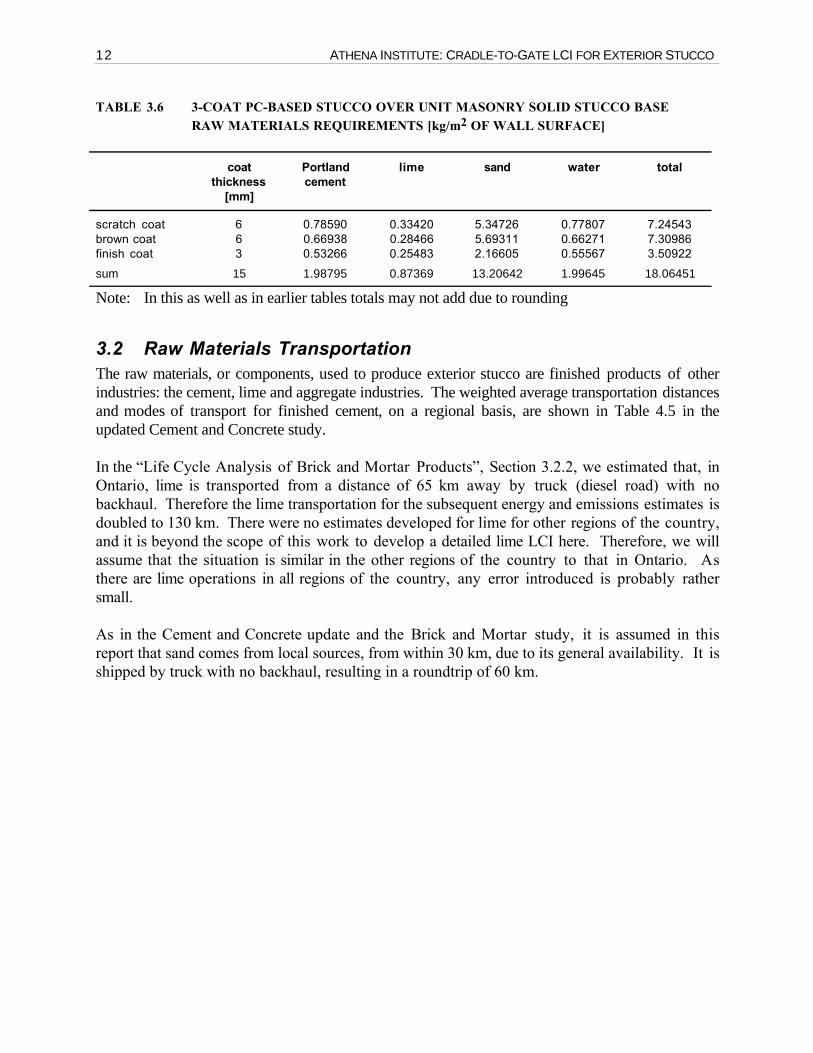
TABLE 3.6 3-COAT PC-BASED STUCCO OVER UNIT MASONRY SOLID STUCCO BASERAW MATERIALS REQUIREMENTS [kg/m2 OF WALL SURFACE]
coatthickness
[mm]
Portlandcement
lime sand water total
scratch coat 6 0.78590 0.33420 5.34726 0.77807 7.24543brown coat 6 0.66938 0.28466 5.69311 0.66271 7.30986finish coat 3 0.53266 0.25483 2.16605 0.55567 3.50922
sum 15 1.98795 0.87369 13.20642 1.99645 18.06451
Note: In this as well as in earlier tables totals may not add due to rounding
3.2 Raw Materials TransportationThe raw materials, or components, used to produce exterior stucco are finished products of otherindustries: the cement, lime and aggregate industries. The weighted average transportation distancesand modes of transport for finished cement, on a regional basis, are shown in Table 4.5 in theupdated Cement and Concrete study.
In the “Life Cycle Analysis of Brick and Mortar Products”, Section 3.2.2, we estimated that, inOntario, lime is transported from a distance of 65 km away by truck (diesel road) with nobackhaul. Therefore the lime transportation for the subsequent energy and emissions estimates isdoubled to 130 km. There were no estimates developed for lime for other regions of the country,and it is beyond the scope of this work to develop a detailed lime LCI here. Therefore, we willassume that the situation is similar in the other regions of the country to that in Ontario. Asthere are lime operations in all regions of the country, any error introduced is probably rathersmall.
As in the Cement and Concrete update and the Brick and Mortar study, it is assumed in thisreport that sand comes from local sources, from within 30 km, due to its general availability. It isshipped by truck with no backhaul, resulting in a roundtrip of 60 km.
ATHENA INSTITUTE: CRADLE-TO-GATE LCI FOR EXTERIOR STUCCO 13
4.0 Energy UseIn this section, we explain and present the estimates of energy embodied in exterior stucco finishes.Energy is used in all stages of exterior stucco production: raw materials extraction andtransportation of the three components (cement, lime and sand); their processing; and transportationof finished cement, lime and sand to the distribution centre/job site for stucco processing. Varioustables show total energy use by region and process stage. We also show the breakdown by energytype because that information is directly relevant to the estimation of atmospheric emissions in asubsequent section of the report.
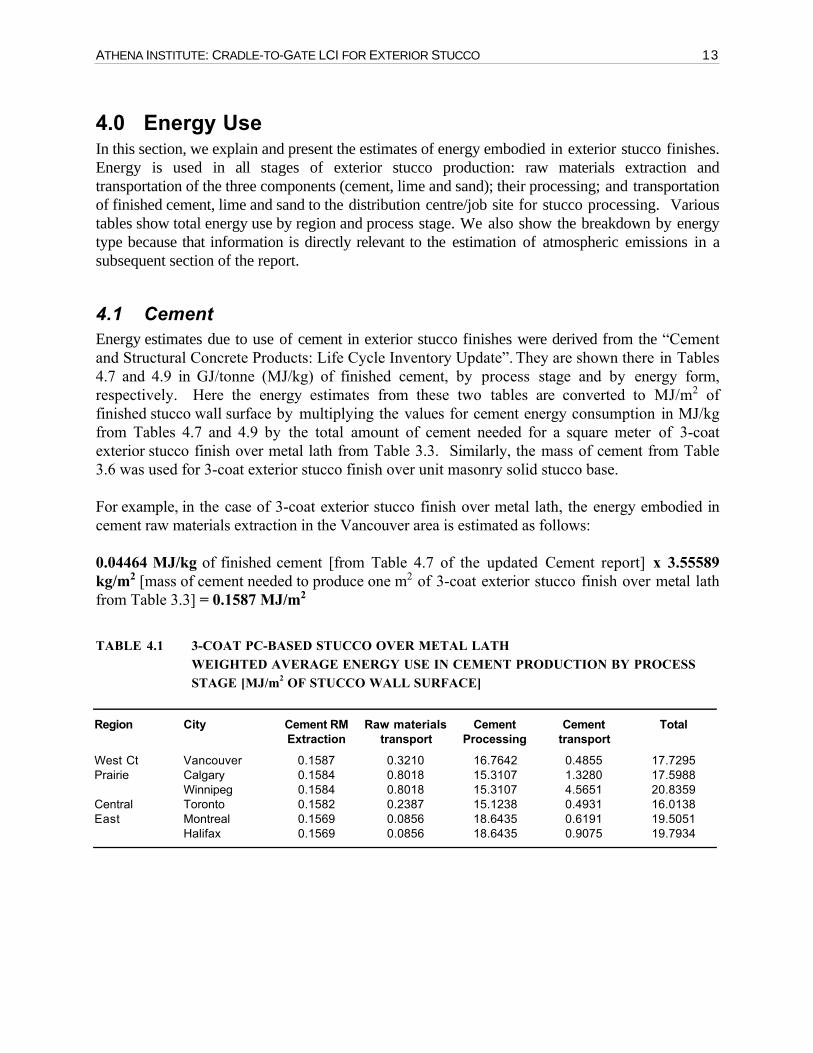
4.1 CementEnergy estimates due to use of cement in exterior stucco finishes were derived from the “Cementand Structural Concrete Products: Life Cycle Inventory Update”. They are shown there in Tables4.7 and 4.9 in GJ/tonne (MJ/kg) of finished cement, by process stage and by energy form,respectively. Here the energy estimates from these two tables are converted to MJ/m2 offinished stucco wall surface by multiplying the values for cement energy consumption in MJ/kgfrom Tables 4.7 and 4.9 by the total amount of cement needed for a square meter of 3-coatexterior stucco finish over metal lath from Table 3.3. Similarly, the mass of cement from Table3.6 was used for 3-coat exterior stucco finish over unit masonry solid stucco base.
For example, in the case of 3-coat exterior stucco finish over metal lath, the energy embodied incement raw materials extraction in the Vancouver area is estimated as follows:
0.04464 MJ/kg of finished cement [from Table 4.7 of the updated Cement report] x 3.55589kg/m2 [mass of cement needed to produce one m2 of 3-coat exterior stucco finish over metal lathfrom Table 3.3] = 0.1587 MJ/m2
TABLE 4.1 3-COAT PC-BASED STUCCO OVER METAL LATHWEIGHTED AVERAGE ENERGY USE IN CEMENT PRODUCTION BY PROCESSSTAGE [MJ/m2 OF STUCCO WALL SURFACE]
Region City Cement RMExtraction
Raw materialstransport
CementProcessing
Cementtransport
Total
West Ct Vancouver 0.1587 0.3210 16.7642 0.4855 17.7295Prairie Calgary 0.1584 0.8018 15.3107 1.3280 17.5988
Winnipeg 0.1584 0.8018 15.3107 4.5651 20.8359Central Toronto 0.1582 0.2387 15.1238 0.4931 16.0138East Montreal 0.1569 0.0856 18.6435 0.6191 19.5051
Halifax 0.1569 0.0856 18.6435 0.9075 19.7934
14 ATHENA INSTITUTE: CRADLE-TO-GATE LCI FOR EXTERIOR STUCCO
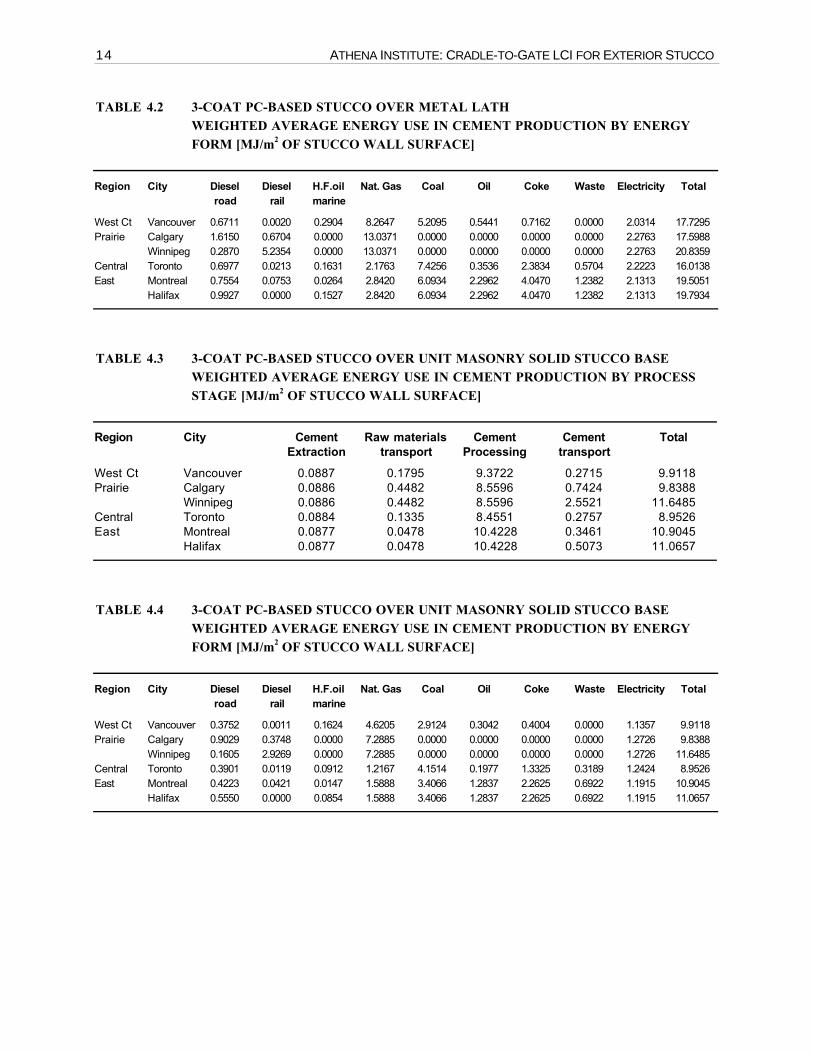
TABLE 4.2 3-COAT PC-BASED STUCCO OVER METAL LATHWEIGHTED AVERAGE ENERGY USE IN CEMENT PRODUCTION BY ENERGYFORM [MJ/m2 OF STUCCO WALL SURFACE]
Region City Dieselroad
Dieselrail
H.F.oilmarine
Nat. Gas Coal Oil Coke Waste Electricity Total
West Ct Vancouver 0.6711 0.0020 0.2904 8.2647 5.2095 0.5441 0.7162 0.0000 2.0314 17.7295Prairie Calgary 1.6150 0.6704 0.0000 13.0371 0.0000 0.0000 0.0000 0.0000 2.2763 17.5988
Winnipeg 0.2870 5.2354 0.0000 13.0371 0.0000 0.0000 0.0000 0.0000 2.2763 20.8359Central Toronto 0.6977 0.0213 0.1631 2.1763 7.4256 0.3536 2.3834 0.5704 2.2223 16.0138East Montreal 0.7554 0.0753 0.0264 2.8420 6.0934 2.2962 4.0470 1.2382 2.1313 19.5051
Halifax 0.9927 0.0000 0.1527 2.8420 6.0934 2.2962 4.0470 1.2382 2.1313 19.7934
TABLE 4.3 3-COAT PC-BASED STUCCO OVER UNIT MASONRY SOLID STUCCO BASEWEIGHTED AVERAGE ENERGY USE IN CEMENT PRODUCTION BY PROCESSSTAGE [MJ/m2 OF STUCCO WALL SURFACE]
Region City CementExtraction
Raw materialstransport
CementProcessing
Cementtransport
Total
West Ct Vancouver 0.0887 0.1795 9.3722 0.2715 9.9118Prairie Calgary 0.0886 0.4482 8.5596 0.7424 9.8388
Winnipeg 0.0886 0.4482 8.5596 2.5521 11.6485Central Toronto 0.0884 0.1335 8.4551 0.2757 8.9526East Montreal 0.0877 0.0478 10.4228 0.3461 10.9045
Halifax 0.0877 0.0478 10.4228 0.5073 11.0657
TABLE 4.4 3-COAT PC-BASED STUCCO OVER UNIT MASONRY SOLID STUCCO BASEWEIGHTED AVERAGE ENERGY USE IN CEMENT PRODUCTION BY ENERGYFORM [MJ/m2 OF STUCCO WALL SURFACE]
Region City Dieselroad
Dieselrail
H.F.oilmarine
Nat. Gas Coal Oil Coke Waste Electricity Total
West Ct Vancouver 0.3752 0.0011 0.1624 4.6205 2.9124 0.3042 0.4004 0.0000 1.1357 9.9118Prairie Calgary 0.9029 0.3748 0.0000 7.2885 0.0000 0.0000 0.0000 0.0000 1.2726 9.8388
Winnipeg 0.1605 2.9269 0.0000 7.2885 0.0000 0.0000 0.0000 0.0000 1.2726 11.6485Central Toronto 0.3901 0.0119 0.0912 1.2167 4.1514 0.1977 1.3325 0.3189 1.2424 8.9526East Montreal 0.4223 0.0421 0.0147 1.5888 3.4066 1.2837 2.2625 0.6922 1.1915 10.9045
Halifax 0.5550 0.0000 0.0854 1.5888 3.4066 1.2837 2.2625 0.6922 1.1915 11.0657

ATHENA INSTITUTE: CRADLE-TO-GATE LCI FOR EXTERIOR STUCCO 15
4.2 LimeEnergy estimates for use of lime in exterior stucco finishes per m2 of finished stucco wall werederived from Table 4.2.1 in the “Life Cycle Analysis of Brick and Mortar Products” in a similarmanner as those for cement in the preceding section.
It should be noted that only lime produced in Ontario was considered in the brick study, as theonly Canadian operation where calcium silicate bricks are produced is located there. As alreadymentioned, lime is produced across the country, in six different provinces, providing a goodcoverage and lime availability in all regions. Of course, there are a number of different types oflime kilns used, with various energy efficiencies and consumptions. However, as noted earlier, itis beyond the scope of this study to develop a full LCI of lime operations in different regions ofCanada. Therefore, we will assume that energy embodied in lime production in all regions is thesame as in Ontario.
TABLE 4.5 3-COAT PC-BASED STUCCO OVER METAL LATHWEIGHTED AVERAGE ENERGY USE IN LIME PRODUCTION (ONTARIO)BY PROCESS STAGE [MJ/m2 OF STUCCO WALL SURFACE]
Extraction RM transport Processing Lime transport Total
0.0588 0.0042 8.1181 0.1870 8.3681
TABLE 4.6 3-COAT PC-BASED STUCCO OVER METAL LATHWEIGHTED AVERAGE ENERGY USE IN LIME PRODUCTION (ONTARIO)BY ENERGY FORM [MJ/m2 OF STUCCO WALL SURFACE]
Natural Gas Electricity Diesel road Total
7.8872 0.2351 0.2458 8.3681
TABLE 4.7 3-COAT PC-BASED STUCCO OVER UNIT MASONRY SOLID STUCCO BASEWEIGHTED AVERAGE ENERGY USE IN LIME PRODUCTION (ONTARIO)BY PROCESS STAGE [MJ/m2 OF STUCCO WALL SURFACE]
Extraction RM transport Processing Lime transport Total
0.0421 0.0030 5.8183 0.1340 5.9974
16 ATHENA INSTITUTE: CRADLE-TO-GATE LCI FOR EXTERIOR STUCCO
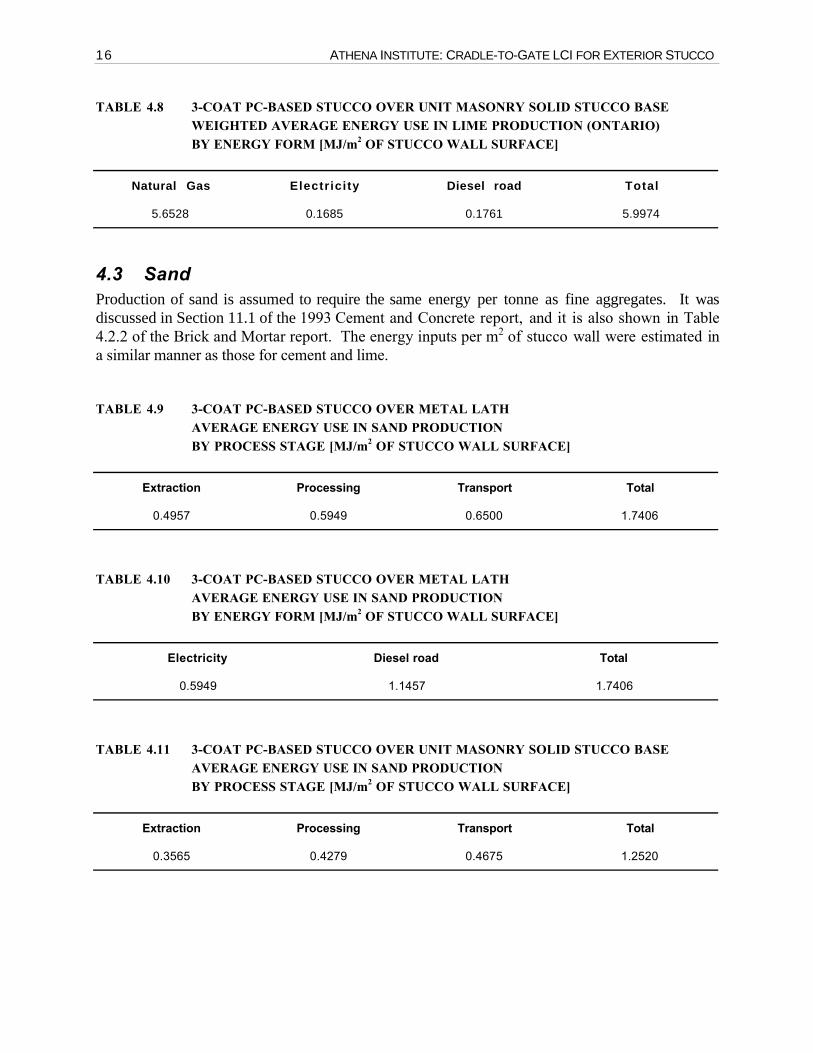
TABLE 4.8 3-COAT PC-BASED STUCCO OVER UNIT MASONRY SOLID STUCCO BASEWEIGHTED AVERAGE ENERGY USE IN LIME PRODUCTION (ONTARIO)BY ENERGY FORM [MJ/m2 OF STUCCO WALL SURFACE]
Natural Gas Electricity Diesel road Total
5.6528 0.1685 0.1761 5.9974
4.3 SandProduction of sand is assumed to require the same energy per tonne as fine aggregates. It wasdiscussed in Section 11.1 of the 1993 Cement and Concrete report, and it is also shown in Table4.2.2 of the Brick and Mortar report. The energy inputs per m2 of stucco wall were estimated ina similar manner as those for cement and lime.
TABLE 4.9 3-COAT PC-BASED STUCCO OVER METAL LATHAVERAGE ENERGY USE IN SAND PRODUCTIONBY PROCESS STAGE [MJ/m2 OF STUCCO WALL SURFACE]
Extraction Processing Transport Total
0.4957 0.5949 0.6500 1.7406
TABLE 4.10 3-COAT PC-BASED STUCCO OVER METAL LATHAVERAGE ENERGY USE IN SAND PRODUCTIONBY ENERGY FORM [MJ/m2 OF STUCCO WALL SURFACE]
Electricity Diesel road Total
0.5949 1.1457 1.7406
TABLE 4.11 3-COAT PC-BASED STUCCO OVER UNIT MASONRY SOLID STUCCO BASEAVERAGE ENERGY USE IN SAND PRODUCTIONBY PROCESS STAGE [MJ/m2 OF STUCCO WALL SURFACE]
Extraction Processing Transport Total
0.3565 0.4279 0.4675 1.2520

ATHENA INSTITUTE: CRADLE-TO-GATE LCI FOR EXTERIOR STUCCO 17
TABLE 4.12 3-COAT PC-BASED STUCCO OVER UNIT MASONRY SOLID STUCCO BASEAVERAGE ENERGY USE IN SAND PRODUCTIONBY ENERGY FORM [MJ/m2 OF STUCCO WALL SURFACE]
Electricity Diesel road Total
0.4279 0.8241 1.2520
4.4 Energy consumption in stucco mixingMixing on the job site simply involves mixing of the three dry stucoo components — cement, limeand sand — with water. The type of mixer and the mixing method are the same as those used forproduction of cement mortar (see section 11.4 in the 1993 Cement report), i.e. a 3 cubic foot (0.085m3) mixer driven by a 3/4 HP electric motor, with a mix time of 10 minutes. That gives the estimateof total electrical energy use of 3.95 MJ per m3 of stucco. To convert to energy use per m2 units ofstucco wall for the two cases under consideration, the above value is multiplied by volumes of thetwo respective stuccos per m2 of wall:
3-coat PC-based stucco over metal lath:3.95 MJ/m3 x 0.022 m3/m2 of stucco surface = 0.0869 MJ/m2
3-coat PC-based stucco over unit masonry solid stucco base:3.95 MJ/m3 x 0.015 m3/m2 of stucco surface = 0.05925 MJ/m2
4.5 Total energy – exterior stuccoTotal energy embodied in production of exterior stucco finishes is obtained by combining the aboveestimates for energy consumption for embodied energy in production of the three dry componentsof the stucco finishes and the energy input for stucco mixing. The totals for the two types ofexterior stucco finishes under consideration are shown below in Sections 4.5.1 and 4.5.2,respectively. In both cases, the total energy inputs are tabulated in three different forms – bycomponents, by process stage, and by energy form. They are all expressed in MJ per m2 of stuccosurface.
As in other cement-containing products, energy embodied in cement production represents thehighest fraction of the total, due to the high energy consumption in the cement manufacturing stage.Lime accounts for the second highest fraction of total energy.
18 ATHENA INSTITUTE: CRADLE-TO-GATE LCI FOR EXTERIOR STUCCO
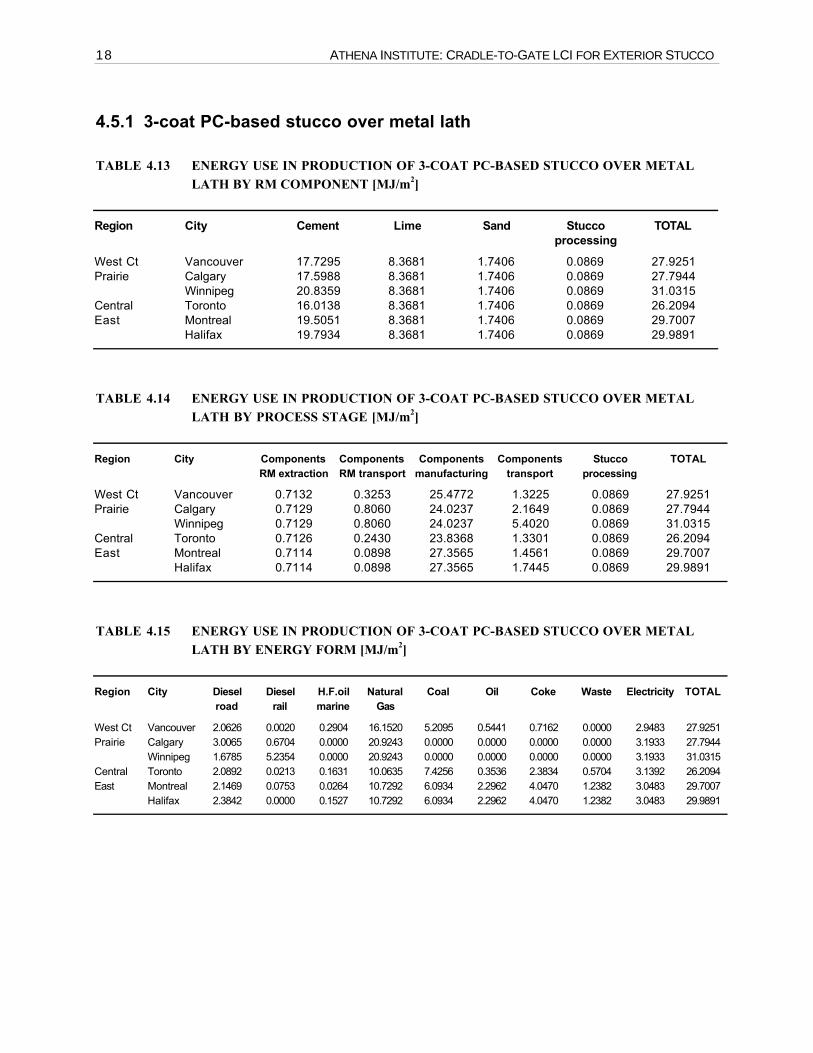
4.5.1 3-coat PC-based stucco over metal lath
TABLE 4.13 ENERGY USE IN PRODUCTION OF 3-COAT PC-BASED STUCCO OVER METALLATH BY RM COMPONENT [MJ/m2]
Region City Cement Lime Sand Stuccoprocessing
TOTAL
West Ct Vancouver 17.7295 8.3681 1.7406 0.0869 27.9251Prairie Calgary 17.5988 8.3681 1.7406 0.0869 27.7944
Winnipeg 20.8359 8.3681 1.7406 0.0869 31.0315Central Toronto 16.0138 8.3681 1.7406 0.0869 26.2094East Montreal 19.5051 8.3681 1.7406 0.0869 29.7007
Halifax 19.7934 8.3681 1.7406 0.0869 29.9891
TABLE 4.14 ENERGY USE IN PRODUCTION OF 3-COAT PC-BASED STUCCO OVER METALLATH BY PROCESS STAGE [MJ/m2]
Region City ComponentsRM extraction
ComponentsRM transport
Componentsmanufacturing
Componentstransport
Stuccoprocessing
TOTAL
West Ct Vancouver 0.7132 0.3253 25.4772 1.3225 0.0869 27.9251Prairie Calgary 0.7129 0.8060 24.0237 2.1649 0.0869 27.7944
Winnipeg 0.7129 0.8060 24.0237 5.4020 0.0869 31.0315Central Toronto 0.7126 0.2430 23.8368 1.3301 0.0869 26.2094East Montreal 0.7114 0.0898 27.3565 1.4561 0.0869 29.7007
Halifax 0.7114 0.0898 27.3565 1.7445 0.0869 29.9891
TABLE 4.15 ENERGY USE IN PRODUCTION OF 3-COAT PC-BASED STUCCO OVER METALLATH BY ENERGY FORM [MJ/m2]
Region City Dieselroad
Dieselrail
H.F.oilmarine
NaturalGas
Coal Oil Coke Waste Electricity TOTAL
West Ct Vancouver 2.0626 0.0020 0.2904 16.1520 5.2095 0.5441 0.7162 0.0000 2.9483 27.9251Prairie Calgary 3.0065 0.6704 0.0000 20.9243 0.0000 0.0000 0.0000 0.0000 3.1933 27.7944
Winnipeg 1.6785 5.2354 0.0000 20.9243 0.0000 0.0000 0.0000 0.0000 3.1933 31.0315Central Toronto 2.0892 0.0213 0.1631 10.0635 7.4256 0.3536 2.3834 0.5704 3.1392 26.2094East Montreal 2.1469 0.0753 0.0264 10.7292 6.0934 2.2962 4.0470 1.2382 3.0483 29.7007
Halifax 2.3842 0.0000 0.1527 10.7292 6.0934 2.2962 4.0470 1.2382 3.0483 29.9891
ATHENA INSTITUTE: CRADLE-TO-GATE LCI FOR EXTERIOR STUCCO 19
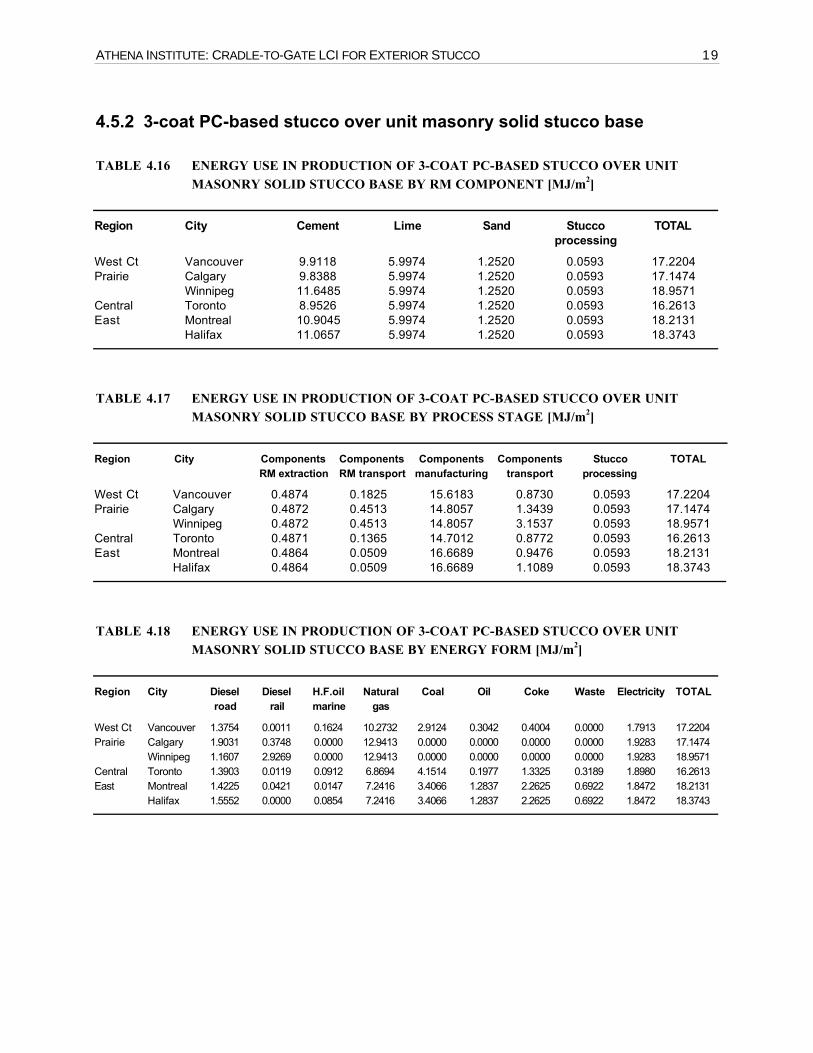
4.5.2 3-coat PC-based stucco over unit masonry solid stucco base
TABLE 4.16 ENERGY USE IN PRODUCTION OF 3-COAT PC-BASED STUCCO OVER UNITMASONRY SOLID STUCCO BASE BY RM COMPONENT [MJ/m2]
Region City Cement Lime Sand Stuccoprocessing
TOTAL
West Ct Vancouver 9.9118 5.9974 1.2520 0.0593 17.2204Prairie Calgary 9.8388 5.9974 1.2520 0.0593 17.1474
Winnipeg 11.6485 5.9974 1.2520 0.0593 18.9571Central Toronto 8.9526 5.9974 1.2520 0.0593 16.2613East Montreal 10.9045 5.9974 1.2520 0.0593 18.2131
Halifax 11.0657 5.9974 1.2520 0.0593 18.3743
TABLE 4.17 ENERGY USE IN PRODUCTION OF 3-COAT PC-BASED STUCCO OVER UNITMASONRY SOLID STUCCO BASE BY PROCESS STAGE [MJ/m2]
Region City ComponentsRM extraction
ComponentsRM transport
Componentsmanufacturing
Componentstransport
Stuccoprocessing
TOTAL
West Ct Vancouver 0.4874 0.1825 15.6183 0.8730 0.0593 17.2204Prairie Calgary 0.4872 0.4513 14.8057 1.3439 0.0593 17.1474
Winnipeg 0.4872 0.4513 14.8057 3.1537 0.0593 18.9571Central Toronto 0.4871 0.1365 14.7012 0.8772 0.0593 16.2613East Montreal 0.4864 0.0509 16.6689 0.9476 0.0593 18.2131
Halifax 0.4864 0.0509 16.6689 1.1089 0.0593 18.3743
TABLE 4.18 ENERGY USE IN PRODUCTION OF 3-COAT PC-BASED STUCCO OVER UNITMASONRY SOLID STUCCO BASE BY ENERGY FORM [MJ/m2]
Region City Dieselroad
Dieselrail
H.F.oilmarine
Naturalgas
Coal Oil Coke Waste Electricity TOTAL
West Ct Vancouver 1.3754 0.0011 0.1624 10.2732 2.9124 0.3042 0.4004 0.0000 1.7913 17.2204Prairie Calgary 1.9031 0.3748 0.0000 12.9413 0.0000 0.0000 0.0000 0.0000 1.9283 17.1474
Winnipeg 1.1607 2.9269 0.0000 12.9413 0.0000 0.0000 0.0000 0.0000 1.9283 18.9571Central Toronto 1.3903 0.0119 0.0912 6.8694 4.1514 0.1977 1.3325 0.3189 1.8980 16.2613East Montreal 1.4225 0.0421 0.0147 7.2416 3.4066 1.2837 2.2625 0.6922 1.8472 18.2131
Halifax 1.5552 0.0000 0.0854 7.2416 3.4066 1.2837 2.2625 0.6922 1.8472 18.3743
20 ATHENA INSTITUTE: CRADLE-TO-GATE LCI FOR EXTERIOR STUCCO
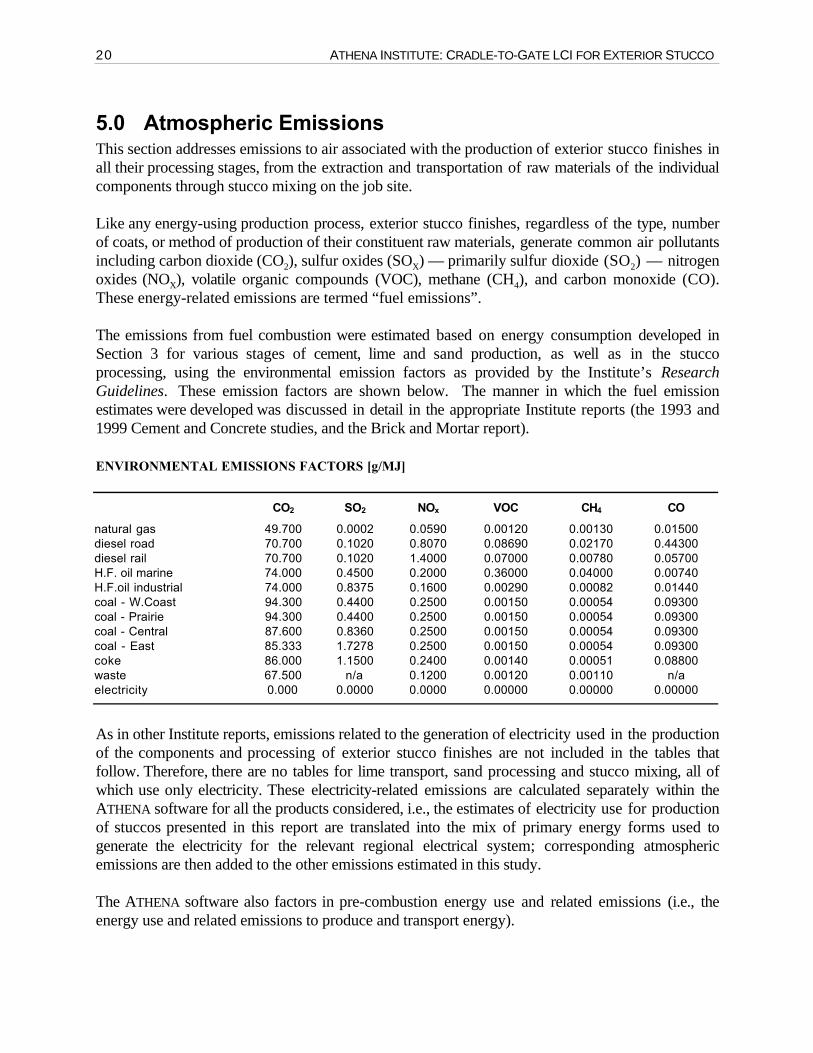
5.0 Atmospheric EmissionsThis section addresses emissions to air associated with the production of exterior stucco finishes inall their processing stages, from the extraction and transportation of raw materials of the individualcomponents through stucco mixing on the job site.
Like any energy-using production process, exterior stucco finishes, regardless of the type, numberof coats, or method of production of their constituent raw materials, generate common air pollutantsincluding carbon dioxide (CO2), sulfur oxides (SOX) — primarily sulfur dioxide (SO2) — nitrogenoxides (NOX), volatile organic compounds (VOC), methane (CH4), and carbon monoxide (CO).These energy-related emissions are termed “fuel emissions”.
The emissions from fuel combustion were estimated based on energy consumption developed inSection 3 for various stages of cement, lime and sand production, as well as in the stuccoprocessing, using the environmental emission factors as provided by the Institute’s ResearchGuidelines. These emission factors are shown below. The manner in which the fuel emissionestimates were developed was discussed in detail in the appropriate Institute reports (the 1993 and1999 Cement and Concrete studies, and the Brick and Mortar report).
ENVIRONMENTAL EMISSIONS FACTORS [g/MJ]
CO2 SO2 NOx VOC CH4 CO
natural gas 49.700 0.0002 0.0590 0.00120 0.00130 0.01500diesel road 70.700 0.1020 0.8070 0.08690 0.02170 0.44300diesel rail 70.700 0.1020 1.4000 0.07000 0.00780 0.05700H.F. oil marine 74.000 0.4500 0.2000 0.36000 0.04000 0.00740H.F.oil industrial 74.000 0.8375 0.1600 0.00290 0.00082 0.01440coal - W.Coast 94.300 0.4400 0.2500 0.00150 0.00054 0.09300coal - Prairie 94.300 0.4400 0.2500 0.00150 0.00054 0.09300coal - Central 87.600 0.8360 0.2500 0.00150 0.00054 0.09300coal - East 85.333 1.7278 0.2500 0.00150 0.00054 0.09300coke 86.000 1.1500 0.2400 0.00140 0.00051 0.08800waste 67.500 n/a 0.1200 0.00120 0.00110 n/aelectricity 0.000 0.0000 0.0000 0.00000 0.00000 0.00000
As in other Institute reports, emissions related to the generation of electricity used in the productionof the components and processing of exterior stucco finishes are not included in the tables thatfollow. Therefore, there are no tables for lime transport, sand processing and stucco mixing, all ofwhich use only electricity. These electricity-related emissions are calculated separately within theATHENA software for all the products considered, i.e., the estimates of electricity use for productionof stuccos presented in this report are translated into the mix of primary energy forms used togenerate the electricity for the relevant regional electrical system; corresponding atmosphericemissions are then added to the other emissions estimated in this study.
The ATHENA software also factors in pre-combustion energy use and related emissions (i.e., theenergy use and related emissions to produce and transport energy).
ATHENA INSTITUTE: CRADLE-TO-GATE LCI FOR EXTERIOR STUCCO 21
The specific characteristics of both cement and lime, and the nature of high temperaturesencountered in their processing, result in both positive and negative “processing” atmosphericemission effects that are in addition to the “fuel” emissions. There is significant “calcinationCO2” contribution due to the decomposition of limestone in the manufacturing of both cement andlime, as well as “thermal” and “prompt” NOx contributions, usually outweighing the “fuel”NOx. On the positive side, cement has the ability during its production to absorb (scrub) almost allSOx generated from both raw materials and fuels used, allowing the use of high sulfur content fuelsthat could not be used in other processes. These aspects of cement and lime process emissions, asopposed to fuel emissions, were discussed in more detail in the Institute’s Cement and Brickreports.
Particulate matter (TPM) emissions are also generated in various stages of production.
Process emissions
In the Tables below concerning cement (Tables 5.3, 5.4, 5.29 and 5.30) and lime (Tables 5.10,5.11, 5.36 and 5.37) processing, we separated the fuel related emissions from the processingones, such as calcination CO2, thermal and prompt NOx, negative (scrubbed) SOx. Fuelemissions are those caused by burning fossil fuels. These are estimated as a product of thequantity and type of fuels used and an appropriate emission factor. Process emissions are anyother emissions caused by the material processing, related to the chemical nature of the rawmaterials used and the process itself.
In the case of cement processing, as discussed in detail in the 1993 Cement and Concrete report,the process affects the CO2, NOx, and SO2 emissions. There are no VOC, CH4, or COprocessing emissions.
CO2: The processing, or calcination CO2 is generated in the kiln during pyroprocessing.Calcium carbonate (CaCO3) contained in limestone breaks down to calcium oxide (CaO) andcarbon dioxide (CO2) that is released into the atmosphere. This can be easily calculated fromstoichiometry of limestone decomposition, as shown in the above-mentioned report. Over thelast few decades, the cement industry made great strides in improving its energy efficiency.Consequently, the ratio between the calcination CO2 and fuel CO2 has shifted from about 50/50to closer to 60/40. The exact ratio depends on the type of fuel used and efficiency (type, age) ofthe kiln.
NOx: There are three mechanisms of NOx formation: thermal NOx, prompt NOx, and fuel NOx.NOx emissions from cement kilns have been found to depend on both the kiln type and fuel type.In general, preheater and precalciner kilns have lower NOx emission rates than long dry and wetkilns due to the higher fuel efficiency and lower firing rates in the kiln firing zone. Due to thehigh temperatures in cement kiln processing, the thermal and prompt portion of thepyroprocessing NOx is substantially higher than its fuel NOx portion.
SO2: The Portland cement industry is in an unusual position of being able to utilize high sulfurcontent fuels while still maintaining low SO2 emissions due to the scrubbing effect (the reactionof the SO2 with CaO formed during the calcination process through disassociation of limestone).

22 ATHENA INSTITUTE: CRADLE-TO-GATE LCI FOR EXTERIOR STUCCO
This scrubbing effect results in negative processing SO2 emissions. Consequently, the totalprocessing SO2 released as gaseous emissions to the atmosphere is substantially lower than SO2
estimated on the basis of fuel and raw materials sulfur uptake, on average reduced by 96.12%.
Similarly, in lime processing, in addition to the fuel emissions there are calcination CO2 andthermal/prompt NOx emissions, as discussed in more detail in Brick and Mortar report.
5.1 3-coat stucco over metal lath
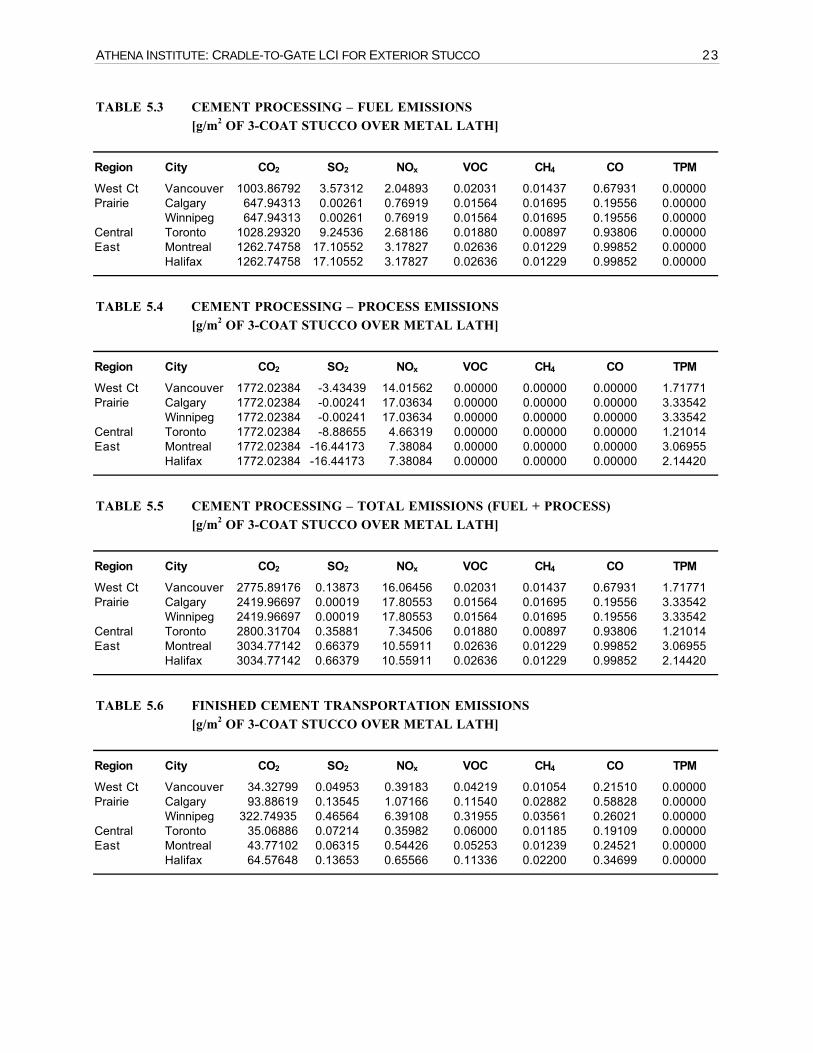
5.1.1 Air emissions from cement productionThe sources of fuel and process emissions from various stages of cement production werediscussed in detail and their estimates developed in the 1993 Institute report on Cement andStructural Concrete, and updated in the 1999 report. Here in the Tables below the estimates fromthose cement LCIs were converted and expressed in g/m2 of the stucco wall finish.
We show here the emissions due to cement production on a regional basis, perhaps in more detailthan necessary, for all the processing steps. The fuel versus process emissions, both in themanufacturing step and in the total emissions, are also highlighted.
TABLE 5.1 CEMENT RAW MATERIALS EXTRACTION EMISSIONS[g/m2 OF 3-COAT STUCCO OVER METAL LATH]
Region City CO2 SO2 NOx VOC CH4 CO TPM
West Ct Vancouver 11.22263 0.01619 0.12810 0.01379 0.00344 0.07032 1.81350Prairie Calgary 11.19994 0.01616 0.12784 0.01377 0.00344 0.07018 1.81350
Winnipeg 11.19994 0.01616 0.12784 0.01377 0.00344 0.07018 1.81350Central Toronto 11.18142 0.01613 0.12763 0.01374 0.00343 0.07006 1.81350East Montreal 11.09374 0.01601 0.12663 0.01364 0.00341 0.06951 1.81350
Halifax 11.09374 0.01601 0.12663 0.01364 0.00341 0.06951 1.81350
TABLE 5.2 CEMENT RAW MATERIALS TRANSPORTATION EMISSIONS[g/m2 OF 3-COAT STUCCO OVER METAL LATH]
Region City CO2 SO2 NOx VOC CH4 CO TPM
West Ct Vancouver 23.53131 0.13363 0.08256 0.10703 0.01222 0.01415 0.00000Prairie Calgary 56.48935 0.08150 1.04233 0.05810 0.00802 0.09519 0.00000
Winnipeg 56.48935 0.08150 1.04233 0.05810 0.00802 0.09519 0.00000Central Toronto 16.65244 0.05844 0.13810 0.04708 0.00655 0.05036 0.00000East Montreal 5.81412 0.01744 0.04937 0.01424 0.00224 0.02440 0.00000
Halifax 5.81412 0.01744 0.04937 0.01424 0.00224 0.02440 0.00000
ATHENA INSTITUTE: CRADLE-TO-GATE LCI FOR EXTERIOR STUCCO 23
TABLE 5.3 CEMENT PROCESSING – FUEL EMISSIONS[g/m2 OF 3-COAT STUCCO OVER METAL LATH]
Region City CO2 SO2 NOx VOC CH4 CO TPM
West Ct Vancouver 1003.86792 3.57312 2.04893 0.02031 0.01437 0.67931 0.00000Prairie Calgary 647.94313 0.00261 0.76919 0.01564 0.01695 0.19556 0.00000
Winnipeg 647.94313 0.00261 0.76919 0.01564 0.01695 0.19556 0.00000Central Toronto 1028.29320 9.24536 2.68186 0.01880 0.00897 0.93806 0.00000East Montreal 1262.74758 17.10552 3.17827 0.02636 0.01229 0.99852 0.00000
Halifax 1262.74758 17.10552 3.17827 0.02636 0.01229 0.99852 0.00000
TABLE 5.4 CEMENT PROCESSING – PROCESS EMISSIONS[g/m2 OF 3-COAT STUCCO OVER METAL LATH]
Region City CO2 SO2 NOx VOC CH4 CO TPM
West Ct Vancouver 1772.02384 -3.43439 14.01562 0.00000 0.00000 0.00000 1.71771Prairie Calgary 1772.02384 -0.00241 17.03634 0.00000 0.00000 0.00000 3.33542
Winnipeg 1772.02384 -0.00241 17.03634 0.00000 0.00000 0.00000 3.33542Central Toronto 1772.02384 -8.88655 4.66319 0.00000 0.00000 0.00000 1.21014East Montreal 1772.02384 -16.44173 7.38084 0.00000 0.00000 0.00000 3.06955
Halifax 1772.02384 -16.44173 7.38084 0.00000 0.00000 0.00000 2.14420
TABLE 5.5 CEMENT PROCESSING – TOTAL EMISSIONS (FUEL + PROCESS)[g/m2 OF 3-COAT STUCCO OVER METAL LATH]
Region City CO2 SO2 NOx VOC CH4 CO TPM
West Ct Vancouver 2775.89176 0.13873 16.06456 0.02031 0.01437 0.67931 1.71771Prairie Calgary 2419.96697 0.00019 17.80553 0.01564 0.01695 0.19556 3.33542
Winnipeg 2419.96697 0.00019 17.80553 0.01564 0.01695 0.19556 3.33542Central Toronto 2800.31704 0.35881 7.34506 0.01880 0.00897 0.93806 1.21014East Montreal 3034.77142 0.66379 10.55911 0.02636 0.01229 0.99852 3.06955
Halifax 3034.77142 0.66379 10.55911 0.02636 0.01229 0.99852 2.14420
TABLE 5.6 FINISHED CEMENT TRANSPORTATION EMISSIONS[g/m2 OF 3-COAT STUCCO OVER METAL LATH]
Region City CO2 SO2 NOx VOC CH4 CO TPM
West Ct Vancouver 34.32799 0.04953 0.39183 0.04219 0.01054 0.21510 0.00000Prairie Calgary 93.88619 0.13545 1.07166 0.11540 0.02882 0.58828 0.00000
Winnipeg 322.74935 0.46564 6.39108 0.31955 0.03561 0.26021 0.00000Central Toronto 35.06886 0.07214 0.35982 0.06000 0.01185 0.19109 0.00000East Montreal 43.77102 0.06315 0.54426 0.05253 0.01239 0.24521 0.00000
Halifax 64.57648 0.13653 0.65566 0.11336 0.02200 0.34699 0.00000
24 ATHENA INSTITUTE: CRADLE-TO-GATE LCI FOR EXTERIOR STUCCO
TABLE 5.7 TOTAL EMISSIONS DUE TO PRODUCTION OF CEMENT[g/m2 OF 3-COAT STUCCO OVER METAL LATH]
Region City CO2 SO2 NOx VOC CH4 CO TPM
West Ct Vancouver 2844.97368 0.33808 16.66706 0.18333 0.04056 0.97888 3.53121Prairie Calgary 2581.54245 0.23330 20.04735 0.20291 0.05722 0.94921 5.14893
Winnipeg 2810.40561 0.56348 25.36677 0.40707 0.06401 0.62113 5.14893Central Toronto 2863.21976 0.50553 7.97060 0.13962 0.03080 1.24957 3.02364East Montreal 3095.45030 0.76038 11.27936 0.10677 0.03033 1.33764 4.88305
Halifax 3116.25576 0.83376 11.39076 0.16760 0.03994 1.43941 3.95771
TABLE 5.8 BREAKDOWN OF CEMENT CO2, SO2 AND NOx FUEL AND PROCESS EMISSIONS[g/m2 OF 3-COAT STUCCO OVER METAL LATH]
Region CityFuelCO2
ProcessCO2
TotalCO2
FuelSO2
ProcessSO2
TotalSO2
FuelNOx
ProcessNOx
TotalNOx
West Ct Vancouver 1072.94985 1772.02384 2844.97368 3.77247 -3.43439 0.33808 2.65143 14.01562 16.66706Prairie Calgary 809.51861 1772.02384 2581.54245 0.23571 -0.00241 0.23330 3.01101 17.03634 20.04735
Winnipeg 1038.38177 1772.02384 2810.40561 0.56590 -0.00241 0.56348 8.33043 17.03634 25.36677Central Toronto 1091.19592 1772.02384 2863.21976 9.39208 -8.88655 0.50553 3.30740 4.66319 7.97060East Montreal 1323.42646 1772.02384 3095.45030 17.20211 -16.44173 0.76038 3.89852 7.38084 11.27936
Halifax 1344.23192 1772.02384 3116.25576 17.27549 -16.44173 0.83376 4.00992 7.38084 11.39076
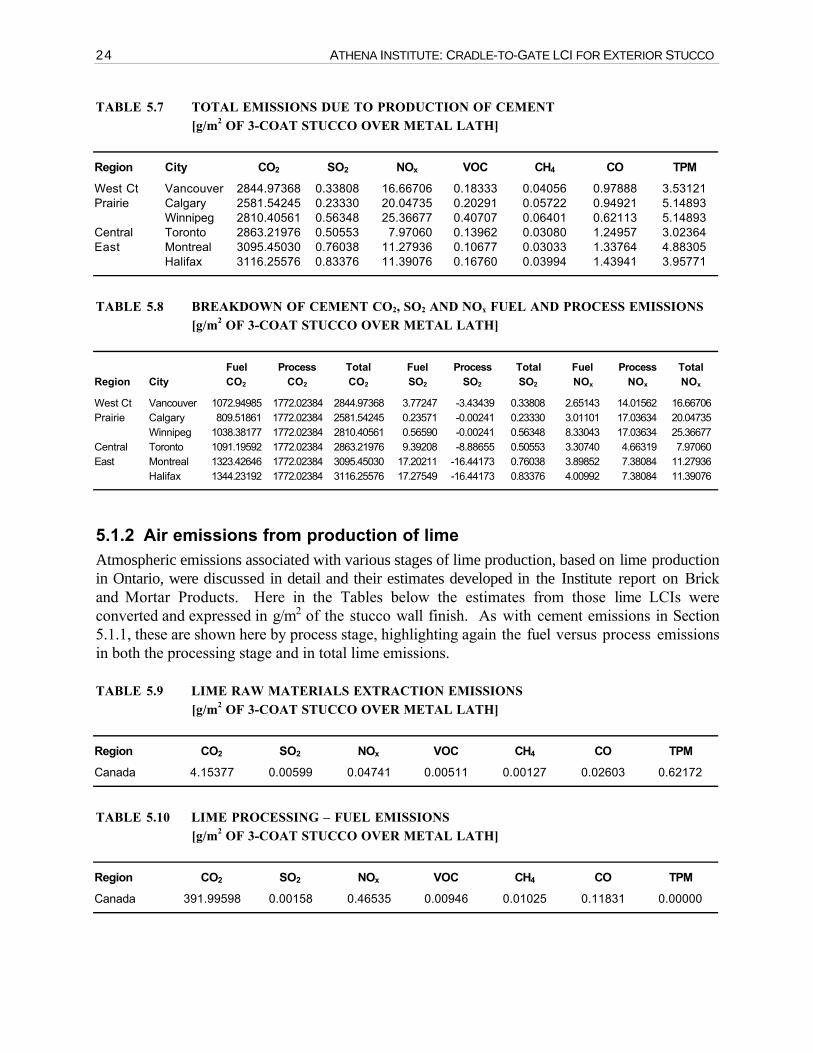
5.1.2 Air emissions from production of limeAtmospheric emissions associated with various stages of lime production, based on lime productionin Ontario, were discussed in detail and their estimates developed in the Institute report on Brickand Mortar Products. Here in the Tables below the estimates from those lime LCIs wereconverted and expressed in g/m2 of the stucco wall finish. As with cement emissions in Section5.1.1, these are shown here by process stage, highlighting again the fuel versus process emissionsin both the processing stage and in total lime emissions.
TABLE 5.9 LIME RAW MATERIALS EXTRACTION EMISSIONS[g/m2 OF 3-COAT STUCCO OVER METAL LATH]
Region CO2 SO2 NOx VOC CH4 CO TPM
Canada 4.15377 0.00599 0.04741 0.00511 0.00127 0.02603 0.62172
TABLE 5.10 LIME PROCESSING – FUEL EMISSIONS[g/m2 OF 3-COAT STUCCO OVER METAL LATH]
Region CO2 SO2 NOx VOC CH4 CO TPM
Canada 391.99598 0.00158 0.46535 0.00946 0.01025 0.11831 0.00000
ATHENA INSTITUTE: CRADLE-TO-GATE LCI FOR EXTERIOR STUCCO 25
TABLE 5.11 LIME PROCESSING – PROCESS EMISSIONS[g/m2 OF 3-COAT STUCCO OVER METAL LATH]
Region CO2 SO2 NOx VOC CH4 CO TPM
Canada 956.95425 0.00000 1.00563 0.00000 0.00000 0.00000 1.45591
TABLE 5.12 LIME PROCESSING – TOTAL EMISSIONS (FUEL + PROCESS)[g/m2 OF 3-COAT STUCCO OVER METAL LATH]
Region CO2 SO2 NOx VOC CH4 CO TPM
Canada 1348.95023 0.00158 1.47098 0.00946 0.01025 0.11831 1.45591
TABLE 5.13 FINISHED LIME TRANSPORTATION EMISSIONS[g/m2 OF 3-COAT STUCCO OVER METAL LATH]
Region CO2 SO2 NOx VOC CH4 CO TPM
Canada 13.22104 0.01907 0.15091 0.01625 0.00406 0.08284 0.00000-
TABLE 5.14 TOTAL EMISSIONS DUE TO PRODUCTION OF LIME[g/m2 OF 3-COAT STUCCO OVER METAL LATH]
Region CO2 SO2 NOx VOC CH4 CO TPM
Canada 1366.32505 0.02664 1.66930 0.03082 0.01559 0.22718 2.07763
TABLE 5.15 BREAKDOWN OF LIME CO2, SO2 AND NOx FUEL AND PROCESS EMISSIONS[g/m2 OF 3-COAT STUCCO OVER METAL LATH]
RegionFuelCO2
ProcessCO2
TotalCO2
FuelSO2
ProcessSO2
TotalSO2
FuelNOx
ProcessNOx
TotalNOx
Canada409.37080
956.954251366.32505
0.02664 0.00000 0.026640.66367
1.005631.66930
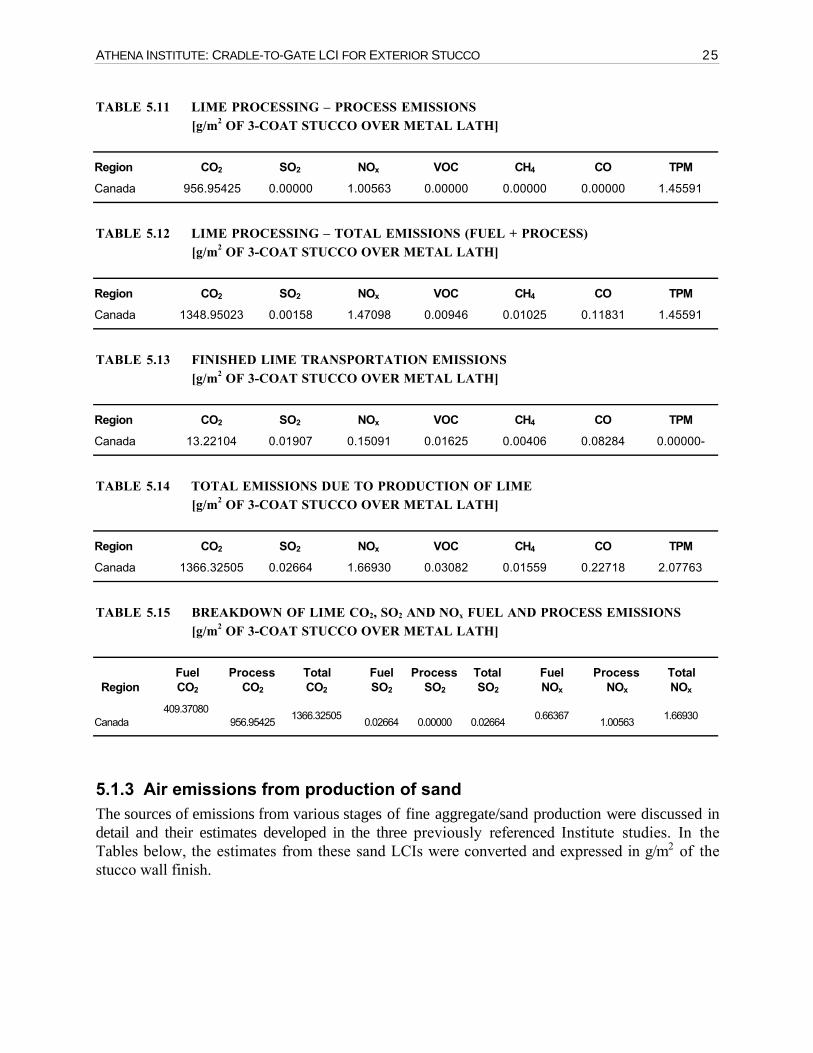
5.1.3 Air emissions from production of sandThe sources of emissions from various stages of fine aggregate/sand production were discussed indetail and their estimates developed in the three previously referenced Institute studies. In theTables below, the estimates from these sand LCIs were converted and expressed in g/m2 of thestucco wall finish.
26 ATHENA INSTITUTE: CRADLE-TO-GATE LCI FOR EXTERIOR STUCCO
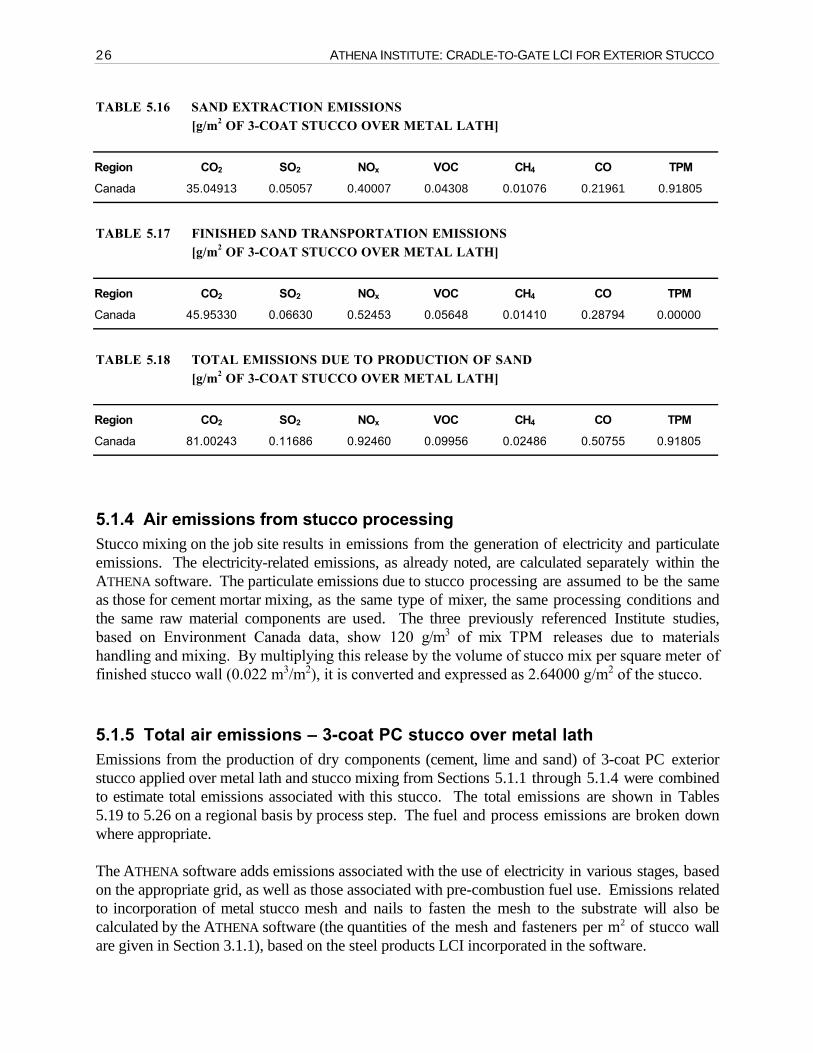
TABLE 5.16 SAND EXTRACTION EMISSIONS[g/m2 OF 3-COAT STUCCO OVER METAL LATH]
Region CO2 SO2 NOx VOC CH4 CO TPM
Canada 35.04913 0.05057 0.40007 0.04308 0.01076 0.21961 0.91805
TABLE 5.17 FINISHED SAND TRANSPORTATION EMISSIONS[g/m2 OF 3-COAT STUCCO OVER METAL LATH]
Region CO2 SO2 NOx VOC CH4 CO TPM
Canada 45.95330 0.06630 0.52453 0.05648 0.01410 0.28794 0.00000
TABLE 5.18 TOTAL EMISSIONS DUE TO PRODUCTION OF SAND[g/m2 OF 3-COAT STUCCO OVER METAL LATH]
Region CO2 SO2 NOx VOC CH4 CO TPM
Canada 81.00243 0.11686 0.92460 0.09956 0.02486 0.50755 0.91805
5.1.4 Air emissions from stucco processingStucco mixing on the job site results in emissions from the generation of electricity and particulateemissions. The electricity-related emissions, as already noted, are calculated separately within theATHENA software. The particulate emissions due to stucco processing are assumed to be the sameas those for cement mortar mixing, as the same type of mixer, the same processing conditions andthe same raw material components are used. The three previously referenced Institute studies,based on Environment Canada data, show 120 g/m3 of mix TPM releases due to materialshandling and mixing. By multiplying this release by the volume of stucco mix per square meter offinished stucco wall (0.022 m3/m2), it is converted and expressed as 2.64000 g/m2 of the stucco.
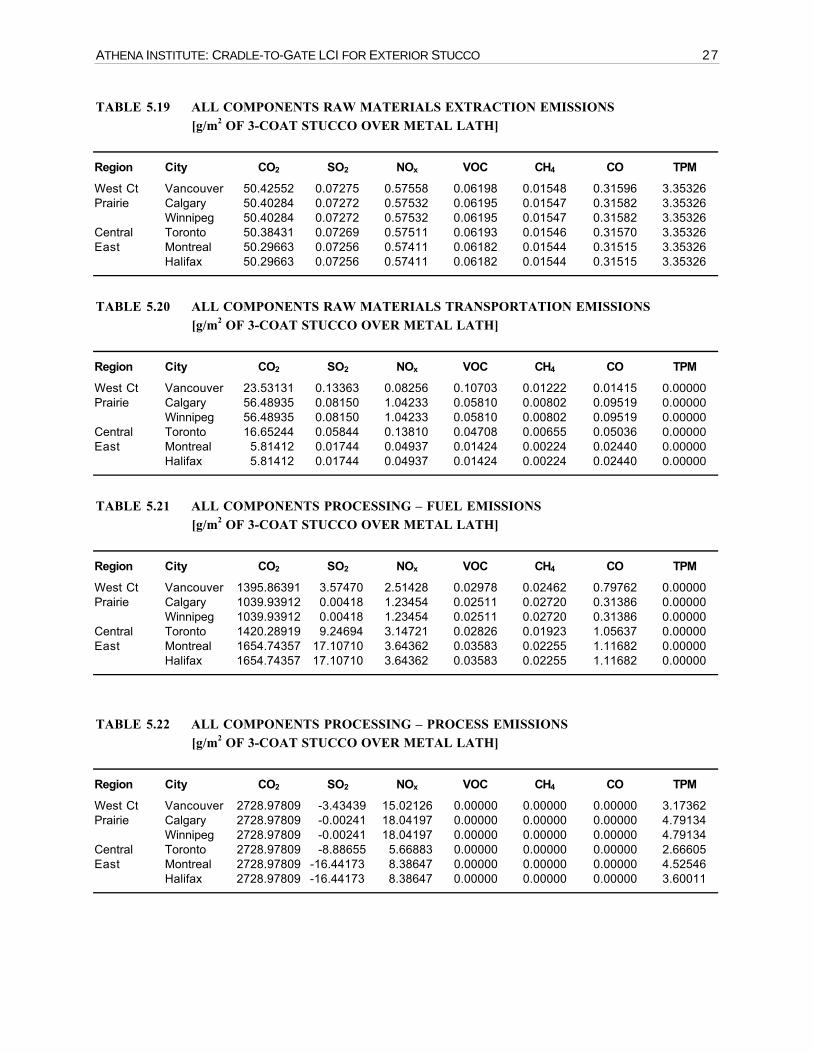
5.1.5 Total air emissions – 3-coat PC stucco over metal lathEmissions from the production of dry components (cement, lime and sand) of 3-coat PC exteriorstucco applied over metal lath and stucco mixing from Sections 5.1.1 through 5.1.4 were combinedto estimate total emissions associated with this stucco. The total emissions are shown in Tables5.19 to 5.26 on a regional basis by process step. The fuel and process emissions are broken downwhere appropriate.
The ATHENA software adds emissions associated with the use of electricity in various stages, basedon the appropriate grid, as well as those associated with pre-combustion fuel use. Emissions relatedto incorporation of metal stucco mesh and nails to fasten the mesh to the substrate will also becalculated by the ATHENA software (the quantities of the mesh and fasteners per m2 of stucco wallare given in Section 3.1.1), based on the steel products LCI incorporated in the software.
ATHENA INSTITUTE: CRADLE-TO-GATE LCI FOR EXTERIOR STUCCO 27
TABLE 5.19 ALL COMPONENTS RAW MATERIALS EXTRACTION EMISSIONS[g/m2 OF 3-COAT STUCCO OVER METAL LATH]
Region City CO2 SO2 NOx VOC CH4 CO TPM
West Ct Vancouver 50.42552 0.07275 0.57558 0.06198 0.01548 0.31596 3.35326Prairie Calgary 50.40284 0.07272 0.57532 0.06195 0.01547 0.31582 3.35326
Winnipeg 50.40284 0.07272 0.57532 0.06195 0.01547 0.31582 3.35326Central Toronto 50.38431 0.07269 0.57511 0.06193 0.01546 0.31570 3.35326East Montreal 50.29663 0.07256 0.57411 0.06182 0.01544 0.31515 3.35326
Halifax 50.29663 0.07256 0.57411 0.06182 0.01544 0.31515 3.35326
TABLE 5.20 ALL COMPONENTS RAW MATERIALS TRANSPORTATION EMISSIONS[g/m2 OF 3-COAT STUCCO OVER METAL LATH]
Region City CO2 SO2 NOx VOC CH4 CO TPM
West Ct Vancouver 23.53131 0.13363 0.08256 0.10703 0.01222 0.01415 0.00000Prairie Calgary 56.48935 0.08150 1.04233 0.05810 0.00802 0.09519 0.00000
Winnipeg 56.48935 0.08150 1.04233 0.05810 0.00802 0.09519 0.00000Central Toronto 16.65244 0.05844 0.13810 0.04708 0.00655 0.05036 0.00000East Montreal 5.81412 0.01744 0.04937 0.01424 0.00224 0.02440 0.00000
Halifax 5.81412 0.01744 0.04937 0.01424 0.00224 0.02440 0.00000
TABLE 5.21 ALL COMPONENTS PROCESSING – FUEL EMISSIONS[g/m2 OF 3-COAT STUCCO OVER METAL LATH]
Region City CO2 SO2 NOx VOC CH4 CO TPM
West Ct Vancouver 1395.86391 3.57470 2.51428 0.02978 0.02462 0.79762 0.00000Prairie Calgary 1039.93912 0.00418 1.23454 0.02511 0.02720 0.31386 0.00000
Winnipeg 1039.93912 0.00418 1.23454 0.02511 0.02720 0.31386 0.00000Central Toronto 1420.28919 9.24694 3.14721 0.02826 0.01923 1.05637 0.00000East Montreal 1654.74357 17.10710 3.64362 0.03583 0.02255 1.11682 0.00000
Halifax 1654.74357 17.10710 3.64362 0.03583 0.02255 1.11682 0.00000
TABLE 5.22 ALL COMPONENTS PROCESSING – PROCESS EMISSIONS[g/m2 OF 3-COAT STUCCO OVER METAL LATH]
Region City CO2 SO2 NOx VOC CH4 CO TPM
West Ct Vancouver 2728.97809 -3.43439 15.02126 0.00000 0.00000 0.00000 3.17362Prairie Calgary 2728.97809 -0.00241 18.04197 0.00000 0.00000 0.00000 4.79134
Winnipeg 2728.97809 -0.00241 18.04197 0.00000 0.00000 0.00000 4.79134Central Toronto 2728.97809 -8.88655 5.66883 0.00000 0.00000 0.00000 2.66605East Montreal 2728.97809 -16.44173 8.38647 0.00000 0.00000 0.00000 4.52546
Halifax 2728.97809 -16.44173 8.38647 0.00000 0.00000 0.00000 3.60011

28 ATHENA INSTITUTE: CRADLE-TO-GATE LCI FOR EXTERIOR STUCCO
TABLE 5.23 ALL COMPONENTS PROCESSING – TOTAL EMISSIONS (FUEL + PROCESS)[g/m2 OF 3-COAT STUCCO OVER METAL LATH]
Region City CO2 SO2 NOx VOC CH4 CO TPM
West Ct Vancouver 4124.84199 0.14031 17.53554 0.02978 0.02462 0.79762 3.17362Prairie Calgary 3768.91720 0.00177 19.27651 0.02511 0.02720 0.31386 4.79134
Winnipeg 3768.91720 0.00177 19.27651 0.02511 0.02720 0.31386 4.79134Central Toronto 4149.26728 0.36039 8.81603 0.02826 0.01923 1.05637 2.66605East Montreal 4383.72166 0.66536 12.03009 0.03583 0.02255 1.11682 4.52546
Halifax 4383.72166 0.66536 12.03009 0.03583 0.02255 1.11682 3.60011
TABLE 5.24 ALL FINISHED COMPONENTS TRANSPORTATION EMISSIONS[g/m2 OF 3-COAT STUCCO OVER METAL LATH]
Region City CO2 SO2 NOx VOC CH4 CO TPM
West Ct Vancouver 93.50233 0.13490 1.06728 0.11493 0.02870 0.58588 0.00000Prairie Calgary 153.06054 0.22082 1.74710 0.18813 0.04698 0.95906 0.00000
Winnipeg 381.92370 0.55101 7.06652 0.39229 0.05377 0.63099 0.00000Central Toronto 94.24321 0.15752 1.03526 0.13273 0.03001 0.56187 0.00000East Montreal 102.94536 0.14852 1.21970 0.12526 0.03055 0.61599 0.00000
Halifax 123.75082 0.22190 1.33110 0.18610 0.04017 0.71777 0.00000
EMISSIONS DUE TO STUCCO MIXINGEmissions due to the mixing of stucco are calculated to be 2.64000 kg/m2 of 3-coat stucco over metal lath.
TABLE 5.25 TOTAL EMISSIONS DUE TO PRODUCTION OF STUCCO[g/m2 OF 3-COAT STUCCO OVER METAL LATH]
Region City CO2 SO2 NOx VOC CH4 CO TPM
West Ct Vancouver 4292.30116 0.48159 19.26096 0.31371 0.08101 1.71362 9.16688Prairie Calgary 4028.86992 0.37681 22.64125 0.33330 0.09767 1.68394 10.78460
Winnipeg 4257.73308 0.70699 27.96067 0.53745 0.10446 1.35587 10.78460Central Toronto 4310.54723 0.64904 10.56449 0.27000 0.07125 1.98430 8.65932East Montreal 4542.77777 0.90389 13.87326 0.23715 0.07078 2.07237 10.51873
Halifax 4563.58323 0.97727 13.98466 0.29798 0.08039 2.17414 9.59338
ATHENA INSTITUTE: CRADLE-TO-GATE LCI FOR EXTERIOR STUCCO 29
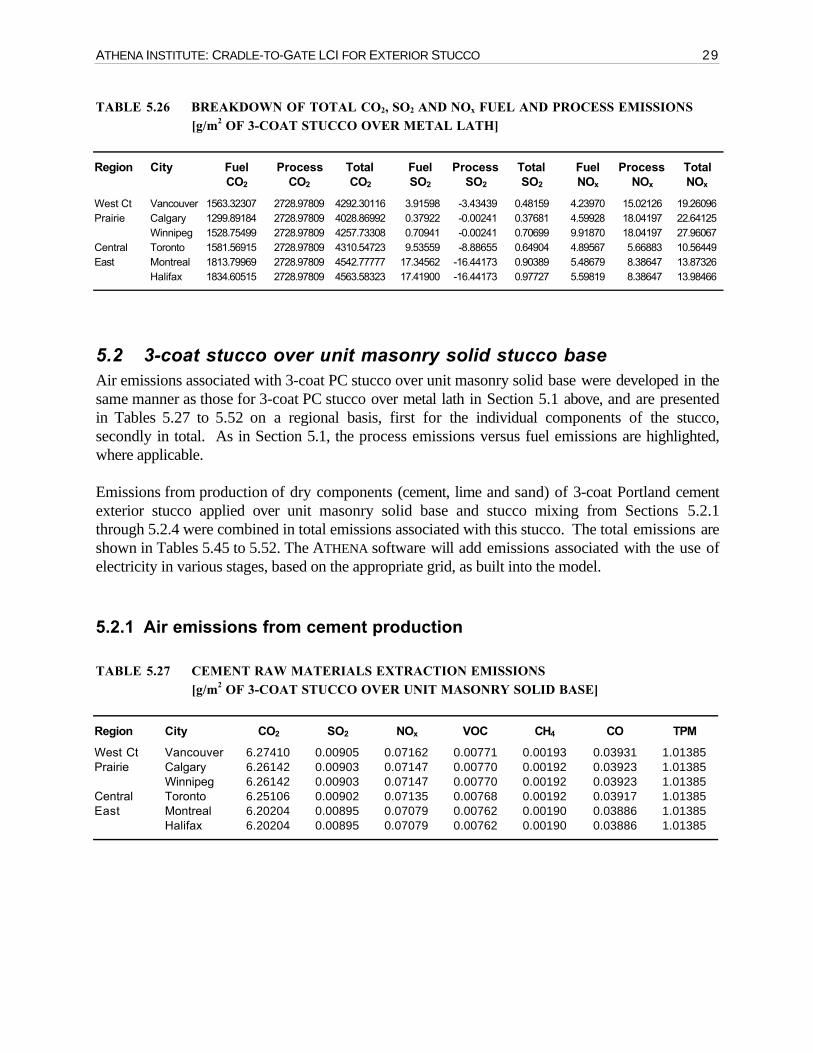
TABLE 5.26 BREAKDOWN OF TOTAL CO2, SO2 AND NOx FUEL AND PROCESS EMISSIONS[g/m2 OF 3-COAT STUCCO OVER METAL LATH]
Region City FuelCO2
ProcessCO2
TotalCO2
FuelSO2
ProcessSO2
TotalSO2
FuelNOx
ProcessNOx
TotalNOx
West Ct Vancouver 1563.32307 2728.97809 4292.30116 3.91598 -3.43439 0.48159 4.23970 15.02126 19.26096Prairie Calgary 1299.89184 2728.97809 4028.86992 0.37922 -0.00241 0.37681 4.59928 18.04197 22.64125
Winnipeg 1528.75499 2728.97809 4257.73308 0.70941 -0.00241 0.70699 9.91870 18.04197 27.96067Central Toronto 1581.56915 2728.97809 4310.54723 9.53559 -8.88655 0.64904 4.89567 5.66883 10.56449East Montreal 1813.79969 2728.97809 4542.77777 17.34562 -16.44173 0.90389 5.48679 8.38647 13.87326
Halifax 1834.60515 2728.97809 4563.58323 17.41900 -16.44173 0.97727 5.59819 8.38647 13.98466
5.2 3-coat stucco over unit masonry solid stucco baseAir emissions associated with 3-coat PC stucco over unit masonry solid base were developed in thesame manner as those for 3-coat PC stucco over metal lath in Section 5.1 above, and are presentedin Tables 5.27 to 5.52 on a regional basis, first for the individual components of the stucco,secondly in total. As in Section 5.1, the process emissions versus fuel emissions are highlighted,where applicable.
Emissions from production of dry components (cement, lime and sand) of 3-coat Portland cementexterior stucco applied over unit masonry solid base and stucco mixing from Sections 5.2.1through 5.2.4 were combined in total emissions associated with this stucco. The total emissions areshown in Tables 5.45 to 5.52. The ATHENA software will add emissions associated with the use ofelectricity in various stages, based on the appropriate grid, as built into the model.
5.2.1 Air emissions from cement production
TABLE 5.27 CEMENT RAW MATERIALS EXTRACTION EMISSIONS[g/m2 OF 3-COAT STUCCO OVER UNIT MASONRY SOLID BASE]
Region City CO2 SO2 NOx VOC CH4 CO TPM
West Ct Vancouver 6.27410 0.00905 0.07162 0.00771 0.00193 0.03931 1.01385Prairie Calgary 6.26142 0.00903 0.07147 0.00770 0.00192 0.03923 1.01385
Winnipeg 6.26142 0.00903 0.07147 0.00770 0.00192 0.03923 1.01385Central Toronto 6.25106 0.00902 0.07135 0.00768 0.00192 0.03917 1.01385East Montreal 6.20204 0.00895 0.07079 0.00762 0.00190 0.03886 1.01385
Halifax 6.20204 0.00895 0.07079 0.00762 0.00190 0.03886 1.01385
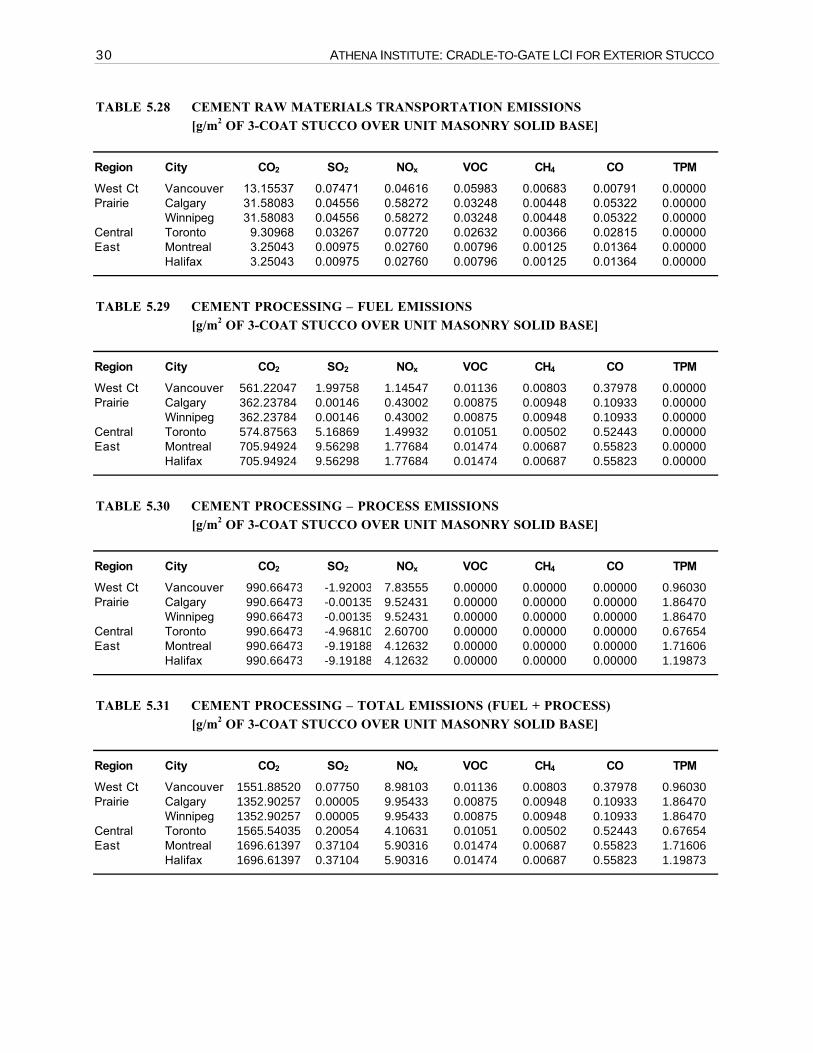
30 ATHENA INSTITUTE: CRADLE-TO-GATE LCI FOR EXTERIOR STUCCO
TABLE 5.28 CEMENT RAW MATERIALS TRANSPORTATION EMISSIONS[g/m2 OF 3-COAT STUCCO OVER UNIT MASONRY SOLID BASE]
Region City CO2 SO2 NOx VOC CH4 CO TPM
West Ct Vancouver 13.15537 0.07471 0.04616 0.05983 0.00683 0.00791 0.00000Prairie Calgary 31.58083 0.04556 0.58272 0.03248 0.00448 0.05322 0.00000
Winnipeg 31.58083 0.04556 0.58272 0.03248 0.00448 0.05322 0.00000Central Toronto 9.30968 0.03267 0.07720 0.02632 0.00366 0.02815 0.00000East Montreal 3.25043 0.00975 0.02760 0.00796 0.00125 0.01364 0.00000
Halifax 3.25043 0.00975 0.02760 0.00796 0.00125 0.01364 0.00000
TABLE 5.29 CEMENT PROCESSING – FUEL EMISSIONS[g/m2 OF 3-COAT STUCCO OVER UNIT MASONRY SOLID BASE]
Region City CO2 SO2 NOx VOC CH4 CO TPM
West Ct Vancouver 561.22047 1.99758 1.14547 0.01136 0.00803 0.37978 0.00000Prairie Calgary 362.23784 0.00146 0.43002 0.00875 0.00948 0.10933 0.00000
Winnipeg 362.23784 0.00146 0.43002 0.00875 0.00948 0.10933 0.00000Central Toronto 574.87563 5.16869 1.49932 0.01051 0.00502 0.52443 0.00000East Montreal 705.94924 9.56298 1.77684 0.01474 0.00687 0.55823 0.00000
Halifax 705.94924 9.56298 1.77684 0.01474 0.00687 0.55823 0.00000
TABLE 5.30 CEMENT PROCESSING – PROCESS EMISSIONS[g/m2 OF 3-COAT STUCCO OVER UNIT MASONRY SOLID BASE]
Region City CO2 SO2 NOx VOC CH4 CO TPM
West Ct Vancouver 990.66473 -1.92003 7.83555 0.00000 0.00000 0.00000 0.96030Prairie Calgary 990.66473 -0.00135 9.52431 0.00000 0.00000 0.00000 1.86470
Winnipeg 990.66473 -0.00135 9.52431 0.00000 0.00000 0.00000 1.86470Central Toronto 990.66473 -4.96810 2.60700 0.00000 0.00000 0.00000 0.67654East Montreal 990.66473 -9.19188 4.12632 0.00000 0.00000 0.00000 1.71606
Halifax 990.66473 -9.19188 4.12632 0.00000 0.00000 0.00000 1.19873
TABLE 5.31 CEMENT PROCESSING – TOTAL EMISSIONS (FUEL + PROCESS)[g/m2 OF 3-COAT STUCCO OVER UNIT MASONRY SOLID BASE]
Region City CO2 SO2 NOx VOC CH4 CO TPM
West Ct Vancouver 1551.88520 0.07750 8.98103 0.01136 0.00803 0.37978 0.96030Prairie Calgary 1352.90257 0.00005 9.95433 0.00875 0.00948 0.10933 1.86470
Winnipeg 1352.90257 0.00005 9.95433 0.00875 0.00948 0.10933 1.86470Central Toronto 1565.54035 0.20054 4.10631 0.01051 0.00502 0.52443 0.67654East Montreal 1696.61397 0.37104 5.90316 0.01474 0.00687 0.55823 1.71606
Halifax 1696.61397 0.37104 5.90316 0.01474 0.00687 0.55823 1.19873
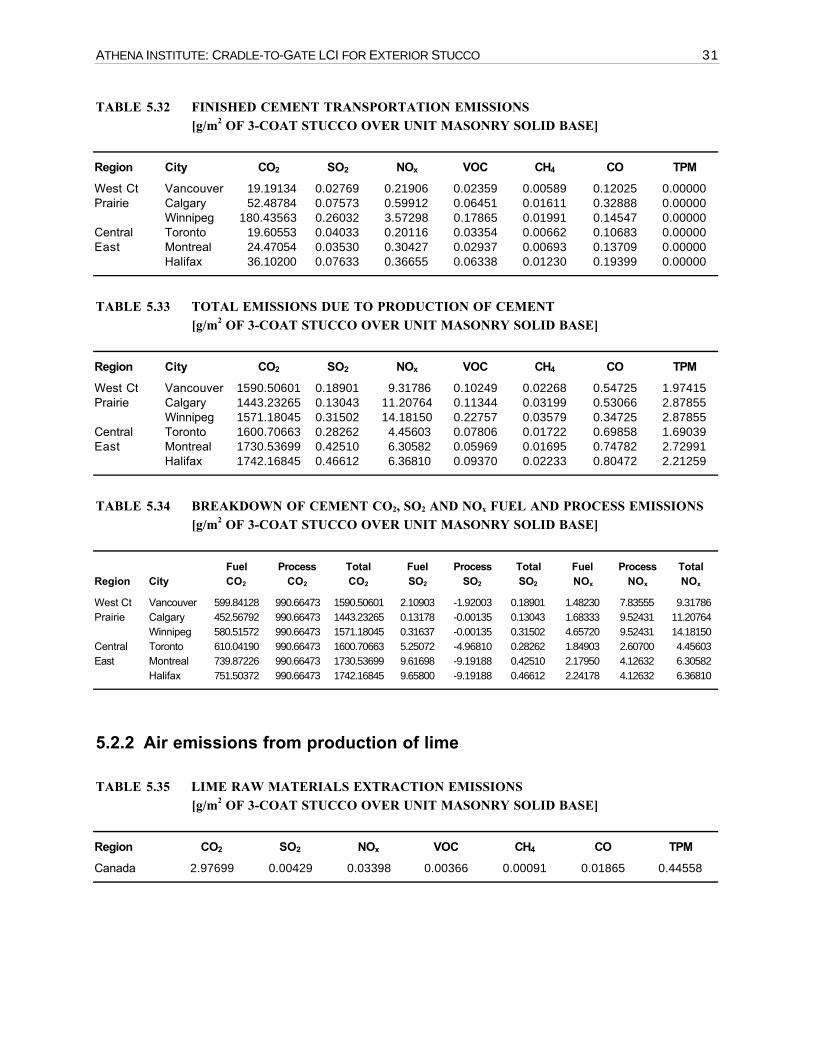
ATHENA INSTITUTE: CRADLE-TO-GATE LCI FOR EXTERIOR STUCCO 31
TABLE 5.32 FINISHED CEMENT TRANSPORTATION EMISSIONS[g/m2 OF 3-COAT STUCCO OVER UNIT MASONRY SOLID BASE]
Region City CO2 SO2 NOx VOC CH4 CO TPM
West Ct Vancouver 19.19134 0.02769 0.21906 0.02359 0.00589 0.12025 0.00000Prairie Calgary 52.48784 0.07573 0.59912 0.06451 0.01611 0.32888 0.00000
Winnipeg 180.43563 0.26032 3.57298 0.17865 0.01991 0.14547 0.00000Central Toronto 19.60553 0.04033 0.20116 0.03354 0.00662 0.10683 0.00000East Montreal 24.47054 0.03530 0.30427 0.02937 0.00693 0.13709 0.00000
Halifax 36.10200 0.07633 0.36655 0.06338 0.01230 0.19399 0.00000
TABLE 5.33 TOTAL EMISSIONS DUE TO PRODUCTION OF CEMENT[g/m2 OF 3-COAT STUCCO OVER UNIT MASONRY SOLID BASE]
Region City CO2 SO2 NOx VOC CH4 CO TPM
West Ct Vancouver 1590.50601 0.18901 9.31786 0.10249 0.02268 0.54725 1.97415Prairie Calgary 1443.23265 0.13043 11.20764 0.11344 0.03199 0.53066 2.87855
Winnipeg 1571.18045 0.31502 14.18150 0.22757 0.03579 0.34725 2.87855Central Toronto 1600.70663 0.28262 4.45603 0.07806 0.01722 0.69858 1.69039East Montreal 1730.53699 0.42510 6.30582 0.05969 0.01695 0.74782 2.72991
Halifax 1742.16845 0.46612 6.36810 0.09370 0.02233 0.80472 2.21259
TABLE 5.34 BREAKDOWN OF CEMENT CO2, SO2 AND NOx FUEL AND PROCESS EMISSIONS[g/m2 OF 3-COAT STUCCO OVER UNIT MASONRY SOLID BASE]
Region CityFuelCO2
ProcessCO2
TotalCO2
FuelSO2
ProcessSO2
TotalSO2
FuelNOx
ProcessNOx
TotalNOx
West Ct Vancouver 599.84128 990.66473 1590.50601 2.10903 -1.92003 0.18901 1.48230 7.83555 9.31786Prairie Calgary 452.56792 990.66473 1443.23265 0.13178 -0.00135 0.13043 1.68333 9.52431 11.20764
Winnipeg 580.51572 990.66473 1571.18045 0.31637 -0.00135 0.31502 4.65720 9.52431 14.18150Central Toronto 610.04190 990.66473 1600.70663 5.25072 -4.96810 0.28262 1.84903 2.60700 4.45603East Montreal 739.87226 990.66473 1730.53699 9.61698 -9.19188 0.42510 2.17950 4.12632 6.30582
Halifax 751.50372 990.66473 1742.16845 9.65800 -9.19188 0.46612 2.24178 4.12632 6.36810
5.2.2 Air emissions from production of lime
TABLE 5.35 LIME RAW MATERIALS EXTRACTION EMISSIONS[g/m2 OF 3-COAT STUCCO OVER UNIT MASONRY SOLID BASE]
Region CO2 SO2 NOx VOC CH4 CO TPM
Canada 2.97699 0.00429 0.03398 0.00366 0.00091 0.01865 0.44558
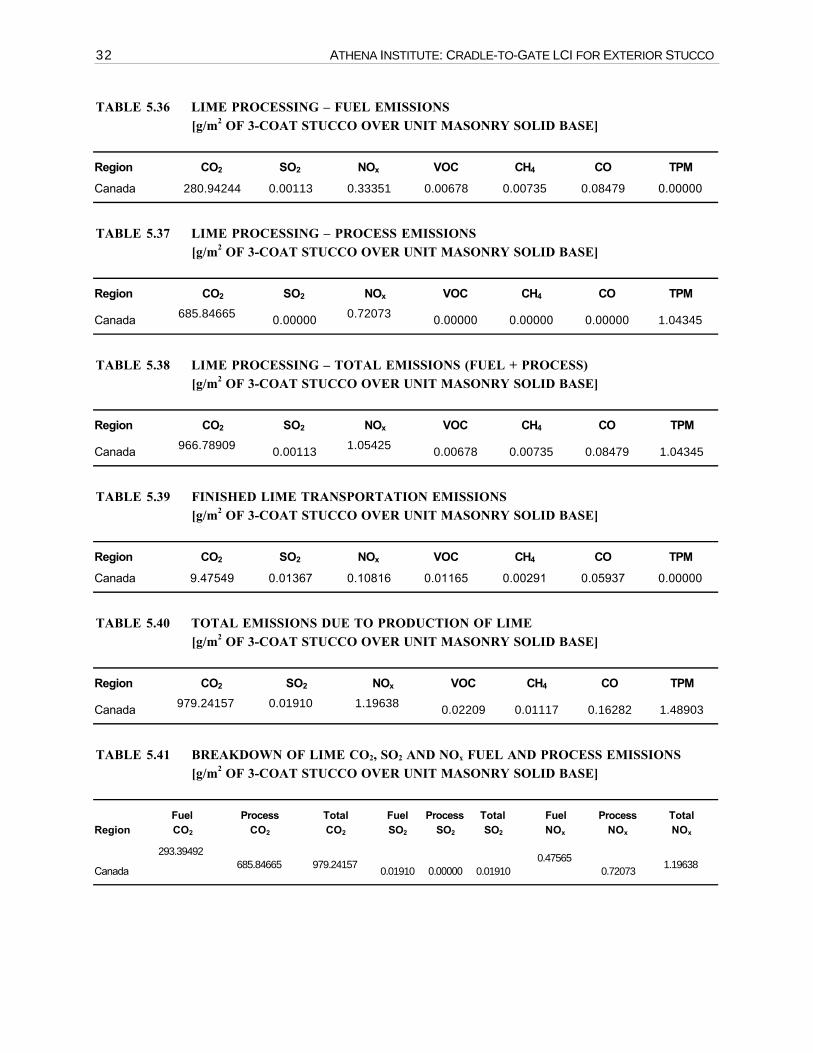
32 ATHENA INSTITUTE: CRADLE-TO-GATE LCI FOR EXTERIOR STUCCO
TABLE 5.36 LIME PROCESSING – FUEL EMISSIONS[g/m2 OF 3-COAT STUCCO OVER UNIT MASONRY SOLID BASE]
Region CO2 SO2 NOx VOC CH4 CO TPM
Canada 280.94244 0.00113 0.33351 0.00678 0.00735 0.08479 0.00000
TABLE 5.37 LIME PROCESSING – PROCESS EMISSIONS[g/m2 OF 3-COAT STUCCO OVER UNIT MASONRY SOLID BASE]
Region CO2 SO2 NOx VOC CH4 CO TPM
Canada 685.84665 0.00000 0.72073 0.00000 0.00000 0.00000 1.04345
TABLE 5.38 LIME PROCESSING – TOTAL EMISSIONS (FUEL + PROCESS)[g/m2 OF 3-COAT STUCCO OVER UNIT MASONRY SOLID BASE]
Region CO2 SO2 NOx VOC CH4 CO TPM
Canada 966.78909 0.00113 1.05425 0.00678 0.00735 0.08479 1.04345
TABLE 5.39 FINISHED LIME TRANSPORTATION EMISSIONS[g/m2 OF 3-COAT STUCCO OVER UNIT MASONRY SOLID BASE]
Region CO2 SO2 NOx VOC CH4 CO TPM
Canada 9.47549 0.01367 0.10816 0.01165 0.00291 0.05937 0.00000
TABLE 5.40 TOTAL EMISSIONS DUE TO PRODUCTION OF LIME[g/m2 OF 3-COAT STUCCO OVER UNIT MASONRY SOLID BASE]
Region CO2 SO2 NOx VOC CH4 CO TPM
Canada 979.24157 0.01910 1.19638 0.02209 0.01117 0.16282 1.48903
TABLE 5.41 BREAKDOWN OF LIME CO2, SO2 AND NOx FUEL AND PROCESS EMISSIONS[g/m2 OF 3-COAT STUCCO OVER UNIT MASONRY SOLID BASE]
RegionFuelCO2
ProcessCO2
TotalCO2
FuelSO2
ProcessSO2
TotalSO2
FuelNOx
ProcessNOx
TotalNOx
Canada
293.39492685.84665 979.24157
0.01910 0.00000 0.019100.47565
0.720731.19638
ATHENA INSTITUTE: CRADLE-TO-GATE LCI FOR EXTERIOR STUCCO 33
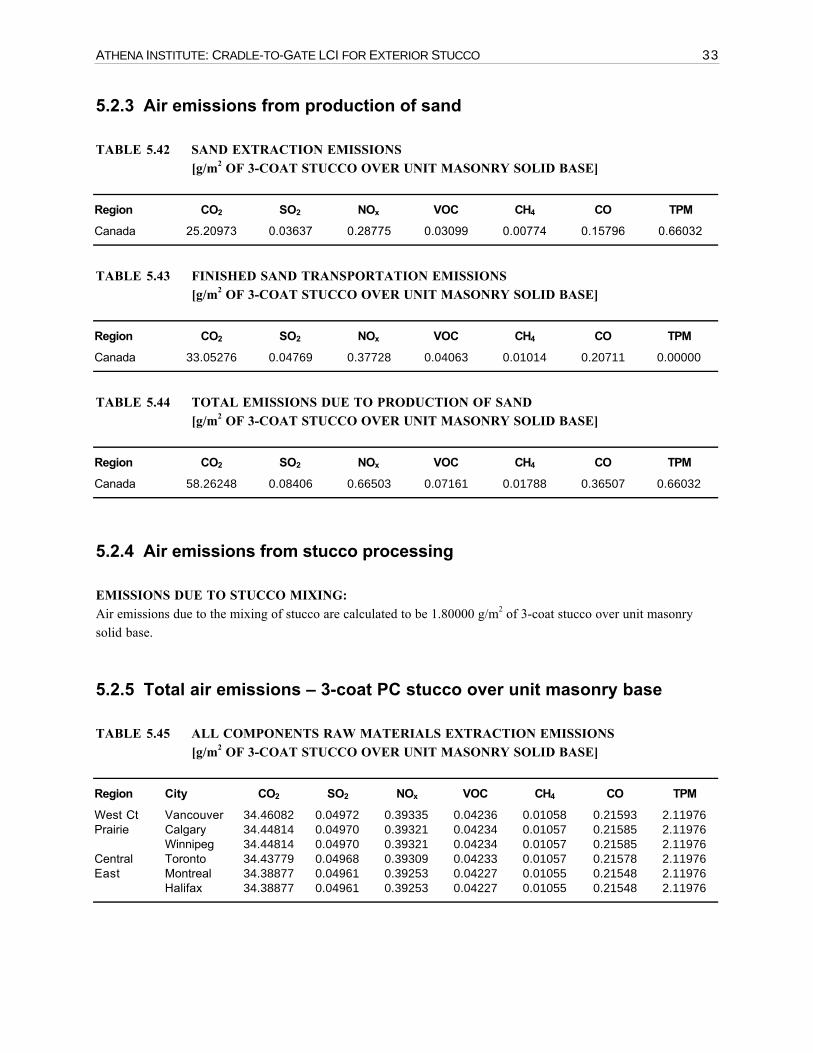
5.2.3 Air emissions from production of sand
TABLE 5.42 SAND EXTRACTION EMISSIONS[g/m2 OF 3-COAT STUCCO OVER UNIT MASONRY SOLID BASE]
Region CO2 SO2 NOx VOC CH4 CO TPM
Canada 25.20973 0.03637 0.28775 0.03099 0.00774 0.15796 0.66032
TABLE 5.43 FINISHED SAND TRANSPORTATION EMISSIONS[g/m2 OF 3-COAT STUCCO OVER UNIT MASONRY SOLID BASE]
Region CO2 SO2 NOx VOC CH4 CO TPM
Canada 33.05276 0.04769 0.37728 0.04063 0.01014 0.20711 0.00000
TABLE 5.44 TOTAL EMISSIONS DUE TO PRODUCTION OF SAND[g/m2 OF 3-COAT STUCCO OVER UNIT MASONRY SOLID BASE]
Region CO2 SO2 NOx VOC CH4 CO TPM
Canada 58.26248 0.08406 0.66503 0.07161 0.01788 0.36507 0.66032
5.2.4 Air emissions from stucco processing
EMISSIONS DUE TO STUCCO MIXING:Air emissions due to the mixing of stucco are calculated to be 1.80000 g/m2 of 3-coat stucco over unit masonrysolid base.
5.2.5 Total air emissions – 3-coat PC stucco over unit masonry base
TABLE 5.45 ALL COMPONENTS RAW MATERIALS EXTRACTION EMISSIONS[g/m2 OF 3-COAT STUCCO OVER UNIT MASONRY SOLID BASE]
Region City CO2 SO2 NOx VOC CH4 CO TPM
West Ct Vancouver 34.46082 0.04972 0.39335 0.04236 0.01058 0.21593 2.11976Prairie Calgary 34.44814 0.04970 0.39321 0.04234 0.01057 0.21585 2.11976
Winnipeg 34.44814 0.04970 0.39321 0.04234 0.01057 0.21585 2.11976Central Toronto 34.43779 0.04968 0.39309 0.04233 0.01057 0.21578 2.11976East Montreal 34.38877 0.04961 0.39253 0.04227 0.01055 0.21548 2.11976
Halifax 34.38877 0.04961 0.39253 0.04227 0.01055 0.21548 2.11976
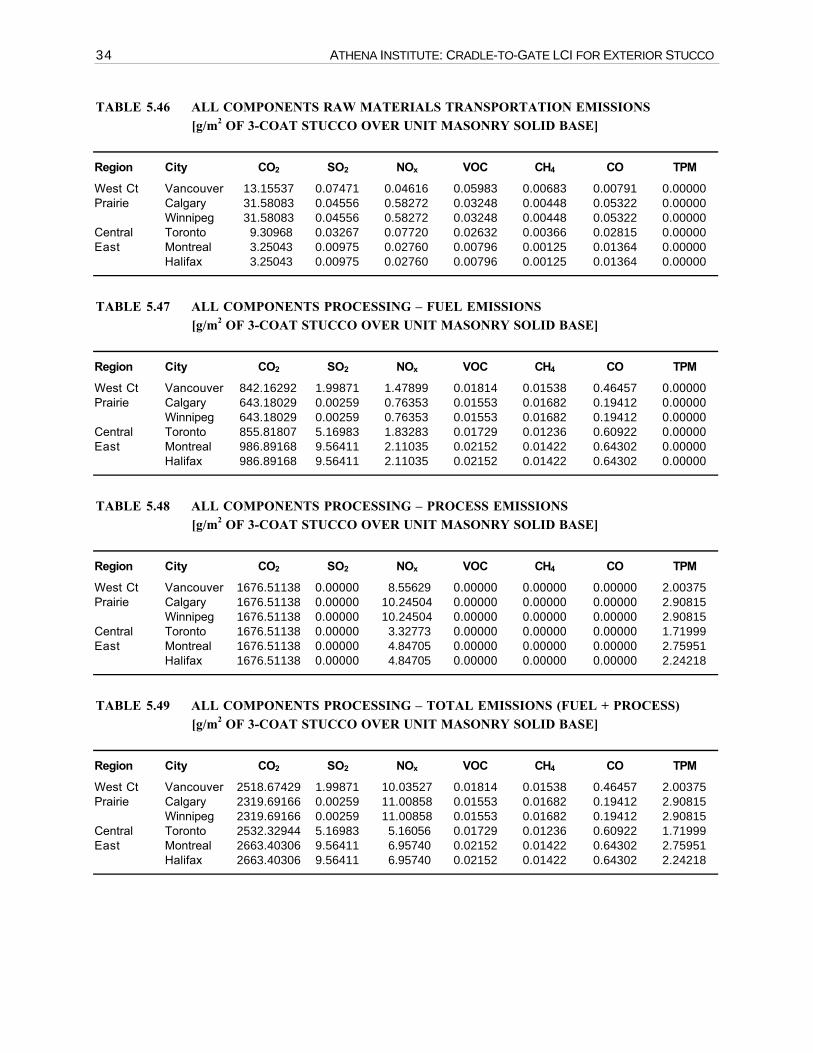
34 ATHENA INSTITUTE: CRADLE-TO-GATE LCI FOR EXTERIOR STUCCO
TABLE 5.46 ALL COMPONENTS RAW MATERIALS TRANSPORTATION EMISSIONS[g/m2 OF 3-COAT STUCCO OVER UNIT MASONRY SOLID BASE]
Region City CO2 SO2 NOx VOC CH4 CO TPM
West Ct Vancouver 13.15537 0.07471 0.04616 0.05983 0.00683 0.00791 0.00000Prairie Calgary 31.58083 0.04556 0.58272 0.03248 0.00448 0.05322 0.00000
Winnipeg 31.58083 0.04556 0.58272 0.03248 0.00448 0.05322 0.00000Central Toronto 9.30968 0.03267 0.07720 0.02632 0.00366 0.02815 0.00000East Montreal 3.25043 0.00975 0.02760 0.00796 0.00125 0.01364 0.00000
Halifax 3.25043 0.00975 0.02760 0.00796 0.00125 0.01364 0.00000
TABLE 5.47 ALL COMPONENTS PROCESSING – FUEL EMISSIONS[g/m2 OF 3-COAT STUCCO OVER UNIT MASONRY SOLID BASE]
Region City CO2 SO2 NOx VOC CH4 CO TPM
West Ct Vancouver 842.16292 1.99871 1.47899 0.01814 0.01538 0.46457 0.00000Prairie Calgary 643.18029 0.00259 0.76353 0.01553 0.01682 0.19412 0.00000
Winnipeg 643.18029 0.00259 0.76353 0.01553 0.01682 0.19412 0.00000Central Toronto 855.81807 5.16983 1.83283 0.01729 0.01236 0.60922 0.00000East Montreal 986.89168 9.56411 2.11035 0.02152 0.01422 0.64302 0.00000
Halifax 986.89168 9.56411 2.11035 0.02152 0.01422 0.64302 0.00000
TABLE 5.48 ALL COMPONENTS PROCESSING – PROCESS EMISSIONS[g/m2 OF 3-COAT STUCCO OVER UNIT MASONRY SOLID BASE]
Region City CO2 SO2 NOx VOC CH4 CO TPM
West Ct Vancouver 1676.51138 0.00000 8.55629 0.00000 0.00000 0.00000 2.00375Prairie Calgary 1676.51138 0.00000 10.24504 0.00000 0.00000 0.00000 2.90815
Winnipeg 1676.51138 0.00000 10.24504 0.00000 0.00000 0.00000 2.90815Central Toronto 1676.51138 0.00000 3.32773 0.00000 0.00000 0.00000 1.71999East Montreal 1676.51138 0.00000 4.84705 0.00000 0.00000 0.00000 2.75951
Halifax 1676.51138 0.00000 4.84705 0.00000 0.00000 0.00000 2.24218
TABLE 5.49 ALL COMPONENTS PROCESSING – TOTAL EMISSIONS (FUEL + PROCESS)[g/m2 OF 3-COAT STUCCO OVER UNIT MASONRY SOLID BASE]
Region City CO2 SO2 NOx VOC CH4 CO TPM
West Ct Vancouver 2518.67429 1.99871 10.03527 0.01814 0.01538 0.46457 2.00375Prairie Calgary 2319.69166 0.00259 11.00858 0.01553 0.01682 0.19412 2.90815
Winnipeg 2319.69166 0.00259 11.00858 0.01553 0.01682 0.19412 2.90815Central Toronto 2532.32944 5.16983 5.16056 0.01729 0.01236 0.60922 1.71999East Montreal 2663.40306 9.56411 6.95740 0.02152 0.01422 0.64302 2.75951
Halifax 2663.40306 9.56411 6.95740 0.02152 0.01422 0.64302 2.24218
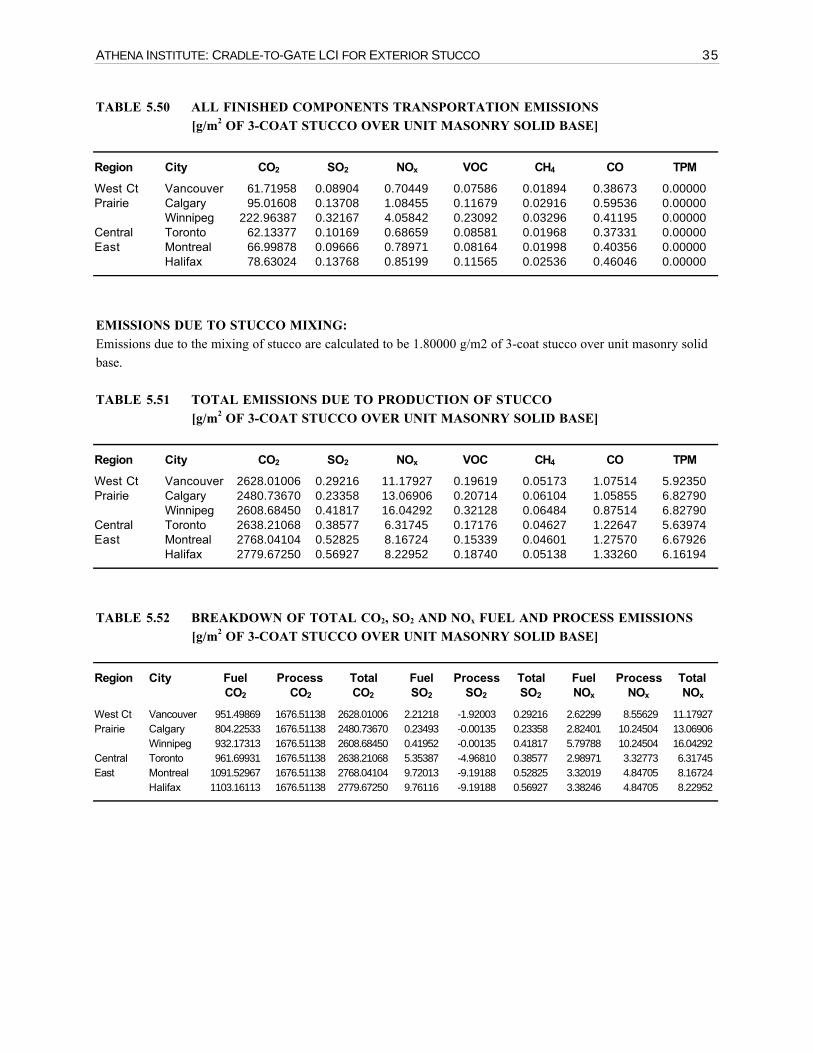
ATHENA INSTITUTE: CRADLE-TO-GATE LCI FOR EXTERIOR STUCCO 35
TABLE 5.50 ALL FINISHED COMPONENTS TRANSPORTATION EMISSIONS[g/m2 OF 3-COAT STUCCO OVER UNIT MASONRY SOLID BASE]
Region City CO2 SO2 NOx VOC CH4 CO TPM
West Ct Vancouver 61.71958 0.08904 0.70449 0.07586 0.01894 0.38673 0.00000Prairie Calgary 95.01608 0.13708 1.08455 0.11679 0.02916 0.59536 0.00000
Winnipeg 222.96387 0.32167 4.05842 0.23092 0.03296 0.41195 0.00000Central Toronto 62.13377 0.10169 0.68659 0.08581 0.01968 0.37331 0.00000East Montreal 66.99878 0.09666 0.78971 0.08164 0.01998 0.40356 0.00000
Halifax 78.63024 0.13768 0.85199 0.11565 0.02536 0.46046 0.00000
EMISSIONS DUE TO STUCCO MIXING:Emissions due to the mixing of stucco are calculated to be 1.80000 g/m2 of 3-coat stucco over unit masonry solidbase.
TABLE 5.51 TOTAL EMISSIONS DUE TO PRODUCTION OF STUCCO[g/m2 OF 3-COAT STUCCO OVER UNIT MASONRY SOLID BASE]
Region City CO2 SO2 NOx VOC CH4 CO TPM
West Ct Vancouver 2628.01006 0.29216 11.17927 0.19619 0.05173 1.07514 5.92350Prairie Calgary 2480.73670 0.23358 13.06906 0.20714 0.06104 1.05855 6.82790
Winnipeg 2608.68450 0.41817 16.04292 0.32128 0.06484 0.87514 6.82790Central Toronto 2638.21068 0.38577 6.31745 0.17176 0.04627 1.22647 5.63974East Montreal 2768.04104 0.52825 8.16724 0.15339 0.04601 1.27570 6.67926
Halifax 2779.67250 0.56927 8.22952 0.18740 0.05138 1.33260 6.16194
TABLE 5.52 BREAKDOWN OF TOTAL CO2, SO2 AND NOx FUEL AND PROCESS EMISSIONS[g/m2 OF 3-COAT STUCCO OVER UNIT MASONRY SOLID BASE]
Region City FuelCO2
ProcessCO2
TotalCO2
FuelSO2
ProcessSO2
TotalSO2
FuelNOx
ProcessNOx
TotalNOx
West Ct Vancouver 951.49869 1676.51138 2628.01006 2.21218 -1.92003 0.29216 2.62299 8.55629 11.17927Prairie Calgary 804.22533 1676.51138 2480.73670 0.23493 -0.00135 0.23358 2.82401 10.24504 13.06906
Winnipeg 932.17313 1676.51138 2608.68450 0.41952 -0.00135 0.41817 5.79788 10.24504 16.04292Central Toronto 961.69931 1676.51138 2638.21068 5.35387 -4.96810 0.38577 2.98971 3.32773 6.31745East Montreal 1091.52967 1676.51138 2768.04104 9.72013 -9.19188 0.52825 3.32019 4.84705 8.16724
Halifax 1103.16113 1676.51138 2779.67250 9.76116 -9.19188 0.56927 3.38246 4.84705 8.22952
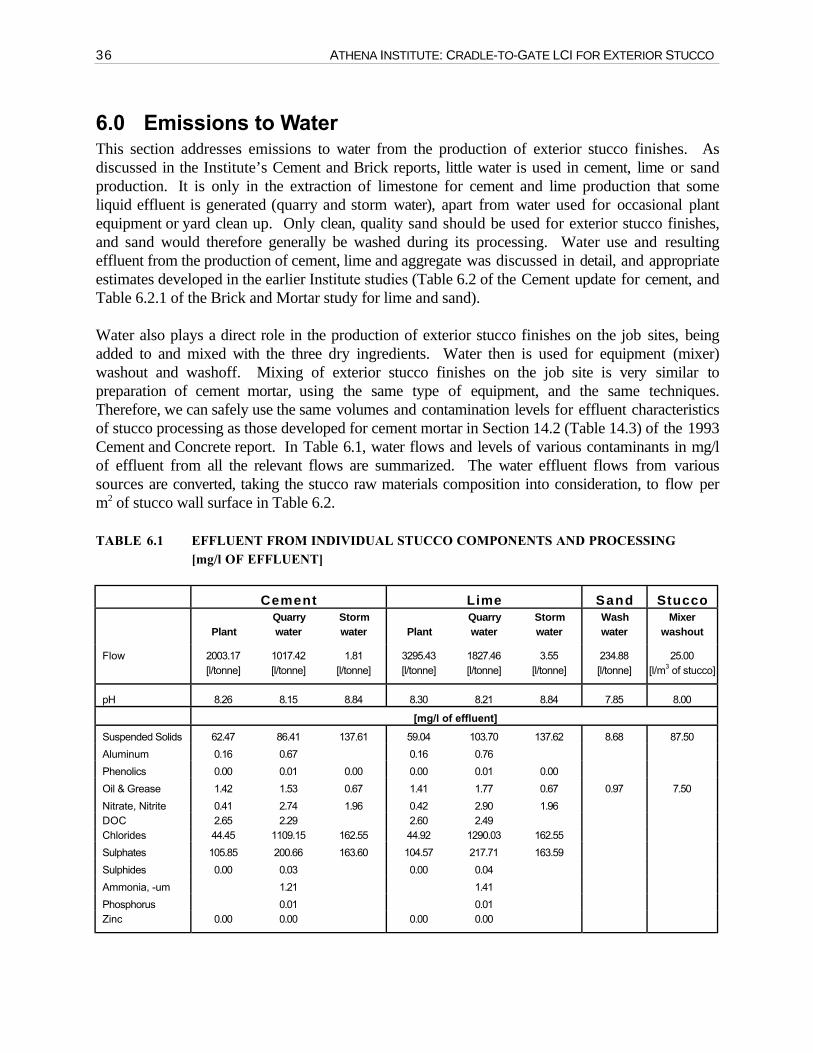
36 ATHENA INSTITUTE: CRADLE-TO-GATE LCI FOR EXTERIOR STUCCO
6.0 Emissions to WaterThis section addresses emissions to water from the production of exterior stucco finishes. Asdiscussed in the Institute’s Cement and Brick reports, little water is used in cement, lime or sandproduction. It is only in the extraction of limestone for cement and lime production that someliquid effluent is generated (quarry and storm water), apart from water used for occasional plantequipment or yard clean up. Only clean, quality sand should be used for exterior stucco finishes,and sand would therefore generally be washed during its processing. Water use and resultingeffluent from the production of cement, lime and aggregate was discussed in detail, and appropriateestimates developed in the earlier Institute studies (Table 6.2 of the Cement update for cement, andTable 6.2.1 of the Brick and Mortar study for lime and sand).
Water also plays a direct role in the production of exterior stucco finishes on the job sites, beingadded to and mixed with the three dry ingredients. Water then is used for equipment (mixer)washout and washoff. Mixing of exterior stucco finishes on the job site is very similar topreparation of cement mortar, using the same type of equipment, and the same techniques.Therefore, we can safely use the same volumes and contamination levels for effluent characteristicsof stucco processing as those developed for cement mortar in Section 14.2 (Table 14.3) of the 1993Cement and Concrete report. In Table 6.1, water flows and levels of various contaminants in mg/lof effluent from all the relevant flows are summarized. The water effluent flows from varioussources are converted, taking the stucco raw materials composition into consideration, to flow perm2 of stucco wall surface in Table 6.2.
TABLE 6.1 EFFLUENT FROM INDIVIDUAL STUCCO COMPONENTS AND PROCESSING[mg/l OF EFFLUENT]
Cement Lime Sand Stucco
PlantQuarrywater
Stormwater Plant
Quarrywater
Stormwater
Washwater
Mixerwashout
Flow 2003.17 1017.42 1.81 3295.43 1827.46 3.55 234.88 25.00[l/tonne] [l/tonne] [l/tonne] [l/tonne] [l/tonne] [l/tonne] [l/tonne] [l/m3 of stucco]
pH 8.26 8.15 8.84 8.30 8.21 8.84 7.85 8.00
[mg/l of effluent]
Suspended Solids 62.47 86.41 137.61 59.04 103.70 137.62 8.68 87.50
Aluminum 0.16 0.67 0.16 0.76
Phenolics 0.00 0.01 0.00 0.00 0.01 0.00
Oil & Grease 1.42 1.53 0.67 1.41 1.77 0.67 0.97 7.50
Nitrate, Nitrite 0.41 2.74 1.96 0.42 2.90 1.96DOC 2.65 2.29 2.60 2.49Chlorides 44.45 1109.15 162.55 44.92 1290.03 162.55
Sulphates 105.85 200.66 163.60 104.57 217.71 163.59
Sulphides 0.00 0.03 0.00 0.04
Ammonia, -um 1.21 1.41
Phosphorus 0.01 0.01Zinc 0.00 0.00 0.00 0.00
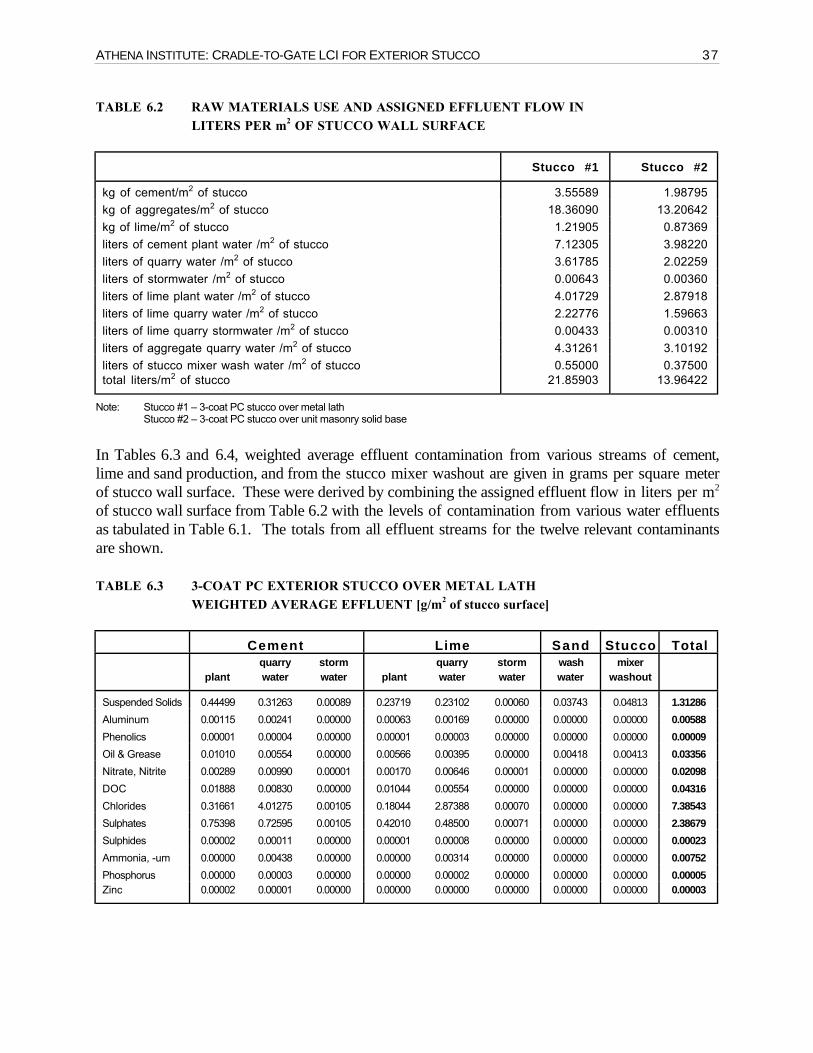
ATHENA INSTITUTE: CRADLE-TO-GATE LCI FOR EXTERIOR STUCCO 37
TABLE 6.2 RAW MATERIALS USE AND ASSIGNED EFFLUENT FLOW INLITERS PER m2 OF STUCCO WALL SURFACE
Stucco #1 Stucco #2
kg of cement/m2 of stucco 3.55589 1.98795
kg of aggregates/m2 of stucco 18.36090 13.20642
kg of lime/m2 of stucco 1.21905 0.87369
liters of cement plant water /m2 of stucco 7.12305 3.98220
liters of quarry water /m2 of stucco 3.61785 2.02259
liters of stormwater /m2 of stucco 0.00643 0.00360
liters of lime plant water /m2 of stucco 4.01729 2.87918
liters of lime quarry water /m2 of stucco 2.22776 1.59663
liters of lime quarry stormwater /m2 of stucco 0.00433 0.00310
liters of aggregate quarry water /m2 of stucco 4.31261 3.10192
liters of stucco mixer wash water /m2 of stucco 0.55000 0.37500total liters/m2 of stucco 21.85903 13.96422
Note: Stucco #1 – 3-coat PC stucco over metal lathStucco #2 – 3-coat PC stucco over unit masonry solid base
In Tables 6.3 and 6.4, weighted average effluent contamination from various streams of cement,lime and sand production, and from the stucco mixer washout are given in grams per square meterof stucco wall surface. These were derived by combining the assigned effluent flow in liters per m2
of stucco wall surface from Table 6.2 with the levels of contamination from various water effluentsas tabulated in Table 6.1. The totals from all effluent streams for the twelve relevant contaminantsare shown.
TABLE 6.3 3-COAT PC EXTERIOR STUCCO OVER METAL LATHWEIGHTED AVERAGE EFFLUENT [g/m2 of stucco surface]
Cement Lime Sand Stucco Total
plantquarrywater
stormwater plant
quarrywater
stormwater
washwater
mixerwashout
Suspended Solids 0.44499 0.31263 0.00089 0.23719 0.23102 0.00060 0.03743 0.04813 1.31286
Aluminum 0.00115 0.00241 0.00000 0.00063 0.00169 0.00000 0.00000 0.00000 0.00588
Phenolics 0.00001 0.00004 0.00000 0.00001 0.00003 0.00000 0.00000 0.00000 0.00009
Oil & Grease 0.01010 0.00554 0.00000 0.00566 0.00395 0.00000 0.00418 0.00413 0.03356
Nitrate, Nitrite 0.00289 0.00990 0.00001 0.00170 0.00646 0.00001 0.00000 0.00000 0.02098
DOC 0.01888 0.00830 0.00000 0.01044 0.00554 0.00000 0.00000 0.00000 0.04316
Chlorides 0.31661 4.01275 0.00105 0.18044 2.87388 0.00070 0.00000 0.00000 7.38543
Sulphates 0.75398 0.72595 0.00105 0.42010 0.48500 0.00071 0.00000 0.00000 2.38679
Sulphides 0.00002 0.00011 0.00000 0.00001 0.00008 0.00000 0.00000 0.00000 0.00023
Ammonia, -um 0.00000 0.00438 0.00000 0.00000 0.00314 0.00000 0.00000 0.00000 0.00752
Phosphorus 0.00000 0.00003 0.00000 0.00000 0.00002 0.00000 0.00000 0.00000 0.00005Zinc 0.00002 0.00001 0.00000 0.00000 0.00000 0.00000 0.00000 0.00000 0.00003
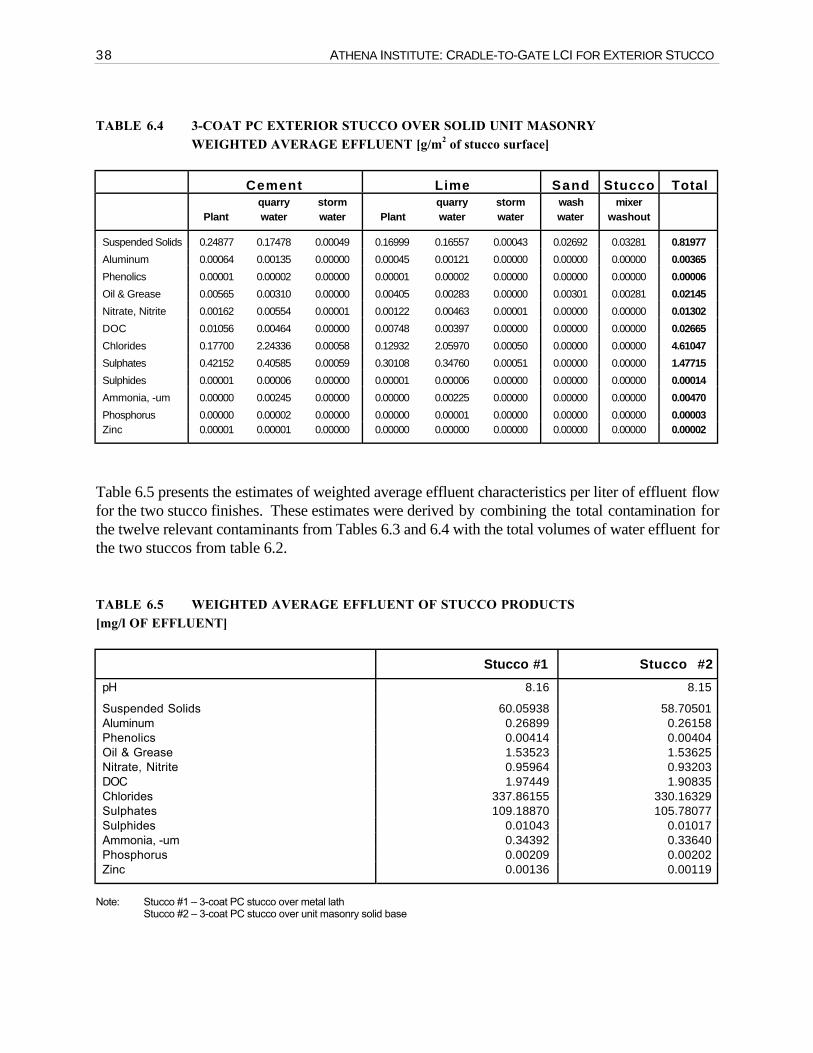
38 ATHENA INSTITUTE: CRADLE-TO-GATE LCI FOR EXTERIOR STUCCO
TABLE 6.4 3-COAT PC EXTERIOR STUCCO OVER SOLID UNIT MASONRYWEIGHTED AVERAGE EFFLUENT [g/m2 of stucco surface]
Cement Lime Sand Stucco Total
Plantquarrywater
stormwater Plant
quarrywater
stormwater
washwater
mixerwashout
Suspended Solids 0.24877 0.17478 0.00049 0.16999 0.16557 0.00043 0.02692 0.03281 0.81977
Aluminum 0.00064 0.00135 0.00000 0.00045 0.00121 0.00000 0.00000 0.00000 0.00365
Phenolics 0.00001 0.00002 0.00000 0.00001 0.00002 0.00000 0.00000 0.00000 0.00006
Oil & Grease 0.00565 0.00310 0.00000 0.00405 0.00283 0.00000 0.00301 0.00281 0.02145
Nitrate, Nitrite 0.00162 0.00554 0.00001 0.00122 0.00463 0.00001 0.00000 0.00000 0.01302
DOC 0.01056 0.00464 0.00000 0.00748 0.00397 0.00000 0.00000 0.00000 0.02665
Chlorides 0.17700 2.24336 0.00058 0.12932 2.05970 0.00050 0.00000 0.00000 4.61047
Sulphates 0.42152 0.40585 0.00059 0.30108 0.34760 0.00051 0.00000 0.00000 1.47715
Sulphides 0.00001 0.00006 0.00000 0.00001 0.00006 0.00000 0.00000 0.00000 0.00014
Ammonia, -um 0.00000 0.00245 0.00000 0.00000 0.00225 0.00000 0.00000 0.00000 0.00470
Phosphorus 0.00000 0.00002 0.00000 0.00000 0.00001 0.00000 0.00000 0.00000 0.00003Zinc 0.00001 0.00001 0.00000 0.00000 0.00000 0.00000 0.00000 0.00000 0.00002
Table 6.5 presents the estimates of weighted average effluent characteristics per liter of effluent flowfor the two stucco finishes. These estimates were derived by combining the total contamination forthe twelve relevant contaminants from Tables 6.3 and 6.4 with the total volumes of water effluent forthe two stuccos from table 6.2.
TABLE 6.5 WEIGHTED AVERAGE EFFLUENT OF STUCCO PRODUCTS[mg/l OF EFFLUENT]
Stucco #1 Stucco #2
pH 8.16 8.15
Suspended Solids 60.05938 58.70501Aluminum 0.26899 0.26158Phenolics 0.00414 0.00404Oil & Grease 1.53523 1.53625Nitrate, Nitrite 0.95964 0.93203DOC 1.97449 1.90835Chlorides 337.86155 330.16329Sulphates 109.18870 105.78077Sulphides 0.01043 0.01017Ammonia, -um 0.34392 0.33640Phosphorus 0.00209 0.00202Zinc 0.00136 0.00119
Note: Stucco #1 – 3-coat PC stucco over metal lathStucco #2 – 3-coat PC stucco over unit masonry solid base
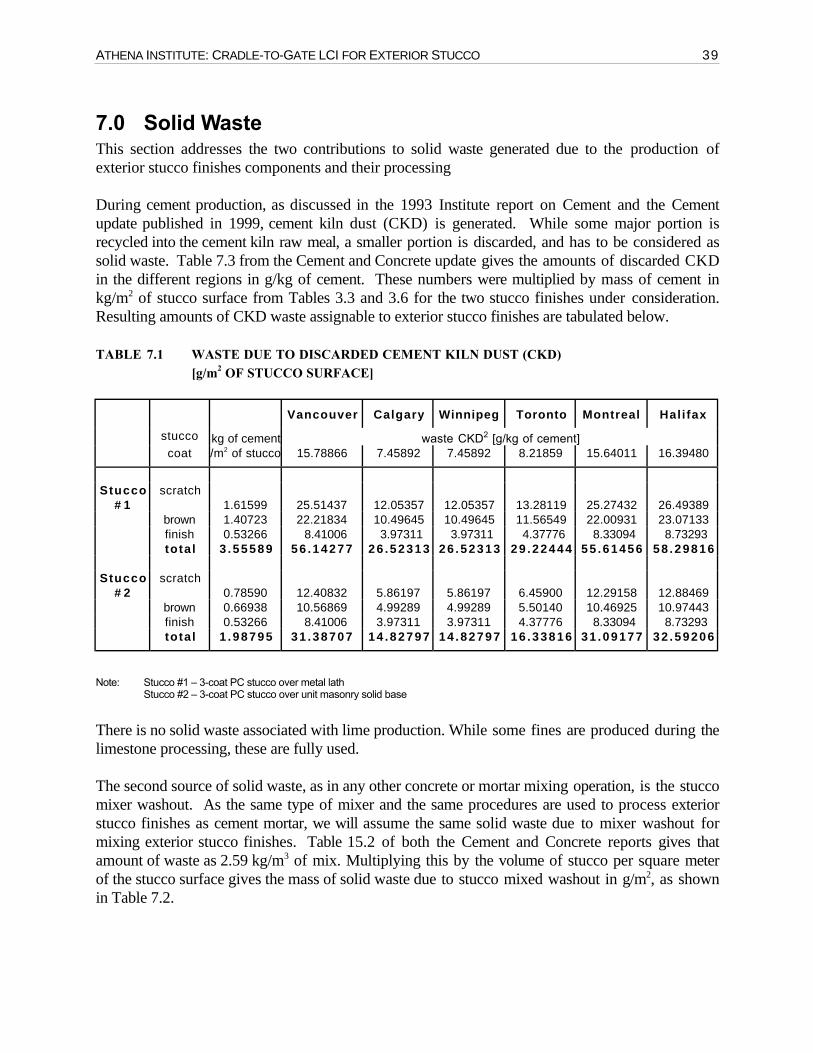
ATHENA INSTITUTE: CRADLE-TO-GATE LCI FOR EXTERIOR STUCCO 39
7.0 Solid WasteThis section addresses the two contributions to solid waste generated due to the production ofexterior stucco finishes components and their processing
During cement production, as discussed in the 1993 Institute report on Cement and the Cementupdate published in 1999, cement kiln dust (CKD) is generated. While some major portion isrecycled into the cement kiln raw meal, a smaller portion is discarded, and has to be considered assolid waste. Table 7.3 from the Cement and Concrete update gives the amounts of discarded CKDin the different regions in g/kg of cement. These numbers were multiplied by mass of cement inkg/m2 of stucco surface from Tables 3.3 and 3.6 for the two stucco finishes under consideration.Resulting amounts of CKD waste assignable to exterior stucco finishes are tabulated below.
TABLE 7.1 WASTE DUE TO DISCARDED CEMENT KILN DUST (CKD)[g/m2 OF STUCCO SURFACE]
Vancouver Calgary Winnipeg Toronto Montreal Halifax
stucco kg of cement waste CKD2 [g/kg of cement]coat /m2 of stucco 15.78866 7.45892 7.45892 8.21859 15.64011 16.39480
Stucco# 1
scratch1.61599 25.51437 12.05357 12.05357 13.28119 25.27432 26.49389
brown 1.40723 22.21834 10.49645 10.49645 11.56549 22.00931 23.07133finish 0.53266 8.41006 3.97311 3.97311 4.37776 8.33094 8.73293total 3 .55589 56 .14277 26 .52313 26 .52313 29 .22444 55 .61456 58 .29816
Stucco# 2
scratch0.78590 12.40832 5.86197 5.86197 6.45900 12.29158 12.88469
brown 0.66938 10.56869 4.99289 4.99289 5.50140 10.46925 10.97443finish 0.53266 8.41006 3.97311 3.97311 4.37776 8.33094 8.73293total 1 .98795 31 .38707 14 .82797 14 .82797 16 .33816 31 .09177 32 .59206
Note: Stucco #1 – 3-coat PC stucco over metal lathStucco #2 – 3-coat PC stucco over unit masonry solid base
There is no solid waste associated with lime production. While some fines are produced during thelimestone processing, these are fully used.
The second source of solid waste, as in any other concrete or mortar mixing operation, is the stuccomixer washout. As the same type of mixer and the same procedures are used to process exteriorstucco finishes as cement mortar, we will assume the same solid waste due to mixer washout formixing exterior stucco finishes. Table 15.2 of both the Cement and Concrete reports gives thatamount of waste as 2.59 kg/m3 of mix. Multiplying this by the volume of stucco per square meterof the stucco surface gives the mass of solid waste due to stucco mixed washout in g/m2, as shownin Table 7.2.
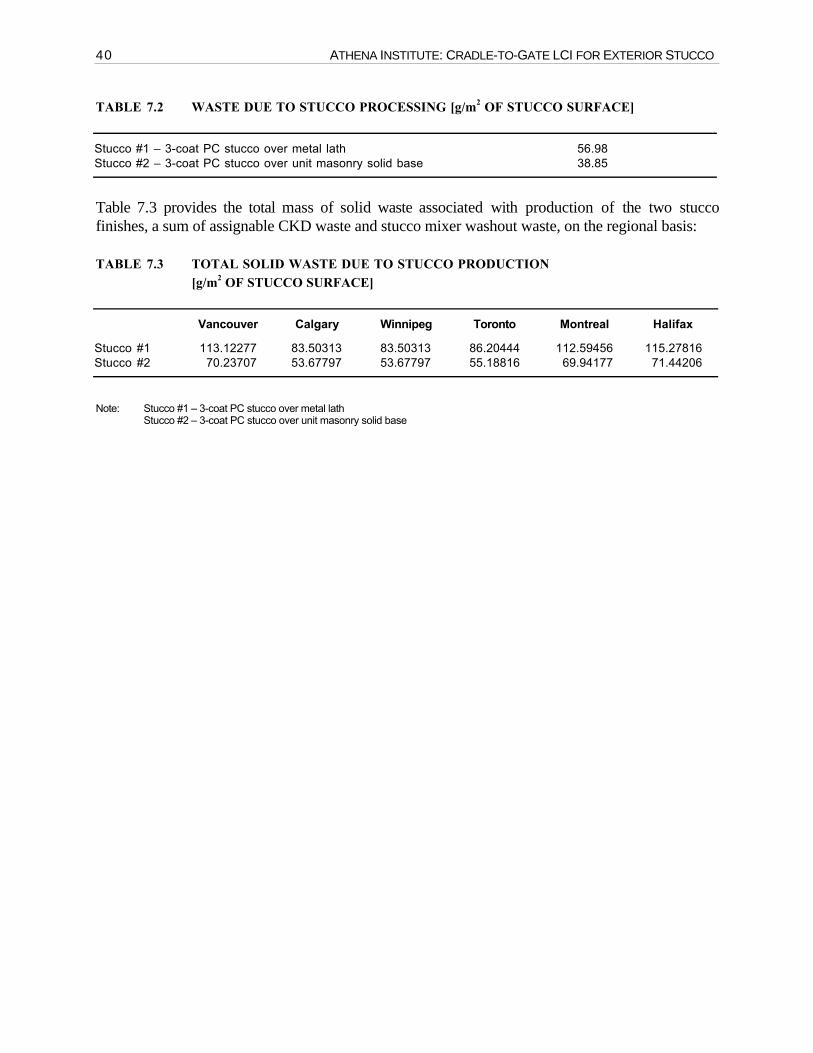
40 ATHENA INSTITUTE: CRADLE-TO-GATE LCI FOR EXTERIOR STUCCO
TABLE 7.2 WASTE DUE TO STUCCO PROCESSING [g/m2 OF STUCCO SURFACE]
Stucco #1 – 3-coat PC stucco over metal lath 56.98Stucco #2 – 3-coat PC stucco over unit masonry solid base 38.85
Table 7.3 provides the total mass of solid waste associated with production of the two stuccofinishes, a sum of assignable CKD waste and stucco mixer washout waste, on the regional basis:
TABLE 7.3 TOTAL SOLID WASTE DUE TO STUCCO PRODUCTION[g/m2 OF STUCCO SURFACE]
Vancouver Calgary Winnipeg Toronto Montreal Halifax
Stucco #1 113.12277 83.50313 83.50313 86.20444 112.59456 115.27816Stucco #2 70.23707 53.67797 53.67797 55.18816 69.94177 71.44206
Note: Stucco #1 – 3-coat PC stucco over metal lathStucco #2 – 3-coat PC stucco over unit masonry solid base


![Nurse Stucco Inc.nursestucco.com/wp-content/uploads/2017/02/Nurse-Stucco-IIPP-Manual.pdfNurse Stucco Inc. Injury and Illness Prevention Program [High Hazard] Prepared by: Nurse Stucco](https://img.pdfslide.us/doc/110x75/5e7cb411957c795622453e76/nurse-stucco-inc-nurse-stucco-inc-injury-and-illness-prevention-program-high.jpg)