Embed Size (px)
Citation preview
Cracking the Enigma of Adenomyosis
Sun-Wei Guo Shanghai OB/GYN Hospital
Fudan University Shanghai, China
Disclosure of conflict of interest
• Nothing to disclose
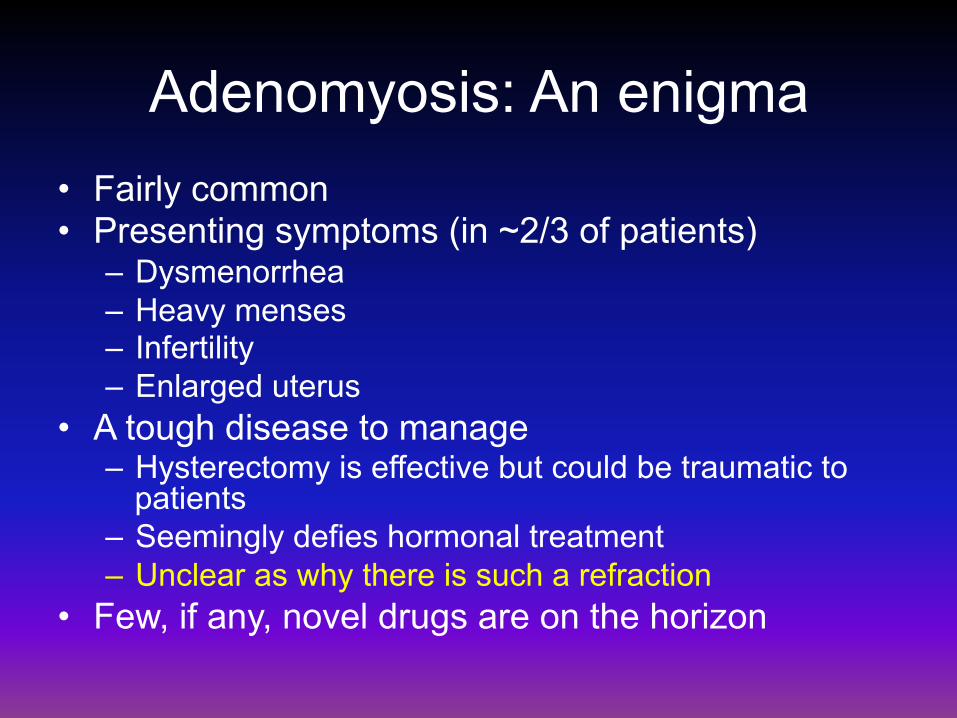
Adenomyosis: An enigma • Fairly common • Presenting symptoms (in ~2/3 of patients)
– Dysmenorrhea – Heavy menses – Infertility – Enlarged uterus
• A tough disease to manage – Hysterectomy is effective but could be traumatic to
patients – Seemingly defies hormonal treatment – Unclear as why there is such a refraction
• Few, if any, novel drugs are on the horizon
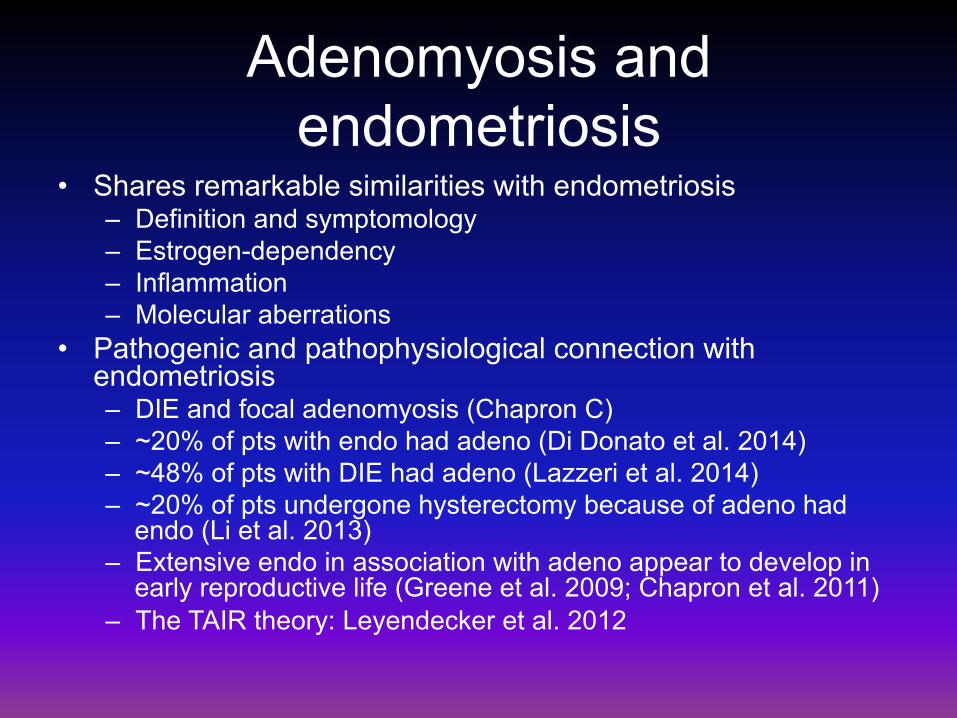
Adenomyosis and endometriosis
• Shares remarkable similarities with endometriosis – Definition and symptomology – Estrogen-dependency – Inflammation – Molecular aberrations
• Pathogenic and pathophysiological connection with endometriosis – DIE and focal adenomyosis (Chapron C) – ~20% of pts with endo had adeno (Di Donato et al. 2014) – ~48% of pts with DIE had adeno (Lazzeri et al. 2014) – ~20% of pts undergone hysterectomy because of adeno had
endo (Li et al. 2013) – Extensive endo in association with adeno appear to develop in
early reproductive life (Greene et al. 2009; Chapron et al. 2011) – The TAIR theory: Leyendecker et al. 2012
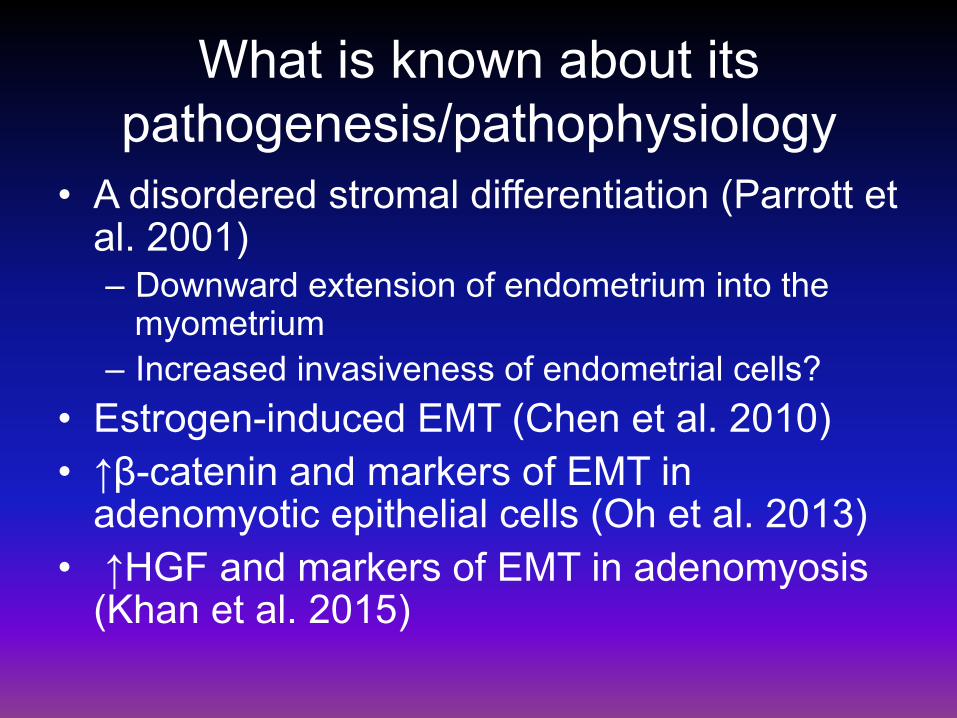
What is known about its pathogenesis/pathophysiology
• A disordered stromal differentiation (Parrott et al. 2001) – Downward extension of endometrium into the
myometrium – Increased invasiveness of endometrial cells?
• Estrogen-induced EMT (Chen et al. 2010) • ↑β-catenin and markers of EMT in
adenomyotic epithelial cells (Oh et al. 2013) • ↑HGF and markers of EMT in adenomyosis
(Khan et al. 2015)
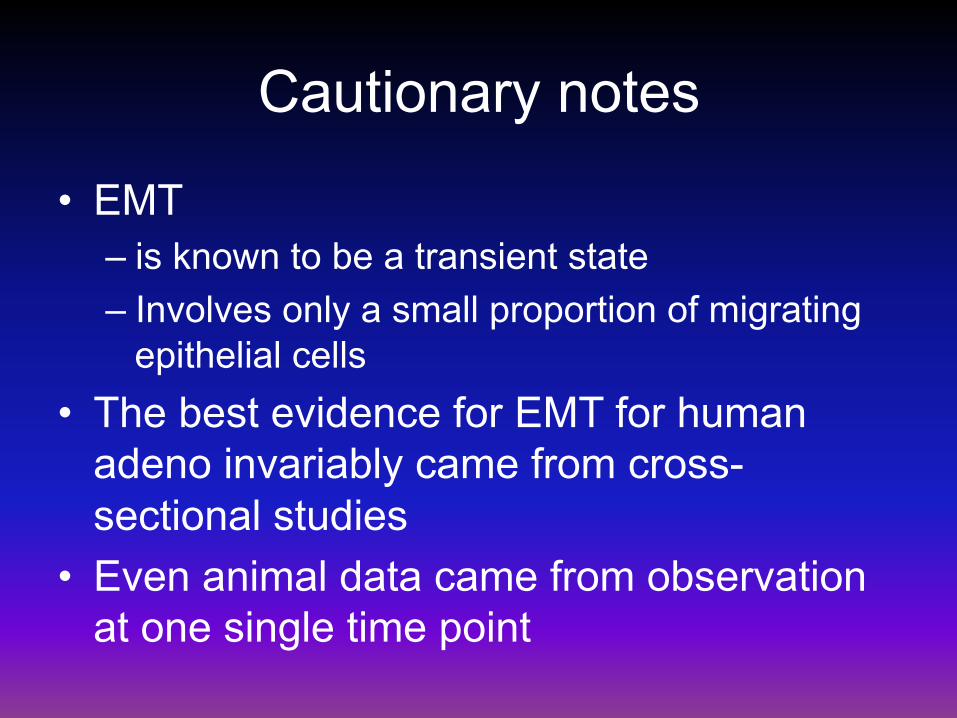
Cautionary notes
• EMT – is known to be a transient state – Involves only a small proportion of migrating
epithelial cells • The best evidence for EMT for human
adeno invariably came from cross-sectional studies
• Even animal data came from observation at one single time point
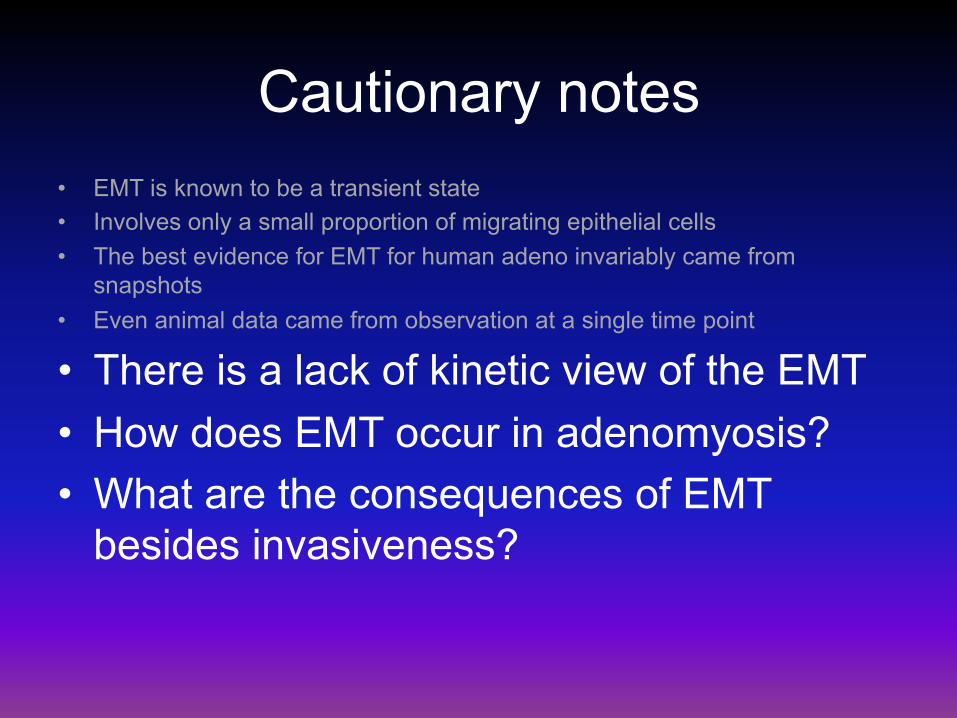
Cautionary notes • EMT is known to be a transient state • Involves only a small proportion of migrating epithelial cells • The best evidence for EMT for human adeno invariably came from
snapshots • Even animal data came from observation at a single time point
• There is a lack of kinetic view of the EMT • How does EMT occur in adenomyosis? • What are the consequences of EMT
besides invasiveness?
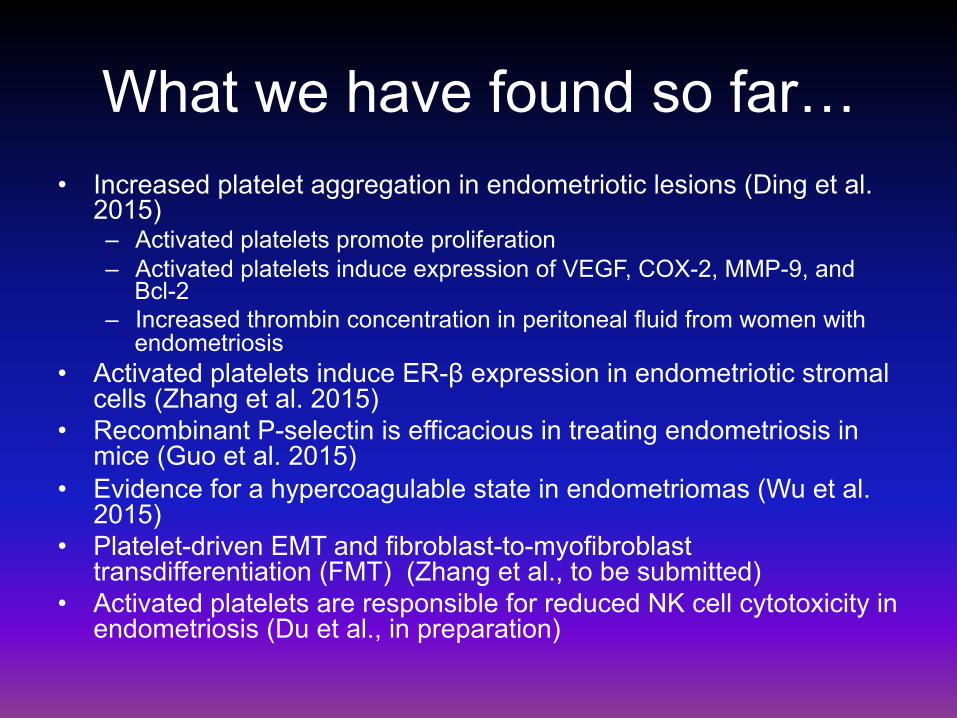
What we have found so far… • Increased platelet aggregation in endometriotic lesions (Ding et al.
2015) – Activated platelets promote proliferation – Activated platelets induce expression of VEGF, COX-2, MMP-9, and
Bcl-2 – Increased thrombin concentration in peritoneal fluid from women with
endometriosis • Activated platelets induce ER-β expression in endometriotic stromal
cells (Zhang et al. 2015) • Recombinant P-selectin is efficacious in treating endometriosis in
mice (Guo et al. 2015) • Evidence for a hypercoagulable state in endometriomas (Wu et al.
2015) • Platelet-driven EMT and fibroblast-to-myofibroblast
transdifferentiation (FMT) (Zhang et al., to be submitted) • Activated platelets are responsible for reduced NK cell cytotoxicity in
endometriosis (Du et al., in preparation)
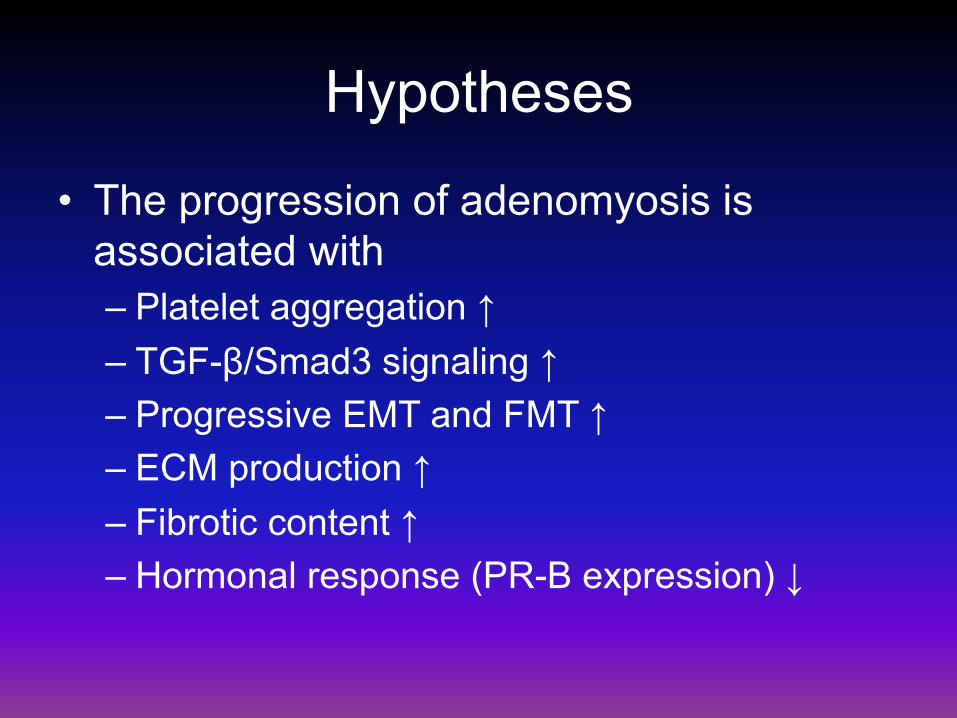
Hypotheses
• The progression of adenomyosis is associated with – Platelet aggregation ↑ – TGF-β/Smad3 signaling ↑ – Progressive EMT and FMT ↑ – ECM production ↑ – Fibrotic content ↑ – Hormonal response (PR-B expression) ↓

All models are wrong, but some are useful. ---- George E.P. Box
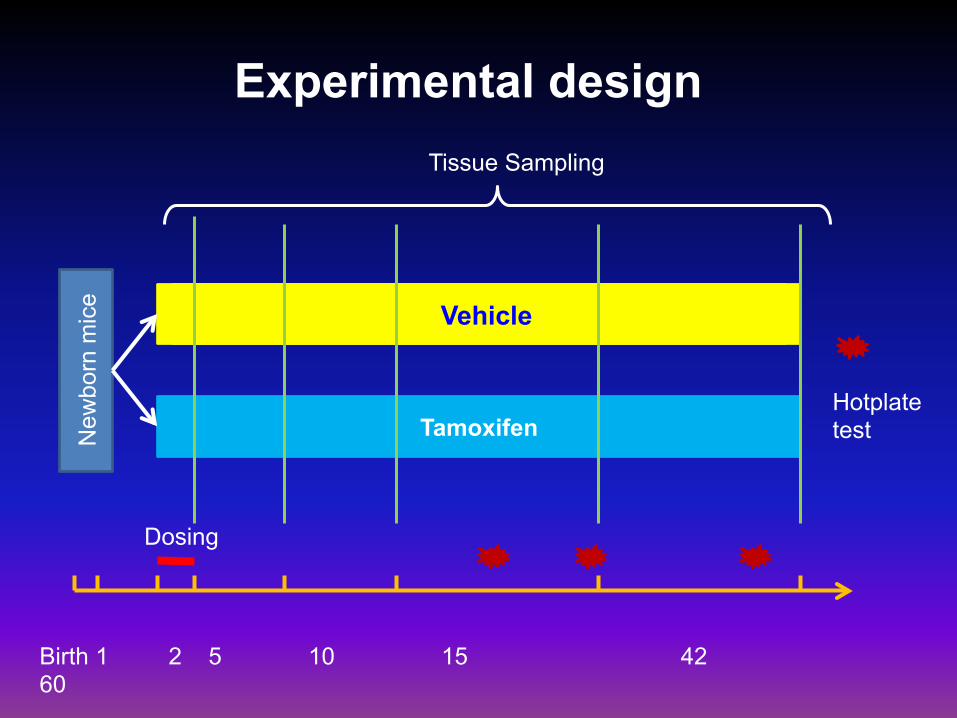
Vehicle
Tamoxifen New
born
mic
e
Birth 1 2 5 10 15 42 60
Vehicle
Dosing
Experimental design Tissue Sampling
Hotplate test
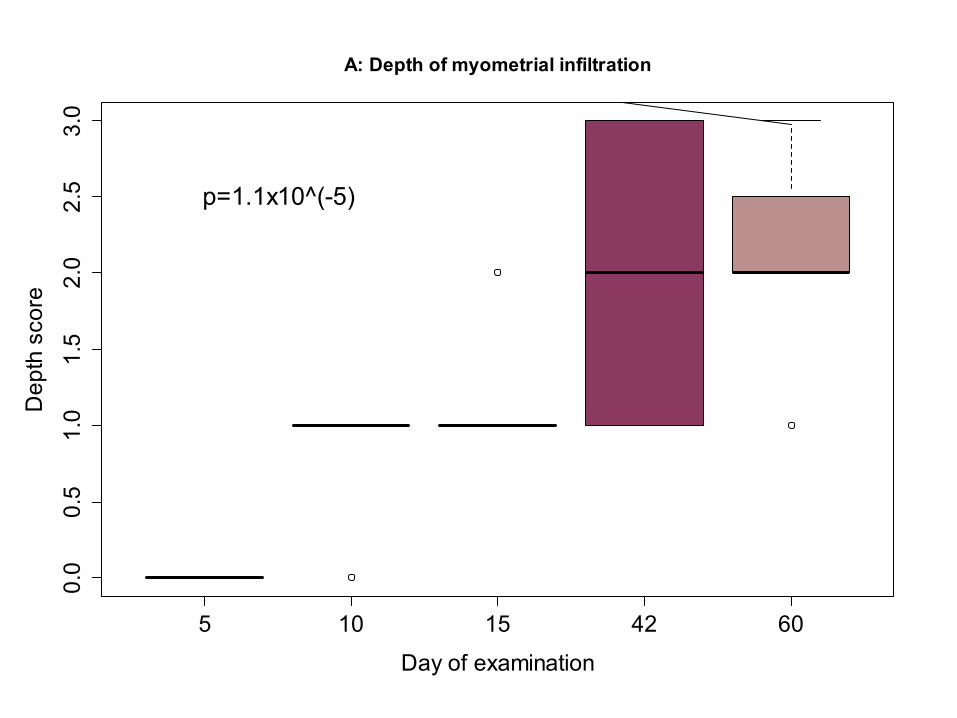
5 10 15 42 60
0.0
0.5
1.0
1.5
2.0
2.5
3.0
A: Depth of myometrial infiltration
Day of examination
Dep
th s
core
p=1.1x10^(-5)
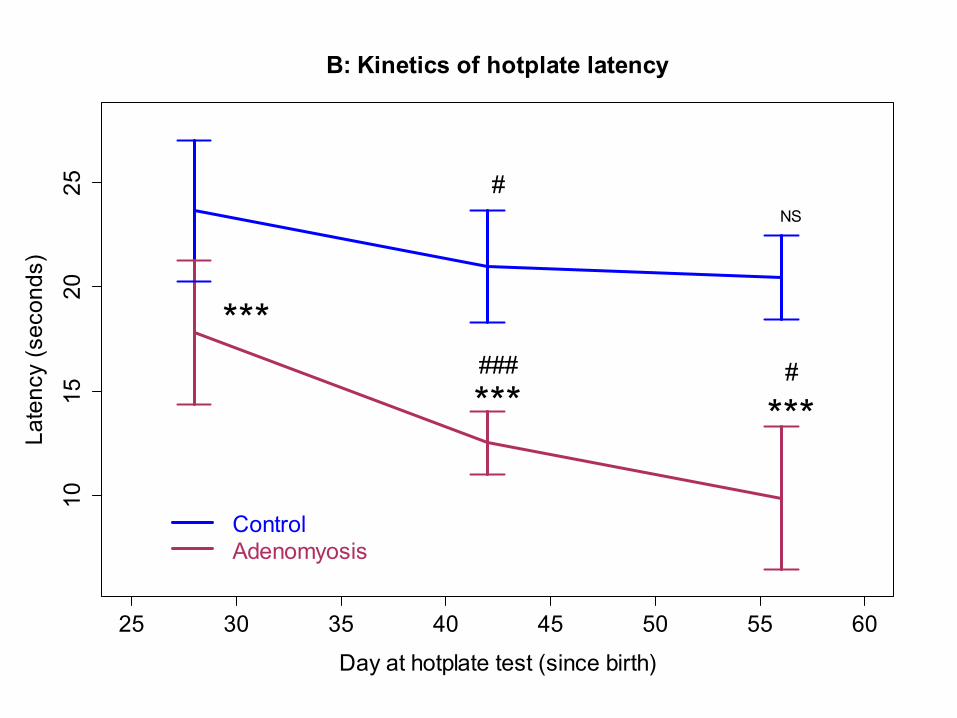
25 30 35 40 45 50 55 60
1015
2025
B: Kinetics of hotplate latency
Day at hotplate test (since birth)
Late
ncy
(sec
onds
)
ControlAdenomyosis
***
*** ***
#NS
### #
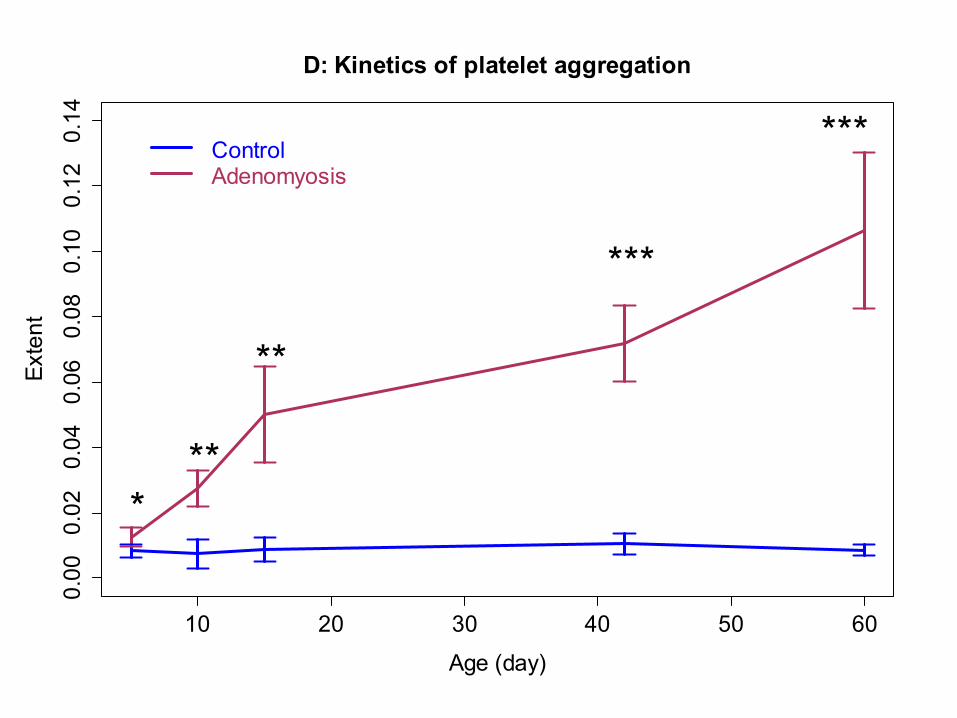
10 20 30 40 50 60
0.00
0.02
0.04
0.06
0.08
0.10
0.12
0.14
D: Kinetics of platelet aggregation
Age (day)
Exte
nt
***
**
***
***ControlAdenomyosis
0.00 0.02 0.04 0.06 0.08 0.10 0.12 0.14
0.00
0.01
0.02
0.03
0.04
0.05
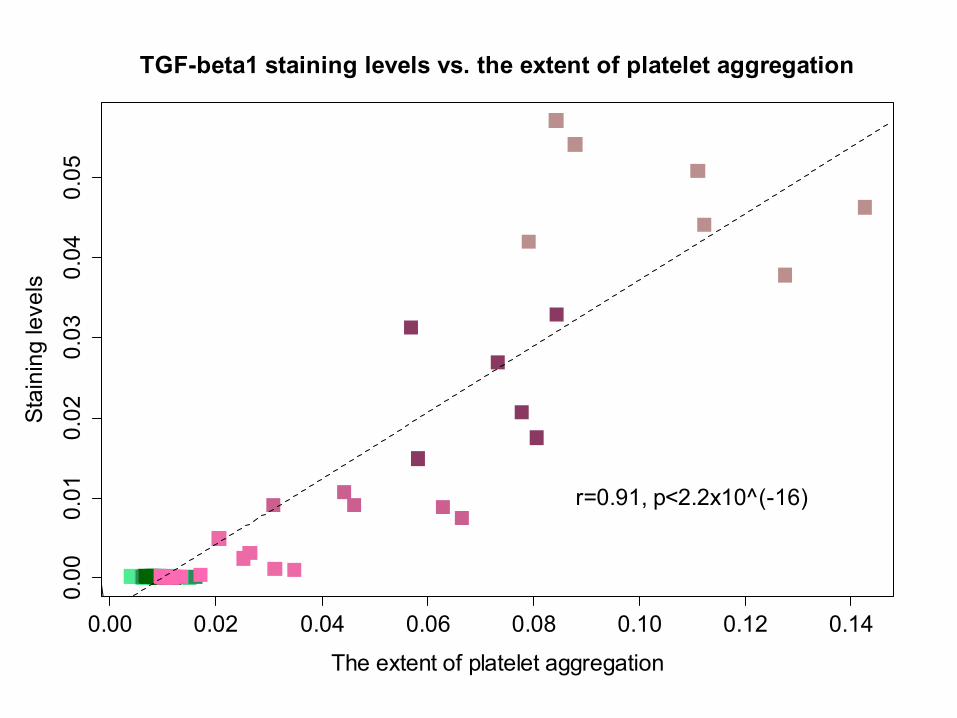
TGF-beta1 staining levels vs. the extent of platelet aggregation
The extent of platelet aggregation
Stai
ning
leve
ls
r=0.91, p<2.2x10^(-16)
0.00 0.02 0.04 0.06 0.08 0.10 0.12 0.14
0.00
0.02
0.04
0.06
0.08
0.10
0.12
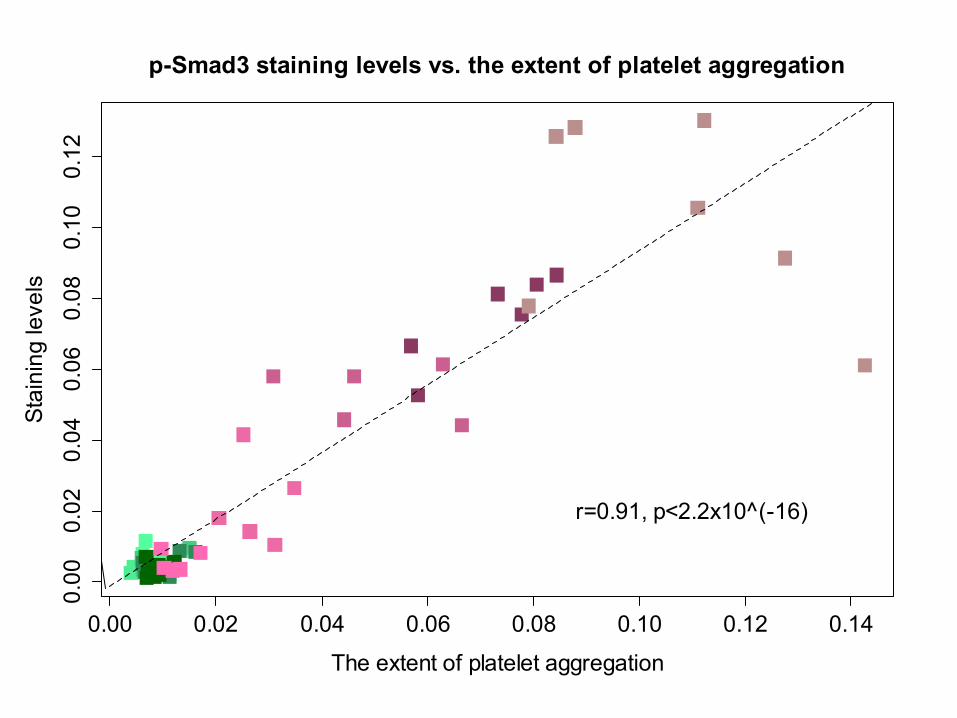
p-Smad3 staining levels vs. the extent of platelet aggregation
The extent of platelet aggregation
Stai
ning
leve
ls
r=0.91, p<2.2x10^(-16)
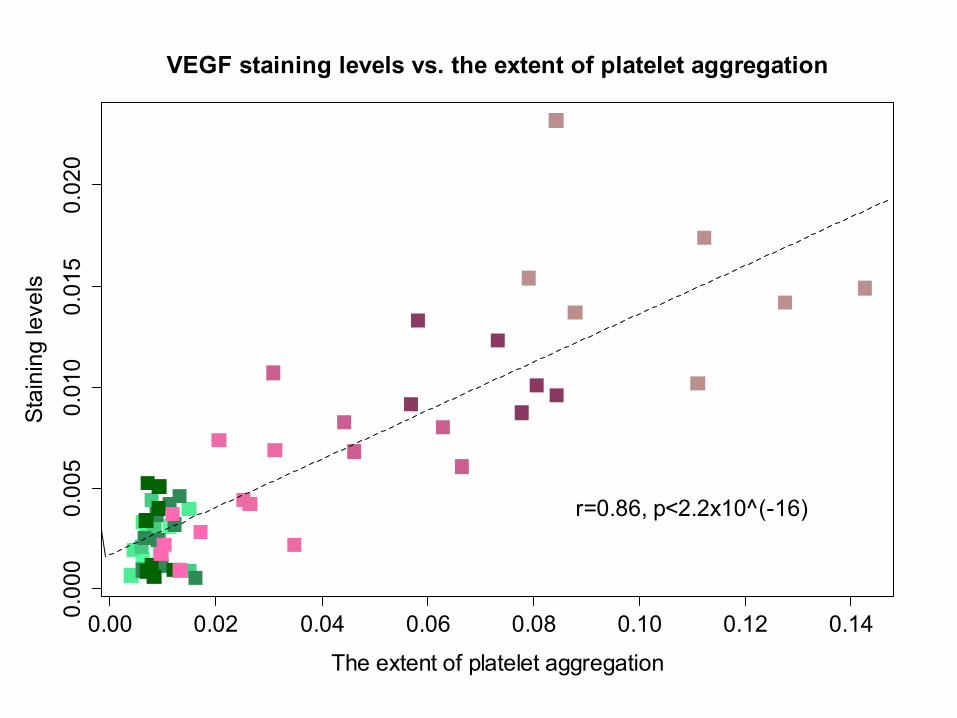
0.00 0.02 0.04 0.06 0.08 0.10 0.12 0.140.00
00.
005
0.01
00.
015
0.02
0VEGF staining levels vs. the extent of platelet aggregation
The extent of platelet aggregation
Stai
ning
leve
ls
r=0.86, p<2.2x10^(-16)
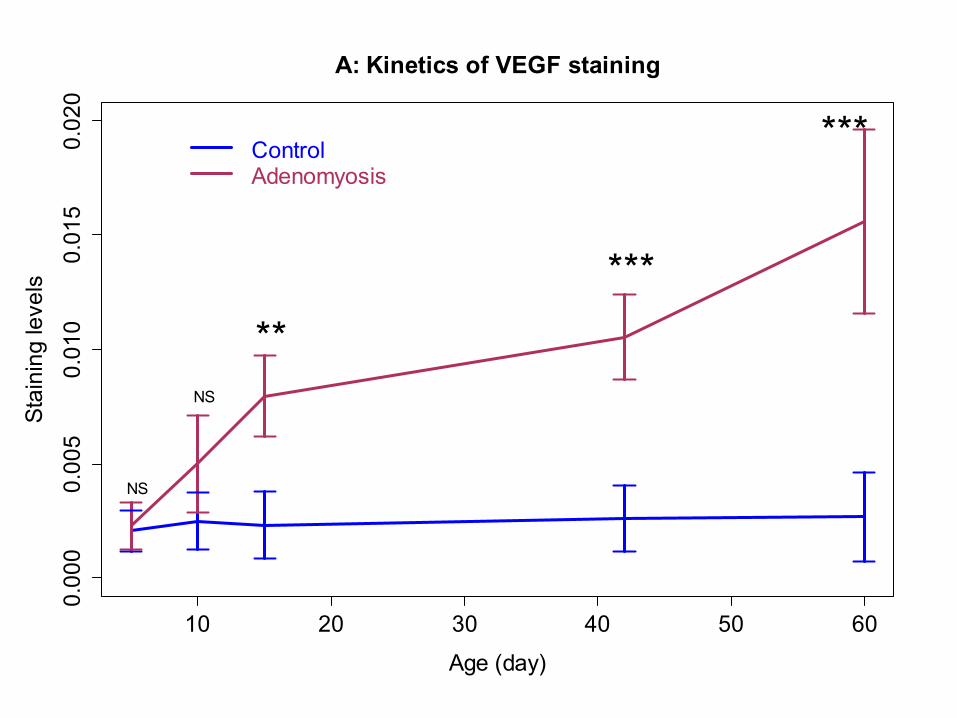
10 20 30 40 50 60
0.00
00.
005
0.01
00.
015
0.02
0A: Kinetics of VEGF staining
Age (day)
Stai
ning
leve
ls
NS
NS
**
***
***ControlAdenomyosis
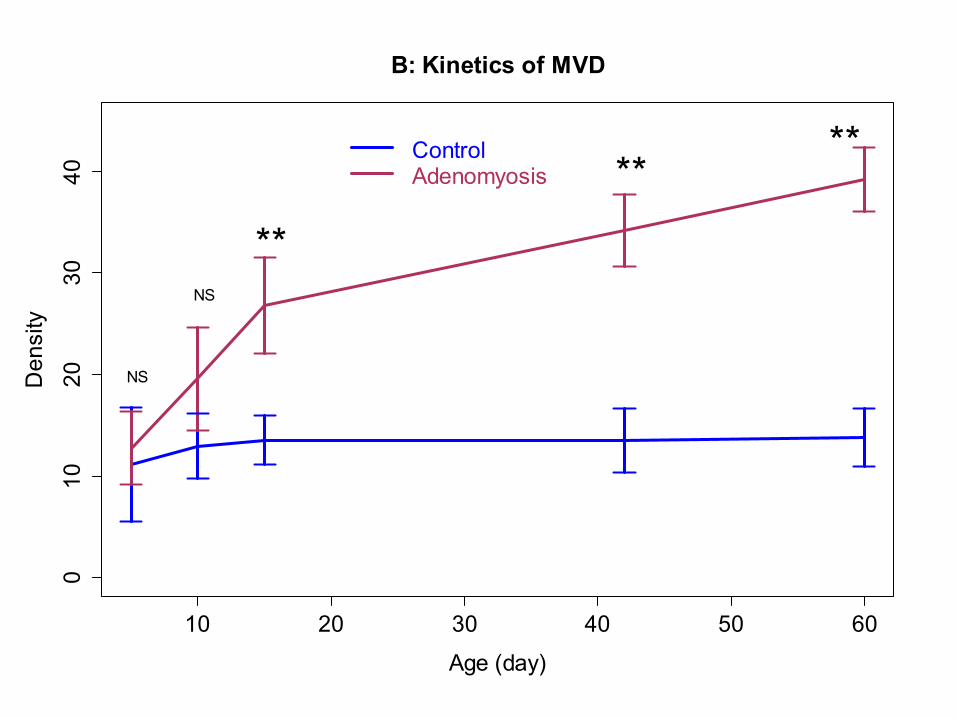
10 20 30 40 50 60
010
2030
40B: Kinetics of MVD
Age (day)
Den
sity
NS
NS
**
****Control
Adenomyosis
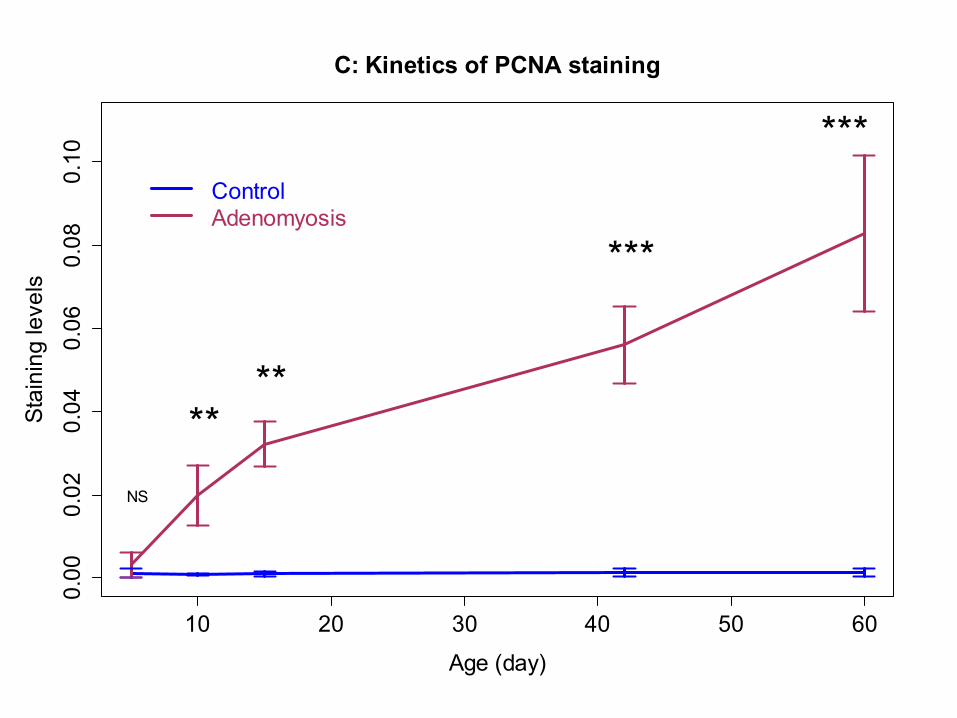
10 20 30 40 50 60
0.00
0.02
0.04
0.06
0.08
0.10
C: Kinetics of PCNA staining
Age (day)
Stai
ning
leve
ls
NS
****
***
***ControlAdenomyosis
10 20 30 40 50 60
0.00
0.01
0.02
0.03
0.04
0.05
0.06
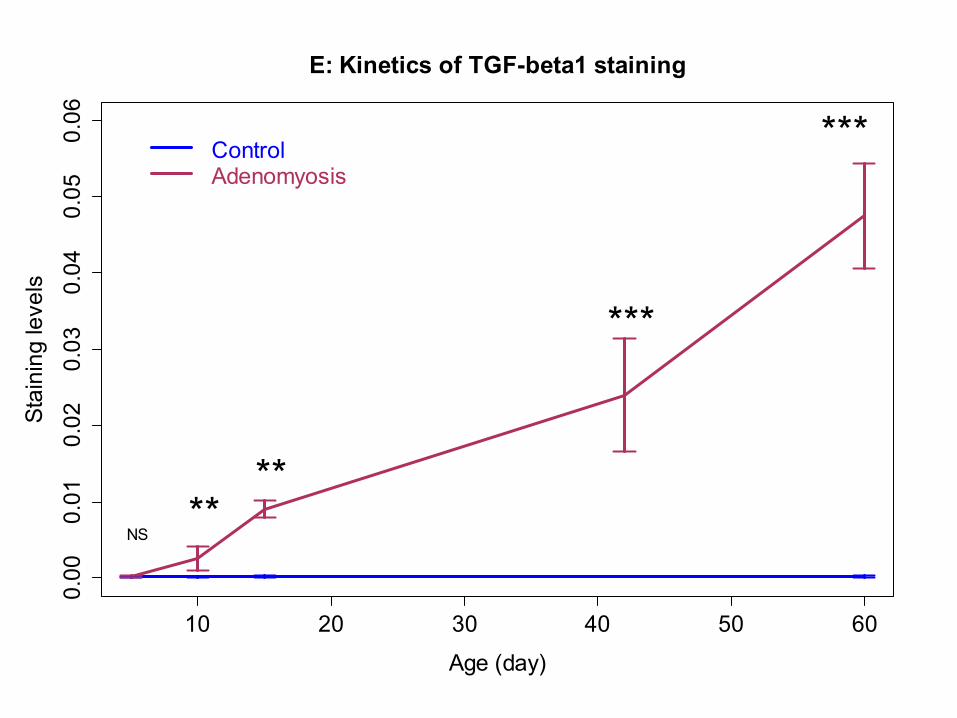
E: Kinetics of TGF-beta1 staining
Age (day)
Stai
ning
leve
ls
NS**
**
***
***ControlAdenomyosis
10 20 30 40 50 60
0.00
0.02
0.04
0.06
0.08
0.10
0.12
0.14
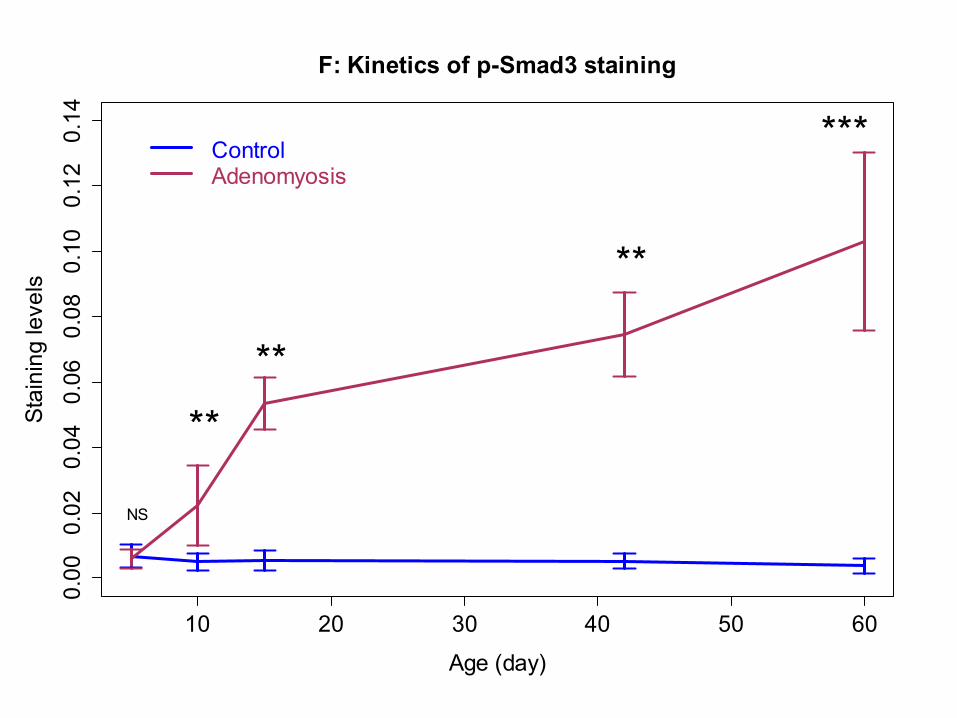
F: Kinetics of p-Smad3 staining
Age (day)
Stai
ning
leve
ls
NS
****
**
***ControlAdenomyosis
10 20 30 40 50 60
0.00
0.05
0.10
0.15
0.20
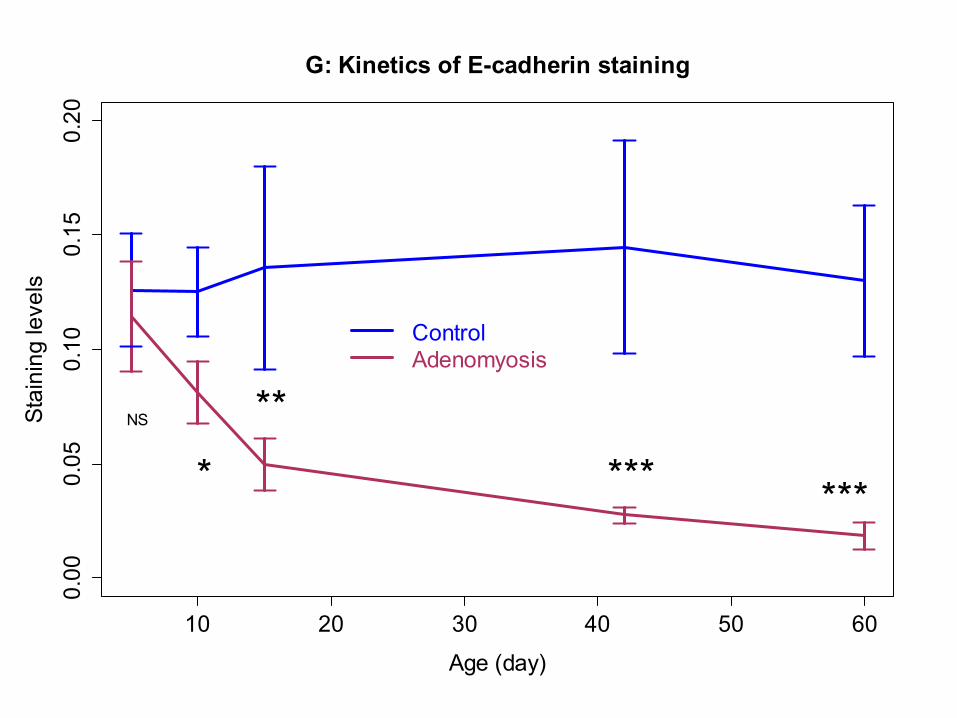
G: Kinetics of E-cadherin staining
Age (day)
Stai
ning
leve
ls
NS
*
**
*** ***
ControlAdenomyosis
10 20 30 40 50 60
0.00
0.05
0.10
0.15
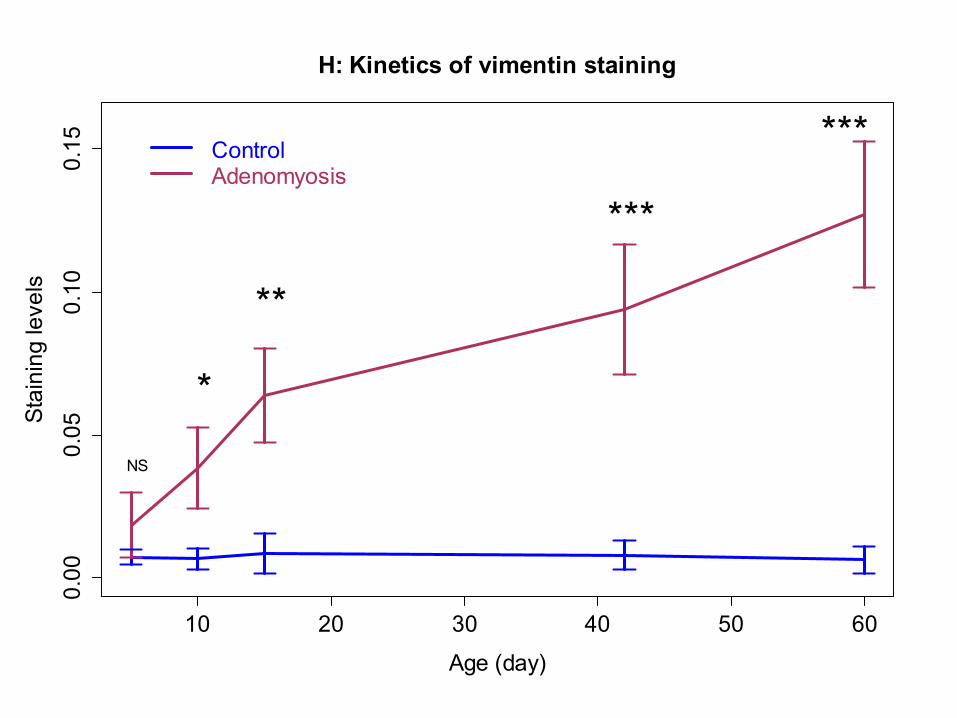
H: Kinetics of vimentin staining
Age (day)
Stai
ning
leve
ls
NS
*
**
***
***ControlAdenomyosis
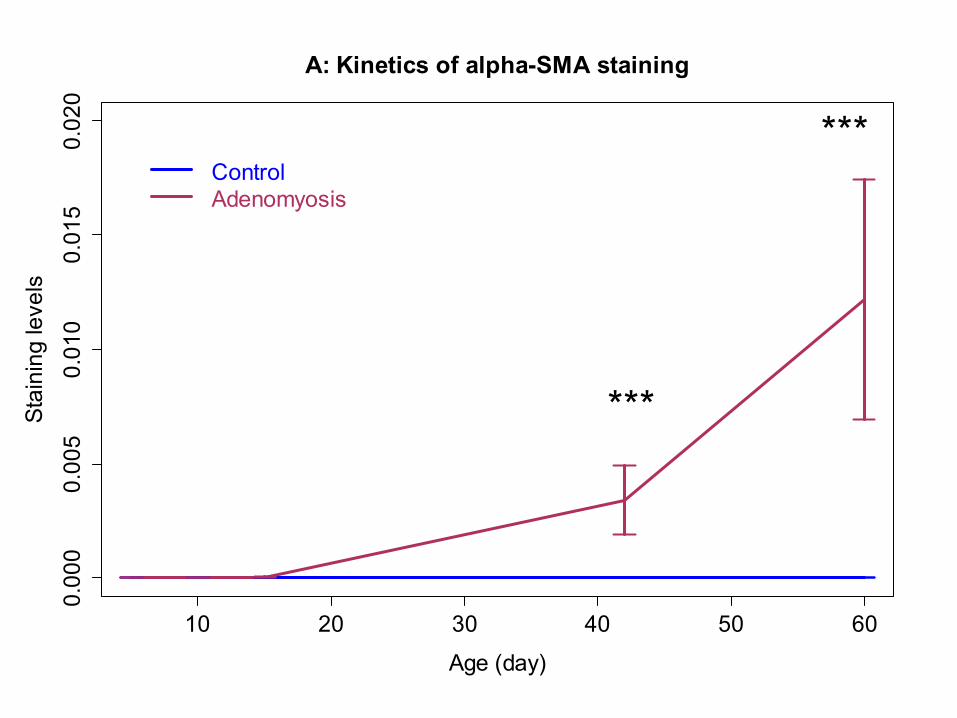
10 20 30 40 50 60
0.00
00.
005
0.01
00.
015
0.02
0A: Kinetics of alpha-SMA staining
Age (day)
Stai
ning
leve
ls
***
***ControlAdenomyosis
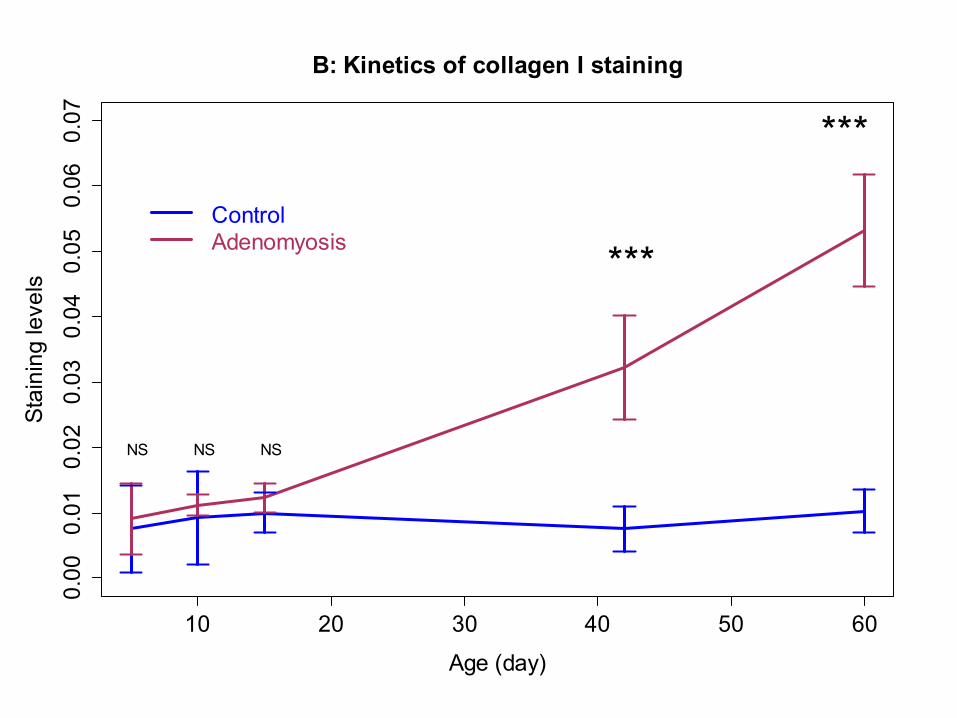
10 20 30 40 50 60
0.00
0.01
0.02
0.03
0.04
0.05
0.06
0.07
B: Kinetics of collagen I staining
Age (day)
Stai
ning
leve
ls
NS NS NS
***
***
ControlAdenomyosis
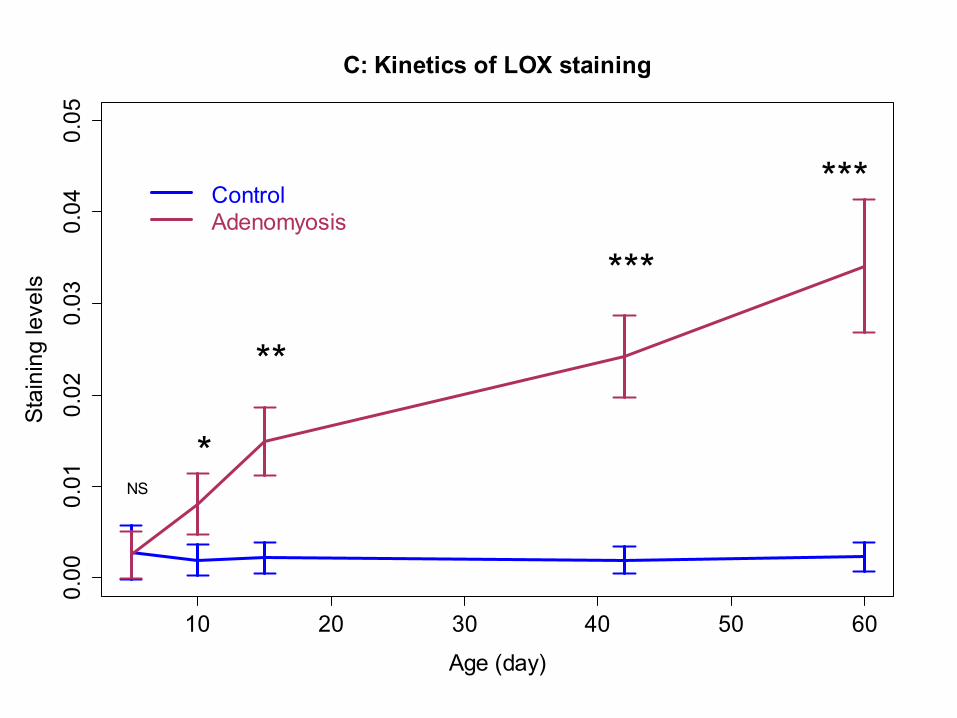
10 20 30 40 50 60
0.00
0.01
0.02
0.03
0.04
0.05
C: Kinetics of LOX staining
Age (day)
Stai
ning
leve
ls
NS
*
**
***
***ControlAdenomyosis
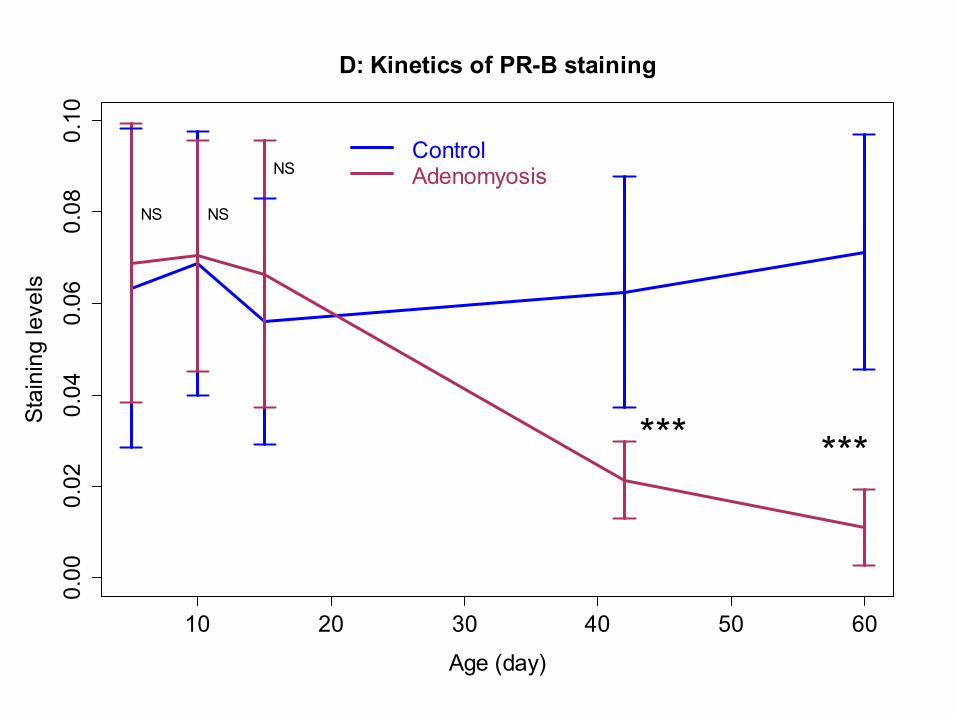
10 20 30 40 50 60
0.00
0.02
0.04
0.06
0.08
0.10
D: Kinetics of PR-B staining
Age (day)
Stai
ning
leve
ls
NS NS
NS
*** ***
ControlAdenomyosis
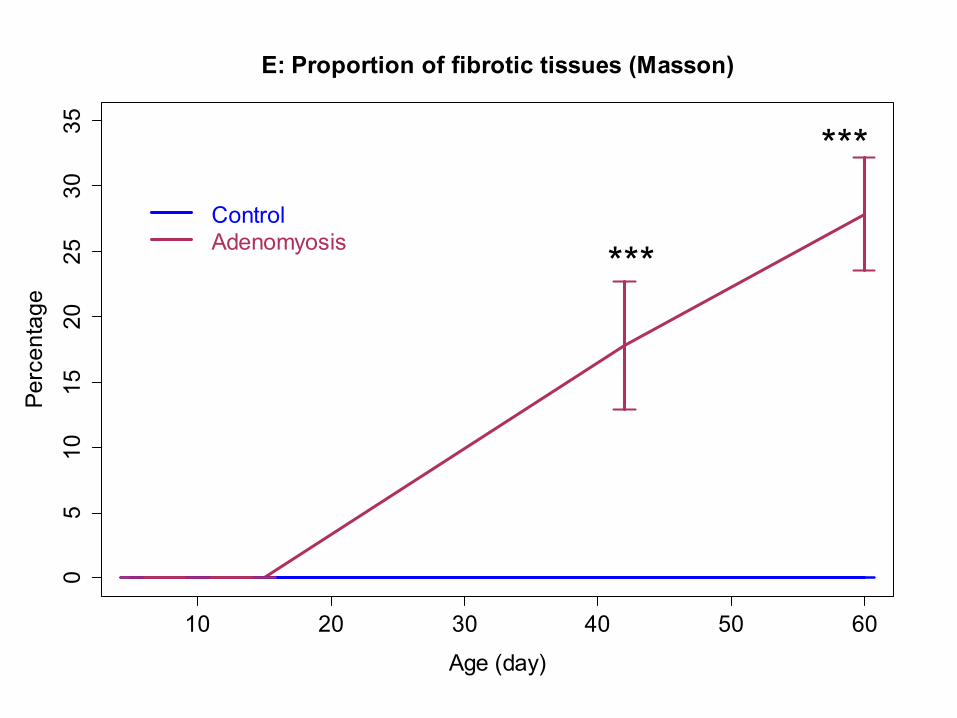
10 20 30 40 50 60
05
1015
2025
3035
E: Proportion of fibrotic tissues (Masson)
Age (day)
Perc
enta
ge
***
***ControlAdenomyosis
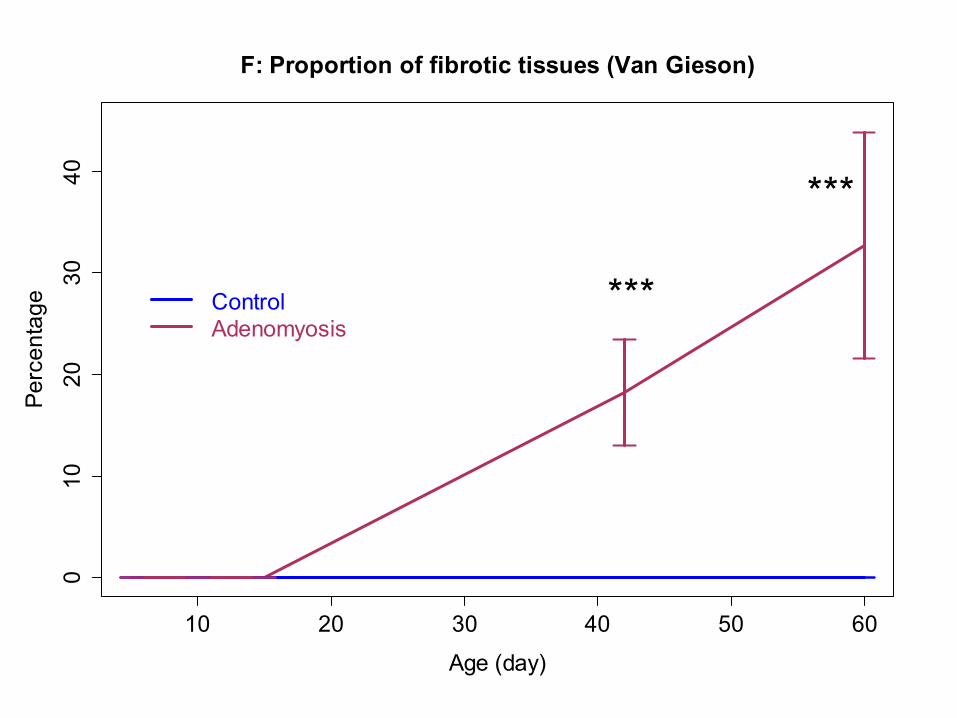
10 20 30 40 50 60
010
2030
40F: Proportion of fibrotic tissues (Van Gieson)
Age (day)
Perc
enta
ge ***
***
ControlAdenomyosis
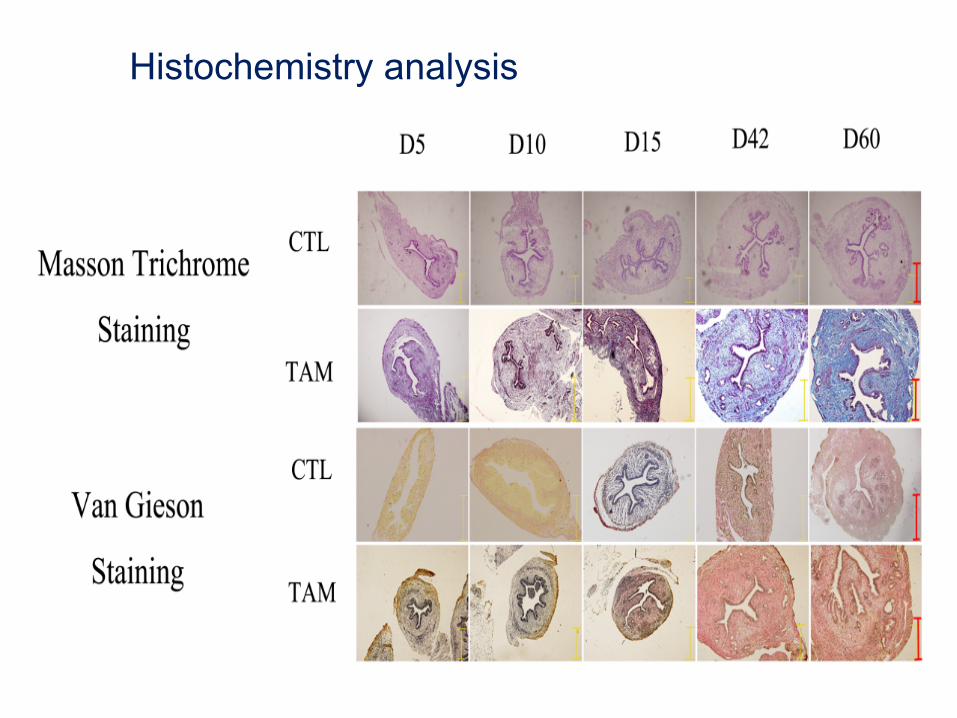
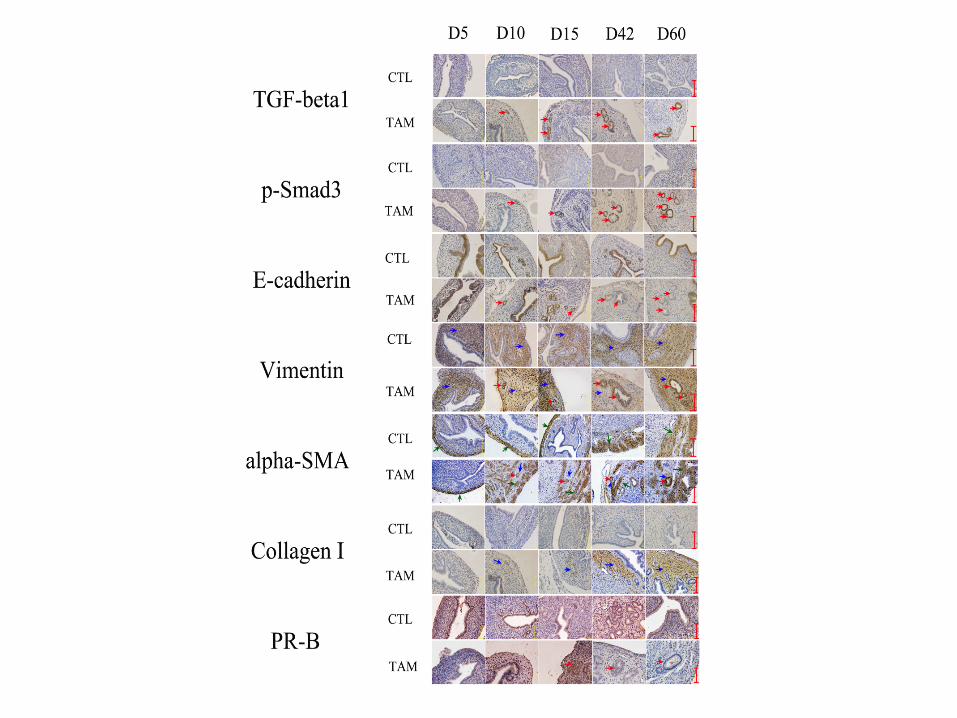
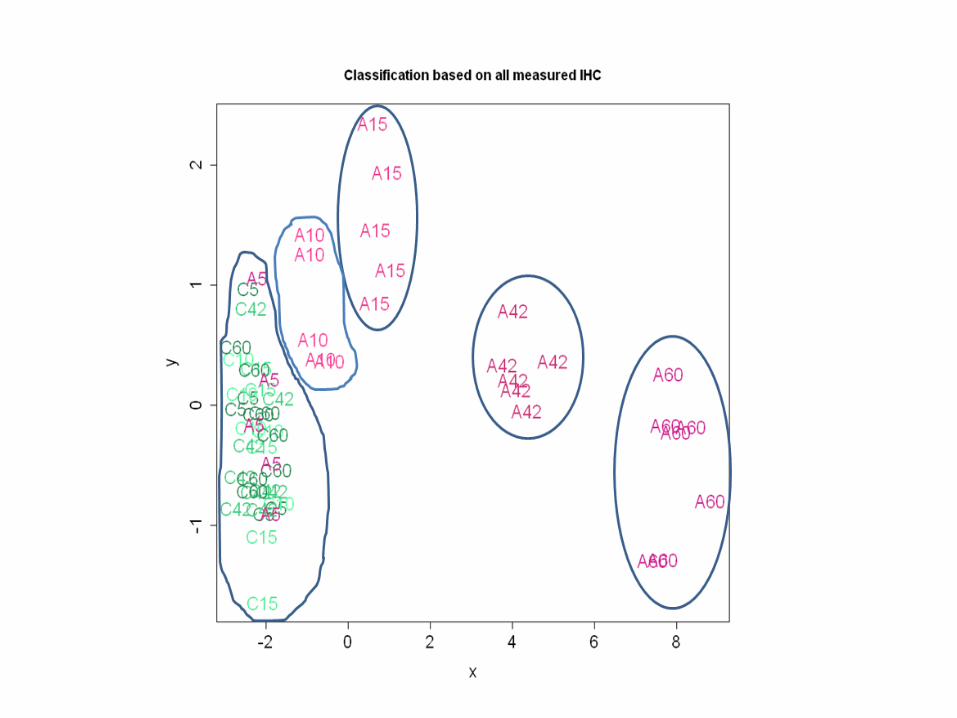
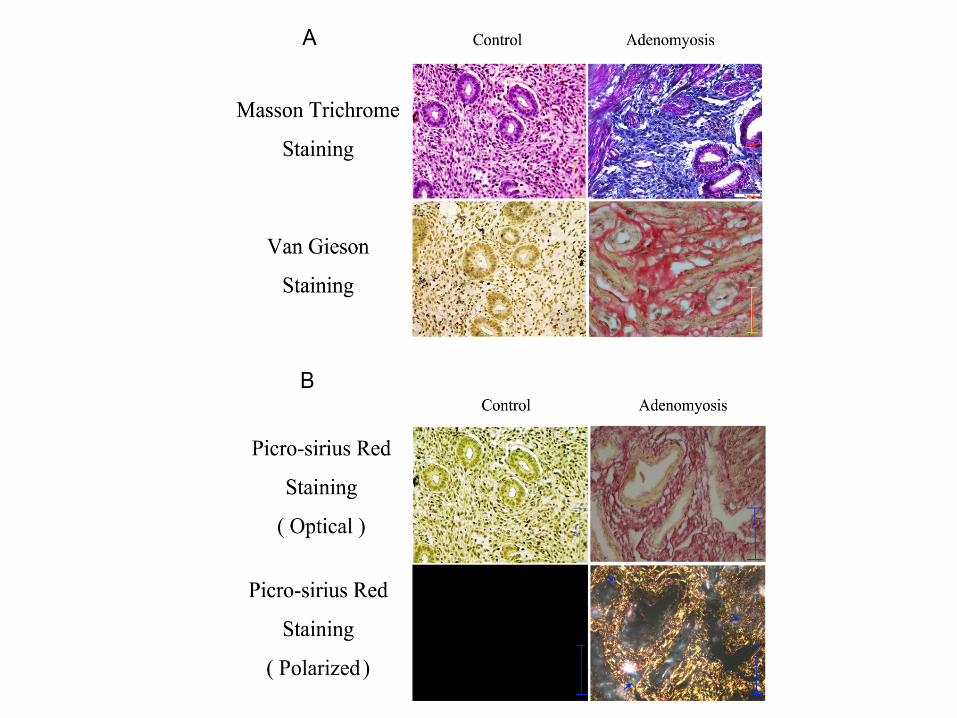
Histochemistry analysis
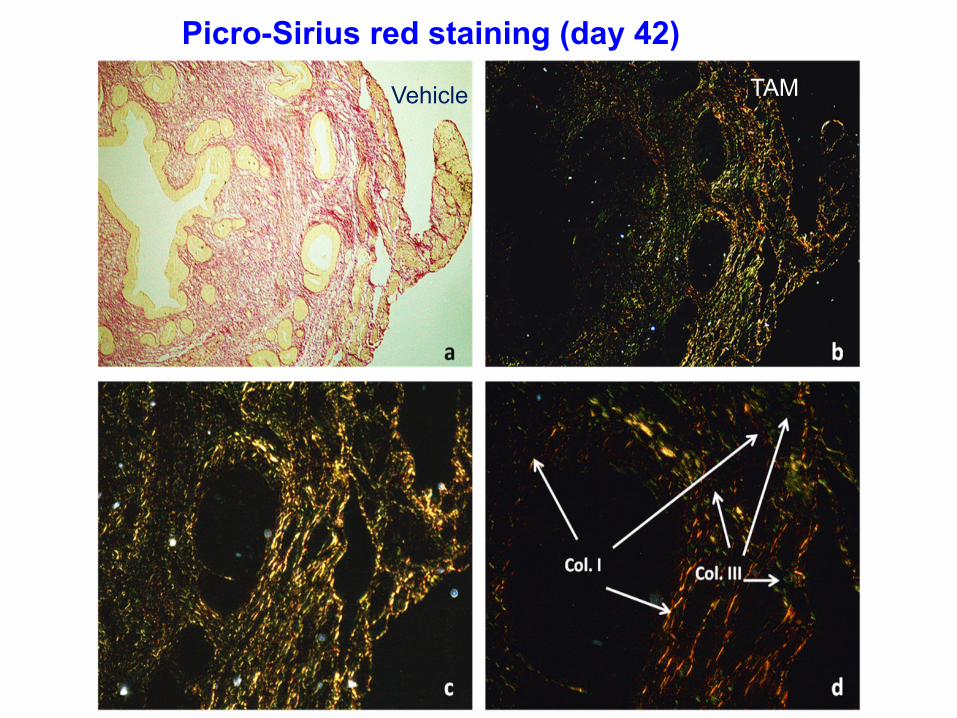
Picro-Sirius red staining (day 42)
Vehicle TAM
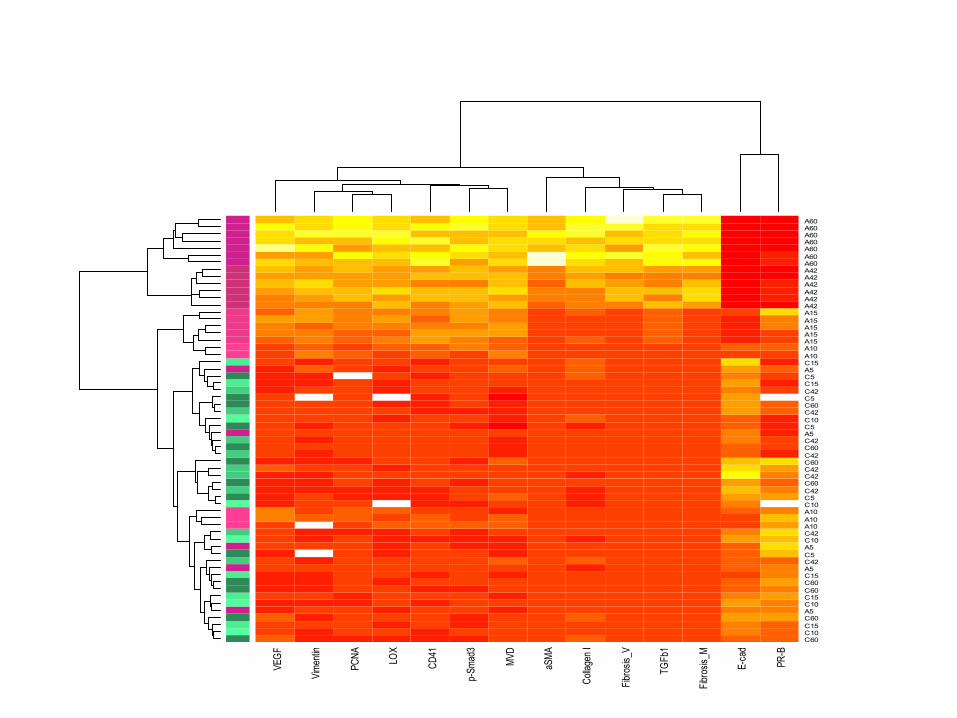
VEGF
Vimen
tin
PCNA LO
X
CD41
p-Sm
ad3
MVD
aSMA
Colla
gen I
Fibro
sis_V
TGFb
1
Fibro
sis_M
E-ca
d
PR-B
C60C10C15C60A5C10C15C60C60C15A5C42C5A5C10C42A10A10A10C10C5C42C60C42C42C60C42C60C42A5C5C10C42C60C5C42C15C5A5C15A10A10A15A15A15A15A15A42A42A42A42A42A42A60A60A60A60A60A60A60
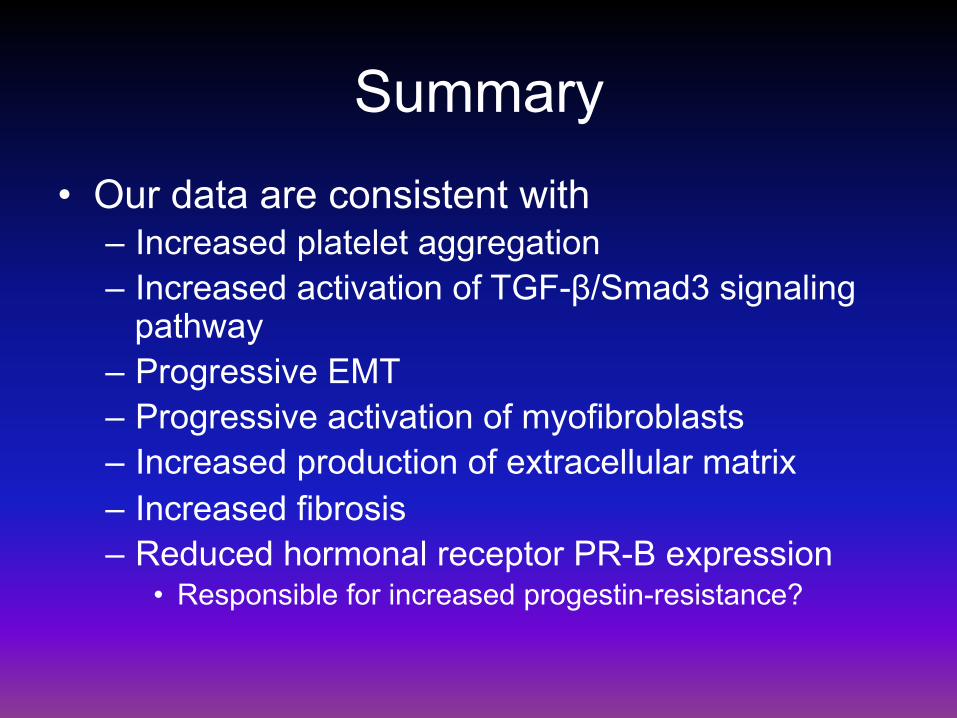
Summary • Our data are consistent with
– Increased platelet aggregation – Increased activation of TGF-β/Smad3 signaling
pathway – Progressive EMT – Progressive activation of myofibroblasts – Increased production of extracellular matrix – Increased fibrosis – Reduced hormonal receptor PR-B expression
• Responsible for increased progestin-resistance?
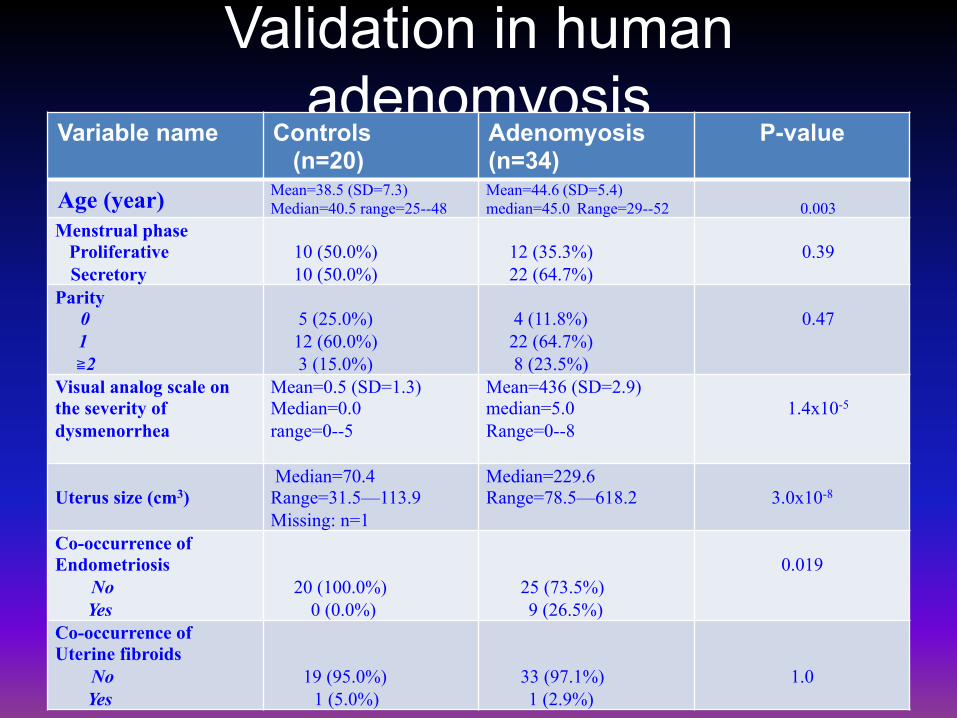
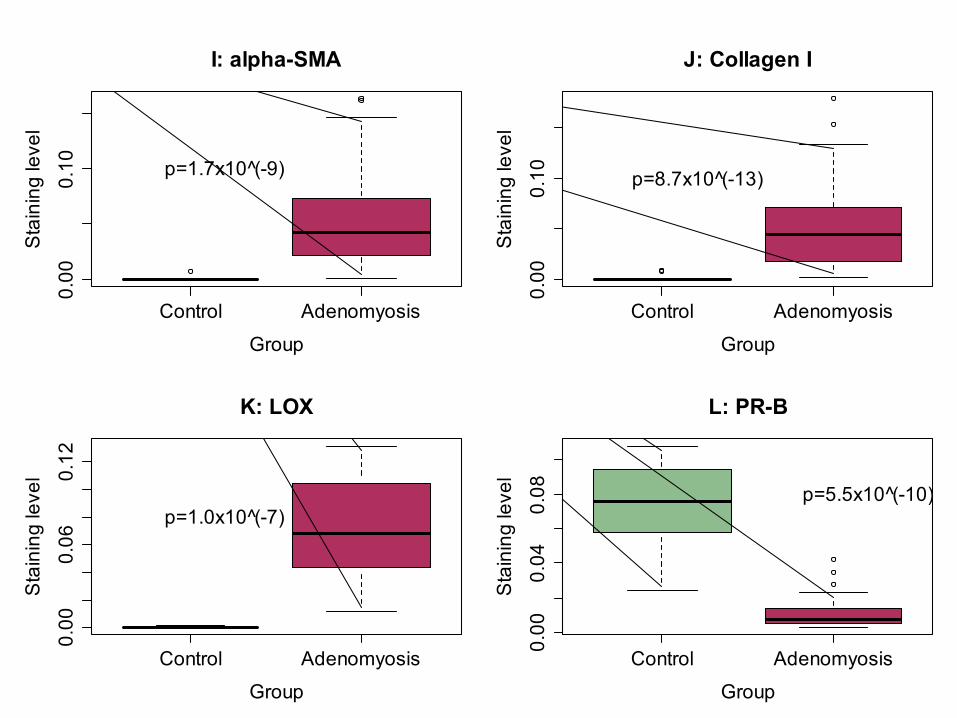
Validation in human adenomyosis
Variable name Controls (n=20)
Adenomyosis (n=34)
P-value
Age (year) Mean=38.5 (SD=7.3) Median=40.5 range=25--48
Mean=44.6 (SD=5.4) median=45.0 Range=29--52
0.003
Menstrual phase Proliferative Secretory
10 (50.0%) 10 (50.0%)
12 (35.3%) 22 (64.7%)
0.39
Parity 0 1 ≧2
5 (25.0%) 12 (60.0%) 3 (15.0%)
4 (11.8%) 22 (64.7%) 8 (23.5%)
0.47
Visual analog scale on the severity of dysmenorrhea
Mean=0.5 (SD=1.3) Median=0.0 range=0--5
Mean=436 (SD=2.9) median=5.0 Range=0--8
1.4x10⁻⁵
Uterus size (cm3)
Median=70.4 Range=31.5—113.9 Missing: n=1
Median=229.6 Range=78.5—618.2
3.0x10⁻⁸
Co-occurrence of Endometriosis No Yes
20 (100.0%) 0 (0.0%)
25 (73.5%) 9 (26.5%)
0.019
Co-occurrence of Uterine fibroids No Yes
19 (95.0%) 1 (5.0%)
33 (97.1%) 1 (2.9%)
1.0
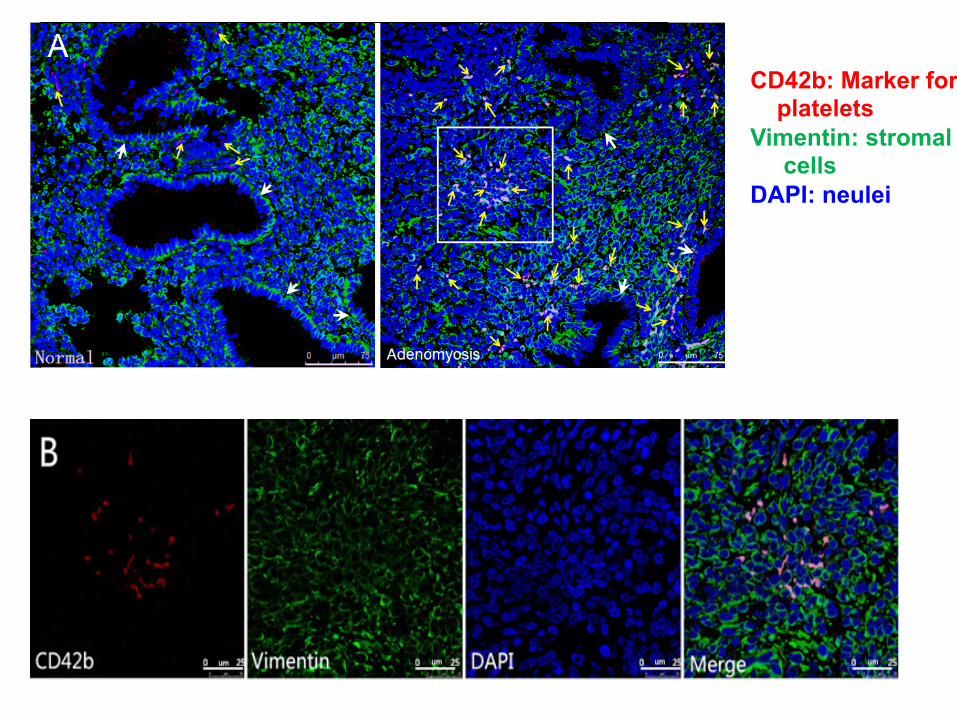
CD42b: Marker for platelets Vimentin: stromal cells DAPI: neulei
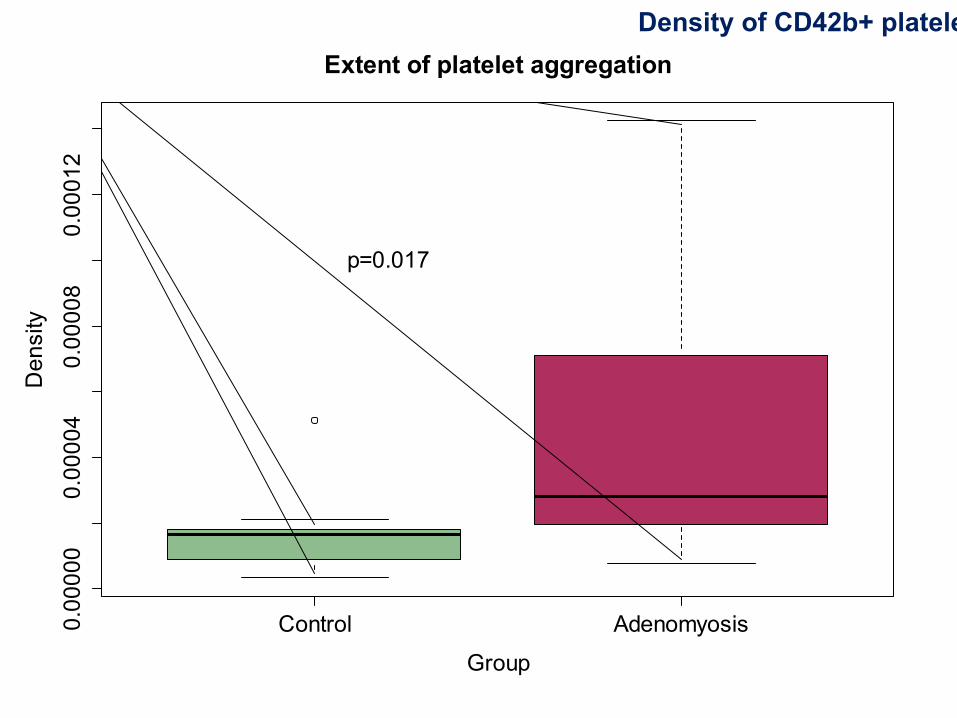
Control Adenomyosis0.00000
0.00004
0.00008
0.00012
Extent of platelet aggregation
Group
Density
p=0.017
Density of CD42b+ platelets
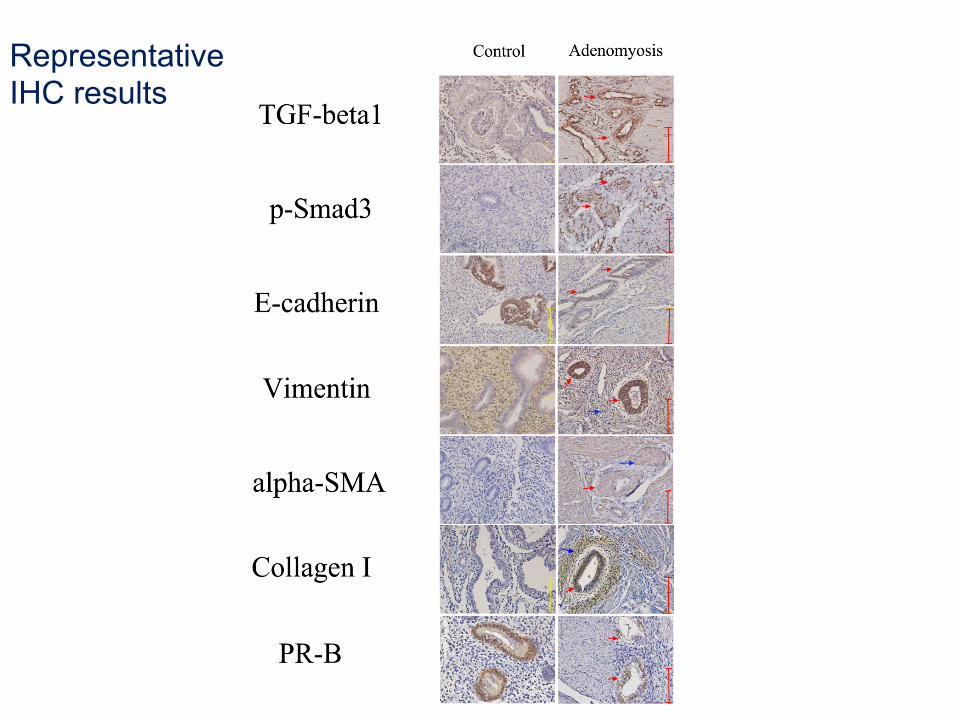
Representative IHC results
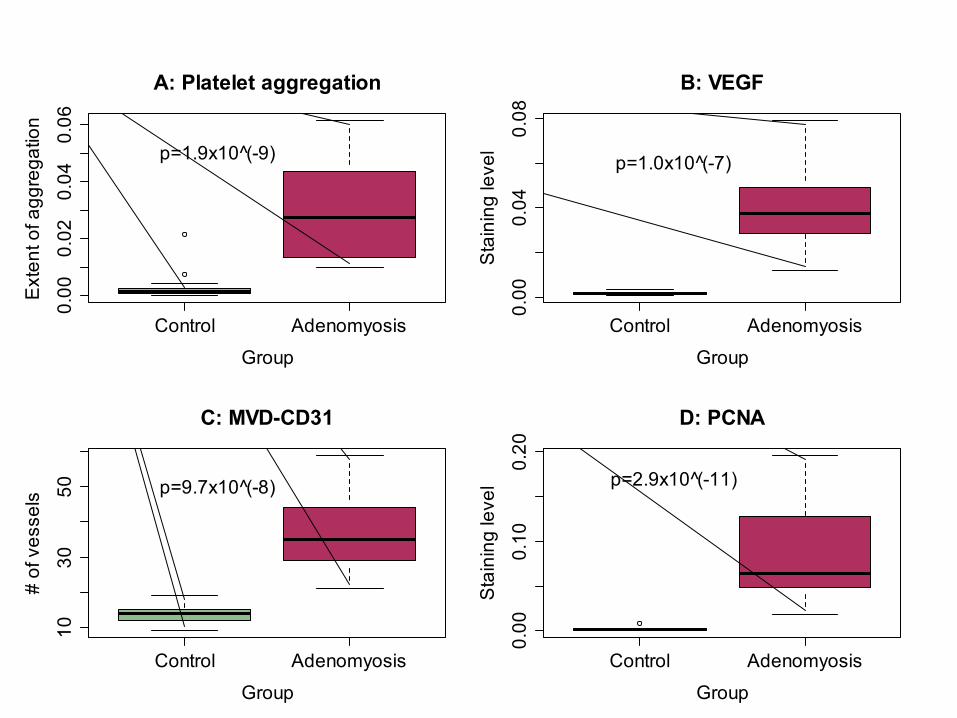
Control Adenomyosis
0.00
0.02
0.04
0.06
A: Platelet aggregation
Group
Ext
ent o
f agg
rega
tion
p=1.9x10 (̂-9)
Control Adenomyosis
0.00
0.04
0.08
B: VEGF
Group
Sta
inin
g le
vel
p=1.0x10 (̂-7)
Control Adenomyosis
1030
50
C: MVD-CD31
Group
# of
ves
sels p=9.7x10 (̂-8)
Control Adenomyosis
0.00
0.10
0.20
D: PCNA
Group
Sta
inin
g le
vel p=2.9x10 (̂-11)
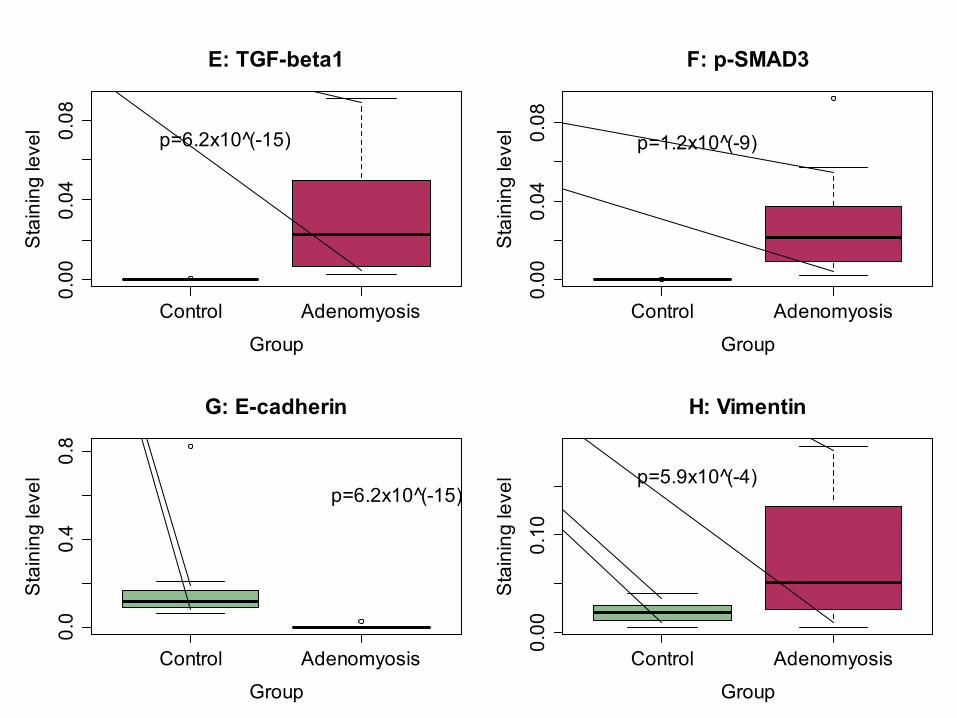
Control Adenomyosis
0.00
0.04
0.08
E: TGF-beta1
Group
Sta
inin
g le
vel p=6.2x10 (̂-15)
Control Adenomyosis
0.00
0.04
0.08
F: p-SMAD3
Group
Sta
inin
g le
vel
p=1.2x10 (̂-9)
Control Adenomyosis
0.0
0.4
0.8
G: E-cadherin
Group
Sta
inin
g le
vel
p=6.2x10 (̂-15)
Control Adenomyosis
0.00
0.10
H: Vimentin
Group
Sta
inin
g le
vel p=5.9x10 (̂-4)
Control Adenomyosis
0.00
0.10
I: alpha-SMA
Group
Sta
inin
g le
vel
p=1.7x10 (̂-9)
Control Adenomyosis
0.00
0.10
J: Collagen I
Group
Sta
inin
g le
vel
p=8.7x10 (̂-13)
Control Adenomyosis
0.00
0.06
0.12
K: LOX
Group
Sta
inin
g le
vel
p=1.0x10 (̂-7)
Control Adenomyosis
0.00
0.04
0.08
L: PR-B
Group
Sta
inin
g le
vel
p=5.5x10 (̂-10)
Control Adenomyosis
010
2030
4050
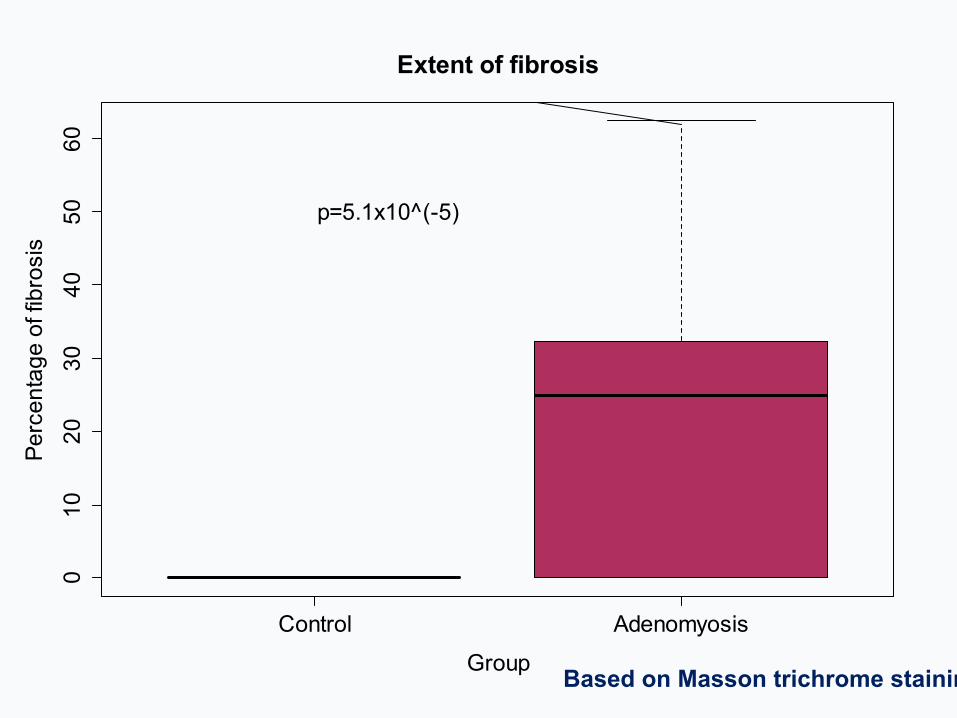
60Extent of fibrosis
Group
Perc
enta
ge o
f fib
rosi
s
p=5.1x10^(-5)
Based on Masson trichrome staining
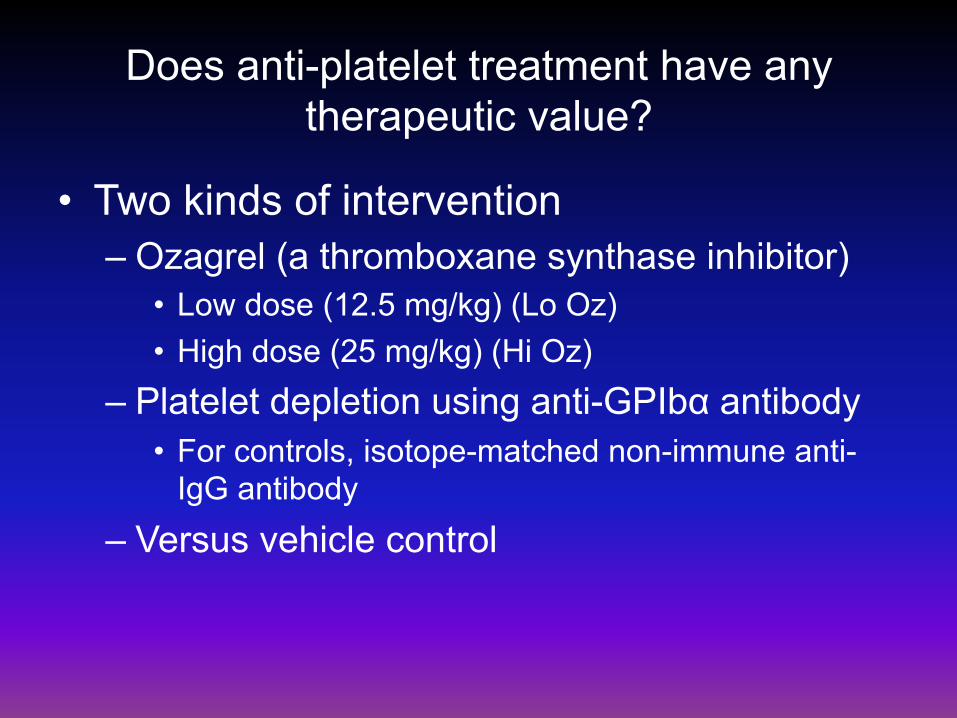
Does anti-platelet treatment have any therapeutic value?
• Two kinds of intervention – Ozagrel (a thromboxane synthase inhibitor)
• Low dose (12.5 mg/kg) (Lo Oz) • High dose (25 mg/kg) (Hi Oz)
– Platelet depletion using anti-GPIbα antibody • For controls, isotope-matched non-immune anti-
IgG antibody – Versus vehicle control
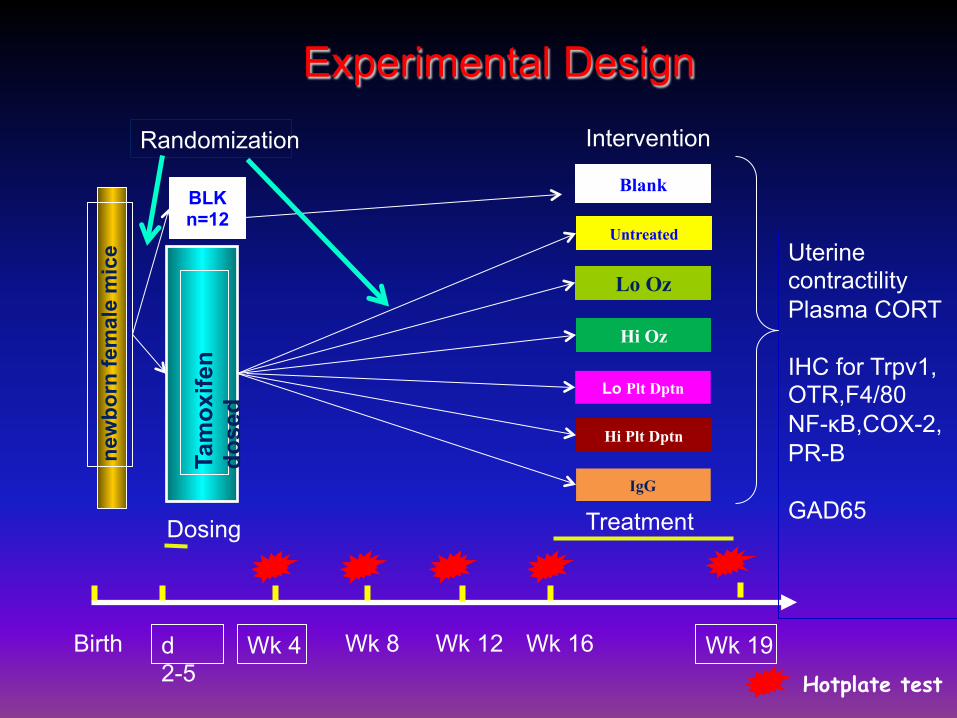
Experimental Design ne
wbo
rn fe
mal
e m
ice
Randomization
d 2-5
Wk 4 Wk 19
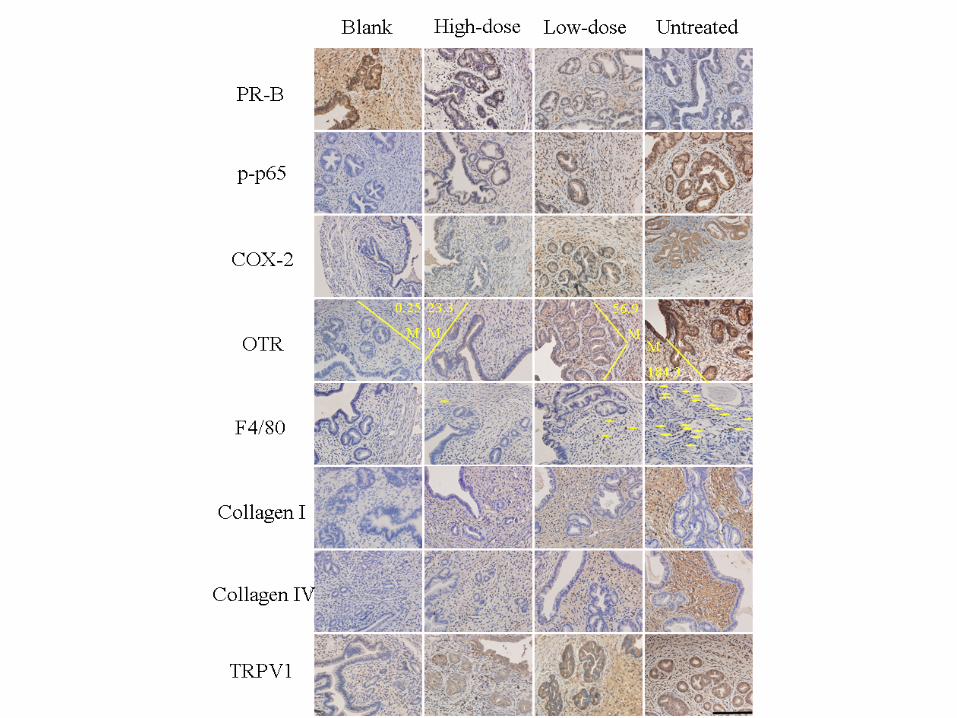
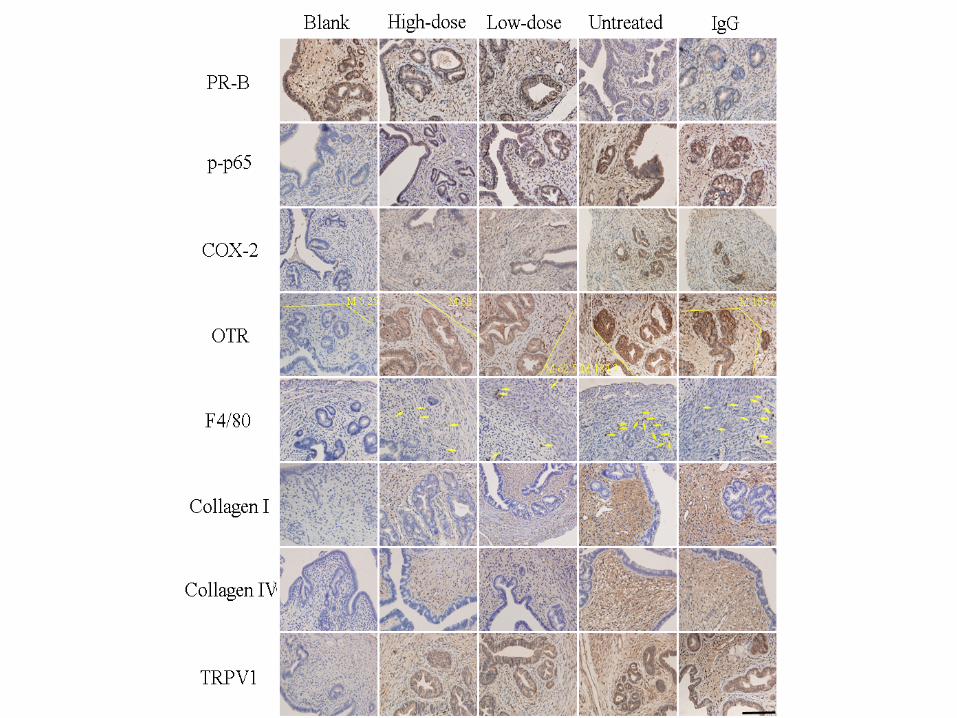
Uterine contractility Plasma CORT IHC for Trpv1, OTR,F4/80 NF-κB,COX-2, PR-B GAD65
Tam
oxife
n do
sed
BLK n=12
Blank
Lo Oz
Hi Oz
IgG
Wk 8 Wk 12 Wk 16 Birth
Intervention
Hotplate test
Lo Plt Dptn
Hi Plt Dptn
Untreated
Dosing Treatment
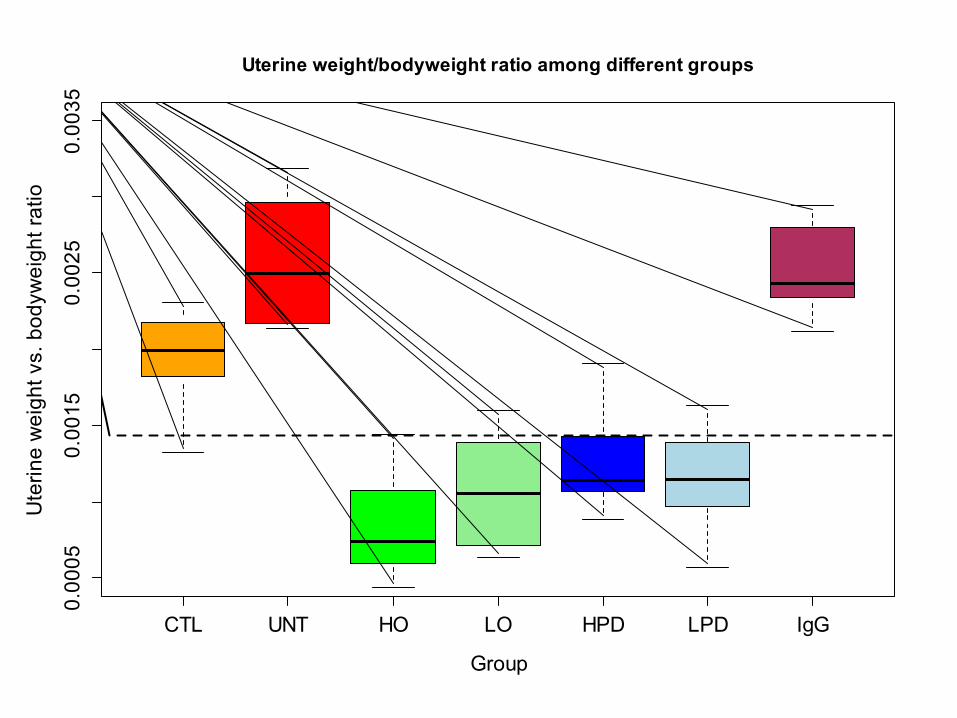
CTL UNT HO LO HPD LPD IgG
0.00
050.
0015
0.00
250.
0035
Uterine weight/bodyweight ratio among different groups
Group
Ute
rine
wei
ght v
s. b
odyw
eigh
t rat
io
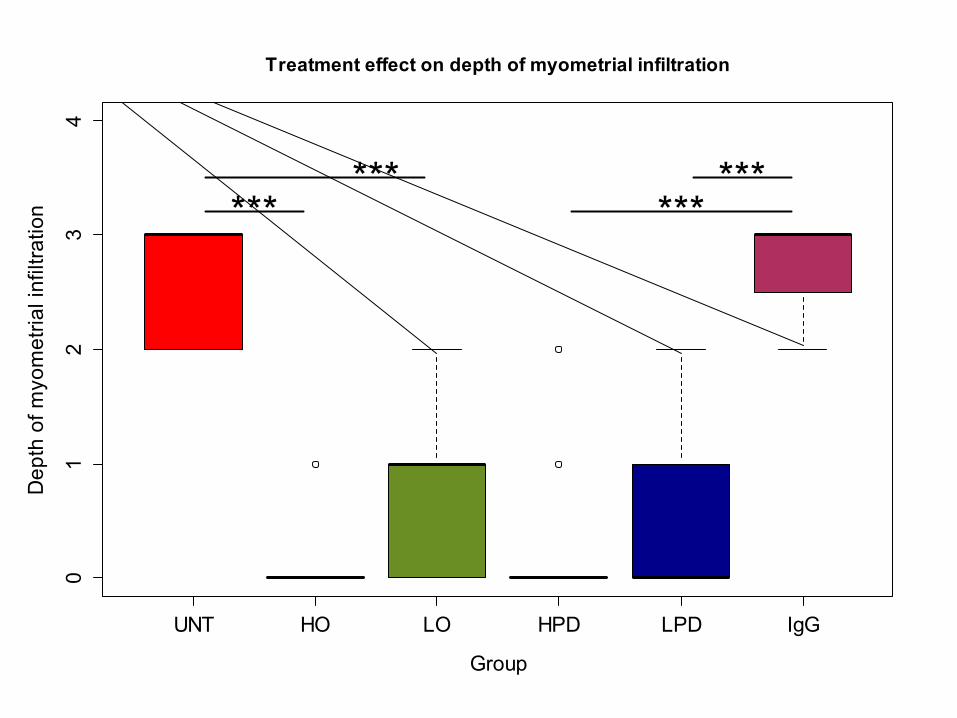
UNT HO LO HPD LPD IgG
01
23
4Treatment effect on depth of myometrial infiltration
Group
Dep
th o
f myo
met
rial i
nfilt
ratio
n ******
******
C CC
C C
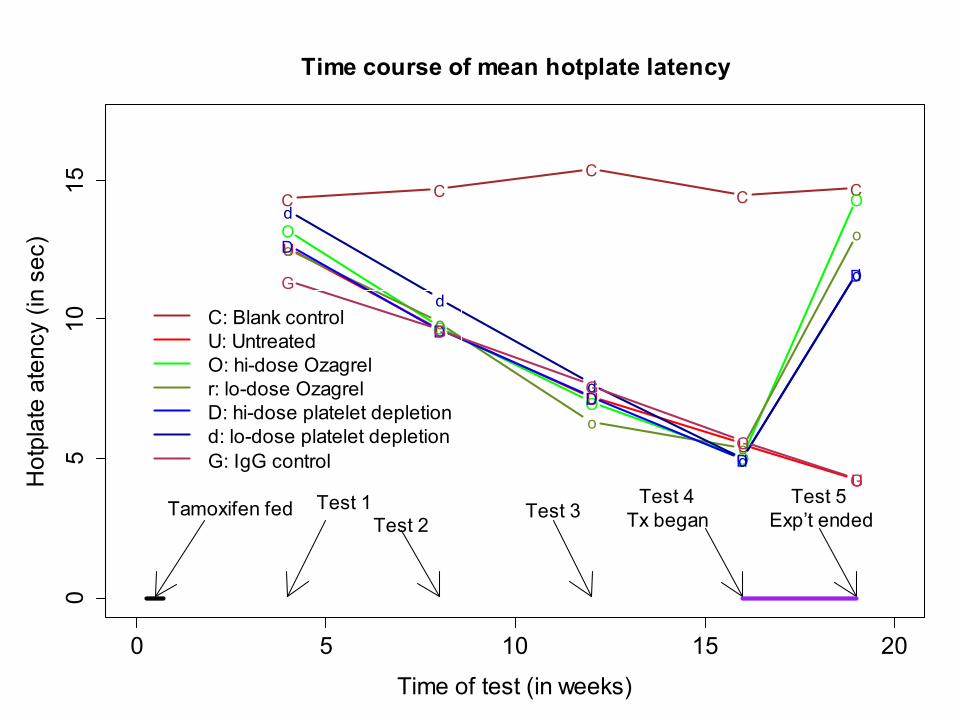
0 5 10 15 20
05
1015
Time course of mean hotplate latency
Time of test (in weeks)
Hot
plat
e at
ency
(in
sec) U
U
U
U
U
O
O
O
O
O
o
o
oo
oD
D
D
D
D
d
d
d
d
dG
G
G
G
G
C: Blank controlU: UntreatedO: hi-dose Ozagrelr: lo-dose OzagrelD: hi-dose platelet depletiond: lo-dose platelet depletionG: IgG control
Tamoxifen fed Test 1Test 2
Test 3Test 4
Tx beganTest 5
Exp’t ended
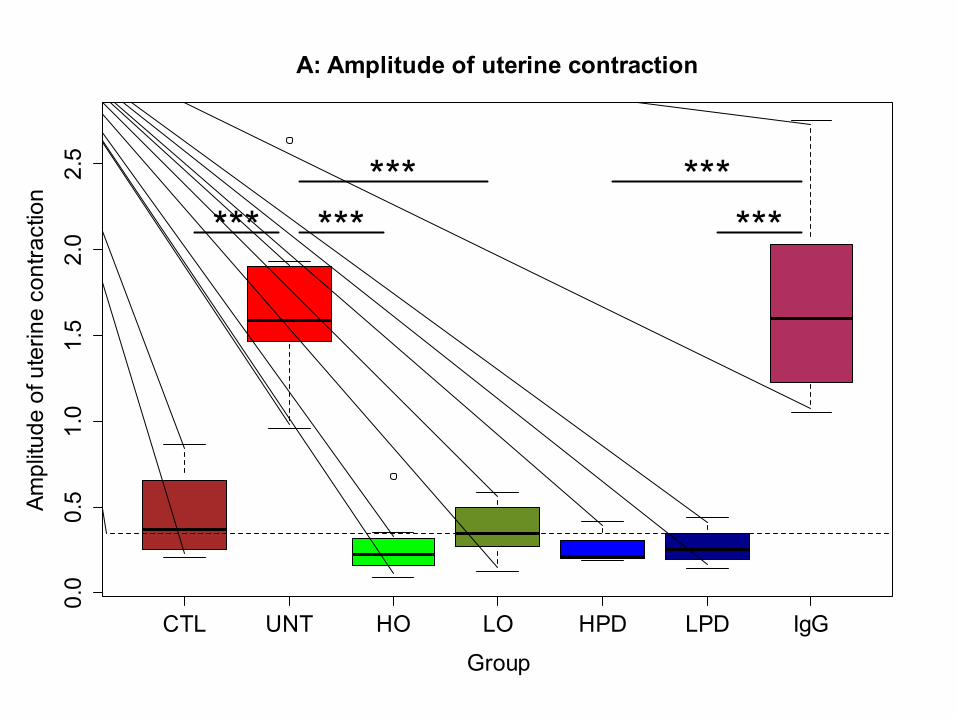
CTL UNT HO LO HPD LPD IgG
0.0
0.5
1.0
1.5
2.0
2.5
A: Amplitude of uterine contraction
Group
Ampl
itude
of u
terin
e co
ntra
ctio
n
*** ****** ***
***
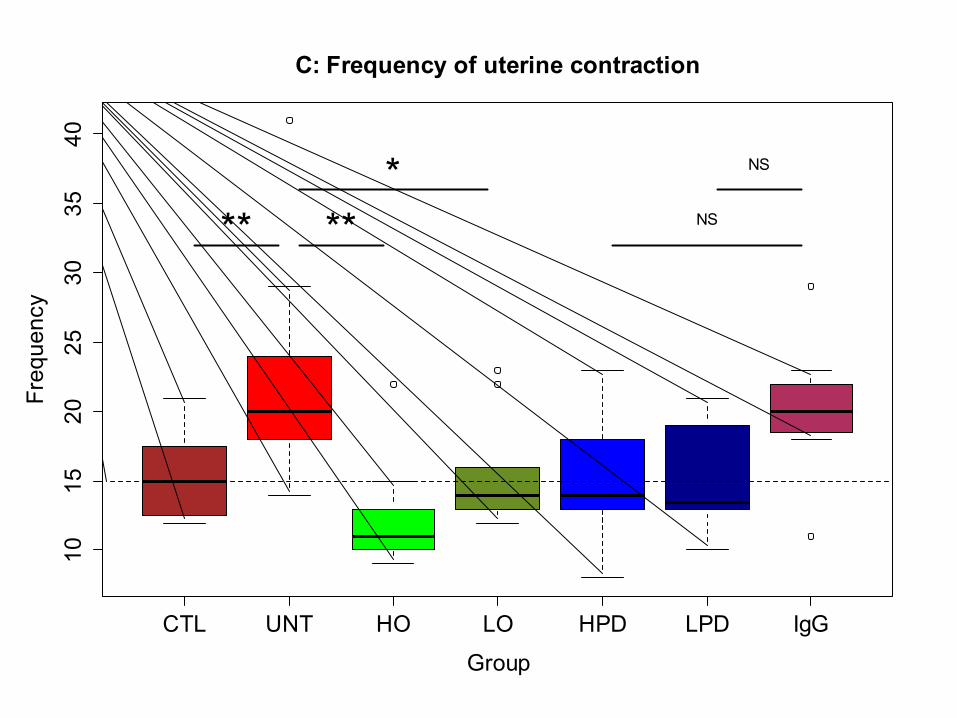
CTL UNT HO LO HPD LPD IgG
1015
2025
3035
40C: Frequency of uterine contraction
Group
Frequency
** ***
NS
NS
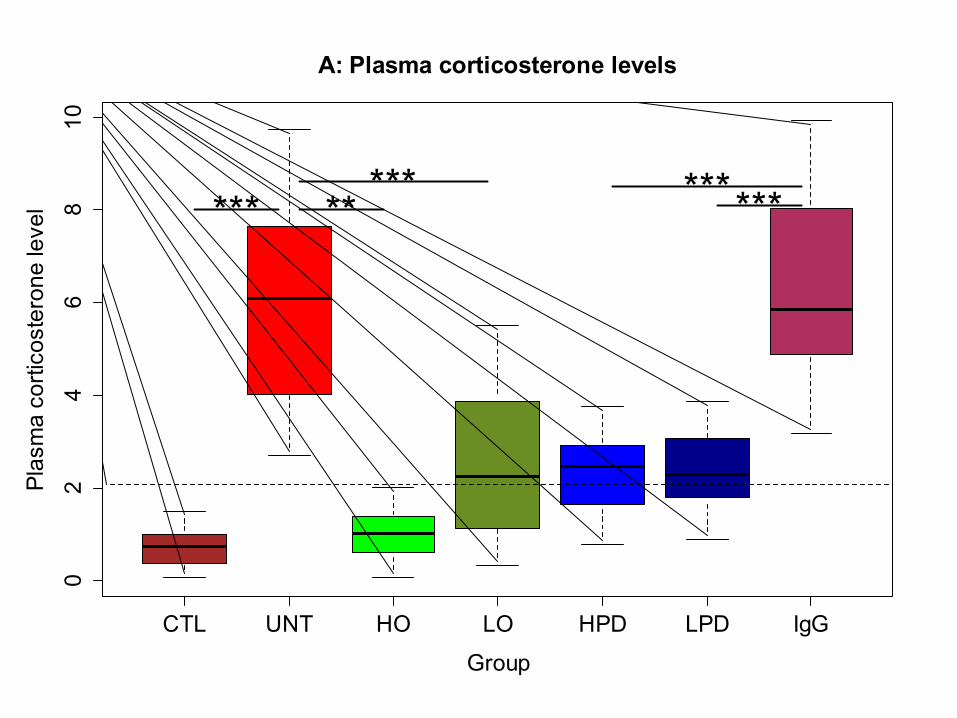
CTL UNT HO LO HPD LPD IgG
02
46
810
A: Plasma corticosterone levels
Group
Plas
ma
corti
cost
eron
e le
vel *** **
*** ******
4 6 8 10 12 14 16
02
46
810
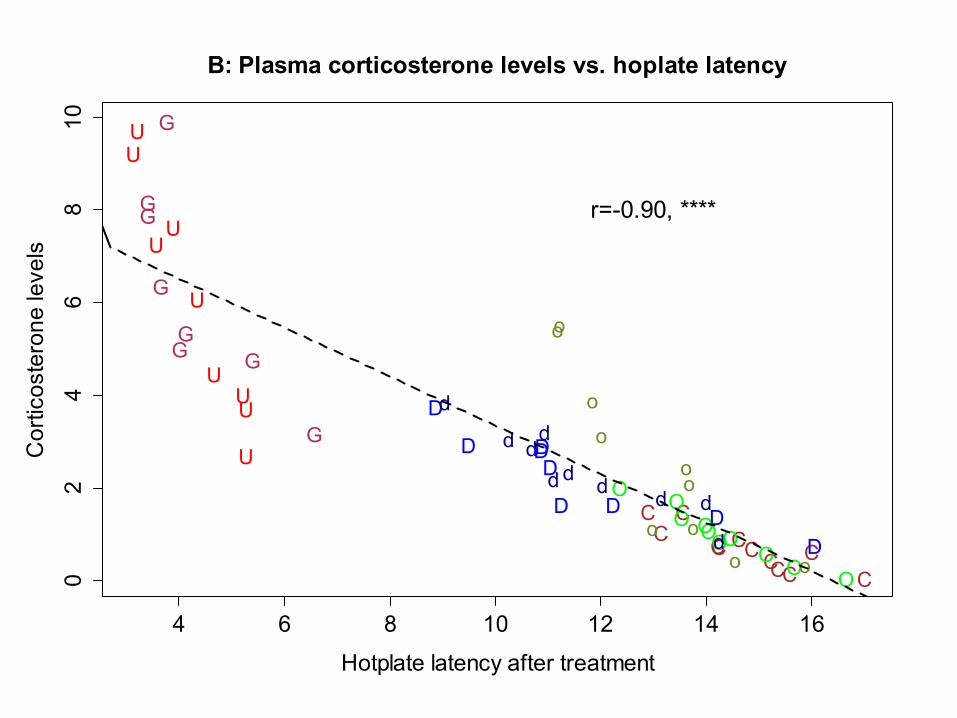
B: Plasma corticosterone levels vs. hoplate latency
Hotplate latency after treatment
Cor
ticos
tero
ne le
vels
CC
CC
C
CCCC
CCC
U
U
U
U
UU
U
U
U
OO
O
O
O O
O
O
O
O
o
o
o
o
o
o
o
o
o
oD
D
D
D D
D
D
DD
dd
d
d
dd
dd
dd
G
GG
G
G
G
G
G
r=-0.90, ****
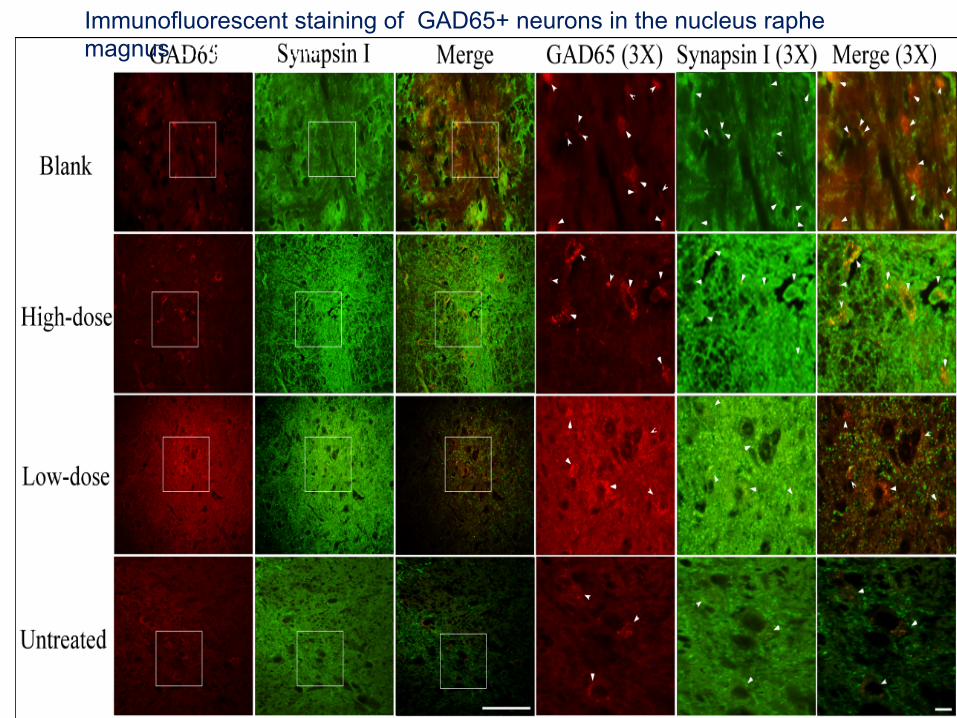
Immunofluorescent staining of GAD65+ neurons in the nucleus raphe magnus GAD65 in the
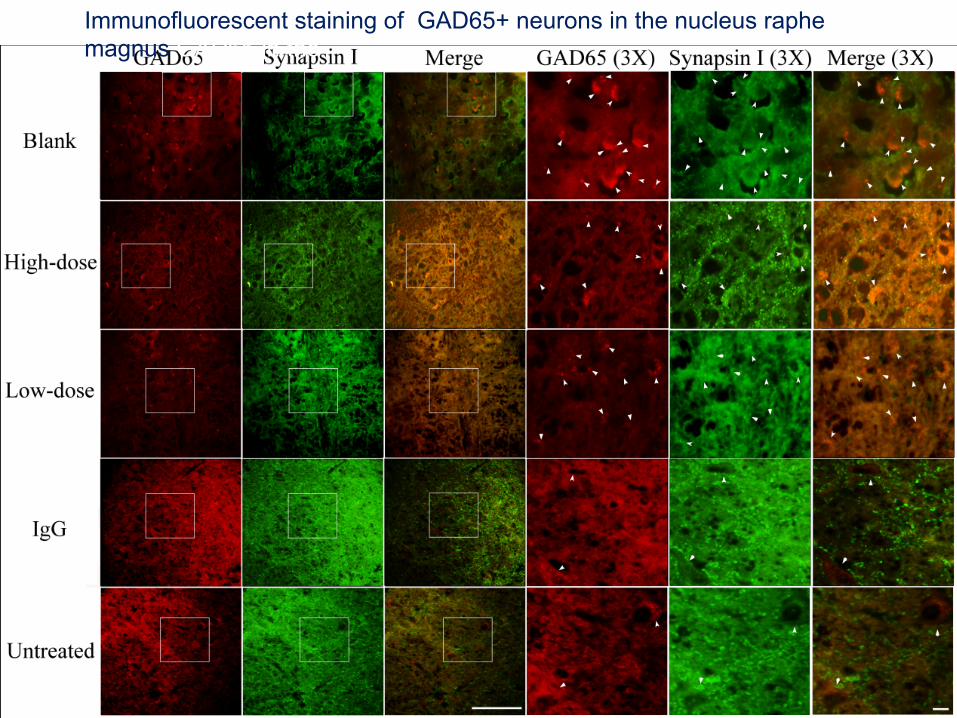
Immunofluorescent staining of GAD65+ neurons in the nucleus raphe magnus GAD65 in the
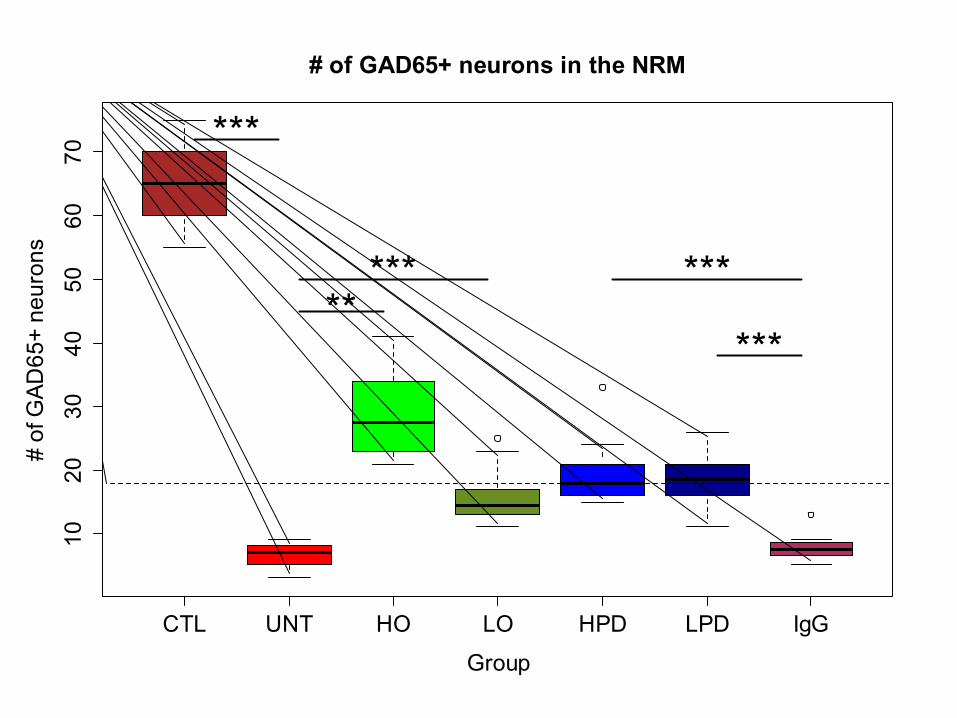
CTL UNT HO LO HPD LPD IgG
1020
3040
5060
70# of GAD65+ neurons in the NRM
Group
# of
GAD
65+
neur
ons
***
***** ***
***
CTL UNT HO LO HPD LPD IgG
0.00
0.02
0.04
0.06
0.08
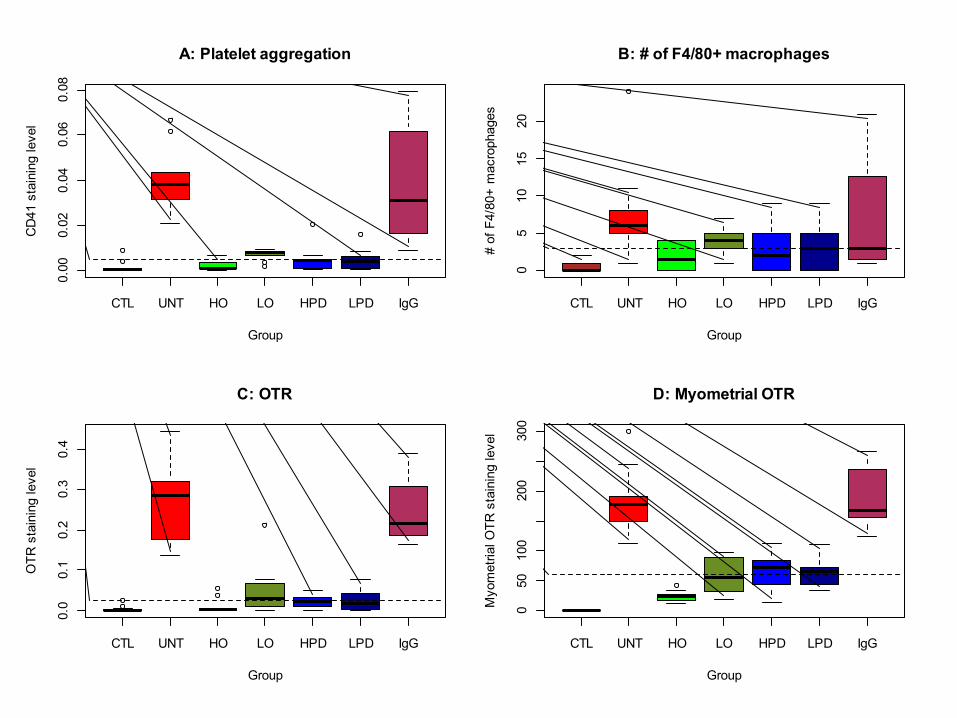
A: Platelet aggregation
Group
CD
41 s
tain
ing
leve
l
CTL UNT HO LO HPD LPD IgG
05
1015
20
B: # of F4/80+ macrophages
Group
# of
F4/
80+
mac
roph
ages
CTL UNT HO LO HPD LPD IgG
0.0
0.1
0.2
0.3
0.4
C: OTR
Group
OTR
sta
inin
g le
vel
CTL UNT HO LO HPD LPD IgG
050
100
200
300
D: Myometrial OTR
Group
Myo
met
rial O
TR s
tain
ing
leve
l
CTL UNT HO LO HPD LPD IgG
0.00
0.10
0.20
0.30
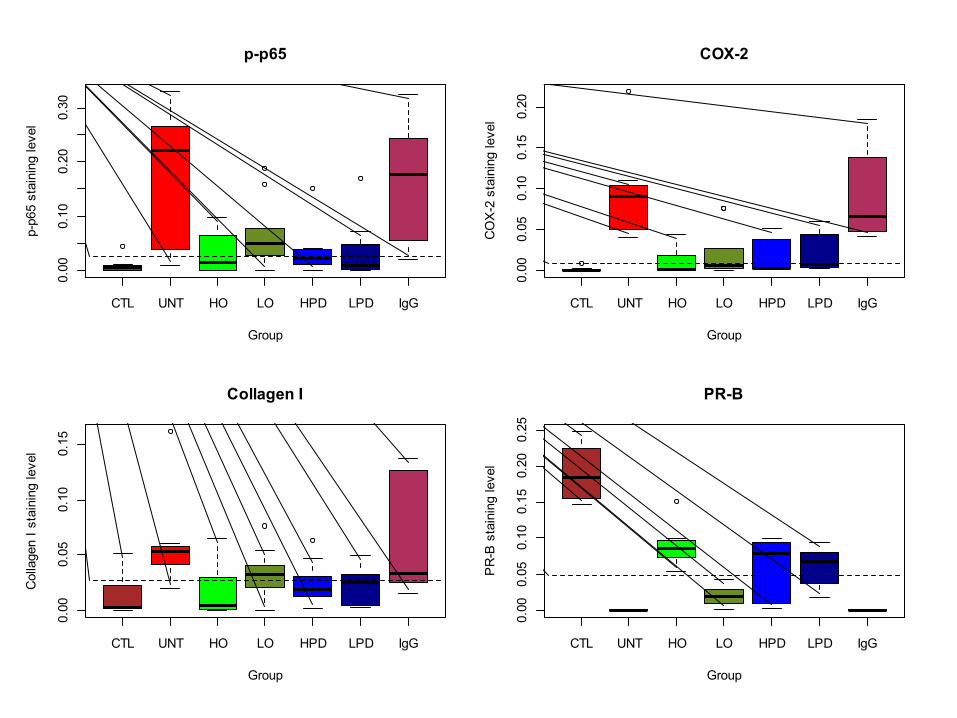
p-p65
Group
p-p6
5 st
aini
ng le
vel
CTL UNT HO LO HPD LPD IgG
0.00
0.05
0.10
0.15
0.20
COX-2
Group
CO
X-2
sta
inin
g le
vel
CTL UNT HO LO HPD LPD IgG
0.00
0.05
0.10
0.15
Collagen I
Group
Col
lage
n I s
tain
ing
leve
l
CTL UNT HO LO HPD LPD IgG
0.00
0.05
0.10
0.15
0.20
0.25
PR-B
Group
PR
-B s
tain
ing
leve
l
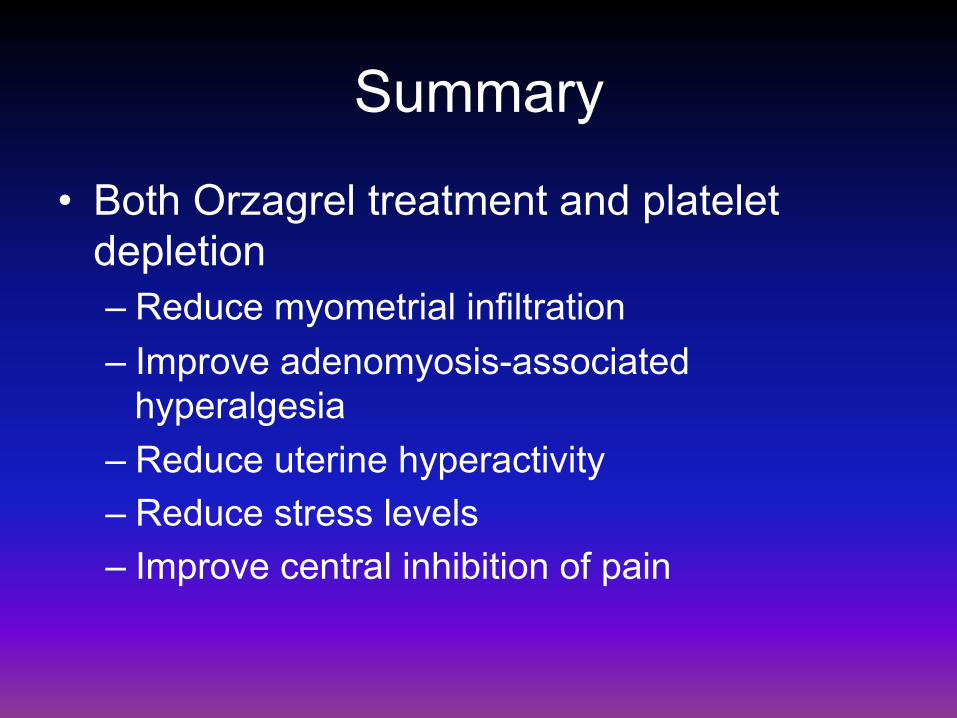
Summary
• Both Orzagrel treatment and platelet depletion – Reduce myometrial infiltration – Improve adenomyosis-associated
hyperalgesia – Reduce uterine hyperactivity – Reduce stress levels – Improve central inhibition of pain

Are there any human data?
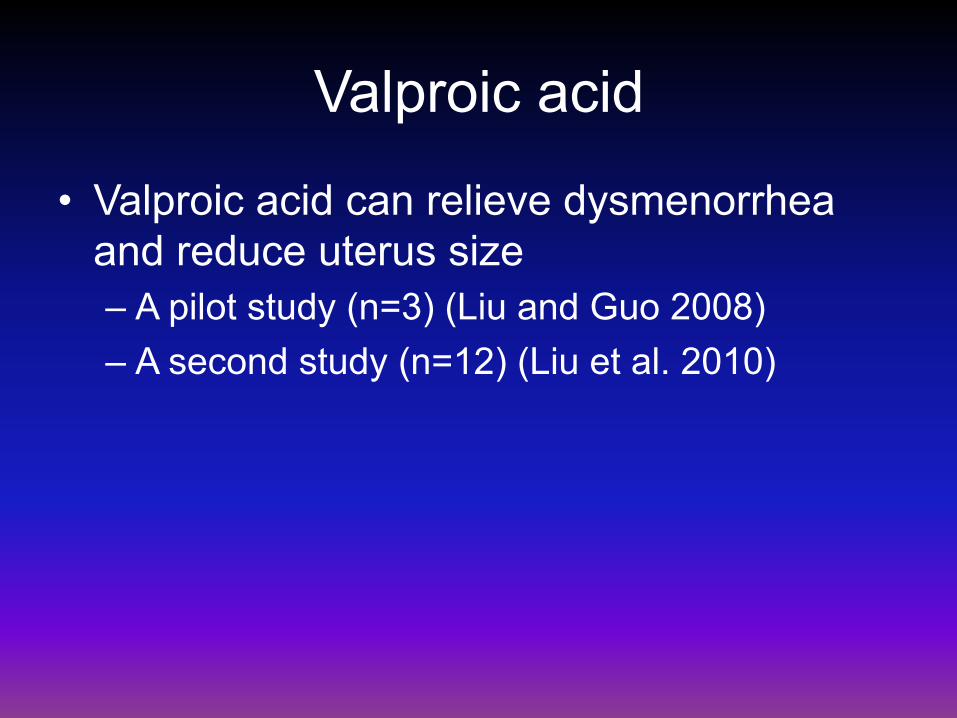
Valproic acid
• Valproic acid can relieve dysmenorrhea and reduce uterus size – A pilot study (n=3) (Liu and Guo 2008) – A second study (n=12) (Liu et al. 2010)
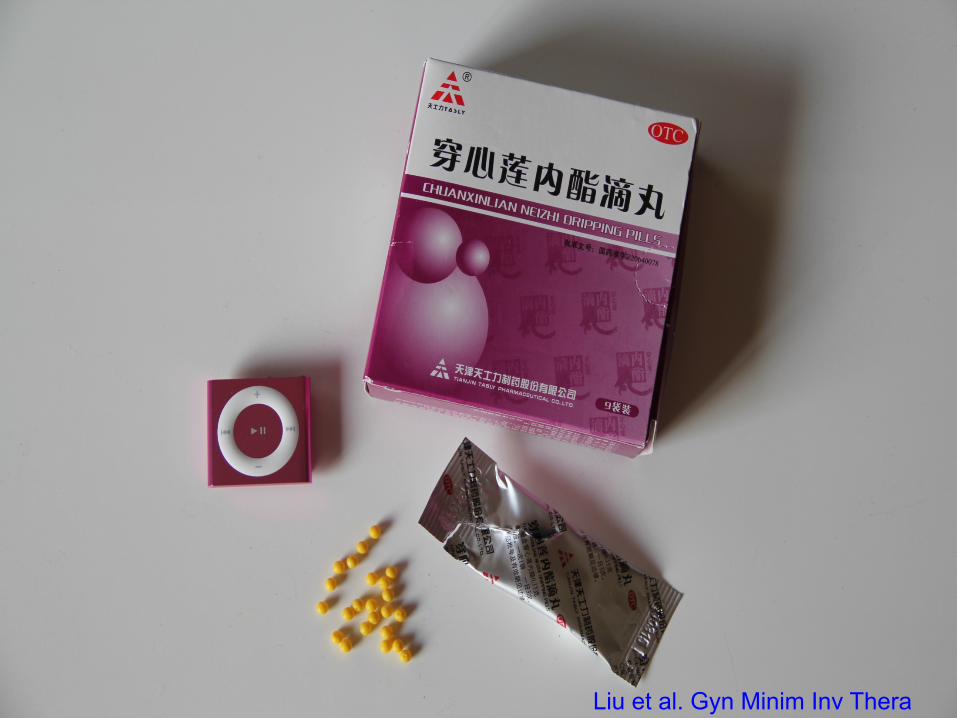
Liu et al. Gyn Minim Inv Thera 2015
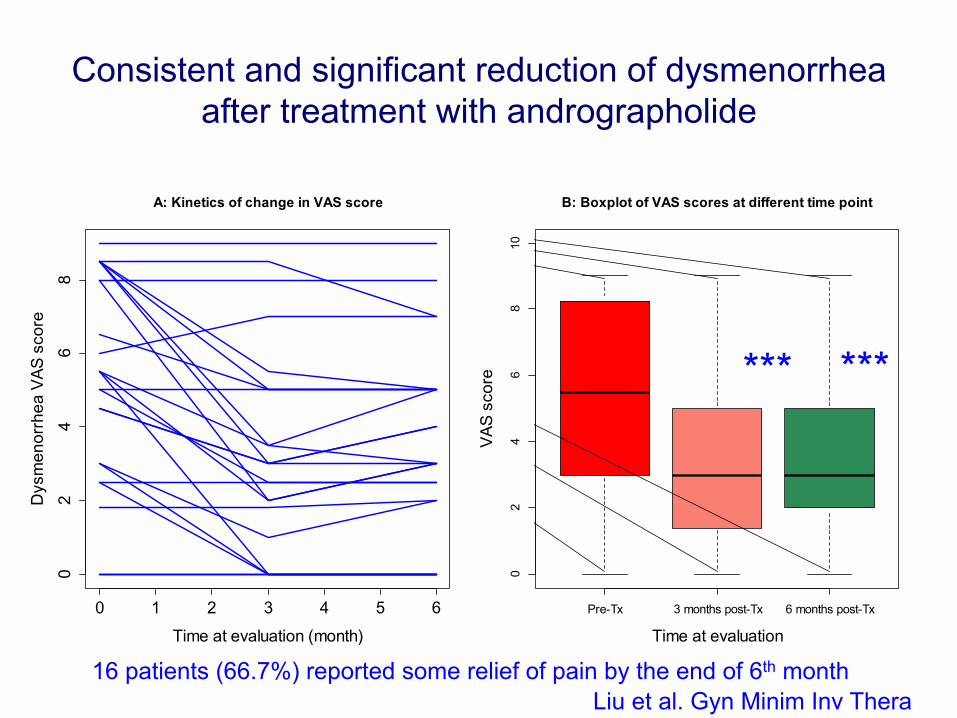
Consistent and significant reduction of dysmenorrhea after treatment with andrographolide
*** ***
0 1 2 3 4 5 6
02
46
8
A: Kinetics of change in VAS score
Time at evaluation (month)
Dys
men
orrh
ea V
AS s
core
Pre-Tx 3 months post-Tx 6 months post-Tx
02
46
810
B: Boxplot of VAS scores at different time point
Time at evaluation
VAS
scor
e *** ***
16 patients (66.7%) reported some relief of pain by the end of 6th month Liu et al. Gyn Minim Inv Thera 2015
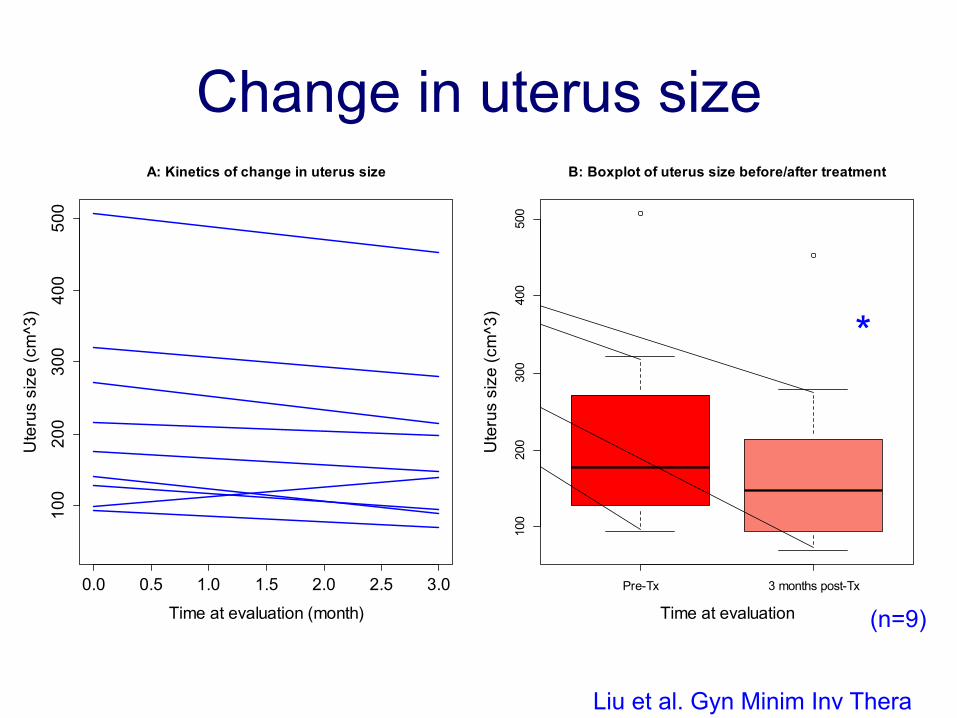
Change in uterus size
Caution: n=11 at Month 3
*
0.0 0.5 1.0 1.5 2.0 2.5 3.0
100
200
300
400
500
A: Kinetics of change in uterus size
Time at evaluation (month)
Ute
rus
size
(cm
^3)
Pre-Tx 3 months post-Tx
100
200
300
400
500
B: Boxplot of uterus size before/after treatment
Time at evaluation
Ute
rus
size
(cm
^3)
*
(n=9)
Liu et al. Gyn Minim Inv Thera 2015
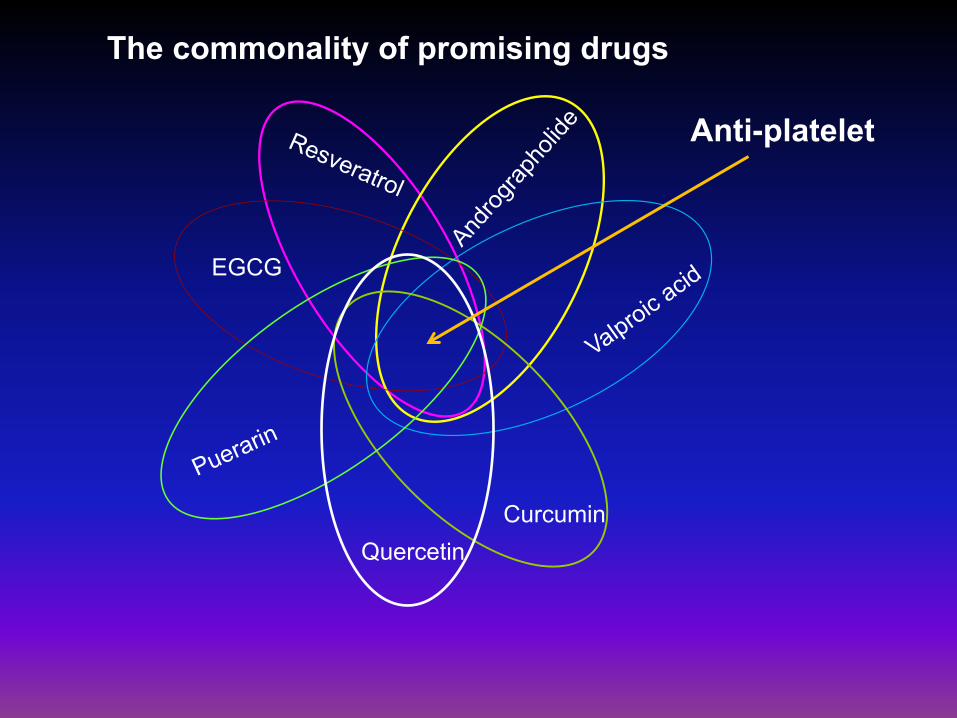
EGCG
Curcumin Quercetin
Anti-platelet
The commonality of promising drugs
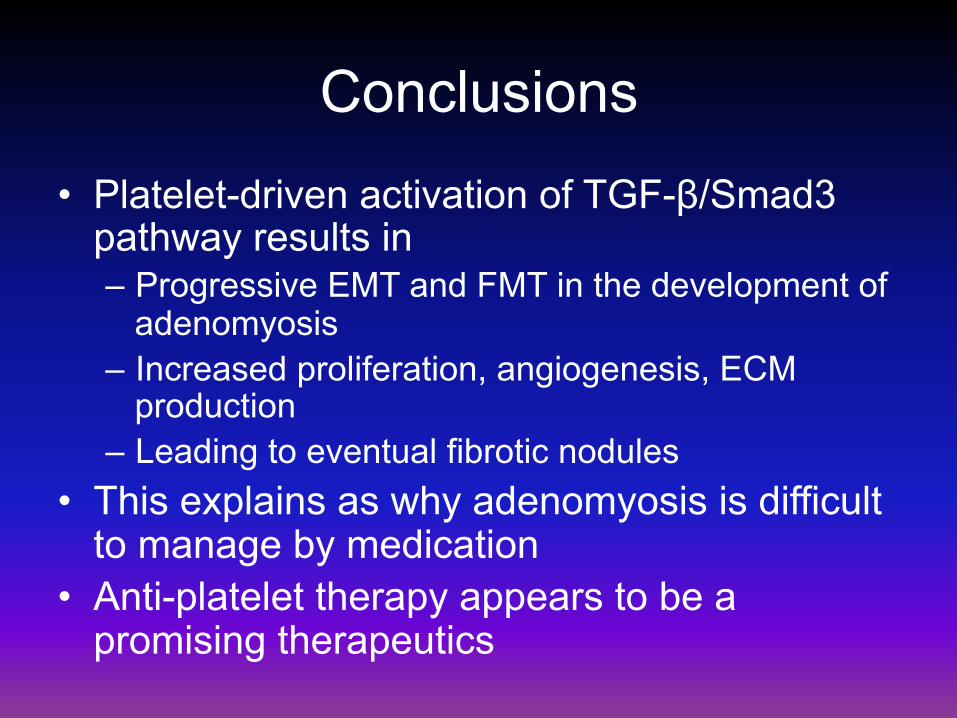
Conclusions • Platelet-driven activation of TGF-β/Smad3
pathway results in – Progressive EMT and FMT in the development of
adenomyosis – Increased proliferation, angiogenesis, ECM
production – Leading to eventual fibrotic nodules
• This explains as why adenomyosis is difficult to manage by medication
• Anti-platelet therapy appears to be a promising therapeutics
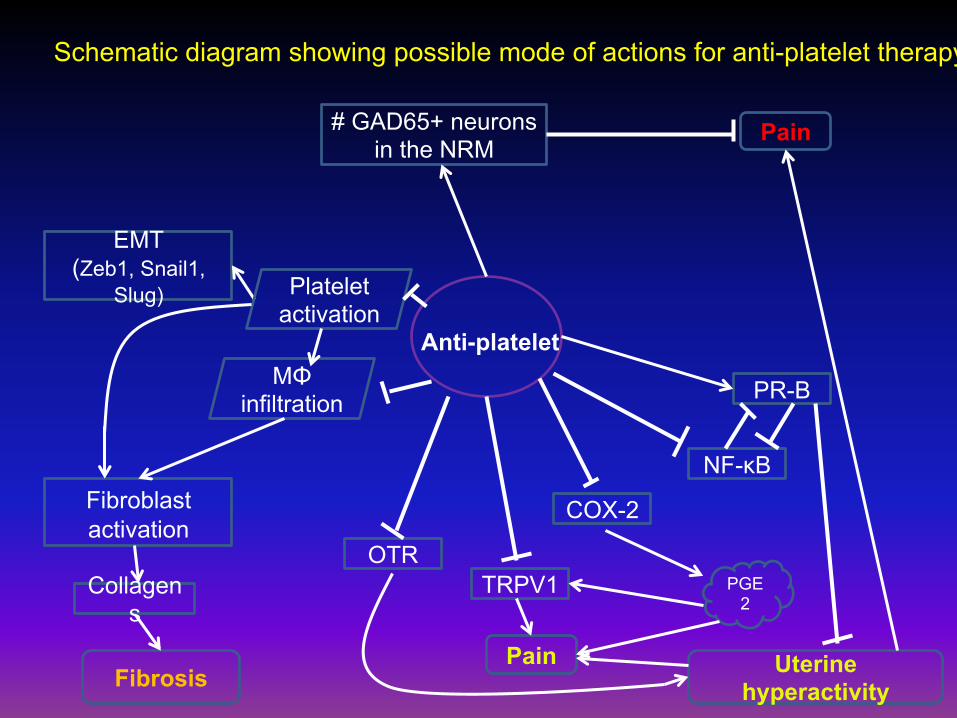
Anti-platelet
PR-B
NF-κB
COX-2
OTR TRPV1
EMT (Zeb1, Snail1,
Slug)
Fibroblast activation
MΦ infiltration
PGE2
Fibrosis
Collagens
# GAD65+ neurons in the NRM
Uterine hyperactivity
Pain
Platelet activation
Pain
Schematic diagram showing possible mode of actions for anti-platelet therapy
Acknowledgment • Minghong Shen, M.D. • Bo Zhu, M.D., M.S. • Qi Zhang, M.D., M.S. • Xishi Liu, M.D., Ph.D. • Hongqi Zhang, M.D. • Yanbo Du, M.D., M.S. • Jie Duan, M.D., M.S. • Qiumin Qi, M.D. • Ding Ding, M.D., Ph.D. • National Science Foundation of China