Embed Size (px)
Citation preview

Cracking the Codes: Do Electronic Medical Records
Facilitate Hospital Revenue Enhancement?
Bingyang Li∗
January 18, 2014
Abstract
Electronic Medical Records (EMR) have great potential to improve the efficiency and
effectiveness of patient care delivery. However, the use of EMR could enable hospitals
to engage in “revenue-enhancing practice” such as upcoding, thereby raising health care
expenditures and potentially jeopardizing quality. This study uses a longitudinal multi-
state patient discharge dataset to examine the effect of EMR adoption on medical coding
and billing in inpatient settings. I find that the fraction of patients who are assigned
to higher-paying DRGs increases significantly after EMR adoption. I estimate that this
type of billing change alone increases the reimbursement for inpatient services by $1.3
billion annually. The effect of EMR on coding and billing is particularly strong among
for-profit hospitals, financially distressed hospitals, Medicare patients, and billing codes
where upcoding potential was previously less exploited. Hospitals document more diag-
noses but do not perform more procedures. These findings together reveal that hospitals
are sophisticated in their use of EMR as a tool to boost revenue.
∗Kellogg School of Management, Northwestern University. [email protected]. I amindebted to David Dranove and Leemore Dafny for their continuous guidance and support. I am also gratefulto Shane Greenstein, and Kai Zheng for their encouragement and advice. I would like to thank Jin Li, JeffMcCullough, Frank Limbrock, Michael Powell, Benjamin Jones, Chris Ody, Danielle Li, Kosuke Uetake andZhuqing Yang for valuable discussions. Conversations with David Artz vastly improved my understandingof institutional background about health IT. This work has also benefited from the comments of seminarparticipants at Kellogg School of Management and the Fourth Annual Workshop on Health IT and Economics.I am responsible for all opinions and errors.
1

1 Introduction
Electronic Medical Records (EMR) are promising in increasing health care efficiency and
improving quality. The HITECH Act introduced in 2009 mandated a gradual shift to EMR
in the healthcare industry and marked an unprecedented investment of $20 billion in health
IT by the federal government, in the hope that adopting EMR will help providers reduce
duplicate medical tests, improve care coordination, and eventually reduce costs and improve
quality. In reality, however, there is a lack of consistent evidence that EMR actually delivers
the expected benefits. Instead, increasing concerns have emerged that adopting EMR is
likely to make it easier for providers to switch patients to higher-paying billing codes, thereby
potentially contributing to rising health expenditures and jeopardizing quality of care. In
this paper, I use multistate patient discharge data to examine the effect of EMR adoption on
hospitals’ revenue-enhancing behavior.
In September 2012, a New York Times front-page article documented multiple cases of
sharp rises in the highest-paying claims after providers adopted EMR and detailed the ways
in which EMR use might be contributing to a rise in Medicare billing (Abelson et al., 2012).
A Washington Post article discussed the fact that EMR vendors explicitly advertise that their
products will help providers fuel the level of billing codes: “one electronic medical records
company predicts on its web site that its product will result in an increase of one coding
level for each patient visit”(Schulte et al., 2012). Providers responded to such accusations of
“upcoding” by claiming that previously they had been ”undercoding” and that the increase
in the number of patients in higher-paying billing codes simply reflects a general change
in practice, which has lead to better documentation of what was previously done but not
recorded. These debates have also received substantial attention from the government. In
September 2012, the Obama Administration warned US hospitals that there were “troubling
indications” of abuse in the way hospitals use electronic records to bill for Medicare and
Medicaid reimbursement(US Department of Health and Human Services & US Department
of Justice, 2012). Despite all the debates and concerns, there is no systematic research linking
EMR use to hospitals’ revenue-enhancing practices or estimating the magnitude of the effect.
Inflated billing codes have an extensive impact on various aspects of the healthcare in-
dustry. First, it leads to a boost in medical payments that may not be justified by clinical
benefits. Second, if payers realize that more healthy patients are assigned with higher-paying
billing codes and decide to recalibrate reimbursement amount, providers that do not engage
in such revenue-enhancing behavior would be financially punished. Third, it also undermines
the reliability of quality measures. Quality measures are risk adjusted, hence a false increase
in case-mix indices would lead to a false improvement in quality measures. This is especially
2

concerning when different hospitals inflate their billings differently. Fourth, fraudulent upcod-
ing could destroy data integrity and compromise the quality of care in the long run. Unlike
previous upcoding studies (Coulam and Gaumer, 1991; Bowblis and Brunt, 2013; Brunt, 2011;
Dafny, 2005), which examine changes in the the benefits of upcoding in a certain subpopula-
tion of patients, EMR adoption reduces the cost of upcoding and could potentially affect care
provision among all patient populations and settings.
This study assembles patient discharge data from six states (AZ, CA, CO, MA, NJ, and
WA) from 1998 to 2010, along with information on hospitals’ EMR adoption as well as hospital
and patient characteristics over the same period. I measure the extent of hospitals’ revenue-
enhancing practice using fraction, the share of patients who are assigned the higher-paying
code within each DRG pair; the two codes within each pair share the same primary diagnosis
but differ in the presence of complications (e.g., diabetes with complications and diabetes
without complications). Figure 1 shows the trend of this measure in the raw data. I regress
fraction on dummy variables indicating the years relative to the adoption year without any
controls and plot the coefficients. The figure shows that there is a general upward trend in
fraction, which is consistent with the phenomenon of “DRG creep”1 documented in literature,
but the slope is steeper after EMR adoption, indicating that EMR adoption facilitates such
revenue enhancement.
My main analysis regresses fraction on EMR adoption, controlling for a rich set of hospital
and patient characteristics, as well as hospital, DRG-pair and year fixed effects, to examine
whether the adoption of EMR systems leads to a higher level of revenue-enhancing practice in
hospitals. The key identification assumption is that EMR adoption is uncorrelated with any
time-varying unobservable factors that are correlated with the fraction of patients assigned
the higher-paying DRGs within each pair. I further explore the heterogeneity in the effect
of EMR across different types of hospitals, patient populations, and billing codes. I also
examine changes in diagnosis codes and treatment intensity to show what exactly hospitals
do to generate additional reimbursements.
I find that hospitals are more likely to assign patients higher-paying billing codes after
adopting EMR. The adoption of EMR is associated with a 1.1 percentage point increase in the
fraction of patients assigned the higher-paying DRGs. This can be translated into an annual
increase of $1.3 billion in the reimbursement for inpatient care alone. The adoption of EMR
does not have the largest effect right away but an increasing effect over at least three years
after the adoption year. This is consistent with findings in Dranove et al. (2013), which shows
that there is a delay in the expected effect of EMR due to the complementary inventions
1This term refers to the phenomenon that patients are increasingly coded into DRGs with higher weightsover the past few decades
3

needed to make new IT more productive in specific settings.
I also find substantial heterogeneity in such effect of EMR on hospital billing. Consistent
with previous studies (Dafny, 2005; Silverman and Skinner, 2004), I find that the effect of
EMR adoption is larger in for-profit hospitals and financially distressed hospitals, which are
likely to place more weight on financial returns or be more willing to risk detection. In
addition, the effect is more prominent among Medicare patients, where the monitoring of
coding is likely to be less compared with private payers.
In addition, I also find heterogeneity across DRG codes with different financial incentives
for upcoding. In contrast to previous evidence (Dafny, 2005), I find that EMR adoption
has less of an effect on DRG pairs with larger financial incentives to upcode. The fraction
of patients in the higher-paying DRG codes has been constantly rising over the past three
decades, yet the potential for upcoding is not infinite. The larger the financial incentives
for upcoding are, the higher the pre-adoption coding level is and the smaller the additional
boost due to EMR adoption is likely to be. This phenomenon is consistent with the ceiling
effect—providers seem to exploit more of the upcoding potential where the financial return is
larger even without EMR. Since upcoding is increasingly costly, there is not as much potential
for further revenue-enhancing behavior compared with the codes that started at a lower level
before EMR adoption.
By running the same model using the measures of documented diagnosis and treatment
intensity as dependent variables, I find that hospitals document more diagnoses after adopting
EMR but do not perform more procedures. This is consistent with the hospitals’ incentive
under the DRG payment system, which pays more for sicker patients but not for performing
more procedures.
This study has important policy implications. Policy makers, researchers, and health
professionals have been debating whether EMR can indeed improve quality or reduce costs.
My findings provide a potential explanation for why we often do not see the expected benefits
of EMR in practice. The evidence of providers actively using EMR as a tool to boost billing
suggests an urgent need of increasing the level of monitoring and audits at the payer side,
as well as the need of properly regulating the way vendors design their EMR products. In
addition, the heterogeneity in such effects of EMR across hospital types, patient types and
DRG pairs also provides extra information regarding the particular areas that audits should
target.
The paper also contributes to the stream of literature about upcoding. Since the intro-
duction of the PPS system in 1984 and the major adjustment in the DRG rules in 1988,
it is fairly rare to have a shock, that could potentially change providers’ coding behavior.
Adopting EMR is not simply picking up a new piece of technology; it is an enterprise-wide
4

adjustment of practice, including coding and billing. In addition, most previous studies fo-
cus on upcoding behavior incentivized by increasing financial benefits—largely involving the
reimbursement rules in certain DRG codes—while this paper looks at providers’ responses
to changes in the cost of upcoding. Lastly, this study documents evidence consistent with
“ceiling effects”, which has not been observed in previous studies.
The rest of the paper proceeds as follows: Section 2 describes the institutional setting
for EMR and upcoding. Section 3 presents a conceptual framework for how EMR may effect
upcoding and how this effect could be heterogeneous across different settings. Section 4
introduces the data sets that I use and defines key measures. Section 5 discusses the empirical
strategy and results. Section 6 presents the results of robustness check. Section 7 discusses
the policy implications and concludes.
2 Background
2.1 EMR use in US hospitals
EMR are not a specific type of software but a catchall expression used to characterize
a collection of information technologies used by hospitals to keep track of utilization, costs,
outcomes, and billing. Various software applications (or modules) are integrated into an
enterprise-wide EMR system, and some of these applications perform overlapping tasks. The
following are the major EMR applications: Clinical Decision Support (CDS) integrates pa-
tient data, pre-established rules, and clinical guidelines to generate diagnostic and treatment
advice; Clinical Data Repository (CDR) is a centralized database that integrates disparate
information about patients, such as clinical, financial, and administrative data from various
applications across the organization, into one single file; Order Entry replace faxes and paper
forms with electronic documents to streamline hospital operations; Computerized Provider
Order Entry (CPOE) involves realtime electronic entry of physician treatment orders that
can be communicated to the pharmacy, lab, and other departments, and it also provides
error checking for duplicate or incorrect doses or tests; Physician Documentation (PD) pro-
vides structured templates to help physicians generate meaningful documentation and valid
diagnostic codes. Together, these EMR applications collect, organize and report patients’
diagnostic information, test results, services, and medications and are often linked to admin-
istrative data such as demographics and insurance information.
Most hospitals purchase EMR systems from a range of commercial vendors. For inpatient
EMR, there are around ten major vendors who together represent more than 90% of the na-
tional market, and they all offer the major EMR applications mentioned above. Hospitals can
purchase individual applications from different vendors or adopt a whole suite of applications
5

from the same vendor. There are large variations in prices depending on bed size, functional-
ity, vendor, and negotiation, ranging from hundreds of thousands to tens of millions of dollars.
Hospitals pay an upfront fee as well as an additional one-seventh to one- fifth annually as a
maintenance fee. After purchasing the system, hospitals need to work together with the ven-
dor and/or hire external consultants to configure it based on their own needs and integrate
it in their legacy IT systems by building interfaces. EMR systems of different hospitals are
not interoperable unless special interfaces are built or both sides are using particular software
such as Care Everywhere from Epic; in general, however, such a scenario is still relatively rare
especially for unaffiliated hospitals.
If implemented under ideal conditions and executed according to the highest standards,
EMR can lead to lower personnel costs, higher diagnosis accuracy, fewer unnecessary and
duplicate tests, and superior outcomes with fewer costly complications. There is a general
belief that health information technology has the potential to create a more-efficient, safer, and
higher-quality care system. This belief is also reflected in the Health Information Technology
for Economic and Clinical Health Act (HITECH Act) passed in 2009, which committed an
unprecedented $20 billion to promote the adoption and use of health information technology
(HIT) and especially electronic health records (Blumenthal, 2009).
However, the use of IT in the US health care industry has lagged far behind other industries
(Jha et al., 2009). There are many reasons for this: Physicians, as the most important end
users, resist the adoption of EHR technologies because they are perceived as a potential threat
to their professional autonomy (Walter and Lopez, 2008). From the product side, most EMR
products are poorly designed and not user-friendly. But of all the reasons, one of the most
significant ones is the lack of consistent evidence that EMR could actually generate sufficient
benefits, such as lower costs or higher quality, to warrant such a significant investment by
providers. Since HITECH, the adoption rate has climbed but the debate on whether EMR
are worth the money and why we often do not see the promised benefits has not relented.
There are many studies trying to evaluate the effect of EMR over the past two decades.
A lot of them are based on case studies of individual institutions, certain subpopulations, of
patients or cross-sectional data (Bates et al., 1999; Javitt et al., 2008; Himmelstein et al., 2010).
A few more-recent studies use longitudinal data at the national level in trying to establish a
causal relationship between EMR adoption and potential effects. Agha (2012) uses Medicare
claims data to examine the effect of EMR adoption on costs and quality of care. She finds
that adopting HIT is associated with an initial 1.3% increase in billed charges and there is no
evidence of cost savings afterwards; furthermore, HIT has little impact on the quality of care.
McCullough et al. (2013) go one step further and show heterogeneity in the effects of EMR
by focusing on technological and organizational complements that affect EMR’s value. They
6

find that the benefits of EMR are mainly experienced by patients whose diagnoses require
cross-specialty care coordination and extensive clinical-information management. Dranove
et al. (2013) stress the need to adapt enterprise IT to local circumstances in order to realize
costsavings. They show that there is a lag in the expected benefits of EMR due to coinvention
activities. EMR adoption eventually leads to savings in hospitals’ operation costs if the
adopters already have access to complementary assets, but there is a delay of three years
before the cost savings are realized.
These studies investigating how the adoption of EMR affects care quality and costs have
largely focused on mechanisms such as (1) quality improvements through enabling informed
medical decision making and facilitating provider-provider communication, and (2) cost sav-
ings through eliminating duplicate tests and improving efficiency. None of the existing studies,
however, has taken into account potential detrimental effects introduced by EMR adoption
as a result of EMR-induced “upcoding”. The work reported in my paper fills this critical gap
by studying how hospitals’ new coding behavior in the EMR era might increase costs and
jeopardize care quality. In addition, both Agha (2012) and McCullough et al. (2013) only
focus on the Medicare population, while the dataset I use allows for a more comprehensive
examination of both Medicare and non-Medicare populations. Heterogeneity among these
subpopulations reveals additional information about the level of sophistication in hospitals’
revenue-enhancing behavior.
2.2 How do EMR facilitate hospital revenue enhancement?
The adoption of EMR comes with many changes in practice that could potentially boost
billing. Some of them are brought on by the technology itself. For example, like other
digitization technology, EMR lowers the costs of documentation and easily generates more-
complete medical records. Physicians and nurses no longer need to write down patients’
medical records word by word. Instead, with a slew of “time-saving” tricks introduced by
EMR, such as generic pick lists, preloaded macro, and autofill, providers can generate com-
prehensive medical records with a few clicks. For instance, doctors used to have to fill out a
checklist for every step in a physical exam. Now, they can click one button that automati-
cally places a comprehensive normal physical exam in the record. Another click brings up a
normal review of systems — the series of screening questions to ask patients about anything
from nasal congestion to constipation. Sometimes the automatically populated fields are not
clinically relevant, have not typically been billed in the past, or even contain obvious mis-
takes. For example, audits have shown that the use of some preloaded macros for the physical
examination created automatic documentation indicating that females had received prostate
exams and males had had negative pap smears (Thurston et al., 2009). Many EMR systems
7

combine the documentation and coding processes into one, making such errors more difficult
to detect. Together, these changes result in a tendency of more documentation, and inflated
documentation often triggers a higher level of billing codes.
At the same time, EMR may also lead to more procedures performed. EMR often has
clinical protocols built into the system. If physicians do not pay enough attention to uncheck
all unrelevant boxes, the system will automatically order a battery of tests. Some of them are
preventive care, recommended by clinical guidelines, and may have long-term benefits, but
others may not be clinically necessary.
In addition to the changes due to the nature of the technology itself, there are also ways
in which hospitals can use EMR to strategically game the system by switching patients to
higher-paying billing codes.
(1) Computerized algorithms monitoring physicians’ coding behavior and suggesting
higher levels of coding to them: In the pre-EMR era, physicians enter medical documen-
tation, and coders then turn the text-based documentation into corresponding billing codes
for reimbursement from insurers. Physicians usually were not clear about what document is
needed in order to justify certain codes. After purchasing a commercially sold EMR, hospi-
tals can configure the system based on their individual needs. Computerized algorithms can
be built into the system to monitor physicians’ coding behavior. Via prompts and alerts, it
produces “recommendations” for additional items to record in order to trigger higher-paying
billing codes. In a whistle-blower lawsuit filed in 2007, a doctor contended that a new EMR
system rolled out in his hospital in 2006 prompted doctors to click a box that indicated that
a thorough review of patients symptoms had taken place, even though the exams were rarely
performed (Abelson et al., 2012).
(2) “Cloning” is a term referring to the behavior of copying and pasting information from
previous encounters or other patients’ records. The use of the copy-and-paste functionality
is not necessarily noncompliant or fraudulent, but there are substantial concerns and prelim-
inary evidence that physicians may be using cloned notes to inflate their medical claims by
copying documentation that is corresponding to a higher billing code than necessary from
one visit to the next, or repeating a service that was provided during an initial visit but
not during the subsequent consult Abelson and Creswell (2014). As discussed in an article
by Hartzband and Groopman (2008) in the New England Journal of Medicine, “many times,
physicians have clearly cut and pasted large blocks of text, or even complete notes, from other
physicians;” According to a testimony by the American Health Information Management As-
sociation (AHIMA), “some EHR systems are designed to facilitate cloning with options such
as ‘make me the author’ to assume the content of another person’s entry or ‘demo recall’ to
copy and forward vital signs.”
8

2.3 DRG upcoding and the previous literature
The federal government implemented the Prospective Payment System (PPS) in 1984.
Before that, hospitals were paid based on their actual costs of providing care by submitting
a “cost report,” which itemized expenditures incurred in the previous fiscal year. Under this
payment system, Medicare’s health expenditure increased dramatically. Mandating PPS was
a solution introduced in order to control costs. Under PPS, inpatient admission cases are
divided into relatively homogeneous categories called diagnosis-related groups (DRGs) and
hospitals receive a flat rate per case for inpatient care. The reimbursement amount a hospital
can receive for a DRG depends on multiple factors, including the hospital’s teaching status, the
share of indigent patients, and DRG weights, but most of the variation in that amount is due
to DRG weights. DRG weights, which range from 0.0987 (DRG 448 for allergic reactions) to
19.8 (DRG 541 for ECMO or Tracheotomy),2 reflect the average intensity of resources needed
to treat the group of patients in that category. The Health Care Financing Administration
(HCFA) uses hospital cost data to recalibrate the weights every year, increasing weights of
the DRGs experiencing a relative increase in average costs. Under this system, hospitals are
rewarded based on their efficiency relative to the national average. The PPS system soon
revealed its own problem, a phenomenon called “DRG creep,” i.e. hospitals increasingly
assigning patients higher-paying DRG codes.
In reality, there are mainly two ways to detect upcoding behavior. One is to audit medical
records, which is time and resource intensive. The other is to compare the case mix across
hospitals and over time. Most of these studies are descriptive. A review by Coulam and
Gaumer (1991) summarizes the literature about upcoding during the first few years following
the implementation of PPS and concludes that there is evidence of upcoding and DRG creep.
A frequently cited study that finds evidence of a causal relationship between the reimburse-
ment amount and upcoding is by Dafny (2005). She uses Medicare claims data and a natural
experiment to examine hospitals’ responses to a policy reform that led to large changes in
prices of DRG pairs in 1988. She finds that hospitals responded the prices changes primarily
by “upcoding” patients to diagnosis codes with the largest price increases. This response was
particularly strong among for-profit hospitals. Silverman and Skinner (2004) find evidence
of upcoding for patients with pneumonia and respiratory infections. Both studies find that
the upcoding phenomenon is more prominent at for-profit hospitals than nonprofit hospitals.
Similar upcoding effects are also examined in other settings such as nursing homes and out-
patient visits (Brunt, 2011; Bowblis and Brunt, 2013). All of these studies examine providers’
responses to increased benefits of upcoding, while in my study, EMR mainly changes the cost
2The DRG range is from year 2005.
9

of upcoding.
3 Conceptual Framework and Hypotheses
When deciding whether to assign a patient higher-paying billing codes, providers put
different weights to added profits, the costs of making additional documentation to justify the
code, the increased risk of being challenged by the payer, as well as ethical discomfort. The
adoption of EMR significantly decreases the cost of documentation and in particular, the cost
of searching for the “right” item to document, therefore shifting providers’ optimal behavior
towards assigning more patients higher-paying codes. At the same time, new processes take
time to adapt, and to the extent that revenue enhancement using EMR is a new process,
there could be a delay in the effect of EMR due to the complementary inventions needed to
make new IT more productive in specific settings (Dranove et al., 2013). Therefore, the effect
is likely to increase after adoption, rather than being instantaneous.
Hypothesis 1: Providers are more likely to assign patients higher-paying billing
codes after adopting EMR. This effect is increasing over several years after adop-
tion.
If such revenue-enhancing practices are partially attributable to the hospitals’ strategic
behavior of using EMR as a tool to receive more reimbursement from payers, there should be
heterogeneity among different types of hospitals and patient populations.
For-profit and nonprofit hospitals have different objective functions (see, for example,
Dranove (1988)). For-profit hospitals are more likely to engage in such revenue-enhancing
practice after EMR adoption due to: 1) for-profit hospitals put more weights on profit than
on quality, and/or 2) for-profit hospitals are better at utilizing technology to capture billable
items to maximize the reimbursement amount. At the same time, financially distressed hos-
pitals should be more willing to take the risk of being detected in order to boost revenue or
improve risk-adjusted quality measures, which could be helpful for attracting patients.
Hypothesis 2: EMR adoption has a larger effect on the billing of for-profit
hospitals than nonprofit hospitals.
Hypothesis 3: EMR adoption has a larger effect on the billing of financially
distressed hospitals
There is also likely to be heterogeneity in such affect across patient populations. In
particular, there are at least two reasons that hospitals are likely to exploit more of the
revenue-enhancement potential among the Medicare population: (1) there is in general less
auditing and monitoring by public payers than private payers, (2) DRG is the reimbursement
system that has primarily been used by Medicare for almost 30 years. The built-in automatic
10

code-generating system of many EMR systems is likely to be the most sophisticated in helping
hospitals optimize billing codes for DRG payment systems. Nevertheless, a weaker but nonzero
effect should still exist among the non-Medicare population. Many potential mechanisms of
EMR leading to inflated billing codes, such as “cloning,” have nothing to do with the particular
reimbursement rules used, but they allow providers to jack up the overall level of diagnosis
codes and/or procedure codes.
Hypothesis 4: The effect of EMR exists in both Medicare and non-Medicare
populations, but it is stronger for the Medicare population.
The effect of EMR could also be heterogeneous across different DRG pairs. On the one
hand, the larger the difference in the reimbursement amount of the top and bottom code is,
the larger the financial incentive of upcoding is, and therefore patients are more likely to be
upcoded. On the other hand, however, since providers have been engaging in such revenue-
enhancing behavior even before EMR adoption and the upcoding potential is more likely to be
exploited first in more profitable areas, the additional effect on billing due to EMR adoption
is likely to be less. Put another way, the adoption of EMR allows providers to exploit the
potential of revenue enhancement in the area where they did not exploit before.
Hypothesis 5: The effect of EMR is larger in DRG pairs where the financial
incentive of upcoding is less.
In the inpatient setting, hospitals’ reimbursement is based on the DRG system, which pays
a flat rate for each hospital stay according to the DRG code assigned to the patient. Hospitals
have incentives to encourage physicians to document more diagnoses hoping that could trigger
higher-paying billing codes, while within a certain DRG code, there is no incentive to perform
more procedures, as it will not generate additional revenue.
Hypothesis 6: Hospitals document more diagnosis codes after adopting EMR
but do not increase treatment intensity.
4 Data and Measures
This study draws on data from a variety of sources: the patient discharge data are from
the Healthcare Cost and Utilization Project (HCUP) State Inpatient Data (SID) of six states
(AZ, CA, CO, MD, NJ and WA) from 1998 to 2010. The data cover annual inpatient discharge
abstracts of all hospitals in these states regardless of insurance payers and contain patient
demographics, diagnosis and procedure codes, hospital identifiers, and payer types. EMR
adoption information is from the Healthcare Information and Management Systems Society
(HIMSS) Analytics Dataset, which reports the current status and implementation history
of health IT for more than 5300 healthcare providers nationwide. Hospital characteristics
11

and financial information are from the Annual Survey of Hospitals from American Hospital
Association (AHA) and Healthcare Cost Report Information System (HCRIS) data from the
Center for Medicare and Medicaid Services (CMS). I also obtain yearly DRG weights from
the Federal Register.
Dependent variable: Measure of hospital billing level. The primary dependent
variable in my main model is the fraction of patients who are assigned the higher-paying code
within each DRG pair. DRG represents inpatient classifications on the basis of diagnosis code,
procedure code, and a set of patient characteristics. About 40% of DRG codes belong to a
“pair” of codes that share the same primary diagnosis but are distinguished by the presence of
complications (CC). For example, DRG 79 and 80 form a pair, where 79 is “major respiratory
infections and inflammations with complications” and 80 is “major respiratory infections and
inflammations without complications.” In the HCUP data that I use, there are approximately
550 DRGs during the sample period,3 and 232 of them are in pairs (116 pairs). Each DRG is
assigned a weight that reflects the relative resource intensity of admissions within that group
and is the main factor that determines the amount of reimbursement that hospitals can receive.
The weight of the top code (with CC) in each pair always exceeds that of the bottom code.
Therefore, conditional on the same primary diagnosis, providers have incentives to switch
patients into higher-paying DRGs in order to receive a higher reimbursement. The fraction
of patients in the top code represents the level of hospitals’ revenue-enhancing practice. To
generate the percentage of patients who are assigned the top DRG, I collapse patient-level
discharge data to the hospital-year DRG-pair level.
Figure 2 shows the trend of average weights of the top and bottom codes within DRG pairs,
weighted by the number of discharges in my dataset. If more and more patients who should be
in the bottom code are switched to the top code, the difference between the health expenditure
of the two groups should become smaller, and the DRG weights, which are calculated based
on aggregated expenditure nationally, should follow the same trend with a lag. The graph
indicates that the average weights of the top codes and bottom codes seem to be converging
over time, which from a different perspective suggests there is upcoding taking place.
I explore the mechanism of hospitals’ revenue-enhancing practices using changes in di-
agnosis codes and treatment intensity. The HCUP data include ICD-9-CM diagnosis and
procedure codes. These are the standard codes used in inpatient care to document the diag-
3There were major changes in the DRG system in 2008. A main adjustment was resequencing the groupsby replacing the “with-CC” and “without-CC” pair with a trifurcated design—“without CC”, “with CC”, and“with major CC”—so the total number of DRG codes rose to 700+. However, the HCUP data I use in thisstudy still include the DRG codes calculated based on the old rule until year 2010, which gives a consistentDRG grouping rule over my whole sample period. As a robustness check, I run the same test using onlypre-2007 data.
12

noses of patients and procedures performed. After patients are discharged, they are converted
into corresponding billing codes for reimbursement. There are about 10,000 different diagnosis
codes and 3,500 procedure codes. For each patient, a primary diagnosis and a primary proce-
dure (if relevant) are recorded. HCUP also allows up to 29 additional diagnosis codes and 29
procedure codes depending on the state and year4. In particular, I use the share of patients
for whom 2 plus, 3 plus, 4 plus, or 5 plus diagnosis codes are recorded to examine whether
hospitals document more patient conditions after EMR adoption. The measure of treatment
intensity include (1) the share of patients with 1 plus, 2 plus, or 3 plus procedures, and (2)
the total charges, which is not the amount that patients actually pay, but is correlated with
how much work the hospital has done on the patient. As a robustness check, I also measure
treatment intensity using the average number of four common procedures per patient.
Key independent variable: EMR adoption. I obtain EMR adoption data from the
2012 release of Healthcare Information and Management Systems Society (HIMSS) Analytics.
Previous releases of HIMSS data have been used in various studies about the diffusion and
effect of EMR (Fonkych and Taylor, 2005; Hillestad et al., 2005; Miller and Tucker, 2009,
2010; Dranove et al., 2013). The HIMSS survey approximates a comprehensive sample of US
hospitals and reports the current status and implementation history of 103 different technolo-
gies in 17 categories, such as Ambulatory, Laboratory, Nursing, and Radiology. I focus on the
applications in the category Electronic Medical Record. Similarly to Dranove et al. (2013), I
aggregate these applications into two broad categories: basic EMR—having either a clinical
data repository, clinical decision support system (CDS), or order communication and result
reports; and advanced EMR—having either computerized practitioner order entry (CPOE) or
physician documentation. Applications within each of these categories involve similar costs
of adoption. Advanced EMR are in general more difficult to implement and operate than
basic EMR, because its proper functioning requires a relatively high level of enterprise-wide
integration of different IT elements, including basic EMR applications. Advanced EMR also
requires greater physician training as well as involvement.
Hospitals may adopt all applications together or adopt individual applications at different
times, but they all have some basic EMR applications before or at the time they adopt
advanced applications. Table 1 shows the adoption rate of each application in the baseline
year and final year over the sample period. There are significant increases in adoption rates
of all technologies. By the end of 2010, around 89.6% of hospitals have adopted one or more
basic EMR systems, and more than 61.4% have adopted some advanced EMR applications.
Other control variables. HCUP data also include patients’ basic demographic informa-
tion such as age and gender. For additional controls on hospital characteristics and financial
4The number of diagnosis codes and procedures that are allowed to record varies by states and year.
13

information, I merge HCUP data and HIMSS data to the Annual Survey of Hospitals by the
American Hospital Association (AHA) and hospital cost reports from the Center for Medi-
care and Medicaid Services (CMS) based on AHA IDs and Medicare IDs. The sample is also
matched to DRG weights from the Federal Register.
Other measures. I use the debt:asset ratio before the adoption year to measure the level
of financial distress. The debt:asset ratio is calculated using the current liability and current
assets from hospitals’ cost reports. Following Dafny (2005), I define a hospital as financially
distressed if its debt:asset ratio is above the 75th percentile and not financially distressed if
it is below the 25th percentile. The Medicare population is identified based on the payer
information in the HCUP data. The hospitals’ profit status is from AHA data.
Sample generation. The primary sample I use consists of all patients who are assigned
to one of the 232 DRG codes that are in pairs. In the HCUP data I use, there are 29,954,649
discharge records that belong to the 232 paired DRG codes (116 pairs). After dropping those
with a missing hospital ID (0.5%), the patient discharge data are collapsed to 672,361 obser-
vations at hopsital-year-DRG pair level, so each observation represents the group of patients
assigned either code of a DRG pair in a given hospital-year. 523,966 observations are matched
with HIMSS data and AHA data. I further exclude one hospital that adopts the advanced
EMR before basic EMR (881 observations), and 1 federal hospital (225 observations). The
final sample consists of around 435,297 observations with 116 DRG pairs (232 DRG codes)
from more than 522 hospitals in six states from year 1998 to 2010. Table 2 shows the summary
statistics of the key variables and Table 3 lists the number of hospitals by year and state in
the final sample.
A small subset of observations have missing values for the adoption status of certain
applications, so the samples in regressions for basic and advanced EMR applications are
slightly different. When examining the role of upcoding benefits in the effect of EMR on
fraction, I only include observations before year 2008 due to the fact that there is a major
adjustment in DRG rules, and weights under the new system are no longer comparable to old
weights.
5 Empirical Strategy and Results
I examine the effect of EMR adoption on hospital billing using a linear model controlling
for DRG-pair fixed effects, hospital fixed effects, year fixed effects, and patient and hospital
characteristics in an unbalanced panel of hospitals in the six states observed annually from
1998 to 2010. I proceed in three steps: First, I examine the overall effect of EMR adoption on
the fraction of patients that are assigned the top code in each DRG pair. I also show the trend
14

in the effect over time. Second, I examine heterogeneity in the effect of EMR among different
types of hospitals, patient populations, and DRG pairs. Third, I explore whether providers
increase the billing level via documenting more diagnoses or performing more procedures.
5.1 Overall effects of EMR adoption on revenue enhancement
I begin by examining the overall effect of adopting EMR on the fraction of patients in the
top DRG code. Equation 5.1 shows the main specification I use:
fractionh,t,p = α+ βEMRh,t + γXh,t,p + θZh,t + µt + µh + µp + εh,t,p. (5.1)
The unit of observation is the hospital-year-DRG pair. Here, h indexes hospitals, t indexes
years, and p indexes DRG pairs. The dependent variable fraction is the share of admissions
to DRG pair p in hospital h and year t assigned to the top code in that pair. EMRh,t is
a dummy which equals 1 if hospital h has adopted EMR by year t and equals 0 otherwise.
µt, µh, and µp are year, hospital and DRG fixed effects, which are differenced out in the
estimation. I assume that εh,t,p is a normal i.i.d. variable and calculate heteroskedasticity-
robust standard errors clustered by hospital. The primary coefficient of interest is β, which
captures the marginal effect of EMR adoption on hospitals’ revenue-enhancing practice. β > 0
signifies that hospitals increase their revenue-enhancing practice after adopting EMR and the
magnitude is the percentage point change in fraction that is associated with the adoption.
I include two sets of controls: First, Xh,t,p is a vector of controls for the characteristics of
patients in DRG pair p, hospital h and year t: age and gender. Older patients are in general
sicker and thus more likely to be assigned the top DRG code. A similar difference exist
between men and women. The second set of controls, Zh,t, includes hospital characteristics,
which include the number of beds, outpatient visits, inpatient admissions, full-time physicians,
the percentage of Medicare discharges and Medicaid discharges, whether the hospital is a for-
profit, nonprofit or government hospital, a teaching hospital, and a resident hospital. Since
I control for hospital fixed effects in the model and many of these variables do not vary
sufficiently over time, they will drop out if I use contemporaneous values. I also worry that
EMR adoption may drive changes in these characteristics. Therefore, similarly to Dranove
et al. (2013), I use their value in the baseline year and interact them with a linear time
trend. However, results are not affected if these are replaced with contemporaneous values. In
addition, I control for hospital fixed effects, DRG fixed effects, and year fixed effects in order to
control for time-invariant unobservable heterogeneity in these dimensions. There is substantial
heterogeneity in patient composition across different diagnoses since some conditions are more
likely to have complications than others. There is also heterogeneity across hospitals due to
15

reasons such as variations in physicians’ practice across regions, variations in patient profiles
(e.g., tertiary hospitals or trauma centers treat patients who are sicker than those seen at
other hospitals), or variation in access to resources (e.g., some hospitals have resources to
hiring professional coders to optimize their coding and maximize revenue, while others do
not). Fraction could also vary across years due to the fluctuation in patient characteristics
as well as financially induced changes in coding behavior due to annual adjustment in DRG
weights (Dafny, 2005). Controlling for various fixed effects allows me to account for various
unobservable heterogeneity.
This identification relies on the assumption that any systematic change in the fraction of
patients who are assigned the top DRG code after EMR adoption is captured by hospital-
level, DRG-pair-level and year-dummy controls, so any time-variant unobservable factors that
affect fraction are uncorrelated with EMR adoption.
Table 4 shows the results of applying model 5.1 to the full sample. Columns (1) to (3)
use each of the three EMR applications which together I label “basic EMR.” Columns (4)
to (5) use the two “advanced EMR” applications. The purpose of the first five columns is
to show that the basic EMR applications all have similar effects and the same is true for
advanced EMR applications. Therefore, it is logical to aggregate them into one measure for
“basic EMR” and one measure for “advanced EMR,” respectively.
The results suggest that adopting each individual EMR application is all associated with
a significant increase in the fraction of patients coded as “with complications.” The effects
of applications in the same category are similar in magnitude. Clinical Decision Support
(CDS) has the biggest and most significant effect, while Clinical Data Repository CDR has
the smallest effect. This is expected because CDS is the application that directly assists
physicians with decision making by providing treatment suggestions and reminders about
patients’ medical history; hence, it is more likely to directly facilitate revenue-enhancing
coding behavior, while CDR, which is a data repository that stores patients’ information in
the background, is expected to have a smaller effect. The effect of Order Entry is somewhere
in between. In general, the effects of adopting the three basic EMR applications are similar.
The coefficients of advanced EMR, CPOE and physician documentation are both smaller in
magnitude and less significant.5,6
In column (6), I include two dummy variables—one is “basic EMR only,” which equals
one if the hospital has at least one basic EMR application but no advanced EMR, and the
other is “advanced EMR,” which equals one if the hospital has at least one advanced EMR
5Note that in regressions (4) and (5), the comparison group consists of a mixture of hospitals with no EMRand hospitals with basic EMR, so the coefficients are smaller than those in the first three columns.
6The sample size for columns (1) to (3) is slightly different from that for columns (4) and (5) because asmall portion of the hospitals have missing information regarding their status on advanced EMR or basic EMR.
16

application (and if it has some advanced EMR, it must also have basic EMR). Both dummy
variables equal 0 if the hospital does not have any EMR applications. The coefficients on
the two dummy variables reflect the effect of adopting “basic EMR” and “both basic and
advanced EMR” respectively compared to “having no EMR.” The results indicate that the
effect of “having basic EMR” and that of “having both basic and advanced EMR” are very
close, although the effect of the latter is a bit larger and more significant. A t-test of the two
coefficients yields a p-value of .6, indicating that, all else equal, there is no significant difference
between the effect of adopting basic EMR only and adopting both levels of applications. If a
hospitals already has basic EMR, then the additional effect due to the adoption of advanced
applications is not statistically significant.
The absence of an additional effect after adopting advanced EMR may suggest that hos-
pitals may not require the advanced functionality of EMR in order to enhance revenue. This
is consistent with many anecdotal stories, since the potential mechanism that is mentioned
most often is “cloning,” a basic copy-and-paste functionality that is available in basic EMR
systems.
To simplify my analysis, I combine the two measures and generate a single dummy for
“having any EMR.” Columns (7) and (8) show the results of this regression on slightly different
samples. The sample in column (7) only includes observations with nonmissing measures of
both basic EMR and advanced EMR. Since hospitals with advanced EMR all have basic EMR,
the definition of this aggregated measure does not require information about the adoption
status of advanced EMR; therefore, column (8) includes all observations with nonmissing
data for the adoption of basic EMR (even though a small portion of them have missing data
for advanced EMR). The results of columns (7) and (8) are very similar in all dimensions, so
hereafter, I include all observations with a nonmissing value in the status of basic EMR for
later analysis regardless of the availability of information about the advanced EMR, i.e., the
sample in column (8).
In summary, the results in these regressions suggest that adopting EMR makes hospitals
more likely to assign patients higher paying DRG codes. On average, adopting EMR leads to
a 1.1 percentage point increase in the fraction of patients who are assigned the top code in a
DRG pair. This moves an average hospital (fraction=0.624) from the 50th to 56th percentile
in the distribution of fraction.
Next, I examine the effect of EMR adoption over time. The main purpose of this step
is (1) to check and rule out the existence of any pre-adoption trend that could complicate
the interpretation of my results, and (2) to examine the trend in the effect of EMR in the
post-adoption period. After including all the control variables and differencing out all fixed
effects, I expect to see no pre-adoption trend in fraction. I also expect the effect of EMR on
17

fraction to be increasing over several years following adoption as the EMR system is rolling
out. Equation 5.2 shows the specification.
fractionh,t,p = α+ ΣL=iβLEMRh,t+L + γXh,t,p + θZh,t + µt + µh + µp + εh,t,p
i ∈ {≤ −4,−3,−2, 0, 1, 2,≥ 3}(5.2)
The only difference between 5.2 and 5.1 is that I replace the single dummy for post-EMR
adoption with a set of dummy variables indicating each year from four years before adoption
to three years after. For example, EMRh,t equals 1 in the year of adoption, EMRh,t+2 equals
1 two years after the adoption, etc. The omitted category is “1 year before adoption.” The
sample excludes hospitals that have not adopted any EMR by the end of my sample period.
Figure 3 plots the coefficients on the set of dummy variables indicating the years relative to
the adoption time. (Regression results are also listed in column (1) of Table 6). There is no
pre-adoption trend in fraction, and there is a slight delay in the effect of EMR and that effect
keeps rising over several years following adoption.
5.2 Heterogeneous effect across different types of hospitals and patient
populations
In this section, I examine whether the impact of EMR adoption on hospitals’ billing levels
varies across different subsamples of hospitals and patient populations. If the observed effect
on coding is purely due to technological changes brought on by EMR, and if hospitals are
only passively coping with such changes instead of actively and sophisticatedly using EMR as
a tool to enhance revenue, we should expect a relatively homogeneous effect across different
hospitals and patient types. Otherwise, we should see heterogeneity in such effect that is
corresponding to hospitals’ various incentives of boosting billing.
I first run separate regressions using the model in equation 5.1 on the subsamples of for-
profit, nonprofit and government hospitals. Results in columns (2) to (4) of Table 5 show
that the effect of EMR on fraction at for-profit hospitals is twice as large as that at nonprofit
hospitals. The effect at government hospitals, although similar in magnitude to that at
nonprofit hospitals, is not statistically significant. This is consistent with previous findings
by Dafny (2005) and Silverman and Skinner (2004). Figure 4 shows the differential trend of
effect over time. The effect on for-profit hospitals starts exceeding that on nonprofit hospitals
two years after the adoption year. By the third year after adoption, the upcoding level of
for-profit hospitals has increased by 3.6 percentage points, compared with 1.6 percentage
18

points at nonprofit hospitals. There is also a slight pre-adoption upward trend at for-profit
hospitals. One potential explanation is that adopting EMR is only part of what those hospitals
do in order to boost revenue. During the years leading up to the adoption, hospitals may
have been hiring external coding consultants to optimize their billing or building up other
complementary resources while looking for the right EMR vendor. The adoption of EMR
accelerates the whole process of revenue enhancement.
Financially distressed hospitals should be more willing to assign patients higher-paying
DRG codes in order to boost revenue or improve risk-adjusted quality measures. In columns
(5) and (6) of Table 5, I run separate regressions on financially distressed and non-distressed
hospitals and find that the effect of EMR adoption on fraction is a lot larger at financially
distressed hospitals than non-distressed hospitals. Figure 5 shows the effect over time.
I also examine whether the effect of EMR on hospitals’ revenue-enhancing practice varies
by patient population. Columns (7) and (8) in Table 5 show results of separate regressions for
the sample generated from Medicare patients only and non-Medicare patients only. Consistent
with my hypothesis, fraction increases in both Medicare and non-Medicare patient populations
after adoption but the magnitude is larger in Medicare population. Figure 6 plots the trend
of effect over time.7
5.3 Heterogeneous effects across DRG pairs
In this section, I examine heterogeneity in the effect of EMR on fraction across DRG pairs
with different financial incentives of upcoding. DRG pairs with a larger difference between
the reimbursement amount of the top and bottom codes give hospitals more incentives to
switch patients into the top code. At the same time, however, the potential for upcoding
within these DRG pairs is more likely to have been fully exploited even without EMR. I use a
measure called “spread” to quantify the financial incentive for upcoding a specific DRG pair.
spread is defined as follows:
spreadp,t = DRGweight in top codep,t −DRGweight in bottom codep,t. (5.3)
This measure varies across years and DRG pairs. All else equal, the larger this value is,
the more additional profit a hospital can generate by moving patients from the bottom code
to the top code. I interact this measure with the dummy indicator of EMR adoption status
to examine the heterogeneous effects of EMR on upcoding across pairs with different spreads.
7Columns (2) to (5) in Table 5 show the complete results of these regressions.
19

The specification of the model is as follows:
fractionh,t,p = α+βEMRh,t+δspreadp,t+κEMRh,t×spreadp,t+γXh,t,p+θZh,t+µt+µh+µp+εh,t,p.
(5.4)
In this model, I include spread as an explanatory variable and interact it with the dummy
variable for EMR adoption. The other specifications are the same as in equation 5.1. The
coefficient I am primarily interested in is β3. It signifies how financial incentives relate to
the effect of EMR on upcoding. Column (1) of Table 7 reports the key coefficients from
this regression. The coefficient on EMR adoption is positive and significant as expected. The
coefficient of spread signifies that DRG pairs with a larger spread have a significantly higher
coding level before EMR adoption. One standard deviation change (SD=0.48) in spread is
associated with a 1.7 percentage point increase in the fraction of patients assigned the top
code. The coefficient of the interaction term of spread and EMR adoption indicates that the
the effect of EMR on fraction significantly decreases as spread increases. The effect of EMR
on a DRG pair with an average spread (mean=0.63) is 0.018, and 1 standard deviation change
of spread (0.48) is associated with a reduction of 0.053 in the effect of EMR, which is a 28%
reduction.
These coefficients suggest that before EMR adoption, patients in DRG pairs with larger
upcoding incentives are more likely to be assigned the top code, but the additional increase in
such probability due to EMR adoption is smaller compared with those with smaller upcoding
incentives. In other words, the effect of EMR on fraction diminishes as spread increases.
In order to demonstrate this pattern in a clearer way, I break down the continuous spread ’
measure into quartiles. The specification is shown below:
fractionh,t,p = α+ βEMRh,t + ΣiδispreadQip,t + ΣiκiEMRh,t × spreadQip,t+γXh,t,p + θZh,t + µt + µh + µp + εh,t,p, i ∈ {1, 2, 3}.
(5.5)
spreadQ1p,t to spreadQ3p,t are dummy variables indicating whether the spread of DRG
pair p falls into the first, second or third quartile of the distribution of all DRG pairs’ weights
in year t. All three equal 0 if it falls into the fourth quartile. I expect the pre-adoption
fraction to be positively correlated with the size of spread ; hence the omitted category, which
has the largest spread, should have the highest baseline coding level, and δi i = 1, 2, 3 should
all be negative, with δ3 being the least negative and δ1 being the most negative. At the same
time, the effect of EMR on fraction should be negatively correlated with the size of spread ;
therefore the omitted category should be the least affected by EMR and κi i = 1, 2, 3 should
all be positive, with κ3 being the smallest and κ1 being the largest.
20

Column (2) of Table 7 shows the result of estimating model 5.5. The signs of the coefficients
are as expected. The results are better shown in a figure. Figure 7 shows the average fraction
of DRG pairs in each spread quartile before and after EMR adoption based on the calculation
using the estimated coefficients.8 This figure indicates that EMR adoption leads to an increase
in fraction for DRG pairs in all quartiles, but the fraction of DRG pairs with a large spread
already reached a relatively high level before EMR adoption; hence the additional increase
due to EMR adoption is much smaller than that of DRG pairs with a smaller spread. This
pattern is consistent across DRG pairs in all spread quartiles. The range in fraction after
EMR adoption is also much smaller than that before EMR adoption, with a range of 0.026
pre-adoption and 0.012 post-adoption, which constitutes a reduction of 54%.
These regression results are consistent with the existence of a “ceiling effect” in hospitals’
revenue-enhancing practice. Providers tend to exploit the revenue-enhancing potential and
are most incentivized to do so where the payoff is the highest. Hospitals have been doing
more “upcoding” on patients in DRG pairs with a larger spread even without the assistance
of EMR; therefore, there is less additional benefit EMR can provide in terms of inflating
billing codes, since there is a “ceiling” on how much upcoding can be done. For those DRG
pairs with smaller financial incentives for upcoding, providers are not able to exploit as much
of the potential without EMR; therefore, adopting EMR is especially beneficial in terms of
expanding their capacity to exploit the potential of elevating bills among these codes.
5.4 More diagnosis codes or higher treatment intensity?
Medical records document what diseases patients have and what procedures providers
perform. Such information is translated into corresponding diagnosis codes and procedure
codes. In this section, I explore the mechanism of hospital revenue enhancement by examine
changes in diagnosis codes and procedure codes.
In order to study changes in diagnosis codes, I run the same model as 5.1 but replace
the dependent variable with the fraction of patients with 2 plus, 3 plus, 4 plus, or 5 plus
diagnosis codes. Table 8 shows the regression results. The coefficients of EMR adoption in all
regressions are positive and significant, indicating that the whole distribution of the number
of recorded diagnosis codes shifts towards the right (i.e., more codes) after EMR adoption.
The effect is especially strong in internal medicine (see Table A4 for regression results on a
sample restricted to a set of DRG codes in internal medicine).
8The average levels of fraction are obtained by replacing the actual values of the EMR- adoption dummyand spread-quartile dummies with hypothetical values and generating a predicted fraction using estimatedcoefficients. For example, the pre-adoption fraction of spreadQ4 is obtained by replacing spreadQip,t with 0and replacing EMRh,t with 0 for all observations. Note that the differences between average fractions areequal to the corresponding estimated coefficients in the regression model.
21

I run the same regression using measures of treatment intensity as dependent variables.
The results are shown in Table 9. Columns (1) to (3) use the fraction of patients with 1 plus, 2
plus, and 3 plus procedures. Column (4) and (5) use the total charges. None of the measures
show any evidence of changes in treatment intensity after EMR adoption. I am concerned that
the null results might be attributed to the fact that a measure counting all procedures is too
coarse, so I also examine changes in several common procedures, including MRI, ultrasound,
CT scan, and blood tests, by regressing the mean and median of the number of each test in
a hospital year on EMR adoption and find no evidence that there is any change after EMR
adoption (see Table A3 for results).
These results together indicate that hospitals generate additional revenue via documenting
more diagnoses and there is no evidence that they increase care intensity. Put another way,
although patients look sicker, providers do not actually provide more treatment. This is
consistent with my hypothesis, as hospitals have an incentive to document more diagnosis
codes in order to trigger higher-paying DRG codes but have no incentive to increase care
intensities since payments are a flat rate conditional on DRG.
5.5 How much money is at stake?
In this section, I calculate the amount of extra reimbursements hospitals can obtain due
to the specific type of revenue-enhancing practice I study in this paper after EMR adoption.
Based on the estimation results in the last column of Table 4, the fraction of patients in the
top code of each DRG pair increases by 1.1 percentage point after EMR adoption. In year
2011, the total reimbursement for Medicare inpatient short stay was $128 billion. About 47%
of Medicare patients are assigned a DRG code among those in pairs. The average weight for
these patients is 1.12 and the average spread is 0.52. Therefore, a change of 1.1 percentage
point in the fraction of patients that are assigned the top DRG code leads to an annual
increase of $307 million (95% confidence interval: $224 million – $390 million) in Medicare
reimbursements.9 As shown in my results, similar revenue-enhancing practice also exists in
non Medicare patients. Since Medicare accounted for 28% of spending on hospital care in 2010
(Commission et al., 2007), the additional annual reimbursement for the whole population due
to this particular type of revenue enhancement is around $ 1.2 billion.
9Another way of calculating this is as follows: The total number of Medicare discharges from short stayhospitals in 2011 was 12.34 million. 47% of all discharges were in paired DRG codes, and 1.1% of those areswitched to the top code after EMR adoption, adding an additional 0.52 DRG weight per patient. As mentionedin Silverman and Skinner (2004), reimbursement per 1.0 DRG weight was equal to roughly US$4000 during themid-1990s, while the Medicare payment per capita for inpatient services roughly was doubled from the mid-1990s to 2011 (Medicare and Medicaid Statistical Supplement, 2012 version). By multiplying these numbertogether, the additional Medicare payment due to EMR adoption is about $270 million.
22

The actual amount of money at stake is likely to be a lot larger than $ 1.2 billion. Unlike
the upcoding phenomenon documented in the previous literature,10 such revenue-enhancing
practice using EMR is applicable to other are settings and payment rules. For example,
“Cloning” and other revenue-enhancing practice are found to be most prevalent in outpatient
and ambulatory settings (Abelson et al., 2012). Under the fee-for-service payment, providers’
have incentives to document more procedures since the reimbursement is often based on that.
Although it is hard to give an estimate of the impact of EMR outside of the empirical setting
I study in this paper, this particular type of revenue enhancement is likely to be a tip of the
iceberg.
6 Robustness Test
6.1 Are patients sicker?
My identification is based on the assumption that patient composition, particularly in
terms of the extent of sickness, does not change before and after EMR adoption. It is possible
though that the adoption of EMR improves the quality and efficiency of care overall so that
the provider can treat sicker patients, or that EMR becomes a competitive advantage of
hospitals so that they attract more sicker patients. In order to test this, I examine changes
in the patients’ Charlson index and ages after EMR adoption.
The Charlson index was developed to predict one-year patient mortality using comorbidity
data obtained from diagnosis codes in hospital charts and is often used to measure patients
overall health conditions (see, for example, Silverman and Skinner (2004)). It assigns each
of the 22 comorbid conditions (such as diabetes, liver disease, tumor, leukemia, congestive
heart failure, etc.) a score of 1,2,3, or 6, depending on the risk of dying and then sums up the
scores to provide a total score that predicts mortality (Charlson et al., 1987). Many studies
have validated the Charlson index in a wide variety of diseases for numerous clinical outcomes
(de Groot et al., 2003). I generate the Charlson index for each patient using the diagnosis
codes in HCUP data and generate average the sum of Charlson weights by hospital-year DRG
pair. I run the same regression as in column (10) of Table 4 but replace the dependent variable
with the average sum of the Charlson weights.
Columns (1) and (2) of Table 10 show the results from this regression. The dependent
variable in column (1) is the sum of the Charlson weights, so it ranges from 0 to about
15. Since the distribution of the Charlson index is quite skewed, in column (2) I categorize
observations with the sum of the Charlson weights equal to or larger than 2 into one group
10See, for example, Dafny (2005), in which the upcoding behavior is induced by changes in the reimbursementamount of a subset of inpatient billing codes, so the effect is localized to those codes.
23

and run the same regression. Both columns show similar results that there is no change in
patients’ general health status measured by Charlson index after EMR adoption. In column
(3) I use the average age of patients in each hospital-year DRG pair as the dependent variable
and find that there is no change in the patients’ age after EMR adoption.
As another falsification test, I examine the changes in diagnosis codes for DRG codes that
are not in pairs. If the observed increase in the number of diagnoses is all due to changes
in patient health, we would see similar effects in non-paired DRG codes. I run the same
regression on the non-paired DRG codes and find that the coefficients on EMR adoption are
not significant and are smaller in magnitude (see Table A5).11
It is still possible that patients’ health conditions change in a more subtle way and these
measures can not capture, but at least I do not find the evidence for any compositional change
at an aggregated level. At the same time, it is unlikely that hospitals are able to attract sicker
patients in all DRGs. In addition, the fact that hospitals do not perform more procedures after
EMR adoption makes it even more unlikely that the patients are actually sicker. Together,
these results imply that the effect of EMR adoption on coding changes is unlikely to be due
to the fact that hospitals are treating sicker patients after adopting EMR. Rather it is likely
due to the fact that hospitals actively use EMR to boost billing.
6.2 Other robustness tests
I also conduct additional tests to address other concerns regarding the specification. Some
of the observations are collapsed using a small number of patient-visit-level data. I am con-
cerned that those observations can bias my results. In column (2) of Table 11, I drop the
observations collapsed from 5 or fewer patient-visit-level observations. The coefficient on the
key variable barely changes.
In column (3), I show that weighting observations using the number of patient visits in
each hospital-year DRG pair does not change the conclusion. As expected, the magnitude
of effect slightly decreases, since the effect of EMR on revenue-enhancing practice is more
prominent in smaller hospitals (see the results in Table A2), which are likely to have limited
resources for optimizing their coding before EMR adoption and therefore benefit more from
EMR adoption.
There were major changes of the DRG rules in 2008. Although similar upcode incentives
still remain and my data provide consistent DRG categorization till 2010, I drop observations
in year 2008 or later as another robustness test. The result is shown in column (4). EMR
11Note that, although it is much more difficult, it is still possible to switch patients across non-paired DRGcodes, so hospitals may still want to record more diagnoses for those patient. Therefore the coefficient on EMRadoption may not be zero.
24

decisions sometimes are made at hospital system level instead of individual hospital level,
hence in column (5), I cluster standard error at health system level, and the results still hold.
I also compare my results with the previous literature on upcoding. In particular, Sil-
verman and Skinner (2004) examines upcoding in two specific DRG pairs (4 DRG codes),
pneumonia and respiratory infections. All four DRGs are common respiratory ailments, which
carry inherent uncertainty and potential to for upcoding. I run my model on these DRG pairs
only and find that the coefficient is similar to that when running the model on the full sample.
At the same time, the difference in the effects of EMR on these two pairs is also consistent
with the “ceiling effect”: DRGs 79 and 80 (respiratory infections with/without CC) have a
spread of 0.73, while DRGs 89 and 90 (pneumonia with/without CC) have a spread of 0.41.
The average pre-adoption fraction of patients assigned the top code in the former pair is
higher than that in the latter (0.92 vs. 0.87), but the effect of EMR adoption on the former is
smaller than that on the latter ( 0.007 vs. 0.012). The results in the Silverman and Skinner
(2004) study also suggest the possibility of switching patients across DRG pairs. In my data
though, the share of patients in the “respiratory infection” pair out of all the patients in these
two pairs is positively correlated with EMR adoption, but the coefficient is not significant
(p=0.22), indicating that switching across DRG pairs may not be of first-order importance in
this scenario.
7 Discussion and Conclusion
Adopting Electronic Medical Records is not simply a process of replacing paper-based
records with electronic ones, but rather an unprecedented way of transforming the practice
in the entire health care industry. As the government continues to make investments to
aggressively push providers to adopt EMR, it is critical to understand how providers truly
respond to the adoption of such technology. Are providers taking advantage of the potential
efficiency gains brought on by the technology to control costs and improve quality or are
they using it as a tool to ease their way to gaming the system and enhancing revenue?
The answers to these questions are particularly important from a policy standpoint as such
revenue-enhancing practice by hospitals have extensive impact on health costs, patient safety,
and the accuracy of quality measures.
As the first study that uses a large-scale dataset to directly examine the effect of EMR
adoption on providers’ coding practice, this paper draws on a variety of data sources on EMR,
patient coding, hospital characteristics, and patient characteristics. It demonstrates the effect
of EMR adoption on hospital revenue enhancement with a focus on changes in medical and
billing codes. The adoption of EMR leads to a significant increase in the fraction of patients
25

who are assigned higher-paying DRG codes. There is a slight delay in this effect, which is
consistent with a phased rollout of EMR in the hospital and a phased adaptation to local
circumstances documented in the previous literature. The effect of this particular type of
revenue enhancement using EMR translates into an annual increase $1.2 billion in reimburse-
ment. However, this estimated amount is likely to be a tip of the iceberg— Considering the
fact that the revenue enhancement using EMR also exists in other forms and is likely to be
more prominent in outpatient and emergency care, the actual amount of money at stake is
much larger.
More importantly, my results indicate that hospitals demonstrate a substantial level of
sophistication in using EMR to escalate their billing: under the DRG payment system, which
pays more for sicker patients but not for performing more procedures, providers increase the
number of documented diagnoses but do not perform more procedures; those who give more
weight to financial gains, such as for-profit hospitals and financially distressed hospitals, tend
to make greater use of EMR to boost billing; they also tend to exploit more of the upcoding
potential among the Medicare population, where the monitoring from the payer is likely to
be the less, the use of prospective payment rules is more stable, and patients are in general
sicker. Lastly, the pattern of “ceiling effects” suggests that EMR might be helping hospitals,
which previously focused limited resources on areas where the return on inflating billing is
the largest, expand their capacity to exploit the rest of the billing codes. Such heterogeneity
is worrying because it potentially punishes the providers that do not engage in such revenue-
enhancing behavior and lead to inaccurate risk-adjusted quality measures.
As is true for any empirical work, this study has a number of limitations. First, I observe a
subset of medical providers and can only measure certain forms of revenue-enhancing practice.
Providers in outpatient and ER settings face different reimbursement rules and could have
different incentives and strategies for coding. Although I believe that many of the potential
mechanisms of EMR leading to revenue-enhancing practice are also applicable to other care
settings, I cannot quantify the exact magnitude of the effect. Second, my main measure of
revenue enhancement can only capture the changes within the same DRG pair. It is also
possible for hospitals to switch patients across DRG pairs, although such effect may not be of
the first-order importance as shown in robustness test, so the magnitude of the effect I find is
likely to be a lower-bound even in the setting of inpatient Medicare patients. Third, the data
I use only covers six state. Although they spread out across the whole country, there may
still be concerns about the external validity of my results if these states are not representative
enough.
The study also leaves open questions. For example, how much of the observed effect
on billing reflects an efficiency or quality improvement such as EMR capturing important
26

medical information that was previously missed and how much is due to a higher level of
sophistication in maximizing billing but generates no clinical benefits or even undermines care
quality. Another question is why I do not observe any changes in the number of procedure
codes. Under the DRG payment system, hospitals are not incentivized to perform more
procedures, but from the perspective of some physicians, especially those who are not affiliated
with hospitals, there may be incentives to perform and/or document more procedures, since
that is what these physicians’ pay largely depends on. It may be that the changes in procedure
codes happen in a more subtle way and require more sophisticated measures to be detected.
Despite the limitations, I believe that my results have important policy implications. The
evidence of hospitals using EMR to boost revenue provides a potential explanation for the
puzzle why EMR does not generate cost reduction and quality improvements as expected. HIT
incentives are aggressively pushing the whole US health care industry to move into the IT
era, while the guidelines for coding practice and the way of monitoring, which were designed
to handle paper-based records, still lag behind. Ambiguity and incompleteness in coding
rules, as well as the lack of proper oversight, generate incentives for providers to game the
system. In order to address this problem, payers should increase the level of auditing, and
more importantly, devote efforts to innovate new audit tools and algorithms that can detect
problematic electronic claims. As suggested by my results, providers have a substantial level
of sophistication and respond to various “upcoding” incentives. Policy makers should take
these reactions into account when developing coding guidelines and looking for audit targets.
27

Figure 1: Effect of EMR on fraction by years relative to adoption (raw data)
Note: This figure shows the relative level of hospitals’ revenue-enhancing practice over time in rawdata. It is generated by regressing the fraction of patients assigned the higher-paying code withineach DRG pair only on a set of dummy variables indicating the years relative to the adoption yearand plotting the coefficients. The omitted category is “1 year before adoption.” The dashed linesshow 95% confidence intervals.
28

Figure 2: Trend in average DRG weights over time
Note: This figure shows the trend in average weights of patients (i.e., case-mix index) in the top(with CC) and bottom (without CC) codes over time. The difference between the weights (and,hence, health expenditure) of the top and bottom codes becomes smaller over time. This is consistentwith the hypothesis that more patients who should be in the bottom code are upcoded into the topcode, leading to a smaller difference in the level of sickness between these two groups of patients.Comparable DRG weights after year 2007 are not available due to adjustments in DRG rules in 2008.
29
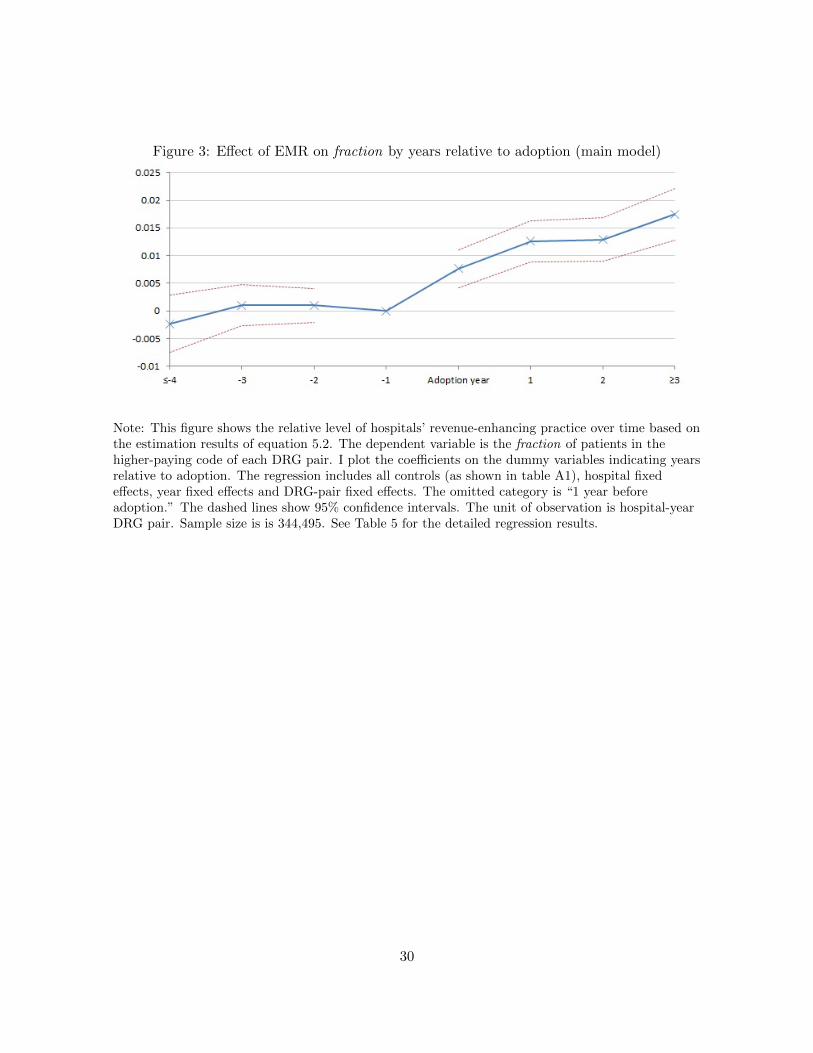
Figure 3: Effect of EMR on fraction by years relative to adoption (main model)
Note: This figure shows the relative level of hospitals’ revenue-enhancing practice over time based onthe estimation results of equation 5.2. The dependent variable is the fraction of patients in thehigher-paying code of each DRG pair. I plot the coefficients on the dummy variables indicating yearsrelative to adoption. The regression includes all controls (as shown in table A1), hospital fixedeffects, year fixed effects and DRG-pair fixed effects. The omitted category is “1 year beforeadoption.” The dashed lines show 95% confidence intervals. The unit of observation is hospital-yearDRG pair. Sample size is is 344,495. See Table 5 for the detailed regression results.
30
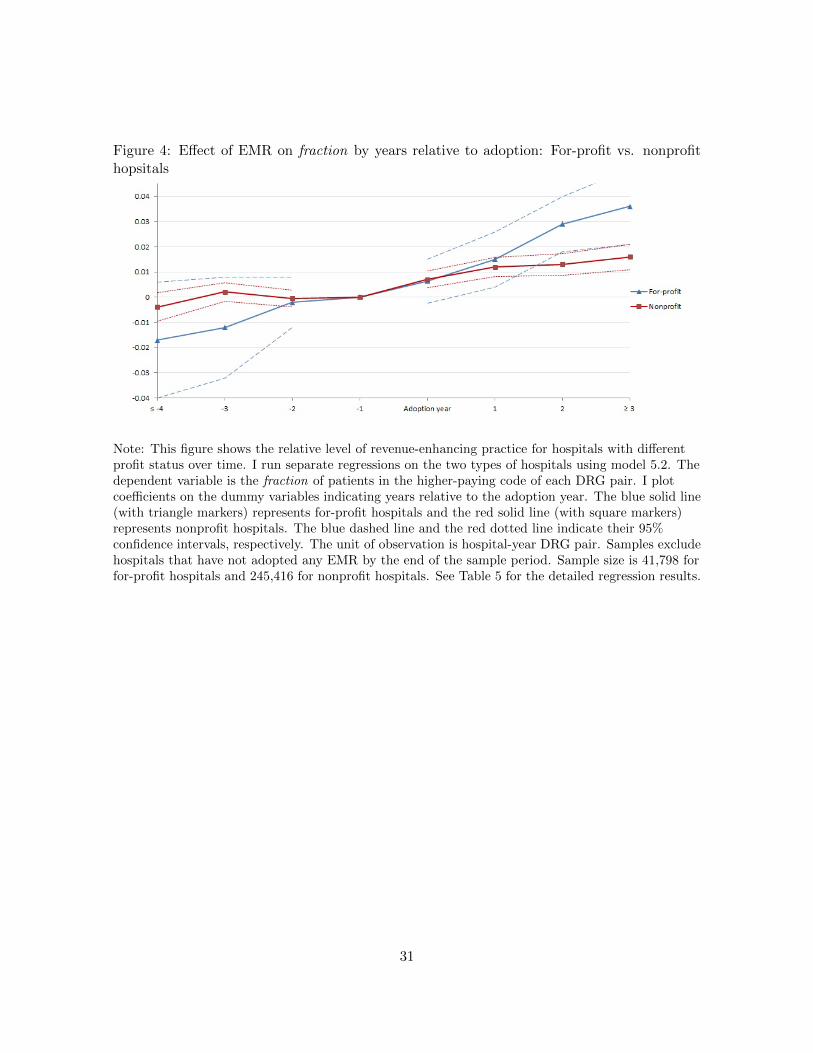
Figure 4: Effect of EMR on fraction by years relative to adoption: For-profit vs. nonprofithopsitals
Note: This figure shows the relative level of revenue-enhancing practice for hospitals with differentprofit status over time. I run separate regressions on the two types of hospitals using model 5.2. Thedependent variable is the fraction of patients in the higher-paying code of each DRG pair. I plotcoefficients on the dummy variables indicating years relative to the adoption year. The blue solid line(with triangle markers) represents for-profit hospitals and the red solid line (with square markers)represents nonprofit hospitals. The blue dashed line and the red dotted line indicate their 95%confidence intervals, respectively. The unit of observation is hospital-year DRG pair. Samples excludehospitals that have not adopted any EMR by the end of the sample period. Sample size is 41,798 forfor-profit hospitals and 245,416 for nonprofit hospitals. See Table 5 for the detailed regression results.
31

Figure 5: Effect of EMR on fraction by years relative to adoption: financially distressed vs.not distressed hospitals
Note: This figure shows the relative level of revenue-enhancing practice for hospitals with differentfinancial status over time. I run separate regressions on the two types of hospitals using model 5.2.The dependent variable is the fraction of patients in the higher-paying code of each DRG pair. I plotcoefficients on the dummy variables indicating years relative to the adoption year. The blue solid line(with triangle markers) represents hospitals that are not financially distressed and the red solid line(with square markers) represents those that are financially distressed. The blue dashed line and thered dotted line indicate their 95% confidence intervals, respectively. The unit of observation ishospital-year DRG pair. Samples exclude hospitals that have not adopted any EMR by the end ofthe sample period. Sample size is 45,340 for financially distressed hospitals and 47,694 for those thatare not financially distressed. See Table 5 for the detailed regression results.
32
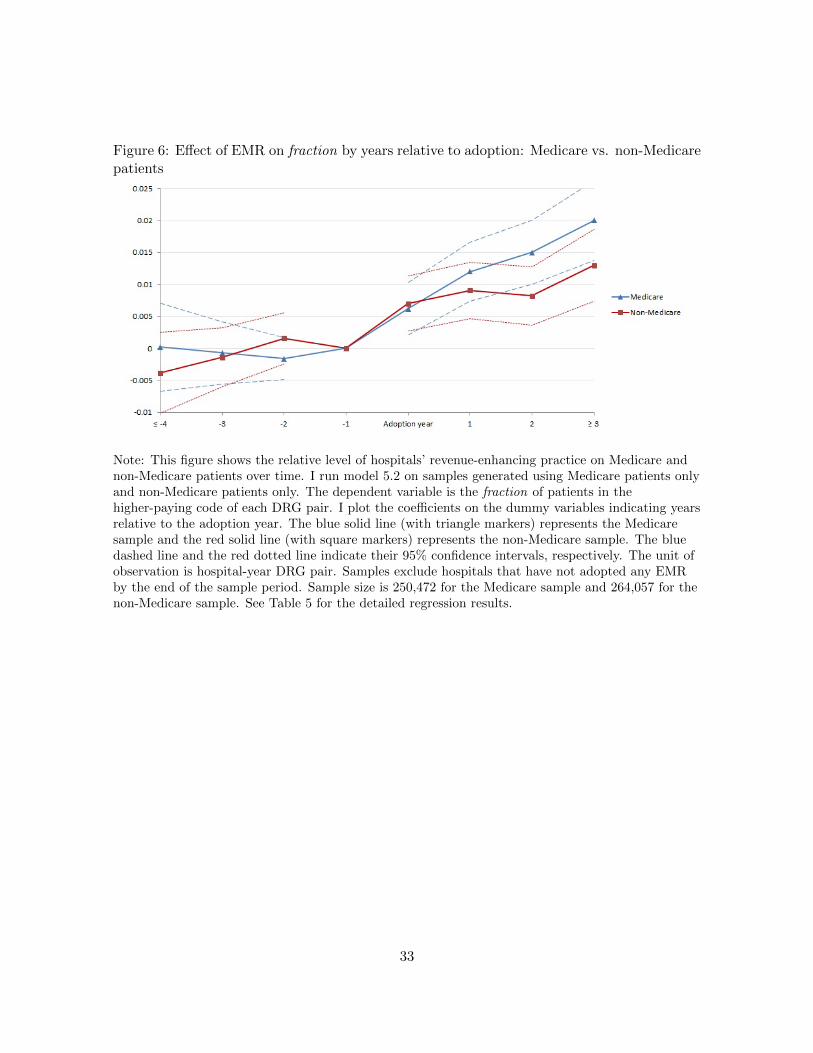
Figure 6: Effect of EMR on fraction by years relative to adoption: Medicare vs. non-Medicarepatients
Note: This figure shows the relative level of hospitals’ revenue-enhancing practice on Medicare andnon-Medicare patients over time. I run model 5.2 on samples generated using Medicare patients onlyand non-Medicare patients only. The dependent variable is the fraction of patients in thehigher-paying code of each DRG pair. I plot the coefficients on the dummy variables indicating yearsrelative to the adoption year. The blue solid line (with triangle markers) represents the Medicaresample and the red solid line (with square markers) represents the non-Medicare sample. The bluedashed line and the red dotted line indicate their 95% confidence intervals, respectively. The unit ofobservation is hospital-year DRG pair. Samples exclude hospitals that have not adopted any EMRby the end of the sample period. Sample size is 250,472 for the Medicare sample and 264,057 for thenon-Medicare sample. See Table 5 for the detailed regression results.
33

Figure 7: Average fraction pre- and post-adoption by quartiles of spread : “Ceiling Effect”
Note: This figure shows the average fraction of patients assigned the higher-paying DRG code byquartile of spread and adoption status. spread is a measure of the upcoding incentives in a DRGpair. SpreadQ1 to spreadQ4 are indicators for the quartiles of spread within which each observationfalls. spread increases from Q1 to Q4. The pre-adoption fraction is positively correlated with spread,but the effect of EMR is negatively correlated with spread. This shows evidence that is consistentwith “ceiling effects.” The average fractions are obtained based on the estimation results of equation5.5 (output shown in Table 7). The sample includes observations from 1998 to 2007.
34
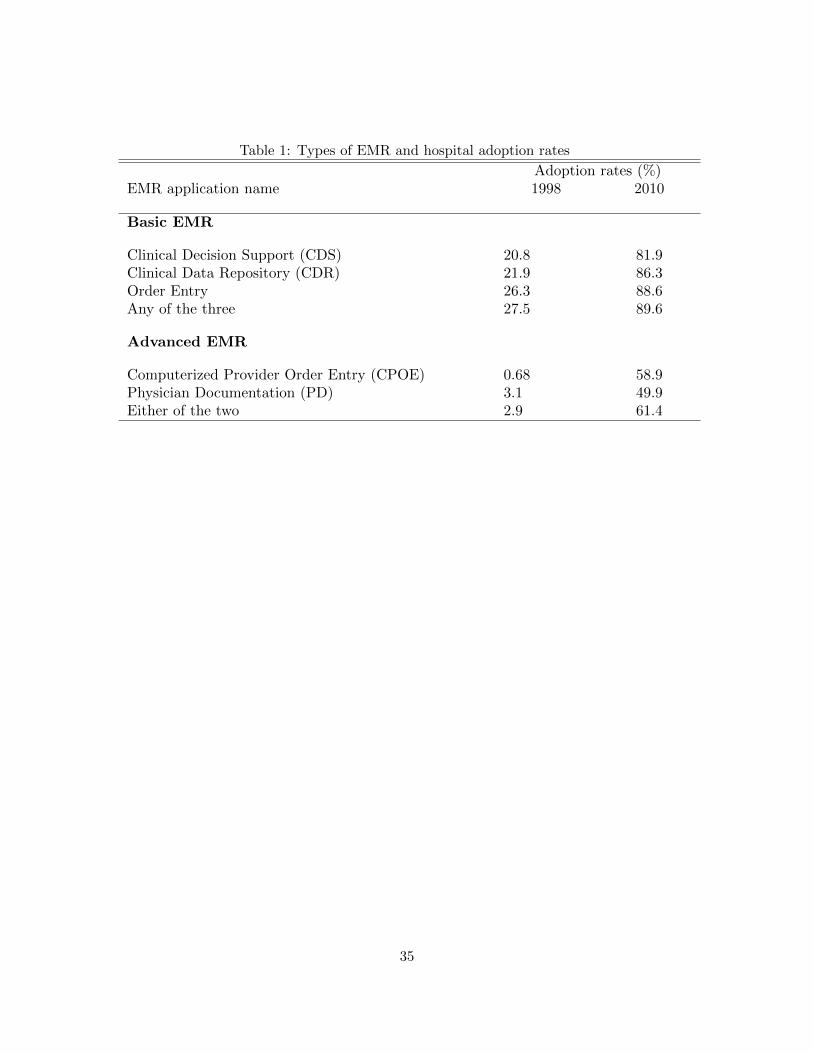
Table 1: Types of EMR and hospital adoption rates
Adoption rates (%)EMR application name 1998 2010
Basic EMR
Clinical Decision Support (CDS) 20.8 81.9Clinical Data Repository (CDR) 21.9 86.3Order Entry 26.3 88.6Any of the three 27.5 89.6
Advanced EMR
Computerized Provider Order Entry (CPOE) 0.68 58.9Physician Documentation (PD) 3.1 49.9Either of the two 2.9 61.4
35

Table 2: Summary statistics
Mean SD min max
EMR Adoption Rate (2010 value)Clinical Decision Support (CDS) 0.82 0.39 0 1Clinical Data Repository (CDR) 0.86 0.34 0 1
Order Entry 0.89 0.32 0 1Any of the three 0.90 0.31 0 1
Computerized Provider Order Entry (CPOE) 0.59 0.49 0 1Physician Documentation (PD) 0.50 0.50 0 1
Either of the two 0.61 0.49 0 1Measure of Revenue-Enhancing Practice (2010 value)
fraction 0.70 0.26 0 1patients with ≥ 2 diagnoses 0.97 0.092 0 1patients with ≥3 diagnoses 0.93 0.15 0 1patients with ≥1 procedure 0.68 0.35 0 1
patients with ≥2 procedures 0.41 0.34 0 1average total charges 34732.5 33232.7 160 805115
Patient Demographics (2010 value)Average age 56.5 21.6 0 124
Female 59.00%Medicare patients 40.01%
Charlson index 1.48 1.40 0 15Hospital Characteristics (2010 value)
% Teaching hospitals 11.2% Resident hospitals 32.4
% For profit hospitals 14.9% Nonprofit hospitals 69
% Government hospitals 16.1# of beds 245.4 168.9 6 993
# patient visits per hospital year 4453.1 3652.3 1 21620Total outpatient visits (000s) 185.1 244.3 0 2990.0
Total inpatient days (000s) 63.7 49 35 308.5Total admission (000s) 13.9 9.86 32 71.1
Births 1755.2 1618.8 0 8049Full-time physicians and dentists equivalent 28.5 82.6 0 906
Medicare discharges(000s) 4.9 3.6 0 21.05Medicaid discharges(000s) 2.6 2.9 0 19
Number of patient visits per hospital-year DRG pair 50.2 107.4 1 3814
Spread 0.63 0.48 0.082 3.065Debt:asset ratio: 0.63 0.47 0 3.76
36
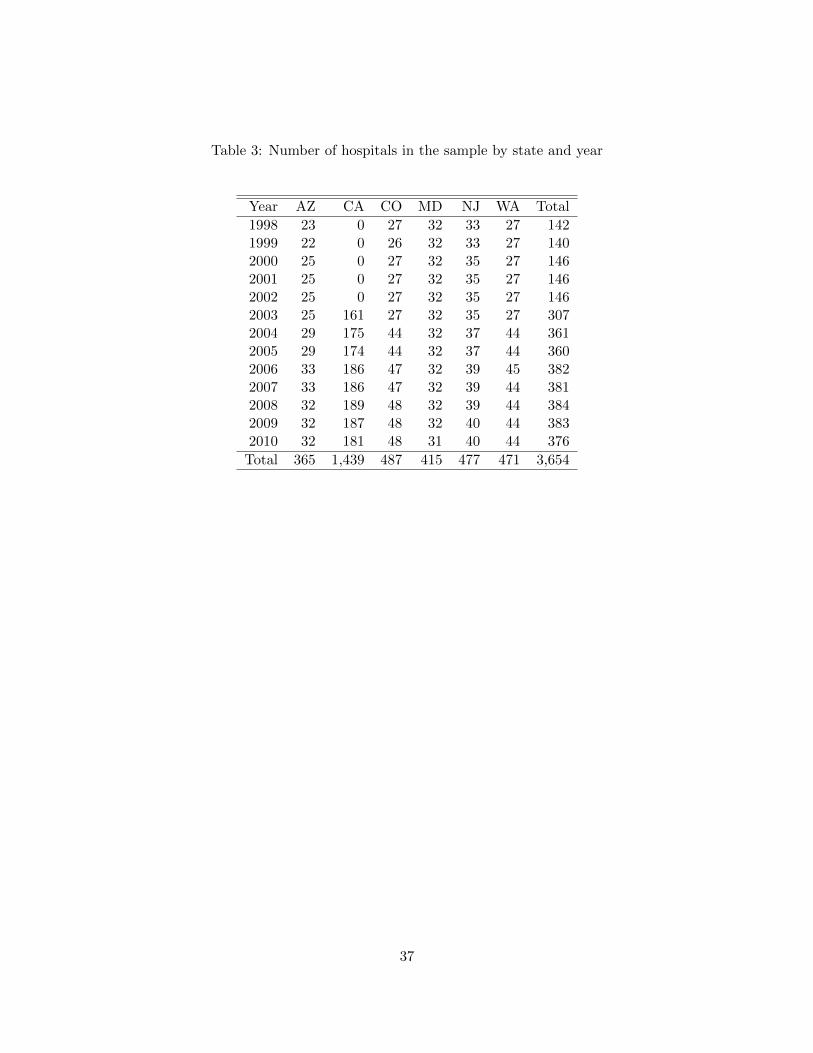
Table 3: Number of hospitals in the sample by state and year
Year AZ CA CO MD NJ WA Total
1998 23 0 27 32 33 27 1421999 22 0 26 32 33 27 1402000 25 0 27 32 35 27 1462001 25 0 27 32 35 27 1462002 25 0 27 32 35 27 1462003 25 161 27 32 35 27 3072004 29 175 44 32 37 44 3612005 29 174 44 32 37 44 3602006 33 186 47 32 39 45 3822007 33 186 47 32 39 44 3812008 32 189 48 32 39 44 3842009 32 187 48 32 40 44 3832010 32 181 48 31 40 44 376
Total 365 1,439 487 415 477 471 3,654
37

Tab
le4:
Over
all
effec
tof
EM
Ron
fract
ion
by
ap
pli
cati
on
(1)
(2)
(3)
(4)
(5)
(6)
(7)
(8)
mea
n(f
ract
ion
)=
0.67
0.6
70.6
70.6
70.6
70.6
70.6
70.6
7
Cli
nic
alD
ecis
ion
Su
pp
ort
0.01
3∗∗∗
(0.0
030)
Cli
nic
alD
ata
Rep
osit
ory
0.0
097∗∗
∗
(0.0
031)
Ord
erE
ntr
y0.0
11∗∗
∗
(0.0
032)
CP
OE
0.0
076∗∗
(0.0
033)
Physi
cian
Docu
men
tati
on0.0
055∗
(0.0
033)
Bas
icE
MR
only
0.0
11∗∗
(0.0
048)
Ad
van
ced
EM
R0.0
12∗∗
∗
(0.0
039)
Any
EM
R0.0
12∗
∗∗0.0
11∗
∗∗
(0.0
036)
(0.0
033)
Ob
serv
atio
ns
3444
95344495
344495
359010
359010
268208
268208
344495
Ad
just
edR
20.
458
0.4
58
0.4
58
0.4
43
0.4
43
0.4
60
0.4
60
0.4
58
Note
s:U
nit
of
obse
rvati
on
ishosp
ital-
yea
rD
RG
pair
.Sam
ple
incl
udes
data
from
1998
to2010.
The
dep
enden
tva
riable
isth
efr
act
ion
of
pati
ents
that
are
ass
igned
the
hig
her
-pay
ing
code
(wit
hco
mplica
tions)
.A
llre
gre
ssio
ns
incl
ude
contr
ols
,hosp
ital
fixed
effec
ts,
DR
G-p
air
fixed
effec
ts,
and
yea
rfixed
effec
ts.
See
equati
on
5.1
for
the
model
spec
ifica
tion.
See
Table
A1
for
afu
lllist
of
contr
ols
.
Robust
standard
erro
rsare
clust
ered
by
hosp
ital
and
are
rep
ort
edin
pare
nth
eses
.∗p<
0.1
,∗∗
p<
0.0
5,∗∗
∗p<
0.0
1
38

Tab
le5:
Eff
ect
ofE
MR
onfr
act
ion
by
hos
pit
alch
arac
teri
stic
san
dp
atie
nt
pop
ula
tion
(1)
(2)
(3)
(4)
(5)
(6)
(7)
By
own
ersh
ipty
pe
By
fin
anci
alst
atu
sB
yp
atie
nt
pop
ula
tion
Not
-for
-N
otn
on
-F
or-p
rofi
tp
rofi
tG
over
nm
ent
Dis
tres
sed
dis
tres
sed
Med
icar
eM
edic
are
mea
n(f
ract
ion
)=
0.68
0.68
0.65
0.66
0.67
0.67
0.6
1
Any
EM
R0.
023∗
0.01
1∗∗
∗0.
0095
0.01
8∗∗∗
0.00
710.
011∗∗
∗0.0
082∗
∗
(0.0
13)
(0.0
034)
(0.0
10)
(0.0
063)
(0.0
059)
(0.0
040)
(0.0
039)
Ob
serv
atio
ns
4685
124
9365
4827
945
340
4769
425
8494
271412
Ad
just
edR
20.
432
0.48
60.
375
0.45
00.
459
0.26
20.3
77
Note
s:U
nit
of
obse
rvati
on
ishosp
ital-
yea
rD
RG
pair
.Sam
ple
incl
udes
data
from
1998
to2010.
All
regre
ssio
ns
incl
ude
hosp
ital
fixed
effec
ts,
DR
G-p
air
fixed
effec
ts,
and
yea
rfixed
effec
ts,
as
wel
las
pati
ent
and
hosp
ital
chara
cter
isti
cs.
See
Table
A1
for
afu
lllist
of
contr
ols
.R
obust
standard
erro
rsare
clust
ered
by
hosp
ital
and
are
rep
ort
edin
pare
nth
eses
.∗p<
0.1
,∗∗
p<
0.0
5,∗∗
∗p<
0.0
1
39
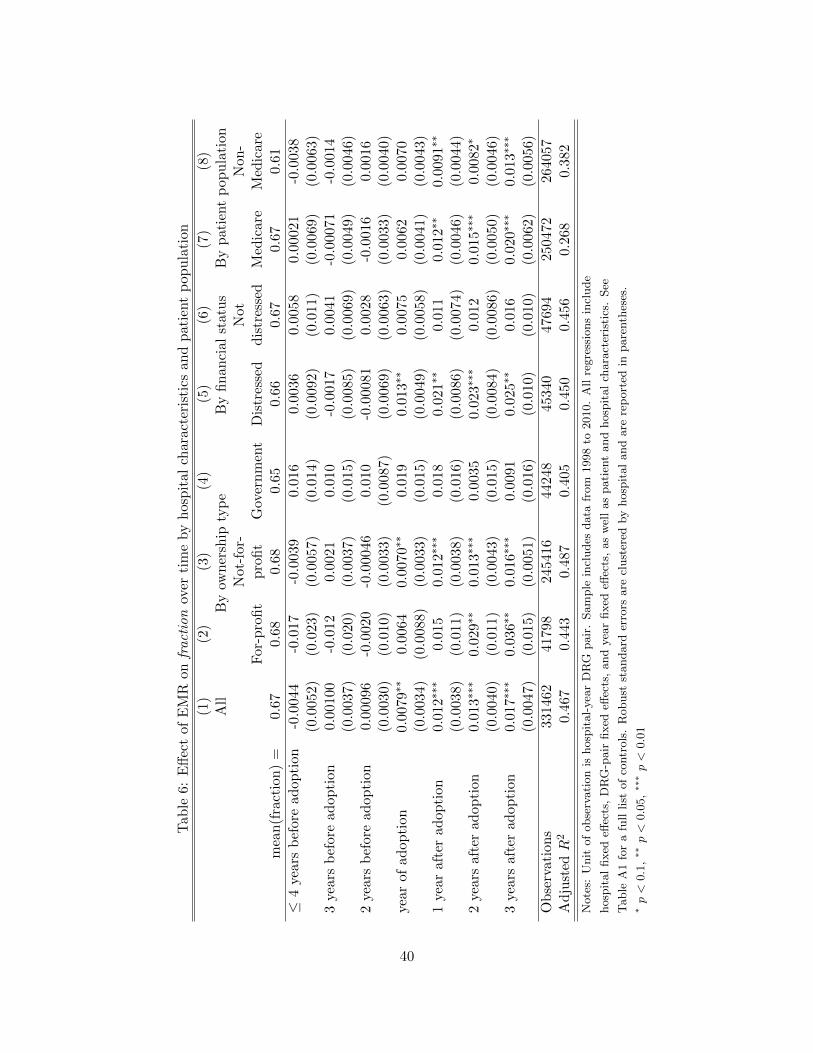
Tab
le6:
Eff
ect
ofE
MR
onfr
act
ion
over
tim
eby
hos
pit
alch
arac
teri
stic
san
dp
atie
nt
pop
ula
tion
(1)
(2)
(3)
(4)
(5)
(6)
(7)
(8)
All
By
own
ersh
ipty
pe
By
fin
anci
alst
atu
sB
yp
ati
ent
pop
ula
tion
Not
-for
-N
otN
on
-F
or-p
rofi
tp
rofi
tG
over
nm
ent
Dis
tres
sed
dis
tres
sed
Med
icare
Med
icare
mea
n(f
ract
ion
)=
0.67
0.68
0.68
0.65
0.66
0.67
0.6
70.6
1
≤4
yea
rsb
efor
ead
opti
on-0
.004
4-0
.017
-0.0
039
0.01
60.
0036
0.00
580.0
0021
-0.0
038
(0.0
052)
(0.0
23)
(0.0
057)
(0.0
14)
(0.0
092)
(0.0
11)
(0.0
069)
(0.0
063)
3yea
rsb
efor
ead
opti
on0.
0010
0-0
.012
0.00
210.
010
-0.0
017
0.00
41-0
.00071
-0.0
014
(0.0
037)
(0.0
20)
(0.0
037)
(0.0
15)
(0.0
085)
(0.0
069)
(0.0
049)
(0.0
046)
2yea
rsb
efor
ead
opti
on0.
0009
6-0
.002
0-0
.000
460.
010
-0.0
0081
0.00
28-0
.0016
0.0
016
(0.0
030)
(0.0
10)
(0.0
033)
(0.0
087)
(0.0
069)
(0.0
063)
(0.0
033)
(0.0
040)
year
ofad
opti
on0.
0079
∗∗0.
0064
0.00
70∗∗
0.01
90.
013∗
∗0.
0075
0.0
062
0.0
070
(0.0
034)
(0.0
088)
(0.0
033)
(0.0
15)
(0.0
049)
(0.0
058)
(0.0
041)
(0.0
043)
1yea
raf
ter
adop
tion
0.01
2∗∗
∗0.
015
0.01
2∗∗∗
0.01
80.
021∗
∗0.
011
0.0
12∗∗
0.0
091∗∗
(0.0
038)
(0.0
11)
(0.0
038)
(0.0
16)
(0.0
086)
(0.0
074)
(0.0
046)
(0.0
044)
2yea
rsaf
ter
adop
tion
0.01
3∗∗∗
0.02
9∗∗
0.01
3∗∗
∗0.
0035
0.02
3∗∗∗
0.01
20.
015∗∗
∗0.0
082∗
(0.0
040)
(0.0
11)
(0.0
043)
(0.0
15)
(0.0
084)
(0.0
086)
(0.0
050)
(0.0
046)
3yea
rsaf
ter
adop
tion
0.01
7∗∗∗
0.03
6∗∗
0.01
6∗∗
∗0.
0091
0.02
5∗∗
0.01
60.
020∗∗
∗0.0
13∗
∗∗
(0.0
047)
(0.0
15)
(0.0
051)
(0.0
16)
(0.0
10)
(0.0
10)
(0.0
062)
(0.0
056)
Ob
serv
atio
ns
3314
6241
798
2454
1644
248
4534
047
694
250472
264057
Ad
just
edR
20.
467
0.44
30.
487
0.40
50.
450
0.45
60.2
68
0.3
82
Note
s:U
nit
of
obse
rvati
on
ishosp
ital-
yea
rD
RG
pair
.Sam
ple
incl
udes
data
from
1998
to2010.
All
regre
ssio
ns
incl
ude
hosp
ital
fixed
effec
ts,
DR
G-p
air
fixed
effec
ts,
and
yea
rfixed
effec
ts,
as
wel
las
pati
ent
and
hosp
ital
chara
cter
isti
cs.
See
Table
A1
for
afu
lllist
of
contr
ols
.R
obust
standard
erro
rsare
clust
ered
by
hosp
ital
and
are
rep
ort
edin
pare
nth
eses
.∗p<
0.1
,∗∗
p<
0.0
5,∗∗
∗p<
0.0
1
40

Table 7: Effect of EMR on fraction by spread
(1) (2)fraction fraction
mean(fraction) = 0.67 0.67
Any EMR 0.025∗∗∗ 0.012∗∗
(0.0047) (0.0047)Spread 0.035∗∗∗
(0.0099)Spread× any EMR -0.011∗∗∗
(0.0035)Spread Q3 -0.0058
(0.0040)Spread Q2 -0.015∗∗∗
(0.0052)Spread Q1 -0.026∗∗∗
(0.0061)Spread Q3× anyEMR 0.0031
(0.0034)Spread Q2× anyEMR 0.0087∗∗
(0.0039)Spread Q1× anyEMR 0.013∗∗∗
(0.0047)
Observations 239918 239918Adjusted R2 0.463 0.463
Notes: Unit of observation is hospital-year DRG pair. Sample includes annual data from 1998 to 2007.
spread is defined as the difference between the weights of the top code and the bottom code of each
DRG pair. SpreadQ1 is a dummy indicating that the DRG pair has a spread below the 25th percentile
among all observations of that year. Similarly, Q2 and Q3 correspond to the 25th to 50th and the 50th to
75th quartiles. The top quartile is omitted. Regressions include controls, hospital fixed effects, DRG-pair
fixed effects, and year fixed effects. See Table A1 for a full list of controls. Robust standard errors are
clustered at the hospital level and are reported in parentheses. ∗ p < 0.1, ∗∗ p < 0.05, ∗∗∗ p < 0.01
41
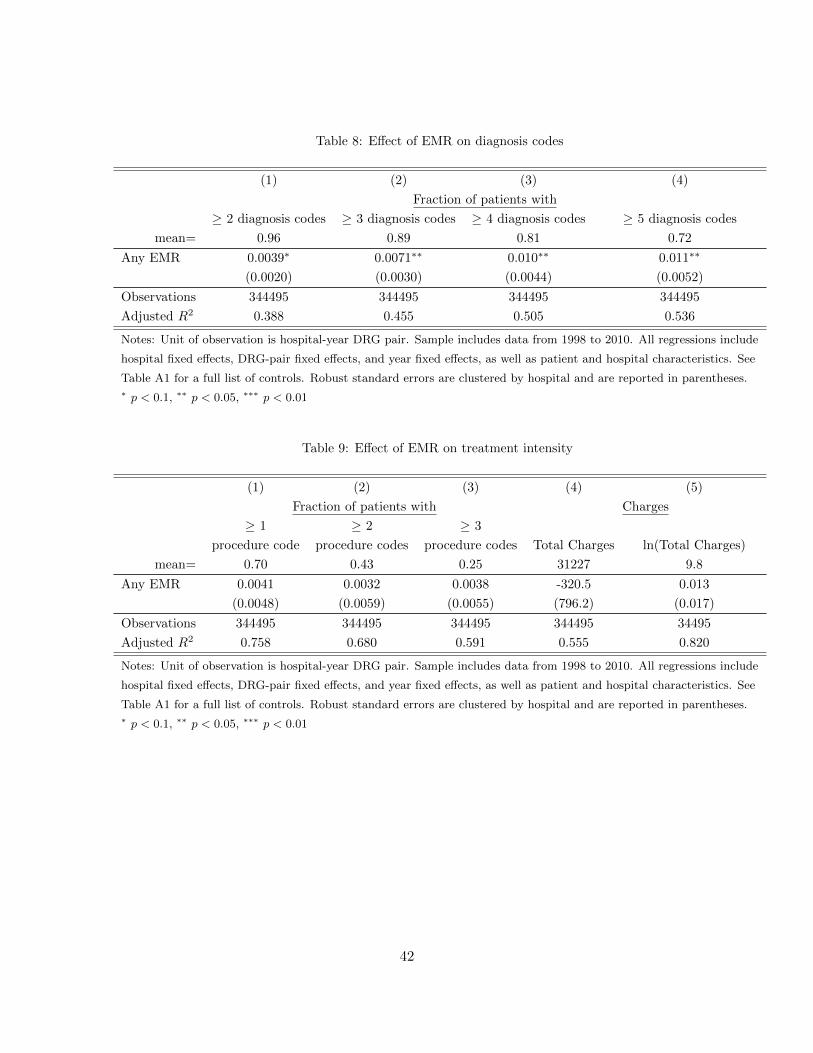
Table 8: Effect of EMR on diagnosis codes
(1) (2) (3) (4)
Fraction of patients with
≥ 2 diagnosis codes ≥ 3 diagnosis codes ≥ 4 diagnosis codes ≥ 5 diagnosis codes
mean= 0.96 0.89 0.81 0.72
Any EMR 0.0039∗ 0.0071∗∗ 0.010∗∗ 0.011∗∗
(0.0020) (0.0030) (0.0044) (0.0052)
Observations 344495 344495 344495 344495
Adjusted R2 0.388 0.455 0.505 0.536
Notes: Unit of observation is hospital-year DRG pair. Sample includes data from 1998 to 2010. All regressions include
hospital fixed effects, DRG-pair fixed effects, and year fixed effects, as well as patient and hospital characteristics. See
Table A1 for a full list of controls. Robust standard errors are clustered by hospital and are reported in parentheses.∗ p < 0.1, ∗∗ p < 0.05, ∗∗∗ p < 0.01
Table 9: Effect of EMR on treatment intensity
(1) (2) (3) (4) (5)
Fraction of patients with Charges
≥ 1 ≥ 2 ≥ 3
procedure code procedure codes procedure codes Total Charges ln(Total Charges)
mean= 0.70 0.43 0.25 31227 9.8
Any EMR 0.0041 0.0032 0.0038 -320.5 0.013
(0.0048) (0.0059) (0.0055) (796.2) (0.017)
Observations 344495 344495 344495 344495 34495
Adjusted R2 0.758 0.680 0.591 0.555 0.820
Notes: Unit of observation is hospital-year DRG pair. Sample includes data from 1998 to 2010. All regressions include
hospital fixed effects, DRG-pair fixed effects, and year fixed effects, as well as patient and hospital characteristics. See
Table A1 for a full list of controls. Robust standard errors are clustered by hospital and are reported in parentheses.∗ p < 0.1, ∗∗ p < 0.05, ∗∗∗ p < 0.01
42

Table 10: Changes in patients’ health condition
(1) (2) (3)
Charlson index Charlson index (truncated) Age
mean= 1.48 0.92 58.3
Any EMR -0.0011 0.0012 -0.18
(0.010) (0.0043) (0.12)
Observations 344495 344495 344495
Adjusted R2 0.716 0.689 0.627
Notes: Unit of observation is hospital-year DRG pair. Sample includes data from 1998 to 2010. All regressions include
hospital fixed effects, DRG-pair fixed effects, and year fixed effects, as well as patient and hospital characteristics. See
Table A1 for a full list of controls. Robust standard errors are clustered by hospital and are reported in parentheses.∗ p < 0.1, ∗∗ p < 0.05, ∗∗∗ p < 0.01
Table 11: Robustness check
(1) (2) (3) (4)
Drop cell observations<6 Weighted Least Squares Drop year>2008 Cluster SE at health system
Any EMR 0.010∗∗∗ 0.0089∗∗∗ 0.017∗∗∗ 0.011∗∗∗
(0.0031) (0.0034) (0.0039) (0.0038)
Observations 252764 344495 242872 344495
Adjusted R2 0.688 0.838 0.462 0.458
Notes: Unit of observation is hospital-year DRG pair. Sample includes data from 1998 to 2010. All regressions include
hospital fixed effects, DRG-pair fixed effects, and year fixed effects, as well as patient and hospital characteristics. See
Table A1 for a full list of controls. Robust standard errors are clustered by hospital and are reported in parentheses.∗ p < 0.1, ∗∗ p < 0.05, ∗∗∗ p < 0.01
43
References
Abelson, R. and J. Creswell (2014). Report finds more flaws in dig-
itizing patient files. http://www.nytimes.com/2014/01/08/business/
report-finds-more-flaws-in-digitizing-patient-files.html. New York Times.
Abelson, R., J. Creswell, and G. Palmer (2012). Medicare bills rise as
records turn electronic. http://www.nytimes.com/2012/09/22/business/
medicare-billing-rises-at-hospitals-with-electronic-records.html/. New York Times.
Agha, L. (2012). The effects of health information technology on the costs and quality of medical care.
Technical report, Working paper, Boston University.
Bates, D. W., J. M. Teich, J. Lee, D. Seger, G. J. Kuperman, N. Ma’Luf, D. Boyle, and L. Leape
(1999). The impact of computerized physician order entry on medication error prevention. Journal
of the American Medical Informatics Association 6 (4), 313–321.
Blumenthal, D. (2009). Stimulating the adoption of health information technology. New England
Journal of Medicine 360 (15), 1477–1479.
Bowblis, J. R. and C. S. Brunt (2013). Medicare skilled nursing facility reimbursement and upcoding.
Health economics.
Brunt, C. S. (2011). Cpt fee differentials and visit upcoding under medicare part b. Health Eco-
nomics 20 (7), 831–841.
Charlson, M. E., P. Pompei, K. L. Ales, and C. R. MacKenzie (1987). A new method of classifying
prognostic comorbidity in longitudinal studies: development and validation. Journal of chronic
diseases 40 (5), 373–383.
Commission, M. P. A., A. D. Book, et al. (2007). Healthcare spending and the medicare program.
Coulam, R. F. and G. L. Gaumer (1991). Medicare’s prospective payment system: a critical appraisal.
Health care financing review. Annual supplement , 45.
Dafny, L. S. (2005). How do hospitals respond to price changes? American Economic Review , 1525–
1547.
de Groot, V., H. Beckerman, G. J. Lankhorst, and L. M. Bouter (2003). How to measure comorbidity:
a critical review of available methods. Journal of clinical epidemiology 56 (3), 221–229.
Dranove, D. (1988). Pricing by non-profit institutions: the case of hospital cost-shifting. Journal of
Health Economics 7 (1), 47–57.
Dranove, D., C. Forman, A. Goldfarb, and S. Greenstein (2013). The trillion dollar conundrum:
Complementarities and health information technology. forthcoming, American Economic Journal:
Economic Policy .
44

Fonkych, K. and R. Taylor (2005). The state and pattern of health information technology adoption.
Rand Corporation.
Hartzband, P. and J. Groopman (2008). Off the record–avoiding the pitfalls of going electronic. New
England Journal of Medicine 358 (16), 1656–1657.
Hillestad, R., J. Bigelow, A. Bower, F. Girosi, R. Meili, R. Scoville, and R. Taylor (2005). Can
electronic medical record systems transform health care? potential health benefits, savings, and
costs. Health Affairs 24 (5), 1103–1117.
Himmelstein, D. U., A. Wright, and S. Woolhandler (2010). Hospital computing and the costs and
quality of care: a national study. The American journal of medicine 123 (1), 40–46.
Javitt, J. C., J. B. Rebitzer, and L. Reisman (2008). Information technology and medical missteps:
evidence from a randomized trial. Journal of health economics 27 (3), 585–602.
Jha, A., C. DesRoches, E. Campbell, K. Donelan, S. Rao, T. Ferris, A. Shields, S. Rosenbaum, and
D. Blumenthal (2009). Use of electronic health records in us hospitals. New England Journal of
Medicine 360 (16), 1628–1638.
McCullough, J. S., S. Parente, and R. Town (2013). Health information technology and patient out-
comes: The role of organizational and informational complementarities. Technical report, National
Bureau of Economic Research.
Miller, A. and C. Tucker (2010). User size and network externalities. Technical report, NET Institute
Working Paper.
Miller, A. R. and C. Tucker (2009). Privacy protection and technology diffusion: The case of electronic
medical records. Management Science 55 (7), 1077–1093.
Schulte, F., J. Eaton, and D. Donald (2012). Doctors, others billing medicare at
higher rates. http://articles.washingtonpost.com/2012-09-15/national/35496252_1_
data-codes-medicare. Washington Post.
Silverman, E. and J. Skinner (2004). Medicare upcoding and hospital ownership. Journal of health
economics 23 (2), 369–389.
Thurston, S., R. Linker, D. Grider, and S. Levinson (2009, Apr). The problem with
ehrs and coding. http://medicaleconomics.modernmedicine.com/medical-economics/news/
modernmedicine/modern-medicine-feature-articles/problem-ehrs-and-coding.
US Department of Health and Human Services & US Department of Justice (2012). http://www.
nytimes.com/interactive/2012/09/25/business/25medicare-doc.html?ref=business.
Walter, Z. and M. S. Lopez (2008). Physician acceptance of information technologies: Role of perceived
threat to professional autonomy. Decision Support Systems 46 (1), 206–215.
45

Table A1: Overall effect of EMR on fraction with coefficients of
controls
(1) (2) (3)
fraction fraction fraction
0.67 0.67 0.67
Basic EMR only 0.011∗∗
(0.0048)
Advanced EMR 0.012∗∗∗
(0.0039)
Any EMR 0.012∗∗∗ 0.011∗∗∗
(0.0036) (0.0033)
Age < 20 -0.29∗∗∗ -0.29∗∗∗ -0.29∗∗∗
(0.012) (0.012) (0.010)
20≤ Age <40 -0.14∗∗∗ -0.14∗∗∗ -0.14∗∗∗
(0.0057) (0.0057) (0.0050)
Age≥65 0.13∗∗∗ 0.13∗∗∗ 0.13∗∗∗
(0.0045) (0.0045) (0.0040)
% female -0.026∗∗∗ -0.026∗∗∗ -0.025∗∗∗
(0.0032) (0.0032) (0.0029)
Beds(000s) 0.051∗∗∗ 0.051∗∗∗ 0.064∗∗∗
(0.019) (0.019) (0.019)
log(outpatient visits) -0.0011 -0.0011 -0.0017
(0.0014) (0.0014) (0.0015)
log(admissions) -0.012 -0.012 -0.011∗
(0.0075) (0.0075) (0.0065)
log(fulltime MD) 0.0000056 -0.0000073 -0.00056
(0.00097) (0.00097) (0.00092)
Nonprofit× year 0.0013 0.0013 0.0018∗
(0.0012) (0.0012) (0.00094)
For-profit× year 0.0018 0.0018 0.0041∗∗∗
(0.0018) (0.0018) (0.0014)
Residency hospital× year -0.0028∗∗∗ -0.0028∗∗∗ -0.0019∗∗
(0.00093) (0.00094) (0.00084)
Academic hospital× year 0.00052 0.00053 0.00018
(0.0010) (0.0010) (0.00100)
% Medicare discharge × year -0.0065∗ -0.0066∗ -0.0061∗
(0.0036) (0.0036) (0.0031)
% Medicaid discharge × year 0.00034 0.00025 -0.0020
(0.0048) (0.0047) (0.0037)
46

Observations 268208 268208 344495
Adjusted R2 0.460 0.460 0.458
Notes: Unit of observation is hospital-year DRG pair. Sample includes data from 1998 to 2010. All regressions include
hospital fixed effects, DRG-pair fixed effects, and year fixed effects, as well as patient and hospital characteristics.
Robust standard errors are clustered by hospital and are reported in parentheses. ∗ p < 0.1, ∗∗ p < 0.05, ∗∗∗ p < 0.01
47

Table A2: Effect of EMR on fraction by hospital size
(1) (2)Beds<200 Beds≥ 200
mean(fraction) = 0.679 0.671
Any EMR 0.015∗∗∗ 0.008∗∗
(0.0055) (0.0038)
Observations 166648 177847Adjusted R2 0.401 0.538
Notes: Unit of observation is hospital-year DRG pair. Sample includes data from 1998 to 2010. All regressions include
hospital fixed effects, DRG-pair fixed effects, and year fixed effects, as well as patient and hospital characteristics. See
Table A1 for a full list of controls. Robust standard errors are clustered by hospital and are reported in parentheses.∗ p < 0.1, ∗∗ p < 0.05, ∗∗∗ p < 0.01
Table A3: Effect of EMR on average number of common procedures
(1) (2) (3) (4)MRI Ultrasound CT scan Lab tests
mean= 0.0073 0.0328 0.0293 0.0009
Any EMR 0.00057 0.0024 0.0014 0.00038∗
(0.0011) (0.0050) (0.0056) (0.00023)
Observations 3628 3628 3628 3628Adjusted R2 0.753 0.749 0.675 0.521
Notes: Unit of observation is hospital year. Sample includes data from 1998 to 2010. All regressions include
hospital fixed effects and year fixed effects, as well as patient and hospital characteristics. See Table A1 for
a full list of controls. Robust standard errors are clustered by hospital and are reported in parentheses.∗ p < 0.1, ∗∗ p < 0.05, ∗∗∗ p < 0.01
48
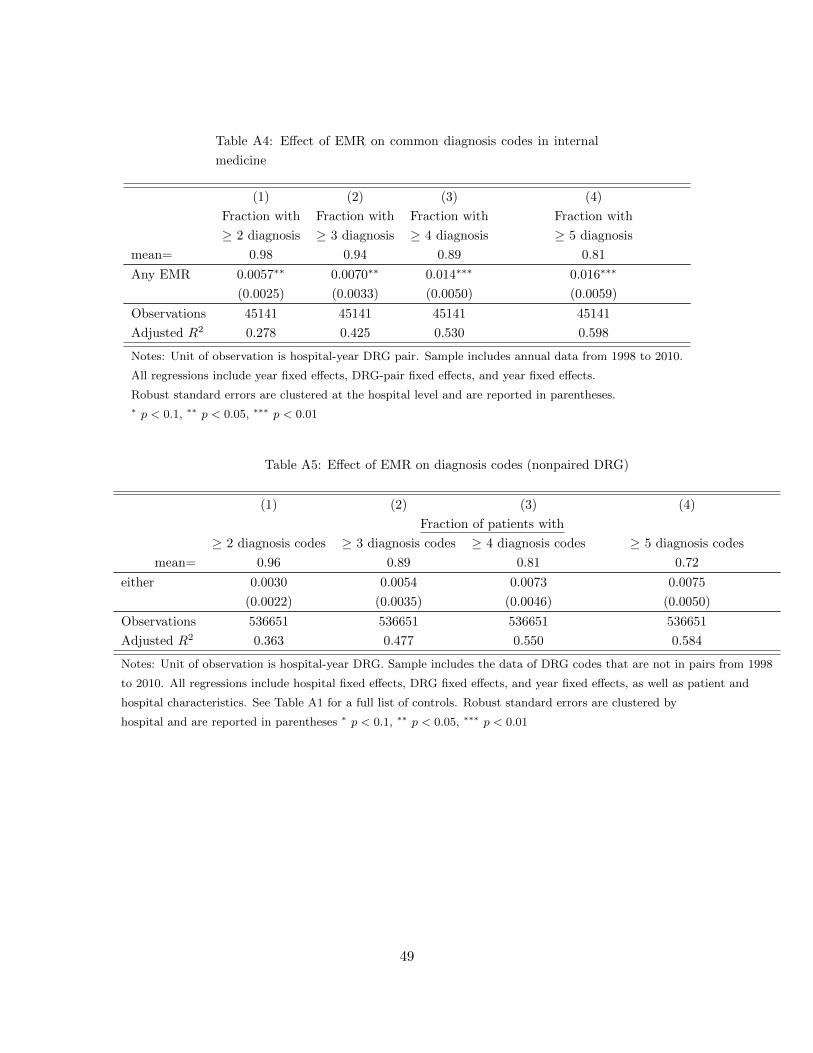
Table A4: Effect of EMR on common diagnosis codes in internal
medicine
(1) (2) (3) (4)
Fraction with Fraction with Fraction with Fraction with
≥ 2 diagnosis ≥ 3 diagnosis ≥ 4 diagnosis ≥ 5 diagnosis
mean= 0.98 0.94 0.89 0.81
Any EMR 0.0057∗∗ 0.0070∗∗ 0.014∗∗∗ 0.016∗∗∗
(0.0025) (0.0033) (0.0050) (0.0059)
Observations 45141 45141 45141 45141
Adjusted R2 0.278 0.425 0.530 0.598
Notes: Unit of observation is hospital-year DRG pair. Sample includes annual data from 1998 to 2010.
All regressions include year fixed effects, DRG-pair fixed effects, and year fixed effects.
Robust standard errors are clustered at the hospital level and are reported in parentheses.∗ p < 0.1, ∗∗ p < 0.05, ∗∗∗ p < 0.01
Table A5: Effect of EMR on diagnosis codes (nonpaired DRG)
(1) (2) (3) (4)
Fraction of patients with
≥ 2 diagnosis codes ≥ 3 diagnosis codes ≥ 4 diagnosis codes ≥ 5 diagnosis codes
mean= 0.96 0.89 0.81 0.72
either 0.0030 0.0054 0.0073 0.0075
(0.0022) (0.0035) (0.0046) (0.0050)
Observations 536651 536651 536651 536651
Adjusted R2 0.363 0.477 0.550 0.584
Notes: Unit of observation is hospital-year DRG. Sample includes the data of DRG codes that are not in pairs from 1998
to 2010. All regressions include hospital fixed effects, DRG fixed effects, and year fixed effects, as well as patient and
hospital characteristics. See Table A1 for a full list of controls. Robust standard errors are clustered by
hospital and are reported in parentheses ∗ p < 0.1, ∗∗ p < 0.05, ∗∗∗ p < 0.01
49