Embed Size (px)
Citation preview
International Journal of Computer Science Trends and Technology (IJCST) – Volume 5 Issue 3, May – Jun 2017
ISSN: 2347-8578 www.ijcstjournal.org Page 162
Crack Propogation Analysis Of Single Edge Notch Beam Mr. Shashikant Ashok Sandhan, Prof. V. L. Kadlag
ME Mechanical, Mechanical Engineering Department
SVIT, Chincholi, Sinner, Nashik
Maharastra - India
ABSTRACT Metal beams are extensively used in automobile sectors and machine components. Some of their applications
include connecting rod of IC engine, shafts, axles, and gears, structures members of bridges and also components of
machines. Most of them experience various load condition in their service life’s such loading conditions may initiate
a crack and cause crack growth. These forces may be tension, compression, internal pressure, bending or any
combination of all. The monitoring and modeling of crack growth are necessary for the stability and safety of
machines and structures. A finite element based two dimensional crack propagation simulator software Ansys14.0
used propagation in two dimensional beam. Four point bending test experiment is carried out on aluminium beam
and crack growth behaviour is observed. These two observations i.e. from Ansys and experiment are compared. In
the present work an attempt has been made to develop a failure prediction methodology by using an Exponential
Model in single edge notched (SEN) cracked beams. The predicted results are compared with experimental crack
growth data. It has been observed that the results obtained from the models are in good agreement with experimental
data.
Keywords:- SEN
I.INTRODUCTION
Beams are used in factories and industries
for support and to give strength to various elements.
It is important to predict crack growth to obtain flaw
acceptance criteria for an existing initial planar notch.
Many experiments are performed to study the crack
growth behaviour of beams containing initial surface
notch under different loading condition [1,2].
Practical methods are not often used to study crack
growth as these require a lot of time and money and
are destructive in nature. So analytical methods are
used to solve this problem based on finite element
method and fracture mechanics. Analyses of three
dimensional partial circumferential cracks need
complex computational work to keep pace with the
mesh pattern and large computer storage memory.
Hence it is essential to have two dimensional analysis
of the beam for ease of study. Thus a three
dimensional beam is converted to a two dimensional
beam having same thickness. For conversion a
method has been proposed based on equating
deflection of both the pipe specimen and the beam.
Four point bending test experiment is performed by
taking a bar made of EN8 material having a initial
crack at one edge. A mesh generation program
software CASCA is used and then for crack
propagation simulation , a finite element based
program FRANC2D software is used. Values of C
and m (constants of Paris model) obtained from both
the process are compared.
Progress has been made in the development
of bending theory for cracked thin plates since the
first work (Williams, 1961). His equations for the
elastic stresses local to the crack tip contained two
unspecified constants, which were defined by Sih,
Paris and Erdogan (1962). Additionally, other
theories have also described the local stress near the
tips of through cracks in plates, the surfaces of the
crack were taken to be stress free in either the
Kirchhoff or the Reissner sense, and the crack tip was
taken to be straight through the thickness of the plate
(Williams, 1961; Knowles and Wang, 1960;
Hartranft and Sih, 1968). However, there is ample
experimental evidence that the restrictions of the
mathematical model are violated in reality (Erdogan,
Tuncel and Paris, 1962). Out-of-plane bending will
produce tension on one surface of the plate and
compress on on the other. This compression induces
contact of the crack faces. In this circumstance, the
behavior of the front crack during growth is not so
RESEARCH ARTICLE OPEN ACCESS
International Journal of Computer Science Trends and Technology (IJCST) – Volume 5 Issue 3, May – Jun 2017
ISSN: 2347-8578 www.ijcstjournal.org Page 163
simple. To the knowledge of the authors, there are
few studies that address the numerical simulation of
crack propagation in plates under cyclic bending,
other than that by Roy et al. (2005). However, Roy et
al. combined out-of plane bending with a tension
load. Further more, there are no experimental studies
of crack propagation under cyclic bending loads. For
example, Erdogan et al. (1962) and Yan et al. (2010)
did experiments using out-ofplane bending, but in
these works the loading is applied statically.
Potyondy considered cyclic loading in fracturing
analysis of shells, but the crack face contact was not
taken into account because a membrane loading and a
bulge-out effect were considered. (Potyondy,
Wawrzynek and Ingraffea, 1995).
The behavior of pre-catastrophic crack
extension in a plate in combined extension and
approximately cylindrical bending was studied by
Wynn and Smith (1969). They compared the
experimental stress with Sih-Hartranft bending
theory. The results are similar to experiment results
in regions where the crack remained open at fracture,
but appeared to provide a lower bound in the region
where crack closure occurred. Smith and Smith
(1970) first studied this problem experimentally
using frozen stress photoelasticity and the data were
also compared with Hartranft-Sih theory. They
concluded that crack face contact during bending
increased the crack tip stress over the no contact case.
More frozen stress photoelasticity experiments were
presented in Mullinix and Smith (1974), but an
extension load was applied simultaneously with the
bending load to ensure that the crack did not close.
Those experimental results agree with the Sih theory
only for thin to moderately thick cracked plate
geometries ( / 2 1 t a < ). In 1992, a theoretical work
was performed using a line contact analysis for
Kirchhoff theory (Young and Sun, 1992). This study
considered closure at the compressive edges for an
infinite plate containing a center crack under
bending. It was found that the closure at the
compressive edge tends to reduce the crack opening
displacement at the tension side and as a result,
reduce the stress intensity factors. In addition,
Heming (1980) used finites elements with Reissner
theory kinematics, and also assuming a line contact
during bending. He also found that the opening
displacements on the crack are reduced. Alwar and
Ramachandran (1983) considered a three dimensional
finite element analysis for this problem. By iteration
they were able to accurately determine the actual area
of contact. As Young and Heming, they concluded
that closure reduces the crack tip stress intensity.
Later, analytical works were developed for an infinite
plate that solves the area contact using Reissner
theory (Slepyan, Dempsey and Shekhtman, 1995;
Dempsey, Shekhtman and Slepyan, 1998). They
determined the shape of the closure region and its
dependence on the remote loading, as well as length
to plate thickness ratio for a pre-existing through
crack. Zehnder and Viz (2005) provide some reviews
on this subject.
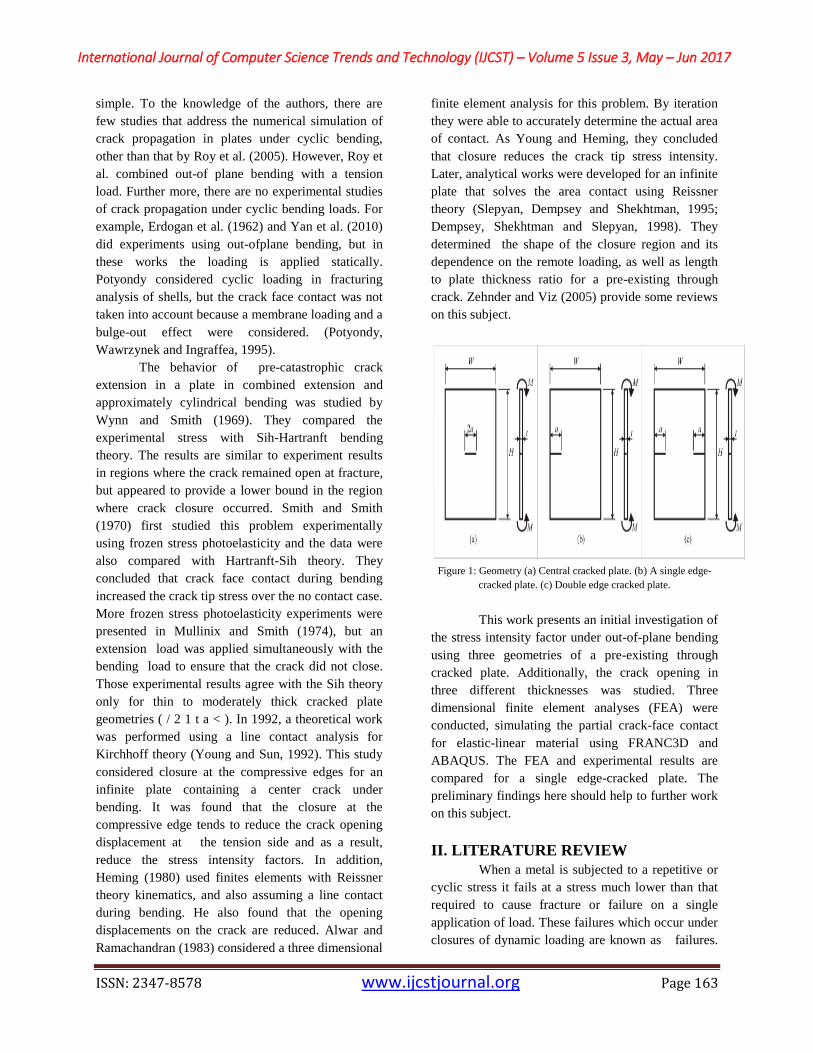
Figure 1: Geometry (a) Central cracked plate. (b) A single edge-
cracked plate. (c) Double edge cracked plate.
This work presents an initial investigation of
the stress intensity factor under out-of-plane bending
using three geometries of a pre-existing through
cracked plate. Additionally, the crack opening in
three different thicknesses was studied. Three
dimensional finite element analyses (FEA) were
conducted, simulating the partial crack-face contact
for elastic-linear material using FRANC3D and
ABAQUS. The FEA and experimental results are
compared for a single edge-cracked plate. The
preliminary findings here should help to further work
on this subject.
II. LITERATURE REVIEW
When a metal is subjected to a repetitive or
cyclic stress it fails at a stress much lower than that
required to cause fracture or failure on a single
application of load. These failures which occur under
closures of dynamic loading are known as failures.
International Journal of Computer Science Trends and Technology (IJCST) – Volume 5 Issue 3, May – Jun 2017
ISSN: 2347-8578 www.ijcstjournal.org Page 164
Failures occur when a metal is subjected to a
repetitive, cyclic or fluctuating stress (load) and will
fail at a stress much lower than its tensile strength.
This kind of failure occurs without any plastic
deformation. The appearance of the fracture surface,
which shows a smooth region, due to the rubbing
action of a crack propagated through a rough section,
where the member has failed in a ductile manner at a
point when the cross section was no longer able to
carry the load. Three basic factors are necessary to
cause failures.
These are:
1. A high value Maximum tensile stress,
2. A large variation in fluctuation on the applied
stress, and
3. A sufficiently large number of cycles of the
applied stress.
Coming to the processes involved in the process:
1. Crack initiation – damage is developed and that
can be removed by thermal annealing.
2. Slip band crack growth – involves the deepening
of the initial crack on high shear stress planes. This
frequently is called stage I crack growth.
3. Crack growth on planes of high tensile stress –this
involves growth of well-defined crack in a direction
perpendicular to maximum tensile stress. Usually
called stage II crack growth.
4. Ultimate ductile failure – this occurs when crack
reaches sufficient length so that the remaining cross
section cannot support the load.
The relative proportions of the total failure that are
involved with each stage depend on the test
conditions and the material. However, it is well
established that a crack can be formed before 10
percent of the total life of the specimen has elapsed.
In general, larger proportions of the total cycles to
failure involves the propagation of the stage II cracks
in low-cycle than in long-life, while stage I crack
growth comprises the largest segment for low-stress,
high-cycle. If the tensile stress is high, as in the
sharply notched specimens, stage I crack growth may
not be observed at all. Several experiments and
models have been proposed till date in order to
predict crack propagation with load control method
under constant amplitude loading conditions with
different stress ratios with the help of INSTRON-
8800. Generally crack length is measured by
travelling microscope determined by mathematical
modeling of standard specimens or by empirical
relationship or by experimental investigation. We are
here doing the experimental procedure to find out the
crack length for beams. Generally compliance crack
length relationship and four point bend test are used
for determination of crack growth. The objective of
present work is to develop compliance correlation of
a-N data and estimation of fatigue crack propagation
life by using exponential model.
Cyclic fatigue involves the microstructural
damage and failure of materials under cyclically
varying loads. Structural materials, however, are
rarely designed with compositions and
microstructures optimized for fatigue resistance.
Metallic alloys are generally designed for strength,
intermetallic for ductility, and ceramics for
toughness; yet, if any of these materials see
engineering service, their structural integrity is often
limited by their mechanical performance under cyclic
loads. In fact, it is generally considered that over 80
percent of all service failures can be traced to
mechanical fatigue, whether in association with
cyclic plasticity, sliding or physical contact (fretting
and rolling contact fatigue), environmental damage
(corrosion fatigue), or elevated temperatures (creep
fatigue). Accordingly, a large volume of literature has
been amassed particularly over the past twenty-five
years, dealing with the mechanics and mechanisms of
mechanical fatigue failure [1, 2].
Subcritical crack growth can occur at stress
intensity K levels generally far less than the fracture
toughness Kc in any metallic alloy when cyclic
loading is applied (∆KTH/Kc is nearly equal to 0.1 –
0.4). In simplified concept, it is the accumulation of
damage from the cyclic plastic deformation in the
plastic zone at the crack tip that accounts for the
intrinsic mechanism of fatigue crack growth at K
levels below Kc. The process of fatigue failure itself
consists of several distinct processes involving initial
cyclic damage (cyclic hardening or softening),
formation of an initial „fatal‟ flaw (crack initiation),
macroscopic propagation of this flaw (crack growth),
and final catastrophic failure or instability. The
physical phenomenon of fatigue was first seriously
Considered in the mid nineteenth century when
widespread failures of railway axles in Europe
prompted Wohler in Germany to conduct the first
systematic investigations into material failure under
cyclic stresses Wohler, 1860 [3]. However, the main
International Journal of Computer Science Trends and Technology (IJCST) – Volume 5 Issue 3, May – Jun 2017
ISSN: 2347-8578 www.ijcstjournal.org Page 165
impetus for research directed at the crack propagation
stage of fatigue failure, as opposed to mere lifetime
calculations, did not occur until the mid-1960s, when
the concepts of linear elastic fracture mechanics and
so-called „defect-tolerant design‟ were first applied
to the problem of subcritical flaw growth (Paris et al.,
1961; Johnson and Paris, 1967). Such approaches
recognize that all structures are flawed, and that
cracks may initiate early in service life and propagate
subcritical.
This paper [4, 5] presents the fatigue crack
growth analysis on the perforated wide flange I-beam
which is subjected to constant amplitude bending
loadings. I-beam of grade steel is widely used in
building and other structural constructions. The
detailed geometries according to the size and weight
have been standardized such as ASTM, ISO etc.
Since I-beam has a significant contribution in
building and other structural constructions, careful
considerations has to be taken if defects or cracks are
present in the beams. Many researchers have reported
the behaviors of beam. Dunn et al.have introduced
closed-form expressions for stress intensity factors
for cracked square -beams subjected to a bending
moment. GAO and Herman [6] have estimated the
stress intensity factors for cracked beams. Most
structural components are often subjected to cyclic
loading, and fatigue fracture is the most common
form of failure. In general, fatigue process consists of
three stages: initiation and early Crack propagation,
subsequent crack growth, and final fracture. The
fatigue crack growth rate, da/dN, which determines
the fatigue life of the cracked components, has
extensively been investigated experimentally and
theoretically. Stephens et al. [7] reported that fatigue
crack growth curve for constant amplitude loading
consisting of the crack growth rate (da/dN) versus the
stress intensity factor range (ΔK) in the log–log scale
typically includes three regions. Region-I is the near
threshold region and indicate the threshold (ΔKth)
value which there is no observable crack growth.
Microstructure, mean stress, frequency, and
environment mainly control Region I crack growth.
Region II corresponds to stable macroscopic crack
growth that is typically controlled by the
environment. In Region III the fatigue crack growth
rates are very high as they approach to instability. In
Region III crack growth is often ignored in practice
due to the insignificant fatigue life remaining upon
entering the region. Structural engineers have been
utilizing numerical tools/ software packages of Finite
Element Method or Boundary Element Method to
assess their designs for strength including crack
problems. BEM has emerged as a powerful
alternative to Finite Element Method (FEM) for cases
where better accuracy is required due to situations
such as stress concentration (as in the case of a
crack), or an infinite domain problem. Since BEM
only requires discretization of surfaces (in case of 3D
problems) and discretization of lines (in case of 2D
problems), it allows modeling of the problem
becoming simpler. Aliabadi [8] reported various
applications of BEM to solve solid mechanics
problems. Boundary element formulations for
modeling the nonlinear behavior of concrete were
reported by Aliabadi and Saleh [9]. Fatigue crack
growth is required for the assessment of residual
fatigue life, or for a damage tolerance analysis to aid
structural design. In this paper fatigue crack growth
of corner crack in wide flange I-beam under constant
amplitude bending loading are presented. A quarter-
elliptical corner crack in a prismatic solid is analyzed
as benchmarking model for the available analytical
solution [10] prior to making further modeling of the
cracks.
This paper examines the fatigue crack growth
histories of a range of test specimens and service
loaded components in Aircraft structures and Joint
failures. The crack growth shows, as a first
approximation a linear relationship between the log
of the crack length or depth and number of cycles.
These cracks have grown from; semi- and quarter
elliptical surface cuts, holes, pits and inherent
material discontinuities in test specimens, fuselage
lap joints, welded butt joints, and complex tubular
jointed specimens‟ .This application of exponential
crack growth are discussed. The stress intensity
factor range, ∆K has for many years been known to
have a significant correlation with the crack growth
rate, da/dN. The first paper making this correlation
was published in 1961 by Paris, Gomez and
Anderson [12], who adopted the K-value from the
analysis of the stress field around the tip of a crack as
proposed by Irwin in 1957 [13]. The results of the
constant-amplitude crack growth tests by Paris were
expressed in terms of da/dN (where N is the number
of fatigue cycles) as a function of ∆K (which is
Kmax - Kmin) on a double log scale. Plotting such
International Journal of Computer Science Trends and Technology (IJCST) – Volume 5 Issue 3, May – Jun 2017
ISSN: 2347-8578 www.ijcstjournal.org Page 166
data shows a region of growth where a linear relation
between log (da/dN) and log (∆K) appears to exist.
This paper examines the Compliance crack length
relations for the four-point bend specimen geometry
in the laboratory. Crack lengths can be measured by
direct and indirect means. While direct methods of
crack length measurement, e.g. by travelling
microscope, are tedious and prone to human error,
the indirect methods are not only superior in these
respects but are also amenable to automation and
therefore useful for computer-controlled fatigue
testing. The simulation and analysis process is done
at various locations in four point bend test. A
beachmarked fatigue fracture is produced under 4PB
loading. The crack length at each beachmark
obtained by optical measurements and compared with
that obtained by the crack mouth CCL relation
developed [14]. This paper examines the life
prediction methodology by adopting an „Exponential
Model‟ that can be used without integration of
fatigue crack growth rate curve. The predicted results
are compared with experimental crack growth data
obtained for 7020-T7 and 2024-T3 aluminum alloy
specimens under constant amplitude loading. It is
observed that the results obtained from this model are
in good agreement with experimental data and cover
both stage-II and stage-III of fatigue crack growth
curve [15]. The aim of developing a fatigue crack
growth model is to predict a safe operating life while
designing a structure/component subjected to cyclic
loading. The service life of a structure/machine
component under cyclic loading can be estimated by
integrating the rate equation of the Paris type.
However, direct integration becomes robust and
complicated as the geometrical factor „f (g)‟ in the
expression of ∆K varies with crack length. Therefore,
fatigue life may be estimated by numerical
integration using different values of „f (g)‟ held
constant over a small crack length increment [16]. To
overcome this difficulty, the authors have attempted
to introduce a life prediction procedure by adopting
an „Exponential Model‟. The model can predict the
fundamental a– N curve to calculate life without
integration of FCGR curve. It is worth mentioning
that an exponential model is often used for
calculation of growth of population/bacteria, etc. In
this paper, the fatigue cracks propagate in
longitudinally reinforced concrete beams without
stirrups. The experimental program has been
designed to investigate the influence of the shear
span-to-depth ratio on diagonal crack propagation
and load carrying capacity of tested beams under four
point bend test. The obtained test results were
compared with numerical results made on the basis of
Finite Element Method .In this paper, Fatigue crack
growth tests were conducted on double cantilever
beam bonded specimens with the aim to characterize
an adhesive for structural applications. The tests were
conducted in lab air at two different load ratios, and
at two different loading frequencies, Crack
propagation was monitored using the compliance
method by three point bend test and FE model was
used also.
III. CRACK PROPAGATION
3.1 CRACK PROPAGATION
A component containing a crack, when
loaded statically, no crack growth is seen as long as
the crack length or the loading remains below a
critical value. If the loading is oscillating crack
growth in small steps can be observed for loading
amplitudes far below the critical static load. This type
of crack growth is called crack growth. Usually crack
growth is specified by the crack growth rate (da/dN),
where N is the number of load cycles.
Crack propagation behaviour for metals can
be divided into three regions. The behaviour in
Region I exhibit a -threshold cyclic stress intensity
factor range, ∆Kth below which cracks do not
propagate under cyclic stress fluctuations. Region II
represents the crack propagation behaviour above
∆Kth which can be represented by [5],
Where, a = crack length; N = no. of cycles; ∆K =
stress intensity factor range,
‘c’ and ‘m’ are material constants.
The crack growth per cycle in region III is higher
than that for region II.
Region wise following characteristics are shown by
the metal.
Region I: The stage I propagate initially along the
persistent slip bands. This stage is a non-propagating
stage or very slow propagating stage with around 1
nm per cycle. The crack growth here is largely
influenced by mean stress, microstructure and
environmental factors.
Region II: This is widely studied stage among all
the stages of crack propagation. This is also stable
International Journal of Computer Science Trends and Technology (IJCST) – Volume 5 Issue 3, May – Jun 2017
ISSN: 2347-8578 www.ijcstjournal.org Page 167
stage crack propagation process. Continuous
behaviour, striations or transition from non-
continuous behaviour with,
(a) Large influence of certain combinations of
environment, mean stress and frequency,
(b) Small to large influences of microstructures,
depending on material.
Region III: In this stage unstable crack growth
occurs which followed by failure. Static mode of
behaviour is shown by the object. In this stage there
is a large influence of microstructure, mean stress and
thickness but a little influence of environmental
changes, inter-granular and dimples affects this stage
of crack growth.
3.2 Stress analysis for members with cracks-
fracture mechanics approach.
For analyzing fracture and behaviour of
sharply notched structural members (cracked or
flawed) fracture mechanics is the recommended
engineering method to be used in terms of stress and
crack length. So as to analyze stress in vicinity of a
well-defined crack or a sharp crack, stress
concentration factor and stress intensity factor are the
main factors to be observed at these points
respectively.
Stress concentration Factor is used for
analyzing stress at a point in vicinity of any well-
defined notches. The discontinuities in structural
components like holes, notches, fillets etc. when have
a well-defined geometry, the value of stress intensity
factor, Kt can be determined [7]. This Stress
Concentration factor gives an important relationship
between applied nominal stress and local maximum
stress. However when the stress concentration goes
severe, like while approaching a sharp where the
radius of the crack tip is nearly zero, an analytical
method which is different from the stress
concentration is needed to analyse the behaviour of
that structural component containing imperfections.
The parameter Stress Intensity Factor (K)
which is related to both nominal stress level in the
member and length of crack (a) and it has a unit of
ksi√ (MPa√ ). To establish methods of stress
analysis for cracks in elastic solids, it is surely
defined in three types of relative movements of
adjacent crack surfaces. The displacement modes (fig
2) represents the local deformation ahead of a crack.
The opening mode I is characterized with local
displacements which are symmetric with respect to x-
y and x-z planes. The two fractured surfaces displace
perpendicularly to each other in opposite directions.
Mode II, is skew-symmetric with respect to the with
respect to x-z plane and is symmetric with respect to
x-y plane. The sliding surfaces slide over each other
in the direction which is perpendicular to the line of
crack tip. Mode III, the tearing mode is associated
with the local displacement which are skew
symmetric with both x-y and x-z planes. Here the two
fracture surfaces slide over each other in the direction
parallel to the crack front line. Each of these modes
of deformation corresponds to a basic type of stress
field which is in the vicinity of the crack tips.
IV. METHODOLOGY
Objectives
The objective of present work is:
1. The basic aim of present work is to develop a
crack propagation model for SEN beam without
going through numerical integration process. The
specific growth rate (m) is an important
parameter of our model. The value of m is
correlated with two crack driving forces (ΔK and
Kmax), and with material parameters fracture
toughness (KC), yield strength (σYS), stress
ratio(R), and Young‟s modulus (E) by curve
fitting.
2. Plates with a pre-existing through-the-thickness
crack were studied under the action of a remote
bending moment.
3. The dependence of the contact region in the
crack tip was investigated, as well as the bending
effect on the stress intensity factor.
4. Two sets of numerical analyses were performed.
One set uses different crack geometries for a
constant plate thickness, and the second set uses
a single crack geometry for three different plate
thicknesses.
5. The experimental a-N data of four specimens
were used for formulation of model, and its
validation has been checked for 5th and 6th
specimens.
6. The predicted result by using exponential model
has been compared with the experimental results.
Methodology:
International Journal of Computer Science Trends and Technology (IJCST) – Volume 5 Issue 3, May – Jun 2017
ISSN: 2347-8578 www.ijcstjournal.org Page 168
The crack initiation starts in a point where
the stress concentration is high. This stress
concentration may be due to abrupt change in cross
section or due to defect present within the system.
The change of the cross section can do in such a way
that the stress concentration will be lower. But the
defect due to manufacturing process cannot be
eliminated completely because of the complex nature
of manufacturing and human interference.
Detection and measurement of cracks and
damage can, in general terms, be classified into the
following two groups according to their areas of
application: laboratory methods and field service
assessment methods. Numerous approaches and
techniques are available to specify crack initiation
and measure crack size for laboratory and field
applications are summaries. This damage can be
measured as the progressive development of a crack
from the sub-microscopic phases of cyclic slip and
crack initiation, followed by the macroscopic crack
propagation stage, to the final distinct fracture. These
three stages are important in defining the life of
specimen and structural components. In many
situations, crack initiation can, however, be the
primary event for life estimation and design analysis.
Crack initiation is the originator of failure. If the
early stage of crack initiation can be identified, the
mechanisms of crack initiation can be better
understood and failure may be banned. When
selecting a method or technique for crack detection or
monitoring and measurement, sensitivity or crack
size resolution plays an important role. The selection
of crack measurement technique depends on loading
type, specimen type, material, environment, crack
initiation site, crack detection method, and
sensitivity. For example, loading condition could be
bending, axial, reverse bending, tension, and mode II
loadings. Specimen types could be plate, bar, welded
plate, cylindrical bar, compact-type (CT) specimen,
blunt-notched specimen, and three-point bend bar,
four points bend specimen etc. The environmental
condition could be air, hydrogen water, vacuum,
helium, and oxygen.
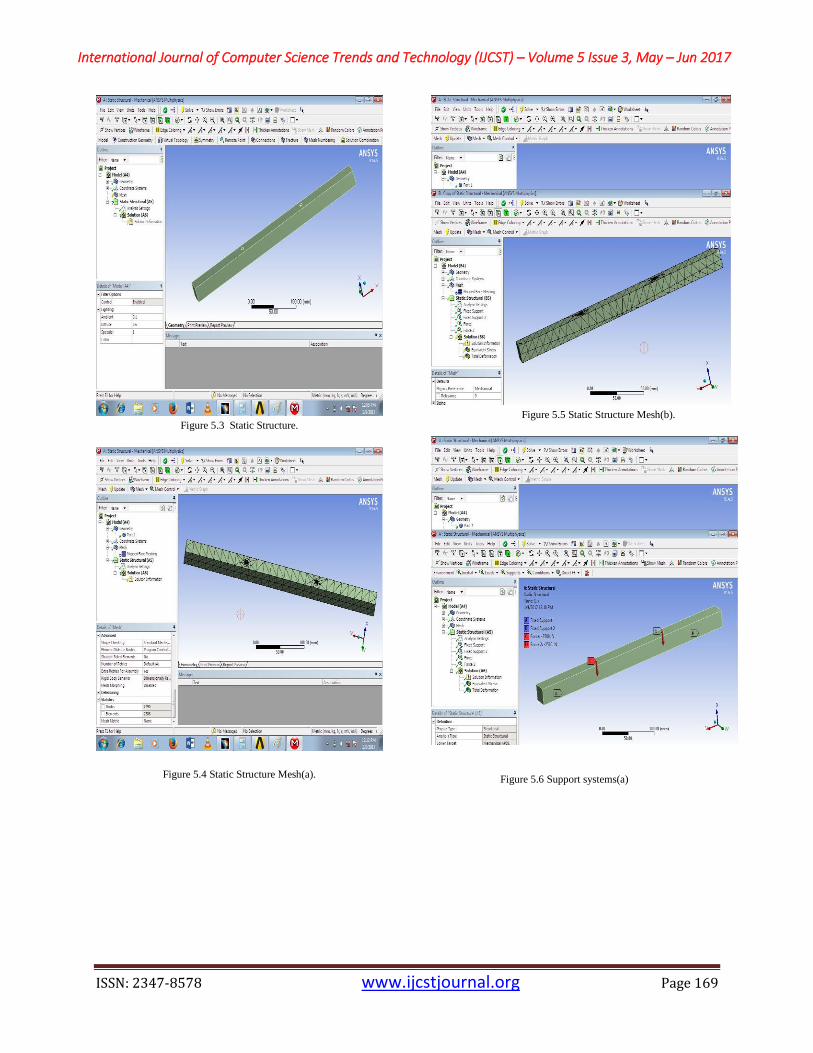
V. FINITE ELEMENT ANALYSIS
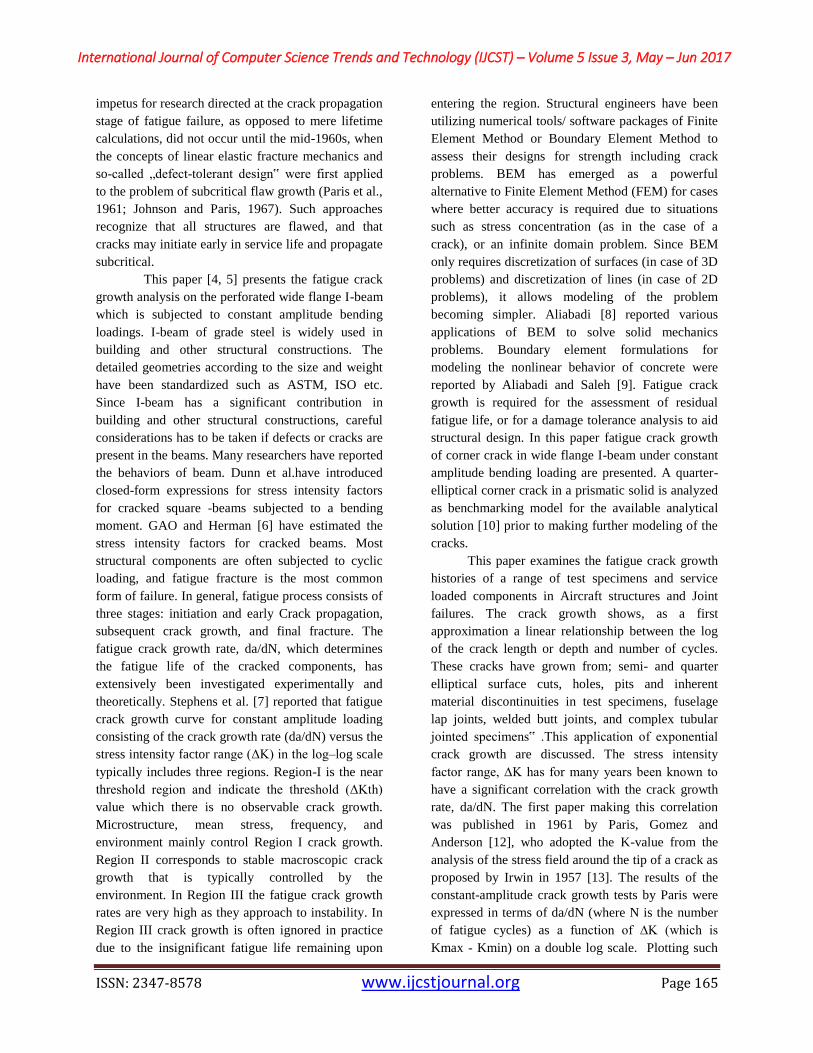
5.1 First Createing Model on ansys.
Figure 5.1 four Point.
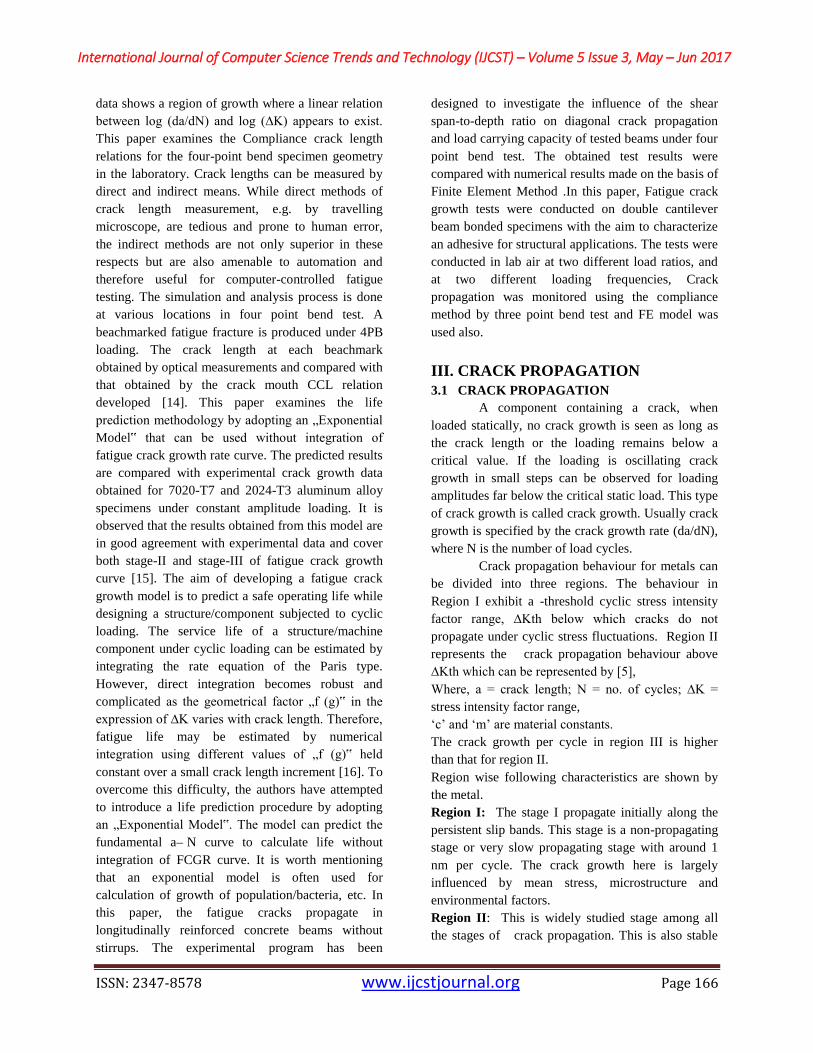
Figure 5.2 four Point with crack.
5.2 Ansys Modeling- After Creating Model in Catia
which is import in ansys. For further analysis.
International Journal of Computer Science Trends and Technology (IJCST) – Volume 5 Issue 3, May – Jun 2017
ISSN: 2347-8578 www.ijcstjournal.org Page 169
Figure 5.3 Static Structure.
Figure 5.4 Static Structure Mesh(a).
Figure 5.5 Static Structure Mesh(b).
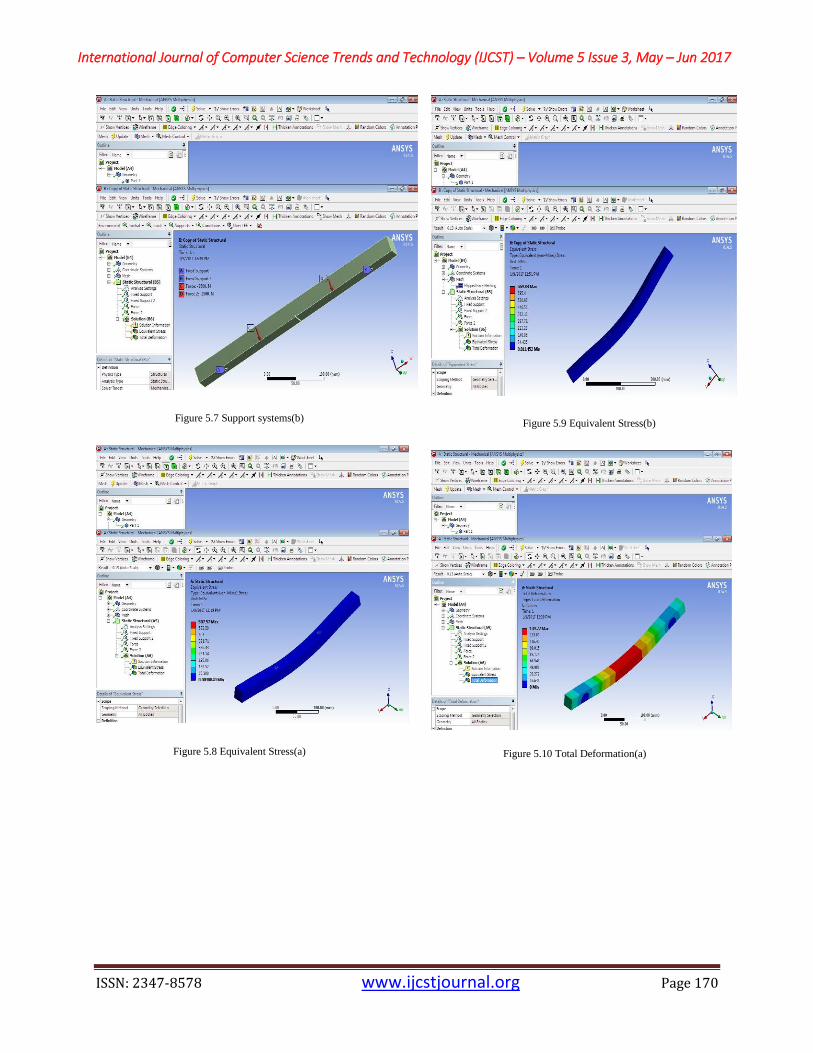
Figure 5.6 Support systems(a)
International Journal of Computer Science Trends and Technology (IJCST) – Volume 5 Issue 3, May – Jun 2017
ISSN: 2347-8578 www.ijcstjournal.org Page 170
Figure 5.7 Support systems(b)
Figure 5.8 Equivalent Stress(a)
Figure 5.9 Equivalent Stress(b)
Figure 5.10 Total Deformation(a)
International Journal of Computer Science Trends and Technology (IJCST) – Volume 5 Issue 3, May – Jun 2017
ISSN: 2347-8578 www.ijcstjournal.org Page 171
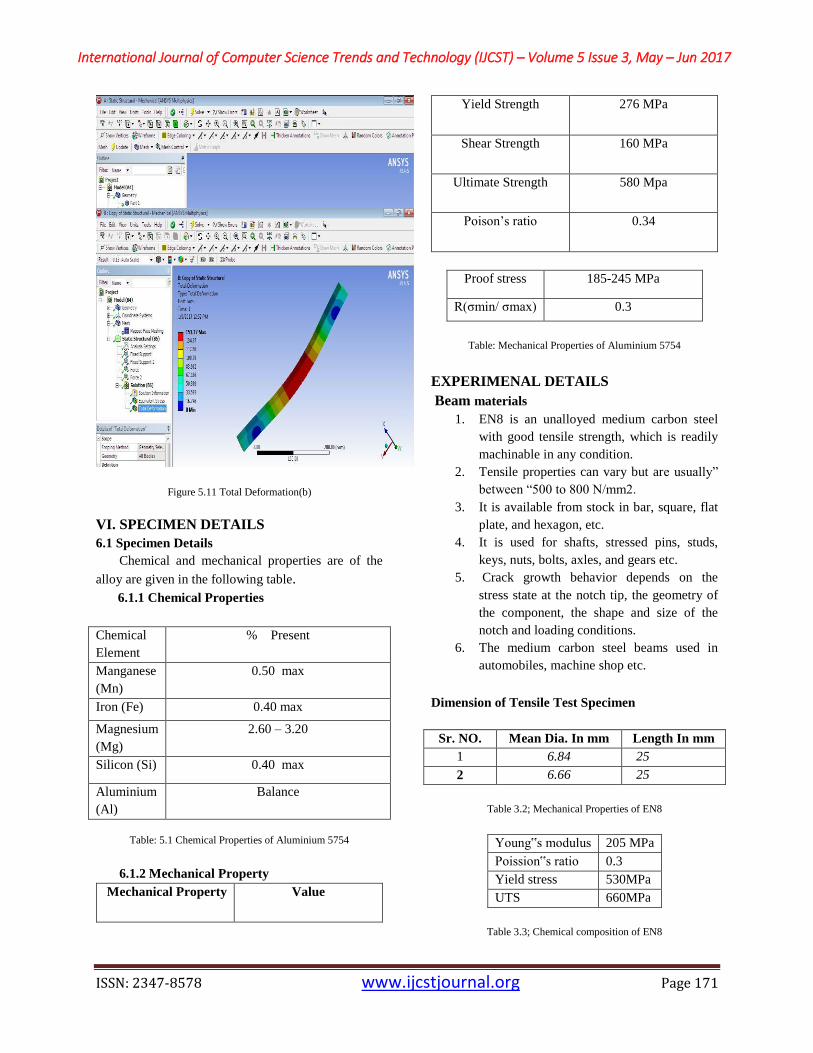
Figure 5.11 Total Deformation(b)
VI. SPECIMEN DETAILS
6.1 Specimen Details
Chemical and mechanical properties are of the
alloy are given in the following table.
6.1.1 Chemical Properties
Chemical
Element
% Present
Manganese
(Mn)
0.50 max
Iron (Fe) 0.40 max
Magnesium
(Mg)
2.60 – 3.20
Silicon (Si) 0.40 max
Aluminium
(Al)
Balance
Table: 5.1 Chemical Properties of Aluminium 5754
6.1.2 Mechanical Property
Mechanical Property Value
Yield Strength 276 MPa
Shear Strength 160 MPa
Ultimate Strength 580 Mpa
Poison’s ratio 0.34
Proof stress 185-245 MPa
R(σmin/ σmax) 0.3
Table: Mechanical Properties of Aluminium 5754
EXPERIMENAL DETAILS
Beam materials
1. EN8 is an unalloyed medium carbon steel
with good tensile strength, which is readily
machinable in any condition.
2. Tensile properties can vary but are usually”
between “500 to 800 N/mm2.
3. It is available from stock in bar, square, flat
plate, and hexagon, etc.
4. It is used for shafts, stressed pins, studs,
keys, nuts, bolts, axles, and gears etc.
5. Crack growth behavior depends on the
stress state at the notch tip, the geometry of
the component, the shape and size of the
notch and loading conditions.
6. The medium carbon steel beams used in
automobiles, machine shop etc.
Dimension of Tensile Test Specimen
Sr. NO. Mean Dia. In mm Length In mm
1 6.84 25
2 6.66 25
Table 3.2; Mechanical Properties of EN8
Young‟s modulus 205 MPa
Poission‟s ratio 0.3
Yield stress 530MPa
UTS 660MPa
Table 3.3; Chemical composition of EN8
International Journal of Computer Science Trends and Technology (IJCST) – Volume 5 Issue 3, May – Jun 2017
ISSN: 2347-8578 www.ijcstjournal.org Page 172
Elements Alloy(% by weight)
Carbon 0.40
Silicon 0.25
Manganese 0.80
Sulphur 0.05
Phosphorus 0.05
Iron Bal.
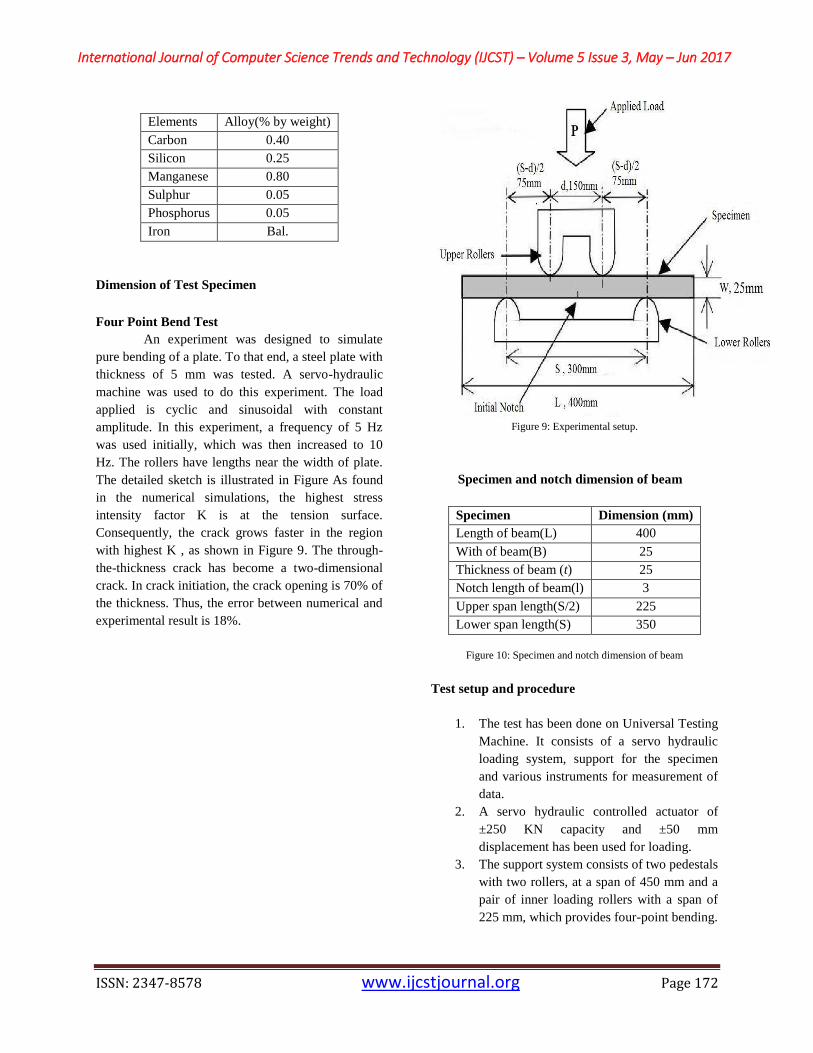
Dimension of Test Specimen
Four Point Bend Test
An experiment was designed to simulate
pure bending of a plate. To that end, a steel plate with
thickness of 5 mm was tested. A servo-hydraulic
machine was used to do this experiment. The load
applied is cyclic and sinusoidal with constant
amplitude. In this experiment, a frequency of 5 Hz
was used initially, which was then increased to 10
Hz. The rollers have lengths near the width of plate.
The detailed sketch is illustrated in Figure As found
in the numerical simulations, the highest stress
intensity factor K is at the tension surface.
Consequently, the crack grows faster in the region
with highest K , as shown in Figure 9. The through-
the-thickness crack has become a two-dimensional
crack. In crack initiation, the crack opening is 70% of
the thickness. Thus, the error between numerical and
experimental result is 18%.
Figure 9: Experimental setup.
Specimen and notch dimension of beam
Specimen Dimension (mm)
Length of beam(L) 400
With of beam(B) 25
Thickness of beam (t) 25
Notch length of beam(l) 3
Upper span length(S/2) 225
Lower span length(S) 350
Figure 10: Specimen and notch dimension of beam
Test setup and procedure
1. The test has been done on Universal Testing
Machine. It consists of a servo hydraulic
loading system, support for the specimen
and various instruments for measurement of
data.
2. A servo hydraulic controlled actuator of
±250 KN capacity and ±50 mm
displacement has been used for loading.
3. The support system consists of two pedestals
with two rollers, at a span of 450 mm and a
pair of inner loading rollers with a span of
225 mm, which provides four-point bending.
International Journal of Computer Science Trends and Technology (IJCST) – Volume 5 Issue 3, May – Jun 2017
ISSN: 2347-8578 www.ijcstjournal.org Page 173
4. The test specimen was gripped between
rollers.
5. The fig. shows the four point bend
arrangement for beam.
6. This type of loading ensures that the mid-
section of the specimen, where the notch is
located is subjected to pure bending.
7. The monitoring of crack was done using a
COD gauge with data acquisition system,
the data storage system is integrated with
machine which stores data at every point of
testing.
8. After the test, fractured surface is extracted
by Power saw and it was cut in such a way
that the crack surface is not damaged.
9. Then the extracted crack length will be
examined in scanning electron microscope
(SEM) at various loading stages.
10. The crack surface is again examined in
travelling microscope. The loading is given
in the form of sinusoidal wave.
VII. CONCLUSION
The basic aim of present work is to develop
a fatigue crack propagation model for SEN beam
without going through numerical integration
process. Plates with a pre-existing through-the-
thickness crack were studied under the action of
a remote bending moment. The dependence of
the contact region in the crack tip was
investigated, as well as the bending effect on the
stress intensity factor. Two sets of numerical
analyses were performed. One set uses different
crack geometries for a constant plate thickness,
and the second set uses a single crack geometry
for three different plate thicknesses.
FUTURE WORK
1. The proposed models may be tested for other
specimen geometries.
2. The soft computing methods may be used to
determine the specific growth rate.
REFERENCES
[1] Anthony Andrews and Peter Folger. Nuclear
Power Plant Design and Seismic Safety
Considerations, Congressional Research
Service, 2012
[2] Sharif Rahman: "Probabilistic elastic-plastic
fracture analysis of circumferentially
cracked pipes with finite-length surface
flaws" Nuclear Engineering and Design, 195
(2000) 239-260.
[3] George E Dieter. Mechanical Metallurgical.
1988
[4] Dietmar Gross and Thomas Seelig. Fracture
Mechanics with an Introduction to
Micromechanics, Springer Verlag
Publication. 2006.
[5] P. C. Paris and F. Erdogan, “A Critical
Analysis of Crack Propagation Laws,” J.
Basic. Engineering. Trans. ASME, Vol.
85, pp. 528-534, 1963.
[6] [6]http://www.apesir.com/mechanical-
engineering/ -crack-growth-rate-properties.
[7] [7]W. D. Pilkey, Peterson's Stress
Concentration Factors, 2nd Edition, John
Wiley & Sons, 1997.
[8] [8]John Barsom and Stanley Rolfe, Fracture
and Control in Structures: application of
fracture mechanics, 3rd Edition, ASTM,
1999.
[9] [9http://www.afgrow.net/applications/DTD
Handbook/sections/page2_2_0.aspx
[10] [http://www.aalco.co.uk/datasheets/Alumini
um-Alloy-5754-H22-Sheet-and
[11] http://www.azom.com/article.aspx?ArticleI
D=2806
[12] Tom Atul Dung Dung, and Ashutosh
Sharan, Prediction of Crack Propagation in
Circumferentially cracked pipe using
CASCA and FRANC2D. NIT Rourkela, B
Tech thesis, ID Code-3629, 2012.
[13] http://www.cfg.cornell.edu/software/franc2d
_casca.htm
[14] http://www.asetsdefense.org/documents/Wo
rkshops/SURF-FIN-TempeAZ-02
[15] 08/Briefings/Brown-Cd_alts_&_non-
Cr_primer.pdf S Tarafder, M Tarafder, V
Ranganath, “Compliance Crack Length
Relation For The Four Point Bend
Specimen”,Engineering Fracture Mechanics
, Vol.47, No. 6 1994.


![CRACK PROPAGATION STARTING AT HOLE’S EDGE GROWING TO …€¦ · element method, the three-dimensional virtual crack closure technique [4]. It is also possible to use fracture mechanics](https://img.pdfslide.us/doc/110x75/605ededb1a595359720e005f/crack-propagation-starting-at-holeas-edge-growing-to-element-method-the-three-dimensional.jpg)