Embed Size (px)
Citation preview

CQI Module 2:INTRODUCTION TO DATA ANALYSIS USING PLAN/DO/CHECK/ACT
On behalf of Workforce Central WDC
Presented by Lori StrumpfStrumpf Associates: Center for Strategic Change

AGENDA
WELCOME AND INTRODUCTIONS
Data Collection
Data Analysis
Data Use
Overview of Tools for Analysis
Strumpf Associates July 2017 2

PHILOSOPHY OF HIGH PERFORMANCE
WORK OGRANIZATIONS
Continuous Quality Improvement
Team Based
Empowered Staff
Customer Focused
Data Driven
Strumpf Associates July 20173

Continuous Quality Process Improvement
To use data in a continuous way
means to begin to think in a cycle
known as Plan\Do\Act\Check.
Strumpf Associates July 2017 4

5General Strategies for
Improvement Strategies for improvement that exist on a continuum from
using data for being reactive to proactive:
RESPONDING to an immediate problem;
PREVENTING the occurrence or recurrence of a problem;
UPGRADING machines, methods and techniques;
EXPERIMENTING to improve an operation or work process; and
CREATING a new opportunity.
It is likely that none of the strategies ever exist in a pure form. They must exist together, and often one will lead to another. Taken together, these strategies describe the level of activity that must be going on all the time in order to insure that improvement is continuous.
These are adapted from Continuous Improvement and Measurement for Total Quality; by Dennis C. Kinlaw, published by Pfeiffer and Company, 1992.
Strumpf Associates July 2017 5

Continuous Cycle
PLAN - plan a process improvement
DO - carry out the change or test on a small scale, searching for data that can be used in step 1 (plan)
CHECK - check the results to see what was accomplished or learned, observing and monitoring the effects of the change
ACT - adopt the change or abandon if not useful, trying the cycle again with the accumulated knowledge.
Strumpf Associates July
2017 6
Strumpf Associates July 2017 7
Successful organizations do not just collect data, they revere it. They aren’t satisfied with data until data have life and meaning for every pertinent party. They use data to create and ensure an objective, commonly held reality…. The use of data allows for organized, simplified discussions that merge to create focused priorities and productive action.

Goal of Data Analysis
Turn data into action thru P/D/C/A
Data Information Knowledge/Insights
Action
Strumpf Associates July 2017 8

TYPES OF DATA
CUSTOMER SATISFACTION DATA
PERFORMANCE DATA
STRATEGIC PLAN OUTCOMES DATA
Strumpf Associates July 2017 9

Program and Process Management
Data Driven◦ Use the principles of Continuous Quality
Improvement (CQI) for program and process management
◦ Need real time data to: Assess progress, benchmarks and targets
Make improvements on a regular basis rather than a more traditional ‘mid-course’ corrections approach using lag data elements
◦ Why focus on building this infrastructure? Key process management tool to create a common
decision making structure
10Strumpf Associates July 2017

Creating the Data Management System: Meeting the Information and Analysis Standard (#4) The team needs to create a common data
management system from the start The system needs to:◦ Produce scorecards and a dashboard◦ Produce organizational and program level information◦ Useful for both staff and leadership
Scorecards and dashboards are tools that:◦ Turn data into information that can be analyzed◦ Provide information for future direction◦ Inform Continuous Quality Improvements (CQI)
Both tools are needed because:◦ Scorecards open the quality of an operation◦ Dashboards provide calculated directions
11Strumpf Associates July 2017

Implementing A Quality Data Management System
1. Identify data elements that are useful for: ◦ On-site management in day to day operations
◦ Strategic management organization-wide
2. Reach agreement on using a common data collection system and single data management system within an organization and across partners, if appropriate
3. Agree to a systematic, structured and deliberate approach to generating scorecards and dashboard
4. Agree to use the Scorecards to:◦ Generated weekly and monthly
◦ Evaluate the data on a weekly basis
◦ Manage the program at each site/partner
◦ Provide information on key indicators and improve program quality
5. Agree to use the Dashboard to:◦ Make program wide improvements
◦ Evaluate the data on a quarterly basis
12Strumpf Associates July 2017

How Data Can be Used to Drive Decision Making and Improvements To provide at-a-glance views of Key
Performance Indicators (KPIs) thru:
◦ Weekly activity reports generated for each staff to review
◦ Monthly assessment score reports
◦ Monthly tracking of performance outcomes
◦ Quarterly Dashboard Review
13Strumpf Associates July 2017

Dashboard Sample(Designed by Strumpf Associates)
Traffic Light Key
On or Above
Target
Needs Corrective
Action to Meet
Goal
In Danger of Not
Meeting Goals
14Strumpf Associates July 2017

Dashboard Sample From a Specific Program (@LIKE)
675
283
195
153
80
0 100 200 300 400 500 600 700
1Q13 2Q13 3Q13 4Q13 Enrollment Target at End of Grant
15Strumpf Associates July 2017
This is 1 of 11 Key Performance Indicators @LIKE tracks
Dashboard: @LIKE Enrollment◦ Figures are cumulative◦ Bars represent number of individuals

Analytics
Dashboards are designed to show ‘at a glance’ summaries
Main users might include:◦ Project Director◦ Coordinator◦ Site Leaders◦ CQI Team
Used to identify◦ Key trends◦ Comparisons◦ Exceptions/Outliers
16Strumpf Associates July 2017

Analytics: Balanced Scorecard Strumpf Associates uses a management system based on the
four dimensions of the balanced scorecard devised by Kaplan and Norton:◦ Financial
◦ Customer
◦ Internal business processes
◦ Innovation and learning
Local government performance measurement pays much less attention to the determinants, or means of achieving long-term, sustained organizational improvement in internal business processes, and innovation and learning
There are few measurement processes in place to manage performance in these areas
Strategic performance management demands an approach that recognizes the importance of a focus on both results and the means of achieving these results
17Strumpf Associates July 2017

Key Elements to Scorecards and Dashboards Successful Scorecards and Dashboards
are:
◦ Simple and easy
◦ Communicate information visually
◦ Minimize distractions and noise
◦ Support strategy and operations with meaning and useful data
◦ Apply human visual perception to visual presentation of information
18@LIKE Presentation: Data Solutions Webinar July 2014 Strumpf Associates July 2017

CUSTOMER SATISFACTION
JUST IN TIME METHODS
RANDOM, LARGE SCALE SURVEYS
QUALITATIVE
◦ FOCUS GROUPS
◦ Mystery Shopper
Strumpf Associates July 2017 19

How much time do you spend on services
that are important to your customers?
Please list your major services on the grid
below. List services only once.
Do Well Don’t Do Well
Important to
Customers A B
Not important
To Customers C D
Strumpf Associates July 2017 20
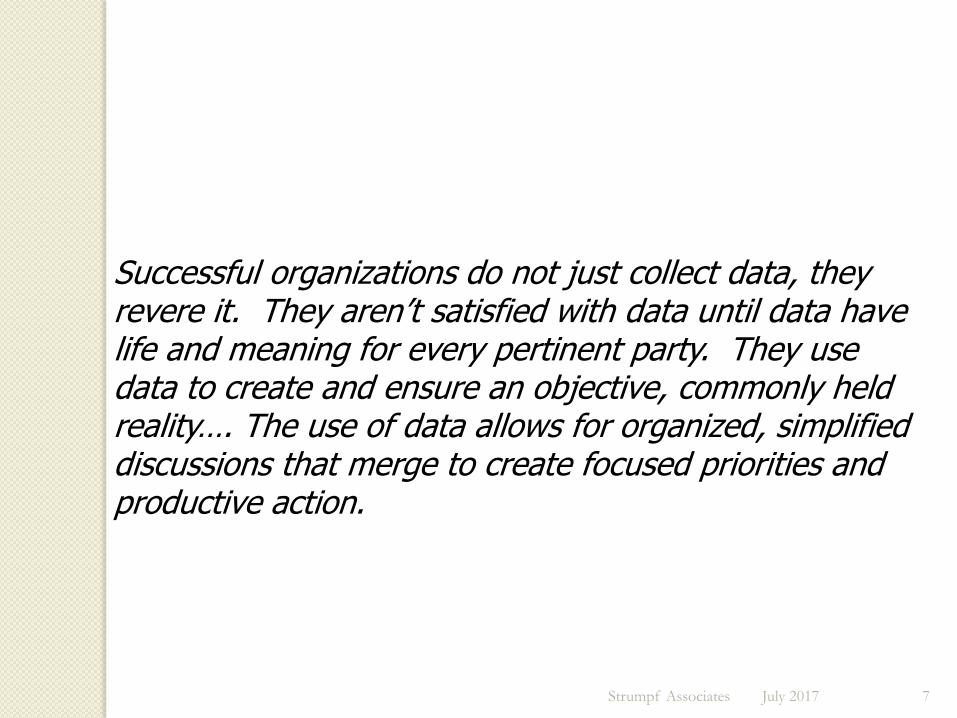
LANGUAGE OF DATA ANALYSIS
VALID◦ Data is only useful if it actually measures what it claims to be measuring and, in this respect, the
concept of validity refers to the extent to which the data we collect gives a true measurement / description of the question at hand, primarily through ‘indicators’.
RELIABLE◦ In simple terms, data can be considered broadly reliable if the same results (or broadly similar)
can be gained by different researchers or at different times asking the same questions to the same (or broadly similar) people.
QUALITATIVE◦ This form of data results from an attempt to specify the quality of the relationship between two
or more things. This usually involves the attempt to say something about the way people experience the environment and their relationships. It is also concerned with the attempt to understand the interpretations and meanings people give to things
QUANTITATIVE◦ This form of data results from an attempt, as the name suggests, to quantify the relationship
between two or more things. In this respect, an attempt is made to represent the relationship statistically / numerically.
Strumpf Associates July 2017 21

More….
REPRESENTATIVE
RANDOM
SUBJECTIVE/OBJECTIVE
Strumpf Associates July 2017 22

TOOLS FOR DATA ANALYSIS
ROOT CAUSE ANALYSIS
◦ FISHBONE
◦ FLOW CHARTS
GENERATE IDEAS
◦ PROBLEM SOLVING GRIDS
◦ AFFINITY DIAGRAMS
ANALYSIS
◦ FORCE FIELD ANALYSIS
Strumpf Associates July 2017 23

◦ HISTOGRAMS
◦ CONTROL/RUN CHARTS
◦ PAREATO CHARTS
◦ Be skeptical: Try to analyze data from at
least two angles. For example, plot the same
data multiple times using different chart types.
Data has the power to mislead, so make sure
it's telling the story accurately.
Strumpf Associates July 2017 24

Use of an Affinity Diagram as a
Brainstorming Tool Why use it? To allow a team to creatively
generate a large number of ideas and then organize and summarize natural groupings among them to understand the essence of a problem and solutions
What does it do?
◦ Encourages creativity by everyone
◦ Breaks down longstanding communication barriers
◦ Encourages non-traditional connections among ideas
Strumpf Associates July 2017 25

How to Create an Affinity Diagram
◦ Each team member writes their ideas on a
post-it note
◦ Post all of them on the wall
◦ Without talking, all team members begin
to group similar ideas together
◦ Create categories for the similar ideas
Strumpf Associates July 2017 26

Discussion
How are you currently using dashboards
or scorecards to inform opportunities for
improvement (OFIs)?
What systems are you using to make sure
you have up-to-date data to work from?
What indicators are you finding most
useful to track?
Strumpf Associates July 2017 27

About Your Trainer
Lori Strumpf
Lori Strumpf Lori Strumpf has over thirty years in the field of organizational development and change
management in human services and workforce development organizations. Lori has been in business as
Strumpf Associates: Center for Strategic Change for the last 28 years. She is a nationally known
expert in organizational management, training and design for education, training, and human resource
development systems. Prior to starting her business, Lori was the Assistant Director for the National
Association of Private Industry Councils. She was a founding member of the National Youth Employment
Coalition. She has been a Senior Associate at Brandeis University, Center for Human Resources, Heller
School for Public Policy. Prior to moving to Washington, D.C. to work on the Vice President’s Task Force for
Youth Employment, Lori was the Assistant Director to a project for court diverted delinquent youth. She
also worked at Florida State Prison, counseling prisoners.
Strumpf Associates is a small cadre of training and consulting experts, headquartered in Washington, DC.
The Principals in Strumpf Associates have decades of experience helping organizations manage change, build
systems, build leadership teams, and improve program quality and customer satisfaction. The Center
provides organizational change management consulting and executive coaching to schools, workforce
organizations, and welfare organizations.
Over the last several years, Lori has helped design and implement over 100 one-stop career development
centers. Currently, she works on behalf of the business community in partnership with local elected
officials in 8 communities around the country to assist in developing a strategic approach to workforce
development. This includes developing the governance structure of the local Workforce Development
Board.
Lori has a Masters and Specialist Degree in Educational Counseling from the University of Florida.
Strumpf Associates July 2017 28