Embed Size (px)
Citation preview

CPT BASED COMPRESSIBILITY ASSESSMENT OF SOILS
A THESIS SUBMITTED TO THE GRADUATE SCHOOL OF NATURAL AND APPLIED SCIENCES
OF MIDDLE EAST TECHNICAL UNIVERSITY
BY
FATMA ÖZKAHRİMAN
IN PARTIAL FULFILLMENT OF THE REQUIREMENTS
FOR
THE DEGREE OF MASTER OF SCIENCE
IN
CIVIL ENGINEERING
JULY 2004

Approval of the Graduate School of Natural and Applied Sciences
_____________________
Prof. Dr. Canan ÖZGEN
Director
I certify that this thesis satisfies all the requirements as a thesis for the degree of Master of Science.
_____________________
Prof. Dr. Erdal ÇOKÇA
Head of Department
This is to certify that we have read this thesis and that in our opinion it is fully adequate, in scope and quality, as a thesis for the degree of Master of Science.
Prof. Dr. Orhan EROL
Co-supervisor
Assoc. Prof. Dr. Kemal Önder ÇETİN
Supervisor
Examining Committee Members
Prof. Dr. Ufuk ERGUN (METU - CE) __________________
Assoc. Prof. Dr. Kemal Önder ÇETİN (METU - CE) __________________
Prof. Dr. Orhan EROL (METU - CE) __________________
Prof. Dr. Erdal ÇOKÇA (METU - CE) __________________
Dr. Mutlu AKDOĞAN (Geoteknik Çözüm&Proje Ltd) __________________

I hereby declare that all information in this document has been obtained and
presented in accordance with academic rules and ethical conduct. I also
declare that, as required by these rules and conduct, I have fully cited and
referenced all material and results that are not original to this work.
Name, Last Name: FATMA ÖZKAHRİMAN
Signature:

ABSTRACT
CPT BASED COMPRESSIBILITY ASSESSMENT OF SOILS
Özkahriman, Fatma
M.S., Department of Civil Engineering
Supervisor: Assoc. Prof. Dr. Kemal Önder Çetin
Co-Supervisor: Prof. Dr. Orhan Erol
July 2004, 282 pages
One of the most critical problems geotechnical engineers face with is the
determination of the amount of consolidation settlement that will occur at a site as
a result of the construction of a structure. The compressibility behavior of the soil
is an important parameter in determining the amount of consolidation settlement.
The goal of this study is to develop probabilistically based correlation between the
compressibility behavior of soil and in-situ test data. Within the scope of this
research effort, performed CPT tests and the recorded settlement case histories
where consolidation settlements at the field under various surcharge loads were
compiled from the Bursa East and West Waste Water Treatment Plant soil
investigation projects.
iv

A database was composed of the results of 45 CPT and 57 settlement plate
recordings. For the compilation of this database, a series of finite difference
software FLAC-3D analyses were carried out to calculate the change in stress
distribution under the settlement plates. A maximum likelihood framework was
used for the development of compressibility behavior of soils.
As a result of careful processing of available data, the cone tip resistance
(qc), soil behavior type index (Ic) were selected as two important parameters
effecting the value of the one-dimensional constraint modulus, M. The regression
analysis which uses the settlement values recorded at the site and those computed
using the change in the stress distribution, the thickness of the sublayers and the
proposed one-dimensional constraint modulus were carried out to calculate the
values of these model parameters. Two correlations based on the cone tip
resistance and soil behavior type index were developed for the computation of the
one-dimensional constraint modulus, M.
Keywords: Compressibility of soils, one-dimensional constrained
modulus, cone penetration test, maximum likelihood methodology, limit state
models.
v

ÖZ
KONİK PENETRASYON DENEYİ (CPT) VERİLERİNİ
KULLANARAK ZEMİNİN SIKIŞABİLİRLİĞİNİN
BELİRLENMESİ
Özkahriman, Fatma
Yüksek Lisans, İnşaat Mühendisliği Bölümü
Tez Yöneticisi: Doç. Dr. Kemal Önder Çetin
Yardımcı Tez Yöneticisi: Prof. Dr. Orhan Erol
Temmuz 2004, 282 sayfa
İnşaat ve sonrasında zeminlerde oluşabilecek konsolidasyon oturmalarının
belirlenmesi geoteknik mühendislerinin karşılaştığı en önemli problemlerden
birisidir. Konsolidasyon oturmalarını etkileyen en önemli parametrelerinden birisi
zeminlerin sıkışabilirlik karakteridir. Bu çalışmanın amacı zeminlerin sıkışabilirlik
özelliği ile saha deneyleri arasında istatistiksel bağıntılar elde etmektir. Bu
araştırma kapsamında Bursa Doğu ve Batı Atıksu Arıtma Tesisleri zemin etüdleri
dahilinde gerçekleştirilen Konik Penetrasyon deneyleri ve farklı yüklemeler
altında sahada oluşan konsolidasyon oturmaları kullanılmıştır.
vi

Bursa Doğu ve Batı Atıksu Arıtma Tesisleri zemin etüdleri kapsamında
yapılan 45 Konik Penetrasyon deneyi ve 57 oturma plakası kaydı toplanarak bir
veritabanı oluşturulmuştur. Sonlu Farklar Metodu temelli FLAC 3D programı
kullanılarak hesaplanan oturma plakaları altındaki basınç dağılımı bu veritabanına
eklenmiştir. Bu veriler kullanılarak zeminlerin sıkışabilirliği maksimum olabilirlik
yöntemi kullanılarak belirlenmiştir.
Eldeki verilerin değerlendirilmesi sonucu, ödometrik deformasyon
modülünü (M) etkileyen en önemli faktörlerin uç direnci (qc), ve zemin tipi indeksi
(Ic) olduğuna karar verilmiştir. Ödometrik deformasyon modül, tabaka kalınlığı ve
plaka altındaki basınç dağılımı kullanılarak hesaplanan oturma değerleri, gerçek
ölçümlerle karşılaştırılarak model değişkenleri bulunmuştur. CPT uç direnci ve
zemin tipi indeksine bağlı olasılıksal ödometrik deformasyon modülü bağıntıları
geliştirilmiştir.
Anahtar Kelimeler: Zeminlerin sıkışabilirliği, Ödometrik deformasyon
modül, konik penetrasyon deneyi, limit durum foksiyonu, maksimum olabilirlik.
vii

To My Family
viii

ACKNOWLEDGEMENTS
I wish to express my appreciation to my supervisor, Assoc. Prof. Dr. Kemal
Önder Çetin for his professional guidance, training and support throughout the
entire process of research and the preparation of the thesis. His advise, motivation
and courage throughout my graduate studies affected my academic path
significantly.
I owe special thanks to my co-supervisor Prof. Dr. A. Orhan Erol for his
invaluable suggestions, encouragement and support throughout this study.
I would like to express my thanks to geological engineer Taylan Demir and
civil engineer A. Feride Armangil Gökalp for their technical advices and
contributions to this study.
The contribution of Berna Unutmaz and Nihat Sinan Işık to this study is
unbearable. I want to extend my thanks to these valuable friends.
I would like to express my thanks to my dear friends Zeynep Yılmaz and
Emrah Erduran for their support and valuable contributions. Thanks and
acknowledgements are given to all my friends for their friendship, fellowship and
encouraging support.
Special and deepest thanks go to my family for their endless love, support,
patience and encouragement throughout my whole life
ix

TABLE OF CONTENTS
ABSTRACT ........................................................................................................... iv
ÖZ ........................................................................................................................... vi
DEDICATION.....................................................................................................viii
ACKNOWLEDGEMENTS.................................................................................. ix
TABLE OF CONTENTS....................................................................................... x
LIST OF FIGURES ............................................................................................xiii
LIST OF TABLES ............................................................................................... xv
LIST OF SYMBOLS........................................................................................... xvi
CHAPTER
1. INTRODUCTION............................................................................................ 1
1.1 General ............................................................................................. 1
1.2 Research Statement .......................................................................... 1
1.3 Problem Significance and Limitations of Previous Studies ............. 2
1.4 Scope of The Thesis ......................................................................... 3
2. AN OVERVIEW OF AVAILABLE METHODS OF SOIL
COMPRESSIBILITY BASED ON CPT DATA ................................................. 4
2.1 Introduction ...................................................................................... 4
2.2 Cone Penetration Test (CPT) ........................................................... 4
2.2.1 Test Procedure............................................................................ 5
2.2.2 Advantages and Limitations of CPT .......................................... 7
2.2.3 CPT Corrections......................................................................... 8
2.2.4 Soil Classification Based on CPT .............................................. 9
2.2.5 Illustrative Example ................................................................. 14
x
2.3 CPT Based Compressibility Estimations ....................................... 16
2.3.1 Fundamentals of One-dimensional Consolidation ................... 16
2.3.2 General Compressibility Characteristics of Soil ...................... 17
2.3.3 Calculation of Consolidation Settlement.................................. 19
2.3.4 Correlations between CPT Data and Compressibility of Soils 21
3. CASE HISTORY PROCESSING................................................................. 27
3.1 Introduction .................................................................................... 27
3.2 Estimation of Elastic Stress Distributions...................................... 29
3.2.1 Boussinesq’s Method ............................................................... 29
3.2.2 Flac 3D Analyses ..................................................................... 31
3.3 Determination of Characteristics of Soil Sublayers ....................... 39
3.4 Prediction of Soil Settlements by Graphical and Semi-Empirical
Methods.......................................................................................... 42
3.4.1 Asaoka’s Method (Asaoka, 1978)............................................ 43
3.4.2 Horn’s Method (Horn, 1983) ................................................... 45
3.5 Database Summary......................................................................... 48
4. DEVELOPMENT OF PROBABILISTIC CPT BASED
COMPRESSIBILITY ASSESSMENT OF SOILS ........................................... 52
4.1 Introduction .................................................................................... 52
4.2 Limit State Models for CPT Based Soil Compressibility .............. 52
4.3 Formulation of Likelihood Function for CPT-Based
Compressibility Assessment of Soil............................................... 55
4.4 Proposed New Correlations............................................................ 57
4.4.1 Comparison of Settlement Values Obtained Using Logarithmic
Correlation with Field Measurements ...................................... 57
4.4.2 Comparison of Settlement Values Obtained Using Exponential
Correlation with Field Measurements ...................................... 59
4.5 Validation of Proposed Correlations .............................................. 61
4.6 Summary of Developed Correlations............................................. 64
xi
5. SUMMARY AND CONCLUSION............................................................... 65
5.1 Summary ........................................................................................ 65
5.2 Conclusion and Observations......................................................... 66
5.3 Recommendations .......................................................................... 67
REFERENCES..................................................................................................... 69
APPENDICES
A. CPT AND SETTLEMENT PLATE LAYOUTS ................................... 73
B. CPT PROFILES ....................................................................................... 78
C. RESULTS OF FLAC 3D ANALYSES ................................................. 123
D. HORN’S AND ASAOKA’S METHODS RESULTS .......................... 128
E. DATABASE SUMMARY ...................................................................... 213
F. FLAC 3D RESULTS AND CPT PROFILES MATCHES ............ CD At
the back cover
xii

LIST OF FIGURES
Figure 2-1 - Schematic view of a cone penetrometer probe .................................... 5
Figure 2-2 - Pore water pressure effects on measured parameters........................... 9
Figure 2-3 - CPT-based soil classification chart (Robertson, 1990) ...................... 11
Figure 2-4 - Flowchart illustrating the application of the process of CPT-based soil
classification method (Robertson, 1990) ........................................... 13
Figure 2-5 - Output of developed software for CPT-based soil classification chart
(Robertson, 1990) .............................................................................. 15
Figure 2-6 - Void ratio-effective stress relationships (Craig, 1987) ...................... 17
Figure 2-7 - The variation of initial effective stress and the coefficient of volume
compressibility with depth (Craig, 1987) .......................................... 19
Figure 2-8 - General relationships between constrained modulus and net cone
resistance (Kulhawy and Mayne, 1990) ............................................ 23
Figure 2-9 - Constrained modulus Mi for Glava clay............................................. 24
Figure 2-10 – Variation of α with cone tip resistance............................................ 26
Figure 3-1 - The layout of selected representative area in the Bursa Eastern Waste
Water Treatment Plant site ................................................................ 29
Figure 3-2 - Distribution of the change in vertical stress with depth at SP50
obtained by Boussinesq’s method and Flac 3D analysis ................... 35
Figure 3-3 - Plan View of the Loading for Representative Site............................. 36
Figure 3-4 - Stress contours obtained from FLAC 3D for representative site ....... 38
Figure 3-5 - Distribution of change in vertical stress due to the applied load ....... 39
Figure 3-6 - Representative Parameters for CPT 12 and SP 54 ............................. 41
Figure 3-7 - The variation of consolidation settlement with time.......................... 42
Figure 3-8 - Graphical presentation of Asaoka’s method (Asaoka, 1978)............. 44
xiii
Figure 3-9 - Estimation of final settlement at SP54 due to the surcharge by using
Asaoka’s method ............................................................................... 44
Figure 3-10 - Settlement vs. Time Diagram (Horn, 1983)..................................... 46
Figure 3-11 - Time vs. Velocity Relationship (Horn, 1983).................................. 46
Figure 3-12 - Time vs. t/s Relationship (Horn, 1983)............................................ 47
Figure 3-13 - Estimation of final settlement at SP54 due to the surcharge by using
Horn’s method.................................................................................. 48
Figure 4-1 - Distribution of observed settlement and predicted settlement based on
the logarithmic correlation................................................................. 58
Figure 4-2 - Variation of the ratio of predicted settlement to the observed
settlement........................................................................................... 58
Figure 4-3 - Distribution of observed settlement and predicted settlement based on
the exponential correlation ................................................................ 59
Figure 4-4 - Variation of the ratio of predicted settlement to the observed
settlement........................................................................................... 60
Figure 4-5 - Geometry of surcharge area of the selected validation cases............. 61
Figure 4-6 -Variation of the ratio of predicted settlement by exponential model to
the observed settlement...................................................................... 63
Figure 4-7 - Distribution of observed and predicted settlement based on the
exponential correlation ...................................................................... 63
xiv

LIST OF TABLES
Table 2-1 - Boundaries of soil behavior type (Robertson, 1990)........................... 14
Table 2-2 - Estimations of coefficient, αm to find the constrained modulus, M, for
clays (Sanglerat, 1972)........................................................................ 22
Table 2-3 - Estimations of coefficient, αn to find the constrained modulus, M, for
clays Mahesh et al. (1995) .................................................................. 25
Table 3-1 - The Distribution of Change in Vertical Stress with depth at the
Position of Settlement Plate ................................................................ 37
Table 3-2 - Match between related CPT and Settlement Plate for chosen
representative site................................................................................ 40
Table 3-3 - Review of final settlement prediction by using two different methods
for the representative site .................................................................... 48
Table 3-4 - Database Summary of SP54 with the related CPT 12 results in the
selected representative area................................................................. 50
Table 4-1 - Maximum likelihood estimates of logarithmic model parameters for
CPT-based compressibility assessment of soil ................................... 56
Table 4-2 - Maximum likelihood estimates of exponential model parameters for
CPT-based compressibility assessment of soil ................................... 57
Table 4-3 - Partial descriptive of developed two methods for observed and
predicted values of settlement............................................................. 60
Table 4-4 - Comparison of the observed and predicted settlement values............. 62
Table 4-5 - Estimations of coefficient mα for different soil types according to the
proposed exponential correlation ........................................................ 64
Table 4-6 - Estimations of coefficient mα for different soil types according to the
proposed logarithmic correlation ........................................................ 64
Table 5-1 - Estimations of coefficient mα for different soil types according to the
proposed exponential correlation ........................................................ 67
xv

LIST OF SYMBOLS
a : Cone area ratio
An : Cross-sectional area of the load cell
Ac : Projected area of the cone
B : Width of rectangular loading area
BCPT : Cone penetration test at Bursa west waste water treatment plant
BSP : Settlement plate at Bursa west waste water treatment plant
Cc : Compression index
CQ : Normalization factor for cone tip resistance
CPT : Cone penetration test
Eu : Undrained Young’s modulus
e : Void ratio of soils
F : Normalized friction ratio
fs : Friction sleeve resistance
H : Thickness of sublayers in soil profile
Ic : Soil behavior type index
Iσ : Influence factor
L : Length of rectangular loading area
mv : Coefficient of volume compressibility
M : One-dimensional constrained modulus
Pa, Pa2 : Reference pressures
S : Total settlement
Sf : The ultimate settlement
So : Observed settlement at the site
Sp : Predicted settlement
xvi

SP : Settlement plate
t : time
u2 : Pore pressure acting on the cone
v : Settlement speed
Q : Normalized CPT penetration resistance
qt : Corrected total cone resistance
qc : Cone tip resistance
qc1N : Cone tip resistance corrected for overburden stress
0vσ : Total overburden stress
0vσ ′ : Effective overburden stress
vσ ′ : Effective vertical stress
σ∆ : Change in vertical stress
mα , nα , iα : Coefficient of constrained modulus
vε : Vertical strain
ε : Model correction term
ϕ : Standard normal probability density function
θ : Model parameters
εσ : Standard deviation
xvii

CHAPTER 1
INTRODUCTION
1.1 GENERAL
Cone penetration testing is a versatile tool for the purpose of soil
investigation. CPT is widely used due to its simplicity, good repeatability and
continuous sounding capability. The results of cone penetration test can, in
principle, be used to evaluate the nature and sequence of soil, groundwater
conditions, physical and mechanical properties of the soil. Moreover, it provides
data for geotechnical design.
In the past decades, many correlations were proposed by several
researchers to predict the compressibility behavior of soils based on the CPT
results. The essential parameter representing one-dimensional consolidation
conditions is one-dimensional constrained modulus, M. Sanglerat (1972), Jones
and Rust (1995), Senneset et al. (1982, 1989) proposed methods of estimating M
based on CPT data. Similarly, Kulhawy and Mayne (1990) suggested a model for
constrained modulus for clays. Lunne and Christophersen (1983) proposed a
method to estimate M for overconsolidated and normally consolidated sands.
These correlations will be discussed in detail in Section 2.2.
1.2 RESEARCH STATEMENT
The main purpose of this study is to develop probabilistically based
correlations to predict the compressibility behavior of soils by CPT data. The
parameters that define the compressibility of soils are crucial for evaluating the
1

settlement of soils. In practice, the most frequently utilized parameter for soils is
the one dimensional constrained modulus, M. In this study a new correlation will
be proposed to assess the compressibility of soils calibrated by settlement case
histories where consolidation settlements at the field under various surcharge loads
were recorded along with CPT-based soil profile data.
For this purpose, a database of 45 CPT sounding data consisting of cone tip
resistance (qc), friction sleeve resistance (fs) along with 57 settlement plate records
was compiled.
1.3 PROBLEM SIGNIFICANCE AND LIMITATIONS OF PREVIOUS STUDIES
Deformation characteristics or compressibility behavior of soils can be
defined in terms of soil modulus. In practice, the one dimensional constrained
modulus, M, undrained Young’s modulus in compression loading, Eu and
compression index, Cc are the most commonly used parameters. Most of the
estimations of these deformability parameters are based on the correlation between
in-situ test data and/or laboratory test results. Several numbers of available
methods in the literature do not cover the real situations observed in the field since
they were mainly derived based on the laboratory tests such as oedometer and
triaxial tests results. However, the laboratory tests may not yield reliable results
due to some reasons including the possible disturbances introduced during
sampling.
To eliminate limitations of available methods for the assessment of soil
compressibility based on the CPT data; settlement case histories where
consolidation settlements at the field under different surcharge load were used in
this study. Recorded settlement values of soils reveal the real compressibility
behavior of soils under various loading cases. These proposed correlations
calibrated by field performance data and based on easy to perform and repeatable
CPT, are believed to be a convenient and reliable way to estimate compressibility
characteristics of soils.
2

1.4 SCOPE OF THE THESIS
Following this introduction chapter, Chapter 2 presents the general
description of CPT, test procedure, interpretation of cone penetration data and also
limitations and advantages of this in-situ test. An overview of available CPT based
compressibility estimations and the concepts of compressibility of cohesive and
cohesionless soils are also discussed in Chapter 2.
Chapter 3 presents the works on this study that had been carried out for the
development of the new correlations based on the CPT data. Discussed process
starts with CPT data processing to develop soil profiles for the purpose of
calculating soil settlements under various surcharges.
Chapter 4 discusses the development of probabilistic models for CPT based
compressibility assessment of soils. Limit state models as well as maximum
likelihood method are discussed. As a conclusion, recommended new correlations
are also presented in Chapter 4.
Finally, Chapter 5 presents a summary of research, main conclusions, and
recommendations for future studies.
3

CHAPTER 2
AN OVERVIEW OF AVAILABLE METHODS OF SOIL
COMPRESSIBILITY BASED ON CPT DATA
2.1 INTRODUCTION
Attempts to develop a correlation for estimating compressibility behavior
of soils based on the CPT data require clear understanding of compressibility
characteristics of soils as well as cone penetration testing. The general information
about cone penetration test is given in Section 2.2 of this chapter. Especially, test
procedure, CPT corrections, advantages and limitations of this in-situ test and CPT
based soil classification method are discussed in detail. The second part of this
chapter gives the general idea of the consolidation theory and the available
methods for soil compressibility predictions based on the CPT data.
2.2 CONE PENETRATION TEST (CPT)
Cone penetration test is a widely used in-situ test for the purpose of soil
investigation. In the cone penetration test (CPT), a cone penetrometer attached to
the ends of rods is pushed vertically into the ground at a constant rate of
penetration (2 cm/sec) and the resistance of the soil at the tip and sleeve of the
penetrometer is recorded. The cone penetrometer consists of the cone, friction
sleeve and the sensors and the data acquisition test system, as well as the
connections to the push rods. CPT is carried out by advancing a 60° apex angle
cone with a diameter of 35.7 mm (10 cm2 cross-sectional area) into the soil. Figure
2.1 presents the sections of cone and detailed terminology.
4

During the penetration, resistance to the penetration of the cone and the
surface of the sleeve are recorded. The values are represented as cone tip
resistance (qc) and friction sleeve resistance (fs). Additionally, pore water pressure,
verticality and shear wave velocity can be measured by attaching additional
sensors to the CPT system. The number of the readings taken must be adequate to
obtain data to give a detailed picture of the variation of the measured parameters
with the penetration depth.
Figure 2-1 - Schematic view of a cone penetrometer probe
The results obtained from cone penetration test are used to evaluate the
nature and sequence of soil, groundwater conditions, physical and mechanical
properties of the soil. These results are used to estimate valuable parameters for
geotechnical design.
2.2.1 Test procedure
In order to obtain reliable and robust data from field tests with the electric
penetrometers, well-trained operators, good technical back-up facilities for
5

calibration and maintenance of the equipment used are required. During the cone
penetration tests, there are certain details that must be taken care of. Criteria that
must be checked during the test are given in detail following sections.
2.2.1.1 Pre-drilling, on Land Testing
In order to avoid overloading or disturbing the cone penetrometer, pre-
drilling gain importance for performing test in fills or hard soils. Fills with coarser
particles such as stones are always predrilled.
In tests in soft soils, this procedure should be done through the dry crust.
The hole is filled with water to at least water table level to guarantee the
maintenance of piezo element’s saturation.
In certain cases, the pre-drilling can be replaced with pre-forming hole with
a solid dummy cone whose diameter is slightly larger than cone penetrometer
(about 45-50 mm) through the stiffer layers (Lunne et al., 1997).
2.2.1.2 Verticality
Verticality of thrust and straightness of pushing rods are the two aspects
that should be checked during penetration. The thrust machine shall be set up as to
obtain vertical thrust direction. Minimum 2˚ exceedence can be acceptable as the
deviation of the initial thrust direction from the vertical. The other point checked is
the coincidence of the axis of push rods with the direction of thrust.
Once the penetrometer deflects, it continues along a path with consistent
radius of curvature. 1˚ of deflection per meter length of standard push rods does
not cause noticeable damage. On the other hand, a sudden deflection in excess of
5˚ over one meter cause damage to the penetrometer end rods as a consequence of
bending. Slope sensor is attached to the electric cone system, hence deflection can
be monitored. When a sudden deflection occurs, penetration should be stopped to
avoid the probable damage (Lunne et al., 1997).
6

2.2.1.3 Rate of penetration
The other point considered during cone penetration tests is the rate of
penetration due to its significant effect on the measurements of pore pressure. In
cone penetration tests without pore pressure measurements, the rate of penetration
may be within 20 mm/s ± 25%. In the tests with pore pressure measurement, the
rate of penetration is narrowed to 20 mm/s ± 10%. Excess pore pressure will start
to dissipate, if any pause occurs during the penetration. To avoid the effect of
dissipation on the CPT measurements, soundings are performed as continuous as
possible (Lunne et al., 1997).
2.2.1.4 Frequency of readings
Continuous analogue data is obtained by electric cone penetrometer that
converts the data to digital format in the selected interval. The chosen interval
depends on the project demand. Collecting data at close intervals is preferable if
information of thin layers is required. In general the depth interval readings will be
in the range of 10-50 mm (Lunne et al., 1997).
2.2.2 Advantages and Limitations of CPT
The CPT has several advantages over other exploration methods, thus, the
popularity of it continues to increase. The cone penetration test (CPT) is a widely
used sounding procedure that has valuable outcomes to classify the materials in a
soil profile and to estimate their engineering properties. Besides these main
advantages, CPT test is one of the most rapid and economical exploration forms of
in-situ testing. The test can be performed in a wide range of soils, although very
hard soils or gravel can not be penetrated with current technology. Significant
advantage of electric cone penetration is that, it provides continuous or near
continuous data.
The CPT has also a number of disadvantages. The significant limitation is
that no sample is obtained during the testing process. The penetrometer can not
7

penetrate very dense soils or soils contain boulder or cobbles because of the
excessive force required to penetrate in these materials.
2.2.3 CPT corrections
Various factors may influence the results of cone penetration test results;
hence the outcomes should be corrected to obtain more accurate ones. The pore
pressure around the penetrating cone is an important factor that must be taken into
consideration. Cone resistance and sleeve friction measurements are influenced by
the pore pressure around the penetrating cone.
Other factors that influence the measurements are the temperature changes,
inclination, calibration errors and wear of the cone. In this study only pore pressure
effect is considered.
Because of the inner geometry of cone penetrometer, the ambient pore
water pressure will act on the shoulder area behind the cone and on the ends of the
friction sleeve. This phenomenon occurred during the cone penetration tests are
defined as unequal area effect (Campanella et al. (1982)). This concept has
influence on the measured total stresses determined from cone and friction sleeve.
The corrected total cone resistance, qt, is given in equation 2.1.
)1(2 auqq ct −+= (2.1)
where u2 is the pore pressure acting behind the cone, qc is the measured tip
resistance and a is the cone area ratio. Cone area ratio, a, can be found by equation
2.2.
c
nA
Aa = (2.2)
8

where An is the cross-sectional area of the load cell or shaft and Ac is the
projected area of cone, as shown in Figure 2.2.
The pore water pressure gains more importance in soft-fine grained
saturated soils because of the fact that the ratio of the pore pressure to the cone
resistance can be higher in these soils.
Figure 2-2 - Pore water pressure effects on measured parameters
2.2.4 Soil classification based on CPT
Classifying soils based on CPT data require the use of correlations due to
the lack of direct soil sampling. In this section, the procedure that is used to
describe and classify soils is presented.
In recent years, numerous correlations were developed to estimate the soil
type from CPT soundings. Olsen and Malone (1988), Olsen and Koester (1995),
Robertson and Campanella (1988) proposed methods that are amongst widely used
correlations for the soil type classifications.
9

In this study, soil behavior type chart developed by Robertson and Wride
(1997) was used to estimate the grain size characteristics of soils directly from
CPT results. Robertson (1990) suggested that the chart shown in Figure 2.3 is
global in nature and should be used as a guide to define the soil behavior type
based on CPT.
The soil behavior type classification chart includes 9 different zones. The
boundaries between soil behavior type zones 2 to 7 can be approximated as
concentric circles (Jefferies and Davies, 1993). The radius of each circle can be
defined as a soil behavior type index, Ic. Soil behavior type index, Ic (Robertson
and Wride, 1997) based on the CPT chart can be found out from below given
equation.
[ ] 5.022 )22.1(log)log47.3( ++−= FQI c (2.3)
where n
Vo
a
a
Voc PP
qQ ⎥
⎦
⎤⎢⎣
⎡′
×⎥⎦
⎤⎢⎣
⎡ −=
σσ
2
)( (2.4)
and
%100)( 0
×⎥⎦
⎤⎢⎣
⎡−
=Vc
S
qf
Fσ
(2.5)
Q and F are the normalized CPT penetration resistance and normalized
friction ratio, respectively. Q is a dimensionless parameter and F is in percent. qc
and fs are the cone tip resistance and friction sleeve resistance, respectively and are
recorded during penetration. 0vσ and 0vσ ′ are the total and effective overburden
stresses and Pa2 and Pa are the reference pressures that have the same units as qc ,
0vσ and 0vσ ′ respectively.
10

Figure 2-3 - CPT-based soil classification chart (Robertson, 1990)
The soil behavior type chart developed by Robertson (1990) is given in
Figure 2.3. This figure uses a normalized cone penetration resistance (Q)
calculated by a simple linear stress exponent of n = 1.0. A value in the range of 0.5
to 1.0 for the linear stress exponent was suggested depending on the grain
characteristics of soils for normalization purposes (Olsen, 1994; Olsen and
Mitchell, 1995). Suggested exponent value of 0.5 is suitable for clean sands and
the value of 1 is appropriate for clayey soil types. For silts and sandy silts, selected
stress exponent value can be adopted as 0.75.
The procedure recommended by Robertson and Wride (1997) is rather
complex and iterative and requires the calculation of the soil behavior type index,
11

Ic. The proposed procedure is initiated by calculating the dimensionless
normalized tip resistance and soil behavior type index by assuming the stress
exponent equal to 1. If the calculated soil behavior type index is larger than 2.6,
the soil can be classified as clay soil type. On the other hand, if the evaluated value
of Ic is smaller than 2.6, then value of stress exponent value should be adopted as
0.5 because of the fact that soil is most likely granular in nature. Hence, the
normalized cone tip resistance Q, essentially qC1N, is calculated by using Equation
(2.6). Soil type index, Ic is recalculated by using an exponent n of 0.5. If the
second calculated Ic value still remains smaller than 2.6, the soil can be classified
as nonplastic and granular soils. On the other hand, if calculated soil type index
value changes depending on the selected stress exponent value n, all calculations
are repeated by new n value of 0.75. At this instant, truly normalized (i,e.
dimensionless) cone penetration resistance corrected for overburden stress, qc1N are
calculated. Ic value is calculated using Equation (2.3) according to the intermediate
exponent n value and qc1N. This Ic value is used to determine the soil classification.
All these procedures are summarized in Figure 2.4.
Qa
cNC C
Pq
q ×=1 (2.6)
n
V
aQ
PC )(
0σ ′= (2.7)
In equation 2.6 and 2.7 qc1N is the dimensionless cone penetration
resistance corrected for overburden stress and CQ is the normalization factor for
cone tip resistance.
12

In Situ Testing
qc (tip resistance)
T
In-situ s
Q = normalized penetration resistance
vo
a
a
voc Px
Pq
Q'
2σ
σ−=
([1 log47.3 −= QI c
If Ic1≤2.6 5.0
1 '2
⎟⎟⎠
⎞⎜⎜⎝
⎛=
vo
a
a
cnc
Px
Pq
qσ
( )[ 2
12 (loglog47.3 −−= FqI ncc
If Ic2>2.6 75.0
1 '2
⎟⎟⎠
⎞⎜⎜⎝
⎛=
vo
a
a
cnc
Px
Pq
qσ
( )[ 21 (loglog47.3 +−−= FqI ncc
Figure 2-4 - Flowchart illustratin
based soil classificatio
CP
fs (sleeve resistance)
tresses (σvo, σ’vo)
F = normalized friction ratio
100xq
fF
voc
s
σ−= (%)
) ( ) ] 5.022 22.1log +− F
If Ic1>2.6 Ic=Ic1
] 5.02)22.1+
If Ic2≤2.6 Ic=Ic2
] 5.02)22.1
g the application of the process of CPT-
n method (Robertson, 1990)
13

As mentioned before, the boundaries between soil behavior type zones 2 to
7 can be approximated as concentric circles (Jefferies and Davies, 1993). The
radius of each circle can be defined as a soil behavior type index, Ic. Hence, the
soil behavior type index does not apply to zones 1, 8 and 9. The variation of soil
behavior type index, Ic with soil behavior type zones are given in Table 2.1.
Table 2-1 - Boundaries of soil behavior type (Robertson, 1990)
Soil Behavior Type Index, CI Zone Soil Behavior Type
CI <1.31 7 Gravelly sand to dense sand 1.31< <2.05 CI 6 Sands: clean sand to silty sand 2.05< <2.60 CI 5 Sand Mixtures: silty sand to sandy silt 2.60< <2.95 CI 4 Silt Mixtures: clayey silt to silty clay 2.95< <3.60 CI 3 Clays: silty clay to clay
3.60< CI 2 Organic soils: peats
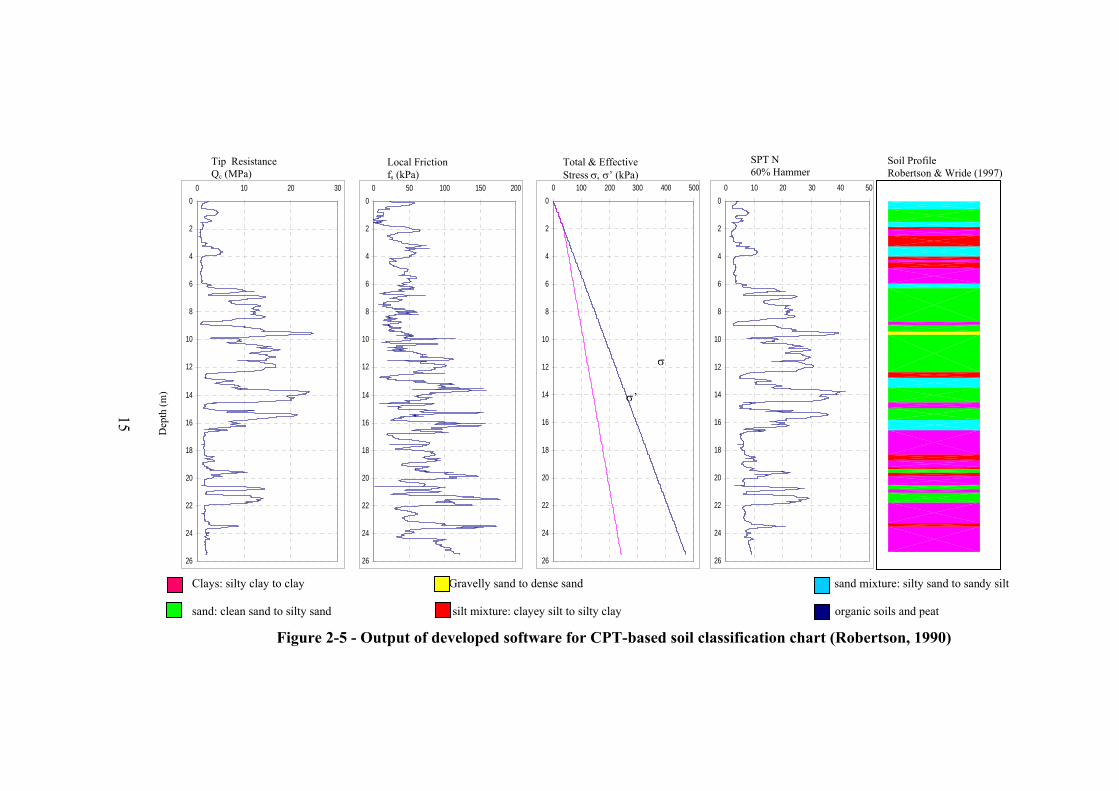
2.2.5 Illustrative Example
According to the details of the procedure given above, the programing
language Visual Basic was selected as the tool to develop software. One of the
outputs of this developed software based on the CPT data is presented in Figure
2.5. Column 1 and 2 in Figure 2.5 shows tip resistance and local friction. Column
3, column 4 and 5 in Figure 2.5 shows total and effective stresses, SPT blow
counts and soil profile respectively. The location of the CPT tests can be seen in
Appendix A.
14
SPT N 60% Hammer
Soil Profile Robertson & Wride (1997)
15
0
2
4
6
8
10
12
14
16
18
20
22
24
26
0 10 20 300
2
4
6
8
10
12
14
16
18
0 50 100 150 2000
2
4
6
8
10
12
14
16
18
0 100 200 300 400 5000
2
4
6
8
10
12
14
16
18
0 10 20 30 40 50
Tip Resistance Qc (MPa)
Total & Effective Stress σ, σ’ (kPa)
Local Friction fs (kPa)
σ
Dep
th (m
) σ’
Figure
Clays: silty clay to clay sand: clean sand to silty sa
20 20 20
2-5 -
nd
22
24
26
22
24
26
22
24
26
Output of developed software for CPT-based soil classification chart (Robertson, 1990)
Gravelly sand to dense sand sand mixture: silty sand to sandy silt
silt mixture: clayey silt to silty clay organic soils and peat

2.3 CPT BASED COMPRESSIBILITY ESTIMATIONS
2.3.1 Fundamentals of one-dimensional consolidation
Compressibility of soils has always been a controversial issue among
geotechnical engineerings. During the construction stage of a structure or any
other external loading conditions, soil layers are subjected to a compressive or
sometimes tensile stresses. A change in the effective stresses in a compressible
soil, such as clay and sand-silt mixture, produces a certain change in the volume of
voids. If the soil is permeable and not very compressible, the change in the volume
of voids due to the change in the state of stress in the soils can be assumed as
negligible. Process involving the reduction in the water content of saturated soils
without the replacement of the water by air is called a consolidation process
(Terzaghi, 1947).
As soon as a saturated soil mass is subjected to an external load, the water
in the pores usually carries the load since the compressibility of water is relatively
smaller than the compressibility of the soil structure. With time, water starts to
dissipate from the soil pores under the effect of loading; hence the load is
transferred to the soil skeleton. As a consequence of the load application, a
significant reduction in the soil volume and a change in the height of the soil are
observed. The vertical displacement in the soil structure due to the drainage of
pore water under the sustained loading is defined as consolidation settlement. The
pore water dissipation and also consolidation settlement are time dependent
processes. A certain amount of settlement is generated rapidly after the load
application, but after that, the amount of settlement increases with a decreasing
rate. Due to the accumulation of vertical displacement with time, the application of
the time of surcharge loading application gains importance. In practice, the soil
can not be subjected to external loads for a long time in order to observe the
ultimate value of the settlement. Due to the time limitation and emergency of the
construction, applied loads must be removed before the visualization of the real
16

compressibility characteristics of soil. In recent decades, some graphical and semi-
empirical methods were proposed to estimate the ultimate consolidation settlement
for a site which was subjected to an external loading for a certain time. In this
study, Asaoka’s method (1978) and Horn’s method (1983) were used for the
calculation of ultimate consolidation settlement. Details of these two methods are
summarized in Section 3.4.
2.3.2 General Compressibility Characteristics of Soil
In order to calculate the consolidation settlement, the value of the
compression index or coefficient of volume compressibility of soils must be
known. As mentioned before, every change in the effective state of stresses of soils
produces a reduction in the volume of voids. The distribution of the void ratio (e)
with respect to the effective stress (σ') for saturated soils presented in Figure 2.6
shows the compressibility characteristics. Figure 2.6 illustrates the initial
compression that is followed by the expansion and recompression (Craig, 1987).
The stress history of soils can be seen from the shapes of the curves in Figure 2.6.
Figure 2-6 - Void ratio-effective stress relationships (Craig, 1987)
Virgin compression line the linear or nearly linear part of the e-log σ'
shows the behavior of the normally consolidated clay. On the other hand, the state
of the overconsolidated is represented by the point on the expansion or
17

recompression parts of these curves. After the recompression stage the further
compression happens along the virgin line. The plots also illustrates that the
compressibility of overconsolidated clays is expected to be much less than the
same clay in the normally consolidated state (Craig, 1987).
The compressibility of soils is represented by two different parameters:
• Coefficient of volume compressibility (mv)
• Compression index (Cc)
Coefficient of volume compressibility (mv) is defined as the volume change
per unit increase in effective stress. This parameter can be calculated by as
follows:
)(
)()1(
1
10
10
0 ′−′−
×+
=σσ
eee
mV (2.8)
)(
)()(
1
10
10
0 ′−′−
×=σσ
HHH
mV (2.9)
where is initial void ratio, is final void ratio, H0e 1e 0 is initial layer
thickness, and H1 is layer thickness after external loadings. σ'0, σ'1 are initial
effective vertical stress and effective vertical stress after applied loads
respectively.
The value of the coefficient of volume compressibility is not constant for a
certain type of soil because of the fact that coefficient of volume compressibility
depends on the range of effective stresses. When effective stresses get larger, the
value of void ratio becomes smaller.
The variation of initial effective stresses (σ'0 ), the increase in the stress due
to the applied external loading and the value of the coefficient of volume
18
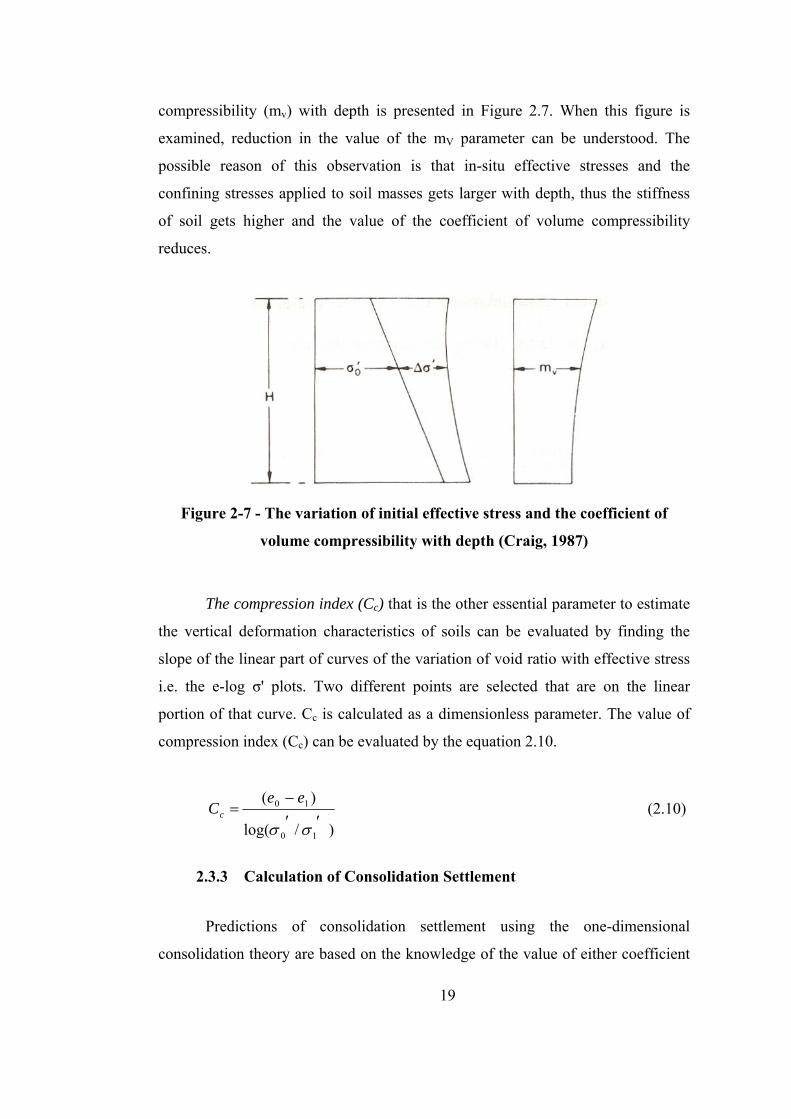
compressibility (mv) with depth is presented in Figure 2.7. When this figure is
examined, reduction in the value of the mV parameter can be understood. The
possible reason of this observation is that in-situ effective stresses and the
confining stresses applied to soil masses gets larger with depth, thus the stiffness
of soil gets higher and the value of the coefficient of volume compressibility
reduces.
Figure 2-7 - The variation of initial effective stress and the coefficient of
volume compressibility with depth (Craig, 1987)
The compression index (Cc) that is the other essential parameter to estimate
the vertical deformation characteristics of soils can be evaluated by finding the
slope of the linear part of curves of the variation of void ratio with effective stress
i.e. the e-log σ' plots. Two different points are selected that are on the linear
portion of that curve. Cc is calculated as a dimensionless parameter. The value of
compression index (Cc) can be evaluated by the equation 2.10.
)/log(
)(
10
10
′′−
=σσ
eeCc (2.10)
2.3.3 Calculation of Consolidation Settlement
Predictions of consolidation settlement using the one-dimensional
consolidation theory are based on the knowledge of the value of either coefficient
19
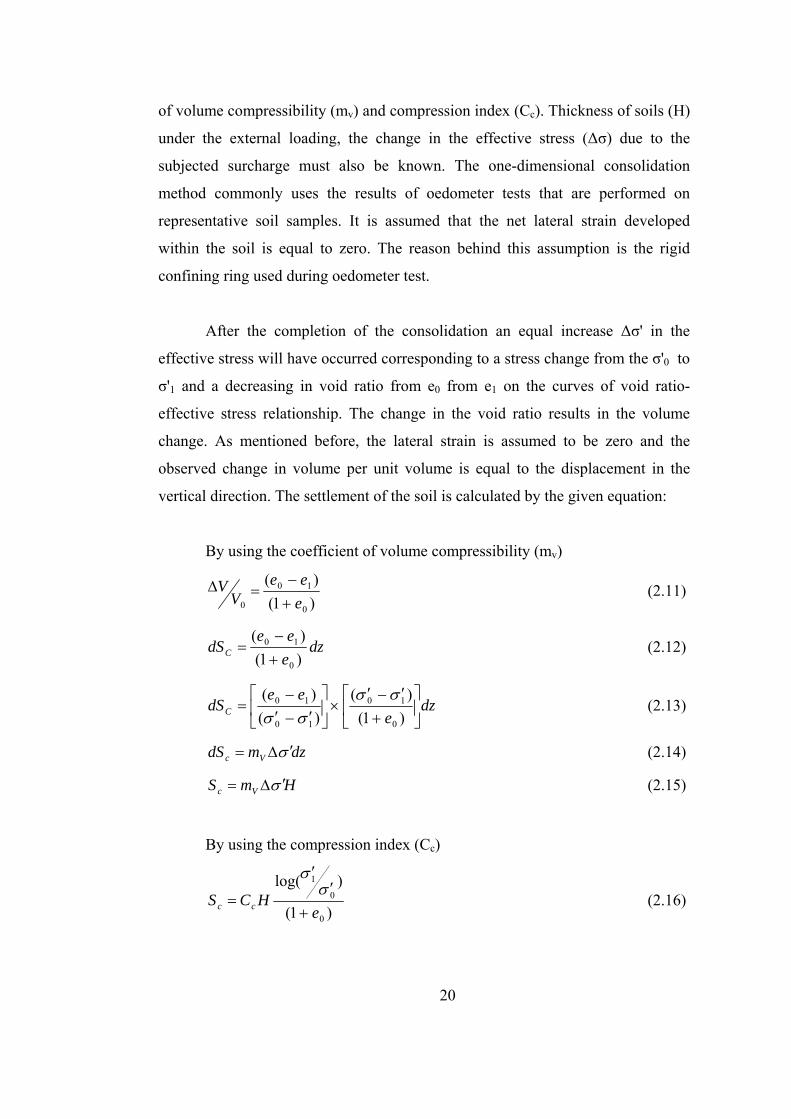
of volume compressibility (mv) and compression index (Cc). Thickness of soils (H)
under the external loading, the change in the effective stress (∆σ) due to the
subjected surcharge must also be known. The one-dimensional consolidation
method commonly uses the results of oedometer tests that are performed on
representative soil samples. It is assumed that the net lateral strain developed
within the soil is equal to zero. The reason behind this assumption is the rigid
confining ring used during oedometer test.
After the completion of the consolidation an equal increase ∆σ' in the
effective stress will have occurred corresponding to a stress change from the σ'0 to
σ'1 and a decreasing in void ratio from e0 from e1 on the curves of void ratio-
effective stress relationship. The change in the void ratio results in the volume
change. As mentioned before, the lateral strain is assumed to be zero and the
observed change in volume per unit volume is equal to the displacement in the
vertical direction. The settlement of the soil is calculated by the given equation:
By using the coefficient of volume compressibility (mv)
)1()(
0
10
0 eee
VV
+−
=∆ (2.11)
dzeee
dSC )1()(
0
10
+−
= (2.12)
dze
eedSC ⎥
⎦
⎤⎢⎣
⎡+
′−′×⎥
⎦
⎤⎢⎣
⎡′−′
−=
)1()(
)()(
0
10
10
10 σσσσ
(2.13)
dzmdS Vc σ ′∆= (2.14)
HmS Vc σ ′∆= (2.15)
By using the compression index (Cc)
)1(
)log(
0
0
1
eHCS cc +
′′
=σ
σ
(2.16)
20

The amount of consolidation settlement can be calculated by using
equation 2.15 and 2.16. In order to predict the total settlement, initially soil is
divided into sublayers and then the consolidation settlement is calculated for all
individual layers. The sum of the sublayer settlements gives the amount of
settlement of the whole layer.
2.3.4 Correlations between CPT Data and Compressibility of Soils
Deformation characteristics of soils are generally expressed by one-
dimensional constrained modulus, M, undrained Young’s modulus, in compression
loading, Eu and small-strain shear modulus, Go. One-dimensional consolidation
settlement is based on the assumption that the lateral strain is equal to zero. Hence,
the appropriate parameter to define the deformation characteristics of soils in the
consolidation process is the one-dimensional constrained modulus, M. One-
dimensional constrained modulus, M is defined as follows;
VV ddM εσ ′= (2.17)
VmM 1= (2.18)
In which vσ ′ is the vertical effective stress, εv is the vertical strain, and mv
is the coefficient of volume compressibility.
The amount of consolidation settlement can be calculated by substituting
equation 2.18 in equation 2.15. Hence, the equation below is obtained:
HMSc σ ′∆= 1 (2.19)
2.3.4.1 Methods to estimate the constrained modulus, M, for Clay
After an extensive literature survey, available methods based on the CPT
data for determining the compressibility characteristics of soils have been
complied. Sanglerat (1972), Jones and Rust (1995), Senneset et al. (1982, 1989)
21

and Kulhawy and Mayne (1990) suggested a model for estimating constrained
modulus of clays. Moreover, Manas et al. (1995), Formanavicius (1995), Mahesh
et al. (1995) and Kaplan et al. (2004) also proposed a correlation for clays. Lunne
and Christophersen (1983) suggested a method for overconsolidated and normally
consolidated sands. All these methods will be discussed next.
The 1-D constrained modulus is expressed in terms of the cone tip
resistance and coefficient, αm as given in equation 2.20. Sanglerat (1972) proposed
a comprehensive relationship for the coefficient, αm for a wide range of the cone
tip resistance (qc) and type of the soils. This correlation is presented in Table 2.2.
cm qM α= (2.20)
Table 2-2 - Estimations of coefficient, αm to find the constrained modulus, M,
for clays (Sanglerat, 1972)
Cone tip resistance, )(MPaq C
The range of coefficient mα Soil Type
Cq <0.7 3< mα <8
0.7< <2.0 Cq 2< mα <5
Cq >2.0 1< mα <2.5
Clay of low plasticity (CL)
Cq >2.0 3< mα <6
Cq <2.0 1< mα <3 Silts of low plasticity (ML)
Cq <2.0 2< mα <6 High plastic silts and clays (MH, CH)
Cq >1.2 2< mα <8 Organic silts (OL)
After the data in Table 2.2 were studied, it was concluded that the value of
coefficient, αm gets smaller with the increase in the tip resistance. This observation
is compatible with the observation that compressibility decreases with increased
effective stress and increased strength.
22

Another correlation developed by Kulhawy and Mayne (1990) has a more
general form as shown in equation 2.21 and does not depend on the soil type or the
amount of the tip resistance. General relationship is expressed as follows
)(25.8 0σ−= tqM (2.21)
The above correlation is also presented in the graphical form in Figure 2.8.
Figure 2-8 - General relationships between constrained modulus and net cone
resistance (Kulhawy and Mayne, 1990)
An alternative correlation for the determination of constrained modulus is
given by Senneset et al. (1982, 1989). Two different relations were developed for
normally consolidated and overconsolidated clays. Senneset et al. (1982, 1989)
proposed a linear interpretation model for overconsolidated clays, in the form of:
)( 0σα −= tii qM (2.22)
The coefficient, αi ranges from 5 to 15 for overconsolidated clays.
Constrained modulus, Mi, for Glava clay was calculated by the Senneset et al.
23

(1989) methods as shown in Figure 2.9. Figure 2.9 also compares the values of
constrained modulus, Mi, obtained from oedometer tests. When the plots shown in
the Figure 2.9 are observed, a good match between the results of laboratory tests
and the interpreted values of Mi for Glava clay can be seen.
Figure 2-9 - Constrained modulus Mi for Glava clay
(Senneset et al., 1989)
For normally consolidated clays the following relationship is
recommended;
)( 0σα −= tnn qM (2.23)
According to the methods of Senneset et al. (1989) the coefficient, αn is in
the range of 4 to 8 for normally consolidated clays.
24

Some of the most recent correlations were developed by Manas et al.
(1995), Formanavicius (1995), Mahesh et al. (1995) and Kaplan et al. (2004).
Manas et al. (1995) suggested that the value of coefficient of one dimensional
constrained modulus, αn is equal to 0.8 for soft clays. On the other hand,
Formanavicius (1995) has indicated that, a representative value of 10 can be used
for the coefficient, αn for clays. Mahesh et al. (1995) proposed another relationship
for the coefficient, αn for a wide range of the cone tip resistance (qc) and type of
clays. This correlation is presented in Table 2.3.
Table 2-3 - Estimations of coefficient, αn to find the constrained
modulus, M, for clays Mahesh et al. (1995)
Cone tip resistance, )(MPaq C
The range of coefficient nα Soil Type
4.5< <6.0 Cq nα = 1.37
4.0< <4.5 Cq nα = 1.67 2.5< <4.0 Cq 1.7< nα <2.8
Clays of low plasticity
0.5< <2.5 Cq 2.8< nα <6.1 Clays of high plasticity
Kaplan et al. (2004) recommended another method for one dimensional
constrained calculation. In this method, the database consisted of laboratory tests
results and in-situ tests results obtained from Romania and Iskenderun sites was
used. Distribution of cone tip resistance values with respect to the coefficient α
values was developed and presented as in Figure 2.10.
Kaplan et al. (2004) recommended that the coefficient α is in the range of 4
to 12 for clay with a cone tip resistance value smaller than 0.75 MPa. Whereas,
when the cone tip resistance value exceeds 0.75 MPa for clay, the coefficient α
may be taken between 2.7 and 4.7.
25

0.00
4.00
8.00
12.00
16.00
0.0 0.5 1.0 1.5 2.0 2.5Cone tip resistance, qc (MPa)
α
Laboratory tests results of Romania site
In-site tests results of Iskenderun site
Laboratory tests results of Iskenderun site
Figure 2-10 – Variation of α with cone tip resistance
(Kaplan et al., 2004)
2.3.4.2 Methods to estimate the constrained modulus, M, for Sands
Lunne and Christophersen (1983) proposed a new method that evaluates
M0 for normally consolidated unaged and uncemented silica sands. This
correlation is presented in equation 2.24 - 2.26.
cqM 40 = for qc< 10 MPa (2.24)
2020 += cqM for 10MPa <qc< 50 MPa (2.25)
MPaM 1200 = for qc > 50MPa (2.26)
Lunne and Christophersen (1983) recommended another correlation for
overconsolidated sands as shown below:
cqM 50 = for qc< 50 MPa (2.27)
MPaM 2500 = for qc > 50 MPa (2.28)
26

CHAPTER 3
CASE HISTORY PROCESSING
3.1 INTRODUCTION
To develop robust and defensible correlations for the assessment of the soil
compressibility based on CPT data, a database consisting of CPT logs and
settlement plate readings was compiled. The database is composed of 57
settlement plate records and 45 CPT boring data consisting of cone tip resistance
(qc), friction sleeve resistance (fs). CPT data and settlement plate readings were
obtained from two different sites, which are (1) Bursa East Waste Water Treatment
Plant Project and, (2) Bursa West Waste Water Treatment Plant Project.
Within the scope of West and East Waste Water Treatment Plant Projects,
site investigation studies composed of 45 CPT were performed in Bursa city. An
electronic cone penetrometer probe was used to perform CPT. 30 of CPT
soundings were carried out in the East Waste Water Treatment Plant site and 15 of
them were performed in the West Waste Water Treatment Plant site. Three of CPT
were extended to a depth of 25 meter. Bursa West and East Waste Water
Treatment Plant soil investigation layouts that show the location of available cone
penetration tests are presented in Appendix A. Distribution of cone tip resistance
(qc), friction sleeve resistance (fs), soil behavior type index (Ic) and soil profile of
each one of the CPT logs are also given in Appendix B. After the CPT profiles
were studied, it was concluded that the soil was too compressible and excessive
settlements can occur.
27

In order to improve the soil site and prevent excessive settlements, it was
decided to preload the site by 4 m high embankments. Several settlement plates
were placed on embankments to record the variation of settlements with time. The
compressibility of soils can be predicted by assessing the records of these
settlement plates. The lay out of settlement plates of Bursa West and East Waste
Water Treatment Plant sites are also presented in Appendix A.
The ultimate goal of this study is to develop a correlation to estimate one
dimensional constraint modulus, which will later be used to estimate the settlement
of soils. In order to predict the settlement of soil, soil profile, compressibility of
soil and the change in effective stresses due to the applied preloading have to be
known. To be able to obtain the first of these variables, the results of the CPT were
evaluated and soil profiles were determined using Robertson and Wride (1997)
CPT based soil classification correlation. The details of this part had been
summarized in Chapter 2. Following that step, increase in the effective stresses in
the soil masses due to the applied loading was calculated. For this, Boussinesq’s
method and the results of the Flac 3D models were used. Having the soil profile
and change in the vertical stresses at hand, the compressibility of the soil must be
estimated to compute the final settlement. For this, records of the settlement plates
were used to evaluate the ultimate settlements occurring at the site which were
then used in the regression analyses together with the settlement values predicted
using the proposed one-dimensional constraint modulus, change in the stress
distribution due to the applied surcharge and thickness of each sublayer. All these
procedures are summarized in detail in the following sections of this chapter. The
details of the development of the correlations will be discussed in Chapter 4.
Presenting results of all numerical analyses, theoretical calculations and
outcomes of CPT soundings for whole site would not be feasible. Due to this fact,
a smaller representative area was selected and is shown in Figure 3.1. The steps of
this study, which had been carried out for entire site, will be summarized on this
representative area.
28

CPT 18
Figure 3-1 - The layout of selected representative area in the Bursa Eastern
Waste Water Treatment Plant site
3.2 ESTIMATION OF ELASTIC STRESS DISTRIBUTIONS
The widely used method for calculation of settlements is based on the
knowledge of the original stresses in the subsoil and their variation due to the
external loadings. The state of stress produced in the subsoil by external loads was
calculated by two different methods, which are: (1) Boussinesq’s mathematical
models and (2) results of Flac 3D, which is a three-dimensional finite-difference
program. This section is divided into two parts in order to be able to focus on these
two methods separately. Section 3.2.1 deals with Boussinesq’s mathematical
model and Section 3.2.2 deals with Flac 3D elastic analyses.
3.2.1 Boussinesq’s Method
The initial step in the determination of the state of stress in soils is the
determination of the character of external loads. The character of external loads
29

can be defined by the intensity and geometry. The load may be either concentrated
or continuous. Other parameters used to define the applied load are the type of the
load distribution, (uniform, triangular, trapezoidal etc.) its direction and
inclination. The dynamics of the external load, which is defined as the way in
which the intensity and the geometry of that load vary with time, is another
important parameter (J.Feda, 1978). In this study, applied loads that produce the
change in effective stresses, ∆σ, have variable geometries but a constant height of
4 m. Surcharge loadings are uniformly distributed short-term loadings.
In the calculations of the state of stress in the subsoil, the real soil is
changed by a mathematical model of a half space to which various mechanical
properties can be assigned. Boussinesq proposed a method based on the elastic
theory that aims the calculation of changes in vertical stresses due to surface loads.
Three dimensional problems involving stresses induced by various loading types
can be solved by Boussinesq’s equation. In order to use elastic relationships
following assumptions are made:
• The soil is perfectly elastic material
• The relationship between strain and stress is linear
• The soil is isotropic and homogeneous
• The stresses are computed in a semi-infinite mass
The most frequent case in the geotechnical applications is a rectangular
area subjected to a uniformly distributed load. This case can be solved in a
comprehensive way by Boussinesq’s method. The vertical stress at any point at a
depth z below the corner of a uniformly loaded rectangular area can be calculated
by the integration of the Boussinesq’s equation given for the solution of the point
load application. This mathematical expression is given in equation 3.2 and 3.3 for
the point under the corner of the loading area.
σσ qIZ = (3.2)
30

⎥⎥⎥⎥⎥
⎦
⎤
⎢⎢⎢⎢⎢
⎣
⎡
+−+++
+++++
∗+++
++= −
1)1(2tan
12
1)1(2
41
2222
5.0221
22
22
2222
5.022
nmnmnmmn
nmnm
nmnmnmmnI
πσ (3.3)
where
zBm =
zLn =
In these equations Iσ is defined as influence factor, B and L are the width
and length of rectangular loading, respectively.
Equation 3.3 was modified to compute the stress change at any point under
the rectangular loaded area. This modification was based on dividing the loaded
area to appropriate rectangles in order to make the point at which you want to
compute Zσ∆ , the corner of the all rectangular areas. This procedure could best be
carried out by a software that computes the effects of various load patterns in the
soil. To develop such a software, the programing language Visual Basic was
selected. It was used effectively in order to give results in tabular form and plot the
distribution of vertical stress with depth clearly.
That developed code can be used for only regular rectangular loading area.
However, approximately half of the geometries of preloadings that were applied in
the Bursa East and West Waste Water Treatment Plant project were irregular
rectangular areas. Hence, another method had to be used in the calculation of that
state of stress in the soil. The most appropriate way for this seemed to be the
utilization of 3 dimensional finite difference program, Flac 3D. The details of that
method is given in the next section.
3.2.2 Flac 3D Analyses
3.2.2.1 General Information
31
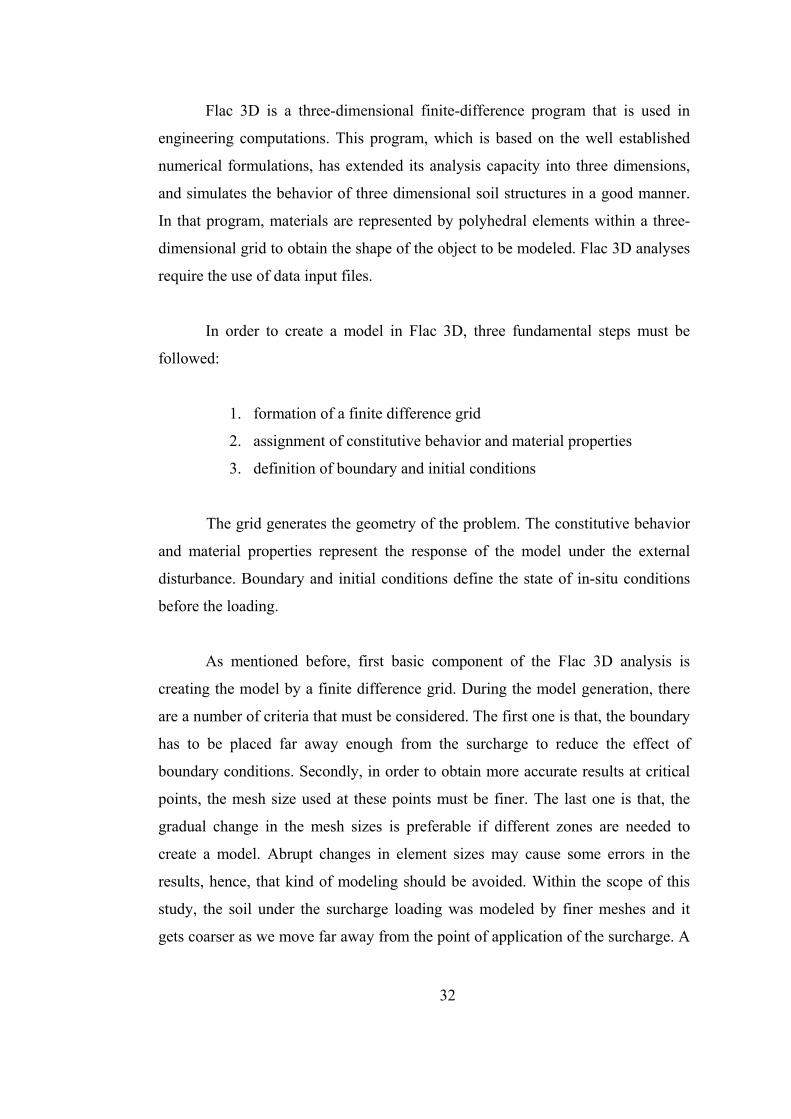
Flac 3D is a three-dimensional finite-difference program that is used in
engineering computations. This program, which is based on the well established
numerical formulations, has extended its analysis capacity into three dimensions,
and simulates the behavior of three dimensional soil structures in a good manner.
In that program, materials are represented by polyhedral elements within a three-
dimensional grid to obtain the shape of the object to be modeled. Flac 3D analyses
require the use of data input files.
In order to create a model in Flac 3D, three fundamental steps must be
followed:
1. formation of a finite difference grid
2. assignment of constitutive behavior and material properties
3. definition of boundary and initial conditions
The grid generates the geometry of the problem. The constitutive behavior
and material properties represent the response of the model under the external
disturbance. Boundary and initial conditions define the state of in-situ conditions
before the loading.
As mentioned before, first basic component of the Flac 3D analysis is
creating the model by a finite difference grid. During the model generation, there
are a number of criteria that must be considered. The first one is that, the boundary
has to be placed far away enough from the surcharge to reduce the effect of
boundary conditions. Secondly, in order to obtain more accurate results at critical
points, the mesh size used at these points must be finer. The last one is that, the
gradual change in the mesh sizes is preferable if different zones are needed to
create a model. Abrupt changes in element sizes may cause some errors in the
results, hence, that kind of modeling should be avoided. Within the scope of this
study, the soil under the surcharge loading was modeled by finer meshes and it
gets coarser as we move far away from the point of application of the surcharge. A
32

model with a unique mesh size causes an increase in the number of elements and
time of computation. Under the concern of these three crucial criteria, mesh
geometry was constructed by optimizing the element size that will reduce the
computation time and also give more reliable results. When the geometry of
loading area is complex and has an irregular shape, the primitive geometry must be
connected to form the irregular shape of application area with unbroken
continuum. The most difficult step for obtaining an irregular model is that, all grid
points along adjoining faces must correspond to each other. If grid points do not
connect with each other, a discontinuity is observed in the stress distribution across
the attached faces.
Once the grid generation is completed, material models and related
properties have to be assigned to all of the elements in the model. The elastic,
isotropic model is acceptable for homogeneous, isotropic, continuous material that
shows a linear stress-strain behavior. For the elastic model, the required
parameters are bulk and shear moduli of soil. In that model, each element behaves
according to a predefined linear stress vs. strain relationship under the effect of
applied loads. The method given in section 3.2.1 is based on the same material
model; therefore the comparison of these two methods can be meaningful.
The last step in generating a Flac 3D model is the definition of the
boundary and initial conditions. In Flac 3D, the boundaries are free of stress and
unconstrained by default. In this study, displacement boundary conditions are
used, in other words roller or pin boundaries are defined. A pinned boundary
condition representing constraints in the x-, y- and z-directions is specified at the
level of bedrock. The boundary condition at the other faces can be defined as fixed
in the x-, y-directions only and free to move in the z-direction. Initial stress
conditions, including gravitational loading can be imposed by adding the
gravitational acceleration vector of 9.81 m/sec2.
33

The final stage of a Flac 3D analysis is the solution of the generated
problem. The Flac 3D finalizes the calculation steps once the ratio of the
maximum unbalanced force for all the grid points in the model to the average
applied load fall below the value of 1.0 x 10⁻⁵. The outcomes of the solution can be
presented as stress contours. Moreover, numeric values of the variation of stresses
in the soil with depth can be obtained as an output. The second way of presenting
the results of analysis gives more detailed information. The outputs of the Flac 3D
analysis for all placed settlement plates are presented in Appendix C in tabular
forms.
3.2.2.2 Comparison of two methods
In Bursa West and East Waste Water Treatment Plant project sites, small
portion of preloaded area has regular shape. As mentioned before, the increase in
the vertical stress under regular rectangular loaded area can be determined by both
developed software based on the Boussinesq’s method and Flac 3D analyses. To
compare these two different methods, the loading case at settlement plate 50
(SP50) that is shown in the Bursa East Waste Water Treatment Plant soil
investigation layout in Appendix A was used. The geometry of the applied loading
is also given in Appendix A. The results of the Flac 3D analyses and Boussinesq’s
solution are presented in Figure 3.2. Once the graphs are evaluated, it was
observed that the distributions of effective stresses in both cases are almost equal
to each other. The small difference, less than 10%, that was seen in the variation of
the effective stress changes with depth for two methods are negligible. The
possible reason of that difference is the defined boundaries condition and mesh
sizes in Flac 3D. Due to its simplicity, in this study the computations for the
change in stresses due to applied loadings were performed by Flac 3D analysis.
34

0
5
10
15
20
25
30
35
25.0 30.0 35.0 40.0 45.0 50.0 55.0 60.0 65.0 70.0 ∆s(kPa)
dept
h (m
)
Boussinesq's Method Flac 3D Analysis
Figure 3-2 - Distribution of the change in vertical stress with depth at
SP50 obtained by Boussinesq’s method and Flac 3D analysis
3.2.2.3 Performed Flac 3D analysis results for the selected
representative area
In this section, Flac 3D analyses results for the selected representative area
shown in Figure 3.1 are presented in order to discuss the change in stress due to
the given loading condition. The geometry of the applied external load is shown in
Figure 3.3. As shown in that figure, the geometry of this loading case is not
appropriate for the determination of the stress change by using Boussinesq’s
method. Thus, Flac 3D program was used.
The geometry of loading area with a constant height of 4 m is shown in
Figure 3.3. Although the edges of the loading area have an inclination, the
generated model did not have these inclined edges. As mentioned before, the most
crucial criterion to obtain reliable and robust results from Flac 3D analysis is the
attachment process. The geometry of this loading case is not primitive hence the
primitive small areas were joined to each other to obtain this complex shape.
During that step, grid points had to be attached to each other along the adjoining
35
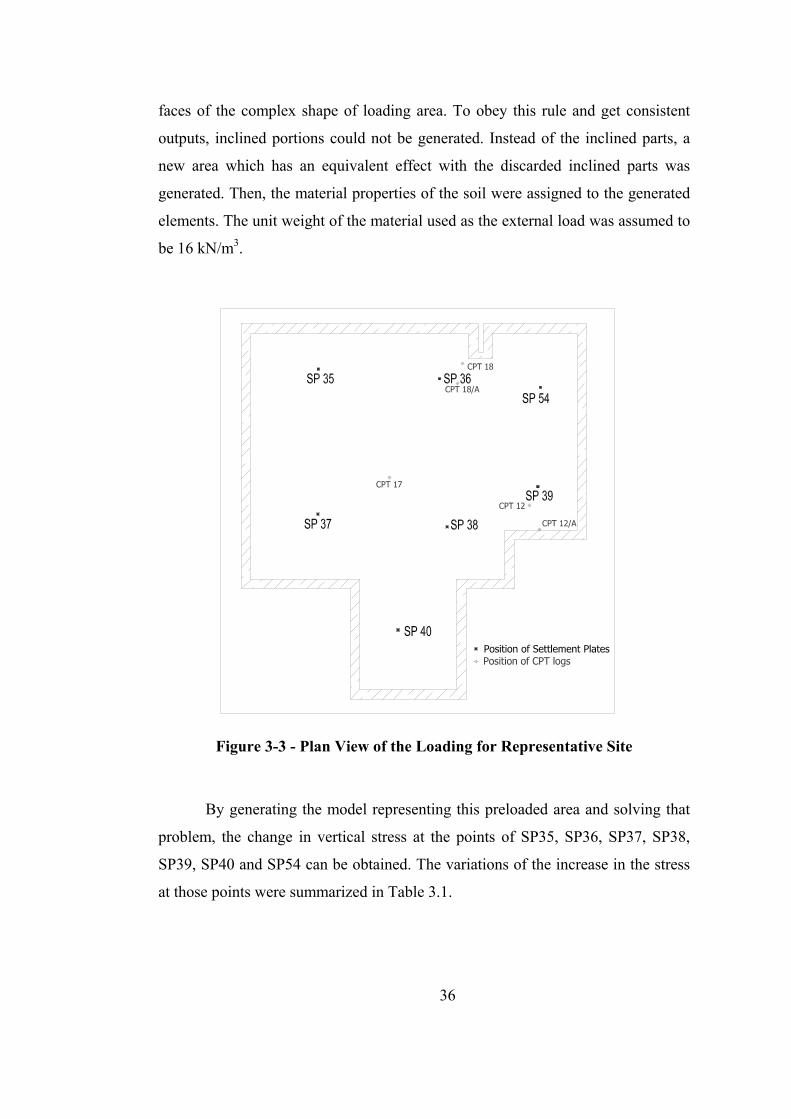
faces of the complex shape of loading area. To obey this rule and get consistent
outputs, inclined portions could not be generated. Instead of the inclined parts, a
new area which has an equivalent effect with the discarded inclined parts was
generated. Then, the material properties of the soil were assigned to the generated
elements. The unit weight of the material used as the external load was assumed to
be 16 kN/m3.
Figure 3-3 - Plan View of the Loading for Representative Site
By generating the model representing this preloaded area and solving that
problem, the change in vertical stress at the points of SP35, SP36, SP37, SP38,
SP39, SP40 and SP54 can be obtained. The variations of the increase in the stress
at those points were summarized in Table 3.1.
36
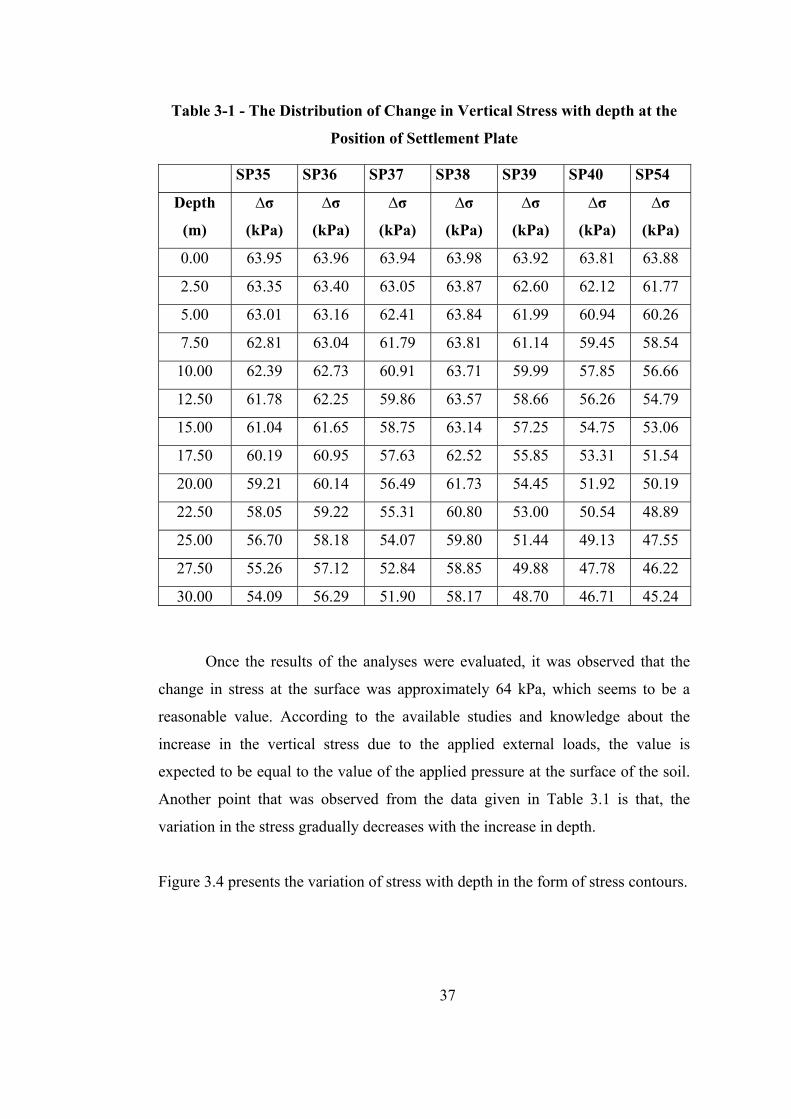
Table 3-1 - The Distribution of Change in Vertical Stress with depth at the
Position of Settlement Plate
SP35 SP36 SP37 SP38 SP39 SP40 SP54
Depth
(m)
∆σ
(kPa)
∆σ
(kPa)
∆σ
(kPa)
∆σ
(kPa)
∆σ
(kPa)
∆σ
(kPa)
∆σ
(kPa)
0.00 63.95 63.96 63.94 63.98 63.92 63.81 63.88
2.50 63.35 63.40 63.05 63.87 62.60 62.12 61.77
5.00 63.01 63.16 62.41 63.84 61.99 60.94 60.26
7.50 62.81 63.04 61.79 63.81 61.14 59.45 58.54
10.00 62.39 62.73 60.91 63.71 59.99 57.85 56.66
12.50 61.78 62.25 59.86 63.57 58.66 56.26 54.79
15.00 61.04 61.65 58.75 63.14 57.25 54.75 53.06
17.50 60.19 60.95 57.63 62.52 55.85 53.31 51.54
20.00 59.21 60.14 56.49 61.73 54.45 51.92 50.19
22.50 58.05 59.22 55.31 60.80 53.00 50.54 48.89
25.00 56.70 58.18 54.07 59.80 51.44 49.13 47.55
27.50 55.26 57.12 52.84 58.85 49.88 47.78 46.22
30.00 54.09 56.29 51.90 58.17 48.70 46.71 45.24
Once the results of the analyses were evaluated, it was observed that the
change in stress at the surface was approximately 64 kPa, which seems to be a
reasonable value. According to the available studies and knowledge about the
increase in the vertical stress due to the applied external loads, the value is
expected to be equal to the value of the applied pressure at the surface of the soil.
Another point that was observed from the data given in Table 3.1 is that, the
variation in the stress gradually decreases with the increase in depth.
Figure 3.4 presents the variation of stress with depth in the form of stress contours.
37

38
Figure 3-4 - Stress contours obtained from FLAC 3D for representative site

More continues information about the stress variation with depth at SP36
can be seen in Figure 3.5. Figure 3.5 shows the distribution of change in vertical
stress due to the applied load. The results of the Flac 3D analyses for all settlement
plates are given in Appendix C.
0
5
10
15
20
25
30
56.0 58.0 60.0 62.0 64.0 66.0∆σ(kPa)
dept
h(m
)
Figure 3-5 - Distribution of change in vertical stress due to the applied load
3.3 DETERMINATION OF CHARACTERISTICS OF SOIL SUBLAYERS
To predict the final settlement of a site, certain parameters such as the
constrained modulus of the soil (M) and the variation of vertical stress in the soil
must be known. The parameter that governs the compressibility behavior of soil
varies with depth. Soil is an anisotropic and inhomogeneous material. Hence,
using a single value for all of these parameters for a site may not yield reliable
results. To obtain reliable results, soil must be divided into sublayers with
representative parameters.
Performed CPT tests describe the soil profile and the sublayers of the soil
at the location of the settlement plates. Because of the nonexistence of the CPT
tests at exactly the same positions with the settlement plates, CPT tests that are in
the close proximity to the considered settlement plate were selected to estimate the
39

soil profile under that plate. Locations of the CPT soundings and settlement plates
for the selected representative site can be seen in Figure 3.1. The summary of
matching between CPT tests and settlement plates (SP) for the representative area
is presented in Table 3.2.
Table 3-2 - Match between related CPT and Settlement Plate for chosen
representative site
Site Name Performed CPT Name Placed
Settlement Plate Name
CPT18,CPT18/A SP35 CPT18,CPT18/A SP36
CPT17 SP37 Anaerobic Reactors
CPT17,CPT12,CPT12/A SP38 Air Blower
Building CPT12,CPT12/A SP39
Selector Tank CPT17,CPT12,CPT12/A SP40 Substation Building
CPT12,CPT12/A, CPT18,CPT18/A SP54
CPT based soil classification charts provide the valuable data for the soil
profiles. For some cases, for which the soil profile can not be known exactly, two
or more CPT results were utilized for soil sublayering. The average values of cone
tip resistance (qc), friction sleeve resistance (fs), soil type index (Ic) and also the
variation in vertical stress due to the external loads (∆σ) were evaluated and used
as representative parameters for each soil layer. The values of the representative
parameters for each sublayer of soil at the location of SP54 were calculated and
one of them was presented in Figure 3.6. These results will be used to propose a
new method for calculation of settlement. The predicted settlement will be
evaluated based on two or more different soil profiles and finally the average of
those results will be used to estimate the settlement of soil under the applied load.
40

Average Increase in Vertical Stress ∆σ (kPa)
Average Soil Index, Ic
Average Local Friction fs (kPa)
Average Tip Resistance qC (MPa)
Soil Profile Robertson & Wride (1997)
41
0
1
2
3
4
5
6
7
8
9
10
11
12
0.0 10.0 20.0 30.0
0
1
2
3
4
5
6
7
8
9
10
11
12
0.0 100.0 200.0 300.0
0
1
2
3
4
5
6
7
8
9
10
11
12
0.0 1.0 2.0 3.0 4.00
1
2
3
4
5
6
7
8
9
10
11
12
56.0 58.0 60.0 62.0 64.0 66.0
Dep
th (m
)
Figure 3-6 - Representative Parameters for CPT 12 and SP 54
Clays: silty clay to clay Gravelly sand to dense sand sand mixture: silty sand to sandy silt sand: clean sand to silty san silt mixture: clayey silt to silty clay organic soils and peat
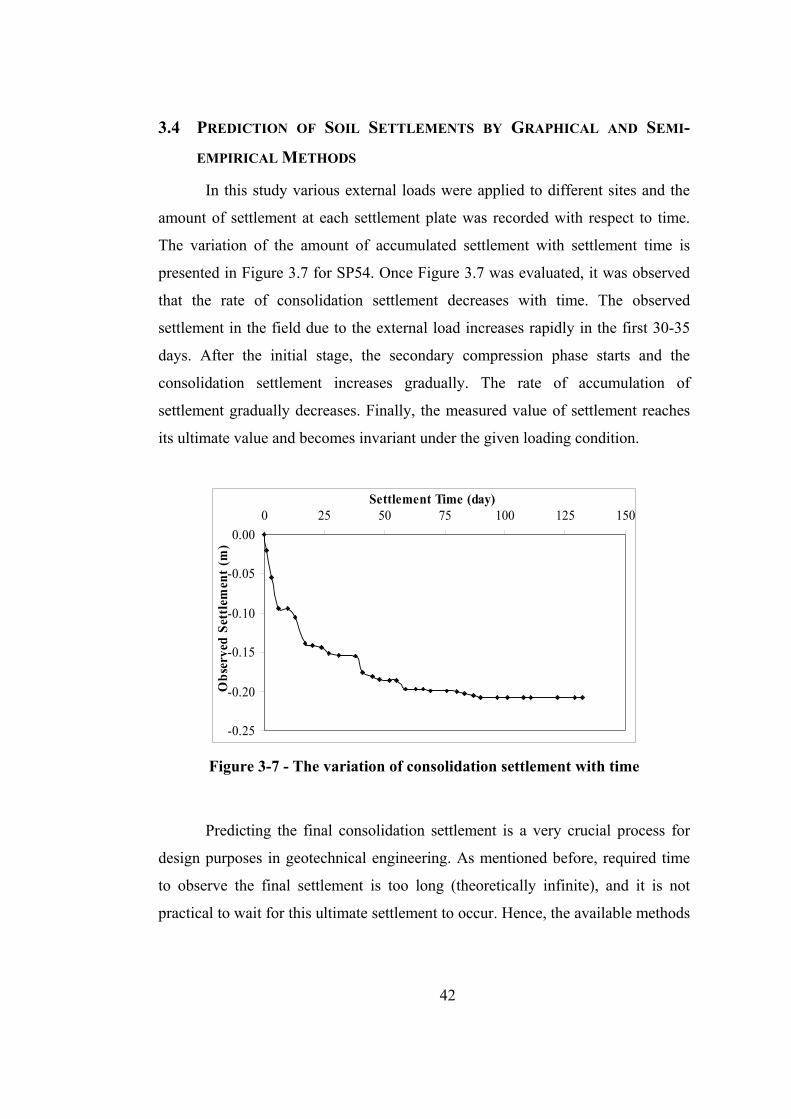
3.4 PREDICTION OF SOIL SETTLEMENTS BY GRAPHICAL AND SEMI-
EMPIRICAL METHODS
In this study various external loads were applied to different sites and the
amount of settlement at each settlement plate was recorded with respect to time.
The variation of the amount of accumulated settlement with settlement time is
presented in Figure 3.7 for SP54. Once Figure 3.7 was evaluated, it was observed
that the rate of consolidation settlement decreases with time. The observed
settlement in the field due to the external load increases rapidly in the first 30-35
days. After the initial stage, the secondary compression phase starts and the
consolidation settlement increases gradually. The rate of accumulation of
settlement gradually decreases. Finally, the measured value of settlement reaches
its ultimate value and becomes invariant under the given loading condition.
-0.25
-0.20
-0.15
-0.10
-0.05
0.000 25 50 75 100 125 150
Settlement Time (day)
Obs
erve
d Se
ttle
men
t (m
)
Figure 3-7 - The variation of consolidation settlement with time
Predicting the final consolidation settlement is a very crucial process for
design purposes in geotechnical engineering. As mentioned before, required time
to observe the final settlement is too long (theoretically infinite), and it is not
practical to wait for this ultimate settlement to occur. Hence, the available methods
42

in the literature are generally used to estimate the ultimate settlement. In this study,
two different methods were used for the calculation of consolidation settlement:
• Asaoka’s method
• Horn’s method
Both of these methods are based on Terzaghi’s one-dimensional
consolidation theory. Details of these two methods are summarized in following
sections
3.4.1 Asaoka’s Method (Asaoka, 1978)
The method developed by Asaoka is based on the assessment of the past
observations in order to predict the ultimate settlement. In order to be able to use
this method, the settlement values measured at a certain time interval (∆t) must be
known. The settlement values obtained at a time tj (tj = ∆t x j ; j=0, 1, 2,…) (Sj) are
plotted against the amount of settlement measured at the time tj-1 (Sj-1). According
to the definition of consolidation settlement, once the pore water dissipation is
completed, the amount of settlement observed at the site remains constant meaning
that the consolidation settlement process is over. In order to determine the ultimate
value of the settlement that can take place due to the prescribed loading condition,
the line that is fitted to the observed data points on the Sj vs. Sj-1 plot is intersected
with the x = y line. This intersection point designates the value where the two
consecutive settlement values are equal to each other, and, in turn, this means that
the settlement process was completed and the obtained value is the final value of
the consolidation settlement due to the applied load.
This theory can be expressed by the graphical presentation that is shown in
Figure 3.8. β0 represents the intercept and β1 represents the slope of the fitted line
to the Sj and Sj-1 values. The intersecting point of the fitted line with the xy = line
shows the expected final settlement (Sf). This philosophy is expressed by the
following expression:
43

1−= jj SS (3.5)
110 −×+= jj SS ββ (3.6)
Sj-1
Sj
Sf
βo1β
45°
Figure 3-8 - Graphical presentation of Asaoka’s method (Asaoka, 1978)
In this study, Asaoka’s method was used to determine the ultimate
settlement under different kinds of load cases for all settlement plates that were
placed at various locations. A sample application of the Asaoka’s method for
settlement plate 54 (SP54) is shown in Figure 3.9.
Asaoka's Method
y = 0.9379x - 0.0129R2 = 0.9983
-0.220
-0.210
-0.200
-0.190
-0.180-0.19-0.180
Sj (m
)
Figure 3-9 - Estimation of fin
usi
Ultimate settlement =0.210 m
-0.220-0.210-0.2000Sj-1(m)
al settlement at SP54 due to the surcharge by
ng Asaoka’s method
44

Prediction of the final settlement is effected by the variation in the
observation period, meaning that time of the application of external loading is an
effective parameter for the anticipation of settlement-time correlation and making
reliable estimation of the ultimate settlement. Time between the start of the
surcharge loading and the removal of the external load was approximately 130
days for the settlement plate 54 (SP54). At the end of the load application period,
the measured settlement under the SP54 was 0.208 m. The settlement value
estimated by using Asaoka’s method is approximately 0.210 m. Once Figure 3.7
was evaluated, it was observed that the rate of consolidation settlement decreases
with time and after a certain time, the value of settlement becomes invariant.
Hence, the observation time is assumed to be enough to understand the
consolidation behavior of soil, and, in turn, the calculated settlement by Asaoka’s
method is expected to be not too different from the last recorded settlement in the
site.
Performed settlement predictions using Asaoka’s method based on the past
observations for all settlement plates that were placed at various places on West
and East Waste Water Treatment Plant Project sites are given in Appendix D.
3.4.2 Horn’s Method (Horn, 1983)
The other method used for the prediction of ultimate settlement in this
study is Horn’s method, which is based on the evaluation of the observed time vs.
settlement curves. As mentioned before, the rate of the settlement decreases and
then becomes zero after a certain time. The settlement speed, v*, can be
determined from the observed settlement vs. time curves. The slope of the tangent
of those curves gives the rate of settlement. Figure 3.10 shows the representative
settlement vs. time diagram and the inclination of these curves can be evaluated by
using equation 3.6.
tsv
∂∂
=∗ (3.6)
45

s
dsdt
o
Figure 3-10 - Settlement vs. Time Diagram (Horn, 1983)
In order to estimate the ultimate settlement, total settlement time, tf, must
be known. Figure 3.11 shows the time vs. velocity diagram. The Horn’s method
(Horn, 1983) evaluates the rate of settlement curve, t - v*, that runs against zero
with a straight line. The value of the time at the zero speed, which means that
intersection point of that straight line with the v = 0 line gives the total settlement
time, tf. In practice, drawing the real time-velocity curve as shown in Figure 3.11
is nearly impossible. Hence; a more practical and easier way was proposed by
Horn to evaluate the ultimate settlement.
v, v*
O t
v
v*
o
o
ft
β
v
v*
Figure 3-11 - Time vs. Velocity Relationship (Horn, 1983)
46

The easier way is based on the equation 3.7 leading practically to the same
result without great deviation. The ultimate settlement value, Sf, can be evaluated
by drawing the reciprocal of the velocity 1/v = t/s against time. Figure 3.12
presents the t vs. t/s diagram. By using that diagram, and the formulation given
below, the ultimate settlement can be calculated.
αtan)(
==s
ttS f (3.7)
t/s=1/v
O t
t/sα
Figure 3-12 - Time vs. t/s Relationship (Horn, 1983)
Application of the Horn’s method on the settlement plate 54 (SP54) is
presented in Figure 3.13.
The ultimate settlement predicted by Horn’s method is approximately
0.210 m. Once the results of the Asaoka’s and Horn’s methods were investigated,
it was observed that these two settlement prediction methods give close results.
The average of the results of these two methods is very close to the ultimate
settlement value observed at the site. The predicted settlement values for the
settlement plates in the selected representative site are summarized in Table 3.3.
Conducted settlement prediction analyses based on Horn’s method for all of the
settlement plates at the project sites are presented in Appendix D.
47

Horn's Method
y = -4.4426x - 41.501R2 = 0.998
-500
-400
-300
-200
-100
0
0 20 40 60 80 100 120 14time(day)
time/
set.
0
Figure 3
Table
SettlemePlate SP 39
SP 54
SP 35
SP 36
SP 37
SP38
SP 40
3.5 DAT
Th
based com
the datab
settlement
-600 Ultimate settlement =0.210 m
-700
-13 - Estimation of final settlement at SP54 due to the surcharge by
using Horn’s method
3-3 - Review of final settlement prediction by using two different
methods for the representative site
nt Final Settlement by Asaoka’s Method (m)
Final Settlement by Horn’s Method (m)
Average Final Settlement (m)
0.211 0.212 0.2115
0.210 0.210 0.210
0.159 0.157 0.158
0.200 0.198 0.199
0.192 0.190 0.191
0.208 0.207 0.208
0.181 0.184 0.183
ABASE SUMMARY
e compiled database was used in this study for the development of CPT
pressibility assessment methods for soils. The most significant point in
ase compilation for the regression analysis is that the predicted
s and the observed ones must cover the same thickness of soils.
48

Once the performed CPT data were examined, it was observed that cone tip
resistance (qc) values are bit low. Hence; compressible soils may extend to deeper
sublayer than the level of performed CPT reached. To investigate the correctness
of that idea, the settlement was calculated between 25 meter and 50 meter depth of
soils by using the correlation proposed by Sanglerat (1972) for one dimensional
constrained modulus. Soil profile between these depths was found by an
assumption that the last soil layer in CPT profile extends to 50 meter. The
settlement occurred in the range of 25 meter to 50 meter depth was calculated
approximately as 4-5 cm. In the light of this discussion, observed settlement values
were corrected by subtracting that value from the settlements recorded at the site.
The predicted settlement values were obtained along the CPT profile. Majority of
performed CPT extended to a depth of 18-20 meters. Only three of them extended
to 25 meter. To make logical comparison between the corrected observed
settlement values and predicted ones CPT profiles were extended to a depth of 25
meter. These three CPT data were used properly to generate profiles for last 5-7
meter. The values of the corrected observed settlement and the predicted ones for
soil profiles with 25 meter depth were used in the regression analysis.
The database used in this study for the development of CPT based
compressibility assessment methods for soils consists of soil type index (Ic) that
represents the type of soil layers and characteristic parameters such as; average
cone tip resistance (qc), and average friction sleeve resistance (fS) of each sublayer
of soil. The other two important parameters in the calculation of the settlement are
the average value of increase in the vertical stress due to the sustained loading for
each sublayer and the calculated ultimate settlement for each settlement plate for
different loading conditions. These two parameters and others were compiled and
database of this study was generated.
One of the examples of the prepared database for settlement plate 54
(SP54) in the selected site is presented in Table 3.4. Complete database is given in
Appendix E.
49
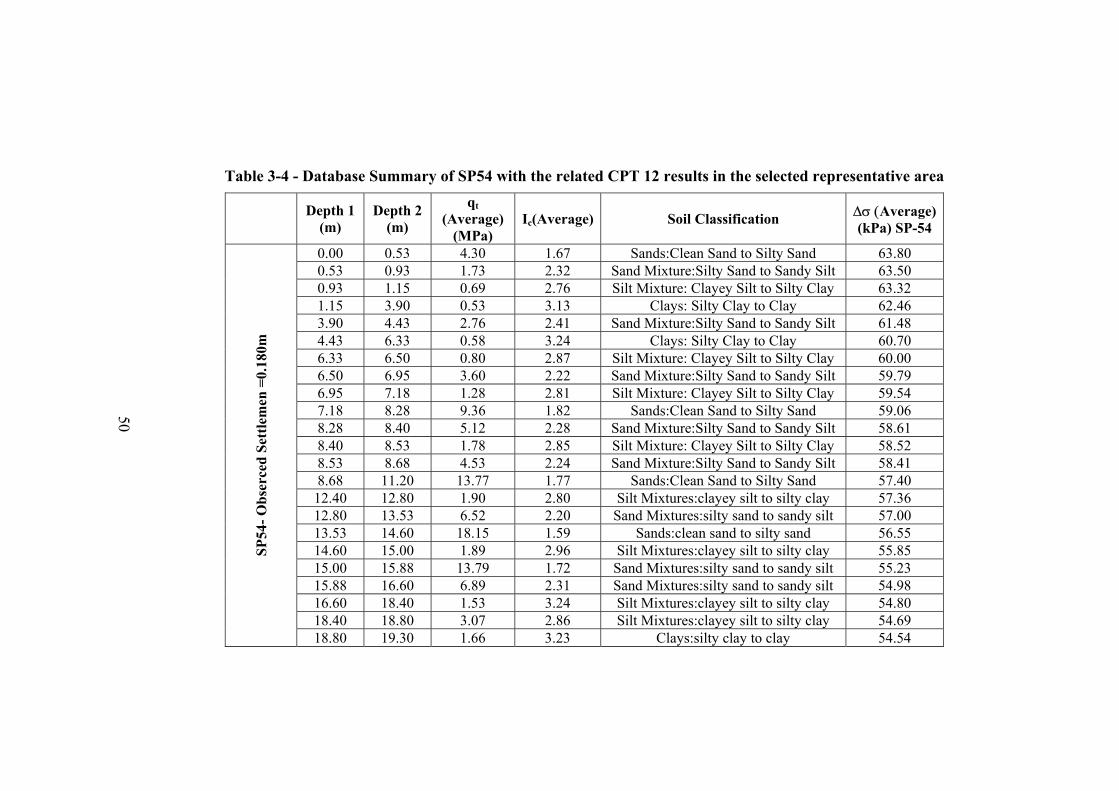
50
Table 3-4 - Database Summary of SP54 with the related CPT 12 results in the selected representative area
Depth 1 (m)
Depth 2 (m)
qt (Average)
(MPa) Ic(Average) Soil Classification ∆σ (Average)
(kPa) SP-54
0.00 0.53 4.30 1.67 Sands:Clean Sand to Silty Sand 63.80 0.53 0.93 1.73 2.32 Sand Mixture:Silty Sand to Sandy Silt 63.50 0.93 1.15 0.69 2.76 Silt Mixture: Clayey Silt to Silty Clay 63.32 1.15 3.90 0.53 3.13 Clays: Silty Clay to Clay 62.46 3.90 4.43 2.76 2.41 Sand Mixture:Silty Sand to Sandy Silt 61.48 4.43 6.33 0.58 3.24 Clays: Silty Clay to Clay 60.70 6.33 6.50 0.80 2.87 Silt Mixture: Clayey Silt to Silty Clay 60.00 6.50 6.95 3.60 2.22 Sand Mixture:Silty Sand to Sandy Silt 59.79 6.95 7.18 1.28 2.81 Silt Mixture: Clayey Silt to Silty Clay 59.54 7.18 8.28 9.36 1.82 Sands:Clean Sand to Silty Sand 59.06 8.28 8.40 5.12 2.28 Sand Mixture:Silty Sand to Sandy Silt 58.61 8.40 8.53 1.78 2.85 Silt Mixture: Clayey Silt to Silty Clay 58.52 8.53 8.68 4.53 2.24 Sand Mixture:Silty Sand to Sandy Silt 58.41 8.68 11.20 13.77 1.77 Sands:Clean Sand to Silty Sand 57.40 12.40 12.80 1.90 2.80 Silt Mixtures:clayey silt to silty clay 57.36 12.80 13.53 6.52 2.20 Sand Mixtures:silty sand to sandy silt 57.00 13.53 14.60 18.15 1.59 Sands:clean sand to silty sand 56.55 14.60 15.00 1.89 2.96 Silt Mixtures:clayey silt to silty clay 55.85 15.00 15.88 13.79 1.72 Sand Mixtures:silty sand to sandy silt 55.23 15.88 16.60 6.89 2.31 Sand Mixtures:silty sand to sandy silt 54.98 16.60 18.40 1.53 3.24 Silt Mixtures:clayey silt to silty clay 54.80 18.40 18.80 3.07 2.86 Silt Mixtures:clayey silt to silty clay 54.69
SP54
- Obs
erce
d Se
ttle
men
=0.
180m
18.80 19.30 1.66 3.23 Clays:silty clay to clay 54.54

51
Table 3-4 - Database Summary of SP54 with the related CPT 12 results in the selected representative area (Continued)
Depth 1 (m)
Depth 2 (m)
qt (Average)
(MPa) Ic(Average) Soil Classification ∆σ (Average)
(kPa) SP-54
19.30 19.45 3.05 2.80 Silt Mixtures:clayey silt to silty clay 54.28 19.45 19.70 8.44 2.12 Sand Mixtures:silty sand to sandy silt 54.01 19.70 19.98 4.04 2.81 Silt Mixtures:clayey silt to silty clay 53.85 19.98 20.60 1.68 3.24 Clays:silty clay to clay 53.57 20.60 21.18 2.31 3.03 Silt Mixtures:clayey silt to silty clay 52.91 21.18 21.88 11.19 2.02 Sand Mixtures:silty sand to sandy silt 52.38 21.88 23.38 1.81 3.25 Silt Mixtures:clayey silt to silty clay 51.71 23.38 23.63 5.86 2.60 Silt Mixtures:clayey silt to silty clay 51.39
23.63 25.50 1.96 3.29 Clays:silty clay to clay 51.14

CHAPTER 4
DEVELOPMENT OF PROBABILISTIC CPT BASED
COMPRESSIBILITY ASSESSMENT OF SOILS
4.1 INTRODUCTION
The main objective of this study is to develop a correlation for the
prediction of compressibility of soil based on CPT data. In the development of this
formulation, the database consisting of CPT data, field measurements of
settlements and results of numerical analyses was used. The compiled database is
presented in tabular form in Appendix E. In order to develop the correlations,
maximum likelihood (ML) method was applied on select representative limit state
models. This chapter summarizes the development of limit state models,
implementation of ML method and the comparison of the proposed correlations
with the other correlations available in literature.
4.2 LIMIT STATE MODELS FOR CPT BASED SOIL COMPRESSIBILITY
Development of limit state model for the CPT-based soil compressibility
assessment starts with the selection of a mathematical model, which will capture
the essentials of the problem. The model for the limit-state function is going to
have a general functional form of ),( Θ= xgg) , where x is a set of descriptive
variables and is the set of unknown model parameters. Θ
52
Based on extensive sensitivity study and literature survey given in the
section 2.2.4, one dimensional constraint modulus, M was assumed to be
calculated by using the below given equation;
cm qM α= (4.1)
When the studies by Sanglerat (1972) and Lunne and Christophersen
(1983) for the prediction of the one-dimensional constrained modulus
coefficient, mα , were examined, the general trend for mα was observed to be
possibly modeled by an exponential or logarithmic functions. The assumed general
form of the mα can be written as
531 )ln()ln( 42 θθθα θθ ++= ccm Iq (4.2)
)(1
432
θθθθα cc Iqm e= (4.3)
To evaluate the compressibility behavior of soils, specifically the one-
dimensional constrained modulus coefficient, mα , the values of ultimate observed
settlements at the field were used in the regression analysis together with the
predicted settlement calculated by developed formulation for mα .
∑=
=
∆∆=ni
imiiiicip HqSS
0),,,( ασ (4.4)
iicimi
miiiici HqHqS σαασ ∆×∆×⎥⎦⎤
⎢⎣⎡
×=∆∆ )(1),,,( (4.5)
where
pS is the total predicted settlement
iS is the predicted settlement at the ith sublayer
ni ,,0 K= is the number of the sublayer for each soil profile
iH∆ is the thickness of ith sublayer
iσ∆ is the increase in vertical stress for ith sublayer
ciq is the average cone tip resistance for the ith sublayer
53

miα is the proposed constrained modulus coefficient for ith sublayer
By using the proposed correlation for mα in equations 4.2 and 4.3, the
formulations given in equations 4.6 and 4.7 were developed to predict the final
settlement of the soil. The representative functional forms that were used for the
development of the functional form of one dimensional constraint modulus mα :
∑=
=ΙΙ ⎥⎦
⎤⎢⎣⎡
×++∆×∆−=Θ∆∆
ni
i cicici
iioiiCicio qIq
HSHIqSg0 531 )))ln()ln(((
)(),,,,,(42 θθθ
σσ θθ)
(4.6)
∑=
=ΙΙΙΙ ⎥
⎦
⎤⎢⎣
⎡×
∆×∆−=Θ∆∆ni
i ciIq
iioiiCicio qe
HSHIqSgcc
0 1 ))((),,,,,( 43
2θθθθ
σσ)
(4.7) where
oS is the observed settlement in the field
ciI is the soil type index for ith sublayer
ΙΘ = (θ1,…., θ5) is the set of model parameters for exponential function
ΙΙΘ = (θ1,…., θ4) is the set of model parameters for logarithmic function
The limit state function given in equations 4.6 and 4.7 assume that the
compressibility behavior of soils can be completely explained by the two
descriptive variables of and . Obviously, there may exist additional
parameters that influence the compressibility behavior of soils. However, both the
observed field measurements and previous works such as Sanglerat (1972) and
Lunne and Christophersen (1983) on this subject indicate that is the most
significant parameters that affect the value of
cq cI
cq
mα . Based on this fact, and in order
to keep the proposed expression as simple as possible only these two parameters
were used. However, to account for the influences of the missing variables and the
possible deficiencies in the functional form, a random model correction term,ε was
introduced and limit state function was modified.
54
εθθθ
σσ θθ +⎥⎦⎤
⎢⎣⎡
×++∆×∆−=Θ∆∆ ∑
=
=ΙΙ
ni
i cicici
iioiiCicio qIq
HSHIqSg0 531 )))ln()ln(((
)(),,,,,(42
)
(4.8)
εθ
σσ θθθ +⎥⎦
⎤⎢⎣
⎡×
∆×∆−=Θ∆∆ ∑=
=ΙΙΙΙ
ni
i ciIq
iioiiCicio qe
HSHIqSgcc
0 1 ))((),,,,,( 43
2
)
(4.9)
),,( 51 θθ K=Ιθ is the set of model parameters for the logarithmic model,
and ),,( 41 θθ K=ΙΙθ is the set of model parameters for exponential model. For the
error terms in all models, it is reasonable and also convenient to assume that ε has
a normal distribution. With the aim of producing an unbiased model (i.e., one that,
in the average, makes the correct prediction), the mean of ε is set to zero. The
standard deviation of ε, denoted σε, however is unknown and must be determined.
The set of unknown parameters of the exponential and logarithmic models,
therefore, are and respectively. ),( εσΙΙ = θΘ ),( εσΙΙΙΙ = θΘ
4.3 FORMULATION OF LIKELIHOOD FUNCTION FOR CPT-BASED
COMPRESSIBILITY ASSESSMENT OF SOIL
Let and is the observed and predicted settlement values at the jjoS pjS th
location in the site, respectively. Let jε be the corresponding realization of the
model correction term. Assuming the observations compiled from different
locations at the field to be statistically independent, the likelihood function can be
written as the product of the probabilities of the observations:
[∏==
=∆∆=55
1jno SP
0),,,,,,(),( θθ jiiCicioj HIqSgPL εσσ ε ] (4.10)
Here it is assumed that the measured values , joS iσ∆ , , , at
each observation are exact, i.e., no measurement or estimation error is present.
Then, noting that
ciq ciI iH∆
jiiCiciojjiiCicioj HIqSgHIqSg εσεσ +∆∆=∆∆ ),,,,,(),,,,,,( θθ ) (4.11)
55

has a normal distribution with a mean of ),,,,,( θiiCicioj HIqSg σ∆∆) and standard
deviation of εσ , the likelihood function can be written as
∏= ⎥
⎥⎦
⎤
⎢⎢⎣
⎡ ∆∆=
55
1j
),,,,,,(),(
εσεσ
ϕεσθ
θ jiiCicioj HIqSgL (4.12)
where ][ ⋅ϕ is the standard normal probability density function. Note that
the above expression is a function of the unknown parameters and θ εσ .
Having formulated the likelihood function, the values of the unknown
model parameters ),,( 51 θθ K=Ιθ for exponential function, ),,( 41 θθ K=ΙΙθ for
logarithmic function and standard deviation εσ of the model error term ε , which
maximize the likelihood function, are computed. Table 4.1 and 4.2 summarize the
exponential and logarithmic models parameters of the CPT-based compressibility
assessment of soil limit state models.
Table 4-1 - Maximum likelihood estimates of logarithmic model parameters
for CPT-based compressibility assessment of soil
1θ -0.30
2θ 5.00
3θ -0.30
4θ 2.00
5θ 6.00
εσ 0.04
Ln (Max. likelihood
value) 45.08
56

Table 4-2 - Maximum likelihood estimates of exponential model parameters
for CPT-based compressibility assessment of soil
1θ 6.61
2θ -0.10
3θ 1.00
4θ 0.40
εσ 0.04
Ln(Max. likelihood
value) 45.32
4.4 PROPOSED NEW CORRELATIONS
If the model parameters given in Tables 4.1 and 4.2 are put into the
Equations 4.2 and 4.3, the final closed form of the correlations for mα becomes:
0 (4.13) .6)ln(3.0)ln(3.0 0.20.5 +−−= ccm Iqα
(4.14) )(1.0 4.0
6.6 cc Iqm e ×−=α
for the logarithmic and exponential cases, respectively.
4.4.1 Comparison of Settlement Values Obtained Using Logarithmic
Correlation with Field Measurements
The observed and the predicted values or several cases are plotted in Figure
4.1 together with xy = , 2xy = and xy 2= lines. The predicted settlements shown
in Figure 4.1 are calculated based on the logarithmic relation given above. When
the data points in Figure 4.1 are examined, it is observed that the predicted values
are close to the observed values and all the data points remain in the zone defined
57
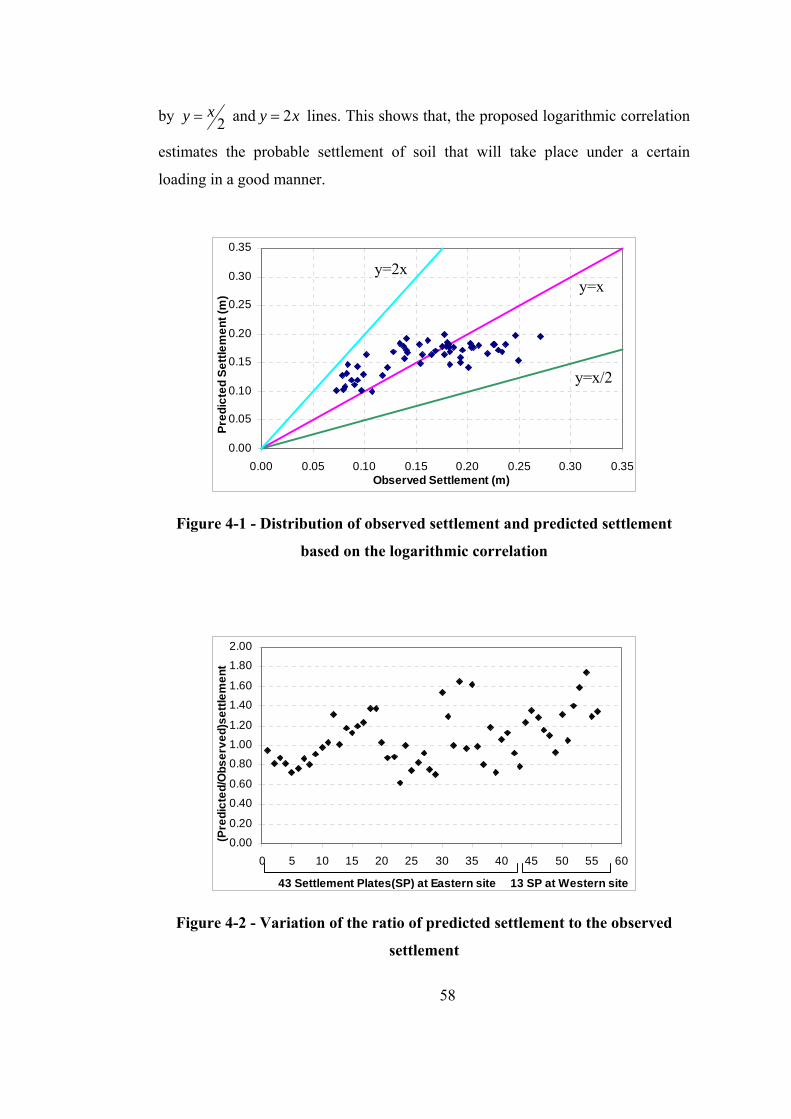
by 2xy = and lines. This shows that, the proposed logarithmic correlation
estimates the probable settlement of soil that will take place under a certain
loading in a good manner.
xy 2=
0.00
0.05
0.10
0.15
0.20
0.25
0.30
0.35
0.00 0.05 0.1
Pred
icte
d Se
ttlem
ent (
m)
x
Figure 4-1 - Distribution of
based on t
0.00
0.20
0.40
0.60
0.80
1.00
1.20
1.40
1.60
1.80
2.00
0 5 10 15
(Pre
dict
ed/O
bser
ved)
settl
emen
t
43 Settlement P
Figure 4-2 - Variation of the
y=2
0 0.15 0.20 0.25 0Observed Settlement (m)
2
observed settlement and pred
he logarithmic correlation
20 25 30 35 40 45 50
lates(SP) at Eastern site 13 SP at W
ratio of predicted settlement
settlement
58
y=x/
.3
ic
e
t
y=x
0 0.35
ted settlement
55 60
stern site
o the observed

The other way of the assessment of the predictions of logarithmic
correlation is the evaluating the ratio of the predicted settlement to the observed
settlement. Those ratios are plotted in Figure 4.2. The ratios of settlement values
generally fall in the range of 0.6 to 1.6. This figure shows that the proposed
logarithmic correlation underestimates the settlement at some observations and
also for the other observations overestimation can be seen.
4.4.2 Comparison of Settlement Values Obtained Using Exponential
Correlation with Field Measurements
The values of settlement based on the above correlation are calculated and
plotted with the measured settlement values at the field. This graph is presented in
Figure 4.3. For the assessment of the correctness of method, the most crucial point
is that, almost all of the predicted settlement values vs. observed settlement values
must fall in the zone defined by 2xy = and xy 2= lines. This observation is still
valid for the developed exponential correlation. The relationship between observed
and predicted settlement values for the exponential form is very similar to the one
for the logarithmic formulation.
0.00
0.05
0.10
0.15
0.20
0.25
0.30
0.35
0.00 0.05 0.10 0.15 0.20 0.25 0.Observed Settlement (m)
Pred
icte
d Se
ttlem
ent (
m)
y=2x
Figure 4-3 - Distribution of observed settlement and predi
based on the exponential correlation
59
y=x
30 0.35
y=x/2
cted settlement

The ratio of predicted settlement to the observed settlement for the
exponential form is shown in Figure 4.4.
0.00
0.20
0.40
0.60
0.80
1.00
1.20
1.40
1.60
1.80
2.00
0 5 10 15 20 25 30 35 40 45 50 55 60
(Pre
dict
ed/O
bser
ved)
settl
emen
t
43 Settlement Plates(SP) at Eastern site 13 SP at Western site
Figure 4-4 - Variation of the ratio of predicted settlement to the observed
settlement
Table 4-3 - Partial descriptive of developed two methods for observed and
predicted values of settlement
Proposed methods Sp/So
mean 1.02
St. dev 0.24 cov 0.24
Exponential method
Ln(Max.likelihood value) 45.32
mean 1.07
St.dev 0.27 cov 0.25
Logarithmic method
Ln(Max.likelihood value) 45.08
The proposed correlations can be compared by focusing on the values of
mean, standard deviation and coefficient of variation (COV) of the ratio of
60

predicted to observed settlement values. When the results presented in Table 4.3
for exponential and logarithmic relations are evaluated; it is observed that the
values of COV and standard deviation of exponential function is smaller than the
logarithmic function. Once the maximum likelihood values given in Table 4.3 are
evaluated, the value for exponential model is slightly higher than the logarithmic
one. Hence, it can be stated proposed exponential correlation works better than the
other for the purpose of the settlement calculation. On the other hand, the
difference is too small and proposed two different relations give logical and
consistent results with the observed settlement plate readings.
4.5 VALIDATION OF PROPOSED CORRELATIONS
In order to check the efficiency of the proposed models, settlement values
were calculated for three different points, which were not used in the regression
analyses. These points are located at the Bursa West Waste Water Treatment Plant
site. Values of settlements observed from the developed models were compared
with the observed settlements at the site.
Figure 4-5 - Geometry of surcharge area of the selected validation cases
61

Soil profile for the selected site and the change in the effective stresses due
to the applied preloading were obtained form CPT data and Flac 3D analysis
respectively. The geometry of the surcharge area is presented in Figure 4.5 and the
related Flac 3D model was generated for this applied loading. Having the soil
profile and change in the vertical stresses at hand, the compressibility of the soil
was evaluated by the proposed models. Thus, the final settlement can be
computed. In Table 4.4, the settlement values obtained from the proposed models
and the observed settlements are given together with the ratio of predicted to
observed values. As it was observed from this table, the calculated settlement
values are close to the observed ones, supporting the reliability of the proposed
methods.
Table 4-4 - Comparison of the observed and predicted settlement values
SP17 SP18 SP19
Observed Settlement (m)
0.09 0.16 0.09
Predicted Settlement by
exponential (m) 0.11 0.14 0.11
Predicted/Observed 1.22 0.90 1.22
Predicted Settlement by
Logarithmic (m) 0.13 0.16 0.12
Predicted/Observed 1.40 1.00 1.33
The ratio of predicted to observed settlement values for these three cases
are presented in Figure 4.6 together with the ratios of others. After this figure was
evaluated, it was observed that the ratios of these three points fall in the range of
0.6 to 1.6. That observation is compatible with the general trend of that model. In
the same way, the observed and predicted values are plotted together with the
values of other cases in Figure 4.7. This figure shows that observed settlement
62

values for three validation points fall in the zone defined by 2xy = and xy 2=
lines. This observation is also valid for the developed logarithmic correlation. All
of those observations support the reliability of the proposed correlations.
0.00
0.20
0.40
0.60
0.80
1.00
1.20
1.40
1.60
1.80
2.00
0 5 10 15 20 25 30 35 40 45 50 55 60
(Pre
dict
ed/O
bser
ved)
settl
emen
t
43 Settlement plates(SP) at Eastern site 13 SP at Western site
Figure 4-6 - Variation of the ratio of predicted settlement by exponential
model to the observed settlement
0.00
0.05
0.10
0.15
0.20
0.25
0.30
0.35
0.00 0.05 0.1
Pred
icte
d Se
ttlem
ent (
m)
Figure 4-7 - Distribution of o
ex
y=2x
0 0.15 0.20 0.25 0.3Observed Settlement (m)
x
2
bserved and predicted settlemen
ponential correlation
63
y=x/
y=
3 validation points
3 validation points
0 0.35
t based on the

4.6 SUMMARY OF DEVELOPED CORRELATIONS
In this study two correlations were proposed to predict the coefficient of
one dimensional constrained modulus mα . Proposed exponential and logarithmic
correlations’ results are presented in Table 4.5 and 4.6. These tables show that
estimations of coefficient mα for typical normally consolidated soils.
Table 4-5 - Estimations of coefficient mα for different soil types according to
the proposed exponential correlation
Soil Behavior Type Index, CI Soil Behavior Type
The Range of coefficient mα
Typicalvalue
CI <1.31 Gravelly sand to dense sand mα <3.0 1.5 1.31< <2.05 CI Sands: clean sand to silty sand 5.0< mα <2.5 4.0 2.05< <2.60 CI Sand Mixtures: silty sand 6.0< mα <4.0 5.0 2.60< <2.95 CI Silt Mixtures: clayey silt to silty clay 6.5< mα <5.5 6.0 2.95< <3.60 CI Clays: silty clay to clay 7.5< mα <6.0 6.5
2.95< <3.60 CI Over consolidated Clays: silty clay to clay
5.5< mα <3.5 4.5
3.60< CI Organic soils: peats mα >6.0 6.5
Table 4-6 - Estimations of coefficient mα for different soil types according to
the proposed logarithmic correlation
Soil Behavior Type Index, CI Soil Behavior Type
The Range of coefficient mα
Typicalvalue
CI <1.31 Gravelly sand to dense sand mα <3.0 1.5 1.31< <2.05 CI Sands: clean sand to silty sand 5.0< mα <2.5 4.0 2.05< <2.60 CI Sand Mixtures: silty sand 6.0< mα <3.5 4.8 2.60< <2.95 CI Silt Mixtures: clayey silt to silty clay 7.0< mα <5.0 6.0 2.95< <3.60 CI Clays: silty clay to clay 9.0< mα <6.5 7.5
2.95< <3.60 CI Over consolidated Clays: silty clay to clay
5.5< mα <3.0 4.5
3.60< CI Organic soils: peats mα >7.0 7.5
64

CHAPTER 5
SUMMARY AND CONCLUSION
5.1 SUMMARY
One of the most critical problems a geotechnical engineer confronts with is
the determination of the amount of consolidation settlement that will occur at a site
as a result of the construction of a structure. If excessive settlements are expected
due to the weight of the structure, precautions must be taken to prevent these
excessive settlements. The compressibility behavior of the soil is an important
parameter in determining the amount of consolidation settlement. The
compressibility of the soil may be estimated using correlations based on laboratory
results. However, the laboratory tests may not yield reliable results due to some
reasons such as the possible disturbances introduced during sampling. Thus, using
field data for the estimation of the compressibility of soils may be a more
convenient way. The main objective of this study was to develop a correlation
between the compressibility behavior of soil and in-situ test data, especially CPT.
Of the in-situ tests available, Cone Penetration Test (CPT) was used in this
study. The main reason under this selection is the ability of CPT to supply
continuous data about the soil.
First of all, a database composed of the results of 45 CPT and 57 settlement
plate recordings was obtained from the Bursa East and West Waste Water
Treatment Plants soil investigation projects. The data obtained from the CPT
65

results include cone tip resistance (qc) and friction sleeve resistance (fs). These data
were then used to determine the soil behavior type index (Ic) and finally the soil
profiles at the test locations.
After the compilation of this database, a series of finite difference analyses
were carried out using the commercial software FLAC 3D. The change in stress
distribution under the settlement plates were computed using these analyses.
Then, two correlations were developed for the computation of the one-
dimensional constraint modulus, M. One of them is of logarithmic form and the
other one is exponential. These correlations are based on the cone tip resistance
(qc), soil behavior type index (Ic) and a number of model parameters (five in case
of logarithmic expression and four in case of exponential). The values of these
model parameters were computed by carrying out a regression analysis which uses
the settlement values recorded at the site and those computed using the change in
the stress distribution, the thickness of the sublayers and the proposed one-
dimensional constraint modulus. The maximum likelihood method was utilized in
the regression analyses carried out within the scope of this study.
5.2 CONCLUSION AND OBSERVATIONS
• Compressibility of soils can be estimated thought the use of one
dimensional constraint modulus, M, which can be estimated as a
function of cone tip resistance, qc, and coefficient of constraint
modulus, mα .
mcqM α×= (5.1)
As a part of these studies, mα can be estimated by equation 5.2 or as
given in Table 5.1. )(1.0 4.0
6.6 cc Iqm e ×−=α (5.2)
66

Table 5-1 - Estimations of coefficient mα for different soil types according to
the proposed exponential correlation
Soil Behavior Type Index, CI Soil Behavior Type
The Range of coefficient mα
Typicalvalue
CI <1.31 Gravelly sand to dense sand mα <3.0 1.5 1.31< <2.05 CI Sands: clean sand to silty sand 5.0< mα <2.5 4.0 2.05< <2.60 CI Sand Mixtures: silty sand 6.0< mα <4.0 5.0 2.60< <2.95 CI Silt Mixtures: clayey silt to silty clay 6.5< mα <5.5 6.0 2.95< <3.60 CI Clays: silty clay to clay 7.5< mα <6.0 6.5
2.95< <3.60 CI Over consolidated Clays: silty clay to clay
5.5< mα <3.5 4.5
3.60< CI Organic soils: peats mα >6.0 6.5
• Both of the proposed correlations can estimate the settlement values
by a factor of maximum 1.25. These proposed correlations are
believed to be calibrated in the settlement range 0-30 cm.
• The cone tip resistance and soil behavior type index are very
significant parameters that affect the compressibility behavior of
soils.
• Three settlement plate records, which were not used in regression
analyses, were used as validation cases. The settlement predictions
at these validation cases were proved to be accurate within a factor
of 1.25.
• One of the most important benefits of this study is that, the
proposed correlations in this study take the effect of the variations
in the soil type throughout the depth in contrast to the available
methods which assume that all the soil profile is composed of a
single soil type.
5.3 RECOMMENDATIONS
• The proposed correlations may be improved using a larger database
which includes data from various sites.
67

• The settlement plate records used in this study give the settlement
of the site as a whole. If the settlement value of each sublayer is
recorded and used, an improvement in the proposed correlations can
be achieved.
68

REFERENCES
Asaoka, A. (1978), “Observational Procedure of Settlement Prediction”,
Soils and Foundations, Vol.18, pp. 87-100.
Campanella, R.G., Gillespie, D. and Robertson, P.K. (1982), “Pore
Pressures During Cone Penetration Testing”, Proceedings, 2nd European
Symposium on Penetration Testing, ESOPT II, pp.507-512.
Craig, R.F. (1987), Soil Mechanics, ELBS Edition (UK), England.
Das, B.V. (1983), Advanced Soil Mechanics, McGraw-Hill Book
Company, New York
Feda, J. (1978), Stress in Subsoil and Methods of Final Settlement
Calculation, Elsevier Scientific Publishing Company, New York
Furmonavicius L., Dagys A. (1995), “Cone Penetration Testing In
Lithuania”, International Symposium on Cone Penetration Testing, Vol.1, pp.125-
131, Linköping, Sweden.
Horn, A. (1983), “Determination of Properties of Weak Soils by Test
Embankments”, International Symposium on Soil and Rock Investigations by In-
situ Testing, Paris, Vol.2, pp.61-66.
Jefferies, M.G. and Davies M.P. (1993)”, Use of CPTu to Estimate
Equivalent SPT N60”, Geotechnical Testing Journal, Vol.16, pp.458-467.
69

Jones, G.A. and Rust, E. (1995), “Piezocone Settlement Prediction
Parameters for Embankments on Alluvium”, Proceedings of the International
Symposium on Cone Penetration Testing, CPT’95, Linköping, Sweden, Vol.2,
pp.501-508, Swedish Geotechnical Society.
Kaplan, N., Cakan, G. and Erol, A.O. (2004), “Plastik Killerde Ödometrik
Deformasyon Modülünün CPT Uç Direncinden Tahmini”, Zemin Mekaniği ve
Temel Mühendisliği Onuncu Ulusal Kongresi, Istanbul Teknik Üniversitesi,
Istanbul.
Kulhawy, F.H. and Mayne, P.H. (1990), “Manual on Estimating Soil
Properties for Foundation Design”, Electric Power Research Institute, EPRI,
August, 1990.
Lunne, T. and Christophersen, H.P. (1983), “Interpretation of Cone
Penetrometer Data for Offshore Sands”, Proceedings of the Offshore Technology
Conference, Richardson, Texas, Paper No. 4464.
Lunne, T., Robertson, P.K. and Powell, J.J.M. (1997), “Cone Penetration
Testing in Geotechnical Practice”, Blackie Academic& Professionals
Mahesh, D. and Vikash, J. (1995), “State of Art of CPT in India”,
International Symposium on Cone Penetration Testing, Vol.1, pp.87-95 Linköping,
Sweden.
Manas, S. and Linaresh, H. (1995), “The use of Cone Penetration Testing
in Spain (NR4)”, International Symposium on Cone Penetration Testing, Vol.1,
pp.213-220, Linköping, Sweden.
70

NCEER (1997), “Proceedings of the NCEER Workshop on Evaluation of
Liquefaction Resistance of Soils”, Edited by Youd, T. L., Idriss, I. M., Technical
Report No. NCEER-97-0022, December 31, 1997.
Olsen, R.S. (1994), “Normalization and Prediction of Geotechnical
Properties using Cone Penetration Test (CPT)”, Ph.D. Dissertation, University of
California, Berkeley, CA.
Olsen, R.S. and Mitchell, J.K. (1995), “CPT Stress Normalization and
Prediction of Soil Classification”, Proceedings of the International Symposium on
Cone Penetration Testing, CPT’95, Linköping, Sweden, Vol.2, pp.257-262,
Swedish Geotechnical Society.
Robertson, P.K. (1990), “Soil Classification using the Cone Penetration
Test”, Canadian Geotechnical Journal, Vol.27 (1), pp.151-158.
Robertson, P.K. and Wride, C.E. (1997), “Cyclic Liquefaction and its
Evaluation Based on the SPT and CPT”, Proceedings of NCEER Workshop on
Evaluation of Liquefaction Resistance of Soils, National Center For Earthquake
Engineering Research State University of New York at Buffalo.
Sanglerat, G. (1972), “The Penetrometer and Soil Exploration”, Elsevier,
Amsterdam, pp. 464
Senneset, K., Janbu, N. and Svano, G. (1982), “Strength and Deformation
Parameters from Cone Penetration Tests”, Proceedings of the 2nd Europen
Symposium on Penetration Testing, ESOPT-II, Amsterdam, 2, 863-70, Balkema
Pub., Rotterdam.
71

Senneset, K., Sandven, R. and Janbu, N. (1989), “The Evaluation of Soil
Parameters from Piezocone Tests”, Transportation Research record, No. 1235,
pp.24-37.
Terzaghi, K. (1947), Theoretical Soil Mechanics, Chapman and Hall,
Limited John Wiley and Sons, Inc New York.
72

APPENDIX A
73

İNŞAAT VE TİCARET ANONİM. ŞTİ.
Figure A1 - CPT Layout of Bursa East Waste Water Treatment Plant
74

MURAT KART
YUSUF KURU
FERIDE GÖKALP
20/05/2003
20/05/2003
20/05/2003
1 20/05/2003 Genel Revizyon Feride Gökalp2 20/08/2003 Genel Revizyon Feride Gökalp
Figure A2 - SP Layout of Bursa East Waste Water Treatment Plant Project
75

İNŞAAT VE TİCARET ANONİM. ŞTİ.
Figure A3 - CPT Layout of Bursa West Waste Water Treatment Plant Project
76

TRAFO
TRANSFORMERBUILDING
21
02
22
10
1723
09
16
03
BURSA SU VE KANALİZASYON İDARESİ
GENERAL LAYOUTWESTERN WASTEWATER TREATMENT PLANT
BURSA ATIKSU PROJESİBURSA WASTEWATER PROJECT
İNŞAAT VE TİCARET ANONİM. ŞTİ.
BATI ATIKSU ARITMA TESİSİ
APPROVED BY
CHECKED BYKONTROL
ONAY10/03/03
10/03/03
SGORBINI
MAMBREANI
YAPANDESIGNED BY
ÇİZENDRAWN BY 10/03/03
10/03/03
DATETARİH
C.S.A.
C.S.A.
NAME SURNAMEADI SOYADI
SIGNATUREİMZA
GENEL YERLEŞİM PLANI
PROJE ADITITLE
GENEL MÜDÜRLÜĞÜ
D-200-001/3
1:1000
RESİM NO / DRAWING NO
REVİZYONREVISION
ÖLÇEKSCALE
3
BURSA BÜYÜKŞEHİR BELEDİYESİ
ONAYLANMIŞTIR / APPROVED
BUSKİ
T.C.
İNCELENMİŞTİR / REVIEWED
Rev. No.Rev. No.
10
DateTarih Açıklama
Remarks
C.S.A.C.S.A.
NameYapan
C.S.A.2
15 15
15
A08
08B
08D
04
04
A
B
YANGIN BİNASI23 FIREFIGHTING BUILDING
HAVA ARITMA SİSTEMİ24 SCRUBBER FOR AIR TREATMENT
21 YEDEK JENERATÖR
YAKIT TANKI 22
TRAFO VE DAĞITMA BİNASI20
STANBY GENERATOR
FUEL TANK
TRANSFORMERS AND DISTRIBUTION
BLOVER BİNASI
KONTROL BINASI19
18
17
16 C YAPISI
CONTROL BUILDING
BLOWER HOUSE
CHAMBER C
SON ÇÖKTÜRME TANKALARI08(A:B) FINAL SEDIMENTATION TANKS
12 ÇAMUR TANKI SLUDGE BUFFER TANK
KÖPÜK POMPA İSTASIONU
TOPLAMA ÇUKURU
14
15
13(A:B)
SCUM PUMPING STATION
COLLECTION CHAMBER
G.A.C. POMPA İSTASYONU 10
ÇAMUR IZGARA YAPISI11
G.A.C. TOPLAMA YAPISI09
R.A.S. PUMPING STATION
SLUDGE SCREEN UNIT
R.A.S. COLLECTION CHAMBER
ANAEROBİK TANK04(A:B) ANAEROBIC TANK
06
ANA DAĞITMA ODASI07
HAVALANDIRMA TANKI05(A:H)
MAIN DISTRIBUTION CHAMBER
AERATION TANK
YENİ GİRİŞ POMPA İSTASYONU
SELEKTÖR TANK03
A YAPISI02
01
SELECTOR TANK
NEW INLET PUMPING STATION
CHAMBER A
I N D E XPOS. DESCRICTION
(TURKISH/ENGLISH)
1 - F.G.L. : FINAL GROUND LEVEL
C.S.A.3
DISEGNODATAPLT
Figure A4 – SP Layout of Bursa West Waste Water Treatment Plant Project
77

APPENDIX B
78
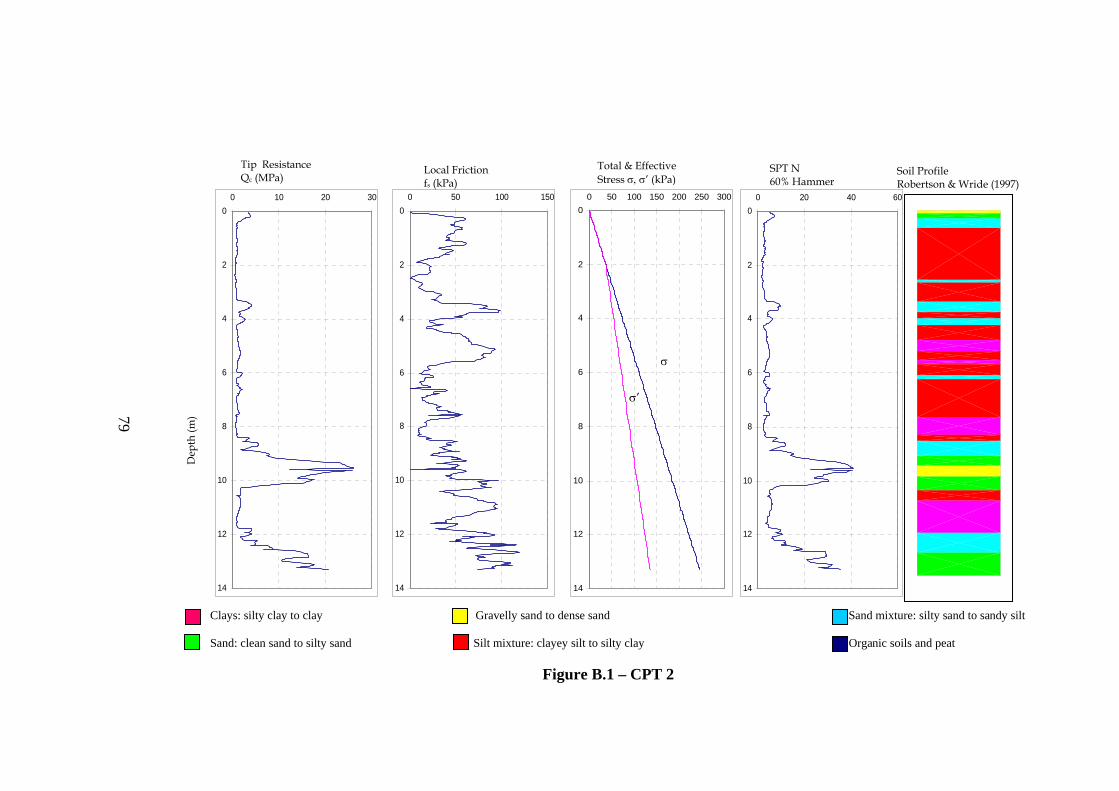
Tip Resistance Qc (MPa)
Total & Effective Stress σ, σ’ (kPa)
SPT N 60% Hammer
79
0
2
4
6
8
10
12
14
0 10 20 300
2
4
6
8
0 100 15050
Local Friction fs (kPa)
0
2
4
6
8
0 50 100 150 200 250 3000
2
4
6
8
0 20 40 60
Soil Profile Robertson & Wride (1997)
σ
σ’
Dep
th (m
)
Clays: silty clay to cla Sand: clean sand to si
10 10 10
y
lty sand
12
14
12
14
12
14
Figure B.1 – CPT 2
Gravelly sand to dense sand Sand mixture: silty sand to sandy silt
Silt mixture: clayey silt to silty clay Organic soils and peat

80
Soil Profile Robertson & Wride (1997)
Tip Resistance Qc (MPa)
Total & Effective Stress σ, σ’ (kPa)
SPT N 60% Hammer
Local Friction fs (kPa)
0
2
4
6
8
10
12
14
16
18
20
0 5 10 15 200
2
4
6
8
10
12
0 50 100 150 2000
2
4
6
8
10
12
0 100 200 300 400
0
2
4
6
8
10
12
0 10 20 30 40
σ
Dep
th (m
)
σ’
Clays: silty clay to clay Sand: clean sand to silty sa
14
16
18
20
14 14
nd
16
18
20
16
18
20
Gravelly sand to dense sand Sand mixture: silty sand to sandy silt
Silt mixture: clayey silt to silty clay Organic soils and peat
Figure B.2 – CPT 2a

Local Friction fs (kPa)
Soil Profile Robertson & Wride (1997)
Tip Resistance Qc (MPa)
Total & Effective Stress σ, σ’ (kPa)
SPT N 60% Hammer
0
2
4
6
8
10
12
14
16
18
20
0 10 20 300
2
4
6
8
10
12
14
16
18
20
0 100 200 3000
2
4
6
8
10
12
14
0 100 200 300 4000
2
4
6
8
10
12
14
0 20 40 60
σ
81
Dep
th (m
)
σ
Clays: silty clay to clay Sand: clean sand to silty sand
16
18
20
16
18
20
Gravelly sand to dense sand Sand mixture: silty sand to sandy silt
Silt mixture: clayey silt to silty clay Organic soils and peat
Figure B.3 – CPT 3
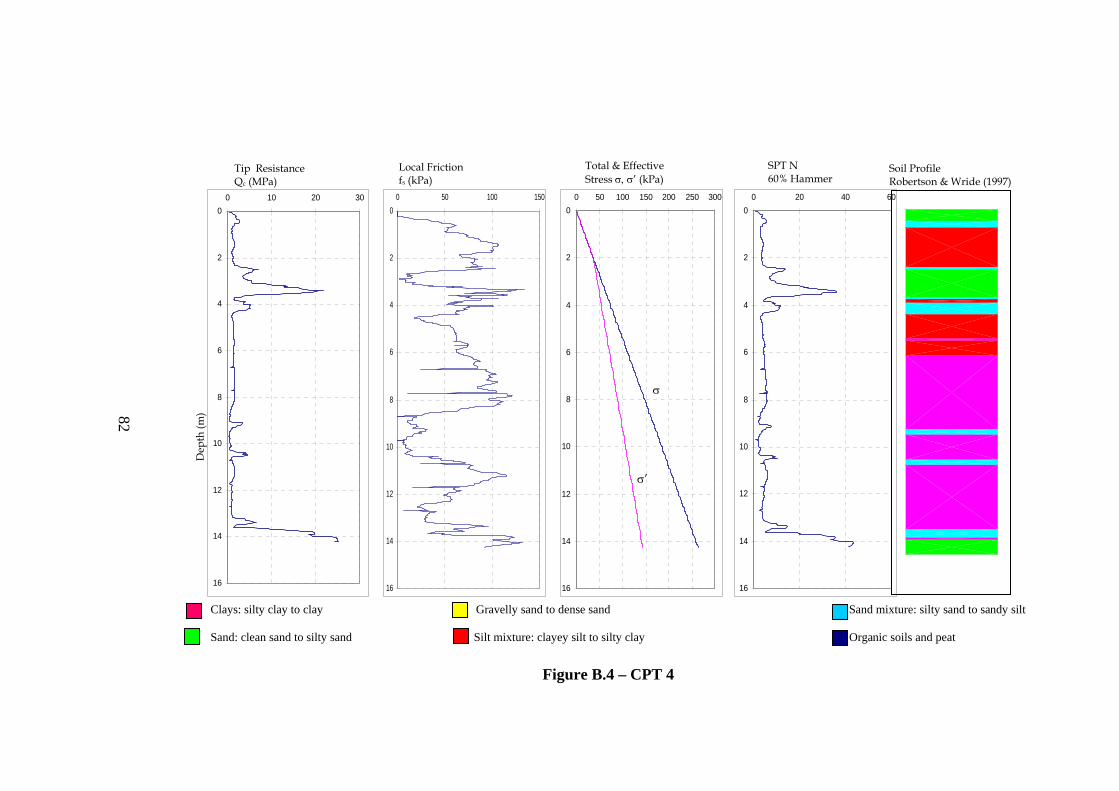
0
2
4
6
8
10
12
14
16
0 10 20 300
2
4
6
8
10
0 50 100 1500
2
4
6
8
10
0 50 100 150 200 250 3000
2
4
6
8
10
0 20 40 60
σ
Tip Resistance Qc (MPa)
Local Friction fs (kPa)
Total & Effective Stress σ, σ’ (kPa)
SPT N 60% Hammer
Soil Profile Robertson & Wride (1997)
Dep
th (m
) 82
Clays: silty clay to clay Sand: clean sand to silty san
12
14
16
σ’
d
12
14
16
12
14
16
Gravelly sand to dense sand Sand mixture: silty sand to sandy silt
Silt mixture: clayey silt to silty clay Organic soils and peat
Figure B.4 – CPT 4

SPT N 60% Hammer
Local Friction fs (kPa)
Soil Profile Robertson & Wride (1997)
83
0
2
4
6
8
10
12
14
0 5 10 15 200
2
4
6
8
0 50 100 150 2000
2
4
6
8
10
0 100 200 3000
2
4
6
8
10
0 10 20 30 40
Total & Effective Stress σ, σ’ (kPa)
Tip Resistance Qc (MPa)
σ
Dep
th (m
)
Clays: silty clay to clay Sand: clean sand to silty sand
10
12
14
12
14
12
14
σ’
Gravelly sand to dense sand Sand mixture: silty sand to sandy silt
Silt mixture: clayey silt to silty clay Organic soils and peat
Figure B.5 – CPT 5

Local Friction fs (kPa)
Soil Profile Robertson & Wride (1997)
Total & Effective Stress σ, σ’ (kPa)
SPT N 60% Hammer
Tip Resistance Qc (MPa)
0
2
4
6
8
10
12
14
16
18
20
22
0 5 10 15 200
2
4
6
8
10
12
14
0 50 100 150 200 2500
2
4
6
8
10
12
14
16
0 100 200 300 400 5000
2
4
6
8
10
12
14
16
0 10 20 30 40
σ 84
Dep
th (m
)
σ’
Clays: silty clay to clay Sand: clean sand to silty sand
16
18
20
22
18 18
20
22
20
22
Figure B.6 – CPT 6
Gravelly sand to dense sand Sand mixture: silty sand to sandy silt
Silt mixture: clayey silt to silty clay Organic soils and peat
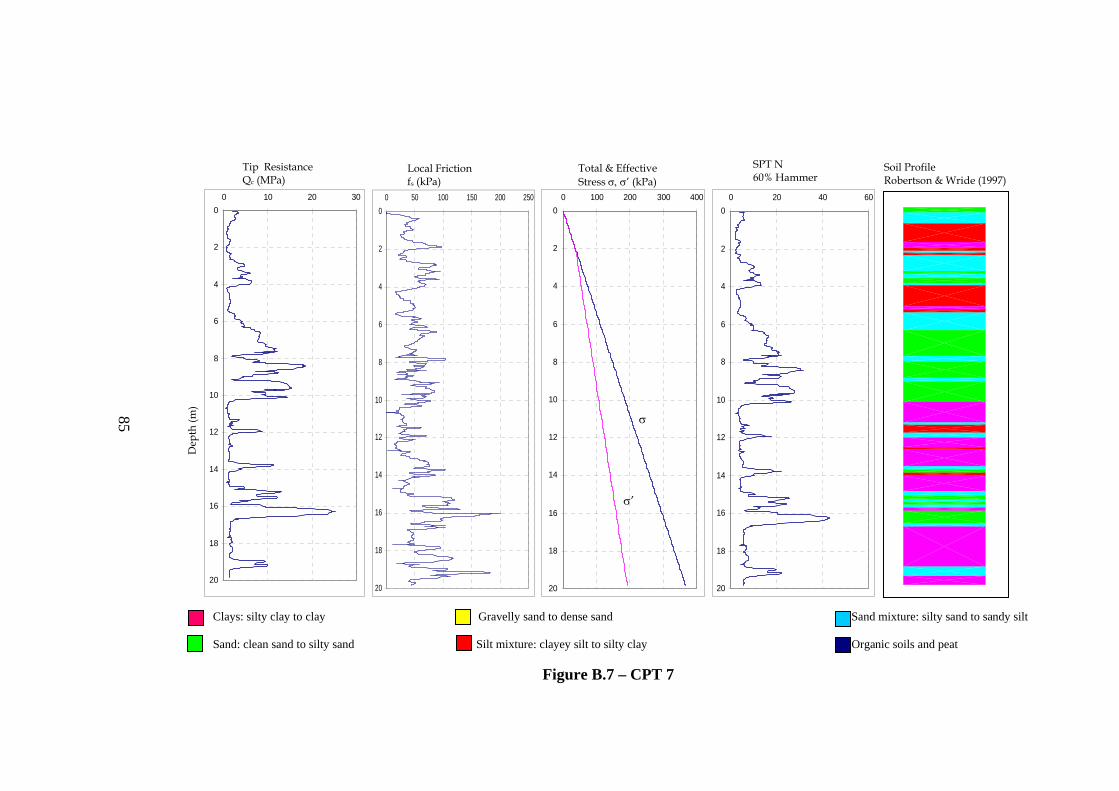
SPT N 60% Hammer
Tip Resistance Qc (MPa)
Soil Profile Robertson & Wride (1997)
Total & Effective Stress σ, σ’ (kPa)
Local Friction fs (kPa)
0
2
4
6
8
10
12
14
16
18
20
0 10 20 300
2
4
6
8
10
12
14
0 50 100 150 200 2500
2
4
6
8
10
12
14
0 100 200 300 4000
2
4
6
8
10
12
14
0 20 40 60D
epth
(m) 85 σ
Clays: silty clay to clay Sand: clean sand to silty sand
16
18
20
σ’
16
18
20
16
18
20
Figure B.7 – CPT 7
Gravelly sand to dense sand Sand mixture: silty sand to sandy silt
Silt mixture: clayey silt to silty clay Organic soils and peat
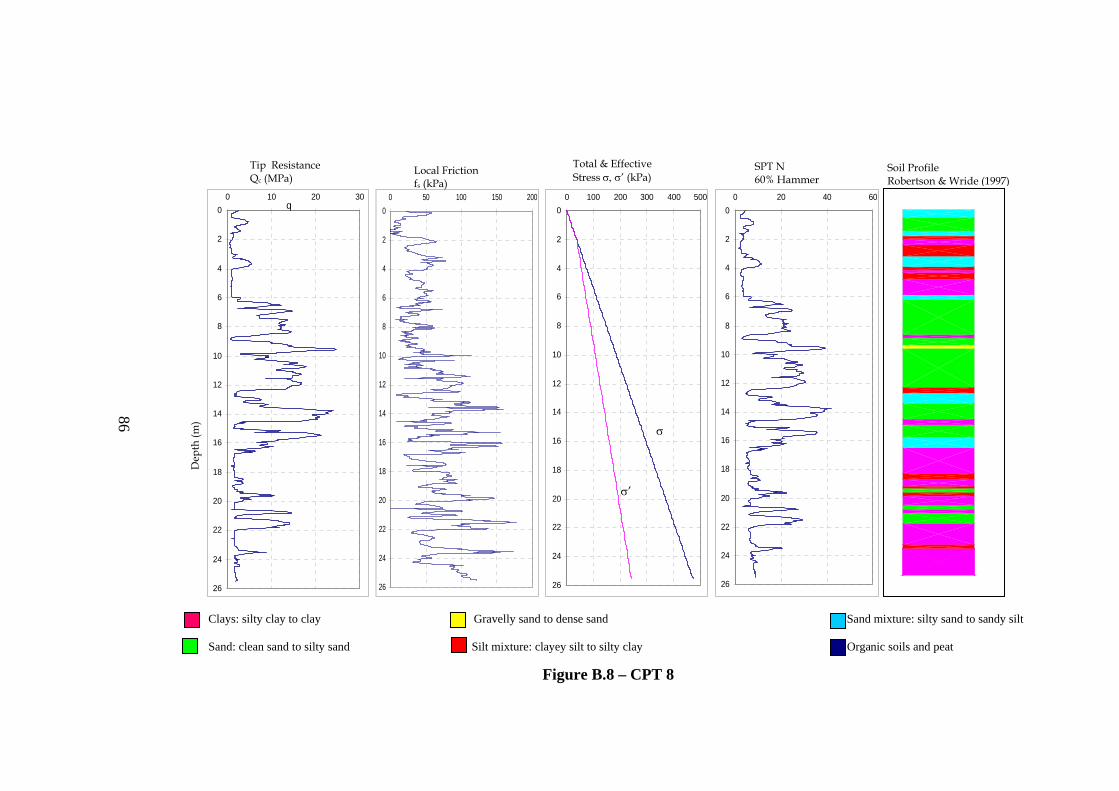
Total & Effective Stress σ, σ’ (kPa)
Tip Resistance Qc (MPa)
SPT N 60% Hammer
86
q0
2
4
6
8
10
12
14
16
18
20
22
24
26
0 10 20 300
2
4
6
8
10
12
14
16
18
20
22
24
26
0 50 100 150 2000
2
4
6
8
10
12
14
16
0 100 200 300 400 5000
2
4
6
8
10
12
14
16
18
0 20 40 60
Soil Profile Robertson & Wride (1997)
Local Friction fs (kPa)
Dep
th (m
)
σ
Clays: silty clay to clay Sand: clean sand to silty sand
18
20 20σ’
22
24
26
22
24
26
Figure B.8 – CPT 8
Gravelly sand to dense sand Sand mixture: silty sand to sandy silt
Silt mixture: clayey silt to silty clay Organic soils and peat
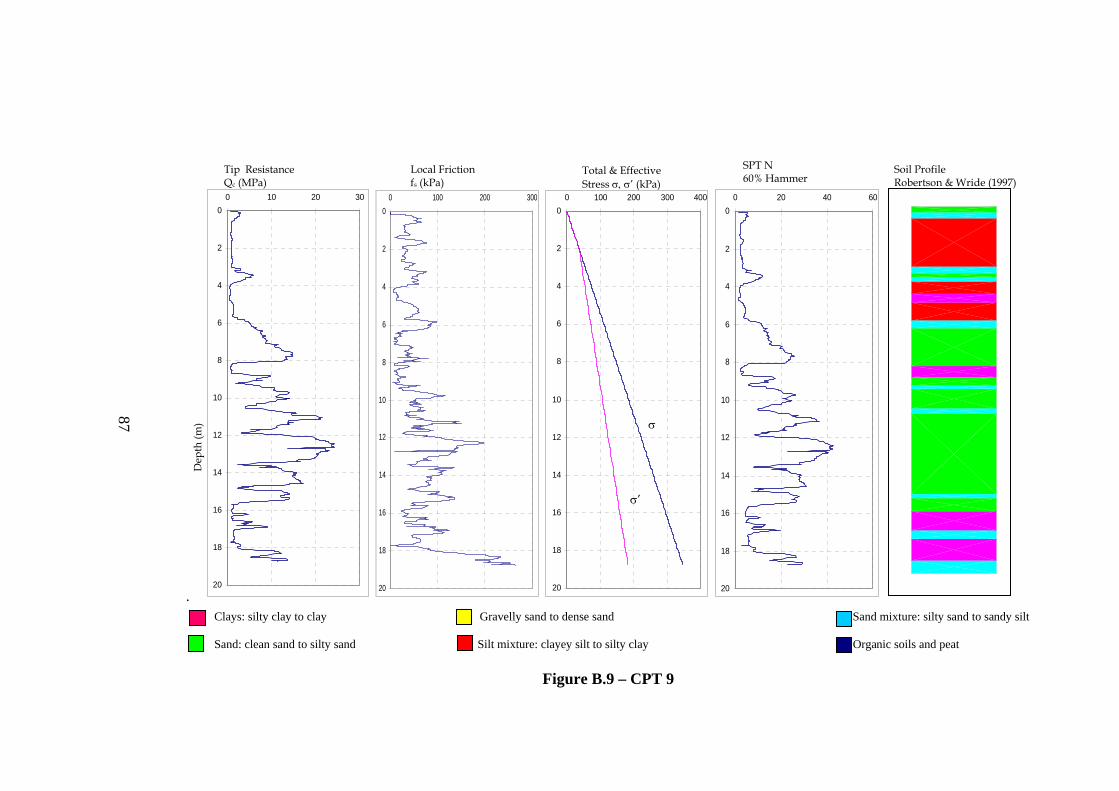
SPT N 60% Hammer
87
.
0
2
4
6
8
10
12
14
16
18
20
0 10 20 300
2
4
6
8
10
12
0 100 200 3000
2
4
6
8
10
12
14
0 100 200 300 4000
2
4
6
8
10
12
14
0 20 40 60
Soil Profile Robertson & Wride (1997)
Tip Resistance Qc (MPa)
Local Friction fs (kPa)
Total & Effective Stress σ, σ’ (kPa)
σ
Dep
th (m
)
Clays: silty clay to clay Sand: clean sand to silty sand
14
16
18
20
16
18
20
16
18
20
σ’
Gravelly sand to dense sand Sand mixture: silty sand to sandy silt
Silt mixture: clayey silt to silty clay Organic soils and peat
Figure B.9 – CPT 9

Total & Effective Stress σ, σ’ (kPa)
Soil Profile Robertson & Wride (1997)
SPT N 60% Hammer
Tip Resistance Qc (MPa)
Local Friction fs (kPa)
0
2
4
6
8
10
12
14
16
18
20
22
0 10 20 300
2
4
6
8
10
12
14
0 50 100 150 200 2500
2
4
6
8
10
12
14
0 100 200 300 400
0
2
4
6
8
10
12
14
0 10 20 30 40
σ88
Dep
th (m
)
Clays: silty clay to clay Sand: clean sand to silty sand
16
18
20
22
16 σ’
18
20
22
16
18
20 Gravelly sand to dense sand Sand mixture: silty sand to sandy silt
Silt mixture: clayey silt to silty clay Organic soils and peat
Figure B.10 – CPT 10

Total & Effective Stress σ, σ’ (kPa)
Soil Profile Robertson & Wride (1997)
Tip Resistance Qc (MPa)
Local Friction fs (kPa)
SPT N 60% Hammer
0
2
4
6
8
10
12
14
16
18
20
0 5 10 15 200
2
4
6
8
10
12
0 50 100 150 2000
2
4
6
8
10
12
14
0 100 200 300 4000
2
4
6
8
10
12
14
0 10 20 30 40
89 σ
Dep
th (m
)
σ’
Clays: silty clay to clay Sand: clean sand to silty sand
14
16
18
20
16
18
20
16
18
20
Gravelly sand to dense sand Sand mixture: silty sand to sandy silt
Silt mixture: clayey silt to silty clay Organic soils and peat
Figure B.11 – CPT 11

Tip Resistance Qc (MPa)
Local Friction fs (kPa)
Soil Profile Robertson & Wride (1997)
90
0
2
4
6
8
10
12
0 10 20 300
2
4
6
8
0 50 100 150 200 2500
2
4
6
8
0 100 200 3000
2
4
6
8
0 10 20 30 40
Total & Effective Stress σ, σ’ (kPa)
SPT N 60% Hammer
σ
Dep
th (m
)
Clays: silty clay to clay Sand: clean sand to silty sa
10
12
σ’
nd
10
12
10
12
Gravelly sand to dense sand Sand mixture: silty sand to sandy silt
Silt mixture: clayey silt to silty clay Organic soils and peat
Figure B.12 – CPT 12
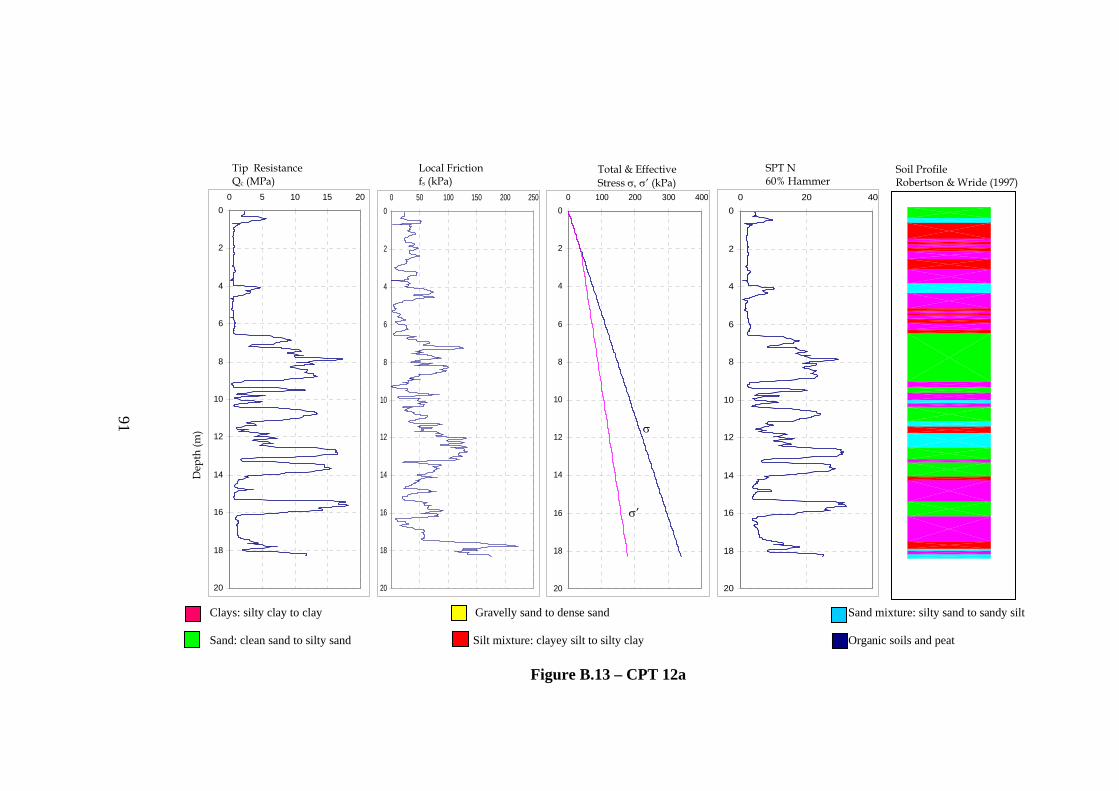
SPT N 60% Hammer
Tip Resistance Qc (MPa)
Local Friction fs (kPa)
Soil Profile Robertson & Wride (1997)
91
0
2
4
6
8
10
12
14
16
18
20
0 5 10 15 200
2
4
6
8
10
12
1
1
1
2
0 50 100 150 200 2500
2
4
6
8
10
12
14
0 100 200 300 4000
2
4
6
8
10
12
14
0 20 40
Total & Effective Stress σ, σ’ (kPa)
σ
Dep
th (m
)
Clays: silty clay to clay Sand: clean sand to silty sand
4
6
8
0
16
18
20
16
18
20
σ’
Gravelly sand to dense sand Sand mixture: silty sand to sandy silt
Silt mixture: clayey silt to silty clay Organic soils and peat
Figure B.13 – CPT 12a

92
Soil Profile Robertson & Wride (1997)
Total & Effective Stress σ, σ’ (kPa)
Local Friction fs (kPa)
SPT N 60% Hammer
Tip Resistance Qc (MPa)
0
1
2
3
4
5
6
7
8
0 10 20 30 400
1
2
3
4
5
6
7
8
0 50 100 1500
1
2
3
4
5
6
0 100 2000
1
2
3
4
5
6
0 20 40 60D
epth
(m)
σ
Clays: silty clay to clay Sand: clean sand to silty sand
7
8
7
8
σ’
Figure B.14 – CPT 13
Gravelly sand to dense sand Sand mixture: silty sand to sandy silt
Silt mixture: clayey silt to silty clay Organic soils and peat

Local Friction fs (kPa)
SPT N 60% Hammer
Soil Profile Robertson & Wride (1997)
Total & Effective Stress σ, σ’ (kPa)
Tip Resistance Qc (MPa)
0
1
2
3
4
5
6
7
8
9
0 10 20 30 400
1
2
3
4
5
6
0 50 100 150 2000
1
2
3
4
5
6
0 100 2000
1
2
3
4
5
6
0 20 40 60
σ 93
Dep
th (m
)
Clays: silty clay to clay Sand: clean sand to silty sand
7
8
9
σ’
7
8
9
7
8
9
Gravelly sand to dense sand Sand mixture: silty sand to sandy silt
Silt mixture: clayey silt to silty clay Organic soils and peat
Figure B.15 – CPT 13a

SPT N 60% Hammer
Tip Resistance Qc (MPa)
Local Friction fs (kPa)
Total & Effective Stress σ, σ’ (kPa)
Soil Profile Robertson & Wride (1997)
0
5
10
15
20
25
0
5
10
15
0 50 100 150 2000
5
10
15
0 100 200 300 400 5000
5
10
15
0 20 40 60
σ
94
Dep
th (m
)
Clays: silty clay to clay Sand: clean sand to silty sand
20
25
σ’
20
25
20
25
Gravelly sand to dense sand Sand mixture: silty sand to sandy silt
Silt mixture: clayey silt to silty clay Organic soils and peat
Figure B.16 – CPT 14

Soil Profile Robertson & Wride (1997) Total & Effective
Stress σ, σ’ (kPa) SPT N 60% Hammer
Tip Resistance Qc (MPa)
Local Friction fs (kPa)
0
2
4
6
8
10
12
14
16
18
20
0 10 20 300
2
4
6
8
10
12
14
0 100 200 3000
2
4
6
8
10
12
14
0 100 200 300 4000
2
4
6
8
10
12
14
0 10 20 30 40
σ
95
Dep
th (m
)
σ’
Clays: silty clay to clay Sand: clean sand to silty sand
16
18
20
16
18
20
16
18
20
Figure B.17 – CPT 15
Gravelly sand to dense sand Sand mixture: silty sand to sandy silt
Silt mixture: clayey silt to silty clay Organic soils and peat

Soil Profile Robertson & Wride (1997)
Total & Effective Stress σ, σ’ (kPa)
Tip Resistance Qc (MPa)
Local Friction fs (kPa)
SPT N 60% Hammer
0
2
4
6
8
10
12
14
16
18
20
0 10 20 300
2
4
6
8
10
12
14
16
18
20
0 50 100 150 2000
2
4
6
8
10
12
0 100 200 300 4000
2
4
6
8
10
12
0 20 40 60
96
Dep
th (m
)
σ
Clays: silty clay to clay Sand: clean sand to silty sand
14 14
16
18
20
16
18
20
σ’
Gravelly sand to dense sand Sand mixture: silty sand to sandy silt
Silt mixture: clayey silt to silty clay Organic soils and peat
Figure B.18 – CPT 16
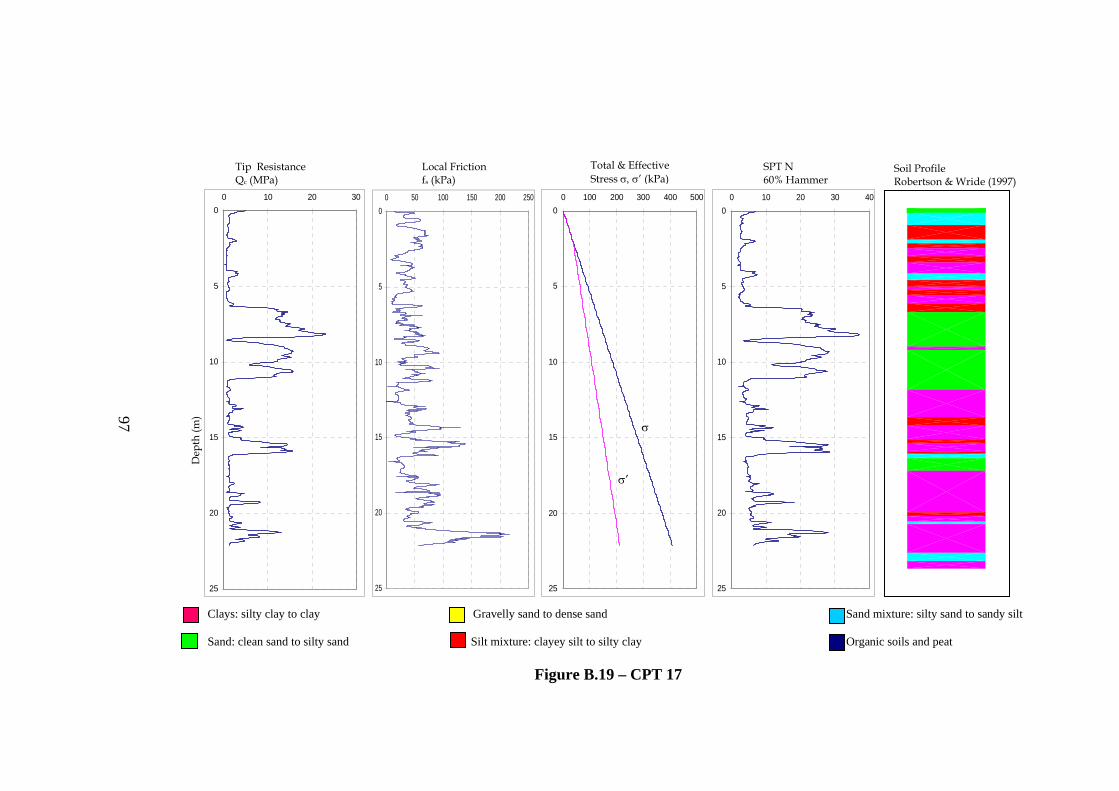
Total & Effective Stress σ, σ’ (kPa)
SPT N 60% Hammer
Tip Resistance Qc (MPa)
Local Friction fs (kPa)
Soil Profile Robertson & Wride (1997)
0
5
10
15
20
25
0 10 20 300
5
10
15
20
25
0 50 100 150 200 2500
5
10
15
0 100 200 300 400 5000
5
10
15
0 10 20 30 40
97
Dep
th (m
)
σ
σ’
Clays: silty clay to clay Sand: clean sand to silty sand
20
25
20
25
Gravelly sand to dense sand Sand mixture: silty sand to sandy silt
Silt mixture: clayey silt to silty clay Organic soils and peat
Figure B.19 – CPT 17

Total & Effective Stress σ, σ’ (kPa)
Tip Resistance Qc (MPa)
Local Friction fs (kPa)
98
Soil Profile Robertson & Wride (1997)
SPT N 60% Hammer
0
1
2
3
4
5
6
7
8
0 10 20 30 400
1
2
3
4
5
6
7
8
0 50 100 1500
1
2
3
4
5
0 50 100 150 2000
1
2
3
4
5
0 20 40 60D
epth
(m)
σ
Clays: silty clay to clay Sand: clean sand to silty sand
6 6
7
8
7
8
σ’
Gravelly sand to dense sand Sand mixture: silty sand to sandy silt
Silt mixture: clayey silt to silty clay Organic soils and peat
Figure B.20 – CPT 18

Soil Profile Robertson & Wride (1997)
Total & Effective Stress σ, σ’ (kPa)
Tip Resistance Qc (MPa)
Local Friction fs (kPa)
SPT N 60% Hammer
q0
1
2
3
4
5
6
7
8
0 10 20 300
1
2
3
4
5
6
7
8
0 50 100 1500
1
2
3
4
5
0 100 2000
1
2
3
4
5
0 20 40 60
99
Dep
th (m
)
σ
Clays: silty clay to clay Sand: clean sand to silty sand
6 6
S
7
8
7
8
σ’
Gravelly sand to dense sand Sand mixture: silty sand to sandy silt
ilt mixture: clayey silt to silty clay Organic soils and peat
Figure B.21 – CPT 18a

Tip Resistance Qc (MPa)
Local Friction fs (kPa)
Total & Effective Stress σ, σ’ (kPa)
SPT N 60% Hammer
Soil Profile Robertson & Wride (1997)
q0
5
10
15
20
0 10 20 30
0
2
4
6
8
10
12
1
1
1
2
0 100 200 3000
2
4
6
8
10
12
0 100 200 300 4000
2
4
6
8
10
12
0 20 40 60
100
Dep
th (m
)
σ
Clays: silty clay to clay Sand: clean sand to silty sand
4
6
8
0
14 14
16
18
20
16
18
20
σ’
Gravelly sand to dense sand Sand mixture: silty sand to sandy silt
Silt mixture: clayey silt to silty clay Organic soils and peat
Figure B.22 – CPT 19

Soil Profile Robertson & Wride (1997)
SPT N 60% Hammer
Total & Effective Stress σ, σ’ (kPa)
Tip Resistance Qc (MPa)
Local Friction fs (kPa)
0
2
4
6
8
10
12
14
16
18
20
22
0 10 20 30
0
2
4
6
8
10
12
14
1
1
2
2
0 50 100 150 2000
2
4
6
8
10
12
14
16
0 100 200 300 400 5000
2
4
6
8
10
12
14
16
0 10 20 30 40
101
Dep
th (m
)
σ
Clays: silty clay to clay Sand: clean sand to silty sand
6
8
0
2
σ’
18
20
22
18
20
22 Gravelly sand to dense sand Sand mixture: silty sand to sandy silt
Silt mixture: clayey silt to silty clay Organic soils and peat
Figure B.23 – CPT 20
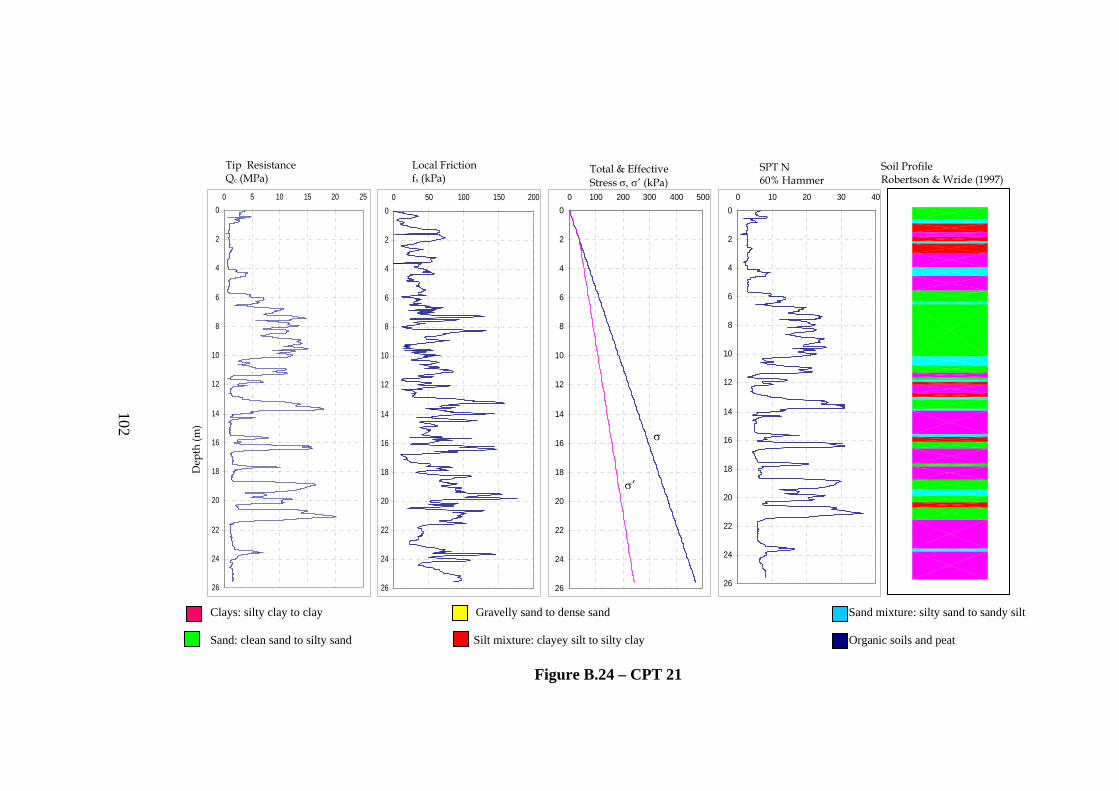
Tip Resistance Qc (MPa)
Local Friction fs (kPa)
Soil Profile Robertson & Wride (1997)
SPT N 60% Hammer
102
0
2
4
6
8
10
12
14
16
18
20
22
24
26
0 5 10 15 20 250
2
4
6
8
10
12
14
16
18
20
22
24
26
0 50 100 150 2000
2
4
6
8
10
12
14
16
0 100 200 300 400 5000
2
4
6
8
10
12
14
16
18
0 10 20 30 40
Total & Effective Stress σ, σ’ (kPa)
Dep
th (m
)
σ
Clays: silty clay to clay Sand: clean sand to silty sand
18
20
22
24
26
20
22
24
26
σ’
Gravelly sand to dense sand Sand mixture: silty sand to sandy silt
Silt mixture: clayey silt to silty clay Organic soils and peat
Figure B.24 – CPT 21

103
Soil Profile Robertson & Wride (1997)
Tip Resistance Qc (MPa)
Local Friction fs (kPa)
Total & Effective Stress σ, σ’ (kPa)
SPT N 60% Hammer
0
2
4
6
8
10
12
14
0 10 20 30
0
2
4
6
8
1
1
1
0 50 100 150 2000
2
4
6
8
0 50 100 150 200 250 3000
2
4
6
8
0 10 20 30 40D
epth
(m)
σ
Clays: silty clay to clay Sand: clean sand to silty sand
0
2
4
10 10σ’
12
14
12
14
Gravelly sand to dense sand Sand mixture: silty sand to sandy silt
Silt mixture: clayey silt to silty clay Organic soils and peat
Figure B.25 – CPT 22

SPT N 60% Hammer
104
0
2
4
6
8
10
12
14
16
18
20
22
0 10 20 300
2
4
6
8
10
12
14
0 50 100 150 200 2500
2
4
6
8
10
12
14
0 100 200 300 4000
2
4
6
8
10
12
14
0 20 40 60
Soil Profile Robertson & Wride (1997)
Total & Effective Stress σ, σ’ (kPa)
Tip Resistance Qc (MPa)
Local Friction fs (kPa)
σ
Dep
th (m
)
Clays: silty clay to clay Sand: clean sand to silty sand
16
18
20
22
16 16
18
20
22
18
20
22
σ’
Gravelly sand to dense sand Sand mixture: silty sand to sandy silt
Silt mixture: clayey silt to silty clay Organic soils and peat
Figure B.26 – CPT 23

SPT N 60% Hammer
Soil Profile Robertson & Wride (1997)
Tip Resistance Qc (MPa)
Local Friction fs (kPa)
Total & Effective Stress σ, σ’ (kPa)
0
2
4
6
8
10
12
14
16
18
20
0 10 20 300
2
4
6
8
10
0 50 100 150 2000
2
4
6
8
10
0 100 200 300 4000
2
4
6
8
10
0 10 20 30 40
σ
105
Dep
th (m
)
σ’
Clays: silty clay to clay Sand: clean sand to silty san
12 12 12
d
14
16
18
20
14
16
18
20
14
16
18
20
Figure B.27 – CPT 24
Gravelly sand to dense sand Sand mixture: silty sand to sandy silt
Silt mixture: clayey silt to silty clay Organic soils and peat

SPT N 60% Hammer
Soil Profile Robertson & Wride (1997)
Total & Effective Stress σ, σ’ (kPa)
Tip Resistance Qc (MPa)
Local Friction fs (kPa)
0
2
4
6
8
10
12
14
16
18
20
0 10 20 300
2
4
6
8
10
12
14
16
18
20
0 50 100 150 2000
2
4
6
8
10
12
0 100 200 300 4000
2
4
6
8
10
12
0 20 40 60
106
Dep
th (m
)
σ
Clays: silty clay to clay Sand: clean sand to silty sand
14 14
16
18
20
16
18
20
σ’
Figure B.1 – CPT 5
Gravelly sand to dense sand Sand mixture: silty sand to sandy silt
Silt mixture: clayey silt to silty clay Organic soils and peat
Figure B.28 – CPT 25
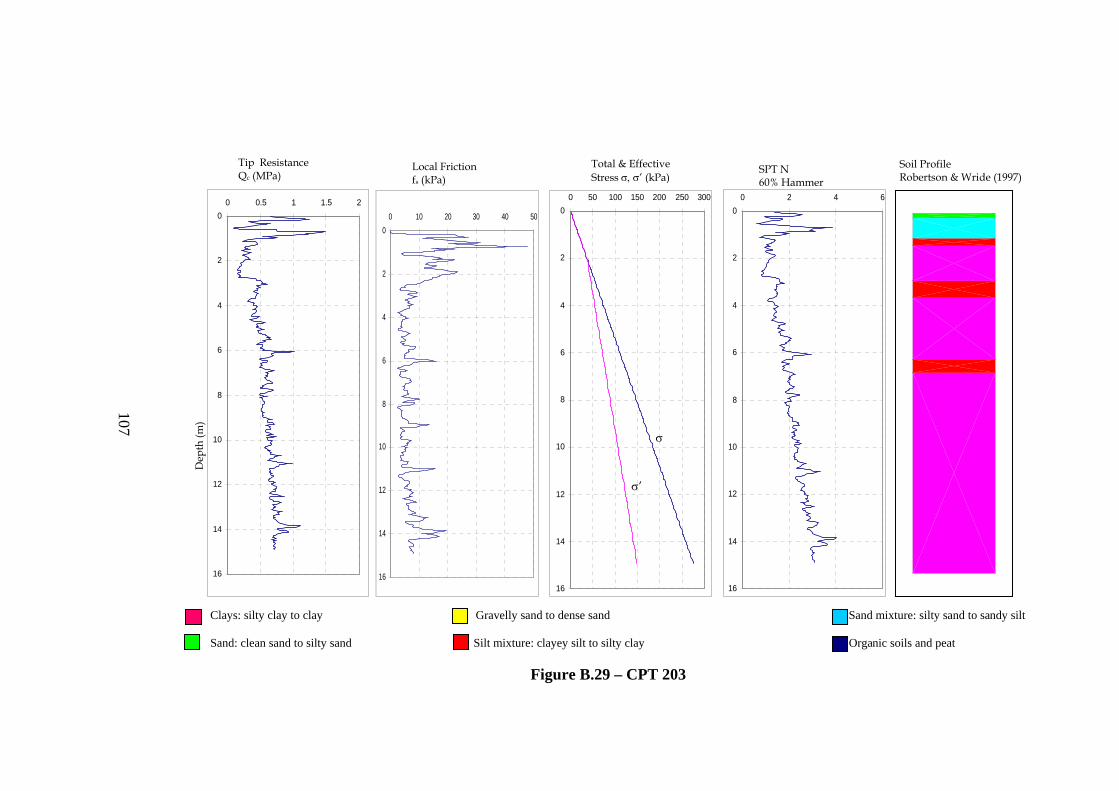
Tip Resistance Qc (MPa)
107
Total & Effective Stress σ, σ’ (kPa)
Soil Profile Robertson & Wride (1997)
Local Friction fs (kPa)
SPT N 60% Hammer
0
2
4
6
8
10
12
14
16
0 0.5 1 1.5 2
0
2
4
6
8
10
12
14
16
0 10 20 30 40 500
2
4
6
8
10
0 50 100 150 200 250 3000
2
4
6
8
10
0 2 4 6D
epth
(m)
σ
Clays: silty clay to clay Sand: clean sand to silty sand
12 12σ’
14
16
14
16
Figure B.29 – CPT 203
Gravelly sand to dense sand Sand mixture: silty sand to sandy silt
Silt mixture: clayey silt to silty clay Organic soils and peat
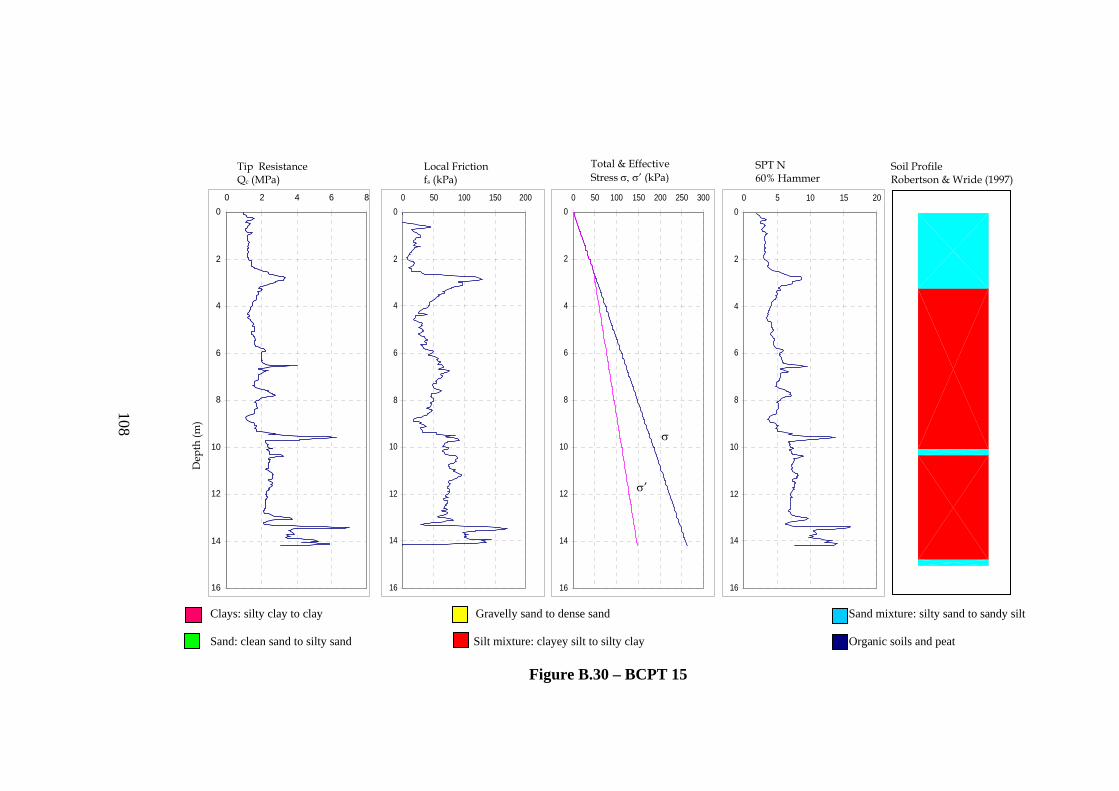
0
2
4
6
8
10
12
14
16
0 2 4 6 8
0
2
4
6
8
10
1
1
1
0 50 100 150 2000
2
4
6
8
10
0 50 100 150 200 250 3000
2
4
6
8
10
0 5 10 15 20
108
σ
Clays: silty clay to clay Sand: clean sand to silty sand
Tip Resistance
Dep
th (m
)
Soil Profile Robertson & Wride (1997)
SPT N 60% Hammer
Total & Effective Stress σ, σ’ (kPa)
Local Friction fs (kPa) Qc (MPa)
2
4
6
σ’
12
14
16
12
14
16
Gravelly sand to dense sand Sand mixture: silty sand to sandy silt
Silt mixture: clayey silt to silty clay Organic soils and peat
Figure B.30 – BCPT 15

Soil Profile Robertson & Wride (1997)
Total & Effective Stress σ, σ’ (kPa)
SPT N 60% Hammer
Tip Resistance Qc (MPa)
Local Friction fs (kPa)
0
2
4
6
8
10
12
14
16
0 2 4 6 8 100
2
4
6
8
10
12
14
16
0 50 100 1500
2
4
6
8
10
0 50 100 150 200 250 3000
2
4
6
8
10
0 5 10 15 20
109
Dep
th (m
)
σ
Clays: silty clay to clay Sand: clean sand to silty sand
12
14
16
12
14
16
σ’
Gravelly sand to dense sand Sand mixture: silty sand to sandy silt
Silt mixture: clayey silt to silty clay Organic soils and peat
Figure B.31 – BCP14
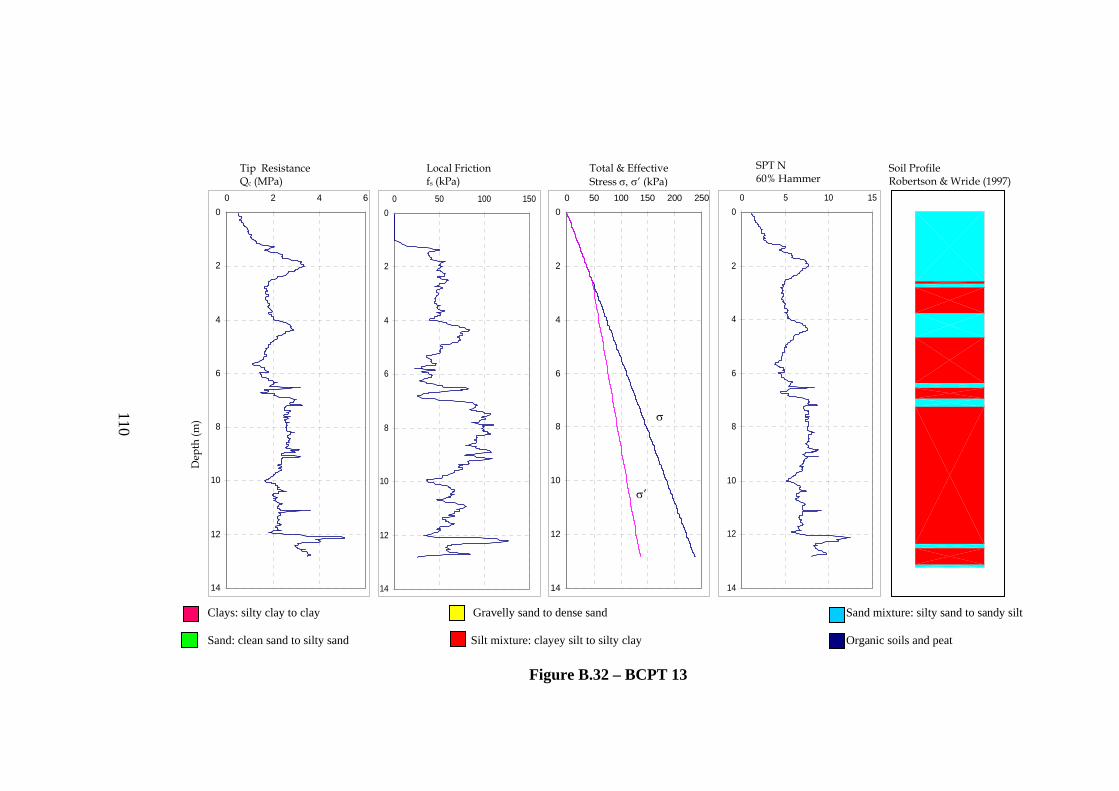
SPT N 60% Hammer
110
Soil Profile Robertson & Wride (1997)
Total & Effective Stress σ, σ’ (kPa)
Tip Resistance Qc (MPa)
Local Friction fs (kPa)
0
2
4
6
8
10
12
14
0 2 4 60
2
4
6
8
0 50 100 1500
2
4
6
8
0 50 100 150 200 2500
2
4
6
8
0 5 10 15
σ
Dep
th (m
)
Clays: silty clay to clay Sand: clean sand to silty sand
10
12
14
10 10
12
14
12
14
σ’
Gravelly sand to dense sand Sand mixture: silty sand to sandy silt
Silt mixture: clayey silt to silty clay Organic soils and peat
Figure B.32 – BCPT 13
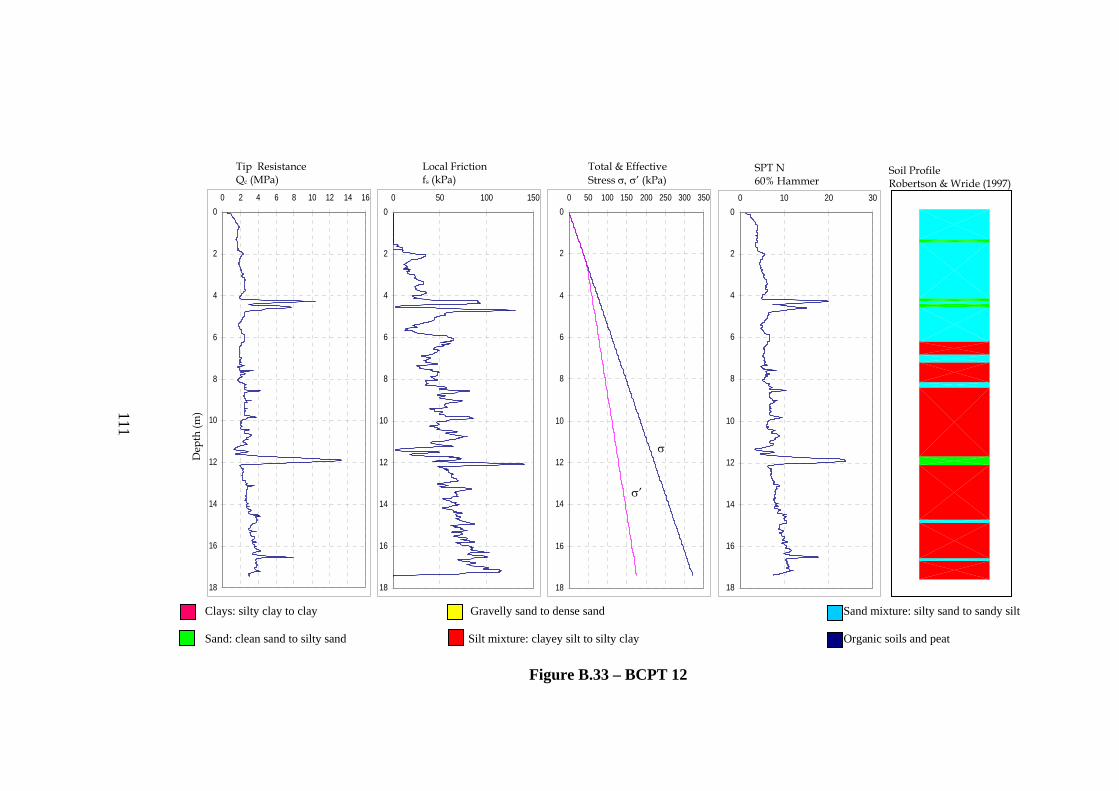
Tip Resistance Qc (MPa)
Local Friction fs (kPa)
Total & Effective Stress σ, σ’ (kPa)
SPT N 60% Hammer
111
0
2
4
6
8
10
12
14
16
18
0 2 4 6 8 10 12 14 160
2
4
6
8
10
12
14
16
18
0 50 100 1500
2
4
6
8
10
12
0 50 100 150 200 250 300 3500
2
4
6
8
10
12
0 10 20 30
Soil Profile Robertson & Wride (1997)
Dep
th (m
)
σ
Clays: silty clay to clay Sand: clean sand to silty sand
σ’
14
16
18
14
16
18
Figure B.1 – CPT 5
Gravelly sand to dense sand Sand mixture: silty sand to sandy silt
Silt mixture: clayey silt to silty clay Organic soils and peat
Figure B.33 – BCPT 12

Total & Effective Stress σ, σ’ (kPa)
Tip Resistance Qc (MPa)
Local Friction fs (kPa)
SPT N 60% Hammer
Soil Profile Robertson & Wride (1997)
112
0
2
4
6
8
10
12
0 2 4 60
2
4
6
8
10
12
0 50 100 150 2000
2
4
6
8
0 50 100 150 200 2500
2
4
6
8
0 5 10 15D
epth
(m)
σ
Clays: silty clay to clay Sand: clean sand to silty sand
10
12
10
12
σ’
Gravelly sand to dense sand Sand mixture: silty sand to sandy silt
Silt mixture: clayey silt to silty clay Organic soils and peat
Figure B.34 – BCPT 11

Soil Profile Robertson & Wride (1997)
Total & Effective Stress σ, σ’ (kPa)
Tip Resistance Qc (MPa)
Local Friction fs (kPa)
SPT N 60% Hammer
0
2
4
6
8
10
12
0 2 4 6 8 10 12 140
2
4
6
8
1
1
0 50 100 150 2000
2
4
6
8
0 50 100 150 200 2500
2
4
6
8
0 10 20 30
113
Dep
th (m
)
σ
Clays: silty clay to clay Sand: clean sand to silty sand
0
2
σ’
10
12
10
12
Gravelly sand to dense sand Sand mixture: silty sand to sandy silt
Silt mixture: clayey silt to silty clay Organic soils and peat
Figure B.35 – BCPT 10

SPT N 60% Hammer
Total & Effective Stress σ, σ’ (kPa)
Soil Profile Robertson & Wride (1997)
Tip Resistance Qc (MPa)
Local Friction fs (kPa)
0
2
4
6
8
10
12
14
16
0 2 4 6 8 100
2
4
6
8
10
12
14
16
0 50 100 150 2000
2
4
6
8
10
0 50 100 150 200 250 3000
2
4
6
8
10
0 5 10 15 20
114
Dep
th (m
)
Clays: silty clay to clay Sand: clean sand to silty sand
σ
12
14
16
12
14
16
σ’
Gravelly sand to dense sand Sand mixture: silty sand to sandy silt
Silt mixture: clayey silt to silty clay Organic soils and peat
Figure B.36 – BCPT 9

SPT N 60% Hammer
Soil Profile Robertson & Wride (1997)
Total & Effective Stress σ, σ’ (kPa)
Tip Resistance Qc (MPa)
Local Friction fs (kPa)
0
2
4
6
8
10
12
14
16
0 1 2 3 40
2
4
6
8
10
12
14
16
0 20 40 60 800
2
4
6
8
10
0 50 100 150 200 250 3000
2
4
6
8
10
0 5 10
115
Dep
th (m
) σ
Clays: silty clay to clay Sand: clean sand to silty sand
12
14
16
12
14
16
σ’
Figure B.1 – CPT 5
Figure B.37 – BCPT 8
Gravelly sand to dense sand Sand mixture: silty sand to sandy silt
Silt mixture: clayey silt to silty clay Organic soils and peat

Tip Resistance Qc (MPa)
Local Friction fs (kPa)
SPT N 60% Hammer
Total & Effective Stress σ, σ’ (kPa)
Soil Profile Robertson & Wride (1997)
0
2
4
6
8
10
12
14
16
0 2 4 6 8 10 12 140
2
4
6
8
10
1
1
1
0 100 200 3000
2
4
6
8
10
0 50 100 150 200 250 3000
2
4
6
8
10
0 10 20 30
116
Dep
th (m
) σ
Clays: silty clay to clay Sand: clean sand to silty sand
2
4
6
12
14
16
12
14
16
σ’
Gravelly sand to dense sand Sand mixture: silty sand to sandy silt
Silt mixture: clayey silt to silty clay Organic soils and peat
Figure B.38 – CPT 7

Total & Effective Stress σ, σ’ (kPa)
SPT N 60% Hammer
Soil Profile Robertson & Wride (1997)
Tip Resistance Qc (MPa)
Local Friction fs (kPa)
0
2
4
6
8
10
12
14
16
18
20
0 2 4 6 8 10 12 140
2
4
6
8
10
12
14
16
18
20
0 100 200 3000
2
4
6
8
10
12
0 50 100 150 200 250 300 350 4000
2
4
6
8
10
12
0 10 20 30
117
Dep
th (m
)
σ
Clays: silty clay to clay Sand: clean sand to silty sand
14 14σ’
16
18
20
16
18
20
Gravelly sand to dense sand Sand mixture: silty sand to sandy silt
Silt mixture: clayey silt to silty clay Organic soils and peat
Figure B.39 – BCPT 6

Soil Profile Robertson & Wride (1997)
118
Total & Effective Stress σ, σ’ (kPa)
SPT N 60% Hammer
Tip Resistance Qc (MPa)
Local Friction fs (kPa)
0
2
4
6
8
10
12
14
16
18
20
22
0 2 4 60
2
4
6
8
10
12
14
16
18
20
22
0 50 100 150 200
0
2
4
6
8
10
12
14
0 50 100 150 200 250 300 350 400 0
2
4
6
8
10
12
14
0 5 10 15D
epth
(m)
σ
Clays: silty clay to clay Sand: clean sand to silty sand
16 16
G
S
18
20
22
18
20
22
σ’
ravelly sand to dense sand Sand mixture: silty sand to sandy silt
ilt mixture: clayey silt to silty clay Organic soils and peat
Figure B.40 – BCPT 5

Total & Effective Stress σ, σ’ (kPa)
Soil Profile Robertson & Wride (1997)
Tip Resistance Qc (MPa)
Local Friction fs (kPa)
SPT N 60% Hammer
0
2
4
6
8
10
12
14
16
18
0 2 4 6 8 100
2
4
6
8
10
12
0 50 100 150 200 250 300 3500
2
4
6
8
10
12
0 50 100 150 200 250 300 3500
2
4
6
8
10
12
0 5 10 15 20
119
Dep
th (m
)
σ
Clays: silty clay to clay Sand: clean sand to silty sand
14
16
18
14
16
18
14
16
18
σ’
Gravelly sand to dense sand Sand mixture: silty sand to sandy silt
Silt mixture: clayey silt to silty clay Organic soils and peat
Figure B.41 – BCPT 4

SPT N 60% Hammer
Soil Profile Robertson & Wride (1997)
Total & Effective Stress σ, σ’ (kPa)
Tip Resistance Qc (MPa)
Local Friction fs (kPa)
0
2
4
6
8
10
12
14
16
0 2 4 6 8 100
2
4
6
8
10
12
14
16
0 50 100 1500
2
4
6
8
10
0 50 100 150 200 250 3000
2
4
6
8
10
0 5 10 15 20
120
Dep
th (m
)
σ
Clays: silty clay to clay Sand: clean sand to silty sand
12 12σ’
14
16
14
16
Gravelly sand to dense sand Sand mixture: silty sand to sandy silt
Silt mixture: clayey silt to silty clay Organic soils and peat
Figure B.42 – BCPT 3

Soil Profile Robertson & Wride (1997)
SPT N 60% Hammer
Total & Effective Stress σ, σ’ (kPa)
Tip Resistance Qc (MPa)
Local Friction fs (kPa)
0
2
4
6
8
10
12
14
16
18
20
22
0 5 100
2
4
6
8
10
12
14
16
18
20
22
0 100 200 300 400
0
2
4
6
8
10
12
14
0 100 200 300 4000
2
4
6
8
10
12
14
0 10 20 30
121
Dep
th (m
)
σ
Clays: silty clay to clay Sand: clean sand to silty sand
16
18
20
22
24
16
18
20
22
σ’
Gravelly sand to dense sand Sand mixture: silty sand to sandy silt
Silt mixture: clayey silt to silty clay Organic soils and peat
Figure B.43 – BCPT 2

Total & Effective Stress σ, σ’ (kPa)
Soil Profile Robertson & Wride (1997)
SPT N 60% Hammer
Tip Resistance Qc (MPa)
Local Friction fs (kPa)
0
2
4
6
8
10
12
14
16
18
20
22
0 5 100
2
4
6
8
10
12
14
16
18
20
22
0 100 200 300 4000
2
4
6
8
10
12
14
0 200 4000
2
4
6
8
10
12
14
0 10 20 30
122
Dep
th (m
)
σ
Clays: silty clay to clay Sand: clean sand to silty sand
1616
18
20
22
18
20
22
σ’
Figure B.44 – BCPT 1
Gravelly sand to dense sand Sand mixture: silty sand to sandy silt
Silt mixture: clayey silt to silty clay Organic soils and peat

APPENDIX C
123

Table.1 - Distribution of Change in Vertical Stresses at the Settlement Plates
SP35 SP36 SP37 SP38 SP39 SP40 SP54 Depth
(m) ∆σ
(kPa) ∆σ
(kPa) ∆σ
(kPa) ∆σ
(kPa) ∆σ
(kPa) ∆σ
(kPa) ∆σ
(kPa) 0.00 63.95 63.96 63.94 63.98 63.92 63.81 63.88
2.50 63.35 63.40 63.05 63.87 62.60 62.12 61.77
5.00 63.01 63.16 62.41 63.84 61.99 60.94 60.26
7.50 62.81 63.04 61.79 63.81 61.14 59.45 58.54
10.00 62.39 62.73 60.91 63.71 59.99 57.85 56.66
12.50 61.78 62.25 59.86 63.57 58.66 56.26 54.79
15.00 61.04 61.65 58.75 63.14 57.25 54.75 53.06
17.50 60.19 60.95 57.63 62.52 55.85 53.31 51.54
20.00 59.21 60.14 56.49 61.73 54.45 51.92 50.19
22.50 58.05 59.22 55.31 60.80 53.00 50.54 48.89
25.00 56.70 58.18 54.07 59.80 51.44 49.13 47.55
27.50 55.26 57.12 52.84 58.85 49.88 47.78 46.22
30.00 54.09 56.29 51.90 58.17 48.70 46.71 45.24
SP33 SP34 SP1 SP2 SP7 SP8 SP9 Depth
(m) ∆σ
(kPa) ∆σ
(kPa) ∆σ
(kPa) ∆σ
(kPa) ∆σ
(kPa) ∆σ
(kPa) ∆σ
(kPa) 0.00 64.00 64.00 64.00 63.90 63.85 63.95 63.92
2.50 63.76 63.86 60.92 60.57 63.57 63.99 63.65
5.00 63.74 63.70 58.82 57.91 63.40 63.90 63.45
7.50 63.68 63.50 56.45 54.10 63.30 63.75 63.19
10.00 63.45 63.45 53.85 49.70 63.10 63.53 62.99
12.50 63.01 63.35 51.35 46.50 62.90 63.32 62.65
15.00 62.37 63.15 49.05 43.60 62.50 63.18 62.11
17.50 61.51 62.55 46.75 41.10 61.70 62.68 61.35
20.00 60.40 61.85 45.15 39.30 61.20 62.00 60.38
22.50 59.03 60.75 42.15 36.70 59.20 61.14 59.24
25.00 57.42 59.65 40.35 35.00 57.90 60.15 58.00
27.50 55.69 58.35 38.35 33.50 56.30 59.17 56.74
30.00 54.15 57.05 36.75 32.30 55.10 58.41 55.54
124

Table.1 -Distribution of Change in Vertical Stresses at Settlement Plates (Continued)
SP16 SP17 SP18 SP22 SP23 SP24 SP28 Depth
(m) ∆σ
(kPa) ∆σ
(kPa) ∆σ
(kPa) ∆σ
(kPa) ∆σ
(kPa) ∆σ
(kPa) ∆σ
(kPa) 0.00 63.85 63.95 63.95 63.95 63.99 63.97 63.88
2.50 63.60 63.55 63.22 63.75 63.72 63.72 63.62
5.00 63.15 63.05 62.72 63.55 63.32 62.62 62.42
7.50 62.80 62.50 60.45 63.35 63.05 60.85 60.75
10.00 61.90 61.80 58.25 63.25 62.85 59.25 59.05
12.50 61.00 61.40 55.85 63.10 62.65 57.65 57.05
15.00 59.70 60.40 54.35 62.80 62.25 56.25 54.75
17.50 58.80 59.60 52.15 62.10 61.95 54.45 53.45
20.00 57.90 59.10 51.25 61.80 62.05 54.15 52.65
22.50 55.80 57.40 48.75 60.10 60.85 51.95 50.15
25.00 54.30 56.40 47.95 59.40 60.75 51.25 48.45
27.50 53.00 55.50 46.45 58.70 60.55 50.40 47.65
30.00 51.90 54.80 45.35 58.20 60.35 49.55 46.75
SP29 SP30 SP41 SP42 SP43 SP44 SP45 Depth
(m) ∆σ
(kPa) ∆σ
(kPa) ∆σ
(kPa) ∆σ
(kPa) ∆σ
(kPa) ∆σ
(kPa) ∆σ
(kPa) 0.00 63.96 63.81 63.91 63.95 63.91 63.94 63.95
2.50 63.72 63.37 63.75 63.80 63.77 63.47 63.82
5.00 62.62 60.87 63.35 63.65 63.17 63.67 63.52
7.50 60.95 57.20 62.95 63.45 62.20 63.40 63.15
10.00 59.55 54.50 62.45 63.25 61.90 62.60 62.95
12.50 57.65 51.50 61.55 62.65 60.70 62.10 62.65
15.00 56.35 49.40 60.35 61.75 59.30 61.80 62.55
17.50 54.75 46.80 58.75 61.15 58.30 60.50 62.05
20.00 54.15 46.00 57.95 60.65 57.10 60.30 62.15
22.50 51.85 43.10 55.65 58.75 54.60 58.60 60.85
25.00 51.25 42.30 54.15 57.95 53.70 57.40 60.75
27.50 50.15 40.80 52.75 56.85 51.90 56.60 60.55
30.00 49.55 39.90 51.45 56.35 50.90 55.80 60.65
125

Table.1 -Distribution of Change in Vertical Stresses at Settlement Plates (Continued)
SP46 SP47 SP48 SP49 SP50 SP3 SP26 Depth
(m) ∆σ
(kPa) ∆σ
(kPa) ∆σ
(kPa) ∆σ
(kPa) ∆σ
(kPa) ∆σ
(kPa) ∆σ
(kPa) 0.00 63.91 63.91 63.94 63.95 64.00 63.95 63.96
2.50 63.77 63.87 63.87 63.82 63.57 63.83 63.72
5.00 63.61 63.70 63.58 63.72 62.88 63.65 62.62
7.50 63.30 63.50 63.45 63.55 62.23 63.62 60.95
10.00 63.10 62.90 63.40 63.45 61.47 63.35 59.55
12.50 62.30 62.20 63.20 62.75 60.57 63.22 57.65
15.00 61.50 61.30 62.70 61.95 59.51 62.45 56.35
17.50 60.80 59.90 62.20 61.35 58.28 61.85 54.75
20.00 60.30 59.10 61.70 60.45 56.88 59.65 54.15
22.50 58.50 57.10 59.90 57.95 55.34 58.65 51.85
25.00 57.80 55.60 59.40 57.05 53.67 56.15 51.25
27.50 56.50 54.30 58.40 55.35 51.90 54.65 50.15
30.00 56.20 53.00 57.90 54.35 50.06 52.75 49.55
SP13 SP14 SP15 SP19 SP20 SP21 SP25 Depth
(m) ∆σ
(kPa) ∆σ
(kPa) ∆σ
(kPa) ∆σ
(kPa) ∆σ
(kPa) ∆σ
(kPa) ∆σ
(kPa) 0.00 63.85 63.95 63.95 63.95 63.99 63.97 63.88
2.50 63.60 63.55 63.22 63.75 63.72 63.72 63.62
5.00 63.15 63.05 62.72 63.55 63.32 62.62 62.42
7.50 62.80 62.50 60.45 63.35 63.05 60.85 60.75
10.00 61.90 61.80 58.25 63.25 62.85 59.25 59.05
12.50 61.00 61.40 55.85 63.10 62.65 57.65 57.05
15.00 59.70 60.40 54.35 62.80 62.25 56.25 54.75
17.50 58.80 59.60 52.15 62.10 61.95 54.45 53.45
20.00 57.90 59.10 51.25 61.80 62.05 54.15 52.65
22.50 55.80 57.40 48.75 60.10 60.85 51.95 50.15
25.00 54.30 56.40 47.95 59.40 60.75 51.25 48.45
27.50 53.00 55.50 46.45 58.70 60.55 50.40 47.65
30.00 51.90 54.80 45.35 58.20 60.35 49.55 46.75
126

Table.1 -Distribution of Change in Vertical Stresses at Settlement Plates (Continued)
BSP1 BSP2 BSP3 BSP4 BSP5 BSP6 BSP7 Depth
(m) ∆σ
(kPa) ∆σ
(kPa) ∆σ
(kPa) ∆σ
(kPa) ∆σ
(kPa) ∆σ
(kPa) ∆σ
(kPa) 0.00 63.95 64.00 63.95 63.90 63.99 63.97 63.96
2.50 60.67 61.47 63.70 63.75 63.82 63.93 63.89
5.00 57.47 59.37 63.50 63.60 63.72 63.89 63.79
7.50 54.60 57.50 63.40 63.57 63.65 63.60 63.62
10.00 51.30 55.30 63.27 63.50 63.35 63.30 63.42
12.50 49.10 53.30 63.20 63.38 63.15 62.70 63.12
15.00 47.00 51.10 62.90 63.27 62.95 61.80 62.52
17.50 45.10 49.50 62.50 62.90 62.65 61.30 61.92
20.00 43.90 48.10 62.30 62.70 62.75 59.50 61.42
22.50 41.90 45.80 60.40 61.10 61.25 58.40 59.52
25.00 40.80 44.30 59.40 60.20 60.95 57.10 58.42
27.50 39.80 43.10 58.40 59.10 60.55 56.20 57.12
30.00 38.90 42.00 57.50 58.30 60.05 55.30 56.12
BSP12 BSP13 BSP14 BSP15 BSP16 BSP20 BSP21 Depth
(m) ∆σ
(kPa) ∆σ
(kPa) ∆σ
(kPa) ∆σ
(kPa) ∆σ
(kPa) ∆σ
(kPa) ∆σ
(kPa) 0.00 63.92 63.93 63.92 63.96 63.97 63.96 63.91 2.50 63.87 63.89 63.77 63.75 63.77 63.57 63.47 5.00 63.80 63.82 63.62 63.65 63.65 62.07 63.07 7.50 63.65 63.78 63.51 63.58 63.50 59.50 62.20 10.00 63.30 63.62 63.40 62.88 63.00 57.10 61.20 12.50 62.80 62.92 63.20 62.38 62.50 54.50 59.80 15.00 62.00 62.32 63.00 61.88 61.70 49.80 58.30 17.50 61.10 61.42 62.50 60.78 60.70 48.40 56.60 20.00 60.40 60.82 62.40 59.58 60.10 45.30 55.40 22.50 58.50 58.72 61.90 57.98 58.20 43.70 52.70 25.00 57.30 57.52 60.70 56.78 57.00 41.60 50.80 27.50 56.00 56.22 60.30 55.48 55.70 40.10 48.80 30.00 55.00 55.22 60.10 54.38 54.70 63.96 47.10
127

APPENDIX D
128
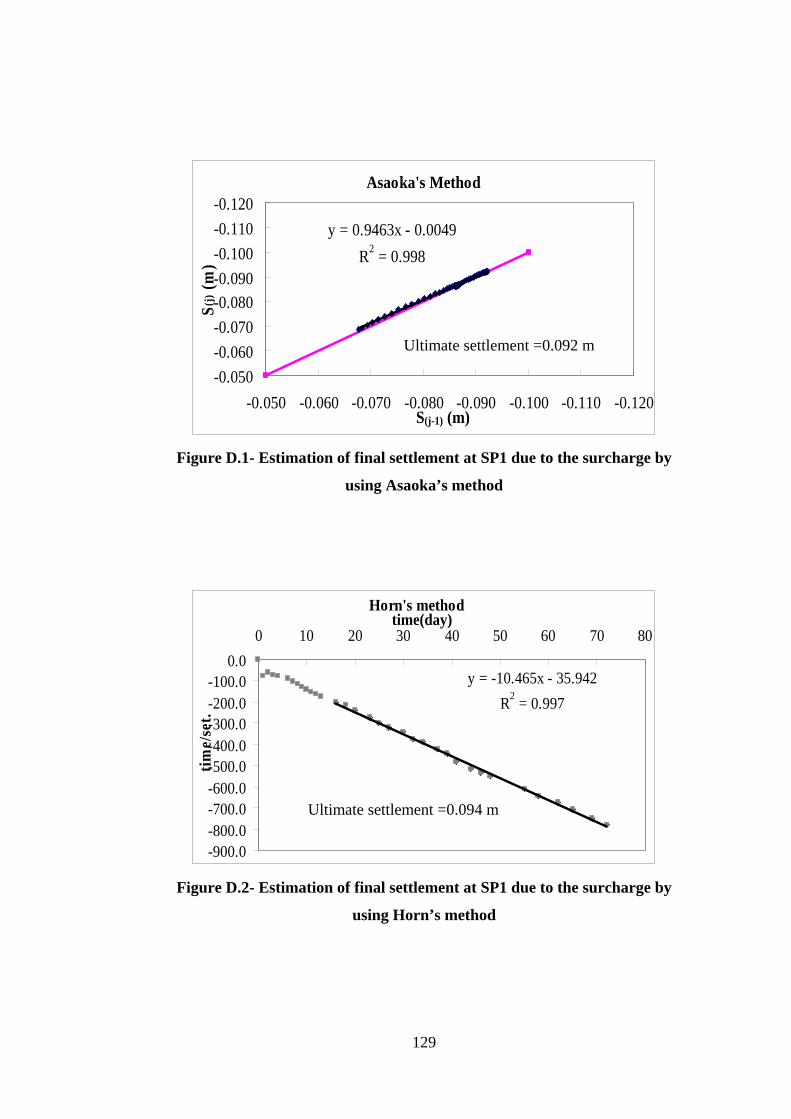
Asaoka's Method
y = 0.9463x - 0.0049R2 = 0.998
-0.120-0.110-0.100-0.090-0.080-0.070-0.060-0.050
-0.060-0.050
S(j)
(m)
m
Figure D.1- Estimation of
u
-900.0-800.0-700.0-600.0-500.0-400.0-300.0-200.0-100.0
0.00 10
time/
set.
Figure D.2- Estimation of
Ultimate settlement =0.092
-0.120-0.110-0.100-0.090-0.080-0.070S(j-1) (m)
final settlement at SP1 due to the surcharge by
sing Asaoka’s method
Horn's method
y = -10.465x - 35.942R2 = 0.997
20 30 40 50 60 70 8time(day)
0
m
Ultimate settlement =0.094final settlement at SP1 due to the surcharge by
using Horn’s method
129

-0.090-0.080-0.070-0.060-0.050-0.040-0.030-0.020-0.0100.000
0 10 20 30 40 50 60 70 80time(day)
sett
lem
ent(
m)
Figure D.3- The distribution of consolidation settlement due to the applied
load with time at SP1
Asaoka's Method
y = 0.9509x - 0.0036R2 = 0.9995
-0.100
-0.090
-0.080
-0.070
-0.060
-0.050
-0.040
-0.030
-0.020-0.100-0.090-0.080-0.070-0.060-0.050-0.040-0.030-0.020
S(j-1) (m)
S(j) (m
)
Ultimate settlement =0.075 m
Figure D.4- Estimation of final settlement at SP2 due to the surcharge by
using Asaoka’s method
130

Horn's method
y = -12.346x - 111.48R2 = 0.9956
-1400.0
-1200.0
-1000.0
-800.0
-600.0
-400.0
-200.0
0.00 20 40 60 80
time(day)tim
e/se
t.100
Ultimate settlement =0.081 m
Figure D.5- Estimation of final settlement at SP2 due to the surcharge by
using Horn’s method
-0.080
-0.070
-0.060
-0.050
-0.040
-0.030
-0.020
-0.010
0.0000 20 40 60 80 100
time(day)
Sett
lem
ent(
m)
Figure D.6- The distribution of consolidation settlement due to the applied
load with time at SP2
131

Asaoka's Method
y = 0.936x - 0.011R2 = 0.998
-0.180-0.170-0.160-0.150-0.140-0.130-0.120-0.110-0.100
-0.180-0.170-0.160-0.150-0.140-0.130-0.120-0.110-0.100S(j-1) (m)
S (j)
(m)
Ultimate settlement =0.172 m
Figure D.7- Estimation of final settlement at SP3 due to the surcharge by
using Asaoka’s method
Horn's Method
y = -6.3105x + 27.565R2 = 0.9896
-900.0-800.0-700.0-600.0-500.0-400.0-300.0-200.0-100.0
0.00 25 50 75 100 125 150
time(day)
time/
set
Ultimate settlement =0.168 m
Figure D.8- Estimation of final settlement at SP3 due to the surcharge by
using Horn’s method
132

-0.180-0.160-0.140-0.120-0.100-0.080-0.060-0.040-0.0200.000
0 25 50 75 100 125 150time(day)
Sett
lem
ent(
m)
Figure D.9- The distribution of consolidation settlement due to the applied
load with time at SP3
Asaoka's Method
y = 0.947x - 0.009R2 = 0.998
-0.180
-0.170
-0.160
-0.150
-0.140
-0.130
-0.120
-0.110-0.180-0.170-0.160-0.150-0.140-0.130-0.120-0.110
S(j-1) (m)
S(j) (m
)
Ultimate settlement =0.170 m
Figure D.10- Estimation of final settlement at SP7 due to the surcharge by
using Asaoka’s method
133

Horn's Method
y = -5.566x - 32.854R2 = 0.9957
-500.0-450.0-400.0-350.0-300.0-250.0-200.0-150.0-100.0
-50.00.0
0 10 20 30 40 50 60 70 80 9time(day)
time/
set
0
Ultimate settlement =0.172 m
Figure D.11- Estimation of final settlement at SP7 due to the surcharge by
using Horn’s method
-0.200
-0.150
-0.100
-0.050
0.0000 10 20 30 40 50 60 70 80 90
time(day)
Sett
lem
ent (
m)
Figure D.12- The distribution of consolidation settlement due to the applied
load with time at SP7
134

Asaoka's Method
y = 0.960x - 0.006R2 = 0.997
-0.180-0.170-0.160-0.150-0.140-0.130-0.120-0.110
-0.180-0.170-0.160-0.150-0.140-0.130-0.120-0.110S(j-1) (m)
S (j)
(m)
Ultimate settlement =0.160 m
Figure D.13- Estimation of final settlement at SP8 due to the surcharge by
using Asaoka’s method
Horn's Method
y = -5.8458x - 46.532R2 = 0.94
-600.0
-500.0
-400.0
-300.0
-200.0
-100.0
0.00 10 20 30 40 50 60 70 80 90 100
time(day)
time/
set
Ultimate settlement =0.168 m
Figure D.14- Estimation of final settlement at SP8 due to the surcharge by
using Horn’s method
135

-0.180-0.160-0.140-0.120-0.100-0.080-0.060-0.040-0.0200.000
0 10 20 30 40 50 60 70 80 90 100time(day)
Sett
lem
ent (
m)
Figure D.15- The distribution of consolidation settlement due to the applied
load with time at SP8
Asaoka's Method
y = 0.961x - 0.008R2 = 0.999
-0.220-0.210-0.200-0.190-0.180-0.170-0.160-0.150
-0.220-0.210-0.200-0.190-0.180-0.170-0.160-0.150S(j-1) (m)
S(j)
(m)
Ultimate settlement =0.205 m
Figure D.16- Estimation of final settlement at SP9 due to the surcharge by
using Asaoka’s method
136

Horn's Method
y = -4.9402x - 30.166R2 = 0.9986
-1000.0
-800.0
-600.0
-400.0
-200.0
0.00 25 50 75 100 125 150 175 200
time(day)tim
e/se
t
Ultimate settlement =0.205 m
Figure D.17- Estimation of final settlement at SP9 due to the surcharge by
using Horn’s method
-0.250
-0.200
-0.150
-0.100
-0.050
0.0000 20 40 60 80 100 120 140 160 180 200
time(day)
Sett
lem
ent (
m)
Figure D.18- The distribution of consolidation settlement due to the applied
load with time at SP9
137

Asaoka's Method
y = 0.9663x - 0.0087R2 = 0.9995
-0.280
-0.260
-0.240
-0.220
-0.200
-0.180-0.280-0.260-0.240-0.220-0.200-0.180
S(j-1) (m)
S (j)
(m)
Ultimate settlement =0.258 m
Figure D.19- Estimation of final settlement at SP16 due to the surcharge by
using Asaoka’s method
Horn's method
y = -4.0952x - 71.854R2 = 0.9925
-450.0-400.0-350.0-300.0-250.0-200.0-150.0-100.0-50.0
0.00 10 20 30 40 50 60 70 8
time(day)
time/
set.
0
Ultimate settlement =0.212 m
Figure D.20- Estimation of final settlement at SP16 due to the surcharge by
using Horn’s method
138

-0.250
-0.200
-0.150
-0.100
-0.050
0.0000 10 20 30 40 50 60 70 80
time (day)se
ttle
men
t (m
)
Figure D.21- The distribution of consolidation settlement due to the applied
load with time at SP16
Asaoka's Method
y = 0.9733x - 0.0057R2 = 0.9998
-0.230-0.210-0.190-0.170-0.150-0.130-0.110-0.090-0.070
-0.230-0.210-0.190-0.170-0.150-0.130-0.110-0.090-0.070S(j-1) (m)
S(j) (m
)
Ultimate settlement =0.214 m
Figure D.22- Estimation of final settlement at SP17 due to the surcharge by
using Asaoka’s method
139

Horn's method
y = -3.9861x - 95.133R2 = 0.9957
-600.0
-500.0
-400.0
-300.0
-200.0
-100.0
0.00 20 40 60 80 100 12
time(day)tim
e/se
t.0
Ultimate settlement =0.236 m
Figure D.23- Estimation of final settlement at SP17 due to the surcharge by
using Horn’s method
-0.250
-0.200
-0.150
-0.100
-0.050
0.0000 20 40 60 80 100 1
time (day)
sett
lem
ent (
m)
20
Figure D.24- The distribution of consolidation settlement due to the applied
load with time at SP17
140

Asaoka's Method
y = 0.9774x - 0.0067R2 = 0.9997
-0.320-0.300-0.280-0.260-0.240-0.220-0.200
-0.320-0.300-0.280-0.260-0.240-0.220-0.200S(j-1) (m)
S(j) (m
)
Ultimate settlement =0.296 m
Figure D.25- Estimation of final settlement at SP18 due to the surcharge by
using Asaoka’s method
Horn's method
y = -3.0726x - 50.893R2 = 0.998
-600.0
-500.0
-400.0
-300.0
-200.0
-100.0
0.00 25 50 75 100 125 150 175
time(day)
time/
set.
Ultimate settlement =0.303 m
Figure D.26- Estimation of final settlement at SP18 due to the surcharge by
using Horn’s method
141

-0.350
-0.300
-0.250
-0.200
-0.150
-0.100
-0.050
0.0000 25 50 75 100 125 150 175
time(day)
settl
emen
t(m)
Figure D.27- The distribution of consolidation settlement due to the applied
load with time at SP18
Asaoka's Method
y = 0.9453x - 0.0113R2 = 0.9989
-0.220
-0.200
-0.180
-0.160
-0.140
-0.120-0.220-0.200-0.180-0.160-0.140-0.120
S(j-1) (m)
S (j) (
m)
Ultimate settlement =0.206 m
Figure D.28- Estimation of final settlement at SP22 due to the surcharge by
using Asaoka’s method
142
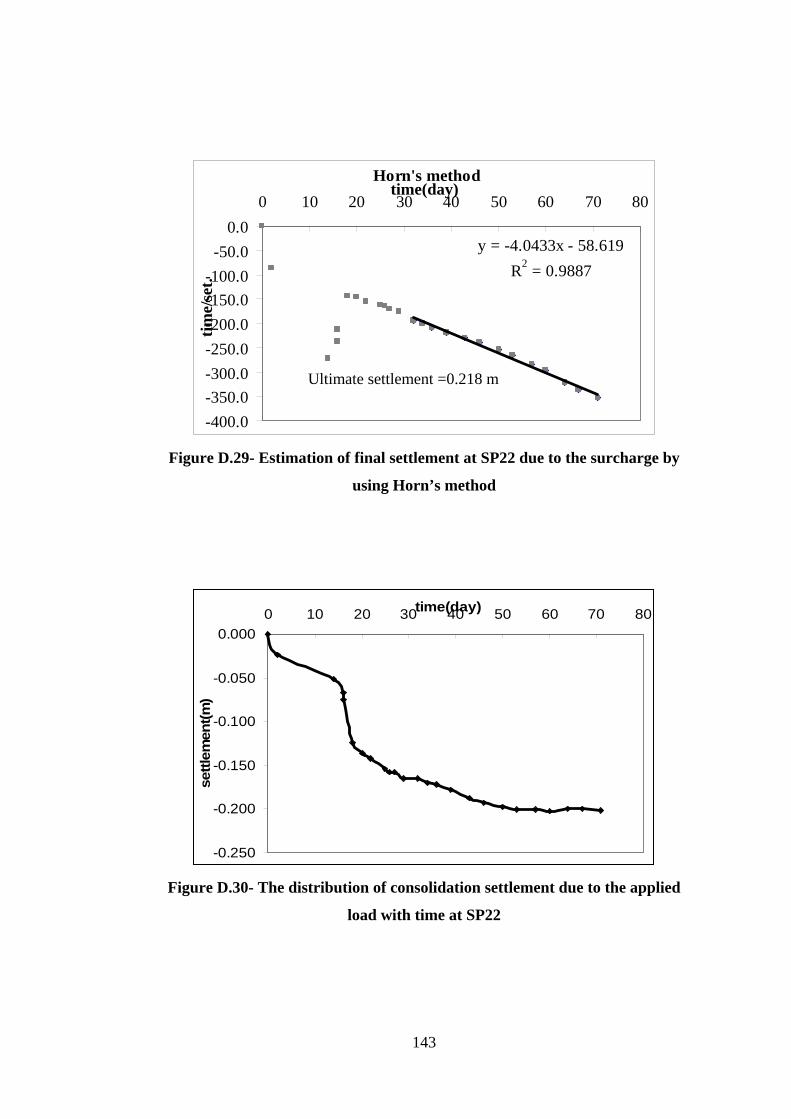
Horn's method
y = -4.0433x - 58.619R2 = 0.9887
-400.0-350.0-300.0-250.0-200.0-150.0-100.0
-50.00.0
0 10 20 30 40 50 60 70 80time(day)
time/
set.
Ultimate settlement =0.218 m
Figure D.29- Estimation of final settlement at SP22 due to the surcharge by
using Horn’s method
-0.250
-0.200
-0.150
-0.100
-0.050
0.0000 10 20 30 40 50 60 70 80time(day)
settl
emen
t(m)
Figure D.30- The distribution of consolidation settlement due to the applied
load with time at SP22
143

Asaoka's Method
y = 0.977x - 0.0059R2 = 0.9997
-0.260-0.240-0.220-0.200-0.180-0.160-0.140-0.120
-0.260-0.240-0.220-0.200-0.180-0.160-0.140-0.120S(j-1) (m)
S(j)
(m)
Ultimate settlement =0.256 m
Figure D.31- Estimation of final settlement at SP23 due to the surcharge by
using Asaoka’s method
Horn's method
y = -3.448x - 75.406R2 = 0.9928
-500.0
-400.0
-300.0
-200.0
-100.0
0.00 20 40 60 80 100 1
time(day)
time/
set.
20
Ultimate settlement =0.264 m
Figure D.31- Estimation of final settlement at SP23 due to the surcharge by
using Horn’s method
144

-0.300
-0.250
-0.200
-0.150
-0.100
-0.050
0.0000 20 40 60 80 100 120
time(day)
settl
emen
t (m
)
Figure D.33- The distribution of consolidation settlement due to the applied
load with time at SP23
Asaoka's Method
y = 0.9749x - 0.0055R2 = 0.9997
-0.240
-0.220
-0.200
-0.180
-0.160
-0.140-0.240-0.220-0.200-0.180-0.160-0.140
S(j-1) (m)
S(j) (m
)
Ultimate settlement =0.219 m
Figure D.34- Estimation of final settlement at SP24 due to the surcharge by
using Asaoka’s method
145

Horn's method
y = -3.9714x - 94.802R2 = 0.996
-800.0-700.0-600.0-500.0-400.0-300.0-200.0-100.0
0.00 25 50 75 100 125 150 175
time(day)tim
e/se
t.
Ultimate settlement =0.227 m
Figure D.35- Estimation of final settlement at SP24 due to the surcharge by
using Horn’s method
-0.250
-0.200
-0.150
-0.100
-0.050
0.0000 25 50 75 100 125 150 175
time (day)
settl
emen
t (m
)
Figure D.36- The distribution of consolidation settlement due to the applied
load with time at SP24
146

Asaoka's Method
y = 0.9648x - 0.0073R2 = 0.9996
-0.220-0.210-0.200-0.190-0.180-0.170-0.160-0.150-0.140
-0.220-0.200-0.180-0.160-0.140 S(j-1) (m)
S(j)
(m)
Ultimate settlement =0.207 m
Figure D.37- Estimation of final settlement at SP28 due to the surcharge by
using Asaoka’s method
Horn's method
y = -4.2499x - 65.85R2 = 0.9805
-400.0-350.0-300.0-250.0-200.0-150.0-100.0-50.0
0.00 10 20 30 40 50 60 70 8
time(day)
time/
set.
0
Ultimate settlement =0.207 m
Figure D.38- Estimation of final settlement at SP28 due to the surcharge by
using Horn’s method
147

-0.200-0.180-0.160-0.140-0.120-0.100-0.080-0.060-0.040-0.0200.000
0 10 20 30 40 50 60 70 8time (day)
settl
emen
t (m
)0
Figure D.39- The distribution of consolidation settlement due to the applied
load with time at SP28
Asaoka's Method
y = 0.9663x - 0.0087R2 = 0.9995
-0.280-0.270-0.260-0.250-0.240-0.230-0.220-0.210-0.200-0.190-0.180
-0.280-0.260-0.240-0.220-0.200-0.180S(j-1) (m)
S (j)
(m)
Ultimate settlement =0.258 m
Figure D.40- Estimation of final settlement at SP29 due to the surcharge by
using Asaoka’s method
148

Horn's method
y = -3.5838x - 40.853R2 = 0.996
-450.0-400.0-350.0-300.0-250.0-200.0-150.0-100.0
-50.00.0
0 20 40 60 80 100 120time(day)
time/
set.
Ultimate settlement =0.261 m
Figure D.41- Estimation of final settlement at SP29 due to the surcharge by
using Horn’s method
-0.300
-0.250
-0.200
-0.150
-0.100
-0.050
0.0000 20 40 60 80 100 1
time (day)
settl
emen
t (m
)
20
Figure D.42- The distribution of consolidation settlement due to the applied
load with time at SP29
149

Asaoka's Method
y = 0.9809x - 0.0044R2 = 0.9997
-0.260
-0.240
-0.220
-0.200
-0.180
-0.160-0.260-0.240-0.220-0.200-0.180-0.160
S(j-1) (m)
S(j)
(m)
Ultimate settlement =0.230 m
Figure D.43- Estimation of final settlement at SP30 due to the surcharge by
using Asaoka’s method
Horn's method
y = -4.0528x - 62.657R2 = 0.998
-800.0-700.0-600.0-500.0-400.0-300.0-200.0-100.0
0.00 25 50 75 100 125 150 175
time(day)
time/
set.
Ultimate settlement =0.231 m
Figure D.44- Estimation of final settlement at SP30 due to the surcharge by
using Horn’s method
150

-0.250
-0.200
-0.150
-0.100
-0.050
0.0000 25 50 75 100 125 150 175
time (day)
settl
emen
t (m
)
Figure D.45- The distribution of consolidation settlement due to the applied
load with time at SP30
Asaoka's Method
y = 0.9577x - 0.0069R2 = 0.9977
-0.190
-0.170
-0.150
-0.130
-0.110
-0.090
-0.070-0.190-0.170-0.150-0.130-0.110-0.090-0.070
S(j-1) (m)
S(j) (m
)
Ultimate settlement =0.163 m
Figure D.46- Estimation of final settlement at SP33 due to the surcharge by
using Asaoka’s method
151

Horn's method
y = -5.2702x - 72.921R2 = 0.9795
-400.0-350.0-300.0-250.0-200.0-150.0-100.0-50.0
0.00 10 20 30 40 50
time(day)tim
e/se
t.60
Ultimate settlement =0.173 m
Figure D.47- Estimation of final settlement at SP33 due to the surcharge by
using Horn’s method
-0.180-0.160-0.140-0.120-0.100-0.080-0.060-0.040-0.0200.000
0 10 20 30 40 50 6time(day)
sett
lem
ent(
m)
0
Figure D.48- The distribution of consolidation settlement due to the applied
load with time at SP33
152

Asaoka's Method
y = 0.9583x - 0.0086R2 = 0.9977
-0.230
-0.210
-0.190
-0.170
-0.150
-0.130
-0.110-0.230-0.210-0.190-0.170-0.150-0.130-0.110
S(j-1) (m)
S(j)
(m)
Ultimate settlement =0.206 m
Figure D.49- Estimation of final settlement at SP34 due to the surcharge by
using Asaoka’s method
Horn's method
y = -4.3262x - 50.393R2 = 0.9886
-350.0
-300.0
-250.0
-200.0
-150.0
-100.0
-50.0
0.00 10 20 30 40 50 60 7
time(day)
time/
set.
0
Ultimate settlement =0.212 m
Figure D.50- Estimation of final settlement at SP34 due to the surcharge by
using Horn’s method
153

-0.250
-0.200
-0.150
-0.100
-0.050
0.0000 10 20 30 40 50 60 7
time(day)
sett
lem
ent(
m)
0
Figure D.51- Estimation of final settlement at SP34 due to the surcharge by
using Asaoka’s method
Asaoka's Method
y = 0.937x - 0.010R2 = 0.995
-0.170
-0.160
-0.150
-0.140
-0.130
-0.120-0.130-0.120
S(j) (m
)
m
Figure D.52- Estimation of f
us
Ultimate settlement =0.159
-0.170-0.160-0.150-0.140S(j-1) (m)
inal settlement at SP35 due to the surcharge by
ing Asaoka’s method
154

Horn's method
y = -6.3631x - 8.166R2 = 0.9979
-400.0-350.0-300.0-250.0-200.0-150.0-100.0
-50.00.0
0 10 20 30 40 50 6time(day)
time/
set.
0
m
Figure D.53-
-0.18-0.16-0.14-0.12-0.10-0.08-0.06-0.04-0.020.00
Sett
lem
ent (
m)
Figure D.54-
Ultimate settlement =0.157
Estimation of final settlement at SP35 due to the surcharge by
using Horn’s method
0000000000
0 10 20 30 40 50 60 70 80 90 100time (day)
The distribution of consolidation settlement due to the applied
load with time at SP35
155

Asaoka's Method
y = 0.958x - 0.0084R2 = 0.9991
-0.210
-0.205-0.200
-0.195-0.190
-0.185-0.180
-0.175-0.170
-0.210-0.200-0.190-0.180-0.170S(j-1) (m)
S (j)
(m)
Ultimate settlement =0.200 m
Figure D.55- Estimation of final settlement at SP36 due to the surcharge by
using Asaoka’s method
Horn's method
y = -5.0619x - 2.546R2 = 0.9998
-300.0
-250.0
-200.0
-150.0
-100.0
-50.0
0.00 10 20 30 40 50
time(day)
time/
set.
60
Ultimate settlement =0.198 m
Figure D.56- Estimation of final settlement at SP36 due to the surcharge by
using Horn’s method
156

-0.250
-0.200
-0.150
-0.100
-0.050
0.0000 10 20 30 40 50 60 70 80 90 100 110 120 130 140
time (day)
Sett
lem
ent (
m)
Figure D.57- The distribution of consolidation settlement due to the applied
load with time at SP36
Asaoka's Method
y = 0.9655x - 0.0066R2 = 0.9994
-0.200
-0.190
-0.180
-0.170
-0.160
-0.150-0.16-0.150
S (j)
(m)
m
Figure D.58- Estimation of f
us
Ultimate settlement =0.192
-0.200-0.190-0.180-0.1700S(j-1) (m)
inal settlement at SP37 due to the surcharge by
ing Asaoka’s method
157

Horn's method
y = -5.2665x - 6.0288R2 = 0.9991
-350.0
-300.0-250.0
-200.0-150.0
-100.0-50.0
0.00 10 20 30 40 50 6
time(day)tim
e/se
t.0
Ultimate settlement =0.190 m
Figure D.59- Estimation of final settlement at SP37 due to the surcharge by
using Horn’s method
-0.200-0.180-0.160-0.140-0.120-0.100-0.080-0.060-0.040-0.0200.000
0 10 20 30 40 50 60 70 80 90 100 110 120time (day)
Sett
lem
ent (
m)
Figure D.60- The distribution of consolidation settlement due to the applied
load with time at SP37
158

Asaoka's Method
y = 0.945x - 0.011R2 = 0.999
-0.220-0.215-0.210-0.205-0.200-0.195-0.190-0.185-0.180-0.175-0.170
-0.220-0.210-0.200-0.190-0.180-0.170S(j-1) (m)
S(j) (m
)
m
Figure D.61- Estimation of final settlement at SP38 due to the surcharge by
using Asaoka’s method
Horn's method
y = -4.8277x - 3.8342R2 = 0.9995
-350.0
-300.0
-250.0
-200.0
-150.0
-100.0
-50.0
0.00 10 20 30 40 50 60 7
time(day)
time/
set.
0
m
Figure D.62-
Ultimate settlement =0.207
Estimation of f
u
Ultimate settlement =0.208
inal settlement at SP38 due to the surcharge by
sing Horn’s method
159

-0.250
-0.200
-0.150
-0.100
-0.050
0.0000 10 20 30 40 50 60 70 80 90 100 110 120
time (day)
Sett
lem
ent (
m)
Figure D.63- The distribution of consolidation settlement due to the applied
load with time at SP38
Asaoka's Method
y = 0.948x - 0.011R2 = 0.999
-0.220
-0.210
-0.200
-0.190
-0.180
-0.170
-0.160-0.220-0.210-0.200-0.190-0.180-0.170-0.160
S(j-1) (m)
S(j)
(m)
Ultimate settlement =0.212 m
Figure D.64- Estimation of final settlement at SP39 due to the surcharge by
using Asaoka’s method
160

Horn's Method
y = -4.2312x - 77.801R2 = 0.9961
-800.0-700.0-600.0-500.0-400.0-300.0-200.0-100.0
0.00 25 50 75 100 125 150 175
time(day)tim
e/se
t.
Ultimate settlement =0.212 m
Figure D.65- Estimation of final settlement at SP39 due to the surcharge by
using Horn’s method
-0.250
-0.200
-0.150
-0.100
-0.050
0.0000 25 50 75 100 125 150 175
time(day)
Settl
emen
t (m
)
Figure D.66- The distribution of consolidation settlement due to the applied
load with time at SP39
161

Asaoka's Method
y = 0.935x - 0.010R2 = 0.993
-0.170-0.165-0.160-0.155-0.150
-0.145-0.140-0.135-0.130
-0.1-0.130
S(j) (m
)
m
Figure D.67- Estimation of f
us
-250.0
-200.0
-150.0
-100.0
-50.0
0.00 5
time/
set.
Ultimate
Figure D.68- Estimation of f
u
Ultimate settlement =0.154
-0.170-0.160-0.15040S(j-1) (m)
inal settlement at SP40 due to the surcharge by
ing Asaoka’s method
Horn's method
y = -6.376x - 3.5035R2 = 0.9989
10 15 20 25 30 35time(day)
settlement =0.157 m
inal settlement at SP40 due to the surcharge by
sing Horn’s method
162

-0.180-0.160-0.140-0.120-0.100-0.080-0.060-0.040-0.0200.000
0 10 20 30 40 50 6time (day)
Sett
lem
ent (
m)
0
Figure D.69- The distribution of consolidation settlement due to the applied
load with time at SP40
Asaoka's Method
y = 0.967x - 0.007R2 = 0.997
-0.250-0.230-0.210-0.190-0.170-0.150-0.130-0.110
-0.250-0.230-0.210-0.190-0.170-0.150-0.130-0.110S(j-1) (m)
S(j) (m
)
Ultimate settlement =0.212 m
Figure D.70- Estimation of final settlement at SP41 due to the surcharge by
using Asaoka’s method
163

Horn's method
y = -4.145x - 53.248R2 = 0.9957
-400.0-350.0-300.0-250.0-200.0-150.0-100.0-50.0
0.00 10 20 30 40 50 60 70 80
time(day)tim
e/se
t.
m
Figure D.71-
-0.250
-0.200
-0.150
-0.100
-0.050
0.000
Sett
lem
ent (
m)
Figure D.72-
Ultimate settlement =0.222
Estimation of final settlement at SP41 due to the surcharge by
using Horn’s method
0 10 20 30 40 50 60 70 8time (day)
0
The distribution of consolidation settlement due to the applied
load with time at SP41
164

Asaoka's Method
y = 0.945x - 0.014R2 = 0.996
-0.290-0.270-0.250-0.230-0.210-0.190-0.170-0.150-0.130-0.110
-0.290-0.270-0.250-0.230-0.210-0.190-0.170-0.150-0.130-0.110S(j-1) (m)
S(j)
(m)
Ultimate settlement =0.254 m
Figure D.73- Estimation of final settlement at SP42 due to the surcharge by
using Asaoka’s method
Horn's method
y = -3.1442x - 82.794R2 = 0.9963
-400.0-350.0-300.0-250.0-200.0-150.0-100.0-50.0
0.00 10 20 30 40 50 60 70 80 90 100
time(day)
time/
set.
Ultimate settlement =0.256 m
Figure D.74- Estimation of final settlement at SP42 due to the surcharge by
using Horn’s method
165
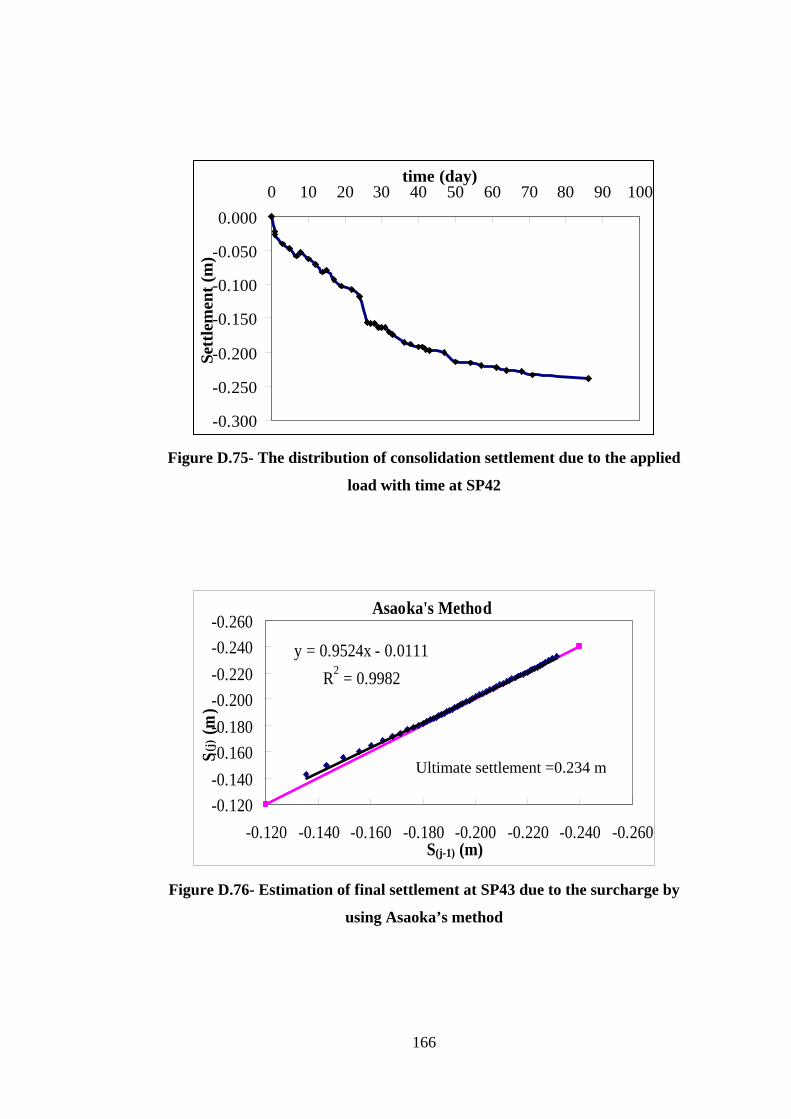
-0.300
-0.250
-0.200
-0.150
-0.100
-0.050
0.0000 10 20 30 40 50 60 70 80 90 100
time (day)
Sett
lem
ent (
m)
Figure D.75- The distribution of consolidation settlement due to the applied
load with time at SP42
Asaoka's Method
y = 0.9524x - 0.0111R2 = 0.9982
-0.260-0.240-0.220-0.200-0.180-0.160-0.140-0.120
-0.260-0.240-0.220-0.200-0.180-0.160-0.140-0.120S(j-1) (m)
S(j)
(m)
Ultimate settlement =0.234 m
Figure D.76- Estimation of final settlement at SP43 due to the surcharge by
using Asaoka’s method
166
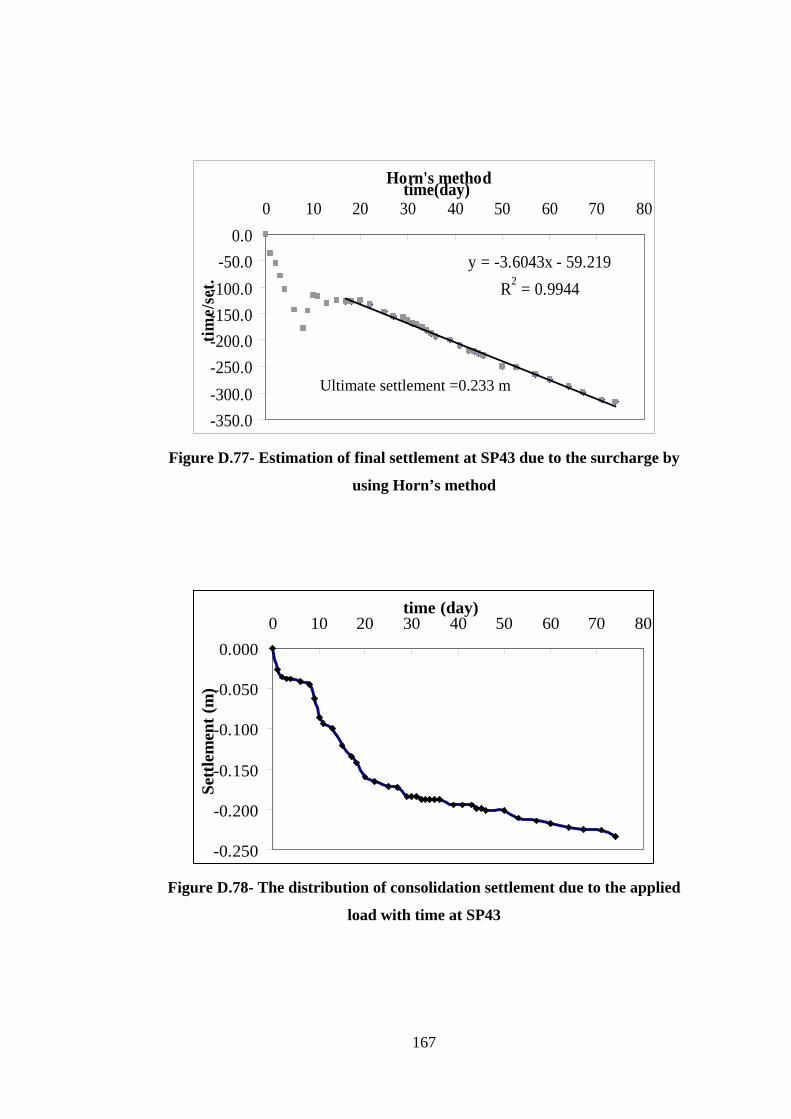
Horn's method
y = -3.6043x - 59.219R2 = 0.9944
-350.0-300.0-250.0-200.0-150.0-100.0
-50.00.0
0 10 20 30 40 50 60 70 8time(day)
time/
set.
0
Ultimate settlement =0.233 m
Figure D.77- Estimation of final settlement at SP43 due to the surcharge by
using Horn’s method
-0.250
-0.200
-0.150
-0.100
-0.050
0.0000 10 20 30 40 50 60 70 80
time (day)
Sett
lem
ent (
m)
Figure D.78- The distribution of consolidation settlement due to the applied
load with time at SP43
167

Asaoka's Method
y = 0.9591x - 0.0104R2 = 0.9972
-0.280-0.260-0.240-0.220-0.200-0.180-0.160-0.140-0.120
-0.280-0.260-0.240-0.220-0.200-0.180-0.160-0.140-0.120S(j-1) (m)
S(j) (m
)
Ultimate settlement =0.254 m
Figure D.79- Estimation of final settlement at SP44 due to the surcharge by
using Asaoka’s method
Horn's method
y = -3.608x - 36.64R2 = 0.9972
-350.0
-300.0
-250.0
-200.0
-150.0
-100.0
-50.0
0.00 10 20 30 40 50 60 70 80
time(day)
time/
set.
Ultimate settlement =0.258 m
Figure D.80- Estimation of final settlement at SP44 due to the surcharge by
using Horn’s method
168
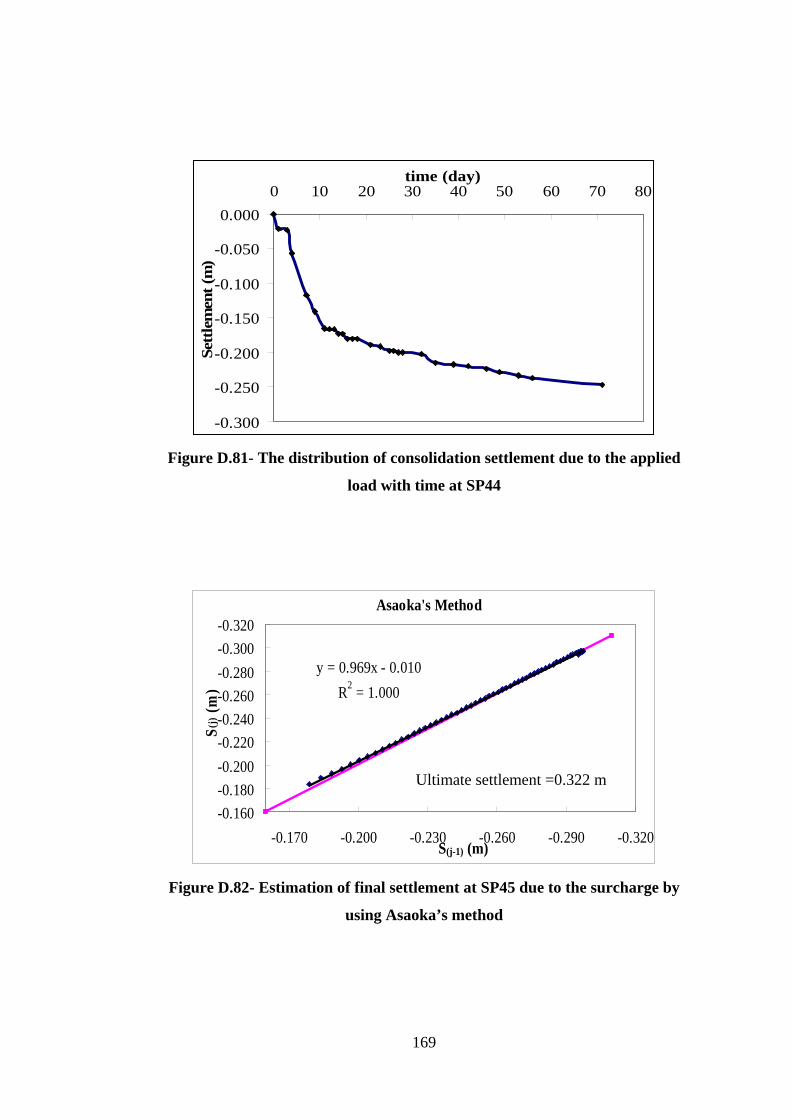
-0.300
-0.250
-0.200
-0.150
-0.100
-0.050
0.0000 10 20 30 40 50 60 70 80
time (day)
Sett
lem
ent (
m)
Figure D.81- The distribution of consolidation settlement due to the applied
load with time at SP44
Asaoka's Method
y = 0.969x - 0.010R2 = 1.000
-0.320-0.300-0.280-0.260-0.240-0.220-0.200-0.180-0.160
-0.320-0.290-0.260-0.230-0.200-0.170S(j-1) (m)
S(j)
(m)
Ultimate settlement =0.322 m
Figure D.82- Estimation of final settlement at SP45 due to the surcharge by
using Asaoka’s method
169

Horn's method
y = -2.4299x - 78.918R2 = 0.9963
-350.0-300.0-250.0-200.0
-150.0-100.0-50.0
0.00 10 20 30 40 50 60 70 80 90 100
time(day)tim
e/se
t.
Ultimate settlement =0.320 m
Figure D.83- Estimation of final settlement at SP45 due to the surcharge by
using Horn’s method
-0.350
-0.300
-0.250
-0.200
-0.150
-0.100
-0.050
0.0000 10 20 30 40 50 60 70 80 90 100
time (day)
Sett
lem
ent (
m)
Figure D.84- The distribution of consolidation settlement due to the applied
load with time at SP45
170

Asaoka's Method
y = 0.9538x - 0.0123R2 = 0.9991
-0.290-0.270-0.250-0.230-0.210-0.190-0.170-0.150-0.130-0.110
-0.290-0.260-0.230-0.200-0.170-0.140-0.110S(j-1) (m)
S(j) (m
)
Ultimate settlement =0.266 m
Figure D.85- Estimation of final settlement at SP46 due to the surcharge by
using Asaoka’s method
Horn's method
y = -2.8472x - 75.561R2 = 0.9963
-350.0-300.0-250.0-200.0-150.0-100.0-50.0
0.00 10 20 30 40 50 60 70 80
time(day)
time/
set.
Ultimate settlement =0.289 m
Figure D.86- Estimation of final settlement at SP46 due to the surcharge by
using Horn’s method
171

-0.300
-0.250
-0.200
-0.150
-0.100
-0.050
0.0000 10 20 30 40 50 60 70 80
time (day)
Settl
emen
t (m
)
Figure D.87- The distribution of consolidation settlement due to the applied
load with time at SP46
Asaoka's Method
y = 0.938x - 0.0144R2 = 0.9987
-0.260-0.240-0.220-0.200-0.180-0.160-0.140-0.120
-0.260-0.240-0.220-0.200-0.180-0.160-0.140-0.120S(j-1) (m)
S(j) (m
)
Ultimate settlement =0.238 m
Figure D.88- Estimation of final settlement at SP47 due to the surcharge by
using Asaoka’s method
172
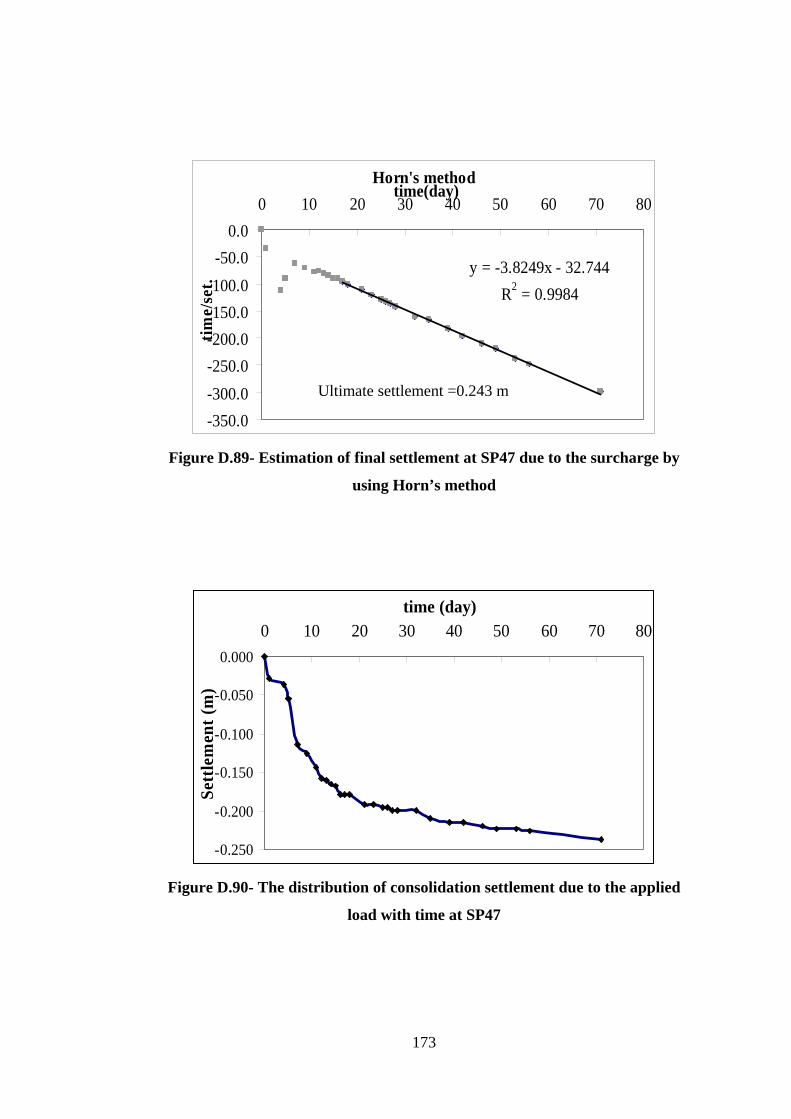
Horn's method
y = -3.8249x - 32.744R2 = 0.9984
-350.0-300.0-250.0-200.0-150.0-100.0-50.0
0.00 10 20 30 40 50 60 70 8
time(day)tim
e/se
t.0
Ultimate settlement =0.243 m
Figure D.89- Estimation of final settlement at SP47 due to the surcharge by
using Horn’s method
-0.250
-0.200
-0.150
-0.100
-0.050
0.0000 10 20 30 40 50 60 70 8
time (day)
Sett
lem
ent (
m)
0
Figure D.90- The distribution of consolidation settlement due to the applied
load with time at SP47
173

Asaoka's Method
y = 0.9536x - 0.0134R2 = 0.999
-0.320-0.300-0.280-0.260-0.240-0.220-0.200-0.180-0.160-0.140
-0.320-0.290-0.260-0.230-0.200-0.170-0.140S(j-1) (m)
S (j)
(m)
Ultimate settlement =0.288 m
Figure D.91- Estimation of final settlement at SP48 due to the surcharge by
using Asaoka’s method
Horn's method
y = -2.8627x - 54.831R2 = 0.9987
-350.0-300.0-250.0-200.0-150.0-100.0
-50.00.0
0 10 20 30 40 50 60 70 80 90time(day)
time/
set.
Ultimate settlement =0.304 m
Figure D.92- Estimation of final settlement at SP48 due to the surcharge by
using Horn’s method
174

-0.300
-0.250
-0.200
-0.150
-0.100
-0.050
0.0000 10 20 30 40 50 60 70 80 90
time (day)
Settl
emen
t (m
)
Figure D.93- The distribution of consolidation settlement due to the applied
load with time at SP48
Asaoka's Method
y = 0.9639x - 0.0087R2 = 0.9989
-0.260
-0.240
-0.220
-0.200
-0.180
-0.160
-0.140-0.260-0.240-0.220-0.200-0.180-0.160-0.140
S(j-1) (m)
S(j) (m
)
Ultimate settlement =0.241 m
Figure D.94- Estimation of final settlement at SP49 due to the surcharge by
using Asaoka’s method
175

Horn's method
y = -3.5746x - 60.092R2 = 0.9958
-350.0-300.0
-250.0-200.0
-150.0-100.0
-50.00.0
0 10 20 30 40 50 60 70 8time(day)
time/
set.
0
Ultimate settlement =0.244 m
Figure D.95- Estimation of final settlement at SP49 due to the surcharge by
using Horn’s method
-0.250
-0.200
-0.150
-0.100
-0.050
0.0000 10 20 30 40 50 60 70 80
time (day)
Sett
lem
ent (
m)
Figure D.96- The distribution of consolidation settlement due to the applied
load with time at SP49
176

Asaoka's Method
y = 0.964x - 0.0058R2 = 0.9979
-0.180-0.170-0.160-0.150-0.140-0.130-0.120-0.110-0.100-0.090
-0.180-0.165-0.150-0.135-0.120-0.105-0.090S(j-1) (m)
S(j) (m
)
Ultimate settlement =0.166 m
Figure D.97- Estimation of final settlement at SP50 due to the surcharge by
using Asaoka’s method
Horn's method
y = -4.7043x - 135.5R2 = 0.9925
-700.0
-600.0
-500.0
-400.0
-300.0
-200.0
-100.0
0.00 20 40 60 80 100 1
time(day)
time/
set.
20
Ultimate settlement =0.202 m
Figure D.98- Estimation of final settlement at SP50 due to the surcharge by
using Horn’s method
177
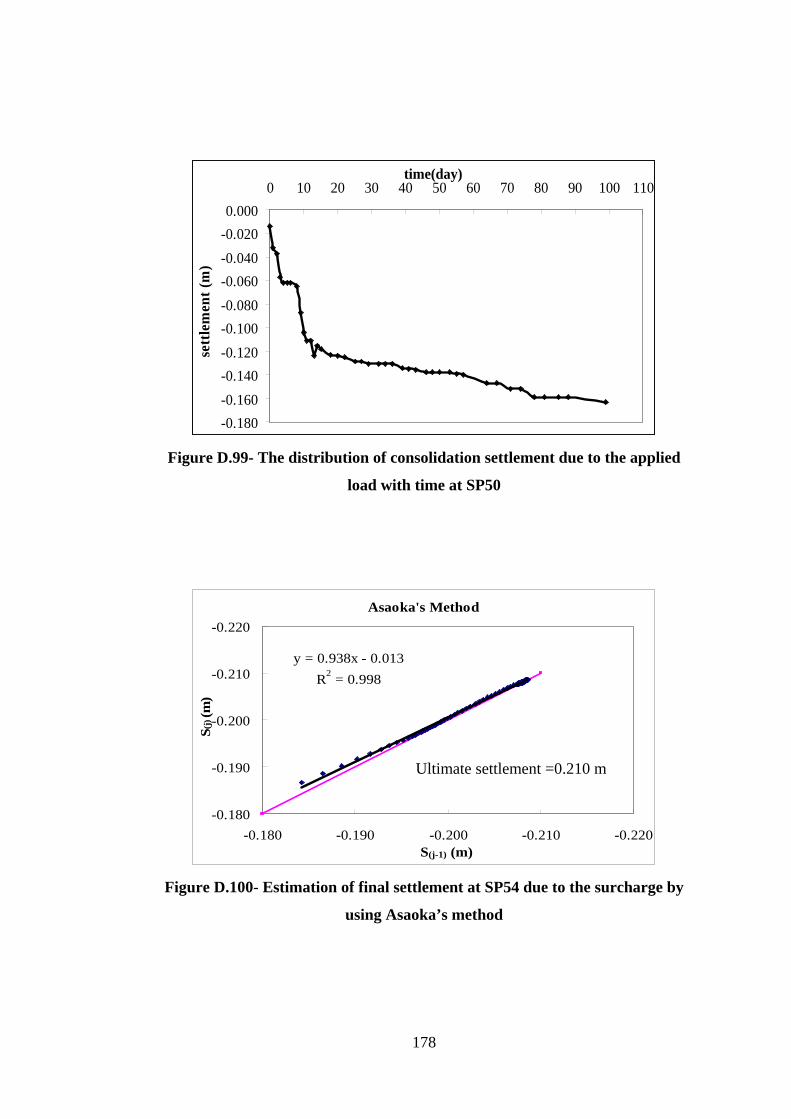
-0.180-0.160-0.140-0.120-0.100-0.080-0.060-0.040-0.0200.000
0 10 20 30 40 50 60 70 80 90 100 110time(day)
sett
lem
ent (
m)
Figure D.99- The distribution of consolidation settlement due to the applied
load with time at SP50
Asaoka's Method
y = 0.938x - 0.013R2 = 0.998
-0.220
-0.210
-0.200
-0.190
-0.180-0.220-0.210-0.200-0.190-0.180
S(j-1) (m)
S(j)
(m)
Ultimate settlement =0.210 m
Figure D.100- Estimation of final settlement at SP54 due to the surcharge by
using Asaoka’s method
178
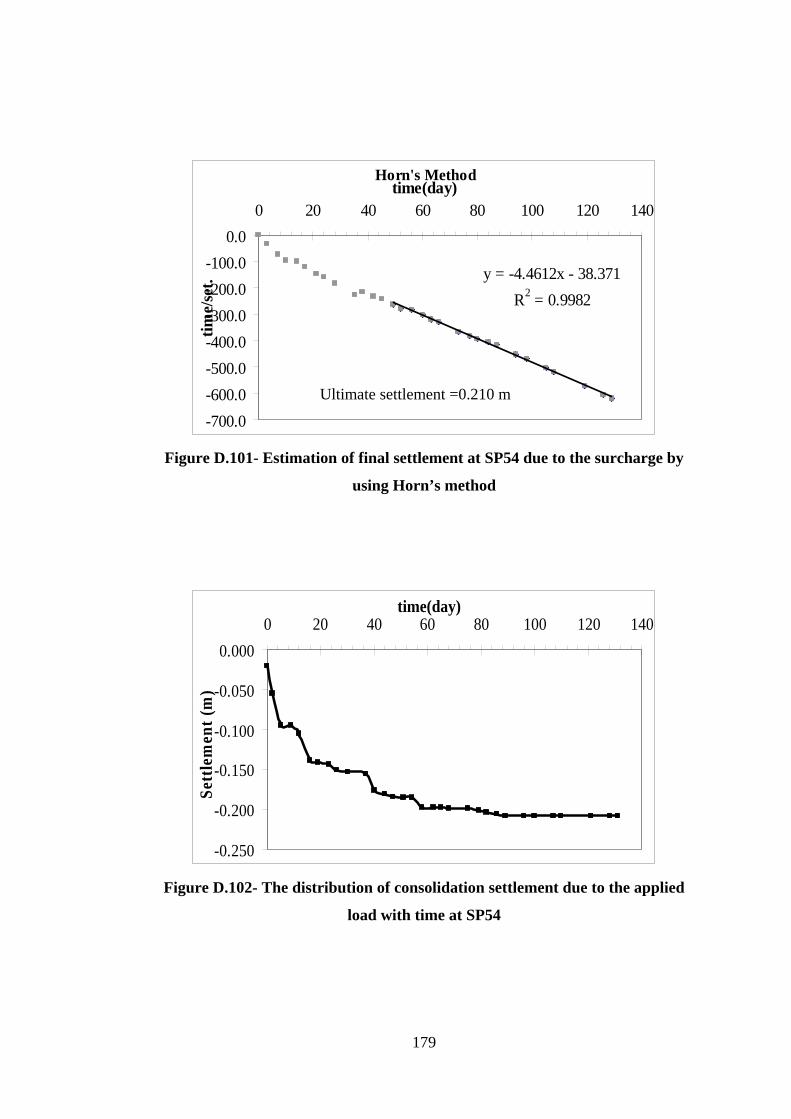
Horn's Method
y = -4.4612x - 38.371R2 = 0.9982
-700.0-600.0-500.0-400.0-300.0-200.0-100.0
0.00 20 40 60 80 100 120 140
time(day)tim
e/se
t.
Ultimate settlement =0.210 m
Figure D.101- Estimation of final settlement at SP54 due to the surcharge by
using Horn’s method
-0.250
-0.200
-0.150
-0.100
-0.050
0.0000 20 40 60 80 100 120 140
time(day)
Sett
lem
ent (
m)
Figure D.102- The distribution of consolidation settlement due to the applied
load with time at SP54
179

Asaoka's Method
y = 0.935x - 0.008R2 = 0.997
-0.150
-0.140
-0.130
-0.120
-0.110
-0.100
-0.090
-0.080-0.150-0.140-0.130-0.120-0.110-0.100-0.090-0.080
S(j-1) (m)
S(j)
(m)
Ultimate settlement =0.129 m
Figure D.103- Estimation of final settlement at SP13 due to the surcharge by
using Asaoka’s method
Horn's method
y = -7.4655x - 25.888R2 = 0.996
-400.0-350.0-300.0-250.0-200.0-150.0-100.0-50.0
0.00 10 20 30 40 5
time(day)
time/
set.
0
Ultimate settlement =0.134 m
Figure D.104- Estimation of final settlement at SP13 due to the surcharge by
using Horn’s method
180

-0.140
-0.120
-0.100
-0.080
-0.060
-0.040
-0.020
0.0000 10 20 30 40 5
time (day)
Settl
emen
t (m
)0
Figure D.105- The distribution of consolidation settlement due to the applied
load with time at SP13
Asaoka's Method
y = 0.948x - 0.010R2 = 0.996
-0.200
-0.190
-0.180
-0.170
-0.160
-0.150
-0.140-0.200-0.190-0.180-0.170-0.160-0.150-0.140
S(j-1) (m)
S (j)
(m)
Ultimate settlement =0.194 m
Figure D.106- Estimation of final settlement at SP14 due to the surcharge by
using Asaoka’s method
181

Horn's method
y = -5.0656x - 16.76R2 = 0.9984
-300.0
-250.0
-200.0
-150.0
-100.0
-50.0
0.00 10 20 30 40 5
time(day)tim
e/se
t.0
Ultimate settlement =0.197 m
Figure D.107- Estimation of final settlement at SP14 due to the surcharge by
using Horn’s method
-0.200
-0.150
-0.100
-0.050
0.0000 10 20 30 40 5
time (day)
Settl
emen
t (m
)
0
Figure D.108- The distribution of consolidation settlement due to the applied
load with time at SP14
182

Asaoka's Method
y = 0.965x - 0.007R2 = 0.970
-0.200-0.195-0.190-0.185-0.180-0.175-0.170-0.165-0.160
-0.200-0.195-0.190-0.185-0.180-0.175-0.170-0.165-0.160S(j-1) (m)
S(j)
(m)
Ultimate settlement =0.200 m
Figure D.109- Estimation of final settlement at SP15 due to the surcharge by
using Asaoka’s method
Horn's method
y = -4.4086x - 186.71R2 = 0.9723
-1000.0
-800.0
-600.0
-400.0
-200.0
0.00 25 50 75 100 125 150 175
time(day)
time/
set.
Ultimate settlement =0.226 m
Figure D.110- Estimation of final settlement at SP15 due to the surcharge by
using Horn’s method
183

-0.200
-0.150
-0.100
-0.050
0.0000 20 40 60 80 100 120 140 160 180
time (day)
Settl
emen
t (m
)
Figure D.111- The distribution of consolidation settlement due to the applied
load with time at SP15
Asaoka's Method
y = 0.977x - 0.006R2 = 0.985
-0.240-0.235-0.230-0.225-0.220-0.215-0.210-0.205-0.200-0.195-0.190
-0.240-0.230-0.220-0.210-0.200-0.190 S(j-1) (m)
S (j)
(m)
Ultimate settlement =0.263 m
Figure D.112- Estimation of final settlement at SP20 due to the surcharge by
using Asaoka’s method
184

Horn's method
y = -3.8038x - 88.493R2 = 0.991
-700.0
-600.0
-500.0
-400.0
-300.0
-200.0
-100.0
0.00 25 50 75 100 125 150
time(day)tim
e/se
t.
m
Figure D.113
-0.250
-0.200
-0.150
-0.100
-0.050
0.000
Settl
emen
t (m
)
Figure D.114
Ultimate settlement =0.263
- Estimation of final settlement at SP20 due to the surcharge by
using Horn’s method
0 20 40 60 80 100 120 140 160time (day)
- The distribution of consolidation settlement due to the applied
load with time at SP20
185

Asaoka's Method
y = 1.011x + 0.001R2 = 0.962
-0.190
-0.185
-0.180
-0.175
-0.170
-0.165
-0.160-0.165-0.160
S (j)
(m
)
m
Figure D.115- Estimation o
u
-1200.0
-1000.0
-800.0
-600.0
-400.0
-200.0
0.00 25
time/
set.
Ul
Figure D.116- Estimation o
Ultimate settlement =0.182
-0.190-0.185-0.180-0.175-0.170S(j-1) (m)
f final settlement at SP21 due to the surcharge by
sing Asaoka’s method
Horn's method
y = -5.2615x - 98.046R2 = 0.9949
50 75 100 125 150 175time(day)
timate settlement =0.190 m
f final settlement at SP21 due to the surcharge by
using Horn’s method
186

-0.200
-0.150
-0.100
-0.050
0.0000 20 40 60 80 100 120 140 160 180
time (day)
Settl
emen
t (m
)
Figure D.117- The distribution of consolidation settlement due to the applied
load with time at SP21
Asaoka's Method
y = 0.925x - 0.012R2 = 0.998
-0.180-0.170-0.160-0.150-0.140-0.130-0.120-0.110-0.100-0.090-0.080
-0.180-0.170-0.160-0.150-0.140-0.130-0.120-0.110-0.100-0.090-0.080S(j-1) (m)
S (j)
(m)
Ultimate settlement =0.169 m
Figure D.118- Estimation of final settlement at SP25 due to the surcharge by
using Asaoka’s method
187

Horn's method
y = -5.938x - 37.631R2 = 0.9952
-900.0-800.0-700.0-600.0-500.0-400.0-300.0-200.0-100.0
0.00 25 50 75 100 125 1
time(day)tim
e/se
t.50
m
Figure D.119-
-0.180-0.160-0.140-0.120-0.100-0.080-0.060-0.040-0.0200.000
Settl
emen
t (m
)
Figure D.120- T
Ultimate settlement =0.169
Estimation of final settlement at SP25 due to the surcharge by
using Horn’s method
0 20 40 60 80 100 120 14time (day)
0
he distribution of consolidation settlement due to the applied
load with time at SP25
188
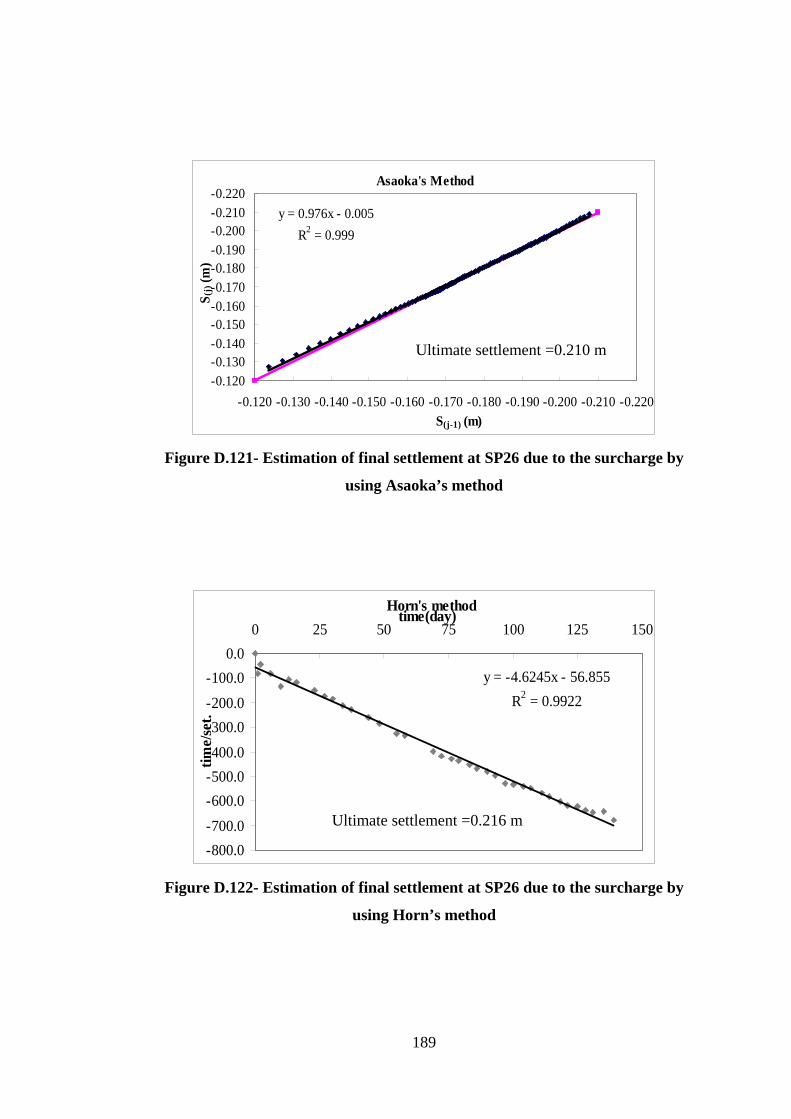
Asaoka's Method
y = 0.976x - 0.005R2 = 0.999
-0.220-0.210-0.200-0.190-0.180-0.170-0.160-0.150-0.140-0.130-0.120
-0-0.140-0.130-0.120
S (j)
(m)
m
Figure D.121- Estimation of
us
-800.0-700.0-600.0-500.0-400.0-300.0-200.0-100.0
0.00 25
time/
set.
Figure D.122- Estimation of
u
Ultimate settlement =0.210
-0.220-0.210-0.200-0.190-0.180-0.170-0.160.150S(j-1) (m)
final settlement at SP26 due to the surcharge by
ing Asaoka’s method
Horn's method
y = -4.6245x - 56.855R2 = 0.9922
50 75 100 125 150time(day)
m
Ultimate settlement =0.216final settlement at SP26 due to the surcharge by
sing Horn’s method
189

-0.250
-0.200
-0.150
-0.100
-0.050
0.0000 20 40 60 80 100 120 140 16
time (day)
Settl
emen
t (m
)0
Figure D.123- The distribution of consolidation settlement due to the applied
load with time at SP26
Asaoka's Method
y = 0.981x - 0.004R2 = 1.000
-0.230-0.220-0.210-0.200-0.190-0.180-0.170-0.160-0.150-0.140
-0.230-0.220-0.210-0.200-0.190-0.180-0.170-0.160-0.150-0.140S(j-1) (m)
S(j)
(m)
Ultimate settlement =0.220 m
Figure D.124- Estimation of final settlement at SP27 due to the surcharge by
using Asaoka’s method
190

Horn's method
y = -4.4201x - 55.14R2 = 0.9955
-900.0-800.0-700.0-600.0-500.0-400.0-300.0-200.0-100.0
0.00 25 50 75 100 125 150 175
time(day)tim
e/se
t.
m
Figure D.125- Es
-0.250
-0.200
-0.150
-0.100
-0.050
0.0000
Settl
emen
t (m
)
Figure D.126- Th
Ultimate settlement =0.226
timation of final settlement at SP27 due to the surcharge by
using Horn’s method
20 40 60 80 100 120 140 160 180time (day)
e distribution of consolidation settlement due to the applied
load with time at SP27
191

Asaoka's Method
y = 0.9321x - 0.006R2 = 0.9966
-0.100
-0.090-0.080
-0.070-0.060
-0.050-0.040
-0.030-0.100-0.090-0.080-0.070-0.060-0.050-0.040-0.030
S(j-1) (m)
S(j)
(m)
Ultimate settlement =0.088 m
Figure D.127- Estimation of final settlement at BSP1 due to the surcharge by
using Asaoka’s method
Horn's method
y = -12.219x + 50.359R2 = 0.9658
-1000.0-900.0-800.0-700.0-600.0-500.0-400.0-300.0-200.0-100.0
0.00 10 20 30 40 50 60 70 8
time(day)
time/
set.
0
Ultimate settlement =0.093 m
Figure D.128- Estimation of final settlement at BSP1 due to the surcharge by
using Horn’s method
192

-0.120
-0.100
-0.080
-0.060
-0.040
-0.020
0.0000 10 20 30 40 50 60 70 8
time (day)
Sett
lem
ent (
m)
0
Figure D.129- The distribution of consolidation settlement due to the applied
load with time at BSP1
Asaoka's Method
y = 0.932x - 0.006R2 = 0.994
-0.095
-0.090
-0.085
-0.080
-0.075
-0.070
-0.065
-0.060-0.095-0.090-0.085-0.080-0.075-0.070-0.065-0.060
S(j-1) (m)
S(j)
(m)
Ultimate settlement =0.088 m
Figure D.130- Estimation of final settlement at BSP2 due to the surcharge by
using Asaoka’s method
193

Horn's method
y = -12.355x + 6.2347R2 = 0.9709
-900.0-800.0-700.0-600.0-500.0-400.0-300.0-200.0-100.0
0.00 10 20 30 40 50 6time(day)
time/
set.
0
Ultimate settlement =0.088 m
Figure D.131- Estimation of final settlement at BSP2 due to the surcharge by
using Horn’s method
-0.100-0.090-0.080-0.070-0.060-0.050-0.040-0.030-0.020-0.0100.000
0 10 20 30 40 50 6time (day)
Sett
lem
ent (
m)
0
Figure D.132- The distribution of consolidation settlement due to the applied
load with time at BSP2
194

Asaoka's Method
y = 0.9511x - 0.0046R2 = 0.997
-0.090-0.085-0.080-0.075-0.070-0.065-0.060-0.055-0.050-0.045
-0.090-0.080-0.070-0.060-0.050 S(j-1) (m)
S(j)
(m)
Ultimate settlement =0.095 m
Figure D.133- Estimation of final settlement at BSP3 due to the surcharge by
using Asaoka’s method
-0.090-0.080-0.070-0.060-0.050-0.040-0.030-0.020-0.0100.000
0 10 20 30 40 5time (day)
Sett
lem
ent (
m)
0
Figure D.134- The distribution of consolidation settlement due to the applied
load with time at BSP3
195

Horn's method
y = -10.023x - 93.233R2 = 0.996
-600.0
-500.0
-400.0
-300.0
-200.0
-100.0
0.00 10 20 30 40
time(day)tim
e/se
t.50
m
Figure D.135- E
-0.120-0.115-0.110-0.105-0.100-0.095-0.090-0.085-0.080-0.075-0.070
-0.0
S (j) (m
)
Figure D.136- E
Ultimate settlement =0.091
stimation of final settlement at BSP3 due to the surcharge by
using Horn’s method
Asaoka's Method
y = 0.9543x - 0.0056R2 = 0.989
-0.120-0.110-0.100-0.090-0.08070S(j-1) (m)
Ultimate settlement =0.123 m
stimation of final settlement at BSP4 due to the surcharge by
using Asaoka’s method
196

-0.120
-0.100
-0.080
-0.060
-0.040
-0.020
0.0000 10 20 30 40 5
time (day)
Sett
lem
ent (
m)
0
Figure D.137- The distribution of consolidation settlement due to the applied
load with time at BSP4
Horn's method
y = -7.567x - 67.912R2 = 0.993
-450.0-400.0-350.0-300.0-250.0-200.0-150.0-100.0-50.0
0.00 10 20 30 40 5
time(day)
time/
set.
0
Ultimate settlement =0.121 m
Figure D.138- Estimation of final settlement at BSP4 due to the surcharge by
using Horn’s method
197

Asaoka's Method
y = 0.9574x - 0.0051R2 = 0.9914
-0.110
-0.100
-0.090
-0.080
-0.070
-0.060
-0.050--0.060-0.050
S(j)
(m)
m
Figure D.139- Estimation of fin
usin
-0.120
-0.100
-0.080
-0.060
-0.040
-0.020
0.0000 10
Sett
lem
ent (
m)
Figure D.140- The distribution
load
Ultimate settlement =0.119
-0.110-0.100-0.090-0.0800.070S(j-1) (m)
al settlement at BSP5 due to the surcharge by
g Asaoka’s method
20 30 40 5time (day)
0
of consolidation settlement due to the applied
with time at BSP5
198
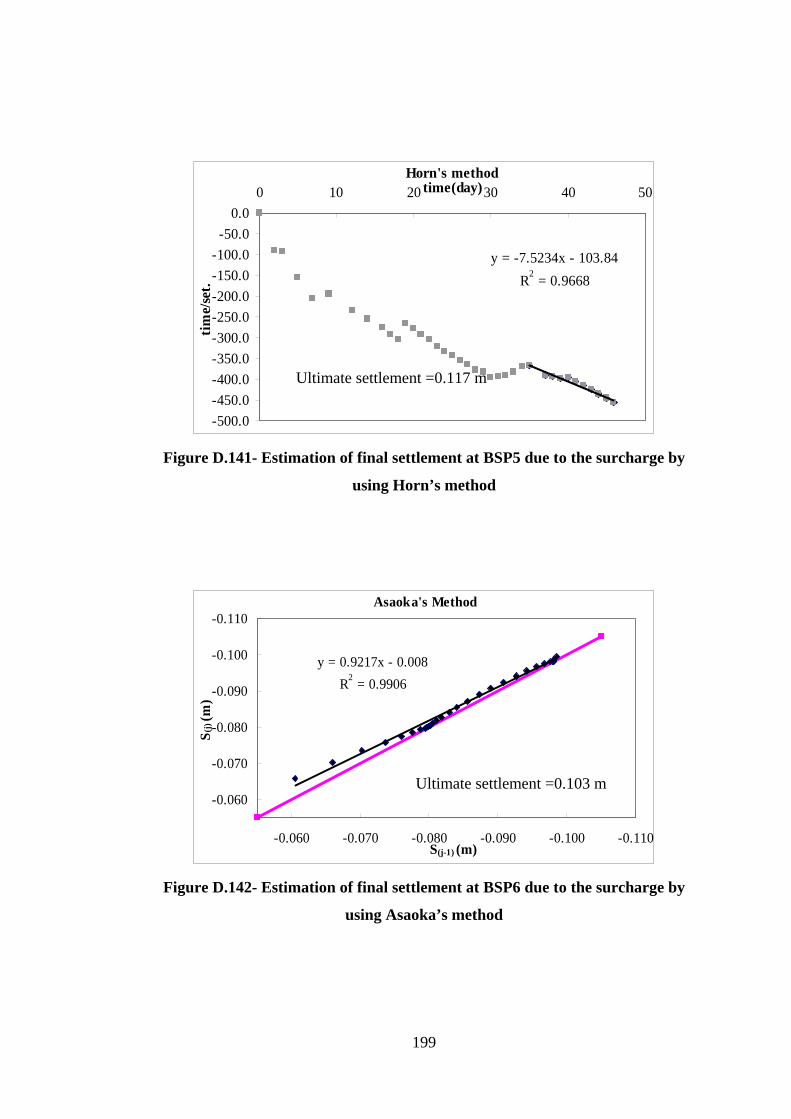
Horn's method
y = -7.5234x - 103.84R2 = 0.9668
-500-450-400-350.0-300.0-250.0-200.0-150.0-100.0
-50.00.0
0 10 20 30 40 5time(day)tim
e/se
t.0
m
Figure D.14
-0.11
-0.10
-0.09
-0.08
-0.07
-0.06
S (j)
(m)
Figure D.14
.0 Ultimate settlement =0.117
.0
.0
1- Estimation of final settlement at BSP5 due to the surcharge by
using Horn’s method
Asaoka's Method
y = 0.9217x - 0.008R2 = 0.9906
0
0
0
0
0
0
-0.110-0.100-0.090-0.080-0.070-0.060S(j-1) (m)
Ultimate settlement =0.103 m
2- Estimation of final settlement at BSP6 due to the surcharge by
using Asaoka’s method
199
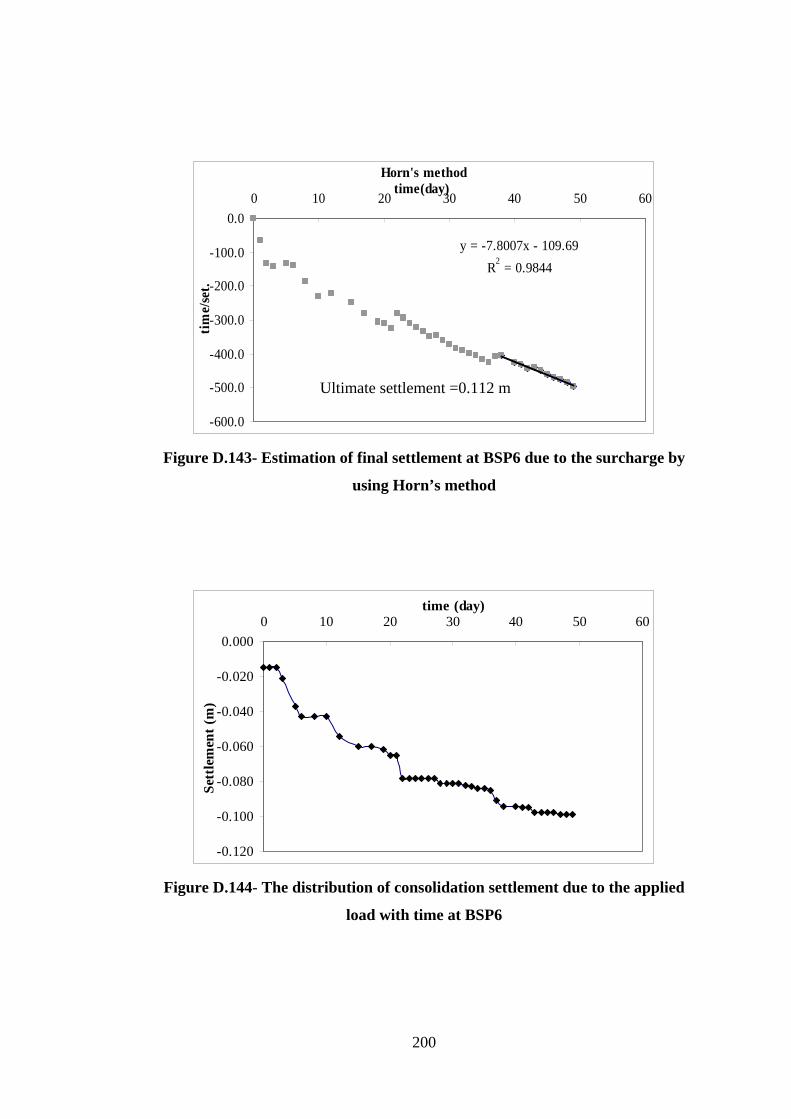
Horn's method
y = -7.8007x - 109.69R2 = 0.9844
-600.0
-500.0
-400.0
-300.0
-200.0
-100.0
0.00 10 20 30 40 50
time(day)tim
e/se
t.60
Ultimate settlement =0.112 m
Figure D.143- Estimation of final settlement at BSP6 due to the surcharge by
using Horn’s method
-0.120
-0.100
-0.080
-0.060
-0.040
-0.020
0.0000 10 20 30 40 50 6
time (day)
Sett
lem
ent (
m)
0
Figure D.144- The distribution of consolidation settlement due to the applied
load with time at BSP6
200
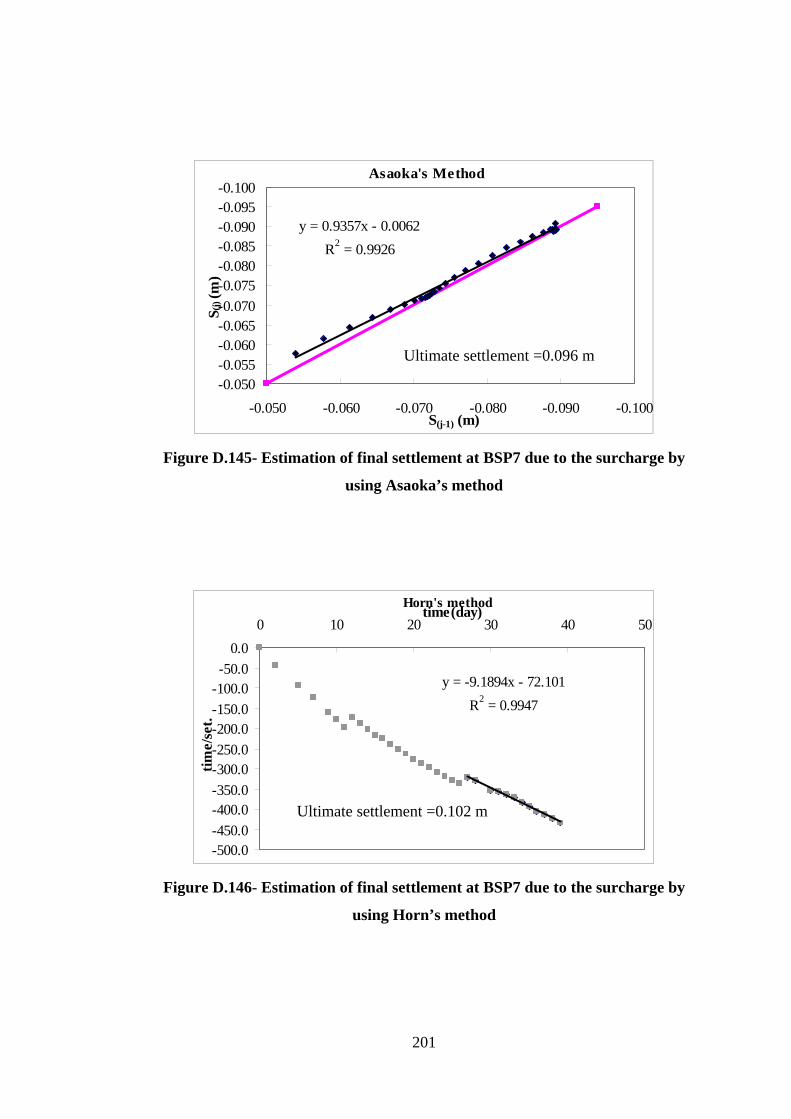
Asaoka's Method
y = 0.9357x - 0.0062R2 = 0.9926
-0.100-0.095-0.090-0.085-0.080-0.075-0.070-0.065-0.060-0.055-0.050
-0.06-0.050
S (j)
(m)
m
Figure D.145- Estimation o
u
-500.0-450.0-400.0-350.0-300.0-250.0-200.0-150.0-100.0-50.0
0.00 10
time/
set.
Ultimate
Figure D.146- Estimation o
Ultimate settlement =0.096
-0.100-0.090-0.080-0.0700S(j-1) (m)
f final settlement at BSP7 due to the surcharge by
sing Asaoka’s method
Horn's method
y = -9.1894x - 72.101R2 = 0.9947
20 30 40 5time(day)
0
settlement =0.102 m
f final settlement at BSP7 due to the surcharge by
using Horn’s method
201

-0.100-0.090-0.080-0.070-0.060-0.050-0.040-0.030-0.020-0.0100.000
0 10 20 30 40 5time (day)
Sett
lem
ent (
m)
0
Figure D.147- The distribution of consolidation settlement due to the applied
load with time at BSP7
Asaoka's Method
y = 0.9173x - 0.0064R2 = 0.9873
-0.085
-0.080
-0.075
-0.070
-0.065
-0.060
-0.055-0.085-0.080-0.075-0.070-0.065-0.060-0.055
S(j-1) (m)
S(j)
(m)
Ultimate settlement =0.083 m
Figure D.148- Estimation of final settlement at BSP12 due to the surcharge by
using Asaoka’s method
202

Horn's method
y = -12.906x - 21.789R2 = 0.9944
-1000.0-900.0-800.0-700.0-600.0-500.0-400.0-300.0-200.0-100.0
0.00 10 20 30 40 50 60 70 8
time(day)tim
e/se
t.0
m
Figure D.149- Est
-0.090
-0.080
-0.070
-0.060
-0.050
-0.040
-0.030
-0.020
-0.010
0.0000
Sett
lem
ent (
m)
Figure D.150- Th
Ultimate settlement =0.081
imation of final settlement at BSP12 due to the surcharge by
using Horn’s method
10 20 30 40 50 60 70 80time (day)
e distribution of consolidation settlement due to the applied
load with time at BSP12
203

Asaoka's Method
y = 0.971x - 0.003R2 = 0.998
-0.095-0.090-0.085-0.080-0.075-0.070-0.065-0.060-0.055
-0.065-0.060-0.055
S (j)
(m)
m
Figure D.151- Estimation of fin
usin
-1000.0-900.0-800.0-700.0-600.0-500.0-400.0-300.0-200.0-100.0
0.00 10 20
time/
set.
Ultim
Figure D.152- Estimation of fin
usi
Ultimate settlement =0.103
-0.095-0.090-0.085-0.080-0.075-0.070 S(j-1) (m)
al settlement at BSP13 due to the surcharge by
g Asaoka’s method
Horn's method
y = -11.186x - 52.652R2 = 0.9923
30 40 50 60 70 8time(day)
0
ate settlement =0.091 m
al settlement at BSP13 due to the surcharge by
ng Horn’s method
204

-0.090
-0.080
-0.070
-0.060
-0.050
-0.040
-0.030
-0.020
-0.010
0.0000 10 20 30 40 50 60 70 80
time (day)
Sett
lem
ent (
m)
Figure D.153- The distribution of consolidation settlement due to the applied
load with time at BSP13
Asaoka's Method
y = 0.9075x - 0.0061R2 = 0.9866
-0.075
-0.070
-0.065
-0.060
-0.055
-0.050
-0.045-0.075-0.070-0.065-0.060-0.055-0.050-0.045 S(j-1) (m)
S(j)
(m)
Ultimate settlement =0.073 m
Figure D.154- Estimation of final settlement at BSP14 due to the surcharge by
using Asaoka’s method
205

Horn's method
y = -13.088x - 21.421R2 = 0.9912
-1400.0
-1200.0
-1000.0
-800.0
-600.0
-400.0
-200.0
0.00.0 10.0 20.0 30.0 40.0 50.0 60.0 70.0 80.0
time(day)tim
e/se
t.
m
Figure D.155- E
-0.080
-0.070
-0.060
-0.050
-0.040
-0.030
-0.020
-0.010
0.0000
Sett
lem
ent (
m)
Figure D.156- T
Ultimate settlement =0.072
stimation of final settlement at BSP14 due to the surcharge by
using Horn’s method
10 20 30 40 50 60 70 80time (day)
he distribution of consolidation settlement due to the applied
load with time at BSP14
206

Asaoka's Method
y = 0.9503x - 0.004R2 = 0.9991
-0.090
-0.085
-0.080
-0.075
-0.070-0.065
-0.060
-0.055
-0.050
-0.045-0.050
S (j) (m
)
m
Figure D.157- Estimation of f
us
-900.0
-800.0
-700.0-600.0
-500.0
-400.0
-300.0-200.0
-100.0
0.00 10
time/
set.
Ultim
Figure D.158- Estimation of f
u
Ultimate settlement =0.081
-0.090-0.080-0.070-0.060S(j-1) (m)
inal settlement at BSP15 due to the surcharge by
ing Asaoka’s method
Horn's method
y = -12.056x - 42.399R2 = 0.9828
20 30 40 50 60 7time(day)
0
ate settlement =0.083 m
inal settlement at BSP15 due to the surcharge by
sing Horn’s method
207

-0.090
-0.080
-0.070
-0.060
-0.050
-0.040
-0.030
-0.020
-0.010
0.0000 10 20 30 40 50 60 70
time (day)
Sett
lem
ent (
m)
Figure D.159- The distribution of consolidation settlement due to the applied
load with time at BSP15
Asaoka's Method
y = 0.9107x - 0.0073R2 = 0.9954
-0.095
-0.090-0.085
-0.080
-0.075-0.070
-0.065
-0.060-0.055
-0.050-0.095-0.085-0.075-0.065-0.055 S(j-1) (m)
S(j) (m
)
Ultimate settlement =0.082 m
Figure D.160- Estimation of final settlement at BSP16 due to the surcharge by
using Asaoka’s method
208

Horn's method
y = -11.892x - 31.095R2 = 0.995
-700.0
-600.0
-500.0
-400.0
-300.0
-200.0
-100.0
0.00 10 20 30 40 50 6
time(day)tim
e/se
t.0
m
Figure D.161-
-0.090
-0.080
-0.070
-0.060
-0.050
-0.040
-0.030
-0.020
-0.010
0.000
Sett
lem
ent (
m)
Figure D.162
Ultimate settlement =0.084
Estimation of final settlement at BSP16 due to the surcharge by
using Horn’s method
0 10 20 30 40 50 60 70time (day)
- The distribution of consolidation settlement due to the applied
load with time at BSP16
209

Asaoka's Method
y = 0.8614x - 0.011R2 = 0.8341
-0.090-0.088-0.086-0.084-0.082-0.080-0.078-0.076-0.074-0.072-0.070
-0.090-0.085-0.080-0.075-0.070 S(j-1) (m)
S (j) (m
)
Ultimate settlement =0.079 m
Figure D.163- Estimation of final settlement at BSP21 due to the surcharge by
using Asaoka’s method
Horn's method
y = -12.644x - 0.9687R2 = 0.9988
-400.0
-350.0
-300.0
-250.0
-200.0
-150.0
-100.0
-50.0
0.00 5 10 15 20 25 30
time(day)
time/
set.
m
Figure D.164- Es
Ultimate settlement =0.083
timation of final settlement at BSP21 due to the surcharge by
using Horn’s method
210

-0.09
-0.08
-0.07
-0.06
-0.05-0.04
-0.03
-0.02
-0.01
00 10 20 30 40 50 60 70
time (day)
Sett
lem
ent (
m)
Figure D.165- The distribution of consolidation settlement due to the applied
load with time at BSP21
Asaoka's Method
y = 0.9016x - 0.0078R2 = 0.8337
-0.090-0.088-0.086-0.084-0.082-0.080-0.078-0.076-0.074-0.072-0.070
-0.090-0.085-0.080-0.075-0.070S(j-1) (m)
S(j)
(m)
Ultimate settlement =0.079 m
Figure D.166- Estimation of final settlement at BSP20 due to the surcharge by
using Asaoka’s method
211

Horn's method
y = -12.478x - 1.8937R2 = 0.999
-400.0-350.0-300.0
-250.0-200.0-150.0-100.0
-50.00.0
0 5 10 15 20 25 30time(day)
time/
set.
Ultimate settlement =0.080 m
Figure D.167- Estimation of final settlement at BSP20 due to the surcharge by
using Horn’s method
-0.090-0.080-0.070-0.060-0.050-0.040-0.030-0.020-0.0100.000
0 10 20 30 40 50 60 70 80 90 100 110 120time (day)
Sett
lem
ent (
m)
Figure D.168- The distribution of consolidation settlement due to the applied
load with time at BSP20
212

APPENDIX E
213

214
Table 1 Database Summary of CPT-2
Depth 1 (m)
Depth 2 (m)
qt (Average) (MPa) Ic(Average) Soil Classification ∆σ (Average)
(kPa) SP-1 ∆σ (Average)
(kPa) SP-2 ∆σ (Average)
(kPa) SP-3 ∆σ (Average)
(kPa) SP-7 0.00 0.08 3.55 0.96 Gravelly Sand to Dense Sand 64.00 62.45 63.98 63.98 0.08 0.25 3.57 1.69 Sands:Clean Sand to Silty Sand 63.82 62.29 63.88 63.88 0.25 0.60 1.43 2.44 Sand Mixture:Silty Sand to Sandy Silt 63.46 61.95 63.85 63.85 0.60 2.50 0.85 2.73 Silt Mixture: Clayey Silt to Silty Clay 62.14 60.46 63.70 63.70 2.50 2.60 0.76 2.55 Sand Mixture:Silty Sand to Sandy Silt 61.09 59.11 63.68 63.68 2.60 3.30 0.87 2.74 Silt Mixture: Clayey Silt to Silty Clay 60.71 58.56 63.65 63.65 3.30 3.68 3.41 2.33 Sand Mixture:Silty Sand to Sandy Silt 60.22 57.81 63.63 63.63 3.68 3.90 1.50 2.79 Silt Mixture: Clayey Silt to Silty Clay 59.95 57.39 63.61 63.61 3.90 4.15 2.32 2.39 Sand Mixture:Silty Sand to Sandy Silt 59.73 57.05 63.57 63.57 4.15 4.70 1.10 2.85 Silt Mixture: Clayey Silt to Silty Clay 59.38 56.48 63.57 63.57 4.70 5.10 1.30 2.96 Clays: Silty Clay to Clay 58.95 55.80 63.56 63.56 5.10 5.43 1.58 2.90 Silt Mixture: Clayey Silt to Silty Clay 58.63 55.28 63.57 63.57 5.43 5.58 1.25 3.01 Clays: Silty Clay to Clay 58.41 54.93 63.55 63.55 5.58 5.98 1.07 2.83 Silt Mixture: Clayey Silt to Silty Clay 58.16 54.53 63.54 63.54 5.98 6.13 1.85 2.45 Sand Mixture:Silty Sand to Sandy Silt 57.91 54.13 63.53 63.53 6.13 6.53 1.06 2.78 Silt Mixture: Clayey Silt to Silty Clay 57.66 53.73 63.53 63.53 6.53 6.60 1.74 2.56 Sand Mixture:Silty Sand to Sandy Silt 57.44 53.38 63.53 63.53 6.60 7.20 1.18 2.83 Silt Mixture: Clayey Silt to Silty Clay 57.12 52.88 63.53 63.53 7.20 7.28 1.08 2.98 Clays: Silty Clay to Clay 56.80 52.39 63.52 63.52 7.28 7.50 1.32 2.89 Silt Mixture: Clayey Silt to Silty Clay 56.66 52.17 63.52 63.52 7.50 8.15 0.82 3.13 Clays: Silty Clay to Clay 56.24 51.53 63.50 63.50 8.15 8.38 1.08 2.78 Silt Mixture: Clayey Silt to Silty Clay 55.81 50.89 63.48 63.48 8.38 8.60 3.38 2.26 Sand Mixture:Silty Sand to Sandy Silt 55.60 50.58 63.47 63.47 8.60 8.73 5.54 2.04 Sands:Clean Sand to Silty Sand 55.42 50.31 63.46 63.46 8.73 8.93 3.27 2.40 Sand Mixture:Silty Sand to Sandy Silt 55.26 50.08 63.45 63.45 8.93 9.28 10.03 1.71 Sands:Clean Sand to Silty Sand 54.98 49.69 63.43 63.43 9.28 9.68 23.38 1.24 Gravelly Sand to Dense Sand 54.60 49.15 63.40 63.40 9.68 10.20 14.79 1.58 Sands:Clean Sand to Silty Sand 54.14 48.50 63.36 63.36
10.20 10.55 1.84 2.89 Silt Mixture: Clayey Silt to Silty Clay 53.69 47.90 63.31 63.31 10.55 11.73 1.29 3.22 Clays: Silty Clay to Clay 52.92 46.86 63.22 63.22 11.73 11.88 3.60 2.39 Sand Mixture:Silty Sand to Sandy Silt 52.25 45.99 63.13 63.13
SP1-
Obs
erce
d Se
ttle
men
=0.
093m
S
P2- O
bser
ced
Sett
lem
en =
0.07
8m
SP3-
Obs
erce
d Se
ttle
men
=0.
141m
S
P2- O
bser
ced
Sett
lem
en =
0.14
1m
11.88 12.20 2.72 2.76 Silt Mixture: Clayey Silt to Silty Clay 52.01 45.68 63.10 63.10

215
Table 2 Database Summary of CPT-2 (Continued)
Depth 1 (m)
Depth 2 (m)
qt (Average) (MPa) Ic(Average) Soil Classification ∆σ (Average)
(kPa) SP-1 ∆σ (Average)
(kPa) SP-2 ∆σ (Average)
(kPa) SP-3 ∆σ (Average)
(kPa) SP-7 12.20 12.45 5.30 2.29 Sand Mixture:Silty Sand to Sandy Silt 51.72 45.31 63.05 63.05 12.45 13.30 14.08 1.74 Sands:Clean Sand to Silty Sand 51.17 44.63 62.96 62.96 13.30 14.63 18.15 1.59 Sands:clean sand to silty sand 50.89 44.28 62.52 62.91 14.63 15.03 1.89 2.96 Silt Mixtures:clayey silt to silty clay 50.01 43.22 62.46 62.73 15.03 15.90 13.79 1.72 Sand Mixtures:silty sand to sandy silt 49.31 42.40 62.39 62.57 15.90 16.63 6.89 2.31 Sand Mixtures:silty sand to sandy silt 48.72 41.72 62.31 62.42 16.63 18.43 1.53 3.24 Silt Mixtures:clayey silt to silty clay 48.00 40.90 62.16 62.20 18.43 18.83 3.07 2.86 Silt Mixtures:clayey silt to silty clay 46.91 39.71 62.00 61.81 18.83 19.33 1.66 3.23 Clays:silty clay to clay 45.99 38.73 61.60 61.43 19.33 19.48 3.05 2.80 Silt Mixtures:clayey silt to silty clay 45.62 38.35 61.41 61.25 19.48 19.73 8.44 2.12 Sand Mixtures:silty sand to sandy silt 45.36 38.08 61.27 61.12 19.73 20.00 4.04 2.81 Silt Mixtures:clayey silt to silty clay 45.19 37.92 61.17 61.04 20.00 20.63 1.68 3.24 Clays:silty clay to clay 44.98 37.71 61.05 60.93 20.63 20.95 10.76 1.95 Sand Mixtures:silty sand to sandy silt 44.62 37.36 60.83 60.73 20.95 21.20 2.31 3.03 Silt Mixtures:clayey silt to silty clay 44.24 36.99 60.58 60.51 21.20 21.90 11.19 2.02 Sand Mixtures:silty sand to sandy silt 44.02 36.78 60.43 60.38 21.90 23.40 1.81 3.25 Silt Mixtures:clayey silt to silty clay 43.62 36.41 60.15 60.14 23.40 23.65 5.86 2.60 Silt Mixtures:clayey silt to silty clay 42.73 35.59 59.46 59.56 SP
1- O
bser
ced
Sett
lem
en =
0.09
3m
SP2
- Obs
erce
d Se
ttle
men
=0.
078m
SP
3- O
bser
ced
Sett
lem
en =
0.14
1m
SP2
- Obs
erce
d Se
ttle
men
=0.
141m
23.65 25.55 1.96 3.29 Clays:silty clay to clay 42.00 34.96 58.87 59.06

216
Table 2 Database Summary of CPT-2a
Depth 1 (m)
Depth 2 (m)
qt (Average) (MPa) Ic(Average) Soil Classification ∆σ (Average)
(kPa) SP-7 ∆σ (Average)
(kPa) SP-8 0.00 0.15 2.20 1.95 Sands:Clean Sand to Silty Sand 63.98 63.96 0.15 0.83 1.74 2.37 Sand Mixture:Silty Sand to Sandy Silt 63.88 63.90 0.83 1.80 1.15 2.72 Silt Mixture: Clayey Silt to Silty Clay 63.85 63.80 1.80 2.18 0.55 3.10 Clays: Silty Clay to Clay 63.70 63.82 2.18 2.53 0.45 2.91 Silt Mixture: Clayey Silt to Silty Clay 63.68 63.82 2.53 2.63 0.46 2.97 Clays: Silty Clay to Clay 63.65 63.82 2.63 2.85 0.65 2.81 Silt Mixture: Clayey Silt to Silty Clay 63.63 63.82 2.85 2.98 0.67 3.01 Clays: Silty Clay to Clay 63.61 63.82 2.98 3.18 1.32 2.73 Silt Mixture: Clayey Silt to Silty Clay 63.57 63.82 3.18 3.28 0.97 2.99 Clays: Silty Clay to Clay 63.57 63.82 3.28 3.48 1.06 2.85 Silt Mixture: Clayey Silt to Silty Clay 63.56 63.82 3.48 3.75 2.79 2.51 Sand Mixture:Silty Sand to Sandy Silt 63.57 63.82 3.75 3.85 1.05 3.08 Clays: Silty Clay to Clay 63.55 63.81 3.85 3.93 1.41 2.78 Silt Mixture: Clayey Silt to Silty Clay 63.54 63.81 3.93 4.20 2.40 2.49 Sand Mixture:Silty Sand to Sandy Silt 63.53 63.81 4.20 4.30 1.37 2.73 Silt Mixture: Clayey Silt to Silty Clay 63.53 63.81 4.30 4.38 0.80 3.05 Clays: Silty Clay to Clay 63.53 63.80 4.38 4.55 0.99 2.84 Silt Mixture: Clayey Silt to Silty Clay 63.53 63.80 4.55 4.93 1.07 3.05 Clays: Silty Clay to Clay 63.52 63.80 4.93 5.03 1.26 2.92 Silt Mixture: Clayey Silt to Silty Clay 63.52 63.79 5.03 5.28 1.47 2.96 Clays: Silty Clay to Clay 63.50 63.79 5.28 5.50 1.72 2.92 Silt Mixture: Clayey Silt to Silty Clay 63.48 63.78 5.50 8.25 1.33 3.12 Clays: Silty Clay to Clay 63.46 63.73 8.25 8.58 1.29 2.78 Silt Mixture: Clayey Silt to Silty Clay 63.46 63.65 8.58 8.65 0.89 3.17 Clays: Silty Clay to Clay 63.45 63.64 8.65 8.70 1.67 2.74 Silt Mixture: Clayey Silt to Silty Clay 63.43 63.64 8.70 8.83 4.00 2.29 Sand Mixture:Silty Sand to Sandy Silt 63.40 63.63 8.83 9.15 8.47 1.79 Sands:Clean Sand to Silty Sand 63.36 63.62 9.15 9.33 5.04 2.16 Sand Mixture:Silty Sand to Sandy Silt 63.31 63.61 9.33 9.78 7.92 1.79 Sands:Clean Sand to Silty Sand 63.22 63.59 9.78 10.05 3.92 2.31 Sand Mixture:Silty Sand to Sandy Silt 63.13 63.56
SP7-
Obs
erce
d Se
ttle
men
=0.
141m
S
P8 O
bser
ced
Sett
lem
en =
0.13
4m
10.05 10.65 12.74 1.65 Sands:Clean Sand to Silty Sand 63.10 63.53
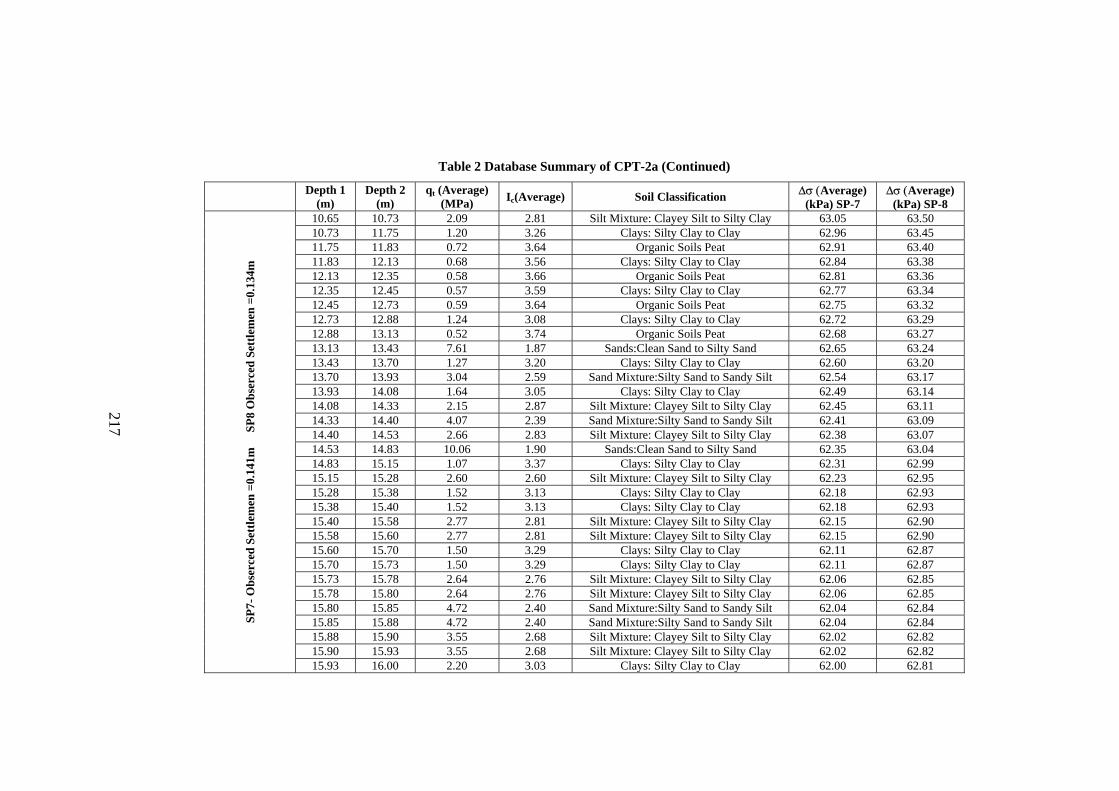
217
Table 2 Database Summary of CPT-2a (Continued)
Depth 1 (m)
Depth 2 (m)
qt (Average) (MPa) Ic(Average) Soil Classification ∆σ (Average)
(kPa) SP-7 ∆σ (Average)
(kPa) SP-8 10.65 10.73 2.09 2.81 Silt Mixture: Clayey Silt to Silty Clay 63.05 63.50 10.73 11.75 1.20 3.26 Clays: Silty Clay to Clay 62.96 63.45 11.75 11.83 0.72 3.64 Organic Soils Peat 62.91 63.40 11.83 12.13 0.68 3.56 Clays: Silty Clay to Clay 62.84 63.38 12.13 12.35 0.58 3.66 Organic Soils Peat 62.81 63.36 12.35 12.45 0.57 3.59 Clays: Silty Clay to Clay 62.77 63.34 12.45 12.73 0.59 3.64 Organic Soils Peat 62.75 63.32 12.73 12.88 1.24 3.08 Clays: Silty Clay to Clay 62.72 63.29 12.88 13.13 0.52 3.74 Organic Soils Peat 62.68 63.27 13.13 13.43 7.61 1.87 Sands:Clean Sand to Silty Sand 62.65 63.24 13.43 13.70 1.27 3.20 Clays: Silty Clay to Clay 62.60 63.20 13.70 13.93 3.04 2.59 Sand Mixture:Silty Sand to Sandy Silt 62.54 63.17 13.93 14.08 1.64 3.05 Clays: Silty Clay to Clay 62.49 63.14 14.08 14.33 2.15 2.87 Silt Mixture: Clayey Silt to Silty Clay 62.45 63.11 14.33 14.40 4.07 2.39 Sand Mixture:Silty Sand to Sandy Silt 62.41 63.09 14.40 14.53 2.66 2.83 Silt Mixture: Clayey Silt to Silty Clay 62.38 63.07 14.53 14.83 10.06 1.90 Sands:Clean Sand to Silty Sand 62.35 63.04 14.83 15.15 1.07 3.37 Clays: Silty Clay to Clay 62.31 62.99 15.15 15.28 2.60 2.60 Silt Mixture: Clayey Silt to Silty Clay 62.23 62.95 15.28 15.38 1.52 3.13 Clays: Silty Clay to Clay 62.18 62.93 15.38 15.40 1.52 3.13 Clays: Silty Clay to Clay 62.18 62.93 15.40 15.58 2.77 2.81 Silt Mixture: Clayey Silt to Silty Clay 62.15 62.90 15.58 15.60 2.77 2.81 Silt Mixture: Clayey Silt to Silty Clay 62.15 62.90 15.60 15.70 1.50 3.29 Clays: Silty Clay to Clay 62.11 62.87 15.70 15.73 1.50 3.29 Clays: Silty Clay to Clay 62.11 62.87 15.73 15.78 2.64 2.76 Silt Mixture: Clayey Silt to Silty Clay 62.06 62.85 15.78 15.80 2.64 2.76 Silt Mixture: Clayey Silt to Silty Clay 62.06 62.85 15.80 15.85 4.72 2.40 Sand Mixture:Silty Sand to Sandy Silt 62.04 62.84 15.85 15.88 4.72 2.40 Sand Mixture:Silty Sand to Sandy Silt 62.04 62.84 15.88 15.90 3.55 2.68 Silt Mixture: Clayey Silt to Silty Clay 62.02 62.82 15.90 15.93 3.55 2.68 Silt Mixture: Clayey Silt to Silty Clay 62.02 62.82
SP7-
Obs
erce
d Se
ttle
men
=0.
141m
S
P8 O
bser
ced
Sett
lem
en =
0.13
4m
15.93 16.00 2.20 3.03 Clays: Silty Clay to Clay 62.00 62.81

218
Table 2 Database Summary of CPT-2a (Continued)
Depth 1 (m)
Depth 2 (m)
qt (Average) (MPa) Ic(Average) Soil Classification ∆σ (Average)
(kPa) SP-7 ∆σ (Average)
(kPa) SP-8 16.00 16.03 2.20 3.03 Clays: Silty Clay to Clay 62.00 62.81 16.03 16.58 13.16 1.80 Sands:Clean Sand to Silty Sand 61.98 62.74 16.58 16.60 13.16 1.80 Sands:Clean Sand to Silty Sand 61.98 62.74 16.60 17.15 1.22 3.29 Clays: Silty Clay to Clay 61.89 62.62 17.15 17.18 1.22 3.29 Clays: Silty Clay to Clay 61.89 62.62 17.18 17.28 3.97 2.38 Sand Mixture:Silty Sand to Sandy Silt 61.72 62.54 17.28 17.30 3.97 2.38 Sand Mixture:Silty Sand to Sandy Silt 61.72 62.54 17.30 17.45 2.03 3.20 Clays: Silty Clay to Clay 61.61 62.51 17.45 17.48 2.03 3.20 Clays: Silty Clay to Clay 61.61 62.51 17.48 17.53 2.50 2.84 Silt Mixture: Clayey Silt to Silty Clay 61.56 62.48 17.53 17.55 2.50 2.84 Silt Mixture: Clayey Silt to Silty Clay 61.56 62.48 17.55 18.28 1.49 3.29 Clays: Silty Clay to Clay 61.52 62.38 18.28 18.30 1.49 3.29 Clays: Silty Clay to Clay 61.52 62.38 18.30 18.43 6.19 2.33 Sand Mixture:Silty Sand to Sandy Silt 61.38 62.28 18.43 18.83 3.07 2.86 Silt Mixtures:clayey silt to silty clay 61.81 62.25 18.83 19.33 1.66 3.23 Clays:silty clay to clay 61.43 62.23 19.33 19.48 3.05 2.80 Silt Mixtures:clayey silt to silty clay 61.25 62.21 19.48 19.73 8.44 2.12 Sand Mixtures:silty sand to sandy silt 61.12 62.10 19.73 20.00 4.04 2.81 Silt Mixtures:clayey silt to silty clay 61.04 61.95 20.00 20.63 1.68 3.24 Clays:silty clay to clay 60.93 61.67 20.63 20.95 10.76 1.95 Sand Mixtures:silty sand to sandy silt 60.73 61.40 20.95 21.20 2.31 3.03 Silt Mixtures:clayey silt to silty clay 60.51 61.27 21.20 21.90 11.19 2.02 Sand Mixtures:silty sand to sandy silt 60.38 61.18 21.90 23.40 1.81 3.25 Silt Mixtures:clayey silt to silty clay 60.14 61.12 23.40 23.65 5.86 2.60 Silt Mixtures:clayey silt to silty clay 59.56 61.04
SP7-
Obs
erce
d Se
ttle
men
=0.
141m
S
P8 O
bser
ced
Sett
lem
en
=0.1
34m
23.65 25.55 1.96 3.29 Clays:silty clay to clay 59.06 60.90
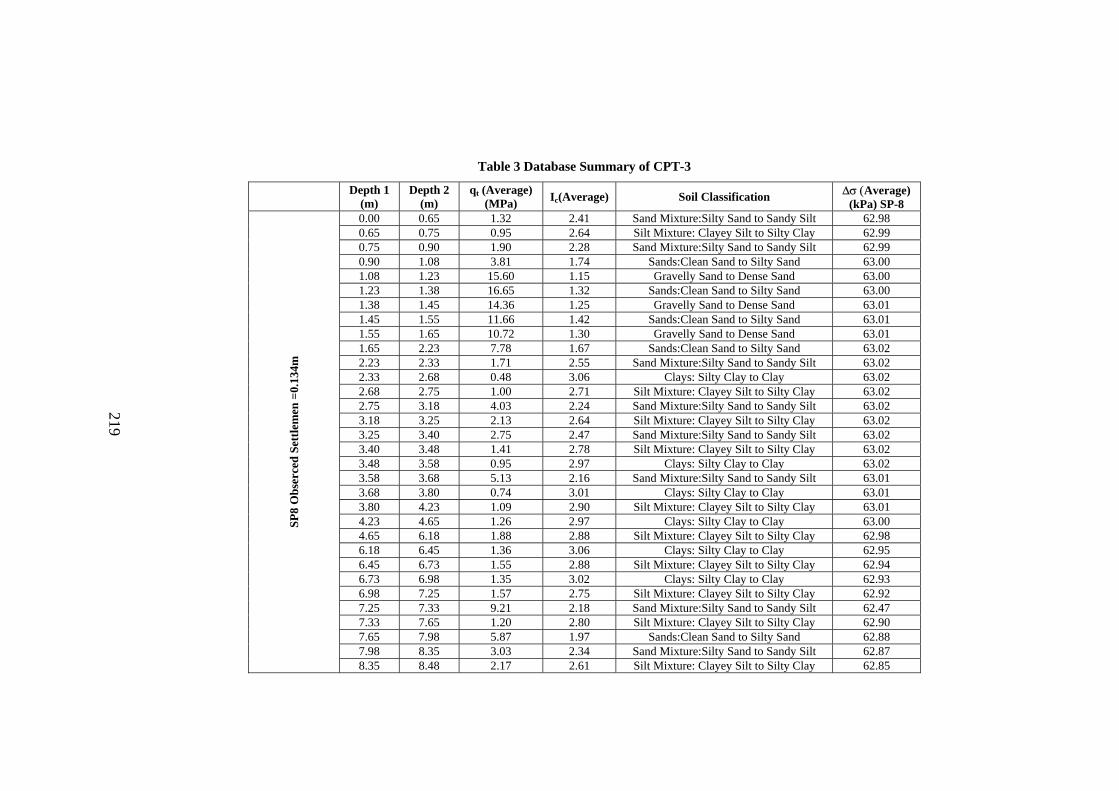
219
Table 3 Database Summary of CPT-3
Depth 1 (m)
Depth 2 (m)
qt (Average) (MPa) Ic(Average) Soil Classification ∆σ (Average)
(kPa) SP-8 0.00 0.65 1.32 2.41 Sand Mixture:Silty Sand to Sandy Silt 62.98 0.65 0.75 0.95 2.64 Silt Mixture: Clayey Silt to Silty Clay 62.99 0.75 0.90 1.90 2.28 Sand Mixture:Silty Sand to Sandy Silt 62.99 0.90 1.08 3.81 1.74 Sands:Clean Sand to Silty Sand 63.00 1.08 1.23 15.60 1.15 Gravelly Sand to Dense Sand 63.00 1.23 1.38 16.65 1.32 Sands:Clean Sand to Silty Sand 63.00 1.38 1.45 14.36 1.25 Gravelly Sand to Dense Sand 63.01 1.45 1.55 11.66 1.42 Sands:Clean Sand to Silty Sand 63.01 1.55 1.65 10.72 1.30 Gravelly Sand to Dense Sand 63.01 1.65 2.23 7.78 1.67 Sands:Clean Sand to Silty Sand 63.02 2.23 2.33 1.71 2.55 Sand Mixture:Silty Sand to Sandy Silt 63.02 2.33 2.68 0.48 3.06 Clays: Silty Clay to Clay 63.02 2.68 2.75 1.00 2.71 Silt Mixture: Clayey Silt to Silty Clay 63.02 2.75 3.18 4.03 2.24 Sand Mixture:Silty Sand to Sandy Silt 63.02 3.18 3.25 2.13 2.64 Silt Mixture: Clayey Silt to Silty Clay 63.02 3.25 3.40 2.75 2.47 Sand Mixture:Silty Sand to Sandy Silt 63.02 3.40 3.48 1.41 2.78 Silt Mixture: Clayey Silt to Silty Clay 63.02 3.48 3.58 0.95 2.97 Clays: Silty Clay to Clay 63.02 3.58 3.68 5.13 2.16 Sand Mixture:Silty Sand to Sandy Silt 63.01 3.68 3.80 0.74 3.01 Clays: Silty Clay to Clay 63.01 3.80 4.23 1.09 2.90 Silt Mixture: Clayey Silt to Silty Clay 63.01 4.23 4.65 1.26 2.97 Clays: Silty Clay to Clay 63.00 4.65 6.18 1.88 2.88 Silt Mixture: Clayey Silt to Silty Clay 62.98 6.18 6.45 1.36 3.06 Clays: Silty Clay to Clay 62.95 6.45 6.73 1.55 2.88 Silt Mixture: Clayey Silt to Silty Clay 62.94 6.73 6.98 1.35 3.02 Clays: Silty Clay to Clay 62.93 6.98 7.25 1.57 2.75 Silt Mixture: Clayey Silt to Silty Clay 62.92 7.25 7.33 9.21 2.18 Sand Mixture:Silty Sand to Sandy Silt 62.47 7.33 7.65 1.20 2.80 Silt Mixture: Clayey Silt to Silty Clay 62.90 7.65 7.98 5.87 1.97 Sands:Clean Sand to Silty Sand 62.88 7.98 8.35 3.03 2.34 Sand Mixture:Silty Sand to Sandy Silt 62.87
SP8
Obs
erce
d Se
ttle
men
=0.
134m
8.35 8.48 2.17 2.61 Silt Mixture: Clayey Silt to Silty Clay 62.85

220
Table 3 Database Summary of CPT-3 (Continued)
Depth 1 (m)
Depth 2 (m)
qt (Average) (MPa) Ic(Average) Soil Classification ∆σ (Average)
(kPa) SP-8 8.48 8.58 3.59 2.39 Sand Mixture:Silty Sand to Sandy Silt 62.85 8.58 8.75 10.19 1.63 Sands:Clean Sand to Silty Sand 62.84 8.75 8.83 16.93 1.30 Gravelly Sand to Dense Sand 62.83 8.83 9.85 16.50 1.45 Sands:Clean Sand to Silty Sand 62.80 9.85 9.93 4.28 2.30 Sand Mixture:Silty Sand to Sandy Silt 62.76 9.93 10.18 2.03 2.90 Silt Mixture: Clayey Silt to Silty Clay 62.75 10.18 11.08 5.06 2.41 Sand Mixture:Silty Sand to Sandy Silt 62.94 11.08 11.15 2.10 2.76 Silt Mixture: Clayey Silt to Silty Clay 62.66 11.15 11.75 4.15 2.40 Sand Mixture:Silty Sand to Sandy Silt 62.63 11.75 11.88 2.45 2.81 Silt Mixture: Clayey Silt to Silty Clay 62.60 11.88 11.95 3.40 2.47 Sand Mixture:Silty Sand to Sandy Silt 62.59 11.95 12.20 2.19 2.78 Silt Mixture: Clayey Silt to Silty Clay 62.57 12.20 13.25 10.11 1.88 Sands:Clean Sand to Silty Sand 62.50 13.25 13.43 4.58 2.45 Sand Mixture:Silty Sand to Sandy Silt 62.43 13.43 13.50 2.83 2.78 Silt Mixture: Clayey Silt to Silty Clay 62.41 13.50 13.63 1.64 3.08 Clays: Silty Clay to Clay 62.40 13.63 13.73 3.20 2.64 Silt Mixture: Clayey Silt to Silty Clay 62.38 13.73 14.35 16.74 1.63 Sands:Clean Sand to Silty Sand 62.33 14.35 14.58 10.38 2.16 Sand Mixture:Silty Sand to Sandy Silt 62.27 14.58 14.65 11.47 2.01 Sands:Clean Sand to Silty Sand 62.24 14.65 14.65 11.47 2.01 Sands:Clean Sand to Silty Sand 62.24 14.65 14.90 8.26 2.20 Sand Mixture:Silty Sand to Sandy Silt 62.22 14.90 14.90 8.26 2.20 Sand Mixture:Silty Sand to Sandy Silt 62.22 14.90 16.70 17.69 1.74 Sands:Clean Sand to Silty Sand 62.03 16.70 16.70 17.69 1.74 Sands:Clean Sand to Silty Sand 62.03 16.70 16.93 8.47 2.22 Sand Mixture:Silty Sand to Sandy Silt 61.83 16.93 16.93 8.47 2.22 Sand Mixture:Silty Sand to Sandy Silt 61.83 16.93 17.28 1.96 3.10 Clays: Silty Clay to Clay 61.77 17.28 17.28 1.96 3.10 Clays: Silty Clay to Clay 61.77 17.28 17.33 9.83 2.06 Sand Mixture:Silty Sand to Sandy Silt 61.72 17.33 18.43 1.53 3.24 Silt Mixtures:clayey silt to silty clay 61.67
SP8
Obs
erce
d Se
ttle
men
=0.
134m
18.43 18.83 3.07 2.86 Silt Mixtures:clayey silt to silty clay 61.40
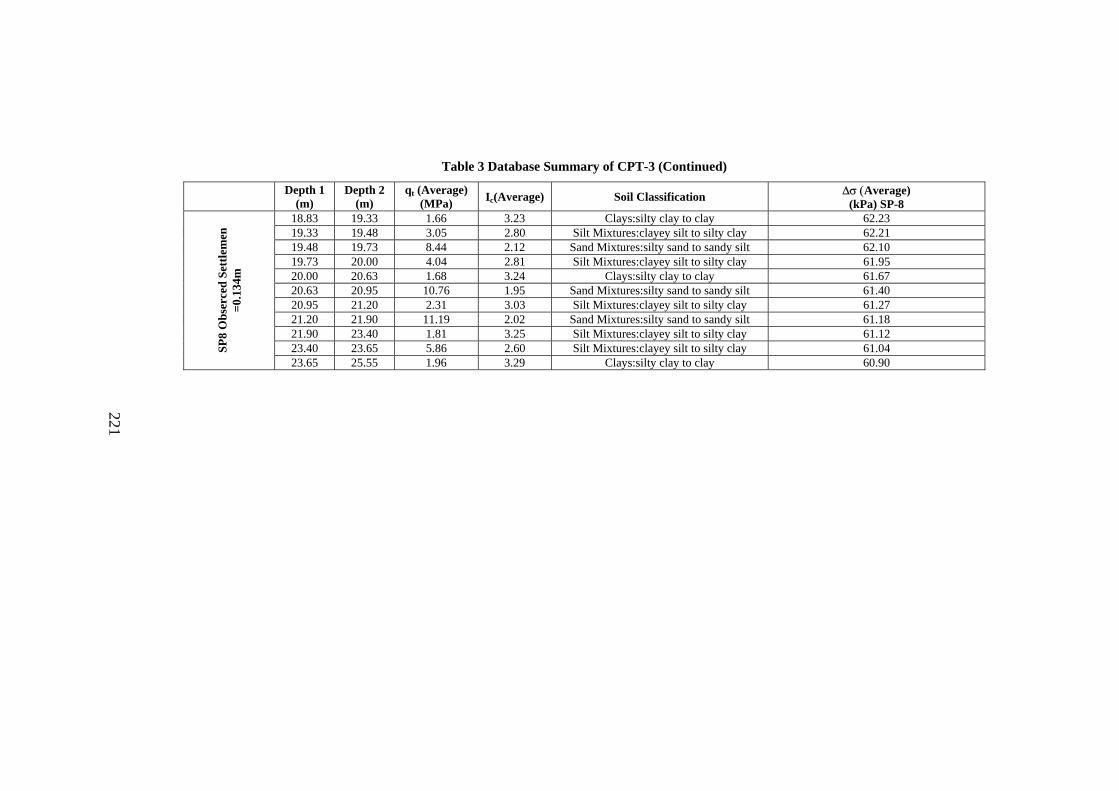
221
Table 3 Database Summary of CPT-3 (Continued)
Depth 1 (m)
Depth 2 (m)
qt (Average) (MPa) Ic(Average) Soil Classification ∆σ (Average)
(kPa) SP-8 18.83 19.33 1.66 3.23 Clays:silty clay to clay 62.23 19.33 19.48 3.05 2.80 Silt Mixtures:clayey silt to silty clay 62.21 19.48 19.73 8.44 2.12 Sand Mixtures:silty sand to sandy silt 62.10 19.73 20.00 4.04 2.81 Silt Mixtures:clayey silt to silty clay 61.95 20.00 20.63 1.68 3.24 Clays:silty clay to clay 61.67 20.63 20.95 10.76 1.95 Sand Mixtures:silty sand to sandy silt 61.40 20.95 21.20 2.31 3.03 Silt Mixtures:clayey silt to silty clay 61.27 21.20 21.90 11.19 2.02 Sand Mixtures:silty sand to sandy silt 61.18 21.90 23.40 1.81 3.25 Silt Mixtures:clayey silt to silty clay 61.12 23.40 23.65 5.86 2.60 Silt Mixtures:clayey silt to silty clay 61.04 SP
8 O
bser
ced
Sett
lem
en
=0.1
34m
23.65 25.55 1.96 3.29 Clays:silty clay to clay 60.90

222
Table 4 Database Summary of CPT-5
Depth 1 (m)
Depth 2 (m)
qt (Average) (MPa) Ic(Average) Soil Classification ∆σ (Average)
(kPa) SP-9 0.00 0.05 2.04 1.99 Sands:Clean Sand to Silty Sand 63.95 0.05 0.90 1.78 2.36 Sand Mixture:Silty Sand to Sandy Silt 63.90 0.90 1.60 0.79 2.70 Silt Mixture: Clayey Silt to Silty Clay 63.73 1.60 1.73 1.78 2.45 Sand Mixture:Silty Sand to Sandy Silt 63.60 1.73 2.00 0.94 2.81 Silt Mixture: Clayey Silt to Silty Clay 63.54 2.00 2.28 0.59 2.99 Clays: Silty Clay to Clay 63.49 2.28 2.73 0.56 2.82 Silt Mixture: Clayey Silt to Silty Clay 63.42 2.73 2.85 0.69 2.97 Clays: Silty Clay to Clay 63.33 2.85 4.25 0.99 2.83 Silt Mixture: Clayey Silt to Silty Clay 63.30 4.25 4.48 3.02 2.26 Sand Mixture:Silty Sand to Sandy Silt 63.29 4.48 4.55 1.34 2.82 Silt Mixture: Clayey Silt to Silty Clay 63.26 4.55 4.68 0.88 3.08 Clays: Silty Clay to Clay 63.24 4.68 4.85 1.40 2.84 Silt Mixture: Clayey Silt to Silty Clay 63.23 4.85 5.05 2.53 2.45 Sand Mixture:Silty Sand to Sandy Silt 63.22 5.05 5.35 10.14 1.78 Sands:Clean Sand to Silty Sand 63.20 5.35 5.63 1.38 3.04 Clays: Silty Clay to Clay 63.20 5.63 6.48 1.73 2.92 Silt Mixture: Clayey Silt to Silty Clay 63.20 6.48 7.73 1.60 3.04 Clays: Silty Clay to Clay 63.18 7.73 8.10 7.01 2.02 Sands:Clean Sand to Silty Sand 63.15 8.10 8.35 5.40 2.26 Sand Mixture:Silty Sand to Sandy Silt 63.13 8.35 8.50 1.70 2.89 Silt Mixture: Clayey Silt to Silty Clay 63.12 8.50 9.73 13.48 1.65 Sands:Clean Sand to Silty Sand 63.07 9.73 9.83 3.07 2.28 Sand Mixture:Silty Sand to Sandy Silt 63.02 9.83 9.93 0.86 3.22 Clays: Silty Clay to Clay 63.01 9.93 10.00 0.40 3.77 Organic Soils Peat 63.00 10.00 10.20 8.24 1.70 Sands:Clean Sand to Silty Sand 62.99 10.20 10.48 2.93 2.55 Sand Mixture:Silty Sand to Sandy Silt 62.96 10.48 10.93 14.14 1.68 Sands:Clean Sand to Silty Sand 62.92 10.93 12.48 1.45 3.20 Clays: Silty Clay to Clay 62.78 12.48 12.70 10.41 1.92 Sands:Clean Sand to Silty Sand 62.64 12.83 13.55 6.52 2.20 Sand Mixtures:silty sand to sandy silt 62.53
SP9
Obs
erce
d Se
ttle
men
=0.
175m
13.55 14.63 18.15 1.59 Sands:clean sand to silty sand 62.33
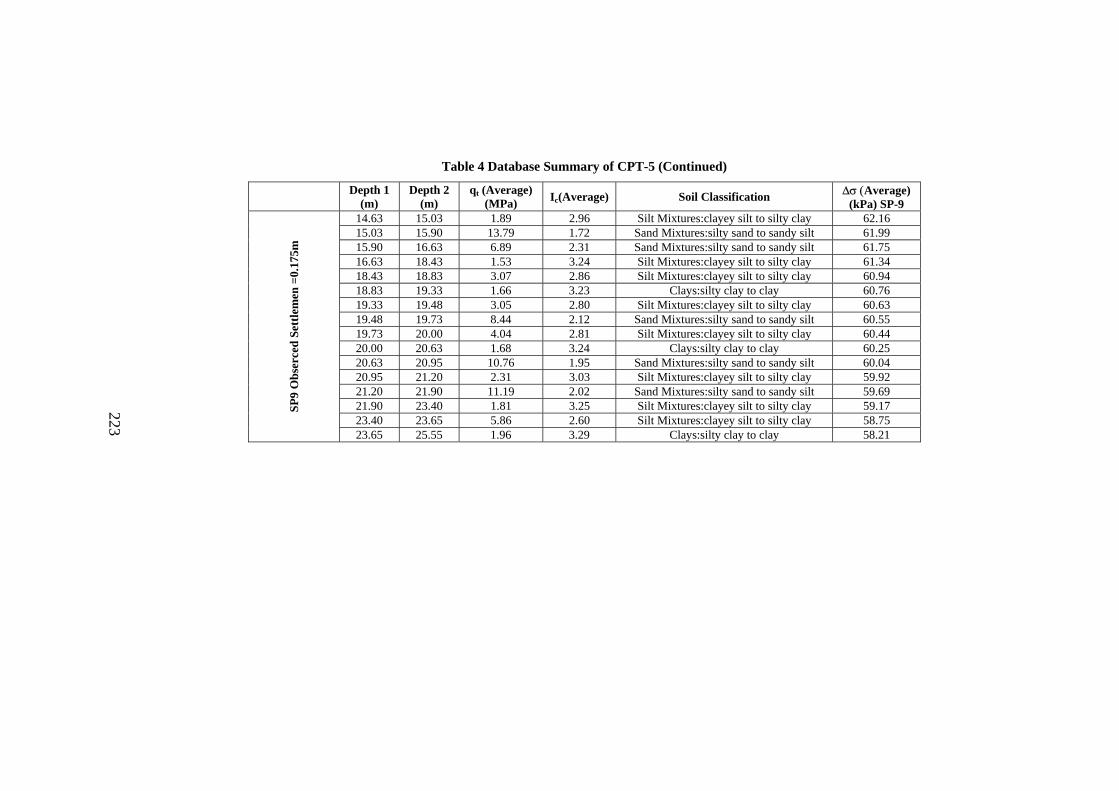
223
Table 4 Database Summary of CPT-5 (Continued)
Depth 1 (m)
Depth 2 (m)
qt (Average) (MPa) Ic(Average) Soil Classification ∆σ (Average)
(kPa) SP-9 14.63 15.03 1.89 2.96 Silt Mixtures:clayey silt to silty clay 62.16 15.03 15.90 13.79 1.72 Sand Mixtures:silty sand to sandy silt 61.99 15.90 16.63 6.89 2.31 Sand Mixtures:silty sand to sandy silt 61.75 16.63 18.43 1.53 3.24 Silt Mixtures:clayey silt to silty clay 61.34 18.43 18.83 3.07 2.86 Silt Mixtures:clayey silt to silty clay 60.94 18.83 19.33 1.66 3.23 Clays:silty clay to clay 60.76 19.33 19.48 3.05 2.80 Silt Mixtures:clayey silt to silty clay 60.63 19.48 19.73 8.44 2.12 Sand Mixtures:silty sand to sandy silt 60.55 19.73 20.00 4.04 2.81 Silt Mixtures:clayey silt to silty clay 60.44 20.00 20.63 1.68 3.24 Clays:silty clay to clay 60.25 20.63 20.95 10.76 1.95 Sand Mixtures:silty sand to sandy silt 60.04 20.95 21.20 2.31 3.03 Silt Mixtures:clayey silt to silty clay 59.92 21.20 21.90 11.19 2.02 Sand Mixtures:silty sand to sandy silt 59.69 21.90 23.40 1.81 3.25 Silt Mixtures:clayey silt to silty clay 59.17 23.40 23.65 5.86 2.60 Silt Mixtures:clayey silt to silty clay 58.75
SP9
Obs
erce
d Se
ttle
men
=0.
175m
23.65 25.55 1.96 3.29 Clays:silty clay to clay 58.21

224
Table 5 Database Summary of CPT-6
Depth 1 (m)
Depth 2 (m)
qt (Average) (MPa) Ic(Average) Soil Classification ∆σ (Average)
(kPa) SP-13 ∆σ (Average) (kPa) SP-14
∆σ (Average) (kPa) SP-15
0.00 0.33 2.09 1.84 Sands:Clean Sand to Silty Sand 63.95 63.99 64.02 0.33 0.63 2.32 2.19 Sand Mixture:Silty Sand to Sandy Silt 63.91 63.97 63.99 0.63 0.98 3.56 1.83 Sands:Clean Sand to Silty Sand 63.88 63.97 63.91 0.98 1.10 1.46 2.38 Sand Mixture:Silty Sand to Sandy Silt 63.87 63.95 63.90 1.10 2.95 2.51 2.01 Sands:Clean Sand to Silty Sand 63.91 63.94 63.77 2.95 3.35 3.17 2.43 Sand Mixture:Silty Sand to Sandy Silt 63.90 63.94 63.48 3.35 3.73 7.95 1.80 Sands:Clean Sand to Silty Sand 63.91 63.93 63.26 3.73 4.10 4.18 2.27 Sand Mixture:Silty Sand to Sandy Silt 63.91 63.91 63.02 4.10 4.70 0.86 2.76 Silt Mixture: Clayey Silt to Silty Clay 63.91 63.91 62.67 4.70 4.93 0.54 3.03 Clays: Silty Clay to Clay 63.89 63.90 62.36 4.93 5.60 0.87 2.78 Silt Mixture: Clayey Silt to Silty Clay 63.87 63.86 62.00 5.60 6.53 4.22 2.27 Sand Mixture:Silty Sand to Sandy Silt 63.79 63.77 61.33 6.53 7.13 8.27 1.80 Sands:Clean Sand to Silty Sand 63.68 63.66 60.66 7.13 7.28 1.41 2.93 Silt Mixture: Clayey Silt to Silty Clay 63.61 63.60 60.32 7.28 7.88 13.45 1.48 Sands:Clean Sand to Silty Sand 63.53 63.53 59.98 7.88 7.98 4.64 2.27 Sand Mixture:Silty Sand to Sandy Silt 63.45 63.46 59.67 7.98 8.10 1.87 2.84 Silt Mixture: Clayey Silt to Silty Clay 63.42 63.44 59.56 8.10 8.25 0.80 3.12 Clays: Silty Clay to Clay 63.39 63.41 59.44 8.25 8.40 0.82 2.86 Silt Mixture: Clayey Silt to Silty Clay 63.35 63.38 59.30 8.40 8.60 1.05 2.96 Clays: Silty Clay to Clay 63.30 63.35 59.15 8.60 8.85 4.27 2.21 Sand Mixture:Silty Sand to Sandy Silt 63.24 63.30 58.94 8.85 10.43 12.74 1.73 Sands:Clean Sand to Silty Sand 62.95 63.09 58.13 10.43 10.70 2.04 2.76 Silt Mixture: Clayey Silt to Silty Clay 62.63 62.87 57.32 10.70 10.90 3.43 2.43 Sand Mixture:Silty Sand to Sandy Silt 62.54 62.81 57.12 10.90 11.30 10.14 1.92 Sands:Clean Sand to Silty Sand 62.42 62.73 56.87 11.30 11.60 4.38 2.42 Sand Mixture:Silty Sand to Sandy Silt 62.28 62.63 56.57 11.60 11.78 2.88 2.76 Silt Mixture: Clayey Silt to Silty Clay 62.19 62.57 56.38 11.78 12.20 4.31 2.46 Sand Mixture:Silty Sand to Sandy Silt 62.07 62.48 56.13 12.20 12.40 1.53 3.13 Clays: Silty Clay to Clay 61.94 62.40 55.87 12.40 12.58 1.97 2.80 Silt Mixture: Clayey Silt to Silty Clay 61.86 62.34 55.72 12.58 13.60 1.07 3.32 Clays: Silty Clay to Clay 61.61 62.17 55.25
SP13
- Obs
erce
d Se
ttle
men
=0.
102m
S
P14-
Obs
erce
d Se
ttle
men
=0.
166m
SP
15- O
bser
ced
Sett
lem
en =
0.18
3m
13.60 13.78 2.83 2.74 Silt Mixture: Clayey Silt to Silty Clay 61.35 61.99 54.78
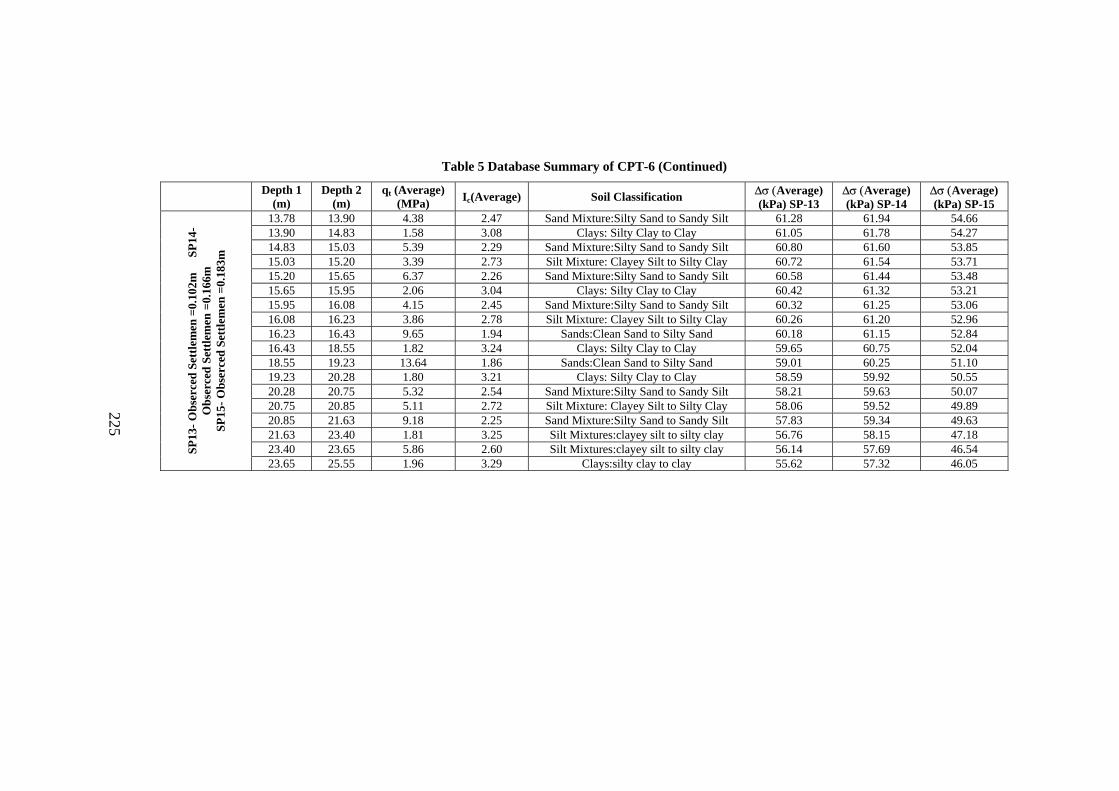
225
Table 5 Database Summary of CPT-6 (Continued)
Depth 1 (m)
Depth 2 (m)
qt (Average) (MPa) Ic(Average) Soil Classification ∆σ (Average)
(kPa) SP-13 ∆σ (Average) (kPa) SP-14
∆σ (Average) (kPa) SP-15
13.78 13.90 4.38 2.47 Sand Mixture:Silty Sand to Sandy Silt 61.28 61.94 54.66 13.90 14.83 1.58 3.08 Clays: Silty Clay to Clay 61.05 61.78 54.27 14.83 15.03 5.39 2.29 Sand Mixture:Silty Sand to Sandy Silt 60.80 61.60 53.85 15.03 15.20 3.39 2.73 Silt Mixture: Clayey Silt to Silty Clay 60.72 61.54 53.71 15.20 15.65 6.37 2.26 Sand Mixture:Silty Sand to Sandy Silt 60.58 61.44 53.48 15.65 15.95 2.06 3.04 Clays: Silty Clay to Clay 60.42 61.32 53.21 15.95 16.08 4.15 2.45 Sand Mixture:Silty Sand to Sandy Silt 60.32 61.25 53.06 16.08 16.23 3.86 2.78 Silt Mixture: Clayey Silt to Silty Clay 60.26 61.20 52.96 16.23 16.43 9.65 1.94 Sands:Clean Sand to Silty Sand 60.18 61.15 52.84 16.43 18.55 1.82 3.24 Clays: Silty Clay to Clay 59.65 60.75 52.04 18.55 19.23 13.64 1.86 Sands:Clean Sand to Silty Sand 59.01 60.25 51.10 19.23 20.28 1.80 3.21 Clays: Silty Clay to Clay 58.59 59.92 50.55 20.28 20.75 5.32 2.54 Sand Mixture:Silty Sand to Sandy Silt 58.21 59.63 50.07 20.75 20.85 5.11 2.72 Silt Mixture: Clayey Silt to Silty Clay 58.06 59.52 49.89 20.85 21.63 9.18 2.25 Sand Mixture:Silty Sand to Sandy Silt 57.83 59.34 49.63 21.63 23.40 1.81 3.25 Silt Mixtures:clayey silt to silty clay 56.76 58.15 47.18 23.40 23.65 5.86 2.60 Silt Mixtures:clayey silt to silty clay 56.14 57.69 46.54 SP
13- O
bser
ced
Sett
lem
en =
0.10
2m
SP1
4-
Obs
erce
d Se
ttle
men
=0.
166m
SP
15- O
bser
ced
Sett
lem
en =
0.18
3m
23.65 25.55 1.96 3.29 Clays:silty clay to clay 55.62 57.32 46.05

226
Table 5 Database Summary of CPT-6 (Continued)
Depth 1 (m)
Depth 2 (m)
qt (Average) (MPa) Ic(Average) Soil Classification ∆σ (Average)
(kPa) SP-19 ∆σ (Average) (kPa) SP-20
∆σ (Average) (kPa) SP-21
0.00 0.33 2.09 1.84 Sands:Clean Sand to Silty Sand 63.96 63.88 63.79 0.33 0.63 2.32 2.19 Sand Mixture:Silty Sand to Sandy Silt 63.96 63.88 63.79 0.63 0.98 3.56 1.83 Sands:Clean Sand to Silty Sand 63.95 63.87 63.76 0.98 1.10 1.46 2.38 Sand Mixture:Silty Sand to Sandy Silt 63.94 63.87 63.76 1.10 2.95 2.51 2.01 Sands:Clean Sand to Silty Sand 63.93 63.85 63.70 2.95 3.35 3.17 2.43 Sand Mixture:Silty Sand to Sandy Silt 63.93 63.60 63.26 3.35 3.73 7.95 1.80 Sands:Clean Sand to Silty Sand 63.92 63.53 63.09 3.73 4.10 4.18 2.27 Sand Mixture:Silty Sand to Sandy Silt 63.92 63.48 62.90 4.10 4.70 0.86 2.76 Silt Mixture: Clayey Silt to Silty Clay 63.91 63.41 62.64 4.70 4.93 0.54 3.03 Clays: Silty Clay to Clay 63.91 63.35 62.40 4.93 5.60 0.87 2.78 Silt Mixture: Clayey Silt to Silty Clay 63.90 63.29 62.13 5.60 6.53 4.22 2.27 Sand Mixture:Silty Sand to Sandy Silt 63.88 63.21 61.61 6.53 7.13 8.27 1.80 Sands:Clean Sand to Silty Sand 63.83 63.13 61.11 7.13 7.28 1.41 2.93 Silt Mixture: Clayey Silt to Silty Clay 63.81 63.10 60.85 7.28 7.88 13.45 1.48 Sands:Clean Sand to Silty Sand 63.78 63.07 60.60 7.88 7.98 4.64 2.27 Sand Mixture:Silty Sand to Sandy Silt 63.75 63.04 60.36 7.98 8.10 1.87 2.84 Silt Mixture: Clayey Silt to Silty Clay 63.74 63.03 60.28 8.10 8.25 0.80 3.12 Clays: Silty Clay to Clay 63.72 63.02 60.19 8.25 8.40 0.82 2.86 Silt Mixture: Clayey Silt to Silty Clay 63.71 63.00 60.08 8.40 8.60 1.05 2.96 Clays: Silty Clay to Clay 63.69 62.99 59.97 8.60 8.85 4.27 2.21 Sand Mixture:Silty Sand to Sandy Silt 63.67 62.97 59.81 8.85 10.43 12.74 1.73 Sands:Clean Sand to Silty Sand 63.56 62.88 59.19 10.43 10.70 2.04 2.76 Silt Mixture: Clayey Silt to Silty Clay 63.45 62.78 58.58 10.70 10.90 3.43 2.43 Sand Mixture:Silty Sand to Sandy Silt 63.42 62.76 58.42 10.90 11.30 10.14 1.92 Sands:Clean Sand to Silty Sand 63.37 62.72 58.23 11.30 11.60 4.38 2.42 Sand Mixture:Silty Sand to Sandy Silt 63.32 62.67 58.00 11.60 11.78 2.88 2.76 Silt Mixture: Clayey Silt to Silty Clay 63.29 62.64 57.85 11.78 12.20 4.31 2.46 Sand Mixture:Silty Sand to Sandy Silt 63.24 62.60 57.67 12.20 12.40 1.53 3.13 Clays: Silty Clay to Clay 63.19 62.56 57.47 12.40 12.58 1.97 2.80 Silt Mixture: Clayey Silt to Silty Clay 63.16 62.53 57.35 12.58 13.60 1.07 3.32 Clays: Silty Clay to Clay 63.05 62.44 56.99
SP19
- Obs
erce
d Se
ttle
men
=0.
142m
S
P20-
Obs
erce
d Se
ttle
men
=0.
233m
SP
21- O
bser
ced
Sett
lem
en =
0.15
6m
13.60 13.78 2.83 2.74 Silt Mixture: Clayey Silt to Silty Clay 62.95 62.36 56.63

227
Table 5 Database Summary of CPT-6 (Continued)
Depth 1 (m)
Depth 2 (m)
qt (Average) (MPa) Ic(Average) Soil Classification ∆σ (Average)
(kPa) SP-19 ∆σ (Average) (kPa) SP-20
∆σ (Average) (kPa) SP-21
13.78 13.90 4.38 2.47 Sand Mixture:Silty Sand to Sandy Silt 62.92 62.34 56.54 13.90 14.83 1.58 3.08 Clays: Silty Clay to Clay 62.81 62.26 56.24 14.83 15.03 5.39 2.29 Sand Mixture:Silty Sand to Sandy Silt 62.70 62.19 55.92 15.03 15.20 3.39 2.73 Silt Mixture: Clayey Silt to Silty Clay 62.66 62.17 55.82 15.20 15.65 6.37 2.26 Sand Mixture:Silty Sand to Sandy Silt 62.59 62.13 55.64 15.65 15.95 2.06 3.04 Clays: Silty Clay to Clay 62.51 62.09 55.44 15.95 16.08 4.15 2.45 Sand Mixture:Silty Sand to Sandy Silt 62.46 62.07 55.32 16.08 16.23 3.86 2.78 Silt Mixture: Clayey Silt to Silty Clay 62.43 62.05 55.25 16.23 16.43 9.65 1.94 Sands:Clean Sand to Silty Sand 62.39 62.04 55.15 16.43 18.55 1.82 3.24 Clays: Silty Clay to Clay 62.10 61.96 54.55 18.55 19.23 13.64 1.86 Sands:Clean Sand to Silty Sand 61.72 61.88 53.85 19.23 20.28 1.80 3.21 Clays: Silty Clay to Clay 61.46 61.81 53.43 20.28 20.75 5.32 2.54 Sand Mixture:Silty Sand to Sandy Silt 61.23 61.69 53.08 20.75 20.85 5.11 2.72 Silt Mixture: Clayey Silt to Silty Clay 61.13 61.63 52.95 20.85 21.63 9.18 2.25 Sand Mixture:Silty Sand to Sandy Silt 60.99 61.49 52.75 21.63 23.40 1.81 3.25 Silt Mixtures:clayey silt to silty clay 60.15 60.44 50.96 23.40 23.65 5.86 2.60 Silt Mixtures:clayey silt to silty clay 60.06 60.36 50.84 SP
19- O
bser
ced
Sett
lem
en =
0.14
2m
SP2
0-
Obs
erce
d Se
ttle
men
=0.
233m
SP
21- O
bser
ced
Sett
lem
en =
0.15
6m
23.65 25.55 1.96 3.29 Clays:silty clay to clay 59.89 60.17 50.62

228
Table 6 Database Summary of CPT-7
Depth 1 (m)
Depth 2 (m)
qt (Average) (MPa) Ic(Average) Soil Classification ∆σ (Average)
(kPa) SP-13 ∆σ (Average) (kPa) SP-14
∆σ (Average) (kPa) SP-15
0.00 0.25 2.92 1.58 Sands:Clean Sand to Silty Sand 63.95 63.99 64.02 0.25 0.83 1.91 2.31 Sand Mixture:Silty Sand to Sandy Silt 63.91 63.97 63.99 0.83 1.83 0.94 2.69 Silt Mixture: Clayey Silt to Silty Clay 63.88 63.97 63.91 1.83 2.10 0.73 3.08 Clays: Silty Clay to Clay 63.87 63.95 63.90 2.10 2.25 0.77 2.84 Silt Mixture: Clayey Silt to Silty Clay 63.91 63.94 63.77 2.25 2.38 1.45 2.55 Sand Mixture:Silty Sand to Sandy Silt 63.90 63.94 63.48 2.38 2.50 1.14 2.65 Silt Mixture: Clayey Silt to Silty Clay 63.91 63.93 63.26 2.50 3.33 3.23 2.38 Sand Mixture:Silty Sand to Sandy Silt 63.91 63.91 63.02 3.33 3.45 5.68 2.00 Sands:Clean Sand to Silty Sand 63.91 63.91 62.67 3.45 3.70 3.96 2.26 Sand Mixture:Silty Sand to Sandy Silt 63.89 63.90 62.36 3.70 3.95 5.94 2.01 Sands:Clean Sand to Silty Sand 63.87 63.86 62.00 3.95 4.08 3.63 2.30 Sand Mixture:Silty Sand to Sandy Silt 63.79 63.77 61.33 4.08 5.18 1.19 2.80 Silt Mixture: Clayey Silt to Silty Clay 63.68 63.66 60.66 5.18 5.33 0.95 3.01 Clays: Silty Clay to Clay 63.61 63.60 60.32 5.33 5.50 1.08 2.77 Silt Mixture: Clayey Silt to Silty Clay 63.53 63.53 59.98 5.50 6.43 3.67 2.33 Sand Mixture:Silty Sand to Sandy Silt 63.45 63.46 59.67 6.43 7.78 8.93 1.77 Sands:Clean Sand to Silty Sand 63.42 63.44 59.56 7.78 8.08 3.65 2.46 Sand Mixture:Silty Sand to Sandy Silt 63.39 63.41 59.44 8.08 8.93 12.24 1.59 Sands:Clean Sand to Silty Sand 63.35 63.38 59.30 8.93 9.15 3.60 2.47 Sand Mixture:Silty Sand to Sandy Silt 63.30 63.35 59.15 9.15 10.20 11.71 1.73 Sands:Clean Sand to Silty Sand 63.24 63.30 58.94 10.20 11.30 1.09 3.14 Clays: Silty Clay to Clay 62.95 63.09 58.13 11.30 11.40 2.92 2.36 Sand Mixture:Silty Sand to Sandy Silt 62.63 62.87 57.32 11.40 11.80 1.62 2.90 Silt Mixture: Clayey Silt to Silty Clay 62.54 62.81 57.12 11.80 12.05 5.73 2.12 Sand Mixture:Silty Sand to Sandy Silt 62.42 62.73 56.87 12.05 12.58 1.23 3.01 Clays: Silty Clay to Clay 62.28 62.63 56.57 12.58 12.70 1.41 2.88 Silt Mixture: Clayey Silt to Silty Clay 62.19 62.57 56.38 12.70 13.58 1.15 3.30 Clays: Silty Clay to Clay 62.07 62.48 56.13 13.58 13.73 4.67 2.46 Sand Mixture:Silty Sand to Sandy Silt 61.94 62.40 55.87 13.73 13.88 9.33 1.91 Sands:Clean Sand to Silty Sand 61.86 62.34 55.72 13.88 14.08 3.60 2.55 Sand Mixture:Silty Sand to Sandy Silt 61.61 62.17 55.25
SP13
- Obs
erce
d Se
ttle
men
=0.
102m
S
P14-
Obs
erce
d Se
ttle
men
=0.
166m
SP
15- O
bser
ced
Sett
lem
en =
0.18
3m
14.08 14.88 1.04 3.31 Clays: Silty Clay to Clay 61.35 61.99 54.78

229
Table 6 Database Summary of CPT-7 (Continued)
Depth 1 (m)
Depth 2 (m)
qt (Average) (MPa) Ic(Average) Soil Classification ∆σ (Average)
(kPa) SP-13 ∆σ (Average) (kPa) SP-14
∆σ (Average) (kPa) SP-15
14.88 15.13 3.61 2.46 Sand Mixture:Silty Sand to Sandy Silt 61.28 61.94 54.66 15.13 15.30 11.37 1.94 Sands:Clean Sand to Silty Sand 61.05 61.78 54.27 15.30 15.45 8.18 2.13 Sand Mixture:Silty Sand to Sandy Silt 60.80 61.60 53.85 15.45 15.58 11.14 1.94 Sands:Clean Sand to Silty Sand 60.72 61.54 53.71 15.58 15.75 5.58 2.35 Sand Mixture:Silty Sand to Sandy Silt 60.58 61.44 53.48 15.75 15.90 2.32 3.00 Clays: Silty Clay to Clay 60.42 61.32 53.21 15.90 16.58 18.12 1.67 Sands:Clean Sand to Silty Sand 60.32 61.25 53.06 16.58 16.73 4.36 2.56 Sand Mixture:Silty Sand to Sandy Silt 60.26 61.20 52.96 16.73 18.90 1.58 3.24 Clays: Silty Clay to Clay 60.18 61.15 52.84 18.90 19.33 7.82 2.22 Sand Mixture:Silty Sand to Sandy Silt 59.65 60.75 52.04 19.33 19.83 1.45 3.36 Clays: Silty Clay to Clay 59.01 60.25 51.10 14.88 15.13 3.61 2.46 Sand Mixture:Silty Sand to Sandy Silt 58.59 59.92 50.55 15.13 15.30 11.37 1.94 Sands:Clean Sand to Silty Sand 58.21 59.63 50.07 15.30 15.45 8.18 2.13 Sand Mixture:Silty Sand to Sandy Silt 58.06 59.58 49.89 15.45 15.58 11.14 1.94 Sands:Clean Sand to Silty Sand 57.83 59.54 49.63 15.58 16.63 6.89 2.31 Sand Mixtures:silty sand to sandy silt 59.30 59.40 50.62 16.63 18.43 1.53 3.24 Silt Mixtures:clayey silt to silty clay 58.73 59.30 49.75 18.43 18.83 3.07 2.86 Silt Mixtures:clayey silt to silty clay 58.22 59.27 49.01 18.83 19.33 1.66 3.23 Clays:silty clay to clay 58.01 59.11 48.72 19.33 19.48 3.05 2.80 Silt Mixtures:clayey silt to silty clay 57.85 58.98 48.51 19.48 19.73 8.44 2.12 Sand Mixtures:silty sand to sandy silt 57.76 58.91 48.38 19.73 20.00 4.04 2.81 Silt Mixtures:clayey silt to silty clay 57.63 58.81 48.21 20.00 20.63 1.68 3.24 Clays:silty clay to clay 57.40 58.64 47.93 20.63 20.95 10.76 1.95 Sand Mixtures:silty sand to sandy silt 57.16 58.45 47.64 20.95 21.20 2.31 3.03 Silt Mixtures:clayey silt to silty clay 57.02 58.34 47.47 21.20 21.90 11.19 2.02 Sand Mixtures:silty sand to sandy silt 56.76 58.15 47.18 21.90 23.40 1.81 3.25 Silt Mixtures:clayey silt to silty clay 56.14 57.69 46.54 23.40 23.65 5.86 2.60 Silt Mixtures:clayey silt to silty clay 55.62 57.32 46.05 SP
13- O
bser
ced
Sett
lem
en =
0.10
2m
SP1
4- O
bser
ced
Sett
lem
en =
0.16
6m
SP15
- Obs
erce
d Se
ttle
men
=0.
183m
23.65 25.55 1.96 3.29 Clays:silty clay to clay 54.95 56.86 45.47
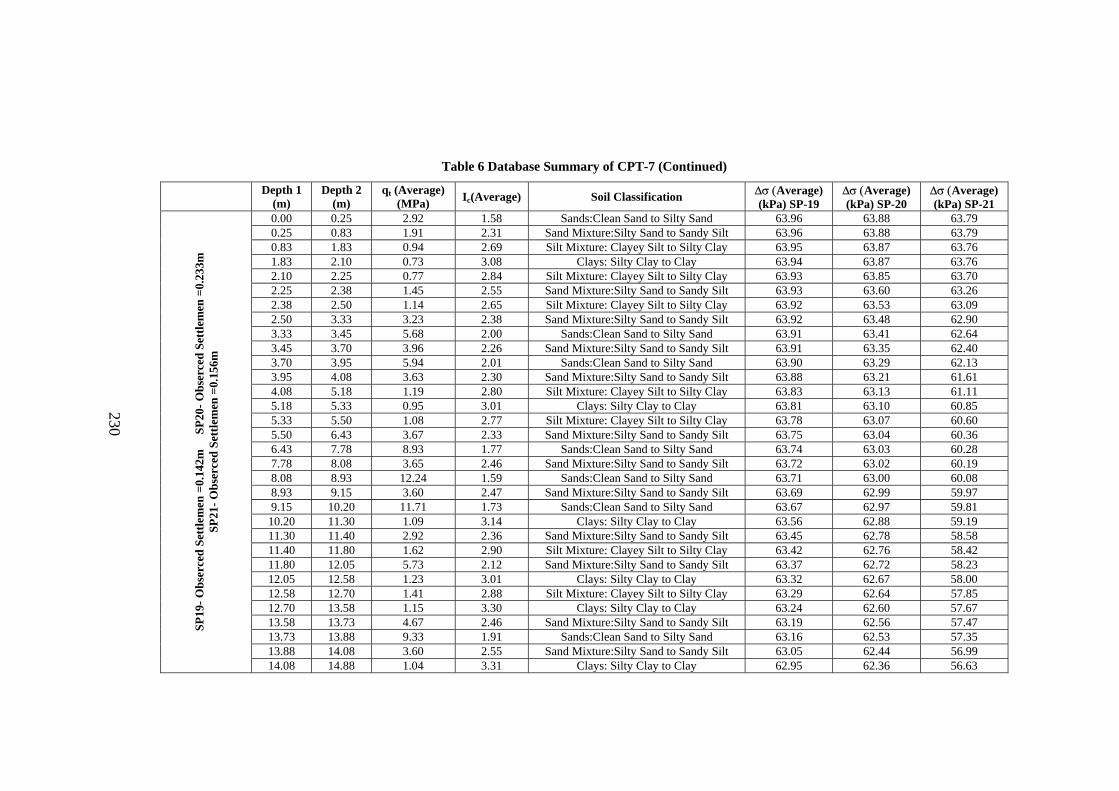
230
Table 6 Database Summary of CPT-7 (Continued)
Depth 1 (m)
Depth 2 (m)
qt (Average) (MPa) Ic(Average) Soil Classification ∆σ (Average)
(kPa) SP-19 ∆σ (Average) (kPa) SP-20
∆σ (Average) (kPa) SP-21
0.00 0.25 2.92 1.58 Sands:Clean Sand to Silty Sand 63.96 63.88 63.79 0.25 0.83 1.91 2.31 Sand Mixture:Silty Sand to Sandy Silt 63.96 63.88 63.79 0.83 1.83 0.94 2.69 Silt Mixture: Clayey Silt to Silty Clay 63.95 63.87 63.76 1.83 2.10 0.73 3.08 Clays: Silty Clay to Clay 63.94 63.87 63.76 2.10 2.25 0.77 2.84 Silt Mixture: Clayey Silt to Silty Clay 63.93 63.85 63.70 2.25 2.38 1.45 2.55 Sand Mixture:Silty Sand to Sandy Silt 63.93 63.60 63.26 2.38 2.50 1.14 2.65 Silt Mixture: Clayey Silt to Silty Clay 63.92 63.53 63.09 2.50 3.33 3.23 2.38 Sand Mixture:Silty Sand to Sandy Silt 63.92 63.48 62.90 3.33 3.45 5.68 2.00 Sands:Clean Sand to Silty Sand 63.91 63.41 62.64 3.45 3.70 3.96 2.26 Sand Mixture:Silty Sand to Sandy Silt 63.91 63.35 62.40 3.70 3.95 5.94 2.01 Sands:Clean Sand to Silty Sand 63.90 63.29 62.13 3.95 4.08 3.63 2.30 Sand Mixture:Silty Sand to Sandy Silt 63.88 63.21 61.61 4.08 5.18 1.19 2.80 Silt Mixture: Clayey Silt to Silty Clay 63.83 63.13 61.11 5.18 5.33 0.95 3.01 Clays: Silty Clay to Clay 63.81 63.10 60.85 5.33 5.50 1.08 2.77 Silt Mixture: Clayey Silt to Silty Clay 63.78 63.07 60.60 5.50 6.43 3.67 2.33 Sand Mixture:Silty Sand to Sandy Silt 63.75 63.04 60.36 6.43 7.78 8.93 1.77 Sands:Clean Sand to Silty Sand 63.74 63.03 60.28 7.78 8.08 3.65 2.46 Sand Mixture:Silty Sand to Sandy Silt 63.72 63.02 60.19 8.08 8.93 12.24 1.59 Sands:Clean Sand to Silty Sand 63.71 63.00 60.08 8.93 9.15 3.60 2.47 Sand Mixture:Silty Sand to Sandy Silt 63.69 62.99 59.97 9.15 10.20 11.71 1.73 Sands:Clean Sand to Silty Sand 63.67 62.97 59.81 10.20 11.30 1.09 3.14 Clays: Silty Clay to Clay 63.56 62.88 59.19 11.30 11.40 2.92 2.36 Sand Mixture:Silty Sand to Sandy Silt 63.45 62.78 58.58 11.40 11.80 1.62 2.90 Silt Mixture: Clayey Silt to Silty Clay 63.42 62.76 58.42 11.80 12.05 5.73 2.12 Sand Mixture:Silty Sand to Sandy Silt 63.37 62.72 58.23 12.05 12.58 1.23 3.01 Clays: Silty Clay to Clay 63.32 62.67 58.00 12.58 12.70 1.41 2.88 Silt Mixture: Clayey Silt to Silty Clay 63.29 62.64 57.85 12.70 13.58 1.15 3.30 Clays: Silty Clay to Clay 63.24 62.60 57.67 13.58 13.73 4.67 2.46 Sand Mixture:Silty Sand to Sandy Silt 63.19 62.56 57.47 13.73 13.88 9.33 1.91 Sands:Clean Sand to Silty Sand 63.16 62.53 57.35 13.88 14.08 3.60 2.55 Sand Mixture:Silty Sand to Sandy Silt 63.05 62.44 56.99
SP19
- Obs
erce
d Se
ttle
men
=0.
142m
S
P20-
Obs
erce
d Se
ttle
men
=0.
233m
SP
21- O
bser
ced
Sett
lem
en =
0.15
6m
14.08 14.88 1.04 3.31 Clays: Silty Clay to Clay 62.95 62.36 56.63

231
Table 6 Database Summary of CPT-7 (Continued)
Depth 1 (m)
Depth 2 (m)
qt (Average) (MPa) Ic(Average) Soil Classification ∆σ (Average)
(kPa) SP-19 ∆σ (Average) (kPa) SP-20
∆σ (Average) (kPa) SP-21
14.88 15.13 3.61 2.46 Sand Mixture:Silty Sand to Sandy Silt 62.92 62.34 56.54 15.13 15.30 11.37 1.94 Sands:Clean Sand to Silty Sand 62.81 62.26 56.24 15.30 15.45 8.18 2.13 Sand Mixture:Silty Sand to Sandy Silt 62.70 62.19 55.92 15.45 15.58 11.14 1.94 Sands:Clean Sand to Silty Sand 62.66 62.17 55.82 15.58 15.75 5.58 2.35 Sand Mixture:Silty Sand to Sandy Silt 62.59 62.13 55.64 15.75 15.90 2.32 3.00 Clays: Silty Clay to Clay 62.51 62.09 55.44 15.90 16.58 18.12 1.67 Sands:Clean Sand to Silty Sand 62.46 62.07 55.32 16.58 16.73 4.36 2.56 Sand Mixture:Silty Sand to Sandy Silt 62.43 62.05 55.25 16.73 18.90 1.58 3.24 Clays: Silty Clay to Clay 62.39 62.04 55.15 18.90 19.33 7.82 2.22 Sand Mixture:Silty Sand to Sandy Silt 62.10 61.96 54.55 19.33 19.83 1.45 3.36 Clays: Silty Clay to Clay 61.72 61.88 53.85 14.88 15.13 3.61 2.46 Sand Mixture:Silty Sand to Sandy Silt 61.46 61.81 53.43 15.13 15.30 11.37 1.94 Sands:Clean Sand to Silty Sand 61.23 61.69 53.08 15.30 15.45 8.18 2.13 Sand Mixture:Silty Sand to Sandy Silt 61.13 61.63 52.95 15.45 15.58 11.14 1.94 Sands:Clean Sand to Silty Sand 60.99 61.49 52.75 15.58 16.63 6.89 2.31 Sand Mixtures:silty sand to sandy silt 61.41 60.85 53.20 16.63 18.43 1.53 3.24 Silt Mixtures:clayey silt to silty clay 61.10 60.76 52.54 18.43 18.83 3.07 2.86 Silt Mixtures:clayey silt to silty clay 60.80 60.70 51.99 18.83 19.33 1.66 3.23 Clays:silty clay to clay 60.67 60.67 51.77 19.33 19.48 3.05 2.80 Silt Mixtures:clayey silt to silty clay 60.58 60.65 51.61 19.48 19.73 8.44 2.12 Sand Mixtures:silty sand to sandy silt 60.52 60.63 51.51 19.73 20.00 4.04 2.81 Silt Mixtures:clayey silt to silty clay 60.44 60.60 51.39 20.00 20.63 1.68 3.24 Clays:silty clay to clay 60.30 60.54 51.18 20.63 20.95 10.76 1.95 Sand Mixtures:silty sand to sandy silt 60.15 60.44 50.96 20.95 21.20 2.31 3.03 Silt Mixtures:clayey silt to silty clay 60.06 60.36 50.84 21.20 21.90 11.19 2.02 Sand Mixtures:silty sand to sandy silt 59.89 60.17 50.62 21.90 23.40 1.81 3.25 Silt Mixtures:clayey silt to silty clay 59.51 59.41 50.15 23.40 23.65 5.86 2.60 Silt Mixtures:clayey silt to silty clay 59.20 58.43 49.79 SP
19- O
bser
ced
Sett
lem
en =
0.14
2m
SP2
0- O
bser
ced
Sett
lem
en =
0.23
3m
SP21
- Obs
erce
d Se
ttle
men
=0.
156m
23.65 25.55 1.96 3.29 Clays:silty clay to clay 58.81 56.18 49.37

232
Table 7 Database Summary of CPT-8
Depth 1 (m)
Depth 2 (m)
qt (Average) (MPa) Ic(Average) Soil Classification ∆σ (Average)
(kPa) SP-16 ∆σ (Average) (kPa) SP-17
∆σ (Average) (kPa) SP-18
0.00 0.53 1.29 2.33 Sands:clean sand to silty sand 63.92 63.93 62.93 0.53 1.45 3.14 1.80 Sands:clean sand to silty sand 63.87 63.93 62.92 1.45 1.83 1.40 2.38 Sand Mixtures:silty sand to sandy silt 63.85 63.92 62.88 1.83 2.03 1.16 2.74 Silt Mixtures:clayey silt to silty clay 63.86 63.91 62.79 2.03 2.43 0.64 3.10 Clays:silty clay to clay 63.86 63.91 62.73 2.43 3.25 1.10 2.79 Silt Mixtures:clayey silt to silty clay 63.88 63.88 62.55 3.25 3.95 4.28 2.18 Sand Mixtures:silty sand to sandy silt 63.90 63.88 62.14 3.95 4.23 1.02 2.88 Silt Mixtures:clayey silt to silty clay 63.90 63.87 61.82 4.23 4.38 0.78 3.00 Clays:silty clay to clay 63.90 63.85 61.67 4.38 4.83 1.02 2.85 Silt Mixtures:clayey silt to silty clay 63.89 63.84 61.45 4.83 5.93 0.90 3.12 Clays:silty clay to clay 63.85 63.77 60.83 5.93 6.28 2.78 2.43 Silt Mixtures:clayey silt to silty clay 63.78 63.68 60.22 6.28 7.50 8.93 1.70 Sands:clean sand to silty sand 63.65 63.57 59.52 7.50 8.70 11.16 1.59 Sands:clean sand to silty sand 63.39 63.35 58.43 8.70 8.95 0.92 3.11 Silt Mixtures:clayey silt to silty clay 63.20 63.20 57.77 8.95 9.45 11.90 1.55 Sand Mixtures:silty sand to sandy silt 63.08 63.12 57.44 9.45 9.65 23.26 1.22 Gravelly sand to dense sand 62.97 63.04 57.13 9.65 11.05 11.93 1.67 Sands:clean sand to silty sand 62.69 62.84 56.43 11.05 12.40 14.24 1.69 Sands:clean sand to silty sand 62.16 62.48 55.27 12.40 12.80 1.90 2.80 Silt Mixtures:clayey silt to silty clay 61.80 62.23 54.55 12.80 13.53 6.52 2.20 Sand Mixtures:silty sand to sandy silt 61.56 62.07 54.11 13.53 14.60 18.15 1.59 Sands:clean sand to silty sand 61.17 61.79 53.41 14.60 15.00 1.89 2.96 Silt Mixtures:clayey silt to silty clay 60.85 61.56 52.86 15.00 15.88 13.79 1.72 Sand Mixtures:silty sand to sandy silt 60.57 61.36 52.39 15.88 16.60 6.89 2.31 Sand Mixtures:silty sand to sandy silt 60.21 61.09 51.82 16.60 18.40 1.53 3.24 Silt Mixtures:clayey silt to silty clay 59.64 60.66 50.95 18.40 18.80 3.07 2.86 Silt Mixtures:clayey silt to silty clay 59.13 60.27 50.21 18.80 19.30 1.66 3.23 Clays:silty clay to clay 58.92 60.11 49.92 19.30 19.45 3.05 2.80 Silt Mixtures:clayey silt to silty clay 58.76 59.98 49.71 19.45 19.70 8.44 2.12 Sand Mixtures:silty sand to sandy silt 58.67 59.91 49.58 19.70 19.98 4.04 2.81 Silt Mixtures:clayey silt to silty clay 58.54 59.81 49.41
SP16
- Obs
erce
d Se
ttle
men
=0.
205m
S
P17-
Obs
erce
d Se
ttle
men
=0.
195m
SP
18- O
bser
ced
Sett
lem
en =
0.25
0m
19.98 20.60 1.68 3.24 Clays:silty clay to clay 58.31 59.64 49.13

233
Table 7 Database Summary of CPT-8 (Continued)
Depth 1 (m)
Depth 2 (m)
qt (Average) (MPa) Ic(Average) Soil Classification ∆σ (Average)
(kPa) SP-16 ∆σ (Average) (kPa) SP-17
∆σ (Average) (kPa) SP-18
20.60 20.93 10.76 1.95 Sand Mixtures:silty sand to sandy silt 58.07 59.45 48.84 20.93 21.18 2.31 3.03 Silt Mixtures:clayey silt to silty clay 57.93 59.34 48.67 21.18 21.88 11.19 2.02 Sand Mixtures:silty sand to sandy silt 57.67 59.15 48.38 21.88 23.38 1.81 3.25 Silt Mixtures:clayey silt to silty clay 57.05 58.69 47.74 23.38 23.63 5.86 2.60 Silt Mixtures:clayey silt to silty clay 56.53 58.32 47.25
23.63 25.50 1.96 3.29 Clays:silty clay to clay 55.86 57.86 46.67

234
Table 7 Database Summary of CPT-8 (Continued)
Depth 1 (m)
Depth 2 (m)
qt (Average) (MPa) Ic(Average) Soil Classification ∆σ (Average)
(kPa) SP-22 ∆σ (Average) (kPa) SP-23
∆σ (Average) (kPa) SP-24
0.00 0.53 1.29 2.33 Sands:clean sand to silty sand 63.96 63.96 63.98 0.53 1.45 3.14 1.80 Sands:clean sand to silty sand 63.96 63.97 63.93 1.45 1.83 1.40 2.38 Sand Mixtures:silty sand to sandy silt 63.95 63.92 63.92 1.83 2.03 1.16 2.74 Silt Mixtures:clayey silt to silty clay 63.95 63.88 63.87 2.03 2.43 0.64 3.10 Clays:silty clay to clay 63.95 63.84 63.80 2.43 3.25 1.10 2.79 Silt Mixtures:clayey silt to silty clay 63.95 63.75 63.59 3.25 3.95 4.28 2.18 Sand Mixtures:silty sand to sandy silt 63.94 63.62 63.26 3.95 4.23 1.02 2.88 Silt Mixtures:clayey silt to silty clay 63.94 63.55 63.01 4.23 4.38 0.78 3.00 Clays:silty clay to clay 63.92 63.52 62.89 4.38 4.83 1.02 2.85 Silt Mixtures:clayey silt to silty clay 63.91 63.48 62.72 4.83 5.93 0.90 3.12 Clays:silty clay to clay 63.90 63.38 62.25 5.93 6.28 2.78 2.43 Silt Mixtures:clayey silt to silty clay 63.88 63.30 61.79 6.28 7.50 8.93 1.70 Sands:clean sand to silty sand 63.83 63.23 61.26 7.50 8.70 11.16 1.59 Sands:clean sand to silty sand 63.73 63.12 60.44 8.70 8.95 0.92 3.11 Silt Mixtures:clayey silt to silty clay 63.66 63.06 59.94 8.95 9.45 11.90 1.55 Sand Mixtures:silty sand to sandy silt 63.62 63.03 59.69 9.45 9.65 23.26 1.22 Gravelly sand to dense sand 63.58 62.99 59.45 9.65 11.05 11.93 1.67 Sands:clean sand to silty sand 63.48 62.91 58.92 11.05 12.40 14.24 1.69 Sands:clean sand to silty sand 63.28 62.74 58.03 12.40 12.80 1.90 2.80 Silt Mixtures:clayey silt to silty clay 63.14 62.61 57.49 12.80 13.53 6.52 2.20 Sand Mixtures:silty sand to sandy silt 63.04 62.53 57.14 13.53 14.60 18.15 1.59 Sands:clean sand to silty sand 62.87 62.40 56.61 14.60 15.00 1.89 2.96 Silt Mixtures:clayey silt to silty clay 62.73 62.30 56.19 15.00 15.88 13.79 1.72 Sand Mixtures:silty sand to sandy silt 62.59 62.23 55.84 15.88 16.60 6.89 2.31 Sand Mixtures:silty sand to sandy silt 62.41 62.15 55.40 16.60 18.40 1.53 3.24 Silt Mixtures:clayey silt to silty clay 62.10 62.06 54.74 18.40 18.80 3.07 2.86 Silt Mixtures:clayey silt to silty clay 61.80 62.00 54.19 18.80 19.30 1.66 3.23 Clays:silty clay to clay 61.67 61.97 53.97 19.30 19.45 3.05 2.80 Silt Mixtures:clayey silt to silty clay 61.58 61.95 53.81 19.45 19.70 8.44 2.12 Sand Mixtures:silty sand to sandy silt 61.52 61.93 53.71 19.70 19.98 4.04 2.81 Silt Mixtures:clayey silt to silty clay 61.44 61.90 53.59
SP22
- Obs
erce
d Se
ttle
men
= 0
.182
S
P23-
Obs
erce
d Se
ttle
men
=0.
230m
SP
24- O
bser
ced
Sett
lem
en =
0.19
3m
19.98 20.60 1.68 3.24 Clays:silty clay to clay 61.30 61.84 53.38

235
Table 7 Database Summary of CPT-8 (Continued)
Depth 1 (m)
Depth 2 (m)
qt (Average) (MPa) Ic(Average) Soil Classification ∆σ (Average)
(kPa) SP-22 ∆σ (Average) (kPa) SP-23
∆σ (Average) (kPa) SP-24
20.60 20.93 10.76 1.95 Sand Mixtures:silty sand to sandy silt 61.15 61.74 53.16 20.93 21.18 2.31 3.03 Silt Mixtures:clayey silt to silty clay 61.06 61.66 53.04 21.18 21.88 11.19 2.02 Sand Mixtures:silty sand to sandy silt 60.89 61.47 52.82 21.88 23.38 1.81 3.25 Silt Mixtures:clayey silt to silty clay 60.51 60.71 52.35 23.38 23.63 5.86 2.60 Silt Mixtures:clayey silt to silty clay 60.20 59.73 51.99
23.63 25.50 1.96 3.29 Clays:silty clay to clay 59.81 57.48 51.57

236
Table 7 Database Summary of CPT-8 (Continued)
Depth 1 (m)
Depth 2 (m)
qt (Average) (MPa) Ic(Average) Soil Classification ∆σ (Average)
(kPa) SP-28 ∆σ (Average) (kPa) SP-29
∆σ (Average) (kPa) SP-30
0.00 0.53 1.29 2.33 Sands:clean sand to silty sand 63.95 63.97 63.88 0.53 1.45 3.14 1.80 Sands:clean sand to silty sand 63.91 63.96 64.00 1.45 1.83 1.40 2.38 Sand Mixtures:silty sand to sandy silt 63.81 63.86 63.87 1.83 2.03 1.16 2.74 Silt Mixtures:clayey silt to silty clay 63.74 63.79 63.74 2.03 2.43 0.64 3.10 Clays:silty clay to clay 63.65 63.71 63.56 2.43 3.25 1.10 2.79 Silt Mixtures:clayey silt to silty clay 63.42 63.49 63.07 3.25 3.95 4.28 2.18 Sand Mixtures:silty sand to sandy silt 63.09 63.17 62.33 3.95 4.23 1.02 2.88 Silt Mixtures:clayey silt to silty clay 62.84 62.93 61.78 4.23 4.38 0.78 3.00 Clays:silty clay to clay 62.72 62.82 61.53 4.38 4.83 1.02 2.85 Silt Mixtures:clayey silt to silty clay 62.55 62.66 61.17 4.83 5.93 0.90 3.12 Clays:silty clay to clay 62.08 62.21 60.17 5.93 6.28 2.78 2.43 Silt Mixtures:clayey silt to silty clay 61.60 61.77 59.21 6.28 7.50 8.93 1.70 Sands:clean sand to silty sand 61.05 61.27 58.16 7.50 8.70 11.16 1.59 Sands:clean sand to silty sand 60.17 60.48 56.55 8.70 8.95 0.92 3.11 Silt Mixtures:clayey silt to silty clay 59.63 60.00 55.63 8.95 9.45 11.90 1.55 Sand Mixtures:silty sand to sandy silt 59.35 59.76 55.16 9.45 9.65 23.26 1.22 Gravelly sand to dense sand 59.08 59.53 54.73 9.65 11.05 11.93 1.67 Sands:clean sand to silty sand 58.48 59.00 53.79 11.05 12.40 14.24 1.69 Sands:clean sand to silty sand 57.46 58.12 52.28 12.40 12.80 1.90 2.80 Silt Mixtures:clayey silt to silty clay 56.82 57.58 51.38 12.80 13.53 6.52 2.20 Sand Mixtures:silty sand to sandy silt 56.42 57.23 50.83 13.53 14.60 18.15 1.59 Sands:clean sand to silty sand 55.78 56.69 49.99 14.60 15.00 1.89 2.96 Silt Mixtures:clayey silt to silty clay 55.28 56.26 49.33 15.00 15.88 13.79 1.72 Sand Mixtures:silty sand to sandy silt 54.85 55.89 48.79 15.88 16.60 6.89 2.31 Sand Mixtures:silty sand to sandy silt 54.32 55.44 48.12 16.60 18.40 1.53 3.24 Silt Mixtures:clayey silt to silty clay 53.52 54.76 47.13 18.40 18.80 3.07 2.86 Silt Mixtures:clayey silt to silty clay 52.83 54.18 46.29 18.80 19.30 1.66 3.23 Clays:silty clay to clay 52.56 53.95 45.96 19.30 19.45 3.05 2.80 Silt Mixtures:clayey silt to silty clay 52.36 53.78 45.73 19.45 19.70 8.44 2.12 Sand Mixtures:silty sand to sandy silt 52.24 53.68 45.59 19.70 19.98 4.04 2.81 Silt Mixtures:clayey silt to silty clay 52.08 53.55 45.40
SP28
- Obs
erce
d Se
ttle
men
= 0
.177
S
P29-
Obs
erce
d Se
ttle
men
=0.
220m
SP
30- O
bser
ced
Sett
lem
en =
0.20
1m
19.98 20.60 1.68 3.24 Clays:silty clay to clay 51.82 53.33 45.09

237
Table 7 Database Summary of CPT-8 (Continued)
Depth 1 (m)
Depth 2 (m)
qt (Average) (MPa) Ic(Average) Soil Classification ∆σ (Average)
(kPa) SP-28 ∆σ (Average) (kPa) SP-29
∆σ (Average) (kPa) SP-30
20.60 20.93 10.76 1.95 Sand Mixtures:silty sand to sandy silt 51.53 53.10 44.77 20.93 21.18 2.31 3.03 Silt Mixtures:clayey silt to silty clay 51.37 52.97 44.58 21.18 21.88 11.19 2.02 Sand Mixtures:silty sand to sandy silt 51.08 52.74 44.26 21.88 23.38 1.81 3.25 Silt Mixtures:clayey silt to silty clay 50.44 52.24 43.58 23.38 23.63 5.86 2.60 Silt Mixtures:clayey silt to silty clay 49.94 51.85 43.06
23.63 25.50 1.96 3.29 Clays:silty clay to clay 49.34 51.41 42.48
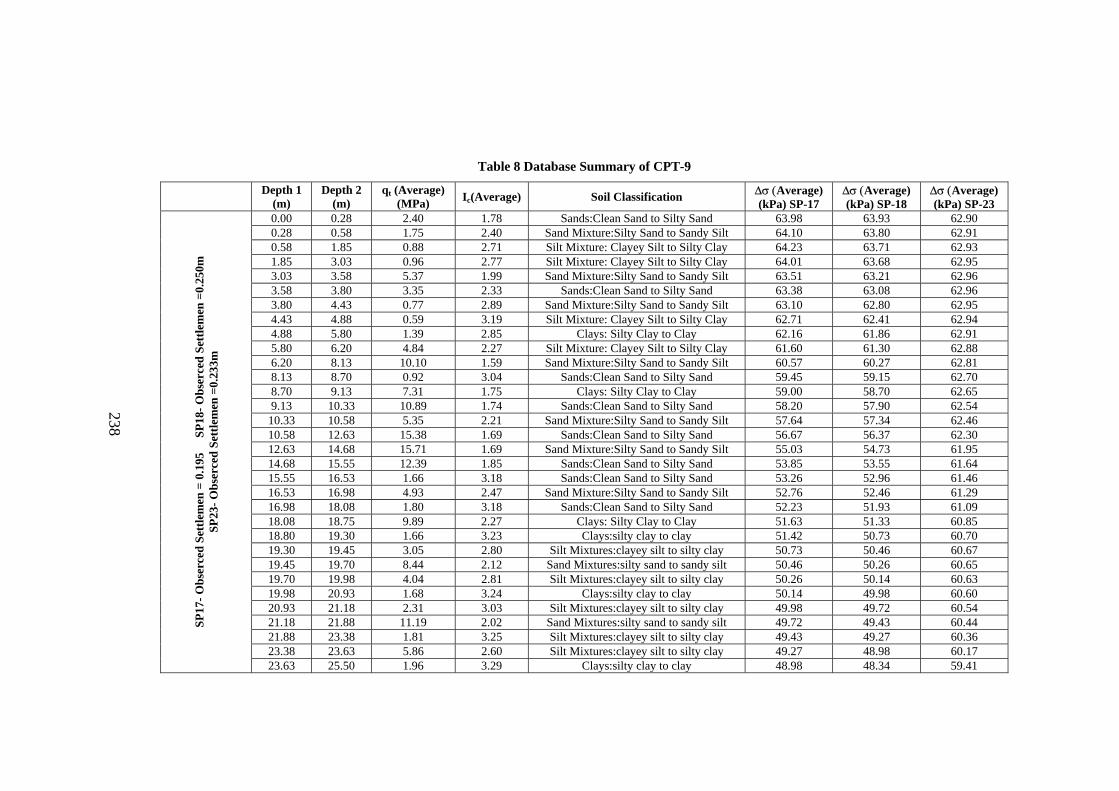
238
Table 8 Database Summary of CPT-9
Depth 1 (m)
Depth 2 (m)
qt (Average) (MPa) Ic(Average) Soil Classification ∆σ (Average)
(kPa) SP-17 ∆σ (Average) (kPa) SP-18
∆σ (Average) (kPa) SP-23
0.00 0.28 2.40 1.78 Sands:Clean Sand to Silty Sand 63.98 63.93 62.90 0.28 0.58 1.75 2.40 Sand Mixture:Silty Sand to Sandy Silt 64.10 63.80 62.91 0.58 1.85 0.88 2.71 Silt Mixture: Clayey Silt to Silty Clay 64.23 63.71 62.93 1.85 3.03 0.96 2.77 Silt Mixture: Clayey Silt to Silty Clay 64.01 63.68 62.95 3.03 3.58 5.37 1.99 Sand Mixture:Silty Sand to Sandy Silt 63.51 63.21 62.96 3.58 3.80 3.35 2.33 Sands:Clean Sand to Silty Sand 63.38 63.08 62.96 3.80 4.43 0.77 2.89 Sand Mixture:Silty Sand to Sandy Silt 63.10 62.80 62.95 4.43 4.88 0.59 3.19 Silt Mixture: Clayey Silt to Silty Clay 62.71 62.41 62.94 4.88 5.80 1.39 2.85 Clays: Silty Clay to Clay 62.16 61.86 62.91 5.80 6.20 4.84 2.27 Silt Mixture: Clayey Silt to Silty Clay 61.60 61.30 62.88 6.20 8.13 10.10 1.59 Sand Mixture:Silty Sand to Sandy Silt 60.57 60.27 62.81 8.13 8.70 0.92 3.04 Sands:Clean Sand to Silty Sand 59.45 59.15 62.70 8.70 9.13 7.31 1.75 Clays: Silty Clay to Clay 59.00 58.70 62.65 9.13 10.33 10.89 1.74 Sands:Clean Sand to Silty Sand 58.20 57.90 62.54 10.33 10.58 5.35 2.21 Sand Mixture:Silty Sand to Sandy Silt 57.64 57.34 62.46 10.58 12.63 15.38 1.69 Sands:Clean Sand to Silty Sand 56.67 56.37 62.30 12.63 14.68 15.71 1.69 Sand Mixture:Silty Sand to Sandy Silt 55.03 54.73 61.95 14.68 15.55 12.39 1.85 Sands:Clean Sand to Silty Sand 53.85 53.55 61.64 15.55 16.53 1.66 3.18 Sands:Clean Sand to Silty Sand 53.26 52.96 61.46 16.53 16.98 4.93 2.47 Sand Mixture:Silty Sand to Sandy Silt 52.76 52.46 61.29 16.98 18.08 1.80 3.18 Sands:Clean Sand to Silty Sand 52.23 51.93 61.09 18.08 18.75 9.89 2.27 Clays: Silty Clay to Clay 51.63 51.33 60.85 18.80 19.30 1.66 3.23 Clays:silty clay to clay 51.42 50.73 60.70 19.30 19.45 3.05 2.80 Silt Mixtures:clayey silt to silty clay 50.73 50.46 60.67 19.45 19.70 8.44 2.12 Sand Mixtures:silty sand to sandy silt 50.46 50.26 60.65 19.70 19.98 4.04 2.81 Silt Mixtures:clayey silt to silty clay 50.26 50.14 60.63 19.98 20.93 1.68 3.24 Clays:silty clay to clay 50.14 49.98 60.60 20.93 21.18 2.31 3.03 Silt Mixtures:clayey silt to silty clay 49.98 49.72 60.54 21.18 21.88 11.19 2.02 Sand Mixtures:silty sand to sandy silt 49.72 49.43 60.44 21.88 23.38 1.81 3.25 Silt Mixtures:clayey silt to silty clay 49.43 49.27 60.36 23.38 23.63 5.86 2.60 Silt Mixtures:clayey silt to silty clay 49.27 48.98 60.17
SP17
- Obs
erce
d Se
ttle
men
= 0
.195
S
P18-
Obs
erce
d Se
ttle
men
=0.
250m
SP
23- O
bser
ced
Sett
lem
en =
0.23
3m
23.63 25.50 1.96 3.29 Clays:silty clay to clay 48.98 48.34 59.41
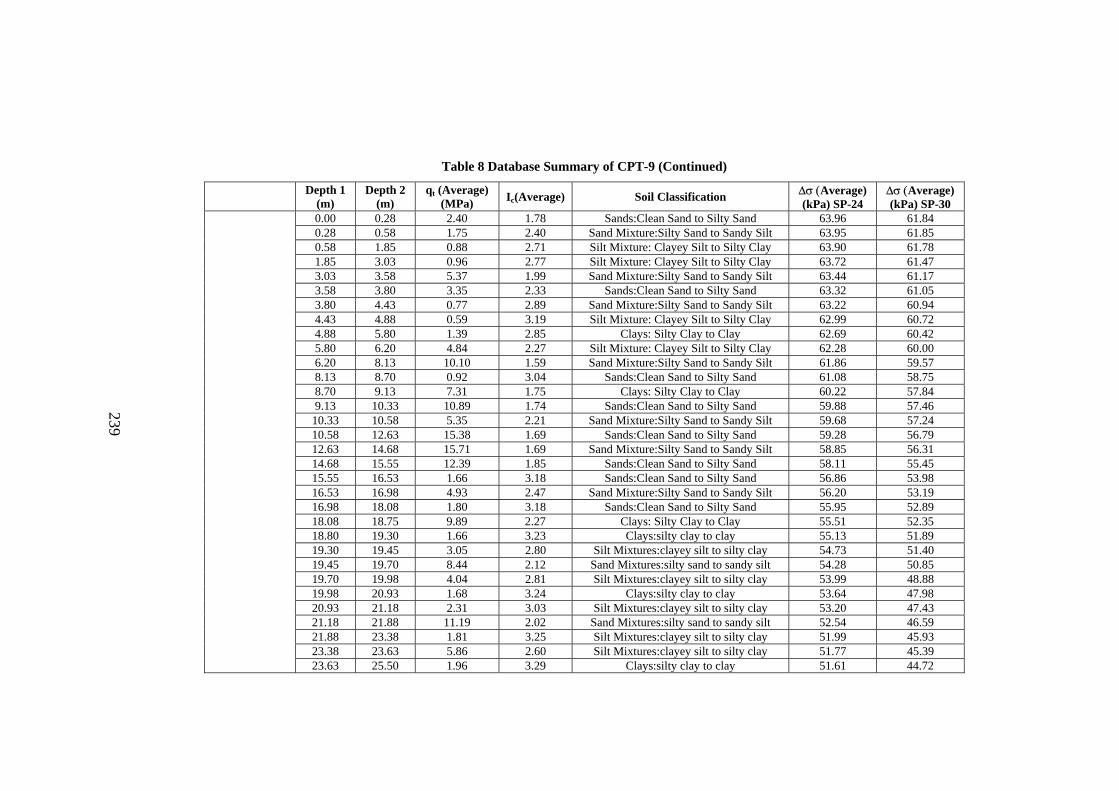
239
Table 8 Database Summary of CPT-9 (Continued)
Depth 1 (m)
Depth 2 (m)
qt (Average) (MPa) Ic(Average) Soil Classification ∆σ (Average)
(kPa) SP-24 ∆σ (Average) (kPa) SP-30
0.00 0.28 2.40 1.78 Sands:Clean Sand to Silty Sand 63.96 61.84 0.28 0.58 1.75 2.40 Sand Mixture:Silty Sand to Sandy Silt 63.95 61.85 0.58 1.85 0.88 2.71 Silt Mixture: Clayey Silt to Silty Clay 63.90 61.78 1.85 3.03 0.96 2.77 Silt Mixture: Clayey Silt to Silty Clay 63.72 61.47 3.03 3.58 5.37 1.99 Sand Mixture:Silty Sand to Sandy Silt 63.44 61.17 3.58 3.80 3.35 2.33 Sands:Clean Sand to Silty Sand 63.32 61.05 3.80 4.43 0.77 2.89 Sand Mixture:Silty Sand to Sandy Silt 63.22 60.94 4.43 4.88 0.59 3.19 Silt Mixture: Clayey Silt to Silty Clay 62.99 60.72 4.88 5.80 1.39 2.85 Clays: Silty Clay to Clay 62.69 60.42 5.80 6.20 4.84 2.27 Silt Mixture: Clayey Silt to Silty Clay 62.28 60.00 6.20 8.13 10.10 1.59 Sand Mixture:Silty Sand to Sandy Silt 61.86 59.57 8.13 8.70 0.92 3.04 Sands:Clean Sand to Silty Sand 61.08 58.75 8.70 9.13 7.31 1.75 Clays: Silty Clay to Clay 60.22 57.84 9.13 10.33 10.89 1.74 Sands:Clean Sand to Silty Sand 59.88 57.46 10.33 10.58 5.35 2.21 Sand Mixture:Silty Sand to Sandy Silt 59.68 57.24 10.58 12.63 15.38 1.69 Sands:Clean Sand to Silty Sand 59.28 56.79 12.63 14.68 15.71 1.69 Sand Mixture:Silty Sand to Sandy Silt 58.85 56.31 14.68 15.55 12.39 1.85 Sands:Clean Sand to Silty Sand 58.11 55.45 15.55 16.53 1.66 3.18 Sands:Clean Sand to Silty Sand 56.86 53.98 16.53 16.98 4.93 2.47 Sand Mixture:Silty Sand to Sandy Silt 56.20 53.19 16.98 18.08 1.80 3.18 Sands:Clean Sand to Silty Sand 55.95 52.89 18.08 18.75 9.89 2.27 Clays: Silty Clay to Clay 55.51 52.35 18.80 19.30 1.66 3.23 Clays:silty clay to clay 55.13 51.89 19.30 19.45 3.05 2.80 Silt Mixtures:clayey silt to silty clay 54.73 51.40 19.45 19.70 8.44 2.12 Sand Mixtures:silty sand to sandy silt 54.28 50.85 19.70 19.98 4.04 2.81 Silt Mixtures:clayey silt to silty clay 53.99 48.88 19.98 20.93 1.68 3.24 Clays:silty clay to clay 53.64 47.98 20.93 21.18 2.31 3.03 Silt Mixtures:clayey silt to silty clay 53.20 47.43 21.18 21.88 11.19 2.02 Sand Mixtures:silty sand to sandy silt 52.54 46.59 21.88 23.38 1.81 3.25 Silt Mixtures:clayey silt to silty clay 51.99 45.93 23.38 23.63 5.86 2.60 Silt Mixtures:clayey silt to silty clay 51.77 45.39
23.63 25.50 1.96 3.29 Clays:silty clay to clay 51.61 44.72
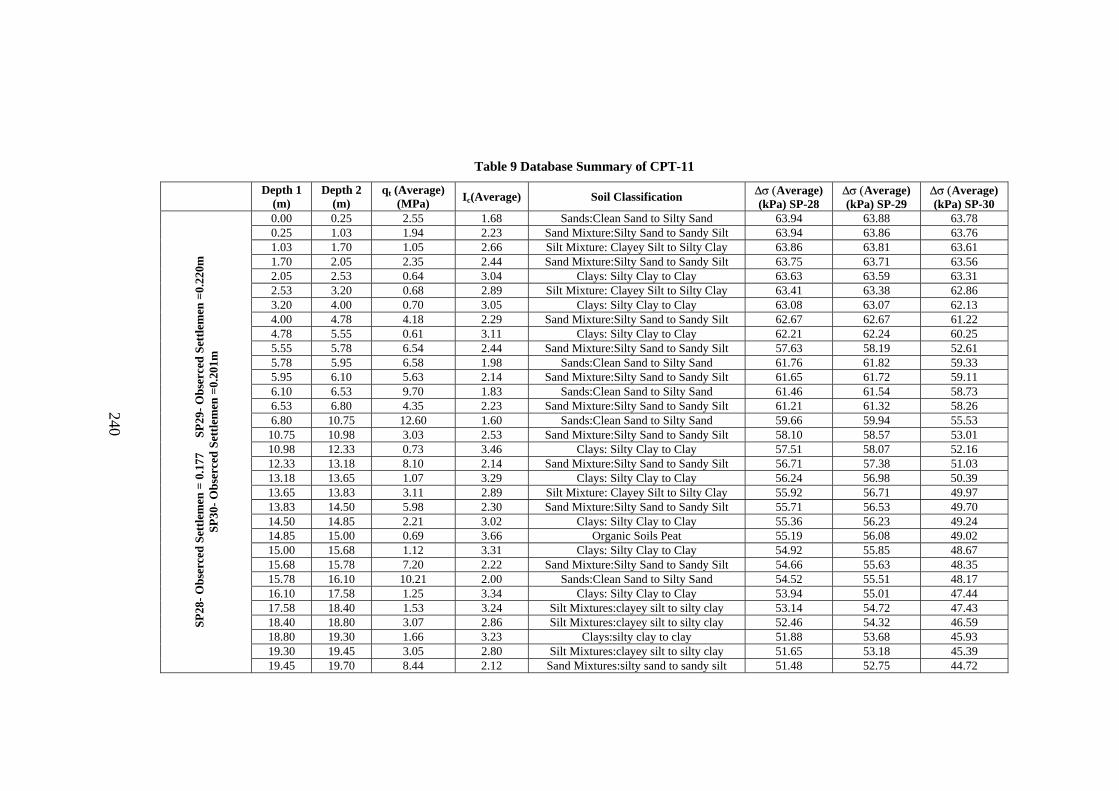
240
Table 9 Database Summary of CPT-11
Depth 1 (m)
Depth 2 (m)
qt (Average) (MPa) Ic(Average) Soil Classification ∆σ (Average)
(kPa) SP-28 ∆σ (Average) (kPa) SP-29
∆σ (Average) (kPa) SP-30
0.00 0.25 2.55 1.68 Sands:Clean Sand to Silty Sand 63.94 63.88 63.78 0.25 1.03 1.94 2.23 Sand Mixture:Silty Sand to Sandy Silt 63.94 63.86 63.76 1.03 1.70 1.05 2.66 Silt Mixture: Clayey Silt to Silty Clay 63.86 63.81 63.61 1.70 2.05 2.35 2.44 Sand Mixture:Silty Sand to Sandy Silt 63.75 63.71 63.56 2.05 2.53 0.64 3.04 Clays: Silty Clay to Clay 63.63 63.59 63.31 2.53 3.20 0.68 2.89 Silt Mixture: Clayey Silt to Silty Clay 63.41 63.38 62.86 3.20 4.00 0.70 3.05 Clays: Silty Clay to Clay 63.08 63.07 62.13 4.00 4.78 4.18 2.29 Sand Mixture:Silty Sand to Sandy Silt 62.67 62.67 61.22 4.78 5.55 0.61 3.11 Clays: Silty Clay to Clay 62.21 62.24 60.25 5.55 5.78 6.54 2.44 Sand Mixture:Silty Sand to Sandy Silt 57.63 58.19 52.61 5.78 5.95 6.58 1.98 Sands:Clean Sand to Silty Sand 61.76 61.82 59.33 5.95 6.10 5.63 2.14 Sand Mixture:Silty Sand to Sandy Silt 61.65 61.72 59.11 6.10 6.53 9.70 1.83 Sands:Clean Sand to Silty Sand 61.46 61.54 58.73 6.53 6.80 4.35 2.23 Sand Mixture:Silty Sand to Sandy Silt 61.21 61.32 58.26 6.80 10.75 12.60 1.60 Sands:Clean Sand to Silty Sand 59.66 59.94 55.53 10.75 10.98 3.03 2.53 Sand Mixture:Silty Sand to Sandy Silt 58.10 58.57 53.01 10.98 12.33 0.73 3.46 Clays: Silty Clay to Clay 57.51 58.07 52.16 12.33 13.18 8.10 2.14 Sand Mixture:Silty Sand to Sandy Silt 56.71 57.38 51.03 13.18 13.65 1.07 3.29 Clays: Silty Clay to Clay 56.24 56.98 50.39 13.65 13.83 3.11 2.89 Silt Mixture: Clayey Silt to Silty Clay 55.92 56.71 49.97 13.83 14.50 5.98 2.30 Sand Mixture:Silty Sand to Sandy Silt 55.71 56.53 49.70 14.50 14.85 2.21 3.02 Clays: Silty Clay to Clay 55.36 56.23 49.24 14.85 15.00 0.69 3.66 Organic Soils Peat 55.19 56.08 49.02 15.00 15.68 1.12 3.31 Clays: Silty Clay to Clay 54.92 55.85 48.67 15.68 15.78 7.20 2.22 Sand Mixture:Silty Sand to Sandy Silt 54.66 55.63 48.35 15.78 16.10 10.21 2.00 Sands:Clean Sand to Silty Sand 54.52 55.51 48.17 16.10 17.58 1.25 3.34 Clays: Silty Clay to Clay 53.94 55.01 47.44 17.58 18.40 1.53 3.24 Silt Mixtures:clayey silt to silty clay 53.14 54.72 47.43 18.40 18.80 3.07 2.86 Silt Mixtures:clayey silt to silty clay 52.46 54.32 46.59 18.80 19.30 1.66 3.23 Clays:silty clay to clay 51.88 53.68 45.93 19.30 19.45 3.05 2.80 Silt Mixtures:clayey silt to silty clay 51.65 53.18 45.39
SP28
- Obs
erce
d Se
ttle
men
= 0
.177
S
P29-
Obs
erce
d Se
ttle
men
=0.
220m
SP
30- O
bser
ced
Sett
lem
en =
0.20
1m
19.45 19.70 8.44 2.12 Sand Mixtures:silty sand to sandy silt 51.48 52.75 44.72
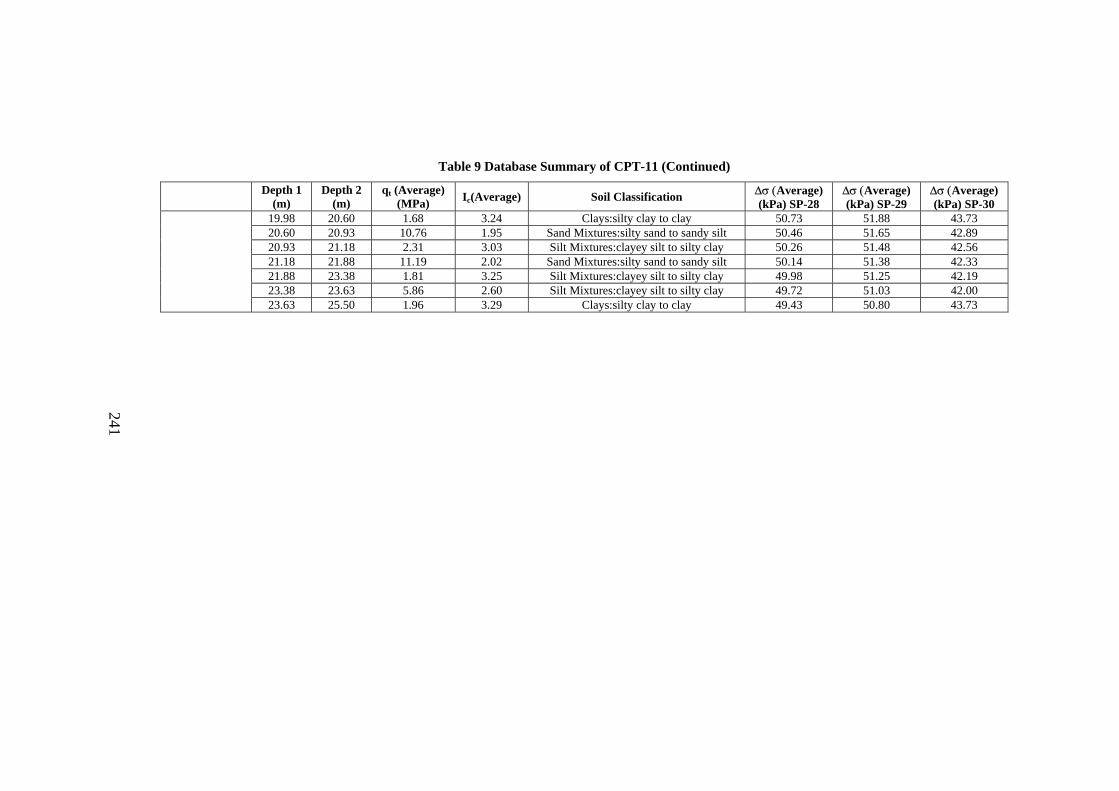
241
Table 9 Database Summary of CPT-11 (Continued)
Depth 1 (m)
Depth 2 (m)
qt (Average) (MPa) Ic(Average) Soil Classification ∆σ (Average)
(kPa) SP-28 ∆σ (Average) (kPa) SP-29
∆σ (Average) (kPa) SP-30
19.98 20.60 1.68 3.24 Clays:silty clay to clay 50.73 51.88 43.73 20.60 20.93 10.76 1.95 Sand Mixtures:silty sand to sandy silt 50.46 51.65 42.89 20.93 21.18 2.31 3.03 Silt Mixtures:clayey silt to silty clay 50.26 51.48 42.56 21.18 21.88 11.19 2.02 Sand Mixtures:silty sand to sandy silt 50.14 51.38 42.33 21.88 23.38 1.81 3.25 Silt Mixtures:clayey silt to silty clay 49.98 51.25 42.19 23.38 23.63 5.86 2.60 Silt Mixtures:clayey silt to silty clay 49.72 51.03 42.00
23.63 25.50 1.96 3.29 Clays:silty clay to clay 49.43 50.80 43.73

242
Table 10 Database Summary of CPT-12
Depth 1 (m)
Depth 2 (m)
qt (Average) (MPa) Ic(Average) Soil Classification ∆σ (Average)
(kPa) SP-37 ∆σ (Average) (kPa) SP-38
∆σ (Average) (kPa) SP-39
0.00 0.53 4.30 1.67 Sands:Clean Sand to Silty Sand 63.90 63.87 63.91 0.53 0.93 1.73 2.32 Sand Mixture:Silty Sand to Sandy Silt 63.87 63.87 63.76 0.93 1.15 0.69 2.76 Silt Mixture: Clayey Silt to Silty Clay 63.85 63.86 63.66 1.15 3.90 0.53 3.13 Clays: Silty Clay to Clay 63.74 63.87 63.30 3.90 4.43 2.76 2.41 Sand Mixture:Silty Sand to Sandy Silt 63.55 63.85 62.91 4.43 6.33 0.58 3.24 Clays: Silty Clay to Clay 63.33 63.84 62.57 6.33 6.50 0.80 2.87 Silt Mixture: Clayey Silt to Silty Clay 63.09 63.83 62.24 6.50 6.95 3.60 2.22 Sand Mixture:Silty Sand to Sandy Silt 63.01 63.81 62.13 6.95 7.18 1.28 2.81 Silt Mixture: Clayey Silt to Silty Clay 62.92 63.75 62.01 7.18 8.28 9.36 1.82 Sands:Clean Sand to Silty Sand 62.71 63.62 61.74 8.28 8.40 5.12 2.28 Sand Mixture:Silty Sand to Sandy Silt 62.51 63.35 61.48 8.40 8.53 1.78 2.85 Silt Mixture: Clayey Silt to Silty Clay 62.47 63.06 61.42 8.53 8.68 4.53 2.24 Sand Mixture:Silty Sand to Sandy Silt 62.42 62.99 61.36 8.68 11.20 13.77 1.77 Sands:Clean Sand to Silty Sand 61.92 62.87 60.71 12.40 12.80 1.90 2.80 Silt Mixtures:clayey silt to silty clay 60.76 62.85 60.38 12.80 13.53 6.52 2.20 Sand Mixtures:silty sand to sandy silt 60.19 62.52 60.21 13.53 14.60 18.15 1.59 Sands:clean sand to silty sand 59.81 62.19 59.81 14.60 15.00 1.89 2.96 Silt Mixtures:clayey silt to silty clay 59.57 62.05 59.08 15.00 15.88 13.79 1.72 Sand Mixtures:silty sand to sandy silt 59.17 61.94 58.60 15.88 16.60 6.89 2.31 Sand Mixtures:silty sand to sandy silt 58.84 61.88 58.28 16.60 18.40 1.53 3.24 Silt Mixtures:clayey silt to silty clay 58.55 61.79 57.78 18.40 18.80 3.07 2.86 Silt Mixtures:clayey silt to silty clay 58.19 61.63 57.36 18.80 19.30 1.66 3.23 Clays:silty clay to clay 57.62 61.46 57.00 19.30 19.45 3.05 2.80 Silt Mixtures:clayey silt to silty clay 57.13 61.36 56.55 19.45 19.70 8.44 2.12 Sand Mixtures:silty sand to sandy silt 56.92 61.17 55.85 19.70 19.98 4.04 2.81 Silt Mixtures:clayey silt to silty clay 56.78 60.75 55.23 19.98 20.60 1.68 3.24 Clays:silty clay to clay 56.68 60.40 54.98 20.60 21.18 2.31 3.03 Silt Mixtures:clayey silt to silty clay 56.56 59.97 54.80 21.18 21.88 11.19 2.02 Sand Mixtures:silty sand to sandy silt 56.36 59.17 54.69 21.88 23.38 1.81 3.25 Silt Mixtures:clayey silt to silty clay 56.14 58.84 54.54 23.38 23.63 5.86 2.60 Silt Mixtures:clayey silt to silty clay 56.01 58.55 54.28
SP37
- Obs
erce
d Se
ttle
men
= 0
.161
S
P38-
Obs
erce
d Se
ttle
men
=0.
178m
SP
39- O
bser
ced
Sett
lem
en =
0.18
2m
23.63 25.50 1.96 3.29 Clays:silty clay to clay 55.78 58.19 54.01

243
Table 10 Database Summary of CPT-12 (Continued)
Depth 1 (m)
Depth 2 (m)
qt (Average) (MPa) Ic(Average) Soil Classification ∆σ (Average)
(kPa) SP-40 ∆σ (Average) (kPa) SP-54
0.00 0.53 4.30 1.67 Sands:Clean Sand to Silty Sand 63.86 63.80 0.53 0.93 1.73 2.32 Sand Mixture:Silty Sand to Sandy Silt 63.77 63.50 0.93 1.15 0.69 2.76 Silt Mixture: Clayey Silt to Silty Clay 63.69 63.32 1.15 3.90 0.53 3.13 Clays: Silty Clay to Clay 63.19 62.46 3.90 4.43 2.76 2.41 Sand Mixture:Silty Sand to Sandy Silt 62.47 61.48 4.43 6.33 0.58 3.24 Clays: Silty Clay to Clay 61.81 60.70 6.33 6.50 0.80 2.87 Silt Mixture: Clayey Silt to Silty Clay 61.22 60.00 6.50 6.95 3.60 2.22 Sand Mixture:Silty Sand to Sandy Silt 61.03 59.79 6.95 7.18 1.28 2.81 Silt Mixture: Clayey Silt to Silty Clay 60.82 59.54 7.18 8.28 9.36 1.82 Sands:Clean Sand to Silty Sand 60.40 59.06 8.28 8.40 5.12 2.28 Sand Mixture:Silty Sand to Sandy Silt 60.02 58.61 8.40 8.53 1.78 2.85 Silt Mixture: Clayey Silt to Silty Clay 59.94 58.52 8.53 8.68 4.53 2.24 Sand Mixture:Silty Sand to Sandy Silt 59.85 58.41 8.68 11.20 13.77 1.77 Sands:Clean Sand to Silty Sand 58.99 57.40 12.40 12.80 1.90 2.80 Silt Mixtures:clayey silt to silty clay 58.14 57.36 12.80 13.53 6.52 2.20 Sand Mixtures:silty sand to sandy silt 57.62 57.00 13.53 14.60 18.15 1.59 Sands:clean sand to silty sand 56.74 56.55 14.60 15.00 1.89 2.96 Silt Mixtures:clayey silt to silty clay 56.19 55.85 15.00 15.88 13.79 1.72 Sand Mixtures:silty sand to sandy silt 55.85 55.23 15.88 16.60 6.89 2.31 Sand Mixtures:silty sand to sandy silt 55.30 54.98 16.60 18.40 1.53 3.24 Silt Mixtures:clayey silt to silty clay 54.86 54.80 18.40 18.80 3.07 2.86 Silt Mixtures:clayey silt to silty clay 54.48 54.69 18.80 19.30 1.66 3.23 Clays:silty clay to clay 54.02 54.54 19.30 19.45 3.05 2.80 Silt Mixtures:clayey silt to silty clay 53.30 54.28 19.45 19.70 8.44 2.12 Sand Mixtures:silty sand to sandy silt 52.69 54.01 19.70 19.98 4.04 2.81 Silt Mixtures:clayey silt to silty clay 52.44 53.85 19.98 20.60 1.68 3.24 Clays:silty clay to clay 52.26 53.57 20.60 21.18 2.31 3.03 Silt Mixtures:clayey silt to silty clay 52.15 52.91 21.18 21.88 11.19 2.02 Sand Mixtures:silty sand to sandy silt 52.01 52.38 21.88 23.38 1.81 3.25 Silt Mixtures:clayey silt to silty clay 51.76 51.71 23.38 23.63 5.86 2.60 Silt Mixtures:clayey silt to silty clay 51.49 51.39
SP40
- Obs
erce
d Se
ttle
men
= 0
.153
S
P54-
Obs
erce
d Se
ttle
men
=0.
180m
23.63 25.50 1.96 3.29 Clays:silty clay to clay 51.34 51.14

244
Table 11 Database Summary of CPT-12a
Depth 1 (m)
Depth 2 (m)
qt (Average) (MPa) Ic(Average) Soil Classification ∆σ (Average)
(kPa) SP-37 ∆σ (Average) (kPa) SP-39
∆σ (Average) (kPa) SP-40
∆σ (Average) (kPa) SP-54
0.00 0.55 3.35 1.71 Sands:Clean Sand to Silty Sand 63.70 63.91 63.76 63.89 0.55 0.80 1.62 2.39 Sand Mixture:Silty Sand to Sandy Silt 63.64 63.77 63.55 63.64 0.80 1.63 0.68 2.78 Silt Mixture: Clayey Silt to Silty Clay 63.29 63.61 62.27 63.31 1.63 1.78 1.21 2.89 Silt Mixture: Clayey Silt to Silty Clay 63.60 62.86 63.35 61.50 1.78 1.93 0.76 2.87 Silt Mixture: Clayey Silt to Silty Clay 63.59 63.45 63.30 62.94 1.93 2.10 0.63 3.07 Clays: Silty Clay to Clay 63.57 63.41 63.24 62.85 2.10 2.28 0.75 2.91 Silt Mixture: Clayey Silt to Silty Clay 63.55 63.37 63.13 62.75 2.28 2.65 0.65 3.03 Clays: Silty Clay to Clay 63.50 63.31 62.93 62.59 2.65 3.23 0.75 2.79 Silt Mixture: Clayey Silt to Silty Clay 63.43 63.20 62.65 62.30 3.23 3.95 0.64 3.11 Clays: Silty Clay to Clay 63.35 63.05 62.35 61.93 3.95 4.45 3.27 2.34 Sand Mixture:Silty Sand to Sandy Silt 63.24 62.90 62.01 61.56 4.45 5.25 0.59 3.16 Clays: Silty Clay to Clay 63.15 62.73 61.76 61.15 5.25 5.38 0.63 2.79 Silt Mixture: Clayey Silt to Silty Clay 63.12 62.60 61.69 60.85 5.38 5.50 0.60 3.07 Clays: Silty Clay to Clay 63.10 62.56 61.62 60.77 5.50 5.60 0.69 2.93 Silt Mixture: Clayey Silt to Silty Clay 63.07 62.53 61.54 60.69 5.60 5.80 0.62 3.22 Clays: Silty Clay to Clay 63.02 62.48 61.42 60.59 5.80 6.00 0.89 2.80 Silt Mixture: Clayey Silt to Silty Clay 62.95 62.42 61.26 60.46 6.00 6.35 0.82 3.05 Clays: Silty Clay to Clay 62.88 62.33 61.09 60.27 6.35 6.55 0.80 2.76 Silt Mixture: Clayey Silt to Silty Clay 62.48 62.23 60.25 60.08 6.55 9.05 9.81 1.80 Sands:Clean Sand to Silty Sand 62.01 61.70 59.36 59.10 9.05 9.35 0.62 3.31 Clays: Silty Clay to Clay 61.90 61.08 59.18 58.06 9.35 9.63 7.87 1.83 Sands:Clean Sand to Silty Sand 61.77 60.94 58.96 57.84 9.63 10.03 2.15 2.83 Silt Mixture: Clayey Silt to Silty Clay 61.66 60.78 58.78 57.59
10.03 10.18 4.20 2.31 Sand Mixture:Silty Sand to Sandy Silt 61.59 60.64 58.67 57.38 10.18 10.38 1.29 3.16 Clays: Silty Clay to Clay 61.40 60.55 58.36 57.24 10.38 11.40 10.46 1.71 Sands:Clean Sand to Silty Sand 61.19 60.30 58.04 56.88 11.40 11.73 2.05 2.91 Silt Mixture: Clayey Silt to Silty Clay 61.06 59.87 57.85 56.27 11.73 12.50 5.28 2.38 Sand Mixture:Silty Sand to Sandy Silt 60.83 59.57 57.50 55.86 12.50 13.10 13.83 1.84 Sands:Clean Sand to Silty Sand 60.53 59.18 57.07 55.36 13.10 13.25 2.09 3.03 Clays: Silty Clay to Clay 60.36 58.97 56.84 55.10 13.25 14.00 11.35 1.85 Sands:Clean Sand to Silty Sand 60.16 58.72 56.56 54.78
SP37
- Obs
erce
d Se
ttle
men
=0.
161m
S
P39-
Obs
erce
d Se
ttle
men
=0.
182m
SP
40- O
bser
ced
Sett
lem
en =
0.53
m
SP5
4- O
bser
ced
Sett
lem
en =
0..1
80m
14.00 14.18 2.84 2.72 Silt Mixture: Clayey Silt to Silty Clay 59.96 58.46 56.28 54.46

245
Table 11 Database Summary of CPT-12a (Continued)
Depth 1 (m)
Depth 2 (m)
qt (Average) (MPa) Ic(Average) Soil Classification ∆σ (Average)
(kPa) SP-37 ∆σ (Average) (kPa) SP-39
∆σ (Average) (kPa) SP-40
∆σ (Average) (kPa) SP-54
14.18 15.30 58.09 54.03 Clays: Silty Clay to Clay 59.67 58.09 55.89 54.03 15.30 16.08 57.56 53.42 Sands:Clean Sand to Silty Sand 59.24 57.56 55.34 53.42 16.08 17.38 56.98 52.79 Clays: Silty Clay to Clay 58.77 56.98 54.74 52.79 17.38 17.75 56.51 52.30 Silt Mixture: Clayey Silt to Silty Clay 58.40 56.51 54.27 52.30 17.75 17.85 56.38 52.17 Sand Mixture:Silty Sand to Sandy Silt 58.29 56.38 54.14 52.17 17.85 18.28 56.23 52.02 Sand Mixture:Silty Sand to Sandy Silt 58.17 56.23 53.99 52.02 18.40 18.80 3.07 2.86 Silt Mixtures:clayey silt to silty clay 58.19 57.36 54.48 54.69 18.80 19.30 1.66 3.23 Clays:silty clay to clay 57.62 57.00 54.02 54.54 19.30 19.45 3.05 2.80 Silt Mixtures:clayey silt to silty clay 57.13 56.55 53.30 54.28 19.45 19.70 8.44 2.12 Sand Mixtures:silty sand to sandy silt 56.92 55.85 52.69 54.01 19.70 19.98 4.04 2.81 Silt Mixtures:clayey silt to silty clay 56.78 55.23 52.44 53.85 19.98 20.60 1.68 3.24 Clays:silty clay to clay 56.68 54.98 52.26 53.57 20.60 21.18 2.31 3.03 Silt Mixtures:clayey silt to silty clay 56.56 54.80 52.15 52.91 21.18 21.88 11.19 2.02 Sand Mixtures:silty sand to sandy silt 56.36 54.69 52.01 52.38 21.88 23.38 1.81 3.25 Silt Mixtures:clayey silt to silty clay 56.14 54.54 51.76 51.71 23.38 23.63 5.86 2.60 Silt Mixtures:clayey silt to silty clay 56.01 54.28 51.49 51.39
23.63 25.50 1.96 3.29 Clays:silty clay to clay 55.78 54.01 51.34 51.14
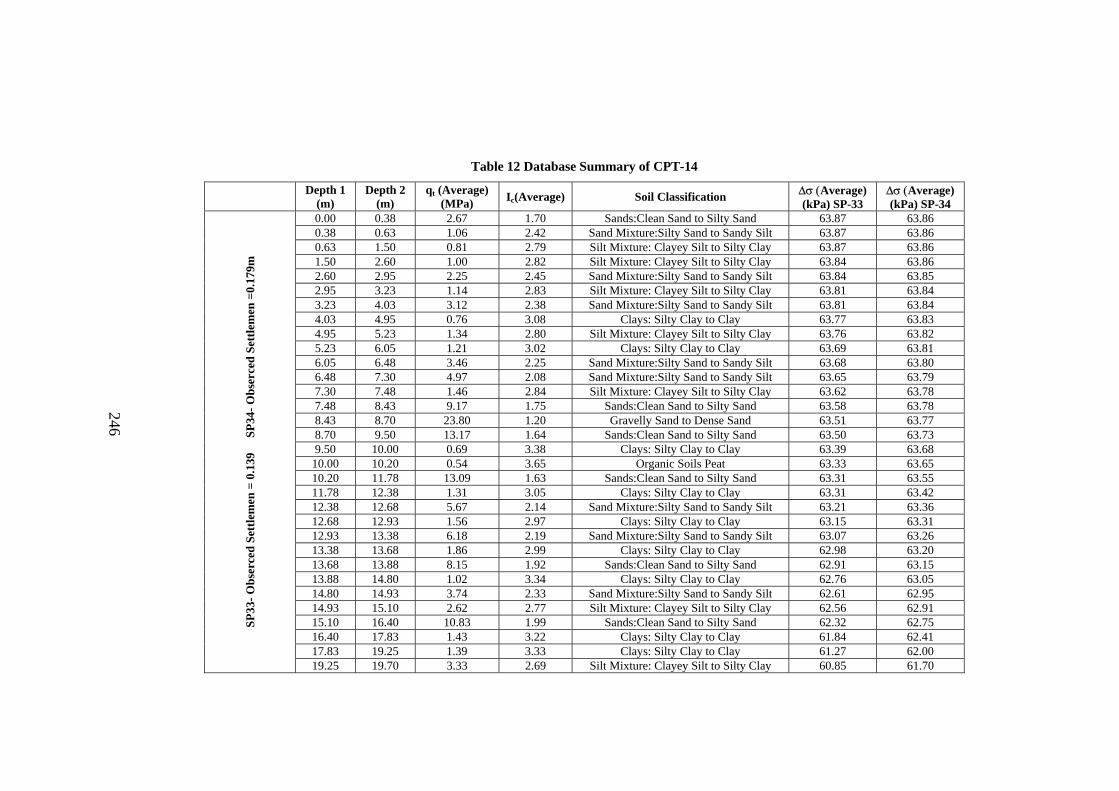
246
Table 12 Database Summary of CPT-14
Depth 1 (m)
Depth 2 (m)
qt (Average) (MPa) Ic(Average) Soil Classification ∆σ (Average)
(kPa) SP-33 ∆σ (Average) (kPa) SP-34
0.00 0.38 2.67 1.70 Sands:Clean Sand to Silty Sand 63.87 63.86 0.38 0.63 1.06 2.42 Sand Mixture:Silty Sand to Sandy Silt 63.87 63.86 0.63 1.50 0.81 2.79 Silt Mixture: Clayey Silt to Silty Clay 63.87 63.86 1.50 2.60 1.00 2.82 Silt Mixture: Clayey Silt to Silty Clay 63.84 63.86 2.60 2.95 2.25 2.45 Sand Mixture:Silty Sand to Sandy Silt 63.84 63.85 2.95 3.23 1.14 2.83 Silt Mixture: Clayey Silt to Silty Clay 63.81 63.84 3.23 4.03 3.12 2.38 Sand Mixture:Silty Sand to Sandy Silt 63.81 63.84 4.03 4.95 0.76 3.08 Clays: Silty Clay to Clay 63.77 63.83 4.95 5.23 1.34 2.80 Silt Mixture: Clayey Silt to Silty Clay 63.76 63.82 5.23 6.05 1.21 3.02 Clays: Silty Clay to Clay 63.69 63.81 6.05 6.48 3.46 2.25 Sand Mixture:Silty Sand to Sandy Silt 63.68 63.80 6.48 7.30 4.97 2.08 Sand Mixture:Silty Sand to Sandy Silt 63.65 63.79 7.30 7.48 1.46 2.84 Silt Mixture: Clayey Silt to Silty Clay 63.62 63.78 7.48 8.43 9.17 1.75 Sands:Clean Sand to Silty Sand 63.58 63.78 8.43 8.70 23.80 1.20 Gravelly Sand to Dense Sand 63.51 63.77 8.70 9.50 13.17 1.64 Sands:Clean Sand to Silty Sand 63.50 63.73 9.50 10.00 0.69 3.38 Clays: Silty Clay to Clay 63.39 63.68 10.00 10.20 0.54 3.65 Organic Soils Peat 63.33 63.65 10.20 11.78 13.09 1.63 Sands:Clean Sand to Silty Sand 63.31 63.55 11.78 12.38 1.31 3.05 Clays: Silty Clay to Clay 63.31 63.42 12.38 12.68 5.67 2.14 Sand Mixture:Silty Sand to Sandy Silt 63.21 63.36 12.68 12.93 1.56 2.97 Clays: Silty Clay to Clay 63.15 63.31 12.93 13.38 6.18 2.19 Sand Mixture:Silty Sand to Sandy Silt 63.07 63.26 13.38 13.68 1.86 2.99 Clays: Silty Clay to Clay 62.98 63.20 13.68 13.88 8.15 1.92 Sands:Clean Sand to Silty Sand 62.91 63.15 13.88 14.80 1.02 3.34 Clays: Silty Clay to Clay 62.76 63.05 14.80 14.93 3.74 2.33 Sand Mixture:Silty Sand to Sandy Silt 62.61 62.95 14.93 15.10 2.62 2.77 Silt Mixture: Clayey Silt to Silty Clay 62.56 62.91 15.10 16.40 10.83 1.99 Sands:Clean Sand to Silty Sand 62.32 62.75 16.40 17.83 1.43 3.22 Clays: Silty Clay to Clay 61.84 62.41 17.83 19.25 1.39 3.33 Clays: Silty Clay to Clay 61.27 62.00
SP33
- Obs
erce
d Se
ttle
men
= 0
.139
S
P34-
Obs
erce
d Se
ttle
men
=0.
179m
19.25 19.70 3.33 2.69 Silt Mixture: Clayey Silt to Silty Clay 60.85 61.70
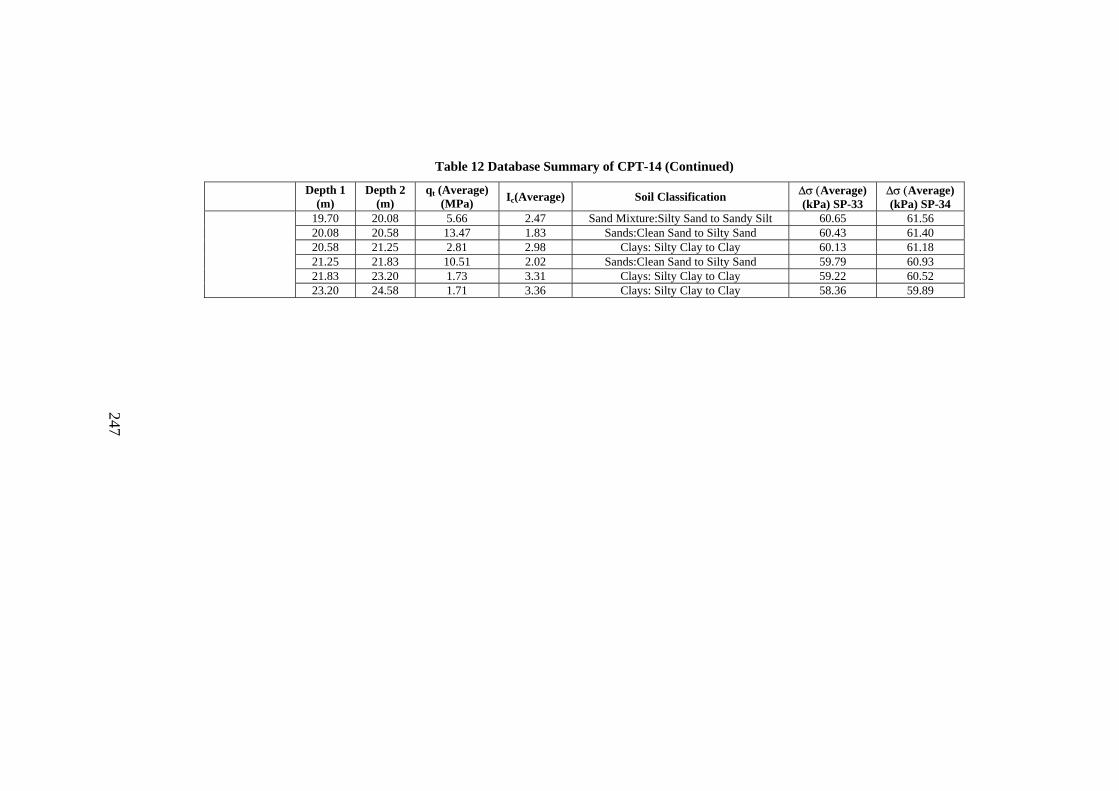
247
Table 12 Database Summary of CPT-14 (Continued)
Depth 1 (m)
Depth 2 (m)
qt (Average) (MPa) Ic(Average) Soil Classification ∆σ (Average)
(kPa) SP-33 ∆σ (Average) (kPa) SP-34
19.70 20.08 5.66 2.47 Sand Mixture:Silty Sand to Sandy Silt 60.65 61.56 20.08 20.58 13.47 1.83 Sands:Clean Sand to Silty Sand 60.43 61.40 20.58 21.25 2.81 2.98 Clays: Silty Clay to Clay 60.13 61.18 21.25 21.83 10.51 2.02 Sands:Clean Sand to Silty Sand 59.79 60.93 21.83 23.20 1.73 3.31 Clays: Silty Clay to Clay 59.22 60.52
23.20 24.58 1.71 3.36 Clays: Silty Clay to Clay 58.36 59.89
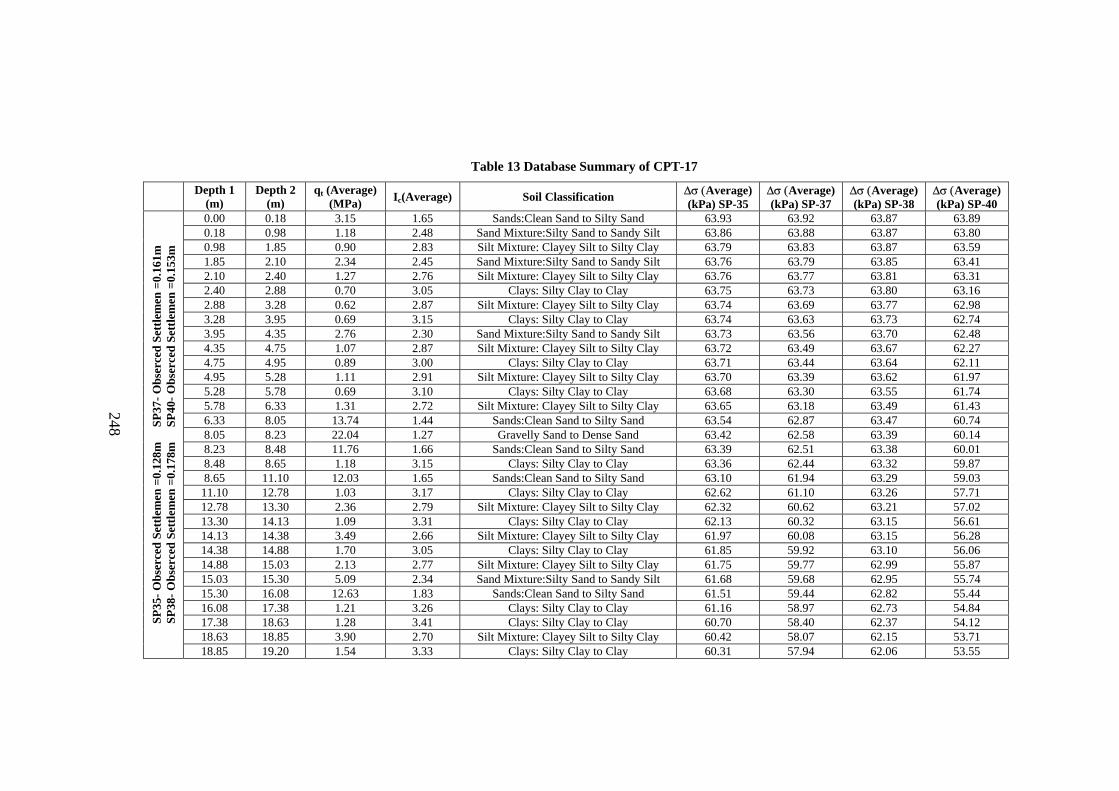
248
Table 13 Database Summary of CPT-17
Depth 1 (m)
Depth 2 (m)
qt (Average) (MPa) Ic(Average) Soil Classification ∆σ (Average)
(kPa) SP-35 ∆σ (Average) (kPa) SP-37
∆σ (Average) (kPa) SP-38
∆σ (Average) (kPa) SP-40
0.00 0.18 3.15 1.65 Sands:Clean Sand to Silty Sand 63.93 63.92 63.87 63.89 0.18 0.98 1.18 2.48 Sand Mixture:Silty Sand to Sandy Silt 63.86 63.88 63.87 63.80 0.98 1.85 0.90 2.83 Silt Mixture: Clayey Silt to Silty Clay 63.79 63.83 63.87 63.59 1.85 2.10 2.34 2.45 Sand Mixture:Silty Sand to Sandy Silt 63.76 63.79 63.85 63.41 2.10 2.40 1.27 2.76 Silt Mixture: Clayey Silt to Silty Clay 63.76 63.77 63.81 63.31 2.40 2.88 0.70 3.05 Clays: Silty Clay to Clay 63.75 63.73 63.80 63.16 2.88 3.28 0.62 2.87 Silt Mixture: Clayey Silt to Silty Clay 63.74 63.69 63.77 62.98 3.28 3.95 0.69 3.15 Clays: Silty Clay to Clay 63.74 63.63 63.73 62.74 3.95 4.35 2.76 2.30 Sand Mixture:Silty Sand to Sandy Silt 63.73 63.56 63.70 62.48 4.35 4.75 1.07 2.87 Silt Mixture: Clayey Silt to Silty Clay 63.72 63.49 63.67 62.27 4.75 4.95 0.89 3.00 Clays: Silty Clay to Clay 63.71 63.44 63.64 62.11 4.95 5.28 1.11 2.91 Silt Mixture: Clayey Silt to Silty Clay 63.70 63.39 63.62 61.97 5.28 5.78 0.69 3.10 Clays: Silty Clay to Clay 63.68 63.30 63.55 61.74 5.78 6.33 1.31 2.72 Silt Mixture: Clayey Silt to Silty Clay 63.65 63.18 63.49 61.43 6.33 8.05 13.74 1.44 Sands:Clean Sand to Silty Sand 63.54 62.87 63.47 60.74 8.05 8.23 22.04 1.27 Gravelly Sand to Dense Sand 63.42 62.58 63.39 60.14 8.23 8.48 11.76 1.66 Sands:Clean Sand to Silty Sand 63.39 62.51 63.38 60.01 8.48 8.65 1.18 3.15 Clays: Silty Clay to Clay 63.36 62.44 63.32 59.87 8.65 11.10 12.03 1.65 Sands:Clean Sand to Silty Sand 63.10 61.94 63.29 59.03 11.10 12.78 1.03 3.17 Clays: Silty Clay to Clay 62.62 61.10 63.26 57.71 12.78 13.30 2.36 2.79 Silt Mixture: Clayey Silt to Silty Clay 62.32 60.62 63.21 57.02 13.30 14.13 1.09 3.31 Clays: Silty Clay to Clay 62.13 60.32 63.15 56.61 14.13 14.38 3.49 2.66 Silt Mixture: Clayey Silt to Silty Clay 61.97 60.08 63.15 56.28 14.38 14.88 1.70 3.05 Clays: Silty Clay to Clay 61.85 59.92 63.10 56.06 14.88 15.03 2.13 2.77 Silt Mixture: Clayey Silt to Silty Clay 61.75 59.77 62.99 55.87 15.03 15.30 5.09 2.34 Sand Mixture:Silty Sand to Sandy Silt 61.68 59.68 62.95 55.74 15.30 16.08 12.63 1.83 Sands:Clean Sand to Silty Sand 61.51 59.44 62.82 55.44 16.08 17.38 1.21 3.26 Clays: Silty Clay to Clay 61.16 58.97 62.73 54.84 17.38 18.63 1.28 3.41 Clays: Silty Clay to Clay 60.70 58.40 62.37 54.12 18.63 18.85 3.90 2.70 Silt Mixture: Clayey Silt to Silty Clay 60.42 58.07 62.15 53.71
SP35
- Obs
erce
d Se
ttle
men
=0.
128m
S
P37-
Obs
erce
d Se
ttle
men
=0.
161m
SP
38- O
bser
ced
Sett
lem
en =
0.17
8m
SP4
0- O
bser
ced
Sett
lem
en =
0.15
3m
18.85 19.20 1.54 3.33 Clays: Silty Clay to Clay 60.31 57.94 62.06 53.55

249
Table 13 Database Summary of CPT-17 (Continued)
Depth 1 (m)
Depth 2 (m)
qt (Average) (MPa) Ic(Average) Soil Classification ∆σ (Average)
(kPa) SP-35 ∆σ (Average) (kPa) SP-37
∆σ (Average) (kPa) SP-38
∆σ (Average) (kPa) SP-40
19.35 21.10 1.68 3.28 Clays: Silty Clay to Clay 59.81 57.38 61.65 52.89 21.10 21.63 8.82 2.31 Sand Mixture:Silty Sand to Sandy Silt 59.30 56.85 61.24 52.26 21.63 22.10 2.92 3.13 Clays: Silty Clay to Clay 59.06 56.62 61.05 51.98 22.10 23.38 1.81 3.25 Silt Mixtures:clayey silt to silty clay 58.97 56.14 60.62 51.76 23.38 23.63 5.86 2.60 Silt Mixtures:clayey silt to silty clay 58.40 56.01 60.32 51.49
23.63 25.50 1.96 3.29 Clays:silty clay to clay 58.07 55.78 60.08 51.34

250
Table 15 Database Summary of CPT-18
Depth 1 (m)
Depth 2 (m)
qt (Average) (MPa) Ic(Average) Soil Classification ∆σ (Average)
(kPa) SP-35 ∆σ (Average) (kPa) SP-36
0.00 0.43 2.80 1.66 Sands:Clean Sand to Silty Sand 63.76 63.86 0.43 0.80 1.39 2.41 Sand Mixture:Silty Sand to Sandy Silt 63.71 63.86 0.80 1.73 0.89 2.72 Silt Mixture: Clayey Silt to Silty Clay 63.65 63.85 1.73 1.93 0.74 2.99 Clays: Silty Clay to Clay 63.62 63.85 1.93 2.28 0.99 2.79 Silt Mixture: Clayey Silt to Silty Clay 63.61 63.82 2.28 2.68 0.70 3.02 Clays: Silty Clay to Clay 63.60 63.80 2.68 3.20 0.70 2.83 Silt Mixture: Clayey Silt to Silty Clay 63.60 63.80 3.20 4.05 0.74 3.10 Clays: Silty Clay to Clay 63.59 63.78 4.05 4.65 3.72 2.16 Sand Mixture:Silty Sand to Sandy Silt 63.58 63.77 4.65 5.08 0.80 2.90 Silt Mixture: Clayey Silt to Silty Clay 63.56 63.74 5.08 6.15 0.71 3.08 Clays: Silty Clay to Clay 63.53 63.74 6.15 7.13 11.01 1.69 Sands:Clean Sand to Silty Sand 63.45 63.71 7.13 7.83 21.40 1.29 Gravelly Sand to Dense Sand 63.36 63.69 7.83 8.70 11.16 1.59 Sands:clean sand to silty sand 63.12 63.16 8.70 8.95 0.92 3.11 Silt Mixtures:clayey silt to silty clay 63.08 63.15 8.95 9.45 11.90 1.55 Sand Mixtures:silty sand to sandy silt 63.07 63.14 9.45 9.65 23.26 1.22 Gravelly sand to dense sand 63.06 63.13 9.65 11.05 11.93 1.67 Sands:clean sand to silty sand 63.05 63.12 11.05 12.40 14.24 1.69 Sands:clean sand to silty sand 63.04 63.09 12.40 12.80 1.90 2.80 Silt Mixtures:clayey silt to silty clay 63.03 63.09 12.80 13.53 6.52 2.20 Sand Mixtures:silty sand to sandy silt 63.03 63.07 13.53 14.60 18.15 1.59 Sands:clean sand to silty sand 63.02 63.06 14.60 15.00 1.89 2.96 Silt Mixtures:clayey silt to silty clay 62.99 63.02 15.00 15.88 13.79 1.72 Sand Mixtures:silty sand to sandy silt 62.95 63.00 15.88 16.60 6.89 2.31 Sand Mixtures:silty sand to sandy silt 62.88 62.98 16.60 18.40 1.53 3.24 Silt Mixtures:clayey silt to silty clay 62.73 62.90 18.40 18.80 3.07 2.86 Silt Mixtures:clayey silt to silty clay 62.61 62.85 18.80 19.30 1.66 3.23 Clays:silty clay to clay 62.54 62.80 19.30 19.45 3.05 2.80 Silt Mixtures:clayey silt to silty clay 62.48 62.67 19.45 19.70 8.44 2.12 Sand Mixtures:silty sand to sandy silt 62.31 62.41 19.70 19.98 4.04 2.81 Silt Mixtures:clayey silt to silty clay 61.98 62.23
SP35
- Obs
erce
d Se
ttle
men
= 0
.128
S
P34-
Obs
erce
d Se
ttle
men
=0.
169m
19.98 20.60 1.68 3.24 Clays:silty clay to clay 61.75 62.10

251
Table 15 Database Summary of CPT-18 (Continued)
Depth 1 (m)
Depth 2 (m)
qt (Average) (MPa) Ic(Average) Soil Classification ∆σ (Average)
(kPa) SP-35 ∆σ (Average) (kPa) SP-36
20.60 21.18 2.31 3.03 Silt Mixtures:clayey silt to silty clay 61.59 61.89 21.18 21.88 11.19 2.02 Sand Mixtures:silty sand to sandy silt 61.32 61.70 21.88 23.38 1.81 3.25 Silt Mixtures:clayey silt to silty clay 61.10 61.53 23.38 23.63 5.86 2.60 Silt Mixtures:clayey silt to silty clay 60.89 61.31
23.63 25.50 1.96 3.29 Clays:silty clay to clay 60.63 60.94

252
Table 16 Database Summary of CPT-18a
Depth 1 (m)
Depth 2 (m)
qt (Average) (MPa) Ic(Average) Soil Classification ∆σ (Average)
(kPa) SP-35 ∆σ (Average) (kPa) SP-36
0.00 0.25 3.80 1.56 Sands:Clean Sand to Silty Sand 64.07 63.96 0.25 0.73 1.73 2.34 Sand Mixture:Silty Sand to Sandy Silt 64.02 63.96 0.73 2.18 0.86 2.78 Silt Mixture: Clayey Silt to Silty Clay 63.94 63.96 2.18 2.90 0.66 3.06 Clays: Silty Clay to Clay 63.90 63.94 2.90 3.05 0.68 2.82 Silt Mixture: Clayey Silt to Silty Clay 63.90 63.94 3.05 4.03 0.64 3.16 Clays: Silty Clay to Clay 63.89 63.93 4.03 4.55 3.54 2.17 Sand Mixture:Silty Sand to Sandy Silt 63.88 63.92 4.55 4.80 1.15 2.76 Silt Mixture: Clayey Silt to Silty Clay 63.87 63.90 4.80 5.80 0.75 3.15 Clays: Silty Clay to Clay 63.84 63.89 5.80 6.03 1.27 2.73 Silt Mixture: Clayey Silt to Silty Clay 63.81 63.85 6.03 6.18 2.97 2.31 Sand Mixture:Silty Sand to Sandy Silt 63.80 63.80 6.18 7.58 11.73 1.66 Sands:Clean Sand to Silty Sand 63.73 63.79 7.83 8.70 11.16 1.59 Sands:clean sand to silty sand 63.12 63.16 8.70 8.95 0.92 3.11 Silt Mixtures:clayey silt to silty clay 63.08 63.15 8.95 9.45 11.90 1.55 Sand Mixtures:silty sand to sandy silt 63.07 63.14 9.45 9.65 23.26 1.22 Gravelly sand to dense sand 63.06 63.13 9.65 11.05 11.93 1.67 Sands:clean sand to silty sand 63.05 63.12 11.05 12.40 14.24 1.69 Sands:clean sand to silty sand 63.04 63.09 12.40 13.53 6.52 2.20 Sand Mixtures:silty sand to sandy silt 63.03 63.09 13.53 14.60 18.15 1.59 Sands:clean sand to silty sand 63.03 63.07 14.60 15.00 1.89 2.96 Silt Mixtures:clayey silt to silty clay 63.02 63.06 15.00 15.88 13.79 1.72 Sand Mixtures:silty sand to sandy silt 62.99 63.02 15.88 16.60 6.89 2.31 Sand Mixtures:silty sand to sandy silt 62.95 63.00 16.60 18.40 1.53 3.24 Silt Mixtures:clayey silt to silty clay 62.88 62.98 18.40 19.30 1.66 3.23 Clays:silty clay to clay 62.73 62.90 19.30 19.45 3.05 2.80 Silt Mixtures:clayey silt to silty clay 62.61 62.85 19.45 19.70 8.44 2.12 Sand Mixtures:silty sand to sandy silt 62.54 62.80 19.70 19.98 4.04 2.81 Silt Mixtures:clayey silt to silty clay 62.48 62.67 19.98 21.88 1.68 3.24 Clays:silty clay to clay 62.31 62.41 21.88 23.38 1.81 3.25 Silt Mixtures:clayey silt to silty clay 61.98 62.23 23.38 23.63 5.86 2.60 Silt Mixtures:clayey silt to silty clay 61.10 61.53
SP35
- Obs
erce
d Se
ttle
men
= 0
.128
S
P34-
Obs
erce
d Se
ttle
men
=0.
169m
23.63 25.50 1.96 3.29 Clays:silty clay to clay 60.89 61.31
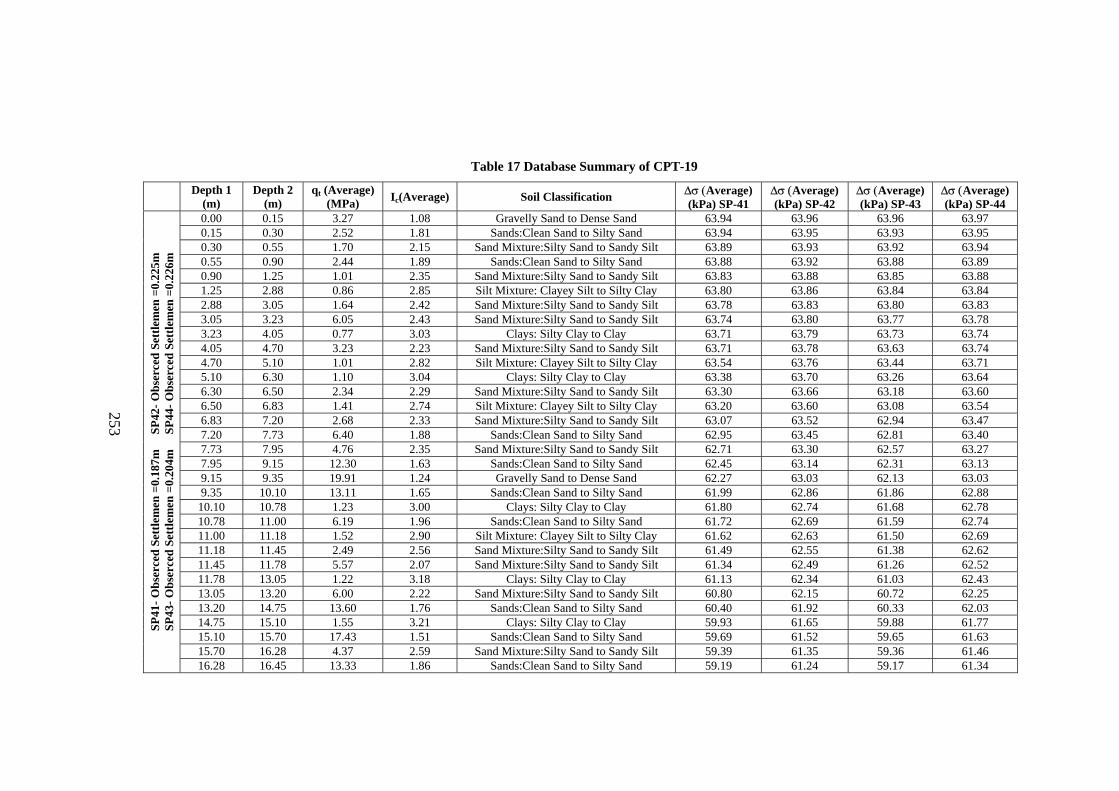
253
Table 17 Database Summary of CPT-19
Depth 1 (m)
Depth 2 (m)
qt (Average) (MPa) Ic(Average) Soil Classification ∆σ (Average)
(kPa) SP-41 ∆σ (Average) (kPa) SP-42
∆σ (Average) (kPa) SP-43
∆σ (Average) (kPa) SP-44
0.00 0.15 3.27 1.08 Gravelly Sand to Dense Sand 63.94 63.96 63.96 63.97 0.15 0.30 2.52 1.81 Sands:Clean Sand to Silty Sand 63.94 63.95 63.93 63.95 0.30 0.55 1.70 2.15 Sand Mixture:Silty Sand to Sandy Silt 63.89 63.93 63.92 63.94 0.55 0.90 2.44 1.89 Sands:Clean Sand to Silty Sand 63.88 63.92 63.88 63.89 0.90 1.25 1.01 2.35 Sand Mixture:Silty Sand to Sandy Silt 63.83 63.88 63.85 63.88 1.25 2.88 0.86 2.85 Silt Mixture: Clayey Silt to Silty Clay 63.80 63.86 63.84 63.84 2.88 3.05 1.64 2.42 Sand Mixture:Silty Sand to Sandy Silt 63.78 63.83 63.80 63.83 3.05 3.23 6.05 2.43 Sand Mixture:Silty Sand to Sandy Silt 63.74 63.80 63.77 63.78 3.23 4.05 0.77 3.03 Clays: Silty Clay to Clay 63.71 63.79 63.73 63.74 4.05 4.70 3.23 2.23 Sand Mixture:Silty Sand to Sandy Silt 63.71 63.78 63.63 63.74 4.70 5.10 1.01 2.82 Silt Mixture: Clayey Silt to Silty Clay 63.54 63.76 63.44 63.71 5.10 6.30 1.10 3.04 Clays: Silty Clay to Clay 63.38 63.70 63.26 63.64 6.30 6.50 2.34 2.29 Sand Mixture:Silty Sand to Sandy Silt 63.30 63.66 63.18 63.60 6.50 6.83 1.41 2.74 Silt Mixture: Clayey Silt to Silty Clay 63.20 63.60 63.08 63.54 6.83 7.20 2.68 2.33 Sand Mixture:Silty Sand to Sandy Silt 63.07 63.52 62.94 63.47 7.20 7.73 6.40 1.88 Sands:Clean Sand to Silty Sand 62.95 63.45 62.81 63.40 7.73 7.95 4.76 2.35 Sand Mixture:Silty Sand to Sandy Silt 62.71 63.30 62.57 63.27 7.95 9.15 12.30 1.63 Sands:Clean Sand to Silty Sand 62.45 63.14 62.31 63.13 9.15 9.35 19.91 1.24 Gravelly Sand to Dense Sand 62.27 63.03 62.13 63.03 9.35 10.10 13.11 1.65 Sands:Clean Sand to Silty Sand 61.99 62.86 61.86 62.88 10.10 10.78 1.23 3.00 Clays: Silty Clay to Clay 61.80 62.74 61.68 62.78 10.78 11.00 6.19 1.96 Sands:Clean Sand to Silty Sand 61.72 62.69 61.59 62.74 11.00 11.18 1.52 2.90 Silt Mixture: Clayey Silt to Silty Clay 61.62 62.63 61.50 62.69 11.18 11.45 2.49 2.56 Sand Mixture:Silty Sand to Sandy Silt 61.49 62.55 61.38 62.62 11.45 11.78 5.57 2.07 Sand Mixture:Silty Sand to Sandy Silt 61.34 62.49 61.26 62.52 11.78 13.05 1.22 3.18 Clays: Silty Clay to Clay 61.13 62.34 61.03 62.43 13.05 13.20 6.00 2.22 Sand Mixture:Silty Sand to Sandy Silt 60.80 62.15 60.72 62.25 13.20 14.75 13.60 1.76 Sands:Clean Sand to Silty Sand 60.40 61.92 60.33 62.03 14.75 15.10 1.55 3.21 Clays: Silty Clay to Clay 59.93 61.65 59.88 61.77 15.10 15.70 17.43 1.51 Sands:Clean Sand to Silty Sand 59.69 61.52 59.65 61.63 15.70 16.28 4.37 2.59 Sand Mixture:Silty Sand to Sandy Silt 59.39 61.35 59.36 61.46
SP41
- Obs
erce
d Se
ttle
men
=0.
187m
S
P42-
Obs
erce
d Se
ttle
men
=0.
225m
SP
43- O
bser
ced
Sett
lem
en =
0.20
4m
SP4
4- O
bser
ced
Sett
lem
en =
0.22
6m
16.28 16.45 13.33 1.86 Sands:Clean Sand to Silty Sand 59.19 61.24 59.17 61.34

254
Table 17 Database Summary of CPT-19 (Continued)
Depth 1 (m)
Depth 2 (m)
qt (Average) (MPa)
Ic(Average) Soil Classification ∆σ (Average)
(kPa) SP-41 ∆σ (Average) (kPa) SP-42
∆σ (Average) (kPa) SP-43
∆σ (Average) (kPa) SP-44
Sand Mixture:Silty Sand to Sandy Silt 16.73 18.25 1.65 3.11 Clays: Silty Clay to Clay 58.59 60.90 58.59 60.98 18.25 18.65 9.54 2.21 Sand Mixture:Silty Sand to Sandy Silt 58.06 60.59 58.06 60.66 18.65 18.83 5.13 2.75 Silt Mixture: Clayey Silt to Silty Clay 57.90 60.50 57.90 60.56 18.83 19.43 9.21 2.23 Sand Mixture:Silty Sand to Sandy Silt 57.68 60.37 57.68 60.42 19.43 21.45 14.16 1.83 Sand Mixtures:silty sand to sandy silt 57.49 59.84 57.49 59.92 21.45 23.45 1.51 3.33 Silt Mixtures:clayey silt to silty clay 57.18 59.67 57.19 59.73 23.45 23.63 5.92 2.32 Sand Mixtures:silty sand to sandy silt 56.74 59.40 56.75 59.46
23.63 25.50 1.80 3.40 Silt Mixtures:clayey silt to silty clay 56.42 59.21 56.43 59.25

255
Table 17 Database Summary of CPT-19 (Continued)
Depth 1 (m)
Depth 2 (m)
qt (Average) (MPa) Ic(Average) Soil Classification ∆σ (Average)
(kPa) SP-45 ∆σ (Average) (kPa) SP-46
∆σ (Average) (kPa) SP-47
0.00 0.15 3.27 1.08 Gravelly Sand to Dense Sand 63.97 63.82 63.99 0.15 0.30 2.52 1.81 Sands:Clean Sand to Silty Sand 63.95 63.82 63.99 0.30 0.55 1.70 2.15 Sand Mixture:Silty Sand to Sandy Silt 63.94 63.79 63.96 0.55 0.90 2.44 1.89 Sands:Clean Sand to Silty Sand 63.89 63.79 63.96 0.90 1.25 1.01 2.35 Sand Mixture:Silty Sand to Sandy Silt 63.88 63.76 63.94 1.25 2.88 0.86 2.85 Silt Mixture: Clayey Silt to Silty Clay 63.84 63.74 63.91 2.88 3.05 1.64 2.42 Sand Mixture:Silty Sand to Sandy Silt 63.83 63.73 63.91 3.05 3.23 6.05 2.43 Sand Mixture:Silty Sand to Sandy Silt 63.78 63.72 63.90 3.23 4.05 0.77 3.03 Clays: Silty Clay to Clay 63.74 63.71 63.88 4.05 4.70 3.23 2.23 Sand Mixture:Silty Sand to Sandy Silt 63.74 63.68 63.87 4.70 5.10 1.01 2.82 Silt Mixture: Clayey Silt to Silty Clay 63.71 63.58 63.78 5.10 6.30 1.10 3.04 Clays: Silty Clay to Clay 63.64 63.48 63.68 6.30 6.50 2.34 2.29 Sand Mixture:Silty Sand to Sandy Silt 63.60 63.44 63.64 6.50 6.83 1.41 2.74 Silt Mixture: Clayey Silt to Silty Clay 63.54 63.38 63.59 6.83 7.20 2.68 2.33 Sand Mixture:Silty Sand to Sandy Silt 63.47 63.30 63.51 7.20 7.73 6.40 1.88 Sands:Clean Sand to Silty Sand 63.40 63.23 63.44 7.73 7.95 4.76 2.35 Sand Mixture:Silty Sand to Sandy Silt 63.27 63.09 63.28 7.95 9.15 12.30 1.63 Sands:Clean Sand to Silty Sand 63.13 62.95 63.12 9.15 9.35 19.91 1.24 Gravelly Sand to Dense Sand 63.03 62.84 63.00 9.35 10.10 13.11 1.65 Sands:Clean Sand to Silty Sand 62.88 62.68 62.81 10.10 10.78 1.23 3.00 Clays: Silty Clay to Clay 62.78 62.58 62.68 10.78 11.00 6.19 1.96 Sands:Clean Sand to Silty Sand 62.74 62.54 62.62 11.00 11.18 1.52 2.90 Silt Mixture: Clayey Silt to Silty Clay 62.69 62.49 62.55 11.18 11.45 2.49 2.56 Sand Mixture:Silty Sand to Sandy Silt 62.62 62.42 62.46 11.45 11.78 5.57 2.07 Sand Mixture:Silty Sand to Sandy Silt 62.52 62.38 62.21 11.78 13.05 1.22 3.18 Clays: Silty Clay to Clay 62.43 62.23 62.19 13.05 13.20 6.00 2.22 Sand Mixture:Silty Sand to Sandy Silt 62.25 62.06 61.94 13.20 14.75 13.60 1.76 Sands:Clean Sand to Silty Sand 62.03 61.86 61.61 14.75 15.10 1.55 3.21 Clays: Silty Clay to Clay 61.77 61.63 61.23 15.10 15.70 17.43 1.51 Sands:Clean Sand to Silty Sand 61.63 61.51 61.03 15.70 16.28 4.37 2.59 Sand Mixture:Silty Sand to Sandy Silt 61.46 61.35 60.77
SP45
- Obs
erce
d Se
ttle
men
=0.
271m
S
P46-
Obs
erce
d Se
ttle
men
=0.
238m
SP
47- O
bser
ced
Sett
lem
en =
0.21
1m
16.28 16.45 13.33 1.86 Sands:Clean Sand to Silty Sand 61.34 61.25 60.60

256
Table 17 Database Summary of CPT-19 (Continued)
Depth 1 (m)
Depth 2 (m)
qt (Average) (MPa) Ic(Average) Soil Classification ∆σ (Average)
(kPa) SP-45 ∆σ (Average) (kPa) SP-46
∆σ (Average) (kPa) SP-47
16.45 16.73 5.92 2.39 Sand Mixture:Silty Sand to Sandy Silt 61.27 61.19 60.50 16.73 18.25 1.65 3.11 Clays: Silty Clay to Clay 60.98 60.94 60.07 18.25 18.65 9.54 2.21 Sand Mixture:Silty Sand to Sandy Silt 60.66 60.65 59.60 18.65 18.83 5.13 2.75 Silt Mixture: Clayey Silt to Silty Clay 60.56 60.56 59.45 18.83 19.43 9.21 2.23 Sand Mixture:Silty Sand to Sandy Silt 60.42 60.44 59.25 19.43 21.45 14.16 1.83 Sand Mixtures:silty sand to sandy silt 60.36 60.27 59.72 21.45 23.45 1.51 3.33 Silt Mixtures:clayey silt to silty clay 60.12 60.06 59.37 23.45 23.63 5.92 2.32 Sand Mixtures:silty sand to sandy silt 59.92 59.89 59.08
23.63 25.50 1.80 3.40 Silt Mixtures:clayey silt to silty clay 59.73 59.72 58.81

257
Table 17 Database Summary of CPT-19 (Continued)
Depth 1 (m)
Depth 2 (m)
qt (Average) (MPa) Ic(Average) Soil Classification ∆σ (Average)
(kPa) SP-48 ∆σ (Average) (kPa) SP-49
∆σ (Average) (kPa) SP-50
0.00 0.15 3.27 1.08 Gravelly Sand to Dense Sand 64.00 63.88 63.98 0.15 0.30 2.52 1.81 Sands:Clean Sand to Silty Sand 63.99 63.88 63.92 0.30 0.55 1.70 2.15 Sand Mixture:Silty Sand to Sandy Silt 63.98 63.87 63.85 0.55 0.90 2.44 1.89 Sands:Clean Sand to Silty Sand 63.96 63.87 63.71 0.90 1.25 1.01 2.35 Sand Mixture:Silty Sand to Sandy Silt 63.94 63.86 63.53 1.25 2.88 0.86 2.85 Silt Mixture: Clayey Silt to Silty Clay 63.91 63.84 62.82 2.88 3.05 1.64 2.42 Sand Mixture:Silty Sand to Sandy Silt 63.90 63.84 62.04 3.05 3.23 6.05 2.43 Sand Mixture:Silty Sand to Sandy Silt 63.89 63.81 61.31 3.23 4.05 0.77 3.03 Clays: Silty Clay to Clay 63.88 63.80 60.44 4.05 4.70 3.23 2.23 Sand Mixture:Silty Sand to Sandy Silt 63.87 63.78 59.76 4.70 5.10 1.01 2.82 Silt Mixture: Clayey Silt to Silty Clay 63.86 63.75 58.64 5.10 6.30 1.10 3.04 Clays: Silty Clay to Clay 63.85 63.71 57.60 6.30 6.50 2.34 2.29 Sand Mixture:Silty Sand to Sandy Silt 63.84 63.71 57.20 6.50 6.83 1.41 2.74 Silt Mixture: Clayey Silt to Silty Clay 63.83 63.70 56.65 6.83 7.20 2.68 2.33 Sand Mixture:Silty Sand to Sandy Silt 63.81 63.70 55.94 7.20 7.73 6.40 1.88 Sands:Clean Sand to Silty Sand 63.79 63.70 55.33 7.73 7.95 4.76 2.35 Sand Mixture:Silty Sand to Sandy Silt 63.75 63.70 54.15 7.95 9.15 12.30 1.63 Sands:Clean Sand to Silty Sand 63.71 63.62 52.98 9.15 9.35 19.91 1.24 Gravelly Sand to Dense Sand 63.67 63.55 52.18 9.35 10.10 13.11 1.65 Sands:Clean Sand to Silty Sand 63.60 63.42 50.99 10.10 10.78 1.23 3.00 Clays: Silty Clay to Clay 63.56 63.34 50.23 10.78 11.00 6.19 1.96 Sands:Clean Sand to Silty Sand 63.54 63.30 49.90 11.00 11.18 1.52 2.90 Silt Mixture: Clayey Silt to Silty Clay 63.51 63.25 49.74 11.18 11.45 2.49 2.56 Sand Mixture:Silty Sand to Sandy Silt 63.48 63.18 49.52 11.45 11.78 5.57 2.07 Sand Mixture:Silty Sand to Sandy Silt 63.37 62.99 49.03 11.78 13.05 1.22 3.18 Clays: Silty Clay to Clay 63.28 62.87 47.73 13.05 13.20 6.00 2.22 Sand Mixture:Silty Sand to Sandy Silt 63.27 62.80 46.59 13.20 14.75 13.60 1.76 Sands:Clean Sand to Silty Sand 63.12 62.55 45.28 14.75 15.10 1.55 3.21 Clays: Silty Clay to Clay 62.95 62.25 43.86 15.10 15.70 17.43 1.51 Sands:Clean Sand to Silty Sand 62.85 62.09 43.18 15.70 16.28 4.37 2.59 Sand Mixture:Silty Sand to Sandy Silt 62.72 61.88 42.35
SP48
- Obs
erce
d Se
ttle
men
=0.
246m
S
P49-
Obs
erce
d Se
ttle
men
=0.
203m
SP
50- O
bser
ced
Sett
lem
en =
0.15
44m
16.28 16.45 13.33 1.86 Sands:Clean Sand to Silty Sand 62.63 61.74 41.84

258
Table 17 Database Summary of CPT-19 (Continued)
Depth 1 (m)
Depth 2 (m)
qt (Average) (MPa) Ic(Average) Soil Classification ∆σ (Average)
(kPa) SP-48 ∆σ (Average) (kPa) SP-49
∆σ (Average) (kPa) SP-50
16.45 16.73 5.92 2.39 Sand Mixture:Silty Sand to Sandy Silt 62.58 61.66 41.54 16.73 18.25 1.65 3.11 Clays: Silty Clay to Clay 62.35 61.30 40.37 18.25 18.65 9.54 2.21 Sand Mixture:Silty Sand to Sandy Silt 62.08 60.88 39.17 18.65 18.83 5.13 2.75 Silt Mixture: Clayey Silt to Silty Clay 62.00 60.75 38.82 18.83 19.43 9.21 2.23 Sand Mixture:Silty Sand to Sandy Silt 61.88 60.57 38.36 19.43 21.45 14.16 1.83 Sand Mixtures:silty sand to sandy silt 60.91 60.13 37.92 21.45 23.45 1.51 3.33 Silt Mixtures:clayey silt to silty clay 60.74 59.86 34.80 23.45 23.63 5.92 2.32 Sand Mixtures:silty sand to sandy silt 60.59 59.63 36.83
23.63 25.50 1.80 3.40 Silt Mixtures:clayey silt to silty clay 59.54 58.01 35.30

259
Table 18 Database Summary of CPT-20
Depth 1 (m)
Depth 2 (m)
qt (Average) (MPa) Ic(Average) Soil Classification ∆σ (Average)
(kPa) SP-41 ∆σ (Average) (kPa) SP-42
∆σ (Average) (kPa) SP-43
∆σ (Average) (kPa) SP-44
0.00 0.50 0.00 0.50 Sands:Clean Sand to Silty Sand 63.46 63.45 63.37 63.47 0.50 0.63 0.50 0.63 Sand Mixture:Silty Sand to Sandy Silt 63.45 63.44 63.36 63.46 0.63 1.03 0.63 1.03 Silt Mixture: Clayey Silt to Silty Clay 63.43 63.42 63.36 63.45 1.03 1.48 1.03 1.48 Clays: Silty Clay to Clay 63.42 63.42 63.34 63.43 1.48 1.68 1.48 1.68 Silt Mixture: Clayey Silt to Silty Clay 63.40 63.40 63.30 63.40 1.68 2.05 1.68 2.05 Clays: Silty Clay to Clay 63.35 63.38 63.29 63.40 2.05 2.53 2.05 2.53 Silt Mixture: Clayey Silt to Silty Clay 63.32 63.36 63.26 63.35 2.53 3.98 2.53 3.98 Clays: Silty Clay to Clay 63.30 63.34 63.21 63.32 3.98 4.53 3.98 4.53 Sand Mixture:Silty Sand to Sandy Silt 63.24 63.31 63.16 63.31 4.53 5.63 4.53 5.63 Clays: Silty Clay to Clay 63.18 63.28 62.99 63.24 5.63 6.03 5.63 6.03 Sand Mixture:Silty Sand to Sandy Silt 63.02 63.28 62.81 63.22 6.03 6.23 6.03 6.23 Silt Mixture: Clayey Silt to Silty Clay 62.95 63.24 62.73 63.18 6.23 6.50 6.23 6.50 Sand Mixture:Silty Sand to Sandy Silt 62.89 63.21 62.67 63.15 6.50 8.40 6.50 8.40 Sands:Clean Sand to Silty Sand 62.57 63.02 62.33 62.97 8.40 9.20 8.40 9.20 Silt Mixture: Clayey Silt to Silty Clay 61.73 62.51 61.50 62.51 9.20 10.45 9.20 10.45 Sands:Clean Sand to Silty Sand 61.45 62.33 61.22 62.36
10.45 10.63 10.45 10.63 Sand Mixture:Silty Sand to Sandy Silt 61.29 62.23 61.06 62.27 10.63 11.23 10.63 11.23 Clays: Silty Clay to Clay 61.04 62.08 60.82 62.14 11.23 11.78 11.23 11.78 Sands:Clean Sand to Silty Sand 60.86 61.98 60.66 62.05 11.78 12.03 11.78 12.03 Sand Mixture:Silty Sand to Sandy Silt 60.73 61.90 60.53 61.98 12.03 12.38 12.03 12.38 Sands:Clean Sand to Silty Sand 60.44 61.73 60.25 61.82 12.38 13.28 12.38 13.28 Clays: Silty Clay to Clay 60.17 61.57 60.00 61.68 13.28 13.53 13.28 13.53 Sand Mixture:Silty Sand to Sandy Silt 60.00 61.47 59.83 61.58 13.53 14.00 13.53 14.00 Silt Mixture: Clayey Silt to Silty Clay 59.82 61.37 59.66 61.48 14.00 14.28 14.00 14.28 Clays: Silty Clay to Clay 59.64 61.27 59.49 61.39 14.28 14.73 14.28 14.73 Sands:Clean Sand to Silty Sand 59.53 61.22 59.37 61.28 14.73 15.53 14.73 15.53 Clays: Silty Clay to Clay 59.33 61.09 59.19 61.21 15.53 15.98 15.53 15.98 Sand Mixture:Silty Sand to Sandy Silt 59.01 60.92 58.88 61.03 15.98 16.18 15.98 16.18 Silt Mixture: Clayey Silt to Silty Clay 58.84 60.82 58.72 60.93 16.18 16.40 16.18 16.40 Sand Mixture:Silty Sand to Sandy Silt 58.73 60.76 58.61 60.87 16.40 17.48 16.40 17.48 Clays: Silty Clay to Clay 58.39 60.57 58.28 60.66
SP41
- Obs
erce
d Se
ttle
men
=0.
187m
S
P42-
Obs
erce
d Se
ttle
men
=0.
225m
SP
43- O
bser
ced
Sett
lem
en =
0.20
4m
SP4
4- O
bser
ced
Sett
lem
en =
0.22
6m
17.48 18.85 17.48 18.85 Clays: Silty Clay to Clay 57.72 60.18 57.62 60.26

260
Table 18 Database Summary of CPT-20
Depth 1 (m)
Depth 2 (m)
qt (Average) (MPa) Ic(Average) Soil Classification ∆σ (Average)
(kPa) SP-41 ∆σ (Average) (kPa) SP-42
∆σ (Average) (kPa) SP-43
∆σ (Average) (kPa) SP-44
18.85 19.43 3.49 2.73 Silt Mixture: Clayey Silt to Silty Clay 57.17 59.86 57.08 59.91 19.43 20.60 1.40 3.43 Clays: Silty Clay to Clay 56.67 59.55 56.57 59.59 20.60 21.45 14.16 1.83 Sand Mixtures:silty sand to sandy silt 56.16 59.05 56.16 59.08 21.45 23.45 1.51 3.33 Silt Mixtures:clayey silt to silty clay 55.58 58.68 55.58 58.76 23.45 23.63 5.92 2.32 Sand Mixtures:silty sand to sandy silt 54.72 58.08 54.69 58.16
23.63 25.50 1.80 3.40 Silt Mixtures:clayey silt to silty clay 54.41 57.75 54.38 57.92

261
Table 18 Database Summary of CPT-20 (Continued)
Depth 1 (m)
Depth 2 (m)
qt (Average) (MPa) Ic(Average) Soil Classification ∆σ (Average)
(kPa) SP-45 ∆σ (Average) (kPa) SP-46
∆σ (Average) (kPa) SP-47
0.00 0.50 0.00 0.50 Sands:Clean Sand to Silty Sand 63.37 63.32 63.50 0.50 0.63 0.50 0.63 Sand Mixture:Silty Sand to Sandy Silt 63.36 63.32 63.49 0.63 1.03 0.63 1.03 Silt Mixture: Clayey Silt to Silty Clay 63.35 63.31 63.48 1.03 1.48 1.03 1.48 Clays: Silty Clay to Clay 63.33 63.30 63.48 1.48 1.68 1.48 1.68 Silt Mixture: Clayey Silt to Silty Clay 63.30 63.30 63.47 1.68 2.05 1.68 2.05 Clays: Silty Clay to Clay 63.30 63.27 63.44 2.05 2.53 2.05 2.53 Silt Mixture: Clayey Silt to Silty Clay 63.25 63.25 63.43 2.53 3.98 2.53 3.98 Clays: Silty Clay to Clay 63.22 63.25 63.42 3.98 4.53 3.98 4.53 Sand Mixture:Silty Sand to Sandy Silt 63.21 63.23 63.40 4.53 5.63 4.53 5.63 Clays: Silty Clay to Clay 63.14 63.16 63.35 5.63 6.03 5.63 6.03 Sand Mixture:Silty Sand to Sandy Silt 63.12 63.07 63.26 6.03 6.23 6.03 6.23 Silt Mixture: Clayey Silt to Silty Clay 63.08 63.03 63.22 6.23 6.50 6.23 6.50 Sand Mixture:Silty Sand to Sandy Silt 63.05 62.99 63.19 6.50 8.40 6.50 8.40 Sands:Clean Sand to Silty Sand 62.87 62.80 63.00 8.40 9.20 8.40 9.20 Silt Mixture: Clayey Silt to Silty Clay 62.41 62.32 62.48 9.20 10.45 9.20 10.45 Sands:Clean Sand to Silty Sand 62.26 62.16 62.28 10.45 10.63 10.45 10.63 Sand Mixture:Silty Sand to Sandy Silt 62.17 62.07 62.17 10.63 11.23 10.63 11.23 Clays: Silty Clay to Clay 62.04 61.94 61.99 11.23 11.78 11.23 11.78 Sands:Clean Sand to Silty Sand 61.95 61.85 61.86 11.78 12.03 11.78 12.03 Sand Mixture:Silty Sand to Sandy Silt 61.88 61.78 61.76 12.03 12.38 12.03 12.38 Sands:Clean Sand to Silty Sand 61.72 61.63 61.55 12.38 13.28 12.38 13.28 Clays: Silty Clay to Clay 61.58 61.50 61.34 13.28 13.53 13.28 13.53 Sand Mixture:Silty Sand to Sandy Silt 61.48 61.41 61.20 13.53 14.00 13.53 14.00 Silt Mixture: Clayey Silt to Silty Clay 61.38 61.32 61.05 14.00 14.28 14.00 14.28 Clays: Silty Clay to Clay 61.29 61.23 60.91 14.28 14.73 14.28 14.73 Sands:Clean Sand to Silty Sand 61.18 61.17 60.73 14.73 15.53 14.73 15.53 Clays: Silty Clay to Clay 61.11 61.07 60.65 15.53 15.98 15.53 15.98 Sand Mixture:Silty Sand to Sandy Silt 60.93 60.92 60.38 15.98 16.18 15.98 16.18 Silt Mixture: Clayey Silt to Silty Clay 60.83 60.83 60.23 16.18 16.40 16.18 16.40 Sand Mixture:Silty Sand to Sandy Silt 60.77 60.77 60.13 16.40 17.48 16.40 17.48 Clays: Silty Clay to Clay 60.56 60.60 59.83
SP45
- Obs
erce
d Se
ttle
men
=0.
271m
S
P46-
Obs
erce
d Se
ttle
men
=0.
238m
SP
47- O
bser
ced
Sett
lem
en =
0.21
1m
17.48 18.85 17.48 18.85 Clays: Silty Clay to Clay 60.16 60.24 59.24

262
Table 18-Database Summary of CPT-20 (Continued)
Depth 1 (m)
Depth 2 (m)
qt (Average) (MPa) Ic(Average) Soil Classification ∆σ (Average)
(kPa) SP-45 ∆σ (Average) (kPa) SP-46
∆σ (Average) (kPa) SP-47
18.85 19.43 3.49 2.73 Silt Mixture: Clayey Silt to Silty Clay 59.81 59.93 58.75 19.43 20.60 1.40 3.43 Clays: Silty Clay to Clay 59.49 59.63 58.29 20.60 21.45 14.16 1.83 Sand Mixtures:silty sand to sandy silt 59.08 59.13 57.88 21.45 23.45 1.51 3.33 Silt Mixtures:clayey silt to silty clay 58.71 58.76 57.35 23.45 23.63 5.92 2.32 Sand Mixtures:silty sand to sandy silt 58.12 58.16 56.56
23.63 25.50 1.80 3.40 Silt Mixtures:clayey silt to silty clay 57.52 57.92 56.28

263
Table 18 Database Summary of CPT-20 (Continued)
Depth 1 (m)
Depth 2 (m)
qt (Average) (MPa) Ic(Average) Soil Classification ∆σ (Average)
(kPa) SP-48 ∆σ (Average) (kPa) SP-49
∆σ (Average) (kPa) SP-50
0.00 0.50 0.00 0.50 Sands:Clean Sand to Silty Sand 63.44 63.53 63.61 0.50 0.63 0.50 0.63 Sand Mixture:Silty Sand to Sandy Silt 63.42 63.53 63.49 0.63 1.03 0.63 1.03 Silt Mixture: Clayey Silt to Silty Clay 63.41 63.53 63.36 1.03 1.48 1.03 1.48 Clays: Silty Clay to Clay 63.39 63.52 63.12 1.48 1.68 1.48 1.68 Silt Mixture: Clayey Silt to Silty Clay 63.37 63.51 62.91 1.68 2.05 1.68 2.05 Clays: Silty Clay to Clay 63.37 63.47 62.70 2.05 2.53 2.05 2.53 Silt Mixture: Clayey Silt to Silty Clay 63.36 63.46 62.36 2.53 3.98 2.53 3.98 Clays: Silty Clay to Clay 63.34 63.42 61.43 3.98 4.53 3.98 4.53 Sand Mixture:Silty Sand to Sandy Silt 63.33 63.39 60.29 4.53 5.63 4.53 5.63 Clays: Silty Clay to Clay 63.32 63.38 59.21 5.63 6.03 5.63 6.03 Sand Mixture:Silty Sand to Sandy Silt 63.31 63.36 58.16 6.03 6.23 6.03 6.23 Silt Mixture: Clayey Silt to Silty Clay 63.30 63.35 57.72 6.23 6.50 6.23 6.50 Sand Mixture:Silty Sand to Sandy Silt 63.30 63.35 57.36 6.50 8.40 6.50 8.40 Sands:Clean Sand to Silty Sand 63.26 63.35 55.65 8.40 9.20 8.40 9.20 Silt Mixture: Clayey Silt to Silty Clay 63.11 63.18 51.72 9.20 10.45 9.20 10.45 Sands:Clean Sand to Silty Sand 63.04 63.05 50.52 10.45 10.63 10.45 10.63 Sand Mixture:Silty Sand to Sandy Silt 63.00 62.98 49.87 10.63 11.23 10.63 11.23 Clays: Silty Clay to Clay 62.94 62.86 48.91 11.23 11.78 11.23 11.78 Sands:Clean Sand to Silty Sand 62.89 62.76 48.26 11.78 12.03 11.78 12.03 Sand Mixture:Silty Sand to Sandy Silt 62.85 62.69 47.77 12.03 12.38 12.03 12.38 Sands:Clean Sand to Silty Sand 62.76 62.53 46.76 12.38 13.28 12.38 13.28 Clays: Silty Clay to Clay 62.67 62.37 45.86 13.28 13.53 13.28 13.53 Sand Mixture:Silty Sand to Sandy Silt 62.61 62.27 45.30 13.53 14.00 13.53 14.00 Silt Mixture: Clayey Silt to Silty Clay 62.55 62.16 44.72 14.00 14.28 14.00 14.28 Clays: Silty Clay to Clay 62.48 62.04 44.57 14.28 14.73 14.28 14.73 Sands:Clean Sand to Silty Sand 62.35 61.84 44.18 14.73 15.53 14.73 15.53 Clays: Silty Clay to Clay 62.33 61.84 43.27 15.53 15.98 15.53 15.98 Sand Mixture:Silty Sand to Sandy Silt 62.22 61.62 42.38 15.98 16.18 15.98 16.18 Silt Mixture: Clayey Silt to Silty Clay 62.15 61.50 41.93 16.18 16.40 16.18 16.40 Sand Mixture:Silty Sand to Sandy Silt 62.10 61.42 41.64 16.40 17.48 16.40 17.48 Clays: Silty Clay to Clay 61.94 61.17 40.78
SP48
- Obs
erce
d Se
ttle
men
=0.
246m
S
P49-
Obs
erce
d Se
ttle
men
=0.
203m
SP
50- O
bser
ced
Sett
lem
en =
0.15
44m
17.48 18.85 17.48 18.85 Clays: Silty Clay to Clay 61.61 60.66 39.22

264
Table 18 Database Summary of CPT-20 (Continued)
Depth 1 (m)
Depth 2 (m)
qt (Average) (MPa) Ic(Average) Soil Classification ∆σ (Average)
(kPa) SP-48 ∆σ (Average) (kPa) SP-49
∆σ (Average) (kPa) SP-50
18.85 19.43 3.49 2.73 Silt Mixture: Clayey Silt to Silty Clay 61.33 60.22 38.05 19.43 20.60 1.40 3.43 Clays: Silty Clay to Clay 61.05 59.79 37.04 20.60 21.45 14.16 1.83 Sand Mixtures:silty sand to sandy silt 60.26 59.12 36.83 21.45 23.45 1.51 3.33 Silt Mixtures:clayey silt to silty clay 59.73 58.32 35.30 23.45 23.63 5.92 2.32 Sand Mixtures:silty sand to sandy silt 59.54 58.01 34.80
23.63 25.50 1.80 3.40 Silt Mixtures:clayey silt to silty clay 59.31 57.67 34.14

265
Table 19 Database Summary of CPT-23
Depth 1 (m)
Depth 2 (m)
qt (Average) (MPa) Ic(Average) Soil Classification ∆σ (Average)
(kPa) SP-25 ∆σ (Average) (kPa) SP-26
∆σ (Average) (kPa) SP-27
0.00 0.40 5.96 1.60 Sands:Clean Sand to Silty Sand 63.85 63.68 63.80 0.40 0.68 12.87 1.30 Gravelly Sand to Dense Sand 63.85 63.67 63.78 0.68 1.55 8.67 1.68 Sands:Clean Sand to Silty Sand 63.80 63.64 63.65 1.55 1.85 2.45 2.35 Sand Mixture:Silty Sand to Sandy Silt 63.69 63.55 63.65 1.85 2.25 0.87 2.99 Clays: Silty Clay to Clay 63.60 63.46 63.47 2.25 3.60 1.11 2.83 Silt Mixture: Clayey Silt to Silty Clay 63.28 63.15 62.78 3.60 4.78 4.47 2.24 Sand Mixture:Silty Sand to Sandy Silt 62.68 62.57 61.46 4.78 5.88 0.74 3.13 Clays: Silty Clay to Clay 62.01 61.94 60.04 5.88 6.23 1.18 2.82 Silt Mixture: Clayey Silt to Silty Clay 61.54 61.50 59.08 6.23 6.35 3.02 2.30 Sand Mixture:Silty Sand to Sandy Silt 61.37 61.35 58.76 6.35 8.43 9.46 1.76 Sands:Clean Sand to Silty Sand 60.59 60.65 57.29 8.43 8.63 1.11 3.20 Clays: Silty Clay to Clay 59.76 59.90 55.80 8.63 13.00 15.70 1.65 Sands:Clean Sand to Silty Sand 58.04 58.41 53.12 13.00 14.63 1.24 3.22 Clays: Silty Clay to Clay 55.86 56.54 50.02 14.63 14.85 4.45 2.44 Sand Mixture:Silty Sand to Sandy Silt 55.22 55.99 49.19 14.85 15.80 1.42 3.33 Clays: Silty Clay to Clay 54.83 55.66 48.68 15.80 16.25 6.44 2.30 Sand Mixture:Silty Sand to Sandy Silt 54.36 55.26 48.10 16.25 18.48 1.43 3.33 Clays: Silty Clay to Clay 53.51 54.53 47.04 18.48 18.75 3.52 2.82 Silt Mixture: Clayey Silt to Silty Clay 52.73 53.87 46.08 18.75 19.08 13.28 1.97 Sands:Clean Sand to Silty Sand 52.54 53.72 45.86 19.08 19.25 9.86 2.21 Sand Mixture:Silty Sand to Sandy Silt 52.39 53.59 45.68 19.25 20.55 1.62 3.29 Clays: Silty Clay to Clay 51.95 53.22 45.16 20.60 21.45 14.16 1.83 Sand Mixtures:silty sand to sandy silt 51.42 52.46 44.72 21.45 23.45 1.51 3.33 Silt Mixtures:clayey silt to silty clay 50.73 51.88 43.73 23.45 23.63 5.92 2.32 Sand Mixtures:silty sand to sandy silt 50.46 51.65 42.89 SP
25- O
bser
ced
Sett
lem
en =
0.13
9m
SP2
6- O
bser
ced
Sett
lem
en
=0.1
83m
SP
27- O
bser
ced
Sett
lem
en =
0.19
3m
23.63 25.50 1.80 3.40 Silt Mixtures:clayey silt to silty clay 50.26 51.48 42.56

266
Table 20 Database Summary of CPT-24
Depth 1 (m)
Depth 2 (m)
qt (Average) (MPa) Ic(Average) Soil Classification ∆σ (Average)
(kPa) SP-16 ∆σ (Average) (kPa) SP-17
∆σ (Average) (kPa) SP-18
0.00 1.03 1.15 2.50 Sand Mixture:Silty Sand to Sandy Silt 63.29 63.33 63.35 1.03 1.28 0.60 2.87 Silt Mixture: Clayey Silt to Silty Clay 63.29 63.33 63.34 1.28 1.65 0.33 3.12 Clays: Silty Clay to Clay 63.28 63.32 63.28 1.65 2.13 0.67 2.77 Silt Mixture: Clayey Silt to Silty Clay 63.27 63.32 63.21 2.13 2.48 0.90 2.96 Clays: Silty Clay to Clay 63.27 63.31 63.17 2.48 2.80 5.19 2.05 Sands:Clean Sand to Silty Sand 63.26 63.31 63.04 2.80 3.08 4.08 2.26 Sand Mixture:Silty Sand to Sandy Silt 63.25 63.29 62.91 3.08 3.70 0.94 3.00 Clays: Silty Clay to Clay 63.25 63.26 62.66 3.70 5.15 1.25 2.91 Silt Mixture: Clayey Silt to Silty Clay 63.24 63.25 61.97 5.15 6.45 1.03 3.11 Clays: Silty Clay to Clay 63.20 63.12 60.87 6.45 6.68 1.21 2.77 Silt Mixture: Clayey Silt to Silty Clay 63.10 63.02 60.21 6.68 7.08 0.69 3.09 Clays: Silty Clay to Clay 63.05 62.97 59.93 7.08 7.65 3.37 2.33 Sand Mixture:Silty Sand to Sandy Silt 62.96 62.89 59.49 7.65 8.00 7.29 1.77 Sands:Clean Sand to Silty Sand 62.85 62.80 59.08 8.00 8.23 2.63 2.39 Sand Mixture:Silty Sand to Sandy Silt 62.78 62.75 58.82 8.23 10.60 14.84 1.51 Sands:Clean Sand to Silty Sand 62.40 62.46 57.65 10.60 10.90 3.59 2.56 Sand Mixture:Silty Sand to Sandy Silt 61.94 62.14 56.48 10.90 11.18 7.94 2.00 Sands:Clean Sand to Silty Sand 61.83 62.06 56.24 11.18 11.75 1.05 3.18 Clays: Silty Clay to Clay 61.66 61.95 55.88 11.75 11.93 4.80 2.36 Sand Mixture:Silty Sand to Sandy Silt 61.51 61.85 55.57 11.93 12.83 1.29 3.28 Clays: Silty Clay to Clay 61.29 61.69 55.13 12.83 13.15 6.82 2.26 Sand Mixture:Silty Sand to Sandy Silt 61.03 61.52 54.64 13.15 13.63 1.63 3.16 Clays: Silty Clay to Clay 60.86 61.40 54.33 13.63 14.38 0.65 3.66 Organic Soils Peat 60.59 61.21 53.86 14.38 14.55 0.85 3.48 Clays: Silty Clay to Clay 60.39 61.07 53.51 14.55 14.90 10.06 1.96 Sands:Clean Sand to Silty Sand 60.27 60.99 53.32 14.90 15.38 3.61 2.63 Silt Mixture: Clayey Silt to Silty Clay 60.09 60.85 53.01 15.38 17.45 1.26 3.42 Clays: Silty Clay to Clay 59.52 60.43 52.10 17.45 17.68 0.90 3.71 Organic Soils Peat 59.00 60.04 51.30 17.68 17.98 2.57 2.96 Clays: Silty Clay to Clay 58.88 59.95 51.13 17.98 18.25 7.09 2.28 Sand Mixture:Silty Sand to Sandy Silt 58.75 59.85 50.93
SP16
- Obs
erce
d Se
ttle
men
=0.
205m
S
P17-
Obs
erce
d Se
ttle
men
=0.
195m
SP
18- O
bser
ced
Sett
lem
en =
0.25
0m
18.25 18.55 2.09 3.24 Clays: Silty Clay to Clay 58.62 59.74 50.74

267
Table 20 Database Summary of CPT-24 Continued
Depth 1 (m)
Depth 2 (m)
qt (Average) (MPa) Ic(Average) Soil Classification ∆σ (Average)
(kPa) SP-16 ∆σ (Average) (kPa) SP-17
∆σ (Average) (kPa) SP-18
18.55 18.80 3.07 2.86 Silt Mixtures:clayey silt to silty clay 58.22 59.27 49.01 18.80 19.30 1.66 3.23 Clays:silty clay to clay 58.01 59.11 48.72 19.30 19.45 3.05 2.80 Silt Mixtures:clayey silt to silty clay 57.85 58.98 48.51 19.45 19.70 8.44 2.12 Sand Mixtures:silty sand to sandy silt 57.76 58.91 48.38 19.70 19.98 4.04 2.81 Silt Mixtures:clayey silt to silty clay 57.63 58.81 48.21 19.98 20.60 1.68 3.24 Clays:silty clay to clay 57.40 58.64 47.93 20.60 20.93 10.76 1.95 Sand Mixtures:silty sand to sandy silt 57.16 58.45 47.64 20.93 21.18 2.31 3.03 Silt Mixtures:clayey silt to silty clay 57.02 58.34 47.47 21.18 21.88 11.19 2.02 Sand Mixtures:silty sand to sandy silt 56.76 58.15 47.18 21.88 23.38 1.81 3.25 Silt Mixtures:clayey silt to silty clay 56.14 57.69 46.54 23.38 23.63 5.86 2.60 Silt Mixtures:clayey silt to silty clay 55.62 57.32 46.05
23.63 25.50 1.96 3.29 Clays:silty clay to clay 54.95 56.86 45.47

268
Table 20 Database Summary of CPT-24 (Contibued)
Depth 1 (m)
Depth 2 (m)
qt (Average) (MPa) Ic(Average) Soil Classification ∆σ (Average)
(kPa) SP-19 ∆σ (Average) (kPa) SP-20
∆σ (Average) (kPa) SP-21
0.00 1.03 1.15 2.50 Sand Mixture:Silty Sand to Sandy Silt 63.26 63.27 63.38 1.03 1.28 0.60 2.87 Silt Mixture: Clayey Silt to Silty Clay 63.26 63.26 63.36 1.28 1.65 0.33 3.12 Clays: Silty Clay to Clay 63.26 63.24 63.35 1.65 2.13 0.67 2.77 Silt Mixture: Clayey Silt to Silty Clay 63.25 63.19 63.28 2.13 2.48 0.90 2.96 Clays: Silty Clay to Clay 63.25 63.13 63.17 2.48 2.80 5.19 2.05 Sands:Clean Sand to Silty Sand 63.24 63.08 63.06 2.80 3.08 4.08 2.26 Sand Mixture:Silty Sand to Sandy Silt 63.24 63.03 62.95 3.08 3.70 0.94 3.00 Clays: Silty Clay to Clay 63.23 62.96 62.76 3.70 5.15 1.25 2.91 Silt Mixture: Clayey Silt to Silty Clay 63.21 62.80 62.22 5.15 6.45 1.03 3.11 Clays: Silty Clay to Clay 63.19 62.63 61.38 6.45 6.68 1.21 2.77 Silt Mixture: Clayey Silt to Silty Clay 63.15 62.56 60.88 6.68 7.08 0.69 3.09 Clays: Silty Clay to Clay 63.13 62.53 60.67 7.08 7.65 3.37 2.33 Sand Mixture:Silty Sand to Sandy Silt 63.09 62.49 60.34 7.65 8.00 7.29 1.77 Sands:Clean Sand to Silty Sand 63.05 62.45 60.03 8.00 8.23 2.63 2.39 Sand Mixture:Silty Sand to Sandy Silt 63.03 62.42 59.83 8.23 10.60 14.84 1.51 Sands:Clean Sand to Silty Sand 62.89 62.30 58.95 10.60 10.90 3.59 2.56 Sand Mixture:Silty Sand to Sandy Silt 62.72 62.16 58.06 10.90 11.18 7.94 2.00 Sands:Clean Sand to Silty Sand 62.68 62.13 57.87 11.18 11.75 1.05 3.18 Clays: Silty Clay to Clay 62.62 62.07 57.60 11.75 11.93 4.80 2.36 Sand Mixture:Silty Sand to Sandy Silt 62.56 62.02 57.36 11.93 12.83 1.29 3.28 Clays: Silty Clay to Clay 62.48 61.95 57.02 12.83 13.15 6.82 2.26 Sand Mixture:Silty Sand to Sandy Silt 62.37 61.86 56.65 13.15 13.63 1.63 3.16 Clays: Silty Clay to Clay 62.30 61.80 56.41 13.63 14.38 0.65 3.66 Organic Soils Peat 62.19 61.71 56.05 14.38 14.55 0.85 3.48 Clays: Silty Clay to Clay 62.09 61.65 55.78 14.55 14.90 10.06 1.96 Sands:Clean Sand to Silty Sand 62.04 61.61 55.63 14.90 15.38 3.61 2.63 Silt Mixture: Clayey Silt to Silty Clay 61.95 61.56 55.40 15.38 17.45 1.26 3.42 Clays: Silty Clay to Clay 61.66 61.44 54.71 17.45 17.68 0.90 3.71 Organic Soils Peat 61.38 61.35 54.11 17.68 17.98 2.57 2.96 Clays: Silty Clay to Clay 61.31 61.34 53.97 17.98 18.25 7.09 2.28 Sand Mixture:Silty Sand to Sandy Silt 61.24 61.32 53.83
SP19
- Obs
erce
d Se
ttle
men
=0.
142m
S
P20-
Obs
erce
d Se
ttle
men
=0.
233m
SP
21- O
bser
ced
Sett
lem
en =
0.15
6m
SP2
2- O
bser
ced
Sett
lem
en =
0.18
2m
SP23
- Obs
erce
d Se
ttle
men
=0.
230m
S
P24-
Obs
erce
d Se
ttle
men
=0.
193m
18.25 18.55 2.09 3.24 Clays: Silty Clay to Clay 61.16 61.31 53.68

269
Table 20 Database Summary of CPT-24 (Contibued)
Depth 1 (m)
Depth 2 (m)
qt (Average) (MPa) Ic(Average) ∆σ (Average)
(kPa) SP-19 ∆σ (Average) (kPa) SP-20
∆σ (Average) (kPa) SP-21
18.40 18.80 3.07 2.86 Silt Mixtures:clayey silt to silty clay 61.10 60.76 52.54 18.80 19.30 1.66 3.23 Clays:silty clay to clay 60.80 60.70 51.99 19.30 19.45 3.05 2.80 Silt Mixtures:clayey silt to silty clay 60.67 60.67 51.77 19.45 19.70 8.44 2.12 Sand Mixtures:silty sand to sandy silt 60.58 60.65 51.61 19.70 19.98 4.04 2.81 Silt Mixtures:clayey silt to silty clay 60.52 60.63 51.51 19.98 20.60 1.68 3.24 Clays:silty clay to clay 60.44 60.60 51.39 20.60 20.93 10.76 1.95 Sand Mixtures:silty sand to sandy silt 60.30 60.54 51.18 20.93 21.18 2.31 3.03 Silt Mixtures:clayey silt to silty clay 60.15 60.44 50.96 21.18 21.88 11.19 2.02 Sand Mixtures:silty sand to sandy silt 60.06 60.36 50.84 21.88 23.38 1.81 3.25 Silt Mixtures:clayey silt to silty clay 59.89 60.17 50.62 23.38 23.63 5.86 2.60 Silt Mixtures:clayey silt to silty clay 59.51 59.41 50.15
23.63 25.50 1.96 3.29 Clays:silty clay to clay 59.20 58.43 49.79

270
Table 20 Database Summary of CPT-24 (Contibued)
Depth 1 (m)
Depth 2 (m)
qt (Average) (MPa) Ic(Average) Soil Classification ∆σ (Average)
(kPa) SP-25 ∆σ (Average) (kPa) SP-26
∆σ (Average) (kPa) SP-27
0.00 1.03 1.15 2.50 Sand Mixture:Silty Sand to Sandy Silt 63.34 63.27 63.41 1.03 1.28 0.60 2.87 Silt Mixture: Clayey Silt to Silty Clay 63.30 63.24 63.34 1.28 1.65 0.33 3.12 Clays: Silty Clay to Clay 63.24 63.20 63.33 1.65 2.13 0.67 2.77 Silt Mixture: Clayey Silt to Silty Clay 63.14 63.10 63.15 2.13 2.48 0.90 2.96 Clays: Silty Clay to Clay 63.02 62.98 62.91 2.48 2.80 5.19 2.05 Sands:Clean Sand to Silty Sand 62.90 62.87 62.65 2.80 3.08 4.08 2.26 Sand Mixture:Silty Sand to Sandy Silt 62.79 62.76 62.39 3.08 3.70 0.94 3.00 Clays: Silty Clay to Clay 62.59 62.56 61.95 3.70 5.15 1.25 2.91 Silt Mixture: Clayey Silt to Silty Clay 62.04 62.04 60.77 5.15 6.45 1.03 3.11 Clays: Silty Clay to Clay 61.20 61.25 59.01 6.45 6.68 1.21 2.77 Silt Mixture: Clayey Silt to Silty Clay 60.68 60.78 57.99 6.68 7.08 0.69 3.09 Clays: Silty Clay to Clay 60.46 60.58 57.57 7.08 7.65 3.37 2.33 Sand Mixture:Silty Sand to Sandy Silt 60.11 60.26 56.92 7.65 8.00 7.29 1.77 Sands:Clean Sand to Silty Sand 59.78 59.96 56.31 8.00 8.23 2.63 2.39 Sand Mixture:Silty Sand to Sandy Silt 59.56 59.77 55.94 8.23 10.60 14.84 1.51 Sands:Clean Sand to Silty Sand 58.59 58.92 54.31 10.60 10.90 3.59 2.56 Sand Mixture:Silty Sand to Sandy Silt 57.58 58.04 52.73 10.90 11.18 7.94 2.00 Sands:Clean Sand to Silty Sand 57.37 57.86 52.41 11.18 11.75 1.05 3.18 Clays: Silty Clay to Clay 57.05 57.59 51.95 11.75 11.93 4.80 2.36 Sand Mixture:Silty Sand to Sandy Silt 56.78 57.35 51.56 11.93 12.83 1.29 3.28 Clays: Silty Clay to Clay 56.38 57.01 51.01 12.83 13.15 6.82 2.26 Sand Mixture:Silty Sand to Sandy Silt 55.94 56.64 50.40 13.15 13.63 1.63 3.16 Clays: Silty Clay to Clay 55.66 56.39 50.02 13.63 14.38 0.65 3.66 Organic Soils Peat 55.23 56.03 49.45 14.38 14.55 0.85 3.48 Clays: Silty Clay to Clay 54.91 55.75 49.03 14.55 14.90 10.06 1.96 Sands:Clean Sand to Silty Sand 54.73 55.60 48.80 14.90 15.38 3.61 2.63 Silt Mixture: Clayey Silt to Silty Clay 54.45 55.36 48.44 15.38 17.45 1.26 3.42 Clays: Silty Clay to Clay 53.61 54.65 47.39 17.45 17.68 0.90 3.71 Organic Soils Peat 52.88 54.02 46.48 17.68 17.98 2.57 2.96 Clays: Silty Clay to Clay 52.71 53.88 46.27 17.98 18.25 7.09 2.28 Sand Mixture:Silty Sand to Sandy Silt 52.53 53.73 46.06
SP25
- Obs
erce
d Se
ttle
men
=0.
139m
S
P26-
Obs
erce
d Se
ttle
men
=0.
183
m
SP27
- Obs
erce
d Se
ttle
men
=0.
193
m
SP2
8- O
bser
ced
Sett
lem
en =
0.17
7 m
SP
29- O
bser
ced
Sett
lem
en =
0.22
0 m
S
P30-
Obs
erce
d Se
ttle
men
=0.
201
m
18.25 18.55 2.09 3.24 Clays: Silty Clay to Clay 52.36 53.58 45.84
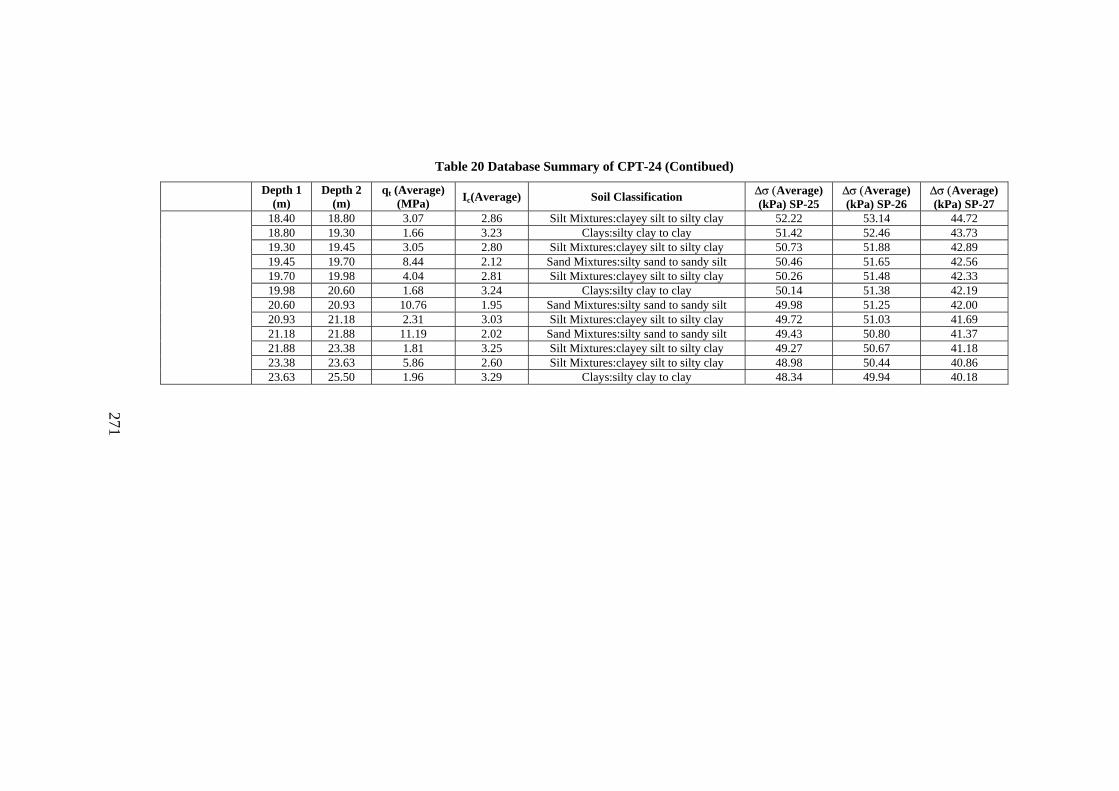
271
Table 20 Database Summary of CPT-24 (Contibued)
Depth 1 (m)
Depth 2 (m)
qt (Average) (MPa) Ic(Average) Soil Classification ∆σ (Average)
(kPa) SP-25 ∆σ (Average) (kPa) SP-26
∆σ (Average) (kPa) SP-27
18.40 18.80 3.07 2.86 Silt Mixtures:clayey silt to silty clay 52.22 53.14 44.72 18.80 19.30 1.66 3.23 Clays:silty clay to clay 51.42 52.46 43.73 19.30 19.45 3.05 2.80 Silt Mixtures:clayey silt to silty clay 50.73 51.88 42.89 19.45 19.70 8.44 2.12 Sand Mixtures:silty sand to sandy silt 50.46 51.65 42.56 19.70 19.98 4.04 2.81 Silt Mixtures:clayey silt to silty clay 50.26 51.48 42.33 19.98 20.60 1.68 3.24 Clays:silty clay to clay 50.14 51.38 42.19 20.60 20.93 10.76 1.95 Sand Mixtures:silty sand to sandy silt 49.98 51.25 42.00 20.93 21.18 2.31 3.03 Silt Mixtures:clayey silt to silty clay 49.72 51.03 41.69 21.18 21.88 11.19 2.02 Sand Mixtures:silty sand to sandy silt 49.43 50.80 41.37 21.88 23.38 1.81 3.25 Silt Mixtures:clayey silt to silty clay 49.27 50.67 41.18 23.38 23.63 5.86 2.60 Silt Mixtures:clayey silt to silty clay 48.98 50.44 40.86
23.63 25.50 1.96 3.29 Clays:silty clay to clay 48.34 49.94 40.18

272
Table 21 Database Summary of BCPT-2
Depth 1 (m)
Depth 2 (m)
qt (Average) (MPa) Ic(Average) Soil Classification ∆σ (Average)
(kPa) SP-4 ∆σ (Average)
(kPa) SP-5 ∆σ (Average)
(kPa) SP-7 0.00 0.18 3.27 1.74 Sands:clean sand to silty sand 63.83 63.70 63.73 0.18 0.60 1.33 2.43 Sand Mixtures:silty sand to sandy silt 63.83 63.70 63.69 0.60 5.28 1.54 2.80 Silt Mixtures:clayey silt to silty clay 63.83 63.64 63.68 5.28 5.74 1.04 3.02 Clays:silty clay to clay 63.82 63.50 63.67 5.74 5.92 1.43 2.89 Silt Mixtures:clayey silt to silty clay 63.81 63.48 63.65 5.92 6.20 4.07 2.34 Sand Mixtures:silty sand to sandy silt 63.80 63.46 63.64 6.20 6.72 0.92 3.10 Silt Mixtures:clayey silt to silty clay 63.80 63.43 63.61 6.72 6.82 1.66 2.87 Silt Mixtures:clayey silt to silty clay 63.78 63.40 63.59 6.82 6.98 1.21 3.03 Clays:silty clay to clay 63.77 63.39 63.58 6.98 7.10 1.55 2.91 Silt Mixtures:clayey silt to silty clay 63.77 63.38 63.56 7.10 7.34 1.81 2.95 Clays:silty clay to clay 63.76 63.36 63.55 7.34 8.14 2.04 2.89 Silt Mixtures:clayey silt to silty clay 63.75 63.32 63.50 8.14 11.06 1.18 3.20 Clays:silty clay to clay 63.75 63.18 63.32 11.06 11.58 2.39 2.91 Silt Mixtures:clayey silt to silty clay 63.73 63.00 63.03 11.58 11.80 1.92 2.99 Clays:silty clay to clay 63.72 62.97 62.97 11.80 12.12 3.41 2.74 Silt Mixtures:clayey silt to silty clay 63.70 62.94 62.93 12.12 12.44 7.22 2.34 Sand Mixtures:silty sand to sandy silt 63.70 62.92 62.88 12.44 12.76 3.83 2.79 Silt Mixtures:clayey silt to silty clay 63.66 62.89 62.82 12.76 14.00 2.24 3.01 Clays:silty clay to clay 63.59 62.82 62.67 14.00 14.26 2.45 2.94 Silt Mixtures:clayey silt to silty clay 63.54 62.76 62.53 14.26 14.96 2.27 2.99 Clays:silty clay to clay 63.53 62.71 62.42 14.96 15.62 3.83 2.83 Silt Mixtures:clayey silt to silty clay 63.49 62.65 62.27 15.62 15.70 8.96 2.43 Sand Mixtures:silty sand to sandy silt 63.46 62.61 62.18 15.70 15.76 5.69 2.83 Silt Mixtures:clayey silt to silty clay 63.37 62.61 62.17 15.76 16.78 2.51 3.09 Clays:silty clay to clay 63.34 62.55 62.03 16.78 16.86 4.42 2.80 Silt Mixtures:clayey silt to silty clay 63.29 62.49 61.89 16.86 17.20 2.54 3.10 Clays:silty clay to clay 63.23 62.47 61.83 17.20 17.34 4.67 2.81 Silt Mixtures:clayey silt to silty clay 63.19 62.44 61.76 17.34 17.84 2.94 3.03 Clays:silty clay to clay 63.17 62.40 61.67 17.84 17.94 3.65 2.88 Silt Mixtures:clayey silt to silty clay 63.14 62.36 61.58 17.94 18.06 3.03 3.05 Clays:silty clay to clay 63.14 62.35 61.54
BSP
5- O
bser
ced
Sett
lem
en =
0.11
8m
BSP
7- O
bser
ced
Sett
lem
en =
0.09
9 m
B
SP4-
Obs
erce
d Se
ttle
men
=0.
122
m
18.06 18.12 2.99 2.95 Silt Mixtures:clayey silt to silty clay 63.13 62.33 61.51
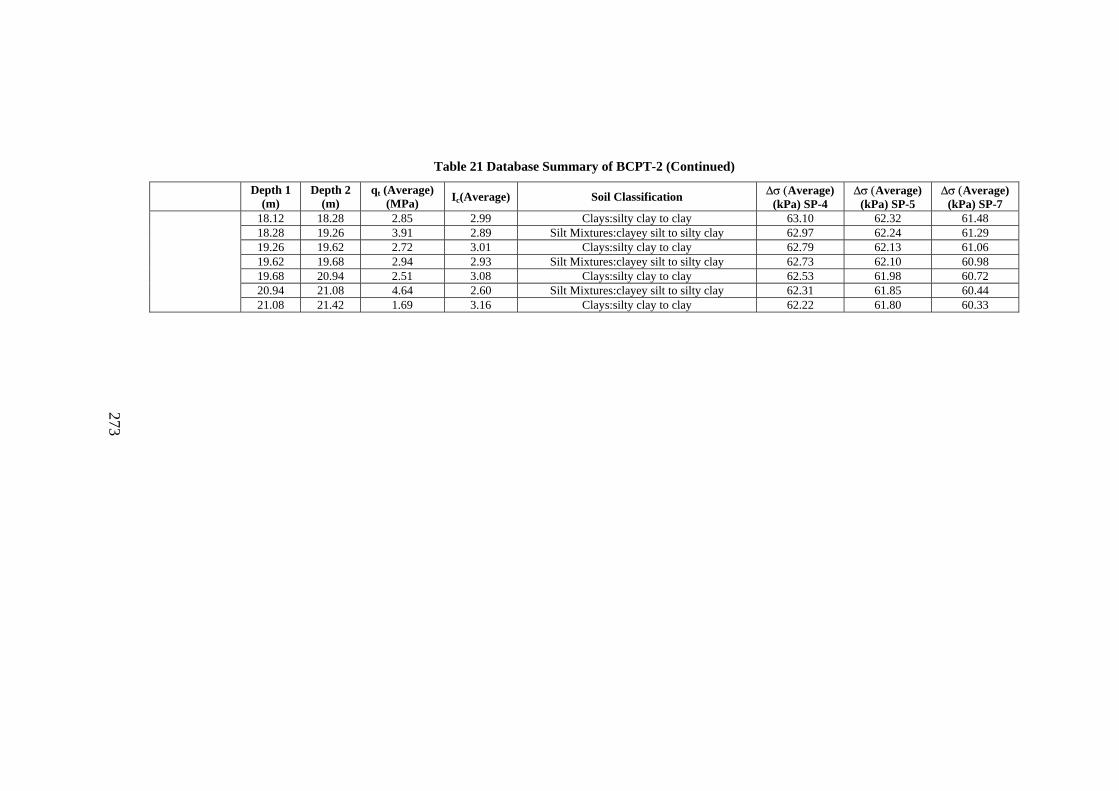
273
Table 21 Database Summary of BCPT-2 (Continued)
Depth 1 (m)
Depth 2 (m)
qt (Average) (MPa) Ic(Average) Soil Classification ∆σ (Average)
(kPa) SP-4 ∆σ (Average)
(kPa) SP-5 ∆σ (Average)
(kPa) SP-7 18.12 18.28 2.85 2.99 Clays:silty clay to clay 63.10 62.32 61.48 18.28 19.26 3.91 2.89 Silt Mixtures:clayey silt to silty clay 62.97 62.24 61.29 19.26 19.62 2.72 3.01 Clays:silty clay to clay 62.79 62.13 61.06 19.62 19.68 2.94 2.93 Silt Mixtures:clayey silt to silty clay 62.73 62.10 60.98 19.68 20.94 2.51 3.08 Clays:silty clay to clay 62.53 61.98 60.72 20.94 21.08 4.64 2.60 Silt Mixtures:clayey silt to silty clay 62.31 61.85 60.44
21.08 21.42 1.69 3.16 Clays:silty clay to clay 62.22 61.80 60.33

274
Table 22 Database Summary of BCPT-3
Depth 1 (m)
Depth 2 (m)
qt (Average) (MPa) Ic(Average) Soil Classification ∆σ (Average)
(kPa) SP-6 ∆σ (Average)
(kPa) SP-7 0.00 0.40 1.35 1.93 Sands:clean sand to silty sand 63.58 63.57 0.40 5.85 2.23 2.42 Sand Mixtures:silty sand to sandy silt 63.50 63.53 5.85 8.90 2.05 2.71 Silt Mixtures:clayey silt to silty clay 63.48 63.38 8.90 9.50 1.11 3.07 Clays:silty clay to clay 63.32 63.19 9.50 9.70 1.90 2.76 Silt Mixtures:clayey silt to silty clay 63.27 63.13 9.70 9.90 3.96 2.38 Sand Mixtures:silty sand to sandy silt 63.25 63.11 9.90 10.25 2.45 2.67 Silt Mixtures:clayey silt to silty clay 63.21 63.07 10.25 10.95 3.25 2.50 Sand Mixtures:silty sand to sandy silt 63.13 63.00 10.95 13.00 2.55 2.72 Silt Mixtures:clayey silt to silty clay 62.90 62.78 13.00 13.25 1.49 2.96 Clays:silty clay to clay 62.68 62.58 13.25 14.10 1.90 2.86 Silt Mixtures:clayey silt to silty clay 62.56 62.47 14.10 14.45 7.15 2.00 Sands:clean sand to silty sand 62.42 62.35 B
SP7-
Obs
erce
d Se
ttle
men
=0
.099
m
B
SP6-
Obs
erce
d Se
ttle
men
=0
.108
m
14.45 14.63 1.99 2.80 Silt Mixtures:clayey silt to silty clay 62.34 62.29

275
Table 23 Database Summary of BCPT-4
Depth 1 (m)
Depth 2 (m)
qt (Average) (MPa) Ic(Average) Soil Classification ∆σ (Average)
(kPa) SP-4 ∆σ (Average)
(kPa) SP-5 0.00 0.16 0.95 1.97 Sands:clean sand to silty sand 63.88 63.94 0.16 0.54 1.41 2.10 Sand Mixtures:silty sand to sandy silt 63.82 63.98 0.54 0.64 1.65 1.94 Sands:clean sand to silty sand 63.80 64.02 0.64 3.16 1.97 2.33 Sand Mixtures:silty sand to sandy silt 63.73 64.19 3.16 4.26 0.95 1.97 Silt Mixtures:clayey silt to silty clay 63.61 64.38 4.26 4.40 1.95 2.57 Sand Mixtures:silty sand to sandy silt 63.45 64.43 4.40 9.48 1.89 2.77 Silt Mixtures:clayey silt to silty clay 63.35 64.56 9.48 9.86 1.26 2.99 Clays:silty clay to clay 63.24 64.64 9.86 14.22 2.83 2.78 Silt Mixtures:clayey silt to silty clay 63.20 64.60 14.22 14.36 6.10 2.36 Sand Mixtures:silty sand to sandy silt 63.15 64.49 14.36 15.66 3.73 2.68 Silt Mixtures:clayey silt to silty clay 63.13 64.42 15.66 15.74 3.05 3.06 Clays:silty clay to clay 63.09 64.34 B
SP4-
Obs
erce
d Se
ttle
men
=0
.122
m
B
SP3-
Obs
erce
d Se
ttle
men
=0
.094
m
15.74 16.92 2.88 2.88 Silt Mixtures:clayey silt to silty clay 63.02 64.25

276
Table 23 Database Summary of BCPT-4(Continued)
Depth 1 (m)
Depth 2 (m)
qt (Average) (MPa) Ic(Average) Soil Classification ∆σ (Average)
(kPa) SP-1 ∆σ (Average)
(kPa) SP-2 0.00 0.16 0.95 1.97 Sands:clean sand to silty sand 63.91 63.94 0.16 0.54 1.41 2.10 Sand Mixtures:silty sand to sandy silt 63.57 63.60 0.54 0.64 1.65 1.94 Sands:clean sand to silty sand 63.26 63.31 0.64 3.16 1.97 2.33 Sand Mixtures:silty sand to sandy silt 61.60 61.99 3.16 4.26 0.95 1.97 Silt Mixtures:clayey silt to silty clay 59.32 60.44 4.26 4.40 1.95 2.57 Sand Mixtures:silty sand to sandy silt 58.55 59.97 4.40 9.48 1.89 2.77 Silt Mixtures:clayey silt to silty clay 55.36 57.92 9.48 9.86 1.26 2.99 Clays:silty clay to clay 52.17 55.66 9.86 14.22 2.83 2.78 Silt Mixtures:clayey silt to silty clay 49.76 53.63 14.22 14.36 6.10 2.36 Sand Mixtures:silty sand to sandy silt 47.68 51.75 14.36 15.66 3.73 2.68 Silt Mixtures:clayey silt to silty clay 47.11 51.19 15.66 15.74 3.05 3.06 Clays:silty clay to clay 46.58 50.67 B
SP1-
Obs
erce
d Se
ttle
men
=0
.091
m
B
SP2-
Obs
erce
d Se
ttle
men
=0
.088
m
15.74 16.92 2.88 2.88 Silt Mixtures:clayey silt to silty clay 46.12 50.21

277
Table 24 Database Summary of BCPT-5
Depth 1 (m)
Depth 2 (m)
qt (Average) (MPa) Ic(Average) Soil Classification ∆σ (Average)
(kPa) SP-1 ∆σ (Average)
(kPa) SP-2 ∆σ (Average) (kPa) SP-16
0.00 0.08 0.73 1.95 Sands:clean sand to silty sand 63.86 63.99 63.80 0.08 0.28 0.79 2.18 Sand Mixtures:silty sand to sandy silt 63.69 63.82 63.77 0.28 0.38 0.97 1.91 Sands:clean sand to silty sand 63.50 63.62 63.74 0.38 2.96 2.04 2.40 Sand Mixtures:silty sand to sandy silt 61.79 62.21 63.72 2.96 5.24 1.85 2.67 Silt Mixtures:clayey silt to silty clay 58.73 60.15 63.69 5.24 5.66 3.26 2.45 Sand Mixtures:silty sand to sandy silt 57.06 59.11 63.57 5.66 6.12 1.58 2.82 Silt Mixtures:clayey silt to silty clay 56.51 58.77 63.56 6.12 6.20 1.13 2.97 Clays:silty clay to clay 56.18 58.56 63.55 6.20 8.86 2.03 2.79 Silt Mixtures:clayey silt to silty clay 54.54 57.46 63.55 8.86 9.60 1.21 3.01 Clays:silty clay to clay 52.56 56.04 63.26 9.60 9.82 2.78 2.78 Silt Mixtures:clayey silt to silty clay 52.03 55.63 63.16 9.82 10.10 1.33 3.07 Clays:silty clay to clay 51.76 55.41 63.11 10.10 10.20 1.53 2.89 Silt Mixtures:clayey silt to silty clay 51.55 55.25 63.06 10.20 10.44 1.56 2.99 Clays:silty clay to clay 51.37 55.10 63.02 10.44 13.26 2.05 2.82 Silt Mixtures:clayey silt to silty clay 49.82 53.78 62.62 13.26 13.38 5.12 2.44 Sand Mixtures:silty sand to sandy silt 48.42 52.54 62.21 13.38 13.84 2.72 2.77 Silt Mixtures:clayey silt to silty clay 48.16 52.30 62.12 13.84 14.06 1.87 3.02 Clays:silty clay to clay 47.87 52.03 62.02 14.06 15.72 2.78 2.89 Silt Mixtures:clayey silt to silty clay 47.11 51.29 61.72 15.72 16.56 2.55 2.98 Clays:silty clay to clay 46.16 50.35 61.30 16.56 16.66 3.12 2.91 Silt Mixtures:clayey silt to silty clay 45.82 50.01 61.13 16.66 16.92 2.55 2.99 Clays:silty clay to clay 45.70 49.89 61.07 16.92 17.02 2.68 2.94 Silt Mixtures:clayey silt to silty clay 45.58 49.76 61.00 17.02 17.10 2.61 2.96 Clays:silty clay to clay 45.52 49.70 60.97 17.10 17.88 3.00 2.92 Silt Mixtures:clayey silt to silty clay 45.24 49.41 60.81 17.88 17.98 2.54 3.08 Clays:silty clay to clay 44.96 49.11 60.65 17.98 18.10 2.67 2.91 Silt Mixtures:clayey silt to silty clay 44.89 49.04 60.60 18.10 20.26 2.26 3.05 Clays:silty clay to clay 44.21 48.31 60.15 20.26 20.58 3.26 2.89 Silt Mixtures:clayey silt to silty clay 43.52 47.53 59.62 20.58 20.84 2.87 2.99 Clays:silty clay to clay 43.36 47.35 59.49
BSP
1- O
bser
ced
Sett
lem
en =
0.09
1m
BSP
2- O
bser
ced
Sett
lem
en =
0.08
8 m
B
SP16
- Obs
erce
d Se
ttle
men
=0.
083
m
20.84 20.94 2.87 2.82 Silt Mixtures:clayey silt to silty clay 43.26 47.24 59.40

278
Table 25 Database Summary of BCPT-6
Depth 1 (m)
Depth 2 (m)
qt (Average) (MPa) Ic(Average) Soil Classification ∆σ (Average)
(kPa) SP-1 ∆σ (Average)
(kPa) SP-2 ∆σ (Average) (kPa) SP-15
0.00 3.22 1.67 2.45 Sand Mixtures:silty sand to sandy silt 63.16 63.28 63.21 3.22 3.72 2.50 2.64 Silt Mixtures:clayey silt to silty clay 60.82 61.63 63.13 3.72 4.02 2.40 2.39 Sand Mixtures:silty sand to sandy silt 60.32 61.32 63.12 4.02 5.22 1.76 2.73 Silt Mixtures:clayey silt to silty clay 59.38 60.75 63.08 5.22 5.42 6.90 2.25 Sand Mixtures:silty sand to sandy silt 58.52 60.21 63.04 5.42 5.62 8.91 1.84 Sands:clean sand to silty sand 58.27 60.06 63.03 5.62 5.68 4.09 2.43 Sand Mixtures:silty sand to sandy silt 58.11 59.96 63.02 5.68 7.78 1.79 2.83 Silt Mixtures:clayey silt to silty clay 56.79 59.11 62.92 7.78 8.26 1.12 3.04 Clays:silty clay to clay 55.25 58.06 62.77 8.26 8.46 1.80 2.84 Silt Mixtures:clayey silt to silty clay 54.86 57.78 62.72 8.46 8.60 1.10 3.04 Clays:silty clay to clay 54.66 57.63 62.70 8.60 8.70 1.24 2.93 Silt Mixtures:clayey silt to silty clay 54.52 57.53 62.68 8.70 9.82 1.05 3.05 Clays:silty clay to clay 53.83 57.01 62.58 9.82 10.22 6.07 2.27 Sand Mixtures:silty sand to sandy silt 52.99 56.36 62.44 10.22 10.28 1.71 3.02 Clays:silty clay to clay 52.74 56.16 62.39 10.28 11.78 2.52 2.80 Silt Mixtures:clayey silt to silty clay 51.93 55.48 62.22 11.78 11.86 1.47 3.00 Clays:silty clay to clay 51.13 54.80 62.04 11.86 11.96 1.97 2.84 Silt Mixtures:clayey silt to silty clay 51.04 54.73 62.02 11.96 12.20 6.69 2.22 Sand Mixtures:silty sand to sandy silt 50.87 54.58 61.98 12.20 12.32 8.62 2.01 Sands:clean sand to silty sand 50.70 54.43 61.93 12.32 12.42 6.42 2.11 Sand Mixtures:silty sand to sandy silt 50.59 54.33 61.90 12.42 12.64 11.04 1.93 Sands:clean sand to silty sand 50.44 54.20 61.86 12.64 12.72 4.03 2.30 Sand Mixtures:silty sand to sandy silt 50.30 54.07 61.82 12.72 14.02 2.11 2.64 Silt Mixtures:clayey silt to silty clay 49.68 53.50 61.62 14.02 15.36 2.93 2.43 Sand Mixtures:silty sand to sandy silt 48.56 52.44 61.22 15.36 15.44 2.60 2.61 Silt Mixtures:clayey silt to silty clay 48.00 51.90 60.98 15.44 15.68 2.72 2.46 Sand Mixtures:silty sand to sandy silt 47.88 51.78 60.93 15.68 15.80 2.66 2.61 Silt Mixtures:clayey silt to silty clay 47.75 51.64 60.87 15.80 15.92 2.75 2.46 Sand Mixtures:silty sand to sandy silt 47.66 51.55 60.82 15.92 16.02 2.71 2.60 Silt Mixtures:clayey silt to silty clay 47.58 51.47 60.78 16.02 16.20 3.43 2.38 Sand Mixtures:silty sand to sandy silt 47.48 51.37 60.73
BSP
1- O
bser
ced
Sett
lem
en =
0.09
1m
BSP
2- O
bser
ced
Sett
lem
en =
0.08
8 m
B
SP15
- Obs
erce
d Se
ttle
men
=0.
082
m
16.20 16.30 4.21 2.82 Silt Mixtures:clayey silt to silty clay 47.38 51.27 60.68

279
Table 25 Database Summary of BCPT-6(Continued)
Depth 1 (m)
Depth 2 (m)
qt (Average) (MPa) Ic(Average) Soil Classification ∆σ (Average)
(kPa) SP-1 ∆σ (Average)
(kPa) SP-2 ∆σ (Average) (kPa) SP-15
16.72 16.90 3.22 2.92 Silt Mixtures:clayey silt to silty clay 47.19 51.08 60.59 16.90 17.02 3.01 2.96 Clays:silty clay to clay 46.99 50.87 60.47 17.02 18.40 3.26 2.89 Silt Mixtures:clayey silt to silty clay 46.89 50.77 60.42 18.40 18.60 2.67 2.97 Clays:silty clay to clay 46.40 50.26 60.12 18.60 18.70 2.94 2.93 Silt Mixtures:clayey silt to silty clay 45.91 49.74 59.79 18.70 19.04 2.67 2.98 Clays:silty clay to clay 45.82 49.64 59.73 19.04 19.08 2.39 2.63 Silt Mixtures:clayey silt to silty clay 45.69 49.50 59.63
16.72 16.90 3.22 2.92 Silt Mixtures:clayey silt to silty clay 45.57 49.37 59.54

280
Table 26 Database Summary of BCPT-7
Depth 1 (m)
Depth 2 (m)
qt (Average) (MPa) Ic(Average) Soil Classification ∆σ (Average)
(kPa) SP-13 ∆σ (Average) (kPa) SP-14
0.00 0.12 1.20 1.84 Sands:clean sand to silty sand 63.82 63.90 0.12 1.36 1.35 2.50 Sand Mixtures:silty sand to sandy silt 63.82 63.86 1.36 2.34 1.51 2.64 Silt Mixtures:clayey silt to silty clay 63.82 63.81 2.34 3.30 2.47 2.58 Sand Mixtures:silty sand to sandy silt 63.79 63.76 3.30 5.06 2.14 2.62 Silt Mixtures:clayey silt to silty clay 63.74 63.71 5.06 5.14 1.89 2.58 Sand Mixtures:silty sand to sandy silt 63.69 63.68 5.14 5.22 1.92 2.62 Silt Mixtures:clayey silt to silty clay 63.67 63.68 5.22 5.52 3.76 2.48 Sand Mixtures:silty sand to sandy silt 63.66 63.67 5.52 11.00 2.20 2.76 Silt Mixtures:clayey silt to silty clay 63.61 63.54 11.00 11.08 4.77 2.54 Sand Mixtures:silty sand to sandy silt 63.21 63.40 11.08 11.18 4.45 2.67 Silt Mixtures:clayey silt to silty clay 63.19 63.39 11.18 11.24 5.48 2.53 Sand Mixtures:silty sand to sandy silt 63.18 63.39 11.24 11.30 4.87 2.62 Silt Mixtures:clayey silt to silty clay 63.17 63.38 11.30 11.52 8.41 2.33 Sand Mixtures:silty sand to sandy silt 63.13 63.37 11.52 11.62 11.16 1.95 Sands:clean sand to silty sand 63.09 63.36 11.62 11.70 8.68 2.19 Sand Mixtures:silty sand to sandy silt 63.07 63.35 11.70 11.82 7.91 2.07 Sands:clean sand to silty sand 63.05 63.35 11.82 11.94 3.26 2.68 Silt Mixtures:clayey silt to silty clay 63.02 63.34 11.94 12.12 1.71 2.99 Clays:silty clay to clay 62.99 63.33 12.12 12.30 1.97 2.93 Silt Mixtures:clayey silt to silty clay 62.95 63.31 12.30 12.46 1.93 2.97 Clays:silty clay to clay 62.91 63.30 12.46 12.68 2.07 2.93 Silt Mixtures:clayey silt to silty clay 62.86 63.28 12.68 13.12 1.97 2.98 Clays:silty clay to clay 62.77 63.26 13.12 14.86 2.75 2.87 Silt Mixtures:clayey silt to silty clay 62.48 63.15
BSP
13- O
bser
ced
Sett
lem
en =
0.09
7m
BSP
14- O
bser
ced
Sett
lem
en =
0.07
3 m
14.86 14.90 2.69 2.32 Sand Mixtures:silty sand to sandy silt 62.21 63.06

281
Table 27 Database Summary of BCPT-8
Depth 1 (m)
Depth 2 (m)
qt (Average) (MPa) Ic(Average) Soil Classification ∆σ (Average)
(kPa) SP-13 0.00 1.40 0.80 2.43 Sands:clean sand to silty sand 63.42 1.40 5.08 1.13 2.74 Silt Mixtures:clayey silt to silty clay 63.42 5.08 5.14 2.62 2.52 Sand Mixtures:silty sand to sandy silt 63.42 5.14 5.20 1.46 2.80 Silt Mixtures:clayey silt to silty clay 63.42 5.20 5.30 0.98 2.98 Clays:silty clay to clay 63.41 5.30 5.46 1.03 2.94 Silt Mixtures:clayey silt to silty clay 63.41 5.46 5.58 1.02 2.96 Clays:silty clay to clay 63.36 5.58 6.44 1.13 2.91 Silt Mixtures:clayey silt to silty clay 63.35 6.44 7.66 0.67 3.18 Clays:silty clay to clay 63.26 7.66 8.70 0.71 3.23 Clays:silty clay to clay 63.26 8.70 9.94 0.68 3.23 Clays:silty clay to clay 63.11 9.94 10.28 2.14 2.77 Silt Mixtures:clayey silt to silty clay 62.99 10.28 10.38 1.41 3.05 Clays:silty clay to clay 62.95 10.38 10.46 1.74 2.92 Silt Mixtures:clayey silt to silty clay 62.93 10.46 10.60 1.58 3.00 Clays:silty clay to clay 62.91 10.60 10.68 2.60 2.74 Silt Mixtures:clayey silt to silty clay 62.89 10.68 10.88 1.53 3.00 Clays:silty clay to clay 62.86 10.88 11.38 1.78 2.91 Silt Mixtures:clayey silt to silty clay 62.79 11.38 11.98 1.01 3.14 Clays:silty clay to clay 62.67 11.98 12.10 2.30 2.81 Silt Mixtures:clayey silt to silty clay 62.59 12.10 12.20 3.14 2.42 Sand Mixtures:silty sand to sandy silt 62.56 12.20 14.66 1.20 3.22 Clays:silty clay to clay 62.23
BSP
13- O
bser
ced
Sett
lem
en =
0.09
7m
14.66 14.70 1.34 2.87 Silt Mixtures:clayey silt to silty clay 61.88

282
Table 28 Database Summary of BCPT-15
Depth 1 (m)
Depth 2 (m)
qt (Average) (MPa) Ic(Average) Soil Classification ∆σ (Average)
(kPa) SP-20 ∆σ (Average) (kPa) SP-21
0.00 3.10 1.56 5.05 Sands:clean sand to silty sand 62.64 62.61 3.10 7.70 1.76 4.08 Silt Mixtures:clayey silt to silty clay 60.49 61.92 7.70 7.90 2.65 5.00 Sand Mixtures:silty sand to sandy silt 58.23 61.17 7.90 8.65 1.69 4.00 Silt Mixtures:clayey silt to silty clay 57.74 60.97 8.65 8.80 1.15 3.00 Clays:silty clay to clay 57.28 60.77 8.80 9.55 1.72 4.07 Silt Mixtures:clayey silt to silty clay 56.82 60.56 9.55 9.75 4.85 5.00 Sand Mixtures:silty sand to sandy silt 56.33 60.34 9.75 14.00 2.69 4.05 Silt Mixtures:clayey silt to silty clay 54.12 59.14 14.00 14.15 4.88 4.80 Sand Mixtures:silty sand to sandy silt 51.96 57.84 0.00 3.10 1.56 5.05 Sands:clean sand to silty sand 62.64 62.61 3.10 7.70 1.76 4.08 Silt Mixtures:clayey silt to silty clay 60.49 61.92 7.70 7.90 2.65 5.00 Sand Mixtures:silty sand to sandy silt 58.23 61.17 7.90 8.65 1.69 4.00 Silt Mixtures:clayey silt to silty clay 57.74 60.97 8.65 8.80 1.15 3.00 Clays:silty clay to clay 57.28 60.77 8.80 9.55 1.72 4.07 Silt Mixtures:clayey silt to silty clay 56.82 60.56 9.55 9.75 4.85 5.00 Sand Mixtures:silty sand to sandy silt 56.33 60.34 9.75 14.00 2.69 4.05 Silt Mixtures:clayey silt to silty clay 54.12 59.14
BSP
20- O
bser
ced
Sett
lem
en =
0.08
0m
BSP
21- O
bser
ced
Sett
lem
en =
0.08
1 m
14.00 14.15 4.88 4.80 Sand Mixtures:silty sand to sandy silt 51.96 57.84