Embed Size (px)
Citation preview
CPSC Staff Statement on SEA, Ltd. Report “Tilt Table Measurements on Twenty-Two
Recreational Off-Highway Vehicles”1 September 2015
The report titled, “Tilt Table Measurements on Twenty-Two Recreational Off-Highway Vehicles,” presents results from lateral tilt table tests made by SEA, Ltd (“SEA”) on 12 model year 2014-2015 Recreational Off-Highway Vehicles (“ROVs”) under contract CPSC-D-11-0003, Task Order 008. In addition, the report contains results of tilt table test results for 10 model year 2008-2011 ROVs that were previously measured by SEA under Contract CPSC-S-10-0014. The objectives of Task Order 008 were:
• To measure the tilt table angle (“TTA”) and tilt table ratio (“TTR”) of 12 model year 2014-2015 ROVs without using a trip rail.
• To measure the TTA and TTR of the same 12 ROVs using a 1-inch high trip rail. • To evaluate the correlation between the measured tilt table metrics and the threshold lateral
acceleration (“Ay”) values measured during a 30 mph dropped-throttle J-turn test. Static and dynamic vehicle characteristics of the 22 ROVs are available in the following published reports:
• Vehicle Characteristics Measurements of Recreational Off-Highway Vehicles – Results from Tests on Thirteen 2014-2015 Model Year Vehicles (available at: http://www.cpsc.gov/en/Research--Statistics/Sports--Recreation/ATVs/Technical-Reports/).
• Vehicle Characteristics Measurements of Recreational Off-Highway Vehicles (available at: http://www.cpsc.gov/PageFiles/96037/rov.pdf).
• Vehicle Characteristics Measurements of Recreational Off-Highway Vehicles – Additional Results for Vehicle J. (available at: http://www.cpsc.gov/PageFiles/93928/rovj.pdf).
The use of a 1-inch trip rail increases the TTA for all of the vehicles (tested with and without a 1-inch trip rail) by an average of 2.0 degrees. The trip rail increases the TTA because the trip rail increases the effective track width and decreases the effective center of gravity of the vehicle during the test. The correlation between TTA and Ay has an R2 value of 0.60 for all 22 ROVs when tested without the 1-inch trip rail. Based on test results for 12 ROVs tested with and without a 1-inch trip rail, the correlation value does not change because the 1-inch trip rail essentially shifts all the TTA values to a higher level. However, for this same reason, it would be inappropriate to mix TTA results with a trip rail and TTA results without a trip rail for comparison to each other or for correlation to Ay.
1 This statement was prepared by the CPSC staff, and the attached report was produced by SEA for CPSC staff. The statement and report have not been reviewed or approved by, and do not necessarily represent the views of, the Commission.
Tilt Table Measurements on Twenty-Two Recreational Off-Highway Vehicles
Including Correlation with Measured Threshold Lateral Acceleration
for: Consumer Product Safety Commission
September 2015
Vehicle Dynamics Division
7349 Worthington-Galena Rd. Columbus, Ohio 43085
Tilt Table Measurements on Twenty-Two Recreational Off-Highway Vehicles
Including Correlation with Measured Threshold Lateral Acceleration
for: Consumer Product Safety Commission
“These comments are those of SEA, Ltd. staff, and they have not been reviewed or
approved by, and may not necessarily reflect the views of, the Commission.”
Report prepared by Gary J. Heydinger, Ph.D., P.E.
Vehicle Dynamics Division
7349 Worthington-Galena Rd. Columbus, Ohio 43085
TABLE OF CONTENTS 1. OVERVIEW .................................................................................................................. 1 2. TILT TABLE TESTING................................................................................................ 2 3. RESULTS ...................................................................................................................... 4 Appendix: Individual Vehicle Results for 2104-2015 Vehicles ............................Appendix Page 1
1
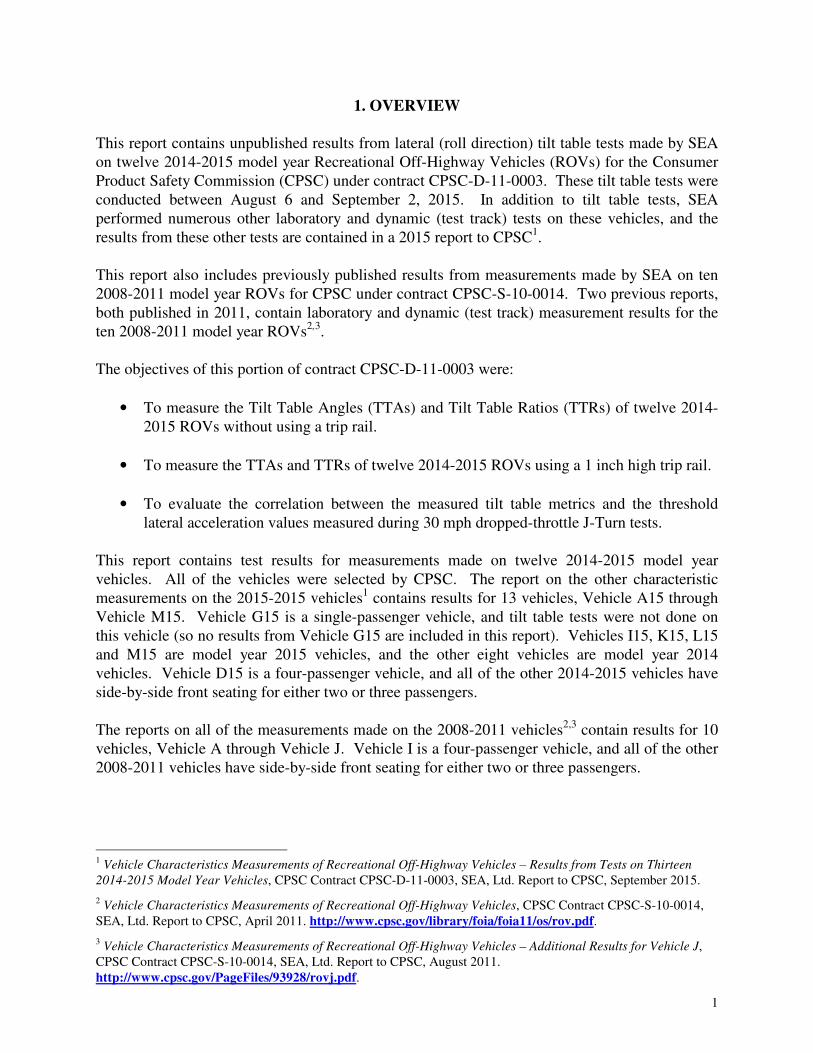
1. OVERVIEW This report contains unpublished results from lateral (roll direction) tilt table tests made by SEA on twelve 2014-2015 model year Recreational Off-Highway Vehicles (ROVs) for the Consumer Product Safety Commission (CPSC) under contract CPSC-D-11-0003. These tilt table tests were conducted between August 6 and September 2, 2015. In addition to tilt table tests, SEA performed numerous other laboratory and dynamic (test track) tests on these vehicles, and the results from these other tests are contained in a 2015 report to CPSC1. This report also includes previously published results from measurements made by SEA on ten 2008-2011 model year ROVs for CPSC under contract CPSC-S-10-0014. Two previous reports, both published in 2011, contain laboratory and dynamic (test track) measurement results for the ten 2008-2011 model year ROVs2,3. The objectives of this portion of contract CPSC-D-11-0003 were:
• To measure the Tilt Table Angles (TTAs) and Tilt Table Ratios (TTRs) of twelve 2014-2015 ROVs without using a trip rail.
• To measure the TTAs and TTRs of twelve 2014-2015 ROVs using a 1 inch high trip rail.
• To evaluate the correlation between the measured tilt table metrics and the threshold
lateral acceleration values measured during 30 mph dropped-throttle J-Turn tests. This report contains test results for measurements made on twelve 2014-2015 model year vehicles. All of the vehicles were selected by CPSC. The report on the other characteristic measurements on the 2015-2015 vehicles1 contains results for 13 vehicles, Vehicle A15 through Vehicle M15. Vehicle G15 is a single-passenger vehicle, and tilt table tests were not done on this vehicle (so no results from Vehicle G15 are included in this report). Vehicles I15, K15, L15 and M15 are model year 2015 vehicles, and the other eight vehicles are model year 2014 vehicles. Vehicle D15 is a four-passenger vehicle, and all of the other 2014-2015 vehicles have side-by-side front seating for either two or three passengers. The reports on all of the measurements made on the 2008-2011 vehicles2,3 contain results for 10 vehicles, Vehicle A through Vehicle J. Vehicle I is a four-passenger vehicle, and all of the other 2008-2011 vehicles have side-by-side front seating for either two or three passengers.
1 Vehicle Characteristics Measurements of Recreational Off-Highway Vehicles – Results from Tests on Thirteen 2014-2015 Model Year Vehicles, CPSC Contract CPSC-D-11-0003, SEA, Ltd. Report to CPSC, September 2015. 2 Vehicle Characteristics Measurements of Recreational Off-Highway Vehicles, CPSC Contract CPSC-S-10-0014, SEA, Ltd. Report to CPSC, April 2011. http://www.cpsc.gov/library/foia/foia11/os/rov.pdf. 3 Vehicle Characteristics Measurements of Recreational Off-Highway Vehicles – Additional Results for Vehicle J, CPSC Contract CPSC-S-10-0014, SEA, Ltd. Report to CPSC, August 2011. http://www.cpsc.gov/PageFiles/93928/rovj.pdf.
2
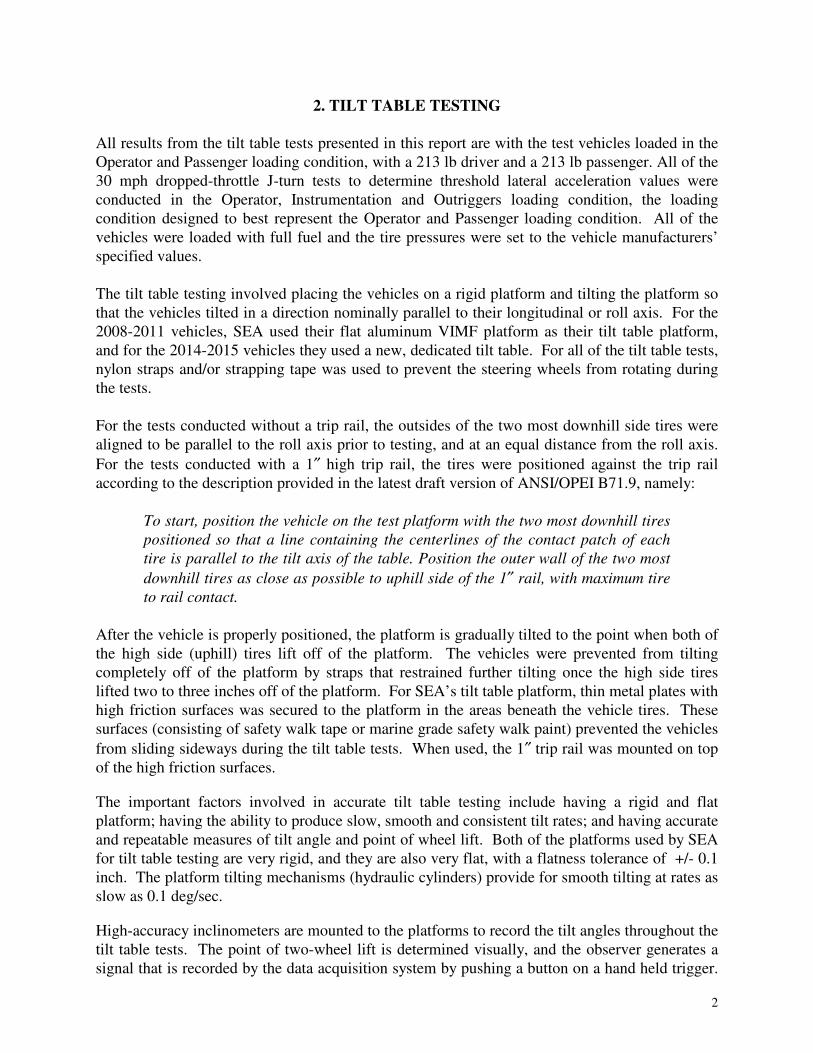
2. TILT TABLE TESTING All results from the tilt table tests presented in this report are with the test vehicles loaded in the Operator and Passenger loading condition, with a 213 lb driver and a 213 lb passenger. All of the 30 mph dropped-throttle J-turn tests to determine threshold lateral acceleration values were conducted in the Operator, Instrumentation and Outriggers loading condition, the loading condition designed to best represent the Operator and Passenger loading condition. All of the vehicles were loaded with full fuel and the tire pressures were set to the vehicle manufacturers’ specified values. The tilt table testing involved placing the vehicles on a rigid platform and tilting the platform so that the vehicles tilted in a direction nominally parallel to their longitudinal or roll axis. For the 2008-2011 vehicles, SEA used their flat aluminum VIMF platform as their tilt table platform, and for the 2014-2015 vehicles they used a new, dedicated tilt table. For all of the tilt table tests, nylon straps and/or strapping tape was used to prevent the steering wheels from rotating during the tests. For the tests conducted without a trip rail, the outsides of the two most downhill side tires were aligned to be parallel to the roll axis prior to testing, and at an equal distance from the roll axis. For the tests conducted with a 1″ high trip rail, the tires were positioned against the trip rail according to the description provided in the latest draft version of ANSI/OPEI B71.9, namely:
To start, position the vehicle on the test platform with the two most downhill tires positioned so that a line containing the centerlines of the contact patch of each tire is parallel to the tilt axis of the table. Position the outer wall of the two most downhill tires as close as possible to uphill side of the 1″ rail, with maximum tire to rail contact.
After the vehicle is properly positioned, the platform is gradually tilted to the point when both of the high side (uphill) tires lift off of the platform. The vehicles were prevented from tilting completely off of the platform by straps that restrained further tilting once the high side tires lifted two to three inches off of the platform. For SEA’s tilt table platform, thin metal plates with high friction surfaces was secured to the platform in the areas beneath the vehicle tires. These surfaces (consisting of safety walk tape or marine grade safety walk paint) prevented the vehicles from sliding sideways during the tilt table tests. When used, the 1″ trip rail was mounted on top of the high friction surfaces. The important factors involved in accurate tilt table testing include having a rigid and flat platform; having the ability to produce slow, smooth and consistent tilt rates; and having accurate and repeatable measures of tilt angle and point of wheel lift. Both of the platforms used by SEA for tilt table testing are very rigid, and they are also very flat, with a flatness tolerance of +/- 0.1 inch. The platform tilting mechanisms (hydraulic cylinders) provide for smooth tilting at rates as slow as 0.1 deg/sec. High-accuracy inclinometers are mounted to the platforms to record the tilt angles throughout the tilt table tests. The point of two-wheel lift is determined visually, and the observer generates a signal that is recorded by the data acquisition system by pushing a button on a hand held trigger.
3
Typically four to six tilts to two-wheel lift were conducted for each vehicle configuration tested. The tests with the closest three angles of two-wheel lift were selected and averaged together to determine the final angle of two-wheel lift. Based on repeatability evaluations conducted using a range of different vehicles, SEA believes that the repeatability of the measurements of two-wheel lift is within +/- 0.1 degrees. Driver’s side and passenger’s side tilts were performed. The angle at which two-wheel lift occurs is referred to as the Tilt Table Angle (TTA). In addition to measuring TTA, the tilt table test results provide a measure of the rollover resistance metric Tilt Table Ratio (TTR). TTR is the tangent of the TTA. TTR is given mathematically by:
( )TTATTR tan=
4
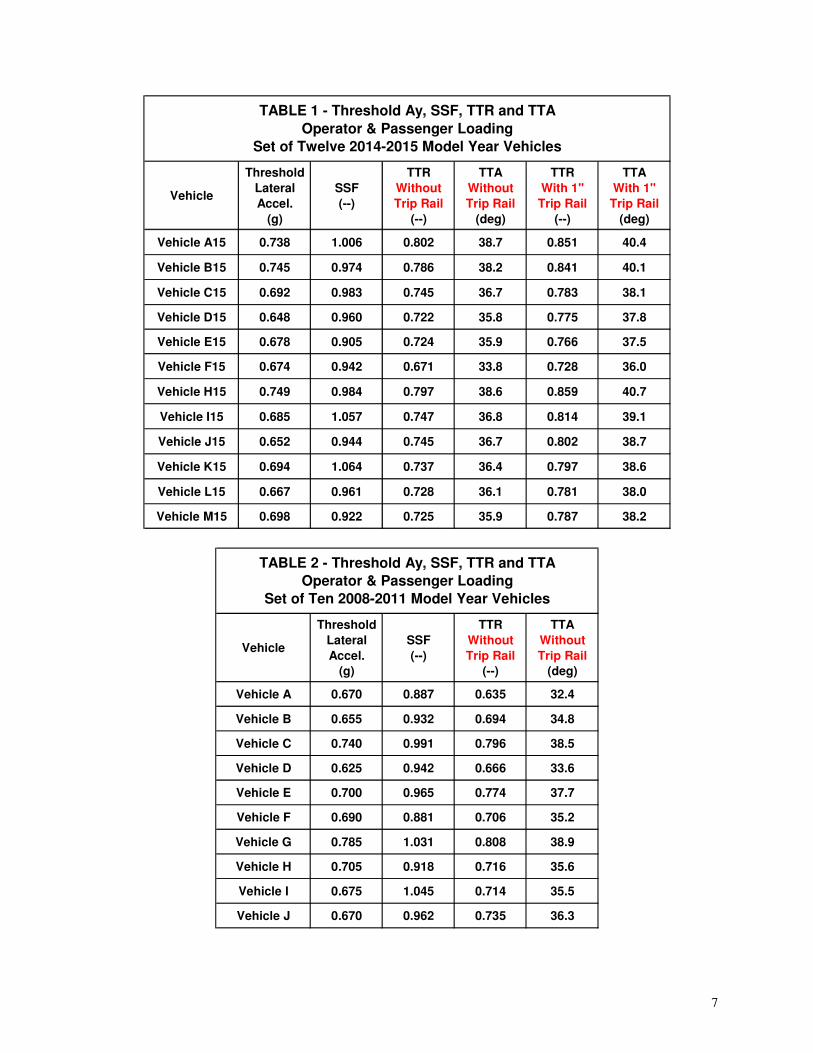
3. RESULTS The tilt table results for each of the 12 2014-2015 model year models are presented in the Appendix. There is one page of results for each vehicle containing results for tests done without a trip rail and with a 1″ trip rail. For each test condition, the first wheel to lift is noted, either: Front, Rear, or Simultaneous (both front and rear lift at the same time). TTA and TTR results from tests tipping to the left (Driver’s Side) and to the right (Passenger’s Side) are included. These are averages of three tilts to the left and three tilts to the right. Finally, the average of the left tilt and right tilt values are given as the Average Tilt Table Angle (TTA) and Average Tilt Table Ratio (TTR). All of this information for the individual 2008-2011 vehicles is presented in SEA’s 2011 reports to CPSC1,2. Table 1 contains a listing of the following lateral stability metrics for the 2014-2015 vehicles:
1. Threshold Lateral Acceleration (g): Peak lateral acceleration measured during 30 mph dropped-throttle J-turn tests with minimum steering input required to generate a two-wheel outcome during the maneuver. Threshold Lateral Accelerations were determined from tests conducted in the Operator, Instrumentation and Outriggers loading condition; the loading condition designed to best represent the Operator and Passenger loading condition.
2. SSF (--): Static Stability Factor measured in the Operator and Passenger loading condition, given by:
CG
AVEH2
TSSF
×=
where: TAVE is the Average Track Width, and HCG is the Vehicle CG Height.
3. TTR Without Trip Rail (--): Average Tilt Table Ratio without a trip rail.
4. TTA Without Trip Rail (deg): Average Tilt Table Angle without a trip rail.
5. TTR With 1″ Trip Rail (--): Average Tilt Table Ratio with a 1″ trip rail.
6. TTA With 1″ Trip Rail (deg): Average Tilt Table Angle with a 1″ trip rail. Table 1 shows that the use of a 1″ trip rail increases the TTA (and TTR) for all of the vehicles. For the vehicles tested both ways, the TTAs with a 1″ trip rail increase from a range of 1.4 deg to 2.4 deg, and the average increase for the 12 vehicles is 2.0 deg. Using a trip rail causes an increase in TTA for two main reasons. The first reason is that the trip rail at the outside edge of the tire moves the effective point of roll rotation outward, increasing the effective track width
1 Vehicle Characteristics Measurements of Recreational Off-Highway Vehicles, CPSC Contract CPSC-S-10-0014, SEA, Ltd. Report to CPSC, April 2011. http://www.cpsc.gov/library/foia/foia11/os/rov.pdf. 2 Vehicle Characteristics Measurements of Recreational Off-Highway Vehicles – Additional Results for Vehicle J, CPSC Contract CPSC-S-10-0014, SEA, Ltd. Report to CPSC, August 2011. http://www.cpsc.gov/PageFiles/93928/rovj.pdf.
5
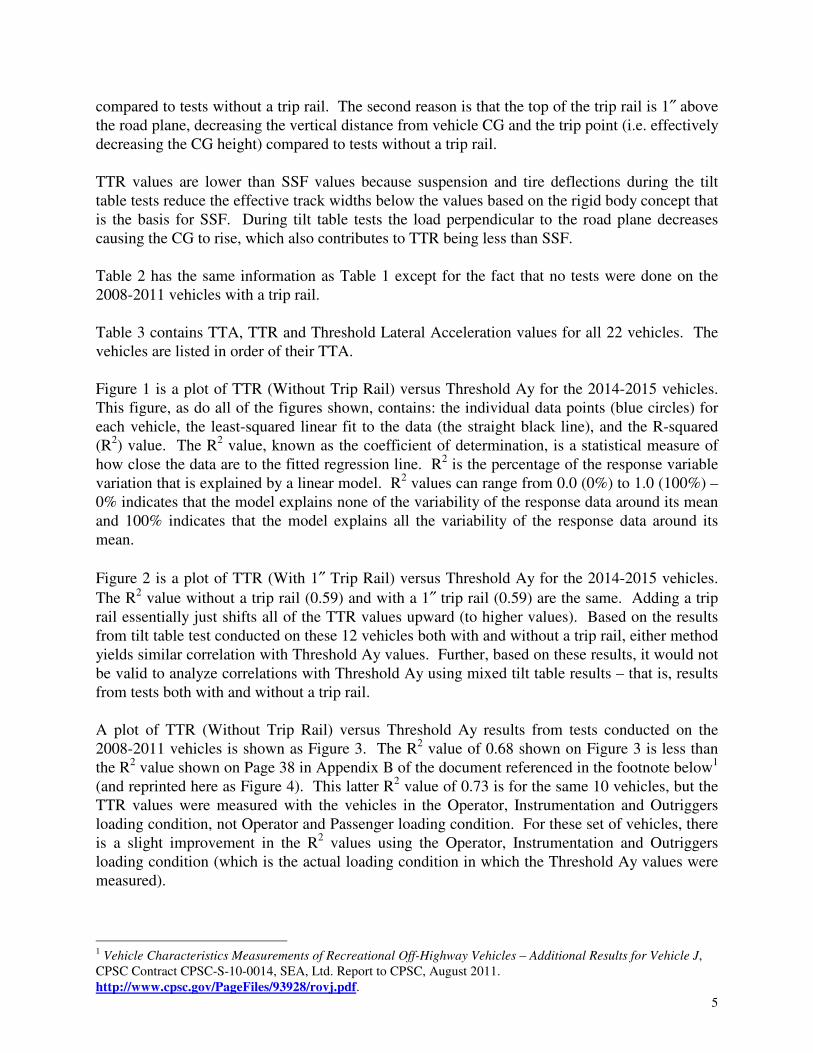
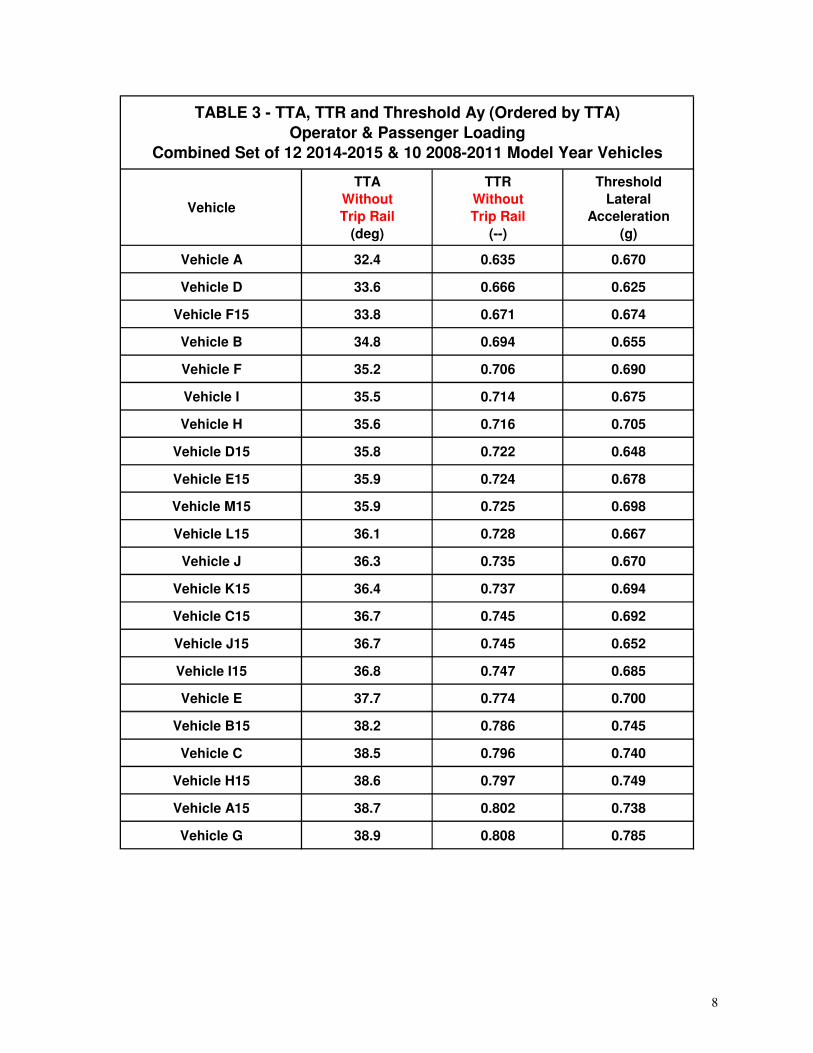
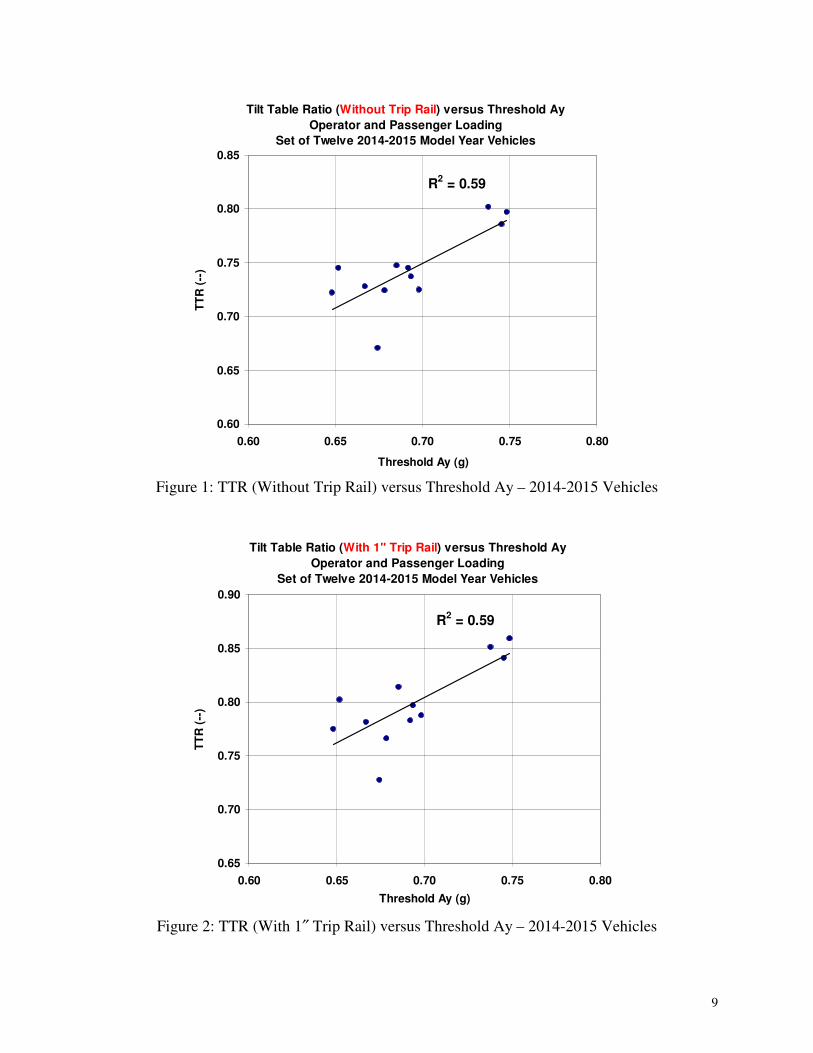
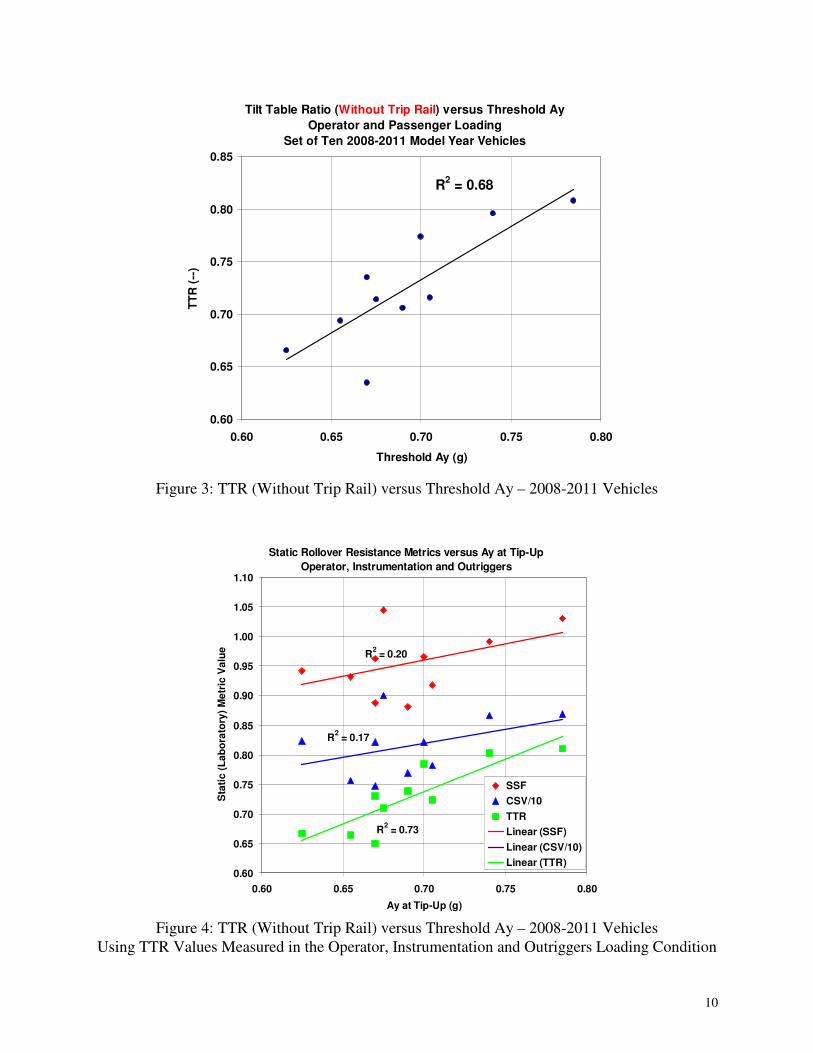
compared to tests without a trip rail. The second reason is that the top of the trip rail is 1″ above the road plane, decreasing the vertical distance from vehicle CG and the trip point (i.e. effectively decreasing the CG height) compared to tests without a trip rail. TTR values are lower than SSF values because suspension and tire deflections during the tilt table tests reduce the effective track widths below the values based on the rigid body concept that is the basis for SSF. During tilt table tests the load perpendicular to the road plane decreases causing the CG to rise, which also contributes to TTR being less than SSF. Table 2 has the same information as Table 1 except for the fact that no tests were done on the 2008-2011 vehicles with a trip rail. Table 3 contains TTA, TTR and Threshold Lateral Acceleration values for all 22 vehicles. The vehicles are listed in order of their TTA. Figure 1 is a plot of TTR (Without Trip Rail) versus Threshold Ay for the 2014-2015 vehicles. This figure, as do all of the figures shown, contains: the individual data points (blue circles) for each vehicle, the least-squared linear fit to the data (the straight black line), and the R-squared (R2) value. The R2 value, known as the coefficient of determination, is a statistical measure of how close the data are to the fitted regression line. R2 is the percentage of the response variable variation that is explained by a linear model. R2 values can range from 0.0 (0%) to 1.0 (100%) – 0% indicates that the model explains none of the variability of the response data around its mean and 100% indicates that the model explains all the variability of the response data around its mean. Figure 2 is a plot of TTR (With 1″ Trip Rail) versus Threshold Ay for the 2014-2015 vehicles. The R2 value without a trip rail (0.59) and with a 1″ trip rail (0.59) are the same. Adding a trip rail essentially just shifts all of the TTR values upward (to higher values). Based on the results from tilt table test conducted on these 12 vehicles both with and without a trip rail, either method yields similar correlation with Threshold Ay values. Further, based on these results, it would not be valid to analyze correlations with Threshold Ay using mixed tilt table results – that is, results from tests both with and without a trip rail. A plot of TTR (Without Trip Rail) versus Threshold Ay results from tests conducted on the 2008-2011 vehicles is shown as Figure 3. The R2 value of 0.68 shown on Figure 3 is less than the R2 value shown on Page 38 in Appendix B of the document referenced in the footnote below1 (and reprinted here as Figure 4). This latter R2 value of 0.73 is for the same 10 vehicles, but the TTR values were measured with the vehicles in the Operator, Instrumentation and Outriggers loading condition, not Operator and Passenger loading condition. For these set of vehicles, there is a slight improvement in the R2 values using the Operator, Instrumentation and Outriggers loading condition (which is the actual loading condition in which the Threshold Ay values were measured).
1 Vehicle Characteristics Measurements of Recreational Off-Highway Vehicles – Additional Results for Vehicle J, CPSC Contract CPSC-S-10-0014, SEA, Ltd. Report to CPSC, August 2011. http://www.cpsc.gov/PageFiles/93928/rovj.pdf.
6
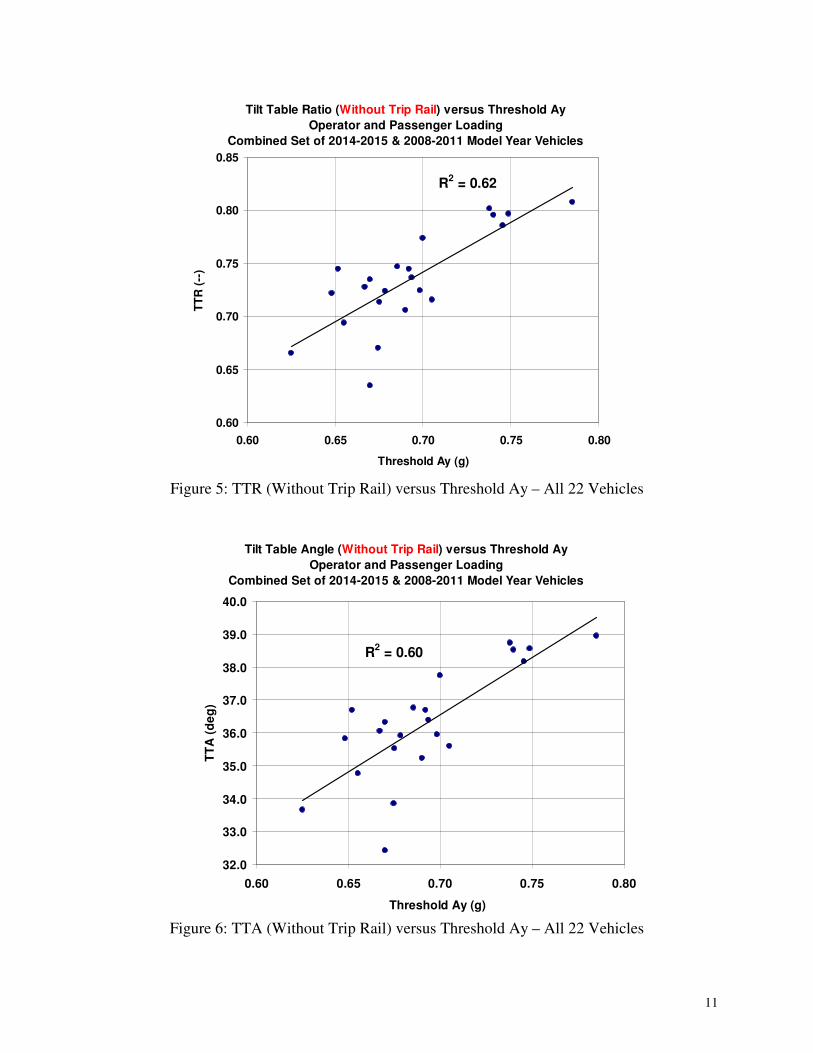
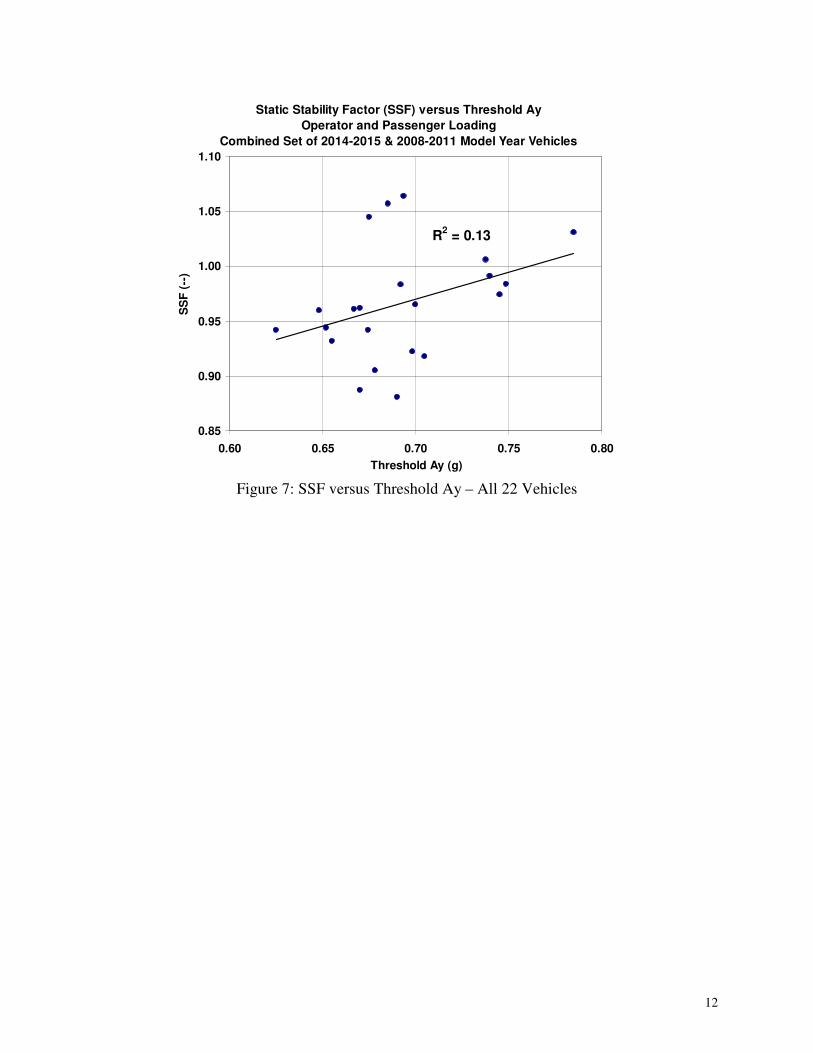
Figure 5 is a plot of TTR (Without Trip Rail) versus Threshold Ay for all 22 Vehicles. The R2 value using all 22 vehicles (0.62) falls between the R2 values for the 2014-2015 vehicles (0.59) and the 2008-2011 vehicles (0.68). Figure 6 is a plot of TTA (Without Trip Rail) versus Threshold Ay for all 22 Vehicles. The R2 value using TTA (0.60) is close to the R2 value using TTR (0.62). (This is because the tangent of an angle is fairly linear over the range of measured TTAs – between 32 and 40 degrees.) Figure 7 is a plot of SSF versus Threshold Ay for all 22 vehicles. The R2 value for SSF (0.13) is much less than the R2 values for TTR and TTA. Clearly, for the ROVs tested, SSF values do not correlate with Threshold Ay values as well as results from tilt table tests correlate with Threshold Ay values.
7
Vehicle
ThresholdLateralAccel.
(g)
SSF(--)
TTRWithoutTrip Rail
(--)
TTAWithoutTrip Rail
(deg)
TTRWith 1"Trip Rail
(--)
TTAWith 1"Trip Rail
(deg)
Vehicle A15 0.738 1.006 0.802 38.7 0.851 40.4
Vehicle B15 0.745 0.974 0.786 38.2 0.841 40.1
Vehicle C15 0.692 0.983 0.745 36.7 0.783 38.1
Vehicle D15 0.648 0.960 0.722 35.8 0.775 37.8
Vehicle E15 0.678 0.905 0.724 35.9 0.766 37.5
Vehicle F15 0.674 0.942 0.671 33.8 0.728 36.0
Vehicle H15 0.749 0.984 0.797 38.6 0.859 40.7
Vehicle I15 0.685 1.057 0.747 36.8 0.814 39.1
Vehicle J15 0.652 0.944 0.745 36.7 0.802 38.7
Vehicle K15 0.694 1.064 0.737 36.4 0.797 38.6
Vehicle L15 0.667 0.961 0.728 36.1 0.781 38.0
Vehicle M15 0.698 0.922 0.725 35.9 0.787 38.2
TABLE 1 - Threshold Ay, SSF, TTR and TTAOperator & Passenger Loading
Set of Twelve 2014-2015 Model Year Vehicles
Vehicle
ThresholdLateralAccel.
(g)
SSF(--)
TTRWithoutTrip Rail
(--)
TTAWithoutTrip Rail
(deg)
Vehicle A 0.670 0.887 0.635 32.4
Vehicle B 0.655 0.932 0.694 34.8
Vehicle C 0.740 0.991 0.796 38.5
Vehicle D 0.625 0.942 0.666 33.6
Vehicle E 0.700 0.965 0.774 37.7
Vehicle F 0.690 0.881 0.706 35.2
Vehicle G 0.785 1.031 0.808 38.9
Vehicle H 0.705 0.918 0.716 35.6
Vehicle I 0.675 1.045 0.714 35.5
Vehicle J 0.670 0.962 0.735 36.3
TABLE 2 - Threshold Ay, SSF, TTR and TTAOperator & Passenger Loading
Set of Ten 2008-2011 Model Year Vehicles
8
Vehicle
TTAWithoutTrip Rail
(deg)
TTRWithoutTrip Rail
(--)
ThresholdLateral
Acceleration(g)
Vehicle A 32.4 0.635 0.670
Vehicle D 33.6 0.666 0.625
Vehicle F15 33.8 0.671 0.674
Vehicle B 34.8 0.694 0.655
Vehicle F 35.2 0.706 0.690
Vehicle I 35.5 0.714 0.675
Vehicle H 35.6 0.716 0.705
Vehicle D15 35.8 0.722 0.648
Vehicle E15 35.9 0.724 0.678
Vehicle M15 35.9 0.725 0.698
Vehicle L15 36.1 0.728 0.667
Vehicle J 36.3 0.735 0.670
Vehicle K15 36.4 0.737 0.694
Vehicle C15 36.7 0.745 0.692
Vehicle J15 36.7 0.745 0.652
Vehicle I15 36.8 0.747 0.685
Vehicle E 37.7 0.774 0.700
Vehicle B15 38.2 0.786 0.745
Vehicle C 38.5 0.796 0.740
Vehicle H15 38.6 0.797 0.749
Vehicle A15 38.7 0.802 0.738
Vehicle G 38.9 0.808 0.785
TABLE 3 - TTA, TTR and Threshold Ay (Ordered by TTA)Operator & Passenger Loading
Combined Set of 12 2014-2015 & 10 2008-2011 Model Year Vehicles
9
Tilt Table Ratio (Without Trip Rail) versus Threshold AyOperator and Passenger Loading
Set of Twelve 2014-2015 Model Year Vehicles
R2 = 0.59
0.60
0.65
0.70
0.75
0.80
0.85
0.60 0.65 0.70 0.75 0.80
Threshold Ay (g)
TTR
(--
)
Figure 1: TTR (Without Trip Rail) versus Threshold Ay – 2014-2015 Vehicles
Tilt Table Ratio (With 1" Trip Rail) versus Threshold AyOperator and Passenger Loading
Set of Twelve 2014-2015 Model Year Vehicles
R2 = 0.59
0.65
0.70
0.75
0.80
0.85
0.90
0.60 0.65 0.70 0.75 0.80Threshold Ay (g)
TTR
(--
)
Figure 2: TTR (With 1″ Trip Rail) versus Threshold Ay – 2014-2015 Vehicles
10
Tilt Table Ratio (Without Trip Rail) versus Threshold AyOperator and Passenger Loading
Set of Ten 2008-2011 Model Year Vehicles
R2 = 0.68
0.60
0.65
0.70
0.75
0.80
0.85
0.60 0.65 0.70 0.75 0.80
Threshold Ay (g)
TTR
(--
)
Figure 3: TTR (Without Trip Rail) versus Threshold Ay – 2008-2011 Vehicles
Static Rollover Resistance Metrics versus Ay at Tip-UpOperator, Instrumentation and Outriggers
R2 = 0.20
R2 = 0.17
R2 = 0.73
0.60
0.65
0.70
0.75
0.80
0.85
0.90
0.95
1.00
1.05
1.10
0.60 0.65 0.70 0.75 0.80
Ay at Tip-Up (g)
Sta
tic (L
abor
ator
y) M
etri
c V
alue
SSFCSV/10TTRLinear (SSF)Linear (CSV/10)Linear (TTR)
Figure 4: TTR (Without Trip Rail) versus Threshold Ay – 2008-2011 Vehicles
Using TTR Values Measured in the Operator, Instrumentation and Outriggers Loading Condition
11
Tilt Table Ratio (Without Trip Rail) versus Threshold AyOperator and Passenger Loading
Combined Set of 2014-2015 & 2008-2011 Model Year Vehicles
R2 = 0.62
0.60
0.65
0.70
0.75
0.80
0.85
0.60 0.65 0.70 0.75 0.80
Threshold Ay (g)
TTR
(--
)
Figure 5: TTR (Without Trip Rail) versus Threshold Ay – All 22 Vehicles
Tilt Table Angle (Without Trip Rail) versus Threshold AyOperator and Passenger Loading
Combined Set of 2014-2015 & 2008-2011 Model Year Vehicles
R2 = 0.60
32.0
33.0
34.0
35.0
36.0
37.0
38.0
39.0
40.0
0.60 0.65 0.70 0.75 0.80
Threshold Ay (g)
TTA
(deg
)
Figure 6: TTA (Without Trip Rail) versus Threshold Ay – All 22 Vehicles
12
Static Stability Factor (SSF) versus Threshold AyOperator and Passenger Loading
Combined Set of 2014-2015 & 2008-2011 Model Year Vehicles
R2 = 0.13
0.85
0.90
0.95
1.00
1.05
1.10
0.60 0.65 0.70 0.75 0.80Threshold Ay (g)
SS
F (-
-)
Figure 7: SSF versus Threshold Ay – All 22 Vehicles

Vehicle A15
Operator&
PassengerWithout Trip Rail
Operator&
PassengerWith 1" Trip Rail
Tilt Table: Direction Driver's Side Driver's Side
Tilt Table: First Wheel Lift Rear Rear
Tilt Table Angle (deg) 39.3 41.2
Tilt Table Ratio (TTR) 0.817 0.875
Tilt Table: Direction Passenger's Side Passenger's Side
Tilt Table: First Wheel Lift Rear Rear
Tilt Table Angle (deg) 38.2 39.6
Tilt Table Ratio (TTR) 0.787 0.828
Average Tilt Table Angle (deg) 38.7 40.4
Average Tilt Table Ratio (TTR) 0.802 0.851
CPSC Test Results - Tilt Table Test Results Appendix Page #1

Vehicle B15
Operator&
PassengerWithout Trip Rail
Operator&
PassengerWith 1" Trip Rail
Tilt Table: Direction Driver's Side Driver's Side
Tilt Table: First Wheel Lift Front Front
Tilt Table Angle (deg) 38.6 40.6
Tilt Table Ratio (TTR) 0.799 0.856
Tilt Table: Direction Passenger's Side Passenger's Side
Tilt Table: First Wheel Lift Front Front
Tilt Table Angle (deg) 37.7 39.5
Tilt Table Ratio (TTR) 0.773 0.826
Average Tilt Table Angle (deg) 38.2 40.1
Average Tilt Table Ratio (TTR) 0.786 0.841
CPSC Test Results - Tilt Table Test Results Appendix Page #2

Vehicle C15
Operator&
PassengerWithout Trip Rail
Operator&
PassengerWith 1" Trip Rail
Tilt Table: Direction Driver's Side Driver's Side
Tilt Table: First Wheel Lift Rear Rear
Tilt Table Angle (deg) 37.6 39.2
Tilt Table Ratio (TTR) 0.770 0.814
Tilt Table: Direction Passenger's Side Passenger's Side
Tilt Table: First Wheel Lift Rear Rear
Tilt Table Angle (deg) 35.8 37.0
Tilt Table Ratio (TTR) 0.720 0.752
Average Tilt Table Angle (deg) 36.7 38.1
Average Tilt Table Ratio (TTR) 0.745 0.783
CPSC Test Results - Tilt Table Test Results Appendix Page #3

Vehicle D15
Operator&
PassengerWithout Trip Rail
Operator&
PassengerWith 1" Trip Rail
Tilt Table: Direction Driver's Side Driver's Side
Tilt Table: First Wheel Lift Rear Rear
Tilt Table Angle (deg) 36.4 38.3
Tilt Table Ratio (TTR) 0.738 0.789
Tilt Table: Direction Passenger's Side Passenger's Side
Tilt Table: First Wheel Lift Rear Rear
Tilt Table Angle (deg) 35.2 37.3
Tilt Table Ratio (TTR) 0.706 0.760
Average Tilt Table Angle (deg) 35.8 37.8
Average Tilt Table Ratio (TTR) 0.722 0.775
CPSC Test Results - Tilt Table Test Results Appendix Page #4

Vehicle E15
Operator&
PassengerWithout Trip Rail
Operator&
PassengerWith 1" Trip Rail
Tilt Table: Direction Driver's Side Driver's Side
Tilt Table: First Wheel Lift Rear Rear
Tilt Table Angle (deg) 36.0 37.6
Tilt Table Ratio (TTR) 0.727 0.771
Tilt Table: Direction Passenger's Side Passenger's Side
Tilt Table: First Wheel Lift Rear Rear
Tilt Table Angle (deg) 35.8 37.3
Tilt Table Ratio (TTR) 0.720 0.761
Average Tilt Table Angle (deg) 35.9 37.5
Average Tilt Table Ratio (TTR) 0.724 0.766
CPSC Test Results - Tilt Table Test Results Appendix Page #5
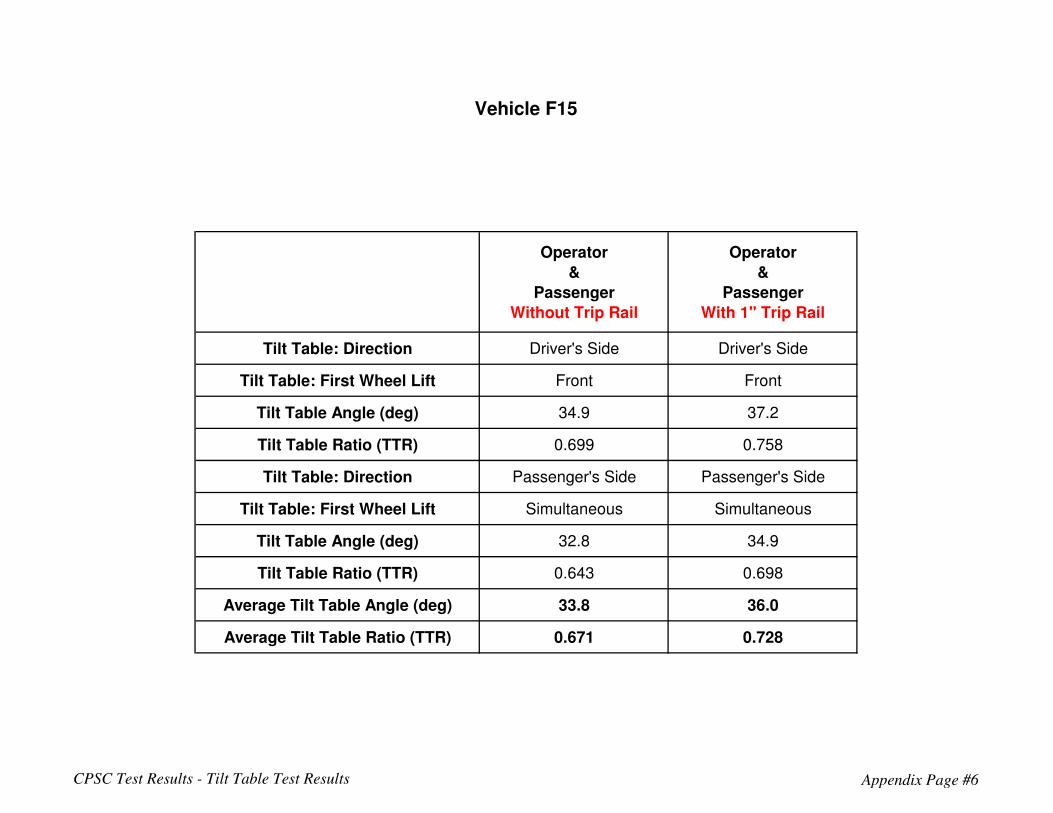
Vehicle F15
Operator&
PassengerWithout Trip Rail
Operator&
PassengerWith 1" Trip Rail
Tilt Table: Direction Driver's Side Driver's Side
Tilt Table: First Wheel Lift Front Front
Tilt Table Angle (deg) 34.9 37.2
Tilt Table Ratio (TTR) 0.699 0.758
Tilt Table: Direction Passenger's Side Passenger's Side
Tilt Table: First Wheel Lift Simultaneous Simultaneous
Tilt Table Angle (deg) 32.8 34.9
Tilt Table Ratio (TTR) 0.643 0.698
Average Tilt Table Angle (deg) 33.8 36.0
Average Tilt Table Ratio (TTR) 0.671 0.728
CPSC Test Results - Tilt Table Test Results Appendix Page #6

Vehicle H15
Operator&
PassengerWithout Trip Rail
Operator&
PassengerWith 1" Trip Rail
Tilt Table: Direction Driver's Side Driver's Side
Tilt Table: First Wheel Lift Simultaneous Simultaneous
Tilt Table Angle (deg) 38.3 40.3
Tilt Table Ratio (TTR) 0.790 0.849
Tilt Table: Direction Passenger's Side Passenger's Side
Tilt Table: First Wheel Lift Simultaneous Simultaneous
Tilt Table Angle (deg) 38.8 41.0
Tilt Table Ratio (TTR) 0.804 0.870
Average Tilt Table Angle (deg) 38.6 40.7
Average Tilt Table Ratio (TTR) 0.797 0.859
CPSC Test Results - Tilt Table Test Results Appendix Page #7
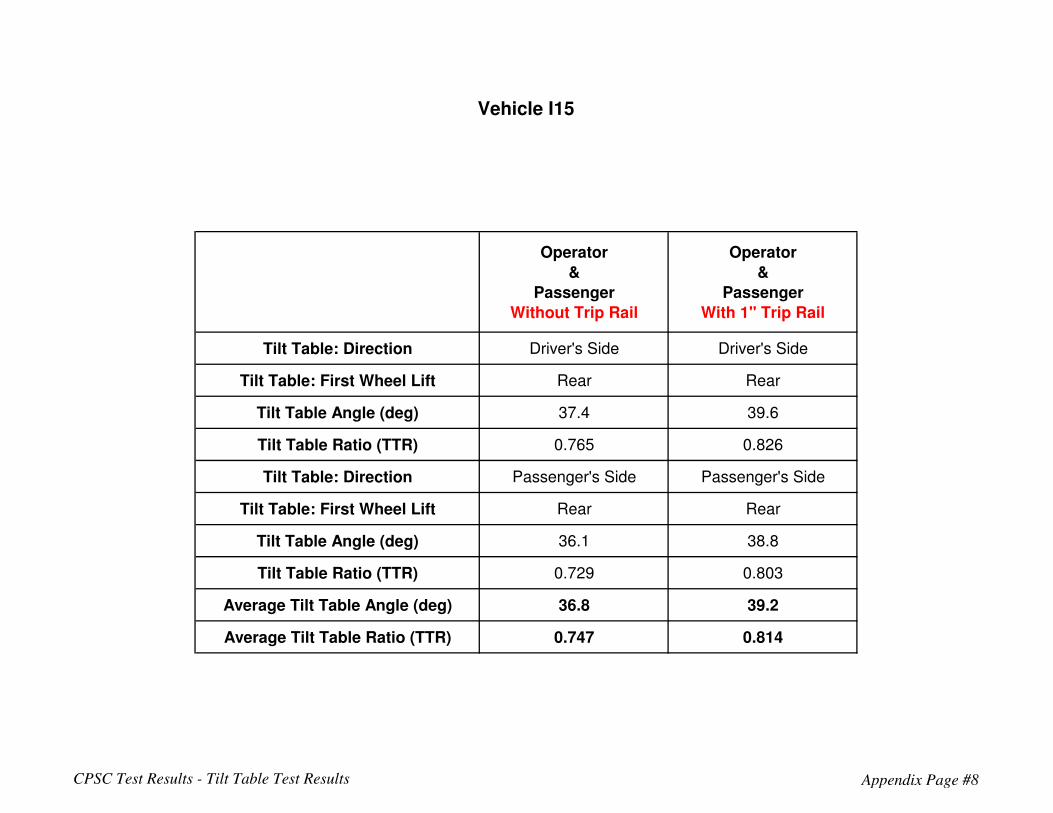
Vehicle I15
Operator&
PassengerWithout Trip Rail
Operator&
PassengerWith 1" Trip Rail
Tilt Table: Direction Driver's Side Driver's Side
Tilt Table: First Wheel Lift Rear Rear
Tilt Table Angle (deg) 37.4 39.6
Tilt Table Ratio (TTR) 0.765 0.826
Tilt Table: Direction Passenger's Side Passenger's Side
Tilt Table: First Wheel Lift Rear Rear
Tilt Table Angle (deg) 36.1 38.8
Tilt Table Ratio (TTR) 0.729 0.803
Average Tilt Table Angle (deg) 36.8 39.2
Average Tilt Table Ratio (TTR) 0.747 0.814
CPSC Test Results - Tilt Table Test Results Appendix Page #8

Vehicle J15
Operator&
PassengerWithout Trip Rail
Operator&
PassengerWith 1" Trip Rail
Tilt Table: Direction Driver's Side Driver's Side
Tilt Table: First Wheel Lift Rear Rear
Tilt Table Angle (deg) 37.3 39.6
Tilt Table Ratio (TTR) 0.760 0.828
Tilt Table: Direction Passenger's Side Passenger's Side
Tilt Table: First Wheel Lift Rear Rear
Tilt Table Angle (deg) 36.1 37.8
Tilt Table Ratio (TTR) 0.730 0.777
Average Tilt Table Angle (deg) 36.7 38.7
Average Tilt Table Ratio (TTR) 0.745 0.802
CPSC Test Results - Tilt Table Test Results Appendix Page #9

Vehicle K15
Operator&
PassengerWithout Trip Rail
Operator&
PassengerWith 1" Trip Rail
Tilt Table: Direction Driver's Side Driver's Side
Tilt Table: First Wheel Lift Rear Rear
Tilt Table Angle (deg) 37.1 39.2
Tilt Table Ratio (TTR) 0.757 0.816
Tilt Table: Direction Passenger's Side Passenger's Side
Tilt Table: First Wheel Lift Rear Rear
Tilt Table Angle (deg) 35.7 37.9
Tilt Table Ratio (TTR) 0.718 0.778
Average Tilt Table Angle (deg) 36.4 38.6
Average Tilt Table Ratio (TTR) 0.737 0.797
CPSC Test Results - Tilt Table Test Results Appendix Page #10

Vehicle L15
Operator&
PassengerWithout Trip Rail
Operator&
PassengerWith 1" Trip Rail
Tilt Table: Direction Driver's Side Driver's Side
Tilt Table: First Wheel Lift Rear Rear
Tilt Table Angle (deg) 36.4 38.3
Tilt Table Ratio (TTR) 0.738 0.788
Tilt Table: Direction Passenger's Side Passenger's Side
Tilt Table: First Wheel Lift Rear Rear
Tilt Table Angle (deg) 35.7 37.7
Tilt Table Ratio (TTR) 0.718 0.774
Average Tilt Table Angle (deg) 36.1 38.0
Average Tilt Table Ratio (TTR) 0.728 0.781
CPSC Test Results - Tilt Table Test Results Appendix Page #11

Vehicle M15
Operator&
PassengerWithout Trip Rail
Operator&
PassengerWith 1" Trip Rail
Tilt Table: Direction Driver's Side Driver's Side
Tilt Table: First Wheel Lift Rear Rear
Tilt Table Angle (deg) 36.7 38.6
Tilt Table Ratio (TTR) 0.745 0.799
Tilt Table: Direction Passenger's Side Passenger's Side
Tilt Table: First Wheel Lift Rear Rear
Tilt Table Angle (deg) 35.2 37.8
Tilt Table Ratio (TTR) 0.705 0.776
Average Tilt Table Angle (deg) 35.9 38.2
Average Tilt Table Ratio (TTR) 0.725 0.787
CPSC Test Results - Tilt Table Test Results Appendix Page #12