Embed Size (px)
Citation preview

Table of Contents
UNITED STATES SECURITIES AND EXCHANGE COMMISSIONWashington, D.C. 20549
Form 10-Q(Mark One)
☒ Quarterly Report Pursuant to Section 13 or 15(d) of the Securities and Exchange Act of 1934
For the Quarterly Period Ended March 31, 2018.
or
☐ Transition Report Pursuant to Section 13 or 15(d) of the Securities Exchange Act of 1934For the Transition Period from to
Commission File Number 001-37584
CPI Card Group Inc.(Exact name of the registrant as specified in its charter)
Delaware 26-0344657(State or other jurisdiction of incorporation or organization) (I.R.S. employer identification no.)
10026 West San Juan WayLittleton, CO 80127
( Address of principal executive offices ) ( Zip Code )(303) 973-9311
(Registrant’s telephone number, including area code)
Indicate by check mark whether the registrant (1) has filed all reports required to be filed by Section 13 or 15(d) of the Securities ExchangeAct of 1934 during the preceding 12 months (or for such shorter period that the registrant was required to file such reports), and (2) has beensubject to such filing requirements for the past 90 days. Yes☒ No ☐ Indicate by check mark whether the registrant has submitted electronically and posted on its corporate Web site, if any, every InteractiveData File required to be submitted and posted pursuant to Rule 405 of Regulation S-T (§232.405 of this chapter) during the preceding 12months (or for such shorter period that the registrant was required to submit and post such files). Yes☒ No☐ Indicate by check mark whether the registrant is a large accelerated filer, an accelerated filer, a non-accelerated filer, a smaller reportingcompany, or an emerging growth company. See the definitions of “large accelerated filer,” “accelerated filer”, “smaller reporting company”and “emerging growth company” in Rule 12b-2 of the Exchange Act.
Large accelerated filer ☐ Accelerated filer ☒
Non-accelerated filer ☐ Smaller reporting company ☐(Do not check if a smaller reporting company) Emerging growth company ☒
If an emerging growth company, indicate by check mark if the registrant has elected not to use the extended transition period for complyingwith any new or revised financial accounting standards provided pursuant to Section 13(a) of the Exchange Act. ☒ Indicate by check mark whether the registrant is a shell company (as defined in Rule 12b-2 of the Exchange Act).Yes☐ No☒ Number of shares of Common Stock, $0.001 par value, outstanding as of April 23, 2018: 11,134,71 4

Table of Contents
Table of Content s
Page Part I — Financial Information Item 1 — Financial Statements (Unaudited) 3 Item 2 — Management’s Discussion and Analysis of Financial Condition and Results of Operations 22 Item 3 — Quantitative and Qualitative Disclosures About Market Risk 29 Item 4 — Controls and Procedures 30 Part II — Other Information
Item 1 — Legal Proceedings 30 Item 1A — Risk Factors 32 Item 2 — Unregistered Sales of Equity Securities and Use of Proceeds 32 Item 6 — Exhibits 33 Signatures 34
2

Table of Contents
Item 1. Financial Statement s
CPI Card Group Inc. and SubsidiariesCondensed Consolidated Balance Sheets
(Dollars in Thousands, Except Share and Per Share Amounts)
March 31, December 31, 2018 2017 (Unaudited) Assets Current assets:
Cash and cash equivalents $ 20,196 $ 23,205Accounts receivable, net 42,277 37,537Inventories 8,603 16,237Prepaid expenses and other current assets 4,261 3,960Income taxes receivable 8,926 8,435Total current assets 84,263 89,374
Plant, equipment and leasehold improvements, net 50,244 49,300Intangible assets, net 40,303 41,472Goodwill 53,859 53,611Other assets 234 248
Total assets $ 228,903 $ 234,005Liabilities and stockholders’ deficit Current liabilities:
Accounts payable $ 15,344 $ 16,545Accrued expenses 14,972 13,820Income taxes payable 678 —Deferred revenue and customer deposits 403 4,177Total current liabilities 31,397 34,542
Long-term debt 304,355 303,869Deferred income taxes 11,209 12,286Other long-term liabilities 5,361 2,882 Total liabilities 352,322 353,579Commitments and contingencies (Note 12) Stockholders’ deficit:
Common stock; $0.001 par value—100,000,000 shares authorized; 11,134,714 shares issuedand outstanding at March 31, 2018 and December 31, 2017 11 11Capital deficiency (112,740) (113,081)Accumulated loss (5,861) (1,366)Accumulated other comprehensive loss (4,829) (5,138)
Total stockholders’ deficit (123,419) (119,574) Total liabilities and stockholders’ deficit $ 228,903 $ 234,005
See accompanying notes to condensed consolidated financial statements
3

Table of Contents
CPI Card Group Inc. and SubsidiariesCondensed Consolidated Statements of Operations and Comprehensive Loss
(Dollars in Thousands, Except Share and Per Share Amounts)(Unaudited)
Three Months Ended March 31, 2018 2017Net sales: Products $ 27,560 $ 29,764Services 31,510 26,244Total net sales 59,070 56,008
Cost of sales: Products (exclusive of depreciation and amortization shown below) 19,082 19,688Services (exclusive of depreciation and amortization shown below) 21,916 17,441Depreciation and amortization 3,630 2,784Total cost of sales 44,628 39,913
Gross profit 14,442 16,095Operating expenses: Selling, general and administrative (exclusive of depreciation and amortization shownbelow) 16,815 16,155Depreciation and amortization 1,595 1,749Total operating expenses 18,410 17,904
Loss from operations (3,968) (1,809)Other expense, net: Interest, net (5,519) (5,062)Foreign currency gain 207 73Other income, net 4 1Total other expense, net (5,308) (4,988)
Loss before income taxes (9,276) (6,797)Income tax benefit 1,985 2,291Net loss $ (7,291) $ (4,506)
Basic and diluted loss per share: $ (0.65) $ (0.40)Weighted-average shares outstanding: Basic 11,134,714 11,084,875Diluted 11,134,714 11,084,875
Dividends declared per common share $ — $ 0.225
Comprehensive loss Net loss $ (7,291) $ (4,506)Currency translation adjustment 309 201Total comprehensive loss $ (6,982) $ (4,305)
See accompanying notes to condensed consolidated financial statements
4
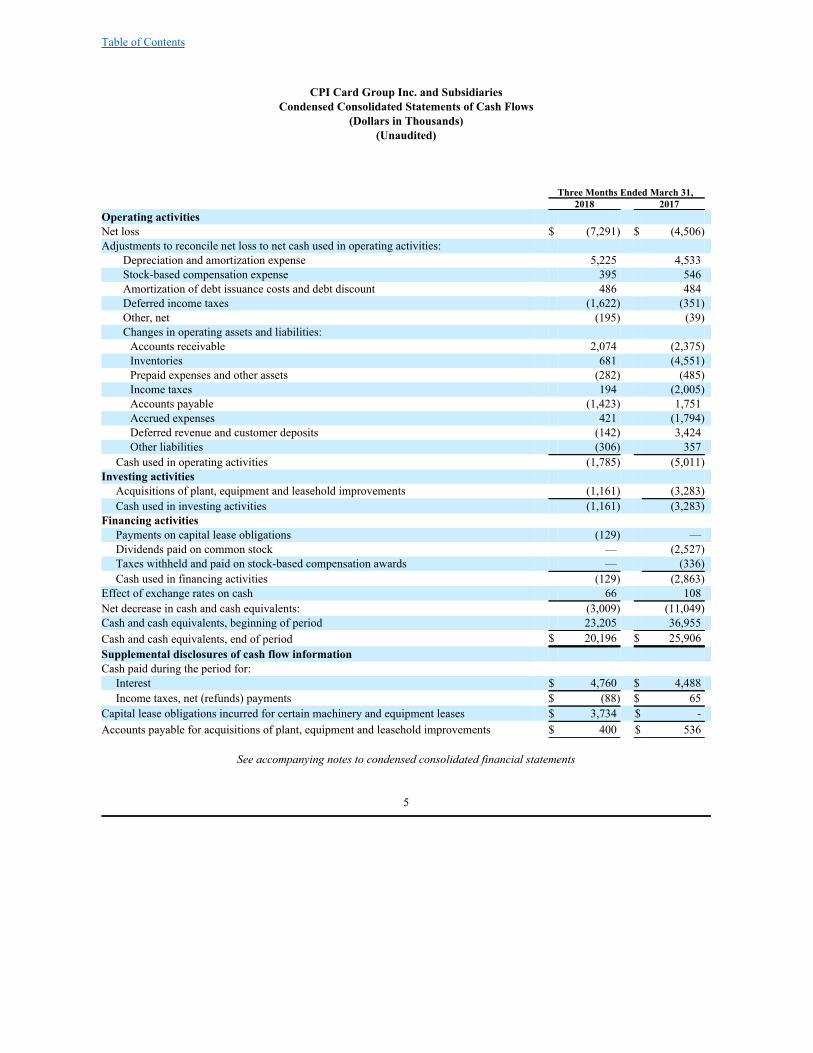
Table of Contents
CPI Card Group Inc. and SubsidiariesCondensed Consolidated Statements of Cash Flows
(Dollars in Thousands)(Unaudited)
Three Months Ended March 31, 2018 2017 Operating activities Net loss $ (7,291) $ (4,506) Adjustments to reconcile net loss to net cash used in operating activities:
Depreciation and amortization expense 5,225 4,533 Stock-based compensation expense 395 546 Amortization of debt issuance costs and debt discount 486 484 Deferred income taxes (1,622) (351) Other, net (195) (39) Changes in operating assets and liabilities: Accounts receivable 2,074 (2,375) Inventories 681 (4,551) Prepaid expenses and other assets (282) (485) Income taxes 194 (2,005) Accounts payable (1,423) 1,751 Accrued expenses 421 (1,794) Deferred revenue and customer deposits (142) 3,424 Other liabilities (306) 357
Cash used in operating activities (1,785) (5,011) Investing activities
Acquisitions of plant, equipment and leasehold improvements (1,161) (3,283) Cash used in investing activities (1,161) (3,283)
Financing activities Payments on capital lease obligations (129) — Dividends paid on common stock — (2,527) Taxes withheld and paid on stock-based compensation awards — (336) Cash used in financing activities (129) (2,863)
Effect of exchange rates on cash 66 108 Net decrease in cash and cash equivalents: (3,009) (11,049) Cash and cash equivalents, beginning of period 23,205 36,955 Cash and cash equivalents, end of period $ 20,196 $ 25,906 Supplemental disclosures of cash flow information Cash paid during the period for:
Interest $ 4,760 $ 4,488 Income taxes, net (refunds) payments $ (88) $ 65
Capital lease obligations incurred for certain machinery and equipment leases $ 3,734 $ - Accounts payable for acquisitions of plant, equipment and leasehold improvements $ 400 $ 536
See accompanying notes to condensed consolidated financial statements
5

Table of Contents
CPI Card Group Inc. and SubsidiariesNotes to Condensed Consolidated Financial Statements
(Dollars in Thousands, Except Share and Per Share Amounts or as Otherwise Indicated)(Unaudited)
1. Business Overview and Summary of Significant Accounting Policies Business Overview
CPI Card Group Inc. (which, together with its subsidiaries, is referred to herein as “CPI” or the “Company”) is engagedin the design, production, data personalization, packaging and fulfillment of Financial Payment Cards which the Company definesas credit cards, debit cards and prepaid debit cards issued on the networks of the Payment Card Brands (Visa, MasterCard,American Express, Discover and Interac (in Canada)) in the United States and Canada. The Company also is engaged in thedesign, production, data personalization, packaging and fulfillment of retail gift and loyalty cards (primarily in Europe andCanada).
As a producer and provider of services for Financial Payment Cards, each of the Company’s secure facilities must becertified by one or more of the Payment Card Brands and is therefore subject to specific requirements and conditions.Noncompliance with these requirements would prohibit the individual facilities of the Company from producing FinancialPayment Cards for these entities’ payment card issuers.
During February 2018, the Company made the decision to consolidate three personalization operations in the United
States into two facilities to better enable the Company to optimize operations and achieve market-leading quality and service witha cost-competitive business model. In conjunction with this decision, the Company accelerated the depreciation of certain relatedassets, which totaled $800 for the three months ended March 31, 2018, and recorded a severance charge of $329 for this sametime period. Basis of Presentation
Certain information and footnote disclosures normally included in financial statements prepared in accordance withaccounting principles generally accepted in the United States of America (“GAAP”) have been condensed or omitted pursuant toForm 10-Q and Article 10 of Regulation S-X. In the opinion of management, these financial statements reflect all adjustments(consisting of normal recurring adjustments) considered necessary for the fair statement of the results of the interim periodspresented. The Condensed Consolidated Balance Sheet as of December 31, 2017 is derived from the audited financial statementsas of that date. The accompanying condensed consolidated financial statements should be read in conjunction with theconsolidated financial statements and related notes included in the Company’s Annual Report on Form 10-K for the year endedDecember 31, 2017.
On December 20, 2017, the Company effected a one-for-five reverse stock split of its common stock, whereby each lot
of five shares of common stock issued and outstanding immediately prior to the reverse stock split was converted into and becameone share of common stock. Share and per share amounts reflect the one-for-five reverse stock split for all periods presented.
Use of Estimates
Management uses estimates and assumptions relating to the reporting of assets and liabilities in its preparation of thecondensed consolidated financial statements. Significant items subject to such estimates and assumptions include the carryingamount of property and equipment, goodwill and intangible assets, valuation allowances for inventories and deferred tax assets,debt, revenue recognized for period-end work in process and stock-based compensation expense. Actual results could differ fromthose estimates. Machinery and Equipment Financing
The Company leases certain machinery and equipment under capital leases. The assets and liabilities under these capitalleases are recorded at the lower of the present value of the minimum lease payments or the fair value of the asset. Once ready fortheir intended use, the assets are depreciated over the lower of their related lease term or their estimated productive lives.
6

Table of Contents
Adoption of New Accounting Standard As of January 1, 2018, the Company adopted Accounting Standards Update (“ASU”) 2014-09, Revenue from Contracts withCustomers , as amended (“ASU 2014-09”), which requires an entity to recognize revenue to depict the transfer of promised goodsor services to customers in an amount that reflects the consideration to which the entity expects to be entitled in exchange forthose goods or services. ASU 2014-09 also requires an entity to disclose sufficient quantitative and qualitative information toenable users of financial statements to understand the nature, amount, timing and uncertainty of revenue and cash flows arisingfrom contracts with customers. The Company adopted ASU 2014-09 as of January 1, 2018 to all its contracts using the modifiedretrospective method and recognized the cumulative effect of adoption as an adjustment to the opening balance of “Accumulatedloss” on the Condensed Consolidated Balance Sheet. Under the new guidance, the Company recognizes certain performanceobligations over time as the goods are produced, since those products provide value to only a specified customer, have noalternative use, and the Company has the right to payment for work completed on such items. This accelerates the timing ofrevenue recognition for these arrangements, as revenue will be recognized as goods are produced rather than upon shipment ordelivery of goods. In addition to accelerating the timing of recording revenue, the Company has recorded decreases in deferredrevenue, work in process and finished goods inventories, and an increase to accounts receivable. The comparative financialinformation has not been restated and continues to be reported under the accounting standards in effect for those periods.
See Note 2 “Revenue” for revenue recognition timing and methodology under ASU 2014-09.
The cumulative effects of the adjustments made to the Company’s January 1, 2018 Condensed Consolidated Balance Sheet uponadoption of ASU 2014-09 were as follows:
December 31, Adoption January 1, Balance Sheet 2017 Adjustments 2018 Assets: Accounts receivable, net $ 37,537 $ 6,708 $ 44,245 Inventories 16,237 (7,003) 9,234 Liabilities: Deferred revenue and customer deposits 4,177 (3,659) 518 Deferred income taxes 12,286 540 12,826 Stockholders' deficit: Accumulated (loss) earnings (1,366) 2,824 1,458 In accordance with ASU 2014-09, the impact on the Company’s Condensed Consolidated Balance Sheet and Statement ofOperations and Comprehensive Loss was as follows:
Balances As Reported Without March 31, Adoption of Balance Sheet 2018 Adjustments ASU 2014-09 Assets: Accounts receivable, net $ 42,277 $ (7,039) $ 35,238 Inventories 8,603 5,861 14,464 Liabilities: Deferred revenue and customer deposits 403 725 1,128 Deferred income taxes 11,209 (540) 10,669 Stockholders' deficit: Accumulated loss (5,861) (1,363) (7,224)
7

Table of Contents
Three Months Ended March 31, 2018 Balances As Reported Without March 31, Adoption of Statement of Operations and Comprehensive Income (Loss) 2018 Adjustments ASU 2014-09 Net sales: Products $ 27,560 $ (725) $ 26,835 Services 31,510 223 31,733 Cost of sales: Products (exclusive of depreciation and amortization) 19,082 (841) 18,241 Services (exclusive of depreciation and amortization) 21,916 179 22,095 Gross profit 14,442 160 14,602 Income tax benefit (expense) 1,985 (34) 1,951 Net (loss) income (7,291) 126 (7,165) Recently Issued Accounting Pronouncements
In February 2016, the Financial Accounting Standards Board (the “FASB”) issued ASU 2016-02, Leases (“ASU 2016-02”), which provides guidance for accounting for leases. The new guidance requires companies to recognize the assets andliabilities for the rights and obligations created by leased assets. ASU 2016-02 is effective for annual and interim periodsbeginning after December 15, 2018 (the Company’s fiscal year 2019) with early adoption permitted. The new standard is requiredto be adopted using a modified retrospective approach. The Company is in the process of assessing the impact of ASU 2016-02on its results of operations, financial position and consolidated financial statements.
During 2017, the Company early adopted ASU 2017-04, Intangibles – Goodwill and Other (Topic 350): Simplifyingthe Test for Goodwill Impairment (“ASU 2017-04”) in conjunction with its annual impairment testing effective October 1, 2017.In accordance with ASU 2017-04, an entity should perform its goodwill impairment test by comparing the fair value of thereporting unit with its carrying amount, and recognize an impairment charge for the amount by which the carrying amount of thereporting unit exceeds its fair value.2. Revenue The Company disaggregates its revenue by major source as follows:
Three Months Ended March 31, 2018 Products Services Total U.S. Debit and Credit $ 23,720 $ 13,428 $ 37,148 U.S. Prepaid Debit - 15,512 15,512 U.K. Limited 2,816 1,397 4,213 Other 1,375 1,324 2,699 Intersegment eliminations (351) (151) (502) Total $ 27,560 $ 31,510 $ 59,070 For periods after January 1, 2018, the Company accounts for its revenue as follows:
8

Table of Contents
Products Revenue
Product revenue is recognized when obligations under the terms of a contract with a customer are satisfied. In most instances, thisoccurs over time as cards are manufactured for specific customers and have no alternative use and the Company has anenforceable right to payment for work performed. For work performed but not completed and unbilled, the Company estimatesrevenue by taking actual costs incurred and applying historical margins for similar types of contracts. Items included in Productsrevenue are manufactured Financial Payment Cards, including in contact-EMV®, Dual-Interface EMV®, contactless andmagnetic stripe cards, private label credit cards and retail gift cards. Card@Once® printers and Consumables are also included inProducts revenue, and their associated revenues are recognized at the time of shipping. Services Revenue Revenue is recognized for Services as the services are performed. Items included in Services revenue include the personalizationand fulfillment of Financial Payment Cards, providing tamper-evident secure packaging and fulfillment services to Prepaid DebitCard program managers and software as a service personalization of instant issuance debit cards. For work performed but notcompleted and unbilled, the Company estimates revenue by taking actual costs incurred and applying historical margins forsimilar types of contracts. Customer Contracts
The Company often enters into Master Services Agreements (“MSAs”) with our customers. Generally, an MSA requires acustomer to place subsequent purchase orders or statements of work to obtain goods or services, thus creating enforceable rightsand obligations for goods and services for the parties. The contract term as defined by ASU 2014-09 is the length of time it takesto deliver the goods or services promised under the purchase order or statement of work. As such, the Company's contracts aregenerally short term in nature. 3. Accounts Receivable Accounts receivable consisted of the following:
March 31, 2018 December 31, 2017 Trade accounts receivable $ 35,291 $ 37,590 Unbilled accounts receivable 7,039 — 42,330 37,590 Less allowance for doubtful accounts (53) (53) $ 42,277 $ 37,537 4 . Inventories
Inventories are summarized below:
March 31, 2018 December 31, 2017 Raw materials $ 6,282 $ 6,498 Work-in-process — 6,557 Finished goods 2,321 3,182 $ 8,603 $ 16,237
9

Table of Contents
5. Plant, Equipment and Leasehold Improvements
Plant, equipment and leasehold improvements consisted of the following:
March 31, 2018 December 31, 2017 Buildings $ 2,363 $ 2,318 Machinery and equipment 63,640 62,318 Machinery and equipment under capital leases 3,734 — Furniture, fixtures and computer equipment 7,626 7,585 Leasehold improvements 19,782 19,754 Construction in progress 1,393 1,980 98,538 93,955 Less accumulated depreciation (48,294) (44,655) $ 50,244 $ 49,300
Depreciation of plant, equipment and leasehold improvements, including depreciation of assets under capital leases,was $4,004 and $3,310 for the three months ended March 31, 2018 and 2017, respectively.
6. Goodwill and Other Intangible Assets
The Company’s goodwill by reportable segment at March 31, 2018 and December 31, 2017 was as follows:
March 31, 2018 December 31, 2017U.S. Debit and Credit $ 47,150 $ 47,150U.K. Limited 6,709 6,461 $ 53,859 $ 53,611
The change in goodwill from December 31, 2017 to March 31, 2018 was a result of foreign currency translationadjustments.
Intangible assets consist of customer relationships, technology and software, non-compete agreements and trademarks.
The changes in the cost basis of the intangibles from December 31, 2017 to March 31, 2018 were related to foreign currencytranslation adjustments. Intangible amortization expense was $1,221 and $1,223 for the three months ended March 31, 2018 and2017, respectively.
At March 31, 2018 and December 31, 2017, intangible assets, excluding goodwill, were comprised of the following:
March 31, 2018 December 31, 2017 Average Life Accumulated Net Book Accumulated Net Book (Years) Cost Amortization Value Cost Amortization Value Customer relationships 12 to 20 $59,026 $ (25,329) $33,697 $58,895 $ (24,373) $34,522 Technology and software 7 to 10 7,101 (3,327) 3,774 7,101 (3,095) 4,006 Trademarks 7.5 to 10 3,330 (584) 2,746 3,330 (487) 2,843 Non-compete agreements 5 to 8 491 (405) 86 491 (390) 101 Intangible assets subject toamortization $ 69,948 $ (29,645) $ 40,303 $ 69,817 $ (28,345) $ 41,472
10

Table of Contents
The estimated future aggregate amortization expense for the identified amortizable intangibles noted above as of March31, 2018 was as follows:
2018 (remaining 9 months) $ 3,6662019 4,8682020 4,8282021 4,5852022 4,100Thereafter 18,256 $ 40,303
7. Fair Value of Financial Instruments
Fair value is defined as the price that would be received to sell an asset or paid to transfer a liability in an orderlytransaction between market participants at the measurement date (exit price). In determining fair value, the Company utilizes afair value hierarchy that prioritizes the inputs to valuation techniques used to measure fair value into three broad levels. Thefollowing is a brief description of those three levels:
Level 1—Valuations based on unadjusted quoted prices in active markets for identical assets or liabilities accessible tothe reporting entity at the measurement date.
Level 2— Observable inputs other than Level 1 prices, such as quoted prices in active markets for similar assets and
liabilities, quoted prices in markets that are not active or other inputs that are observable or can be corroborated byobservable market data for substantially the full term for the assets or liabilities.
Level 3— Valuations based on unobservable inputs for the asset or liability used to measure fair value to the extent that
observable inputs are not available, thereby allowing for situations in which there is little, if any, market activity for theasset or liability at measurement date.
The Company’s financial assets and liabilities that are not required to be remeasured at fair value in the Condensed
Consolidated Balance Sheets were as follows:
Carrying Value as
of Fair Value as of Fair Value Measurement at March 31, 2018 March 31, March 31, (Using Fair Value Hierarchy) 2018 2018 Level 1 Level 2 Level 3 Liabilities:
First Lien Term Loan $ 312,500 $ 217,188 $ — $ 217,188 $ —
Carrying
Value as of Fair Value as of Fair Value Measurement at December 31, 2017 December 31, December 31, (Using Fair Value Hierarchy) 2017 2017 Level 1 Level 2 Level 3 Liabilities:
First Lien Term Loan $ 312,500 $ 228,125 $ — $ 228,125 $ —
The aggregate fair value of the Company’s First Lien Term Loan, as defined in Note 8, “Long-Term Debt and CreditFacility,” was based on bank quotes.
The carrying amounts for cash and cash equivalents, accounts receivable and accounts payable each approximate fair
value.
11

Table of Contents
8. Long-Term Debt and Credit Facility
At March 31, 2018 and December 31, 2017, long-term debt and credit facilities consisted of the following:
Interest March 31, December 31, Rate 2018 2017 First Lien Term Loan 6.36 % $312,500 $ 312,500 Unamortized discount (2,954) (3,122) Unamortized deferred financing costs (5,191) (5,509) Long-term debt $304,355 $ 303,869
(1 ) Interest rate at March 31, 2018. Interest rate at December 31, 2017 was 5.96%. First Lien Credit Facility
On August 17, 2015, the Company entered into a first lien credit facility (the “First Lien Credit Facility”) with asyndicate of lenders providing for a $435,000 first lien term loan (the “First Lien Term Loan”) and a $40,000 revolving creditfacility (the “Revolving Credit Facility”). The First Lien Term Loan and the Revolving Credit Facility have maturity dates ofAugust 17, 2022 and August 17, 2020, respectively.
The First Lien Credit Facility is secured by a first-priority security interest in substantially all of the Company’s assets
constituting equipment, inventory, receivables, cash and other tangible and intangible property.
Interest rates under the First Lien Credit Facility are based, at the Company’s election, on a Eurodollar rate, subject to aninterest rate floor of 1.0%, plus a margin of 4.50%, or a base rate plus a margin of 3.50%.
The First Lien Credit Facility contains customary nonfinancial covenants, including among other things, restrictions onindebtedness, issuance of liens, investments, dividends, redemptions and other distributions to equity holders, asset sales, certainmergers or consolidations, sales, transfers, leases or dispositions of substantially all of the Company’s assets and affiliatetransactions. The First Lien Credit Facility also contains a requirement that, as of the last day of any fiscal quarter, if the amountthe Company has drawn under the Revolving Credit Facility is greater than 50% of the aggregate principal amount of allcommitments of the lenders thereunder, the Company maintain a first lien net leverage ratio not in excess of 7.0 times trailingtwelve month Adjusted EBITDA, as defined in the agreement. As of March 31, 2018, the Company was in compliance with allcovenants under the First Lien Credit Facility.
The First Lien Credit Facility also requires prepayment in advance of the maturity date upon the occurrence of certain
customary events, including based on an annual excess cash flow calculation, pursuant to the terms of the agreement, with anyrequired payments to be made after the issuance of the Company’s annual financial statements. As of March 31, 2018, theCompany did not expect to have a required excess cash flow payment related to 2018.
At March 31, 2018, the Company did not have any outstanding amounts under the Revolving Credit Facility and has$19,950 available for borrowing. Additional amounts may be available for borrowing under the term of the Revolving CreditFacility, up to the full $40,000, to the extent the Company’s net leverage ratio does not exceed 7.0 times Adjusted EBITDA, asdefined in the agreement. The Company has one outstanding letter of credit for $50 relating to the security deposit on a realproperty lease agreement. The Company pays a fee on outstanding letters of credit at the applicable margin, which was 4.50% asof March 31, 2018 and December 31, 2017, in addition to a fronting fee of 0.125% per annum. In addition, the Company isrequired to pay an unused commitment fee ranging from 0.375% per annum to 0.50% per annum of the average unused portion ofthe revolving commitments. The unused commitment fee is determined on the basis of a grid that results in a lower unusedcommitment fee as the Company’s total net leverage ratio declines. The Company recorded accrued interest of $4,526 and$4,296 within “Accrued expenses” on the Condensed Consolidated Balance Sheets at March 31, 2018 and December 31, 2017,respectively.
Deferred Financing Costs
Certain costs incurred with borrowings or the establishment or modification of credit facilities are reflected as areduction to the long-term debt balance. These costs are amortized as an adjustment to interest expense over the life of theborrowing using the effective-interest rate method.
12
(1)
(1)
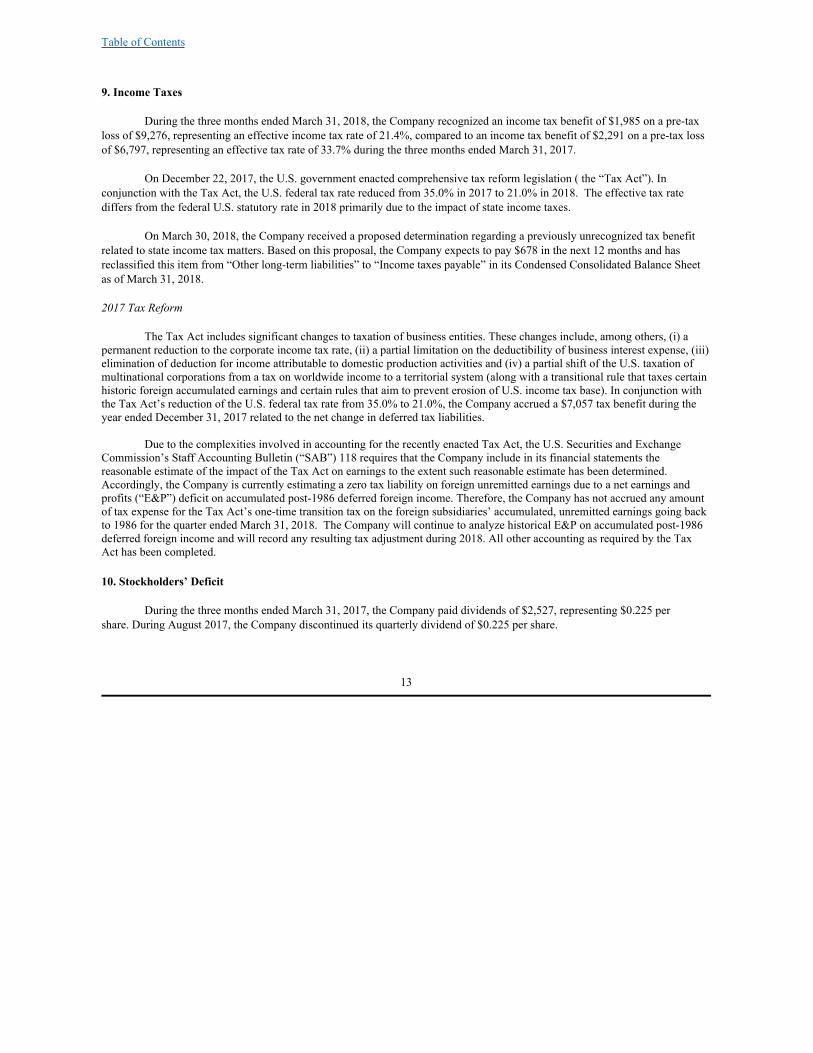
Table of Contents
9. Income Taxes
During the three months ended March 31, 2018, the Company recognized an income tax benefit of $1,985 on a pre-taxloss of $9,276, representing an effective income tax rate of 21.4%, compared to an income tax benefit of $2,291 on a pre-tax lossof $6,797, representing an effective tax rate of 33.7% during the three months ended March 31, 2017.
On December 22, 2017, the U.S. government enacted comprehensive tax reform legislation ( the “Tax Act”). In
conjunction with the Tax Act, the U.S. federal tax rate reduced from 35.0% in 2017 to 21.0% in 2018. The effective tax ratediffers from the federal U.S. statutory rate in 2018 primarily due to the impact of state income taxes.
On March 30, 2018, the Company received a proposed determination regarding a previously unrecognized tax benefit
related to state income tax matters. Based on this proposal, the Company expects to pay $678 in the next 12 months and hasreclassified this item from “Other long-term liabilities” to “Income taxes payable” in its Condensed Consolidated Balance Sheetas of March 31, 2018.
2017 Tax Reform
The Tax Act includes significant changes to taxation of business entities. These changes include, among others, (i) apermanent reduction to the corporate income tax rate, (ii) a partial limitation on the deductibility of business interest expense, (iii)elimination of deduction for income attributable to domestic production activities and (iv) a partial shift of the U.S. taxation ofmultinational corporations from a tax on worldwide income to a territorial system (along with a transitional rule that taxes certainhistoric foreign accumulated earnings and certain rules that aim to prevent erosion of U.S. income tax base). In conjunction withthe Tax Act’s reduction of the U.S. federal tax rate from 35.0% to 21.0%, the Company accrued a $7,057 tax benefit during theyear ended December 31, 2017 related to the net change in deferred tax liabilities.
Due to the complexities involved in accounting for the recently enacted Tax Act, the U.S. Securities and ExchangeCommission’s Staff Accounting Bulletin (“SAB”) 118 requires that the Company include in its financial statements thereasonable estimate of the impact of the Tax Act on earnings to the extent such reasonable estimate has been determined.Accordingly, the Company is currently estimating a zero tax liability on foreign unremitted earnings due to a net earnings andprofits (“E&P”) deficit on accumulated post-1986 deferred foreign income. Therefore, the Company has not accrued any amountof tax expense for the Tax Act’s one-time transition tax on the foreign subsidiaries’ accumulated, unremitted earnings going backto 1986 for the quarter ended March 31, 2018. The Company will continue to analyze historical E&P on accumulated post-1986deferred foreign income and will record any resulting tax adjustment during 2018. All other accounting as required by the TaxAct has been completed.
10. Stockholders’ Deficit
During the three months ended March 31, 2017, the Company paid dividends of $2,527, representing $0.225 pershare. During August 2017, the Company discontinued its quarterly dividend of $0.225 per share.
13

Table of Contents
11. Loss per Share
Basic and diluted loss per share is computed by dividing net loss by the weighted-average number of common sharesoutstanding during the period.
The following table sets forth the computation of basic and diluted loss per share:
Three Months Ended March 31, 2018 2017 Numerator:
Net loss $ (7,291) $ (4,506) Denominator:
Basic-weighted-average common shares outstanding 11,134,714 11,084,875 Diluted-weighted-average common shares outstanding 11,134,714 11,084,875
Loss per share: Basic $ (0.65) $ (0.40) Diluted $ (0.65) $ (0.40)
The Company reported a net loss for the three-month periods ended March 31, 2018 and 2017. Accordingly, the
potentially dilutive effect of 952,706 and 465,174 stock options and 48,509 and 37,352 restricted stock units were excluded fromthe computation of diluted earnings per share as of March 31, 2018 and 2017, respectively, as their inclusion would be anti-dilutive. 12. Commitments and Contingencies Commitments
The Company incurred rent expense under non-cancellable operating leases of $934 and $953 for the three monthsended March 31, 2018 and 2017, respectively. During the first quarter of 2018, the Company leased certain machinery andequipment under capital lease obligations, which consisted of the following at March 31, 2018:
March 31, 2018 Machinery and equipment $ 3,561 Less current portion of capital lease obligations (699) Total long-term capital lease obligations $ 2,862
In its Condensed Consolidated Balance Sheet at March 31, 2018, the Company has recorded the current portion of
capital lease obligations in “Accrued expenses” and the long-term capital lease obligations in “Other long-term liabilities”.
Contingencies
In accordance with applicable accounting guidance, the Company establishes an accrued liability when losscontingencies are both probable and estimable. In such cases, there may be an exposure to loss in excess of any amounts accrued.As a matter develops, the Company, in conjunction with any outside counsel handling the matter, evaluates on an ongoing basiswhether such matter presents a loss contingency that is probable and estimable. Once the loss contingency is deemed to be bothprobable and estimable, the Company will establish an accrued liability and record a corresponding amount of litigation-relatedexpense. The Company expenses professional fees associated with litigation claims and assessments as incurred. In Re CPI Card Group Inc. Securities Litigation , Case No. 1:16-CV-04531 (S.D.N.Y.) (the “Class Action”)
On June 15, 2016, two purported CPI stockholders filed putative class action lawsuits captioned Vance, et al. v. CPICard Group Inc., et al. and Chipman, et al. v. CPI Card Group Inc. in the United States District Court for the Southern District ofNew York (the “Court”) against CPI, certain of its former officers and current and former directors, along with the sponsors ofand the financial institutions who served as underwriters for CPI’s October 2015
14

Table of Contents
initial public offering (“IPO”). The complaints, purportedly brought on behalf of all purchasers of CPI common stock pursuant tothe October 8, 2015 Registration Statement filed in connection with the IPO, assert claims under §§11 and 15 of the SecuritiesAct of 1933, as amended (the “Securities Act”) and seek, among other things, damages and costs. In particular, the complaintsallege that the Registration Statement contained false or misleading statements or omissions regarding CPI’s customers’ (i)purchases of Europay, MasterCard and VISA chip cards (collectively, “EMV cards”) during the first half of fiscal year 2015 andresulting EMV card inventory levels; and (ii) capacity to purchase additional EMV cards in the fourth quarter of fiscal year 2015,and the remainder of the fiscal year ended December 31, 2015. The complaints allege that these actions artificially inflated theprice of CPI common stock issued pursuant to the IPO.
On August 30, 2016, the Court consolidated the Vance and Chipman actions and appointed lead plaintiff and lead
counsel pursuant to the Private Securities Litigation Reform Act (the “PSLRA”). On October 17, 2016, lead plaintiff filed aconsolidated amended complaint, asserting the same claims for violations of §§11 and 15 of the Securities Act. The amendedcomplaint is based principally on the same theories as the original complaints, but adds allegations that the Registration Statementcontained inadequate risk disclosures and failed to disclose (i) small and mid-size issuers’ slower-than-anticipated conversion toEMV technology and (ii) increased pricing pressure and competition CPI faced in the EMV market.
On November 16, 2016, the Company filed a motion to dismiss the amended complaint, which was denied by the Court
on October 30, 2017. On January 12, 2018, the Company filed an answer to the amended complaint. On March 23, 2018, leadplaintiff filed his motion for class certification.
The Company believes these claims are without merit and is defending the Class Action vigorously. Given the currentstage of the matter, the range of any potential loss is not probable or estimable and no liability has been recorded as of March 31,2018 or December 31, 2017.
Heckermann v. Montross et al. , Case No. 1:17-CV-01673 (D. Del.) (the “Derivative Suit”)
On November 20, 2017, a purported CPI stockholder filed a stockholder derivative complaint in the United States
District Court for the District of Delaware (the “Court”) against certain of CPI’s former officers and current and former directors,along with the sponsors of the IPO. CPI is also named as a nominal defendant. The derivative complaint asserts claims under§§10(b) and 20(a) of the Securities Exchange Act of 1934 and SEC Rule 10b-5 and seeks, among other things, injunctive relief,damages and costs. It alleges false or misleading statements and omissions in the Registration Statement filed by CPI inconnection with its IPO and subsequent public filings and statements. The derivative complaint also asserts claims for purportedbreaches of fiduciary duties, unjust enrichment, mismanagement and waste of corporate assets.
On March 28, 2018, the Court entered the parties’ stipulated order staying the Derivative Suit pending final
determination of the Class Action. The Company believes these claims are without merit and is defending the Derivative Suit vigorously. Given the current
stage of these matters, the range of any potential loss is not probable or estimable and no liability has been recorded as of March31, 2018 or December 31, 2017. Gemalto S.A. v. CPI Card Group Inc. (2 cases)
First case. This suit was initially filed by Gemalto S.A. (“Gemalto”) against the Company in the United States DistrictCourt for the Western District of Texas in October 2015. The complaint alleged that the Company infringed a now-expiredGemalto patent by incorporating into the Company’s products microchips that allegedly practice the EMV standard. TheCompany successfully moved to transfer the lawsuit to the District of Colorado, answered the complaint and filed counterclaimsthat the asserted patent was invalid and unenforceable, and that Gemalto’s lawsuit was a “sham” intended to interfere with theCompany’s IPO and business relationships.
During 2016, the Company filed an Inter Partes Review ("IPR") petition with the United States Patent & Trademark
Office’s Patent Trial & Appeal Board (“PTAB”) seeking re-examination of Gemalto’s asserted patent, and the United StatesDistrict Court for the District of Colorado granted the Company’s motion to stay the litigation pending the PTAB’s considerationof the Company’s challenge to the patentability of asserted claims.
15

Table of Contents
Second case. On May 3, 2016, Gemalto filed a second patent infringement action against CPI in the United StatesDistrict Court for the District of Colorado. The complaint alleged that the Company infringed a Gemalto patent on networkedsmartcard printing by way of the Company’s Card@Once offering. During 2017, the Company filed an IPR petition with thePTAB seeking re-examination of Gemalto’s asserted patent.
On September 28, 2017, the Company reached a settlement with Gemalto to resolve both lawsuits. Under the terms of
the settlement, the Company made a one-time payment of $750 in the fourth quarter of 2017. The settlement resulted in thedismissal of both lawsuits with prejudice, and included a mutual covenant not to sue for a period of 18 months.
In addition to the matters described above, the Company is subject to routine legal proceedings in the ordinary course of
business. The Company believes that the ultimate resolution of these matters will not have a material adverse effect on itsbusiness, financial condition or results of operations. 13. Stock-Based Compensation CPI Card Group Inc. Omnibus Incentive Plan
On December 20, 2017, the Company effected a one-for-five reverse stock split of its common stock, whereby each lotof five shares of common stock issued and outstanding immediately prior to the reverse stock split was converted into and becameone share of common stock. Share and per share amounts below reflect the one-for-five reverse stock split for all periodspresented.
During October 2015, the Company adopted the CPI Card Group Inc. Omnibus Incentive Plan (the “Omnibus Plan”)pursuant to which cash and equity based incentives may be granted to participating employees, advisors and directors. TheCompany had reserved 800,000 shares of common stock for issuance under the Omnibus Plan. Effective September 25, 2017, theOmnibus Plan was amended and restated, providing for an increase in the number of shares of common stock authorized forissuance thereunder by 400,000. The increase was made effective in the fourth quarter of 2017 by stockholder approval inaccordance with applicable law, after which the Company had reserved 1,200,000 shares of common stock for issuance. As ofMarch 31, 2018, there were 167,506 shares available for grant under the Omnibus Plan.
During the three months ended March 31, 2018, the Company granted awards of non-qualified stock options for 31,480shares of common stock. All stock option grants have a 10-year term and will generally vest ratably over a three-year periodbeginning on the first anniversary of the grant date.
The following is a summary of the activity in outstanding stock options under the Omnibus Plan:
Weighted- Weighted- Average Average Remaining Exercise Contractual Term Options Price (in Years) Outstanding as of December 31, 2017 937,310 $ 17.11
Granted 31,480 5.02 Forfeited (22,684) 18.31
Outstanding as of March 31, 2018 946,106 $ 16.68 8.98 Options vested and exercisable as March 31, 2018 112,225 35.67 8.20 Options vested and expected to vest as March 31, 2018 946,106 16.68 8.98
16

Table of Contents
The following is a summary of the activity in non-vested stock options under the Omnibus Plan:
Weighted-Average Number Grant-Date Fair Value Non-vested as of December 31, 2017 876,903 $ 4.08 Granted 31,480 1.80 Forfeited (22,684) 5.19 Vested (51,818) 4.61
Non-vested as of March 31, 2018 833,881 $ 3.93 Unvested options as of March 31, 2018 will vest as follows:
2018 255,669 2019 309,357 2020 256,880 2021 11,975 Total unvested options as of March 31, 2018 833,881
The fair value of the stock option awards granted during the three months ended March 31, 2018 was determined at thedate of grant using a Black-Scholes option-pricing model with the following weighted-average assumptions:
Three Months Ended March 31, 2018 Expected term in years 6.0 Volatility 49.0 %Risk-free interest rate 2.3 %Dividend yield - %
(1) The Company estimated the expected term based on the average of the weighted-average vesting period and the contractualterm of the stock option awards by utilizing the “simplified method”, as the Company does not have sufficient availablehistorical data to estimate the expected term of these stock option awards.
(2) During the first quarter of 2018, the Company considered the volatility of its common stock in determining the fair value ofstock option awards, in addition to a peer group average historical volatility over the expected option term. The peer groupwas based on financial technology companies that completed an initial public offering of common stock within the last 10years.
(3) The risk-free interest rate was determined by using the United States Treasury rate for the period that coincided with theexpected option term.
(4) The Company discontinued its quarterly dividend program during August 2017. The weighted-average grant-date fair value of options granted was as follows:
Three Months Ended March 31, 2018 2017 Weighted-average grant-date fair value of options granted $ 1.80 $ 4.68
The following table summarizes the changes in the number of outstanding restricted stock units for the three month-
period ended March 31, 2018:
Weighted- Average Grant-Date Units Fair Value Outstanding as of December 31, 2017 49,677 $ 16.20 Forfeited (1,168) 22.53 Outstanding as of March 31, 2018 48,509 $ 16.05
17
(1)
(2)
(3)
(4)

Table of Contents
There were no awards of restricted stock units during the first quarter of 2018. The restricted stock units contain
conditions associated with continued employment or service and generally vest one year from the date of grant. On the vestingdates, shares of common stock will be issue to the award recipients.
The following table summarizes the changes in the number of outstanding cash performance units for the three-month
period ended March 31, 2018:
Units Outstanding as of December 31, 2017 822,915Granted —Vested (263,664)Forfeited (31,923)
Outstanding as of March 31, 2018 527,328 There were no awards of cash performance units during the three months ended March 31, 2018. These awards will
settle in cash in three annual payments on the first, second and third anniversaries of the date of grant. The cash performance unitsare based on the performance of the Company’s stock, measured based on the Company’s stock price at each of the first, secondand third anniversaries of the grant date compared to the Company’s stock price on the date of grant. During the first quarter of2018, the first tranche of the cash performance units vested. Accordingly, the Company made a cash payment of $137 to theaward recipients.
The Company recognizes compensation expense on a straight-line basis for each annual performance period. The cash
performance units are accounted for as a liability and remeasured to fair value at the end of each reporting period. As of March31, 2018, the Company recognized a liability of $68 in “Accrued expenses” and $45 in “Other long-term liabilities” in theCondensed Consolidated Balance Sheet for unsettled cash performance units.
Compensation expense for the Omnibus Plan for the three months ended March 31, 2018 and 2017 was $395 and $689,respectively. As of March 31, 2018, the total unrecognized compensation expense related to unvested options, restricted stockunits and cash performance unit awards under the Omnibus Plan was $1,720, which the Company expects to recognize over anestimated weighted-average period of 1.6 years.
CPI Holdings I, Inc. Amended and Restated 2007 Stock Option Plan
In 2007, the Company’s Board of Directors adopted the CPI Holdings I, Inc. Amended and Restated 2007 Stock OptionPlan (the “Option Plan”). Under the provisions of the Option Plan, stock options may be granted to employees, directors andconsultants at an exercise price greater than or equal to (and not less than) the fair market value of a share on the date the option isgranted.
As a result of the Company’s adoption of the Omnibus Plan, as further described above, no further awards will be made
under the Option Plan. The outstanding stock options under the Option Plan are non-qualified, have a 10-year life and are fullyvested as of March 31, 2018.
During the three months ended March 31, 2018, there was no activity under the Option Plan. As such, total sharesoutstanding and exercisable were 6,600 shares with a weighted-average exercise price of $0.002 per share and a weighted-averageremaining contract term of 5.16 years at March 31, 2018.
Compensation expense and unrecorded compensation expense related to options previously granted under the OptionPlan, for the three months ended March 31, 2018 and 2017, were de minimis.
Other Stock-Based Compensation Awards
During June 2015, the Company issued 38,332 restricted shares of common stock to certain executives of the Company
at weighted-average grant-date fair value of $47.40. There are no outstanding unvested restricted shares of common stock as ofMarch 31, 2018. There was no compensation expense recorded for these awards during the three months ended March 31,2018. During the first quarter of 2017, the executive holding the restricted shares changed
18

Table of Contents
employment status to a consultant and the Company remeasured the awards and reduced stock-based compensation expense by$143 during the three months ended March 31, 2017. 14. Segment Reporting
The Company has identified reportable segments as those consolidated subsidiaries that represent 10% or more of itsrevenue, EBITDA (as defined below) or total assets, or when the Company believes information about the segment would beuseful to the readers of the financial statements. The Company’s chief operating decision maker is its Chief Executive Officerwho is charged with management of the Company and is responsible for the evaluation of operating performance and decisionmaking about the allocation of resources to operating segments based on measures, such as revenue and EBITDA.
EBITDA is the primary measure used by the Company’s chief operating decision maker to evaluate segment operating
performance. As the Company uses the term, EBITDA is defined as income before interest expense, income taxes, depreciationand amortization. The Company’s chief operating decision maker believes EBITDA is a meaningful measure and is superior toavailable GAAP measures as it represents a transparent view of the Company’s operating performance that is unaffected byfluctuations in property, equipment and leasehold improvement additions. The Company’s chief operating decision maker usesEBITDA to perform periodic reviews and comparison of operating trends and identify strategies to improve the allocation ofresources amongst segments.
During the first quarter of 2018, the Company reorganized its United States business operations and realigned its United
States reporting segments to correspond with the manner with which the Company’s chief decision maker evaluates operatingperformance and makes decisions as to the allocation of resources. As a result of this realignment, the Company’s CPI onDemand business operations have been moved from the U.S. Prepaid Debit segment into the U.S. Debit and Credit reportingsegment, consistent with the other related personalization operations. Segment information for previous periods has been restatedto conform with this realignment and current period presentation. The restatement of first quarter 2017 segment information wasnot material.
As of March 31, 2018, the Company’s reportable segments were as follows:
U.S. Debit and Credit, U.S. Prepaid Debit, U.K. Limited and Other.
The Other category includes the Company’s corporate headquarters and a less significant operating segment that derivesits revenue from the production of Financial Payment Cards and retail gift cards in Canada.
19

Table of Contents
Performance Measures of Reportable Segments
Revenue and EBITDA of the Company’s reportable segments for the three months ended March 31, 2018 and 2017were as follows:
Revenue Three Months Ended March 31, 2018 2017 U.S. Debit and Credit $ 37,148 $ 39,751 U.S. Prepaid Debit 15,512 9,497 U.K. Limited 4,213 5,587 Other 2,699 2,503 Intersegment eliminations (502) (1,330) Total $ 59,070 $ 56,008
EBITDA Three Months Ended March 31, 2018 2017 U.S. Debit and Credit $ 5,719 $ 7,402 U.S. Prepaid Debit 4,819 2,013 U.K. Limited (1,102) 325 Other (7,968) (6,942) Total $ 1,468 $ 2,798
The following table provides a reconciliation of total segment EBITDA to net (loss) income for the three months ended
March 31, 2018 and 2017:
Three Months Ended March 31, 2018 2017 Total segment EBITDA from continuing operations $ 1,468 $ 2,798 Interest, net (5,519) (5,062) Income tax benefit 1,985 2,291 Depreciation and amortization (5,225) (4,533) Net (loss) $ (7,291) $ (4,506)
Balance Sheet Data of Reportable Segments
Total assets of the Company’s reportable segments at March 31, 2018 and December 31, 2017 were as follows:
March 31, 2018 December 31, 2017 U.S. Debit and Credit $ 160,708 $ 164,397 U.S. Prepaid Debit 30,960 33,130 U.K. Limited 23,286 22,640 Other 13,949 13,838 Total assets $ 228,903 $ 234,005
20

Table of Contents
Plant, Equipment and Leasehold Improvement Additions of Geographic Locations
Plant, equipment and leasehold improvement additions of the Company’s geographical locations for the three monthsended March 31, 2018 and 2017 were as follows:
Three Months Ended March 31, 2018 2017 U.S. $ 1,582 $ 2,275 Canada 2 72 Total North America 1,584 2,347
U.K. 3,311 961 Total plant, equipment and leasehold improvement additions $ 4,895 $ 3,308
Net Sales to Geographic Locations
Net sales to geographic locations for the three months ended March 31, 2018 and 2017 were as follows:
Three Months Ended March 31, 2018 2017 U.S. $ 52,791 $ 47,811 Other (a) 6,279 8,197 Total net sales $ 59,070 $ 56,008
(a) Amounts in Other include sales to various countries that individually are not material. Long-Lived Assets of Geographic Segments
Long-lived assets of the Company’s geographic segments at March 31, 2018 and December 31, 2017 were as follows:
March 31, 2018 December 31, 2017 U.S. $ 127,396 $ 130,767 Canada 814 911 Total North America 128,210 131,678
U.K. 16,196 12,705 Total long-lived assets $ 144,406 $ 144,383
Net Sales by Product and Services
Net sales from products and services sold by the Company for the three months ended March 31, 2018 and 2017 were asfollows:
Three Months Ended March 31, 2018 2017 Product net sales (a) $ 27,560 $ 29,764 Services net sales (b) 31,510 26,244
Total net sales $ 59,070 $ 56,008
(a) Product net sales include the design and production of Financial Payment Cards in contact-EMV, Dual-Interface EMV,contactless and magnetic stripe card formats. The Company also generates Product revenue from the sale of Card@Once instant issuance systems, private label credit cards and retail gift cards.
(b) Services net sales include revenue from the personalization and fulfillment of Financial Payment Cards, providing tamper-evident security packaging and fulfillment services to Prepaid Debit Card program managers and software as a servicepersonalization of instant issuance debit cards. The Company also generates Services revenue from personalizing retail giftcards (primarily in Canada and the United Kingdom) and from click-fees generated from the Company’s patented carddesign software, known as MYCA, which provides customers and cardholders the ability to design cards on the internet andcustomize cards with individualized digital images.
21
®

Table of Contents
Item 2. Management’s Discussion and Analysis of Financial Condition and Results of Operation s
References to the “Company,” “our,” “us” or “we” refer to CPI Card Group Inc. and its subsidiaries. For anunderstanding of the significant factors that influenced our results, the following discussion should be read in conjunction withour unaudited condensed consolidated financial statements and related notes appearing elsewhere in this report. Thismanagement’s discussion and analysis should also be read in conjunction with the management’s discussion and analysis andconsolidated financial statements included in our Annual Report on Form 10-K for the year ended December 31, 2017 filed withthe Securities and Exchange Commission (“SEC”). Cautionary Statement Regarding Forward-Looking Information
Certain statements and information in this Form 10-Q may constitute “forward-looking statements” within the meaning ofthe Private Securities Litigation Reform Act of 1995, Section 27A of the Securities Act of 1933, as amended (the “1933 Act”) andSection 21E of the Securities Exchange Act of 1934, as amended (the “1934 Act”). The words “believe,” “estimate,” “project,”“expect,” “anticipate,” “plan,” “intend,” “foresee,” “should,” “would,” “could” or other similar expressions are intended toidentify forward-looking statements, which are generally not historical in nature. These forward-looking statements are based onour current expectations and beliefs concerning future developments and their potential effect on us, and other informationcurrently available. Such statements reflect our current views with respect to future events and are subject to certain risks,uncertainties and assumptions. Should one or more of these risks or uncertainties materialize, or should underlying assumptionsprove incorrect, actual results may vary materially from those described herein as anticipated, believed, estimated, expected orintended. We are making investors aware that such forward-looking statements, because they relate to future events, are by theirvery nature subject to many important factors that could cause actual results to differ materially from those contemplated. Theserisks and uncertainties include, but are not limited to: system security risks, data protection breaches and cyber-attacks; interruptions in our operations, including our IT systems; defects in our software; failure to identify and attract newcustomers or to retain our existing customers; problems in production quality and process; failure to meet our customers’demands in a timely manner; a loss of market share or a decline in profitability resulting from competition; developingtechnologies that make our existing technology solutions and products less relevant or a failure to introduce new products andservices in a timely manner; disruptions relating to the development and execution of our strategy, or a failure to realize theanticipated benefits of such strategy; our inability to sell, exit, reconfigure or consolidate businesses or facilities that no longermeet with our strategy; our inability to develop, introduce and commercialize new products; our substantial indebtedness,including inability to make debt service payments or refinance such indebtedness; the restrictive terms of our credit facility andcovenants of future agreements governing indebtedness; our limited ability to raise capital in the future; our inability toadequately protect our trade secrets and intellectual property rights from misappropriation or infringement; our dependence on thetimely supply of materials, products and specialized equipment from third-party suppliers; a competitive disadvantage resultingfrom chip operating systems developed by our competitors; price erosion in the financial payment card industry; failure toaccurately predict demand for our products and services; quarterly variation in our operating results; the effect of legal andregulatory proceedings; infringement of our intellectual property rights, or claims that our technology is infringing on third-partyintellectual property; our inability to realize the full value of our long-lived assets; the impact of U.S. tax reform legislation; ourfailure to operate our business in accordance with data privacy laws, the PCI Security Standards Council (“PCI”) securitystandards or other industry standards, such as Payment Card Brand certification standards; costs relating to product defects; adecline in U.S. and global market and economic conditions; potential imposition of tariffs and/or trade restrictions on goodsimported into the United States; economic conditions and regulatory changes leading up to and following the United Kingdom’sexit from the European Union; our dependence on licensing arrangements; inability to renew leases for our facilities or renewleases at existing terms; dependence on our senior leadership team; inability to recruit, retain and develop qualified personnel; thecontinued viability of the Payment Card Brands; non-compliance with, and changes in, laws in the United States and in foreignjurisdictions in which we operate and sell our products; failure to maintain our listing on the NASDAQ and other risks and otherrisk factors or uncertainties identified from time to time in our filings with the SEC. Although we believe that the expectationsreflected in such forward-looking statements are reasonable, we can give no assurance that such expectations will prove to havebeen correct. Reference is made to a more complete discussion of forward-looking statements and applicable risks containedunder the captions “Cautionary Statement Regarding Forward-Looking Information” and “Risk Factors” in our Annual Report onForm 10-K for the year ended December 31, 2017 filed with the SEC on March 13, 2018. CPI Card Group Inc. undertakes noobligation to update or revise any of its forward-looking statements, whether as a result of new information, future events orotherwise.
22

Table of Contents
Overview
We are engaged in the design, production, data personalization, packaging and fulfillment of Financial Payment Cardswhich we define as credit cards, debit cards and prepaid debit cards issued on the networks of the Payment Card Brands (Visa,MasterCard, American Express, Discover and Interac (in Canada)) in the United States and Canada. We also are engaged in thedesign, production, data personalization, packaging and fulfillment of retail gift and loyalty cards (primarily in Europe andCanada).
As a producer and provider of services for Financial Payment Cards, each of our secure facilities must be certified byone or more of the Payment Card Brands and is therefore subject to specific requirements and conditions. Noncompliance withthese requirements would prohibit the individual facilities from producing Financial Payment Cards for these entities’ paymentcard issuers.
During February 2018, we made the decision to consolidate three personalization operations in the United States into
two facilities to better enable us to optimize operations and achieve market-leading quality and service with a cost-competitivebusiness model. In conjunction with this decision, we accelerated the depreciation of certain related assets, which totaled $0.8million for the three months ended March 31, 2018, and recorded a severance charge of $0.3 million for this same time period. Results of Operations
The following table presents the components of our condensed consolidated statements of operations for each of theperiods presented:
Three Months Ended March 31, 2018 2017 (dollars in thousands) Net sales:
Products $ 27,560 $ 29,764 Services 31,510 26,244 Total net sales 59,070 56,008
Cost of sales 44,628 39,913 Gross profit 14,442 16,095 Operating expenses 18,410 17,904 Loss from operations (3,968) (1,809) Other expense, net:
Interest, net (5,519) (5,062) Foreign exchange gain 207 73 Other income, net 4 1
Loss before taxes (9,276) (6,797) Income tax benefit 1,985 2,291 Net loss $ (7,291) $ (4,506) Segment Discussion
During the first quarter of 2018, the Company reorganized its United States business operations and realigned its UnitedStates reporting segments to correspond with the manner with which the Company’s Chief Operating Decision Maker evaluatesoperating performance and makes decisions as to the allocation of resources. As a result of this realignment, the Company’s CPIon Demand business operations have been moved from the U.S. Prepaid Debit segment into the U.S. Debit and Credit reportingsegment, consistent with the other related personalization operations. Segment information for previous periods has been restatedto conform with this realignment and current year presentation. The restatement of first quarter 2017 segment information wasnot material.
23
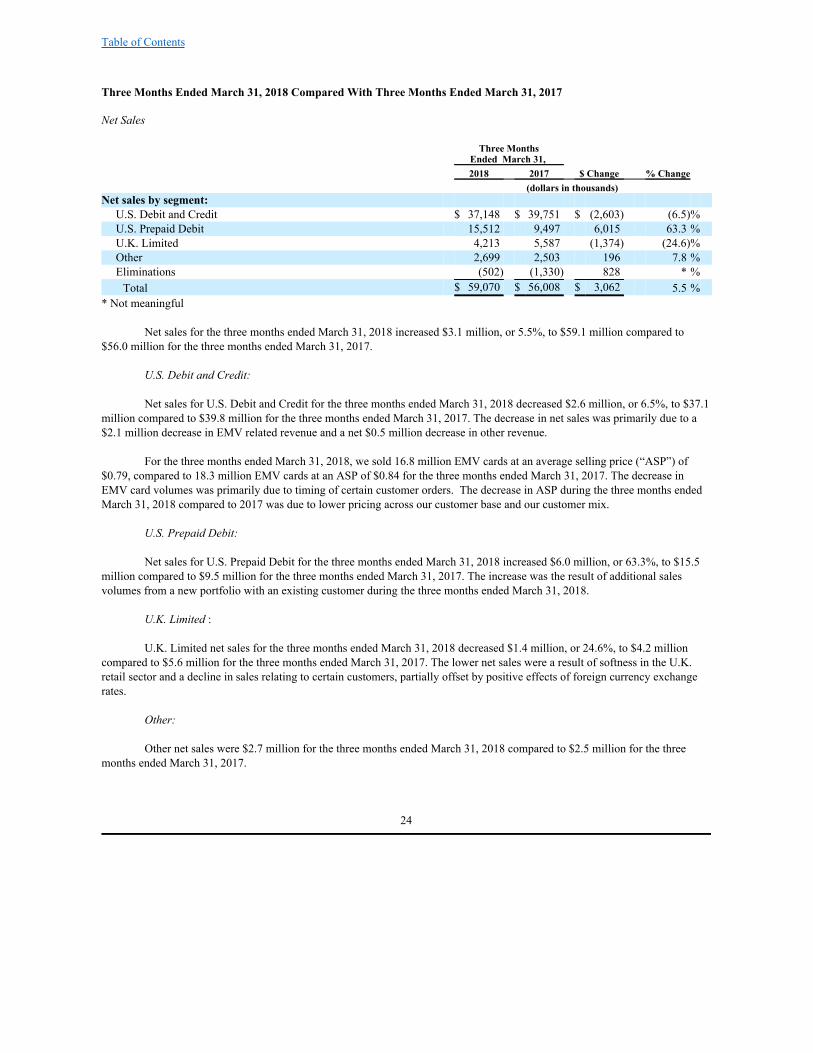
Table of Contents
Three Months Ended March 31, 2018 Compared With Three Months Ended March 31, 2017 Net Sales
Three Months
Ended March 31, 2018 2017 $ Change % Change (dollars in thousands) Net sales by segment:
U.S. Debit and Credit $ 37,148 $ 39,751 $ (2,603) (6.5)% U.S. Prepaid Debit 15,512 9,497 6,015 63.3 % U.K. Limited 4,213 5,587 (1,374) (24.6)% Other 2,699 2,503 196 7.8 % Eliminations (502) (1,330) 828 * % Total $ 59,070 $ 56,008 $ 3,062 5.5 %
* Not meaningful
Net sales for the three months ended March 31, 2018 increased $3.1 million, or 5.5%, to $59.1 million compared to$56.0 million for the three months ended March 31, 2017.
U.S. Debit and Credit:
Net sales for U.S. Debit and Credit for the three months ended March 31, 2018 decreased $2.6 million, or 6.5%, to $37.1million compared to $39.8 million for the three months ended March 31, 2017. The decrease in net sales was primarily due to a$2.1 million decrease in EMV related revenue and a net $0.5 million decrease in other revenue.
For the three months ended March 31, 2018, we sold 16.8 million EMV cards at an average selling price (“ASP”) of$0.79, compared to 18.3 million EMV cards at an ASP of $0.84 for the three months ended March 31, 2017. The decrease inEMV card volumes was primarily due to timing of certain customer orders. The decrease in ASP during the three months endedMarch 31, 2018 compared to 2017 was due to lower pricing across our customer base and our customer mix.
U.S. Prepaid Debit:
Net sales for U.S. Prepaid Debit for the three months ended March 31, 2018 increased $6.0 million, or 63.3%, to $15.5million compared to $9.5 million for the three months ended March 31, 2017. The increase was the result of additional salesvolumes from a new portfolio with an existing customer during the three months ended March 31, 2018.
U.K. Limited :
U.K. Limited net sales for the three months ended March 31, 2018 decreased $1.4 million, or 24.6%, to $4.2 million
compared to $5.6 million for the three months ended March 31, 2017. The lower net sales were a result of softness in the U.K.retail sector and a decline in sales relating to certain customers, partially offset by positive effects of foreign currency exchangerates.
Other:
Other net sales were $2.7 million for the three months ended March 31, 2018 compared to $2.5 million for the threemonths ended March 31, 2017.
24

Table of Contents
Gross Profit and Gross Profit Margin
Three Months Ended March 31,
% of2018
% of2017
2018 Net Sales 2017 Net
Sales $ Change % Change (dollars in thousands) Gross profit by segment:
U.S. Debit and Credit $ 8,483 22.8 % $ 11,510 29.0 % $ (3,027) (26.3)% U.S. Prepaid Debit 5,368 34.6 % 2,541 26.8 % 2,827 111.3 % U.K. Limited 16 0.4 % 1,449 25.9 % (1,433) (98.9)% Other 575 21.3 % 595 23.8 % (20) * % Total $14,442 24.4 % $ 16,095 28.7 % $ (1,653) (10.3)%
* Not meaningful, see Other category description in Note 14
Gross profit for the three months ended March 31, 2018 decreased $1.7 million, or 10.3%, to $14.4 million compared to$16.1 million for the three months ended March 31, 2017. Gross profit margin for the three months ended March 31, 2018decreased to 24.4% compared to 28.7% for the three months ended March 31, 2017.
U.S. Debit and Credit: Gross profit for U.S. Debit and Credit for the three months ended March 31, 2018 decreased $3.0 million, or 26.3%, to
$8.5 million compared to $11.5 million during the three months ended March 31 2017. The decrease in gross profit for U.S. Debitand Credit was driven primarily by the reduction in net sales, lower overhead cost absorption, and the acceleration of depreciationexpense relating to the consolidation of our personalization operations. Gross profit margin for U.S. Debit and Credit for the threemonths ended March 31, 2018 decreased to 22.8% compared to 29.0% for the same period in the prior year, due to loweroverhead cost absorption attributed to reduced sales, as well as product mix and the acceleration of depreciation expense of $0.8million.
U.S. Prepaid Debit: Gross profit for U.S. Prepaid Debit during the three months ended March 31, 2018 increased 111.3% to $5.4 million
compared to $2.5 million for the three months ended March 31, 2017. Gross profit margin for U.S. Prepaid Debit for the threemonths ended March 31, 2018 increased to 34.6% compared to 26.8% for the three months ended March 31, 2017. The increasein gross profit and margin was attributed primarily to higher sales volumes and favorable overhead cost absorption.
U.K. Limited : Gross profit for U.K. Limited decreased 98.9% in the three months ended March 31, 2018 to $0.02 million compared to
$1.4 million for the three months ended March 31, 2017, primarily due to the decreased sales activity described above. Grossprofit margin for U.K. Limited was 0.4% during the three months ended March 31, 2018 compared to the gross profit margin of25.9% during the three months ended March 31, 2017. The decline was a result of lower overhead cost absorption attributed toreduced sales.
Other: Other gross profit was $0.6 million in both the three months ended March 31, 2018 and 2017.
25

Table of Contents
Operating Expenses
Three Months
Ended March 31, 2018 2017 $ Change % Change (dollars in thousands) Operating expenses by segment:
U.S. Debit and Credit $ 5,962 $ 6,490 $ (528) (8.1)% U.S. Prepaid Debit 1,043 1,108 (65) (5.9)% U.K. Limited 1,372 1,334 38 2.8 % Other 10,033 8,972 1,061 * % Total $ 18,410 $ 17,904 $ 506 2.8 %
* Not meaningful
Operating expenses for the three months ended March 31, 2018 increased $0.5 million, or 2.8%, to $18.4 millioncompared to $17.9 million for the three months ended March 31, 2017.
U.S. Debit and Credit: U.S. Debit and Credit operating expenses declined to $6.0 million in the three months ended March 31, 2018, compared
to $6.5 million in the three months ended March 31, 2017, due to cost reduction efforts. U.S. Prepaid Debit: U.S. Prepaid Debit operating expenses decreased $0.1 million, or 5.9%, primarily due to reduced selling expenses. U.K. Limited : U.K. Limited operating expenses were $1.4 million in the three months ended March 31, 2018 compared to $1.3 million
in the three months ended March 31, 2017, representing a 2.8% increase and attrituble to foreign exchange rate fluctuations, netof reduced labor and related expenses.
Other: Other operating expenses during the three months ended March 31, 2018 increased $1.1 million compared to the three
months ended March 31, 2017. The net increase primarily resulted from higher technology and consulting costs of $0.5 million,increased legal costs of $0.3 million and increased compensation expense related primarily to transition costs of $0.3 million. Income from Operations and Operating Margin
Three Months Ended March 31,
% of2018
% of2017
2018 Net
Sales 2017 Net
Sales $ Change %
Change (dollars in thousands) (Loss) income from operations by segment:
U.S. Debit and Credit $ 2,522 6.8 % $ 5,020 12.6 % $ (2,498) (49.8)% U.S. Prepaid Debit 4,325 27.9 % 1,433 15.1 % 2,892 201.8 % U.K. Limited (1,357) (32.2)% 115 2.1 % (1,472) * % Other (9,458) * % (8,377) * % (1,081) * % Total $(3,968) (6.7)% $ (1,809) (3.2)% $ (2,159) 119.3 %
* Not meaningful
Loss from operations for the three months ended March 31, 2018 was $4.0 million compared to a loss from operations of$1.8 million for the three months ended March 31, 2017. The Company’s operating loss margin for the three months ended March31, 2018 increased to 6.7% compared to 3.2% for the three months ended March 31, 2017.
26
Table of Contents
U.S. Debit and Credit: Income from operations for U.S. Debit and Credit for the three months ended March 31, 2018 decreased $2.5 million, or
49.8%, to $2.5 million compared to $5.0 million for the three months ended March 31, 2017 due primarily to lower sales volumeand the resulting lower overhead cost absorption discussed above. Operating margins for the three months ended March 31, 2018decreased to 6.8% compared to 12.6% for the three months ended March 31, 2017.
U.S. Prepaid Debit: Income from operations for U.S. Prepaid Debit for the three months ended March 31, 2018 increased 201.8% to $4.3
million compared to $1.4 million for the three months ended March 31, 2017 due to increased sales volumes and the resultingfavorable overhead cost absorption discussed above. U.S. Prepaid Debit operating income margin for the three months endedMarch 31, 2018 increased to 27.9% from 15.1% for the same period in 2017.
U.K. Limited : During the three months ended March 31, 2018, U.K. Limited incurred a loss from operations of $1.4 million,
representing a $1.5 million decrease compared to the three months ended March 31, 2017. The decrease was due to lower salesactivity. Operating margins decreased to (32.2)% during the three months ended March 31, 2018 compared to 2.1% during thethree months ended March 31, 2017. The decline was a result of lower overhead cost absorption attributed to reduced sales.
Other : The loss from operations in Other was $9.5 million for the three months ended March 31, 2018 compared to a loss from
operations of $8.4 million for the same time period of 2017. The comparatively larger operating loss was attributable to higheroperating expenses in the first quarter of 2018.
Interest, net : Interest expense for the three months ended March 31, 2018 increased to $5.5 million compared to $5.1 million for the
three months ended March 31, 2017. The additional interest expense resulted from a higher average interest rate on the First LienTerm Loan during the three months ended March 31, 2018 compared to the three months ended March 31, 2017.
Income tax benefit:
During the three months ended March 31, 2018, there was an income tax benefit of $2.0 million on pre-tax loss of $9.3million, compared with an income tax benefit of $2.3 million on pre-tax loss of $6.8 million for the three months ended March 31,2017. In c onjunction with the Tax Act, the U.S. federal tax rate reduced from 35.0% in 2017 to 21.0% in 2018. The effective taxrate differs from the federal U.S. statutory rate in 2018 primarily due to the impact of state income taxes.
Net loss: During the three months ended March 31, 2018, net loss was $7.3 million, compared to a net loss of $4.5 million during
the three months ended March 31, 2017. The change was primarily due to lower sales volumes and pricing, as well as higheroperating expenses as described above.
Liquidity and Capital Resources
At March 31, 2018, we had $20.2 million of cash and cash equivalents. Of this amount, $1.8 million was held inaccounts outside of the United States.
Our ability to make investments in and grow our business, service our debt and improve our debt leverage ratios, whilemaintaining strong liquidity, will depend upon our ability to generate excess operating cash flows through
27
Table of Contents
our operating subsidiaries. Although we can provide no assurances, we believe that our cash flows from operations, combinedwith our current cash levels and available borrowing capacity, will be adequate to fund debt service requirements and providecash, as required, to support our ongoing operations, capital expenditures, lease obligations and working capital needs.
At March 31, 2018, there was $312.5 million outstanding under the First Lien Term Loan, and we had an undrawn $40.0
million Revolving Credit Facility, of which $20.0 million is available for borrowing. Additional amounts may be available forborrowing during the term of the Revolving Credit Facility, up to the full $40.0 million, to the extent our net leverage ratio doesnot exceed 7.0 times Adjusted EBITDA, as defined in the agreement. The First Lien Term Loan and Revolving Credit Facilitymature on August 17, 2022 and August 17, 2020, respectively.
Interest rates under the First Lien Term Loan, at the Company’s election, are based on either a Eurodollar rate, subject to
an interest rate floor of 1.0%, plus a margin of 4.5%, or a base rate plus a margin of 3.5%. As of March 31, 2018, the interest rateon our First Lien Term Loan was 6.36%.
The First Lien Credit Facility contains customary covenants, including among other things, certain restrictions or
limitations on indebtedness, issuance of liens, investments, dividends, redemptions and other distributions to equity holders, assetsales, certain mergers or consolidations, sales, transfers, leases or dispositions of substantially all of our assets and affiliatetransactions. As of March 31, 2018, we were in compliance with all covenants under the First Lien Credit Facility. We may alsobe required to make repayments on the First Lien Term Loan in advance of the maturity date based on a calculation of excesscash flows, as defined in the agreement, with any required payments to be made after the issuance of the Company’s annualfinancial statements. As of March 31, 2018, we did not expect to have a required excess cash flow payment related to 2018.
Operating Activities
Cash used in operating activities for the three months ended March 31, 2018 was $1.8 million compared to $5.0 millionof cash used in operating activities during the three months ended March 31, 2017. The year over year fluctuation was dueprimarily to working capital cash flow increases, including accounts receivable and inventories, partially offset by an increase inthe net loss incurred during the current year period compared to the prior year period.
Investing Activities
Cash used in investing activities for the three months ended March 31, 2018 of $1.2 million was lower than thecomparative $3.3 million during the three months ended March 31, 2017. Cash used in investing activities during both periodswas related to capital expenditures. In the current year period, capital leases were executed for the acquisition of certainmachinery and equipment totaling $3.7 million.
Financing Activities
During the three months ended March 31, 2018, cash used in financing activities was $0.1 million and related toprincipal payments on capital lease obligations.
Cash used in financing activities during the three months ended March 31, 2017 was $2.9 million and related to dividend
payments of $2.5 million and $0.3 million of taxes withheld and paid on stock-based compensation awards. The Companydiscontinued its quarterly dividend program during August 2017.
Contractual Obligations
During the three months ended March 31, 2018, there were no material changes in our contractual obligations from thosereported in our Annual Report on Form 10-K for the year ended December 31, 2017. Off-Balance Sheet Arrangements
We had no material off-balance sheet arrangements at March 31, 2018.
28

Table of Contents
Critical Accounting Policies and Estimates
The preparation of financial statements in conformity with accounting principles generally accepted in the United Statesrequires management to make estimates and assumptions that affect the amounts and disclosures in the financial statements andaccompanying notes. Actual results could differ from those estimates. Our Critical Accounting Policies and Estimates disclosed inour Annual Report on Form 10-K filed for the year ended December 31, 2017, for which there were no material changes as ofMarch 31, 2018, included:
Impairment Assessments of Goodwill and Long-Lived Assets, Inventory Valuation, Stock-Based Compensation and Income Taxes.
As of January 1, 2018, we adopted ASU 2014-09, Revenue from Contracts with Customers , as amended, which requires an entityto recognize revenue to depict the transfer of promised goods or services to customers in an amount that reflects the considerationto which the entity expects to be entitled in exchange for those goods or services. ASU 2014-09 also requires an entity to disclosesufficient quantitative and qualitative information to enable users of financial statements to understand the nature, amount, timingand uncertainty of revenue and cash flows arising from contracts with customers. We adopted ASU 2014-09 as of January 1,2018, to all of our contracts using the modified retrospective method and recognized the cumulative effect of application as anadjustment to the opening balance of “Accumulated loss” on the Condensed Consolidated Balance Sheet. The comparativefinancial information has not been restated and continues to be reported under the accounting standards in effect for those periods. For periods after January 1, 2018, we account for our revenues as follows: Products Revenue
Product revenue is recognized when obligations under the terms of a contract with a customer are satisfied. In most instances, thisoccurs over time as cards are manufactured for specific customers and have no alternative use and the Company has anenforceable right to payment for work performed. For work performed but not completed and billed, we estimate revenue bytaking actual costs incurred and applying historical margins for similar types of contracts. Items included in Products revenue aremanufactured Financial Payment Cards, including in contact-EMV, Dual-Interface EMV, contactless and magnetic stripe cards,private label credit cards and retail gift cards. Card@Once printers and Consumables are also included in Products revenue, andtheir associated revenues are recognized at the time of shipping. Services Revenue Revenue is recognized for Services as the services are performed. Items included in Services revenue include the personalizationand fulfillment of Financial Payment Cards, providing tamper-evident secure packaging and fulfillment services to Prepaid DebitCard program managers and software as a service personalization of instant issuance debit cards. For work performed but notcompleted and billed, we estimate revenue by taking actual costs incurred and applying historical margins for similar types ofcontracts Customer Contracts
The Company often enters into MSAs with our customers. Generally, a MSA requires a customer to place subsequent purchaseorders or statements of work to obtain goods or services, thus creating enforceable rights and obligations for goods and servicesfor the parties. The contract term as defined by ASU 2014-09 is the length of time it takes to deliver the goods or servicespromised under the purchase order or statement of work. As such, the Company's contracts are generally short term in nature. Item 3. Quantitative and Qualitative Disclosures About Market Ris k
As of March 31, 2018, there have been no material changes in market risk for key input prices, labor and benefits costs,interest rate risk, foreign currency exchange rates or pricing from those included in our Annual Report on Form 10-K for the yearended December 31, 2017.
29

Table of Contents
Item 4. Controls and Procedure s
Evaluation of Disclosure Controls and Procedures
We maintain disclosure controls and procedures (as defined in Rule 13a-15(e) under the Securities Exchange Act of
1934, as amended, (the "Exchange Act")) that are designed to assure that information required to be disclosed in our ExchangeAct reports is recorded, processed, summarized and reported within the time periods specified in the SEC's rules and forms, andthat such information is accumulated and communicated to management, including our Chief Executive Officer and ChiefFinancial Officer, as appropriate, to allow timely decisions regarding required disclosures. Our management, with theparticipation of our Chief Executive Officer and Chief Financial Officer, evaluated the effectiveness of our disclosure controlsand procedures pursuant to Exchange Act Rule 13a-15(b). Based on this evaluation, our Chief Executive Officer and ChiefFinancial Officer concluded that our disclosure controls and procedures were effective as of March 31, 2018.
Changes in Internal Control Over Financial Reporting
Beginning January 1, 2018, we implemented ASU 2014-09, RevenuefromContractswithCustomers. We developed
new accounting policies based on the revenue recognition standard, and implemented changes to our processes related to revenuerecognition and the related control activities. Other than as it relates to ASU 2014-09, there has been no change in the Company’sinternal control over financial reporting during our most recent quarter that has materially affected, or is reasonably likely tomaterially affect, the Company’s internal control over financial reporting. Limitations on Effectiveness of Controls
Our management, including our Chief Executive Officer and Chief Financial Officer, do not expect that our disclosurecontrols and procedures will prevent all errors and fraud. In designing and evaluating the disclosure controls and procedures,management recognized that any controls and procedures, no matter how well designed and operated, can provide onlyreasonable, not absolute, assurance of achieving the desired control objectives. Further, the design of a control system must reflectthe fact that there are resource constraints, and management necessarily was required to apply its judgment in evaluating the cost-benefit relationship of possible controls and procedures. Because of the inherent limitations in all control systems, no evaluationof controls can provide absolute assurance that all control issues and instances of fraud, if any, within the Company have beendetected. These inherent limitations include the realities that judgments in decision making can be faulty, and that breakdownscan occur because of simple error or mistake. Additionally, controls can be circumvented by the individual acts of some persons,by collusion of two or more people or by management’s override of the control.
The design of any system of controls also is based in part upon certain assumptions about the likelihood of future events,
and there can be no assurance that any design will succeed in achieving its stated goals under all potential future conditions. Overtime, controls may become inadequate because of changes in conditions, or the degree of compliance with the policies orprocedures may deteriorate. Because of the inherent limitations in a cost-effective control system, misstatements due to error orfraud may occur and not be detected. PART II – Other Information
Item 1. Legal Proceedings
In Re CPI Card Group Inc. Securities Litigation , Case No. 1:16-CV-04531 (S.D.N.Y.) (the “Class Action”)
On June 15, 2016, two purported CPI stockholders filed putative class action lawsuits captioned Vance, et al. v. CPICard Group Inc., et al. and Chipman, et al. v. CPI Card Group Inc. in the United States District Court for the Southern District ofNew York (the “Court”) against CPI, certain of its former officers and current and former directors, along with the sponsors ofand the financial institutions who served as underwriters for CPI’s October 2015 initial public offering (“IPO”). The complaints,purportedly brought on behalf of all purchasers of CPI common stock pursuant to the October 8, 2015 Registration Statementfiled in connection with the IPO, assert claims under §§11 and 15 of the Securities Act of 1933, as amended (the “Securities Act”)and seek, among other things, damages and costs. In particular, the complaints allege that the Registration Statement containedfalse or misleading statements or omissions
30
Table of Contents
regarding CPI’s customers’ (i) purchases of Europay, MasterCard and VISA chip cards (collectively, “EMV cards”) during thefirst half of fiscal year 2015 and resulting EMV card inventory levels: and (ii) capacity to purchase additional EMV cards in thefourth quarter of fiscal year 2015, and the remainder of the fiscal year ended December 31, 2015. The complaints allege that theseactions artificially inflated the price of CPI common stock issued pursuant to the IPO.
On August 30, 2016, the Court consolidated the Vance and Chipman actions and appointed lead plaintiff and lead
counsel pursuant to the Private Securities Litigation Reform Act (the “PSLRA”). On October 17, 2016, lead plaintiff filed aconsolidated amended complaint, asserting the same claims for violations of §§11 and 15 of the Securities Act. The amendedcomplaint is based principally on the same theories as the original complaints, but adds allegations that the Registration Statementcontained inadequate risk disclosures and failed to disclose (i) small and mid-size issuers’ slower-than-anticipated conversion toEMV technology and (ii) increased pricing pressure and competition CPI faced in the EMV market.
On November 16, 2016, the Company filed a motion to dismiss the amended complaint, which was denied by the Court
on October 30, 2017. On January 12, 2018, the Company filed an answer to the amended complaint. On March 23, 2018, leadplaintiff filed his motion for class certification.
The Company believes these claims are without merit and is defending the Class Action vigorously.
Heckermann v. Montross et al. , Case No. 1:17-CV-01673 (D. Del.) (the “Derivative Suit”) On November 20, 2017, a purported CPI stockholder filed a stockholder derivative complaint in the United States
District Court for the District of Delaware (the “Court”) against certain of CPI’s former officers and current and former directors,along with the sponsors of the IPO. CPI is also named as a nominal defendant. The derivative complaint asserts claims under§§10(b) and 20(a) of the Securities Exchange Act of 1934 and SEC Rule 10b-5 and seeks, among other things, injunctive relief,damages and costs. It alleges false or misleading statements and omissions in the Registration Statement filed by CPI inconnection with its IPO and subsequent public filings and statements. The derivative complaint also asserts claims for purportedbreaches of fiduciary duties, unjust enrichment, mismanagement and waste of corporate assets.
On March 28, 2018, the Court entered the parties’ stipulated order staying the Derivative Suit pending final
determination of the Class Action. The Company believes these claims are without merit and is defending the Derivative Suit vigorously.
Gemalto S.A. v. CPI Card Group Inc. (2 cases)
First case. This suit was initially filed by Gemalto against the Company in the United States District Court for theWestern District of Texas in October 2015. The complaint alleged that the Company infringed a now-expired Gemalto patent byincorporating into the Company’s products microchips that allegedly practice the EMV standard. The Company successfullymoved to transfer the lawsuit to the District of Colorado, answered the complaint, and filed counterclaims that the asserted patentwas invalid and unenforceable, and that Gemalto’s lawsuit was a “sham” intended to interfere with the Company’s IPO andbusiness relationships.
During 2016, the Company filed an IPR petition with the United States Patent & Trademark Office’s PTAB, seeking re-
examination of Gemalto’s asserted patent, and the United States District Court for the District of Colorado granted theCompany’s motion to stay the litigation pending the PTAB’s consideration of the Company’s challenge to the patentability ofasserted claims.
Second case. On May 3, 2016, Gemalto filed a second patent infringement action against CPI in the United States DistrictCourt for the District of Colorado. The complaint alleged that the Company infringed a Gemalto patent on networked smartcardprinting by way of the Company’s Card@Once offering. During 2017, the Company filed an IPR petition with the PTAB, seekingre-examination of Gemalto’s asserted patent.
On September 28, 2017, the Company reached a settlement with Gemalto to resolve both lawsuits. Under the terms of
the settlement, the Company made a one-time payment of $750,000 in the fourth quarter of 2017. The
31

Table of Contents
settlement resulted in the dismissal of both lawsuits with prejudice, and included a mutual covenant not to sue for a period of 18months.
CPI Card Group Inc. v. Multi Packaging Solutions, Inc., et al. (2 cases)
First case. On October 11, 2016, the Company filed a patent infringement suit against Multi Packaging Solutions, Inc.(“MPS”) in the United States District Court for the District of Colorado. The complaint asserts that MPS ultrasecure gift cardpackages sold to at least one customer infringe a Company patent on ultrasecure gift card packages. The Company’s patent willexpire in 2028. MPS has answered the complaint and counterclaimed for invalidity and noninfringement. The Company’spreliminary injunction request was denied without prejudice after MPS represented that it had voluntarily ceased using theaccused technology and will notify CPI before it re-starts. Discovery is underway. MPS has moved to dismiss on the ground thatthe wrong Company subsidiary filed the suit, and the Company is moving to amend to add the applicable subsidiary. The case isstayed until that issue is resolved. If the case is dismissed, the Company's subsidiary will promptly re-file.
In June 2017, MPS filed an early motion for summary judgment and sought to stay discovery pending the outcome of
that motion. Both motions were denied in August 2017. Also in June 2017, MPS filed an IPR petition with the PTAB. Also, theCompany filed its preliminary opposition to the IPR Petition in October 2017. In September 2017, the Company filed a motion toreplace the named plaintiff in the litigation with the Company’s wholly owned subsidiary, CPI Card Group-Minnesota, Inc.; MPSsought to dismiss the complaint for lack of standing on the same ground. That issue has been fully briefed and is awaitingdecision. The PTAB instituted the IPR on January 9, 2018, and the Company prepared and filed its formal response in the IPR onApril 15, 2018. The Company intends to vigorously assert its intellectual property rights in connection with this litigation and theIPR.
Second case. During the summer of 2017, the Company commenced a lawsuit in the District of Minnesota against a
former employee, MPS, and two MPS employees (collectively, the Defendants). The former employee was a sales executive wholeft the Company in 2017 to join MPS. In the lawsuit, the Company alleges that the Defendants misappropriated the Company'strade secrets and confidential information, that the former employee violated his employment agreements with the Company, andthat Defendants committed various related business torts. After some early discovery, the Company moved for a preliminaryinjunction, which the Court granted in December, 2017. The litigation is ongoing .
In addition to the matters described above, the Company is subject to routine legal proceedings in the ordinary course of
business. The Company believes that the ultimate resolution of these matters will not have a material adverse effect on ourbusiness, financial condition or results of operations. Item 1A. Risk Factor s
The risk factors disclosed in the section entitled “Risk Factors” in our Annual Report on Form 10-K for the year endedDecember 31, 2017 set forth information relating to various risks and uncertainties that could materially adversely affect ourbusiness, financial condition and operating results. Such risk factors continue to be relevant to an understanding of our business,financial condition and operating results. As of the date of this Quarterly Report on Form 10-Q, there have been no materialchanges with respect to such risk factors. Item 2. Unregistered Sales of Equity Securities and Use of Proceeds Unregistered Sales of Equity Securities None. Issuer Purchases of Equity Securities
None.
32

Table of Contents
Item 6. Exhibit s
Exhibit Number
Description
31.1 Certification of Chief Executive Officer pursuant to Section 302 of the Sarbanes-Oxley Act of 2002.31.2 Certification of Chief Financial Officer pursuant to Section 302 of the Sarbanes-Oxley Act of 2002.32.1 Certification of Chief Executive Officer pursuant to Section 906 of the Sarbanes-Oxley Act of 2002.32.2 Certification of Chief Financial Officer pursuant to Section 906 of the Sarbanes-Oxley Act of 2002.101.INS XBRL Instance Document.101.SCH XBRL Taxonomy Extension Schema Document.101.CAL XBRL Taxonomy Extension Calculation Linkbase Document.101.LAB XBRL Taxonomy Extension Label Linkbase Document.101.PRE XBRL Taxonomy Extension Presentation Linkbase Document.101.DEF XBRL Taxonomy Extension Definition Linkbase Document.
33

Table of Contents
SIGNATURE S
Pursuant to the requirement of the Securities Exchange Act of 1934, the registrant has duly caused this report to besigned on its behalf by the undersigned thereunto duly authorized.
CPI CARD GROUP INC. /s/ Lillian Etzkorn Lillian Etzkorn Chief Financial Officer May 9, 2018
34
Exhibit 31.1
Exhibit 31.1
CERTIFICATION PURSUANT TO SECTION 302OF THE SARBANES-OXLEY ACT OF 2002
I, Scott Scheirman, certify that: 1. I have reviewed this quarterly report on Form 10-Q of CPI Card Group Inc.; 2. Based on my knowledge, this report does not contain any untrue statement of a material fact or omit to state a material fact
necessary to make the statements made, in light of the circumstances under which such statements were made, not misleadingwith respect to the period covered by this report;
3. Based on my knowledge, the financial statements, and other financial information included in this report, fairly present in all
material respects the financial condition, results of operations and cash flows of the registrant as of, and for, the periodspresented in this report;
4. The registrant’s other certifying officer and I are responsible for establishing and maintaining disclosure controls and
procedures (as defined in Exchange Act Rules 13a-15(e) and 15d-15(e)) and internal control over financial reporting (asdefined in Exchange Act Rules 13a-15(f) and 15d-15(f)) for the registrant and have:
a) Designed such disclosure controls and procedures, or caused such disclosure controls and procedures to be designed
under our supervision, to ensure that material information relating to the registrant, including its consolidatedsubsidiaries, is made known to us by others within those entities, particularly during the period in which this report isbeing prepared;
b) Designed such internal controls over financial reporting, or caused such internal control over financial reporting to be
designed under our supervision, to provide reasonable assurance regarding the reliability of financial reporting and thepreparation of the financial statements for external purposes in accordance with generally accepted accountingprinciples;
c) Evaluated the effectiveness of the registrant’s disclosure controls and procedures and presented in this report our
conclusions about the effectiveness of the disclosure controls and procedures, as of the end of the period covered by thisreport based on such evaluation; and
d) Disclosed in this report any change in the registrant’s internal control over financial reporting that occurred during the
registrant’s most recent fiscal quarter (the registrant’s fourth fiscal quarter in the case of an annual report) that hasmaterially affected, or is reasonably likely to materially affect, the registrant’s internal control over financial reporting;and
5. The registrant’s other certifying officer and I have disclosed, based on our most recent evaluation of internal control over
financial reporting, to the registrant’s auditors and the audit committee of the registrant’s board of directors (or personsperforming the equivalent functions):
a) All significant deficiencies and material weaknesses in the design or operation of internal control over financial
reporting which are reasonably likely to adversely affect the registrant’s ability to record, process, summarize and reportfinancial information; and
b) Any fraud, whether or not material, that involves management or other employees who have a significant role in the
registrant’s internal control over financial reporting. Date: May 9, 2018
/s/ Scott ScheirmanScott ScheirmanPresident and Chief Executive Officer
Exhibit 31.2

Exhibit 31.2
CERTIFICATION PURSUANT TO SECTION 302OF THE SARBANES-OXLEY ACT OF 2002
I, Lillian Etzkorn, certify that: 1. I have reviewed this quarterly report on Form 10-Q of CPI Card Group Inc.; 2. Based on my knowledge, this report does not contain any untrue statement of a material fact or omit to state a material fact
necessary to make the statements made, in light of the circumstances under which such statements were made, not misleadingwith respect to the period covered by this report;
3. Based on my knowledge, the financial statements, and other financial information included in this report, fairly present in all
material respects the financial condition, results of operations and cash flows of the registrant as of, and for, the periodspresented in this report;
4. The registrant’s other certifying officer and I are responsible for establishing and maintaining disclosure controls and
procedures (as defined in Exchange Act Rules 13a-15(e) and 15d-15(e)) and internal control over financial reporting (asdefined in Exchange Act Rules 13a-15(f) and 15d-15(f)) for the registrant and have:
a) Designed such disclosure controls and procedures, or caused such disclosure controls and procedures to be designed
under our supervision, to ensure that material information relating to the registrant, including its consolidatedsubsidiaries, is made known to us by others within those entities, particularly during the period in which this report isbeing prepared;
b) Designed such internal controls over financial reporting, or caused such internal control over financial reporting to be
designed under our supervision, to provide reasonable assurance regarding the reliability of financial reporting and thepreparation of the financial statements for external purposes in accordance with generally accepted accountingprinciples;
c) Evaluated the effectiveness of the registrant’s disclosure controls and procedures and presented in this report our
conclusions about the effectiveness of the disclosure controls and procedures, as of the end of the period covered by thisreport based on such evaluation; and
d) Disclosed in this report any change in the registrant’s internal control over financial reporting that occurred during the
registrant’s most recent fiscal quarter (the registrant’s fourth fiscal quarter in the case of an annual report) that hasmaterially affected, or is reasonably likely to materially affect, the registrant’s internal control over financial reporting;and
5. The registrant’s other certifying officer and I have disclosed, based on our most recent evaluation of internal control over
financial reporting, to the registrant’s auditors and the audit committee of the registrant’s board of directors (or personsperforming the equivalent functions):
a) All significant deficiencies and material weaknesses in the design or operation of internal control over financial
reporting which are reasonably likely to adversely affect the registrant’s ability to record, process, summarize and reportfinancial information; and
b) Any fraud, whether or not material, that involves management or other employees who have a significant role in the
registrant’s internal control over financial reporting. Date: May 9, 2018
/s/ Lillian EtzkornLillian Etzkorn Chief Financial Officer
Exhibit 32.1

Exhibit 32.1
CERTIFICATION PURSUANT TO 18 U.S.C. SECTION 1350,ADOPTED PURSUANT TO SECTION 906 OF THE SARBANES-OXLEY ACT OF 2002
In connection with the Quarterly Report on Form 10-Q of CPI Card Group Inc. (the “Company”) for the period ended March 31,2018, as filed with the Securities and Exchange Commission on the date hereof (the “Report”), I, Scott Scheirman, President andChief Executive Officer of the Company, certify to the best of my knowledge, pursuant to 18 U.S.C. Section 1350, as adoptedpursuant to Section 906 of the Sarbanes-Oxley Act of 2002, that: (1) The Report fully complies with the requirements of Section 13(a) or 15(d) of the Securities Exchange Act of 1934, and (2) The information contained in the Report fairly presents, in all material respects, the financial condition and results ofoperations of the Company.
/s/ Scott ScheirmanScott ScheirmanPresident and Chief Executive Officer
Date: May 9, 2018
Exhibit 32.2

Exhibit 32.2
CERTIFICATION PURSUANT TO 18 U.S.C. SECTION 1350,ADOPTED PURSUANT TO SECTION 906 OF THE SARBANES-OXLEY ACT OF 2002
In connection with the Quarterly Report on Form 10-Q of CPI Card Group Inc. (the “Company”) for the period ended March 31,2018, as filed with the Securities and Exchange Commission on the date hereof (the “Report”), I, Lillian Etzkorn, Chief FinancialOfficer of the Company, certify to the best of my knowledge, pursuant to 18 U.S.C. Section 1350, as adopted pursuant to Section906 of the Sarbanes-Oxley Act of 2002, that: (1) The Report fully complies with the requirements of Section 13(a) or 15(d) of the Securities Exchange Act of 1934, and (2) The information contained in the Report fairly presents, in all material respects, the financial condition and results ofoperations of the Company.
/s/ Lillian EtzkornLillian Etzkorn Chief Financial Officer
Date: May 9, 2018