Embed Size (px)
Citation preview
NASDAQ: CPHDNASDAQ: CPHD
Baird’s 2008 Small Cap Health Care ConferenceSeptember 10, 2008
Baird’s 2008 Small Cap Health Care ConferenceSeptember 10, 2008
© 2008 Cepheid2
Forward Looking StatementDuring the course of this presentation, dated 10 September 2008, we may make projections or other forward looking statements regarding future events or the future financial performance of Cepheid. We wish to caution you that such statements are just projections and that actual events or results may differ materially. We refer you to the documents that we have filed from time to time with the SEC, specifically our last filed Form 10-K and most recent Form 10-Q filed. These documents contain and identify important factors that could cause the actual results to differ materially from those contained in these projections and forward looking statements.
During the course of this presentation, dated 10 September 2008, we may make projections or other forward looking statements regarding future events or the future financial performance of Cepheid. We wish to caution you that such statements are just projections and that actual events or results may differ materially. We refer you to the documents that we have filed from time to time with the SEC, specifically our last filed Form 10-K and most recent Form 10-Q filed. These documents contain and identify important factors that could cause the actual results to differ materially from those contained in these projections and forward looking statements.
© 2008 Cepheid
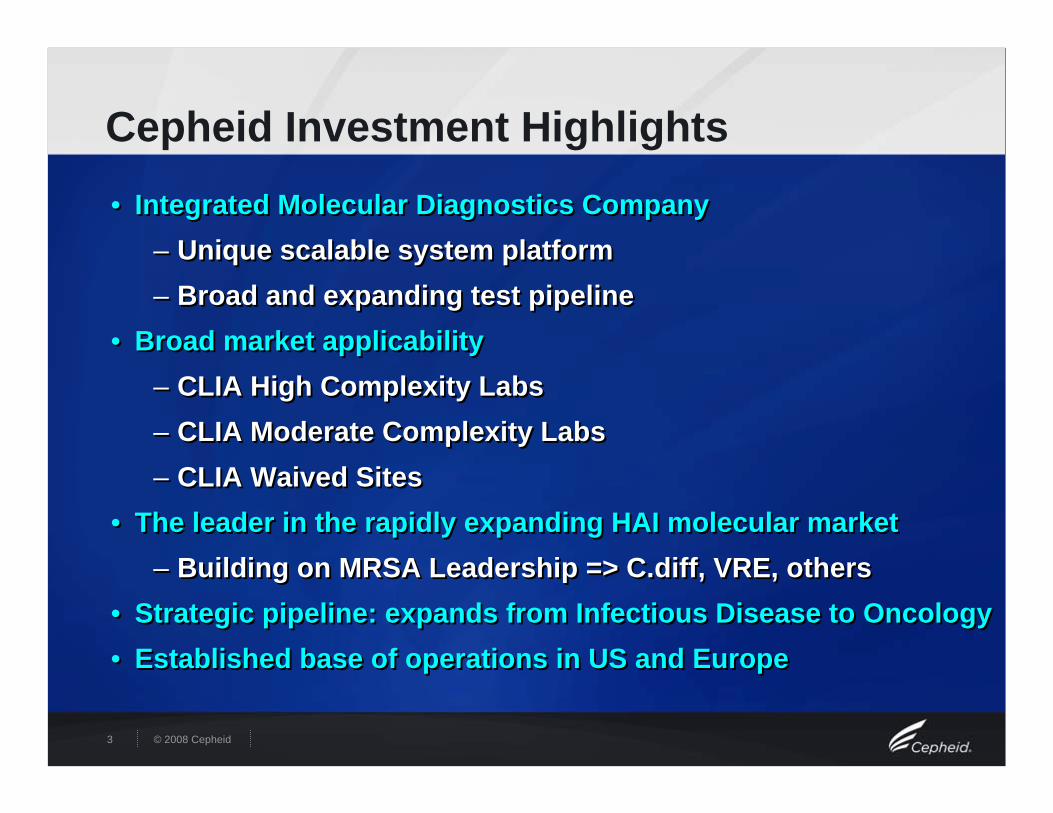
Cepheid Investment Highlights
• Integrated Molecular Diagnostics Company– Unique scalable system platform– Broad and expanding test pipeline
• Broad market applicability– CLIA High Complexity Labs– CLIA Moderate Complexity Labs – CLIA Waived Sites
• The leader in the rapidly expanding HAI molecular market– Building on MRSA Leadership => C.diff, VRE, others
• Strategic pipeline: expands from Infectious Disease to Oncology• Established base of operations in US and Europe
3
© 2008 Cepheid
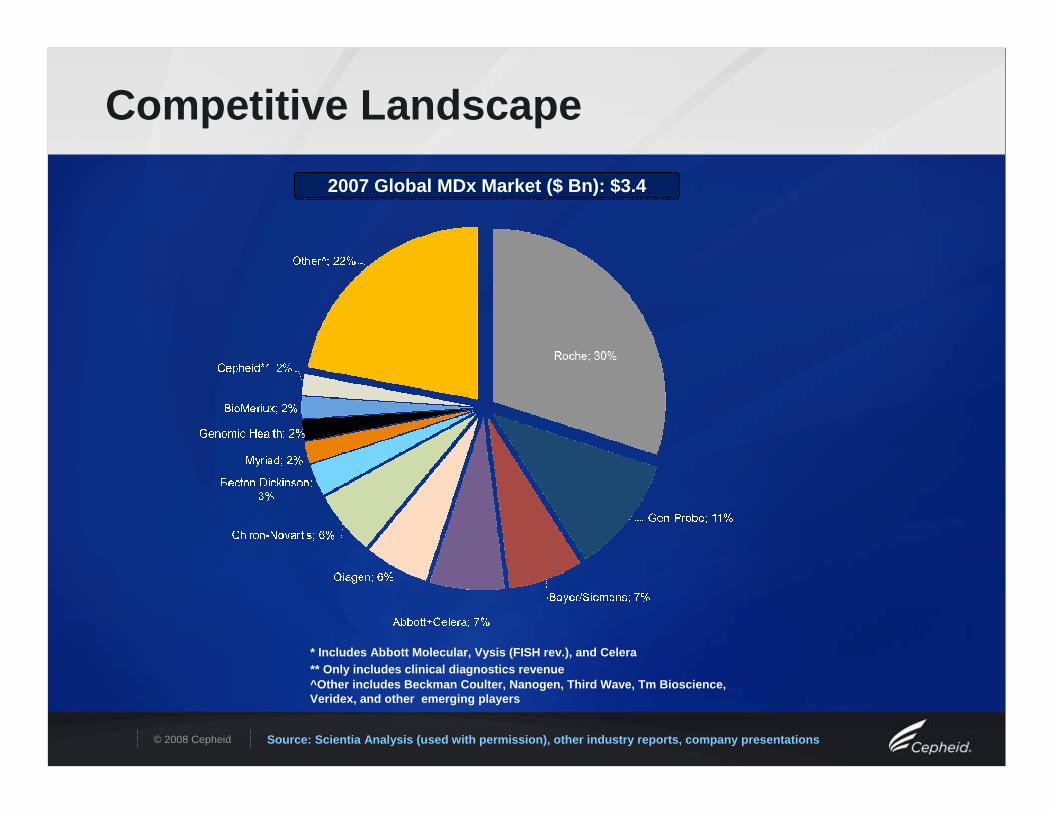
Competitive Landscape
Source: Scientia Analysis (used with permission), other industry reports, company presentations
2007 Global MDx Market ($ Bn): $3.4 2007 Global MDx Market ($ Bn): $3.4
^Other includes Beckman Coulter, Nanogen, Third Wave, Tm Bioscience, Veridex, and other emerging players
* Includes Abbott Molecular, Vysis (FISH rev.), and Celera** Only includes clinical diagnostics revenue
© 2008 Cepheid
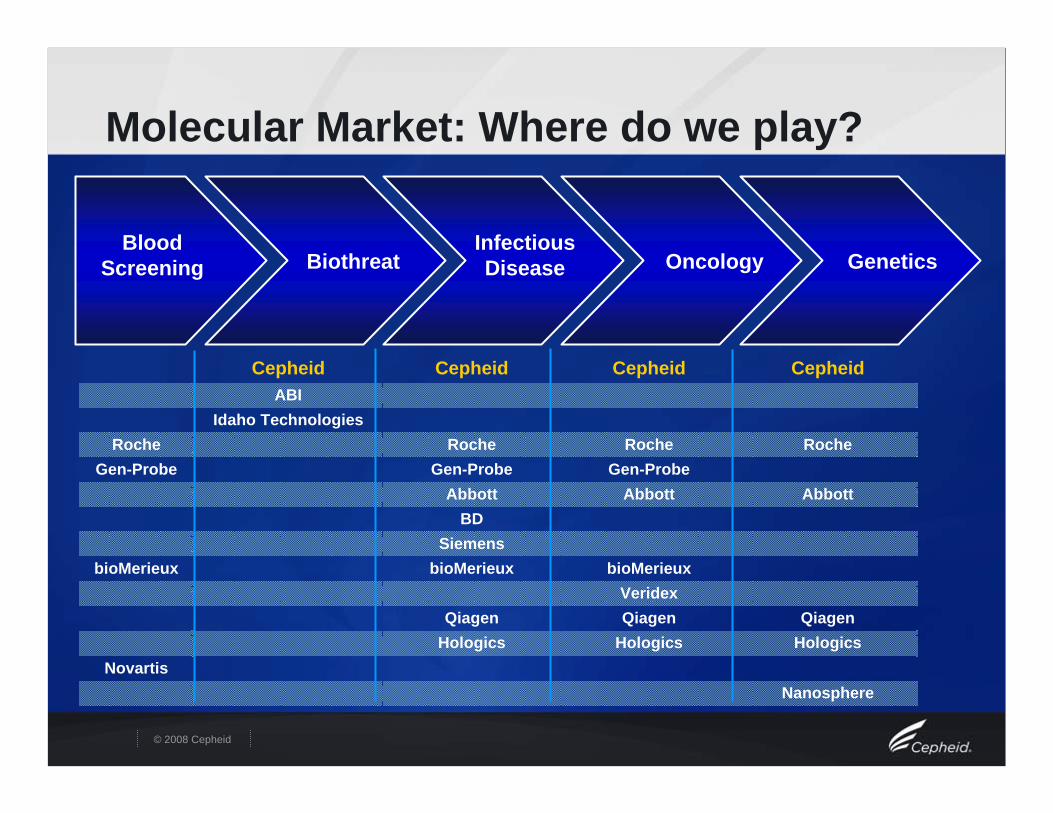
Molecular Market: Where do we play?
BloodScreening
InfectiousDisease OncologyBiothreat Genetics
NovartisNanosphere
HologicsHologicsHologicsQiagenQiagenQiagen
VeridexbioMerieuxbioMerieuxbioMerieux
SiemensBD
AbbottAbbott AbbottGen-ProbeGen-ProbeGen-Probe
RocheRocheRocheRocheIdaho Technologies
ABICepheidCepheidCepheidCepheid
© 2008 Cepheid
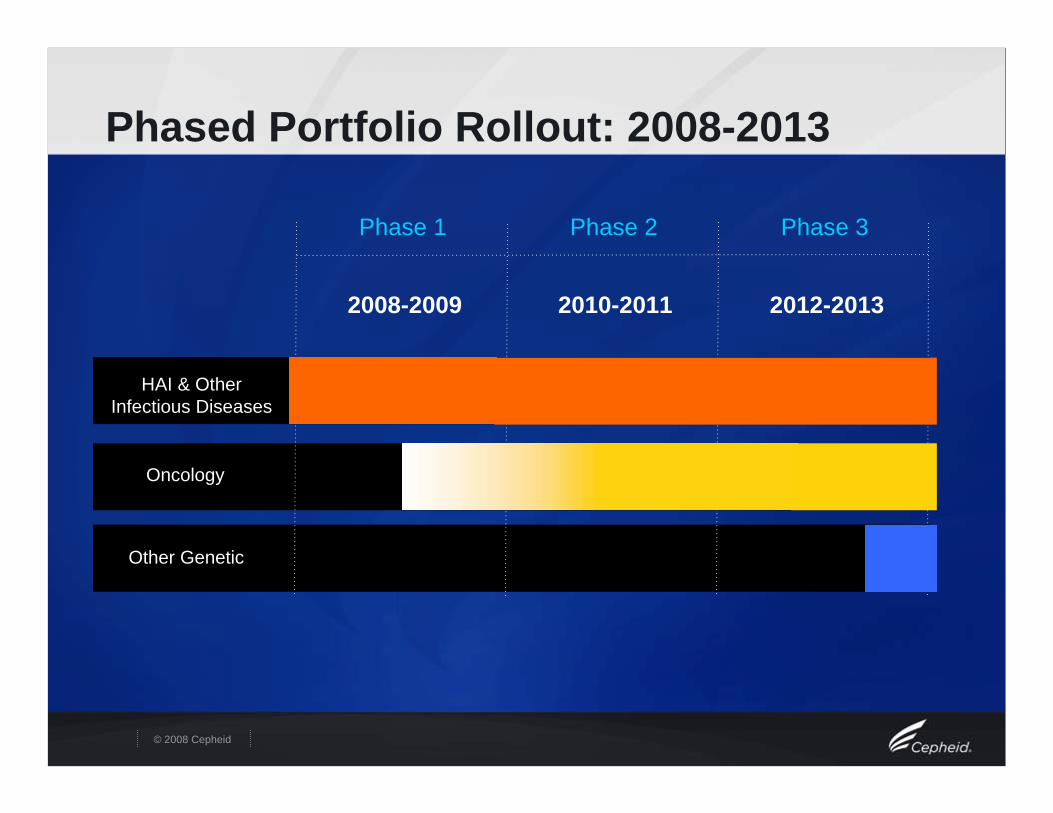
Phased Portfolio Rollout: 2008-2013
2008-2009 2010-2011 2012-2013
Phase 1 Phase 2 Phase 3
HAI & Other Infectious Diseases
Other Genetic
Oncology
© 2008 Cepheid
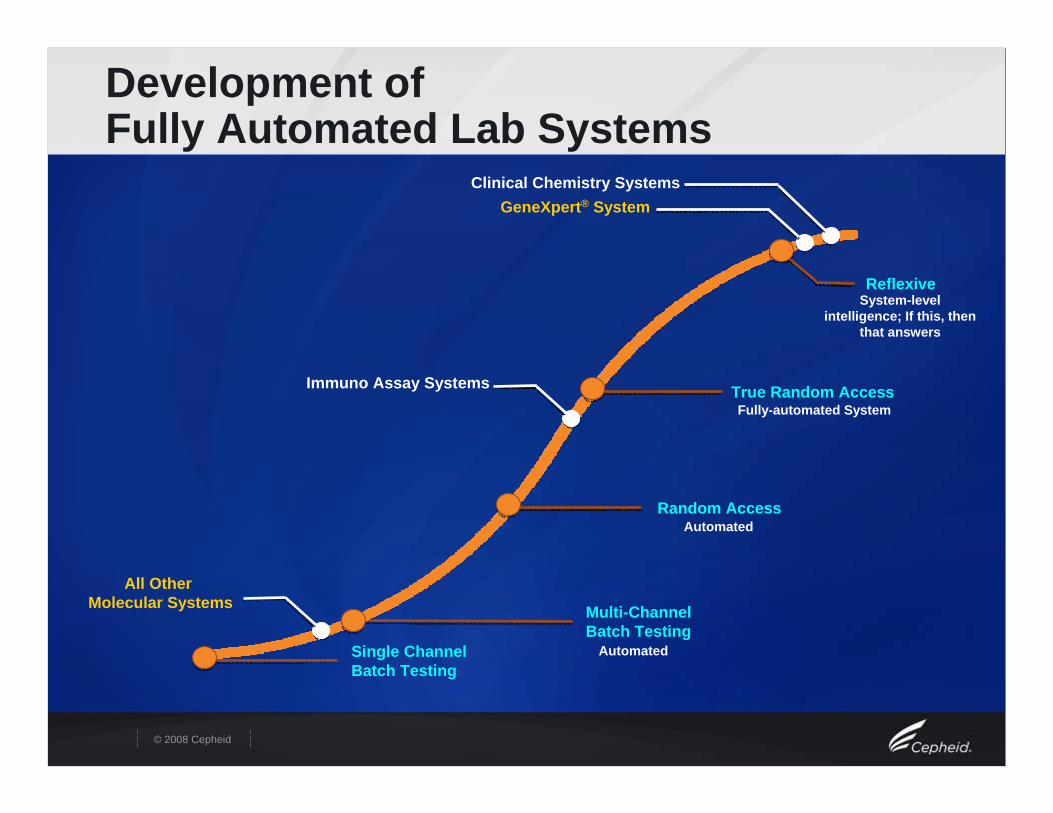
ReflexiveSystem-level
intelligence; If this, then that answers
True Random AccessFully-automated System
Random AccessAutomated
Multi-ChannelBatch Testing
AutomatedSingle Channel Batch Testing
Development of Fully Automated Lab Systems
GeneXpert® System Clinical Chemistry Systems
Immuno Assay Systems
All Other Molecular Systems
© 2008 Cepheid
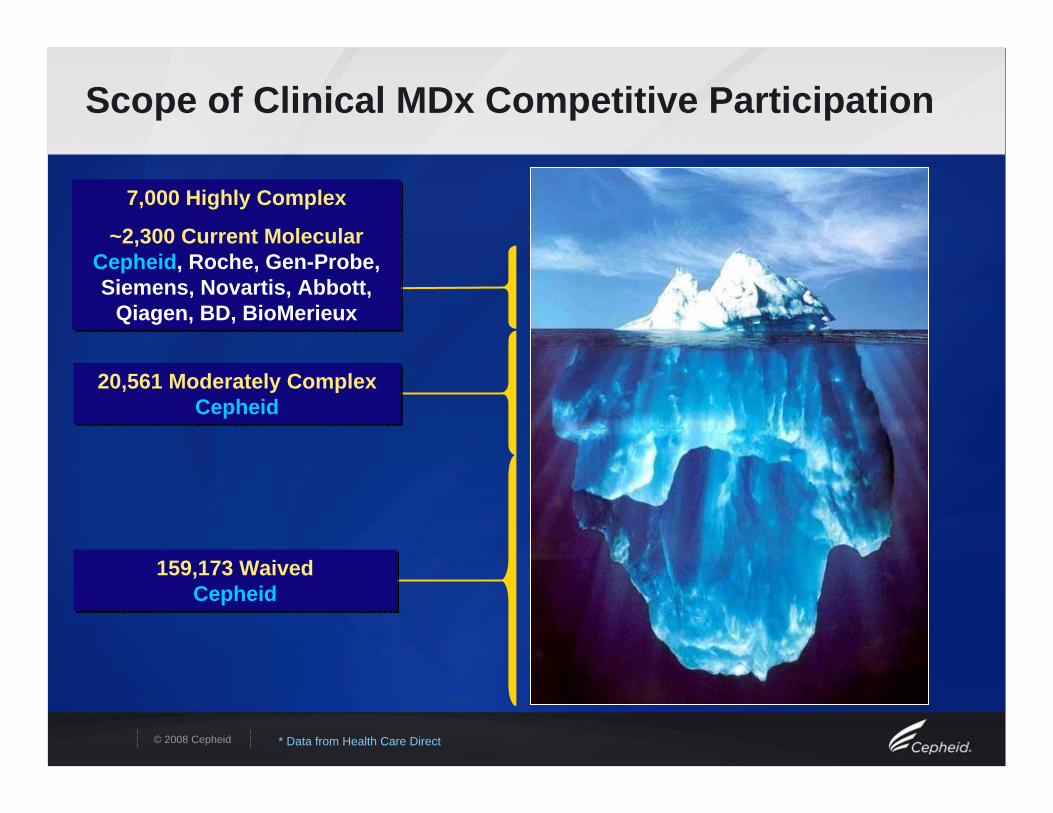
Scope of Clinical MDx Competitive Participation
7,000 Highly Complex
~2,300 Current MolecularCepheid, Roche, Gen-Probe, Siemens, Novartis, Abbott,
Qiagen, BD, BioMerieux
7,000 Highly Complex
~2,300 Current MolecularCepheid, Roche, Gen-Probe, Siemens, Novartis, Abbott,
Qiagen, BD, BioMerieux
159,173 WaivedCepheid
159,173 WaivedCepheid
* Data from Health Care Direct
20,561 Moderately ComplexCepheid
20,561 Moderately ComplexCepheid
© 2008 Cepheid
GeneXpert® SystemA Disruptive TechnologyGeneXpert® SystemA Disruptive Technology
© 2008 Cepheid
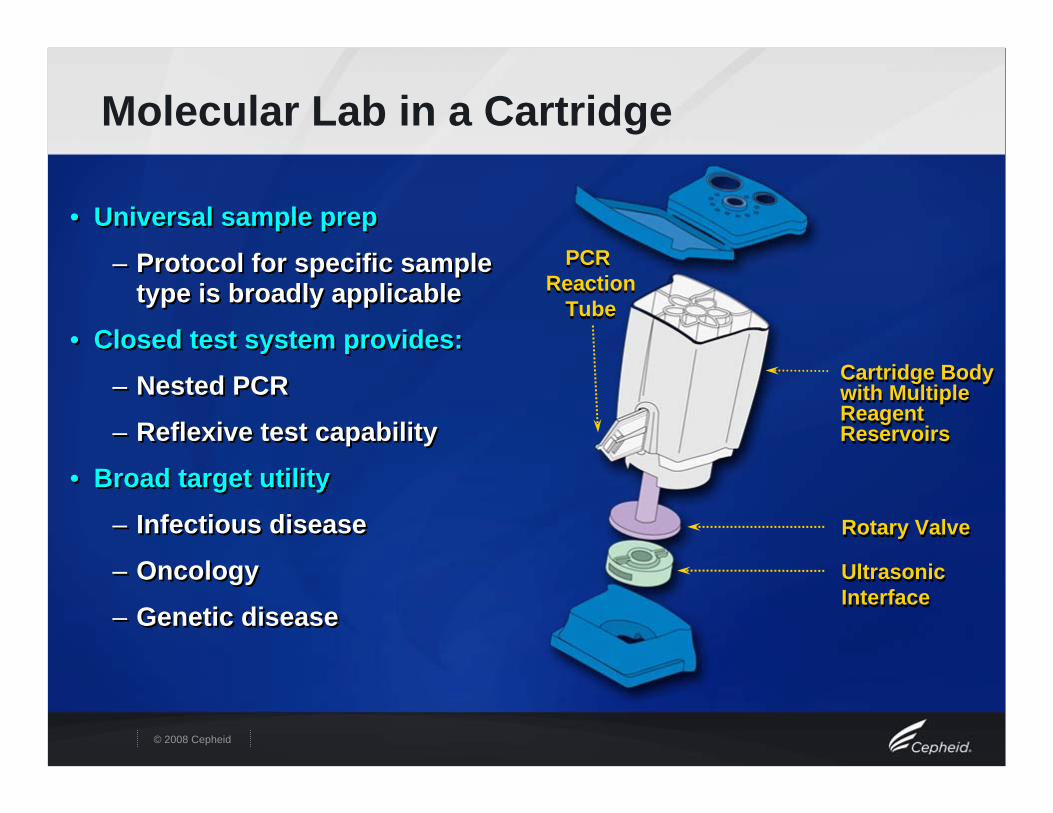
Molecular Lab in a Cartridge
• Universal sample prep
– Protocol for specific sample type is broadly applicable
• Closed test system provides:
– Nested PCR
– Reflexive test capability
• Broad target utility
– Infectious disease
– Oncology
– Genetic disease
• Universal sample prep
– Protocol for specific sample type is broadly applicable
• Closed test system provides:
– Nested PCR
– Reflexive test capability
• Broad target utility
– Infectious disease
– Oncology
– Genetic disease
Cartridge Bodywith Multiple ReagentReservoirs
Cartridge Bodywith Multiple ReagentReservoirs
PCR Reaction
Tube
PCR Reaction
Tube
Ultrasonic InterfaceUltrasonic Interface
Rotary ValveRotary Valve
© 2008 Cepheid
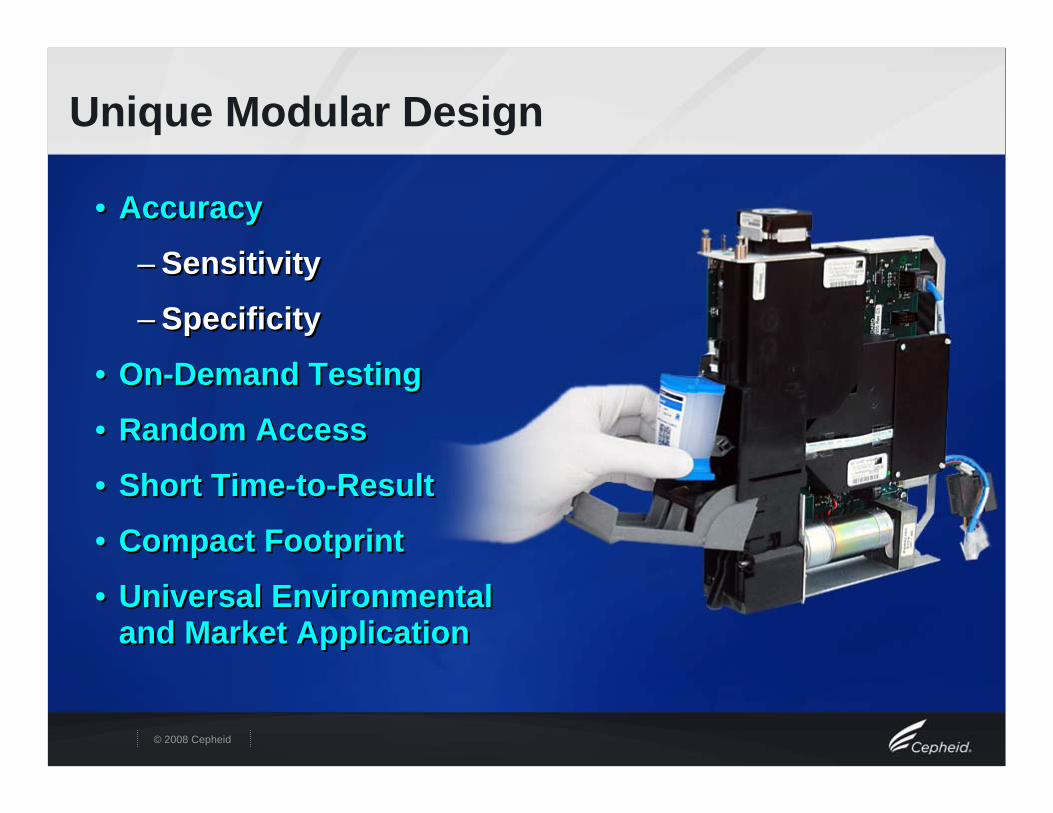
Unique Modular Design
• Accuracy
– Sensitivity
– Specificity
• On-Demand Testing
• Random Access
• Short Time-to-Result
• Compact Footprint
• Universal Environmental and Market Application
• Accuracy
– Sensitivity
– Specificity
• On-Demand Testing
• Random Access
• Short Time-to-Result
• Compact Footprint
• Universal Environmental and Market Application
© 2008 Cepheid1212
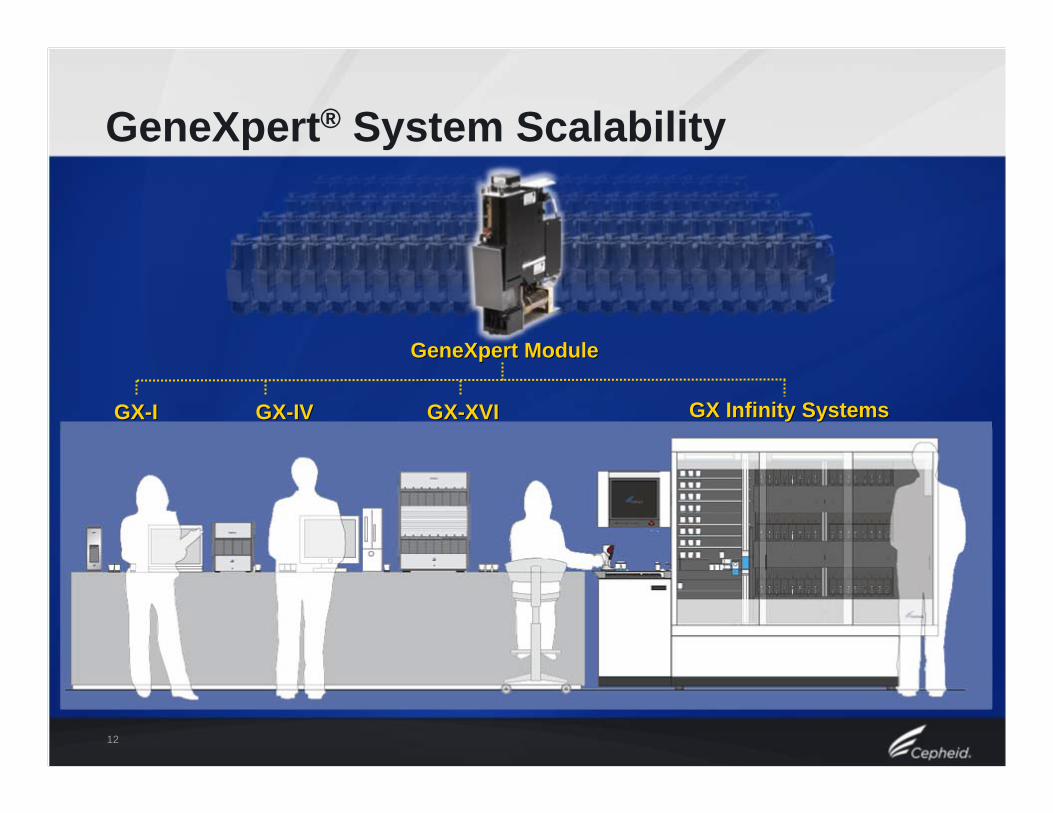
GeneXpert® System Scalability
GX-IGX-I GX-IVGX-IV GX-XVIGX-XVI GX Infinity SystemsGX Infinity Systems
GeneXpert ModuleGeneXpert Module
© 2008 Cepheid1313
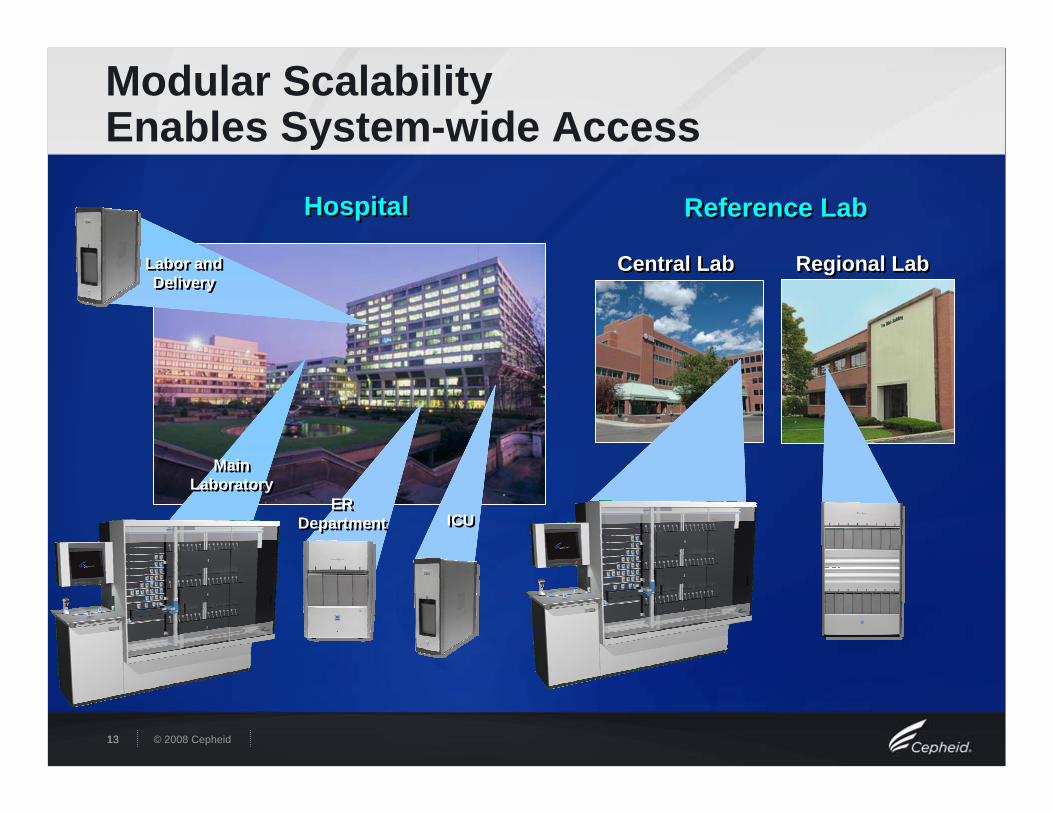
Modular Scalability Enables System-wide Access
HospitalHospital
Central LabCentral Lab Regional LabRegional LabLabor and Delivery
Labor and Delivery
ER Department
ER Department ICUICU
Reference LabReference Lab
Main Laboratory
Main Laboratory
© 2008 Cepheid
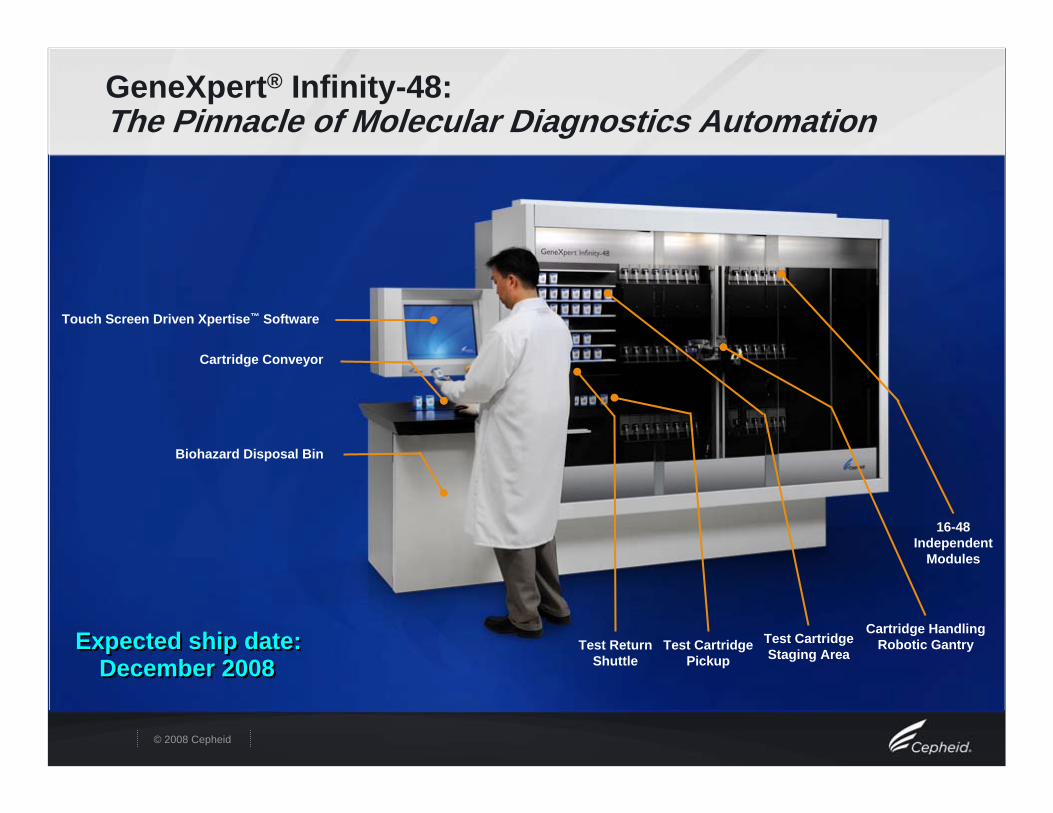
GeneXpert® Infinity-48: The Pinnacle of Molecular Diagnostics Automation
Touch Screen Driven Xpertise™ Software
Cartridge Conveyor
Test CartridgeStaging Area
Cartridge Handling Robotic Gantry
16-48 Independent
Modules
Test CartridgePickup
Test Return Shuttle
Biohazard Disposal Bin
Expected ship date: December 2008
Expected ship date: December 2008
© 2008 Cepheid
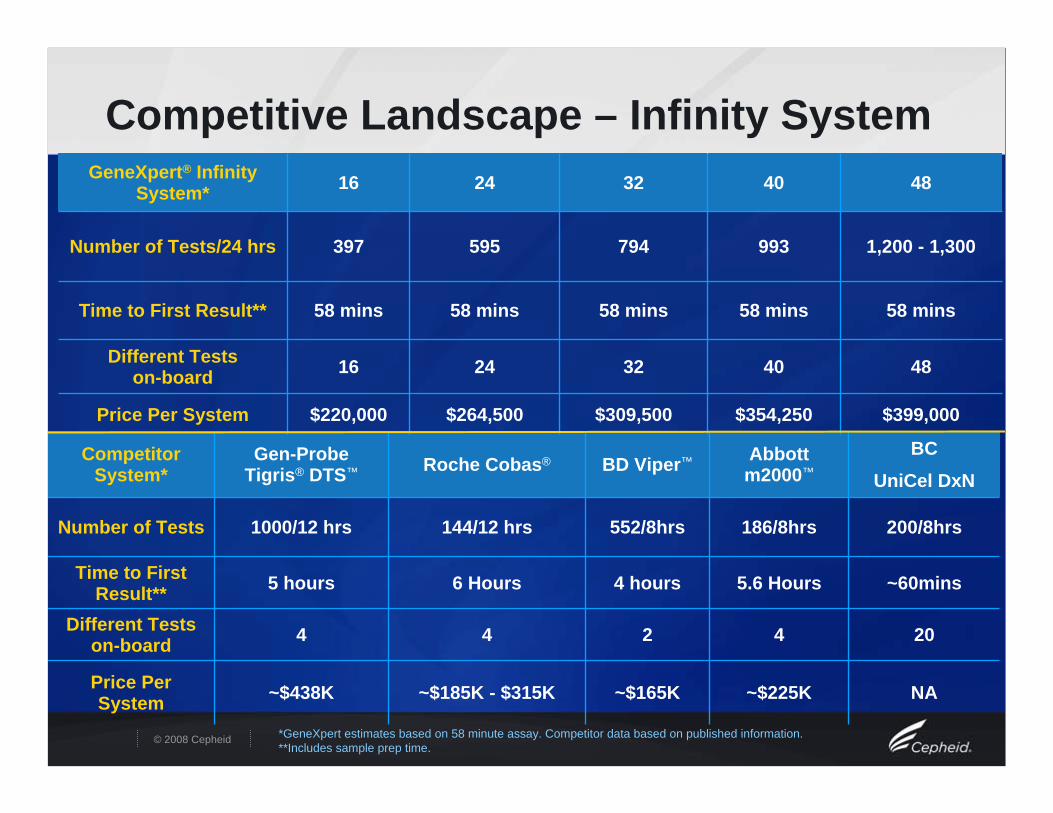
204244Different Tests on-board
NA
~60mins
200/8hrs
BC
UniCel DxNCompetitor
System*Gen-Probe
Tigris® DTS™ Roche Cobas® BD Viper™ Abbott m2000™
Number of Tests 1000/12 hrs 144/12 hrs 552/8hrs 186/8hrs
Time to First Result** 5 hours 6 Hours 4 hours 5.6 Hours
Price Per System ~$438K ~$185K - $315K ~$165K ~$225K
Competitive Landscape – Infinity System
*GeneXpert estimates based on 58 minute assay. Competitor data based on published information.**Includes sample prep time.
4840322416Different Tests on-board
GeneXpert® Infinity System* 16 24 32 40 48
Number of Tests/24 hrs 397 595 794 993 1,200 - 1,300
Time to First Result** 58 mins 58 mins 58 mins 58 mins 58 mins
Price Per System $220,000 $264,500 $309,500 $354,250 $399,000
© 2008 Cepheid
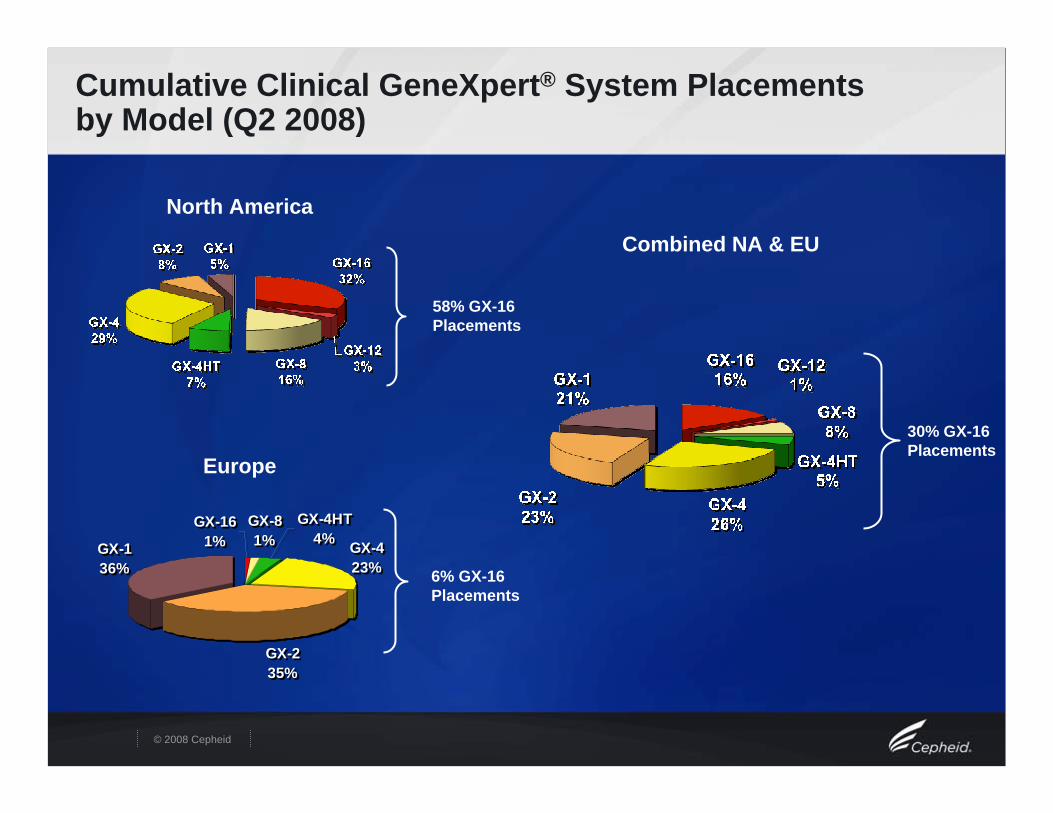
Cumulative Clinical GeneXpert® System Placements by Model (Q2 2008)
North America
Combined NA & EU
Europe
58% GX-16 Placements
GX-423%
GX-235%
GX-136%
GX-161%
GX-81%
GX-4HT4% GX-4
23%
GX-235%
GX-136%
GX-161%
GX-81%
GX-4HT4%
6% GX-16 Placements
30% GX-16 Placements
© 2008 Cepheid
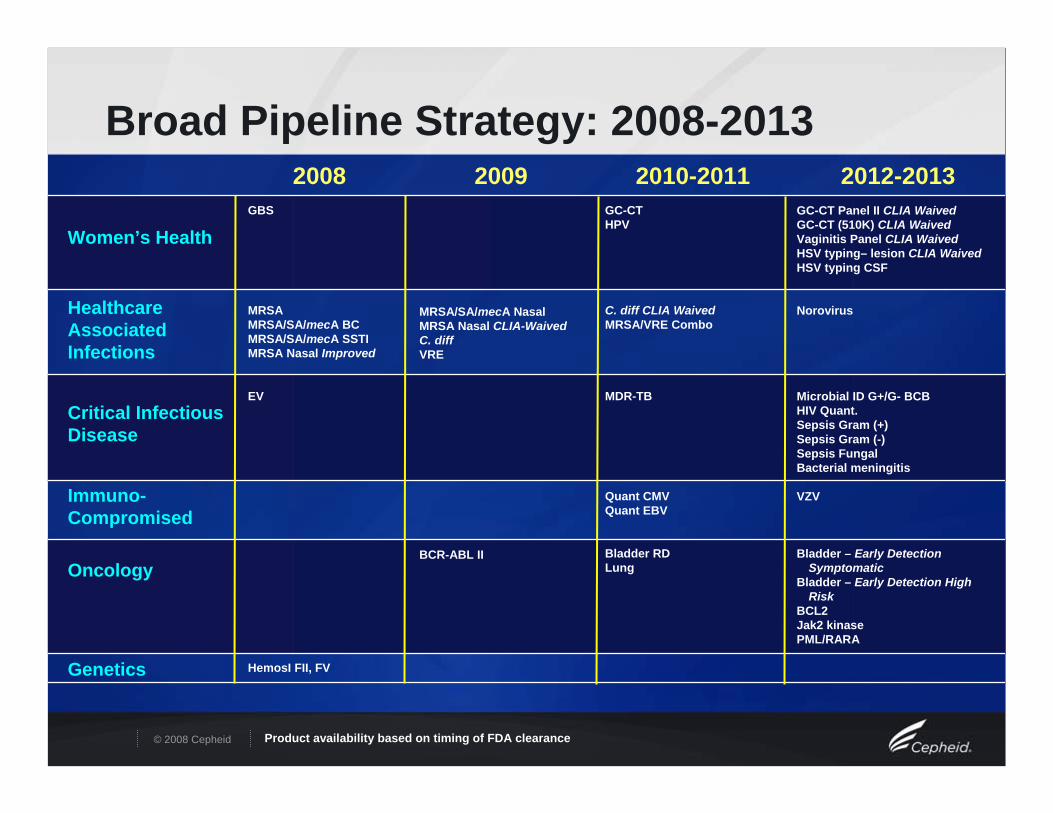
Women’s Health
Healthcare Associated Infections
Critical Infectious Disease
Immuno-Compromised
Oncology
Genetics
GBS
MRSAMRSA/SA/mecA BCMRSA/SA/mecA SSTIMRSA Nasal Improved
EV
HemosI FII, FV
GC-CTHPV
C. diff CLIA WaivedMRSA/VRE Combo
MDR-TB
Quant CMVQuant EBV
Bladder RDLung
GC-CT Panel II CLIA WaivedGC-CT (510K) CLIA Waived Vaginitis Panel CLIA WaivedHSV typing– lesion CLIA WaivedHSV typing CSF
Norovirus
Microbial ID G+/G- BCBHIV Quant.Sepsis Gram (+)Sepsis Gram (-)Sepsis FungalBacterial meningitis
VZV
Bladder – Early Detection Symptomatic
Bladder – Early Detection High Risk
BCL2Jak2 kinasePML/RARA
Broad Pipeline Strategy: 2008-20132009 2012-20132010-20112008
MRSA/SA/mecA NasalMRSA Nasal CLIA-WaivedC. diffVRE
BCR-ABL II
Product availability based on timing of FDA clearance
© 2008 Cepheid
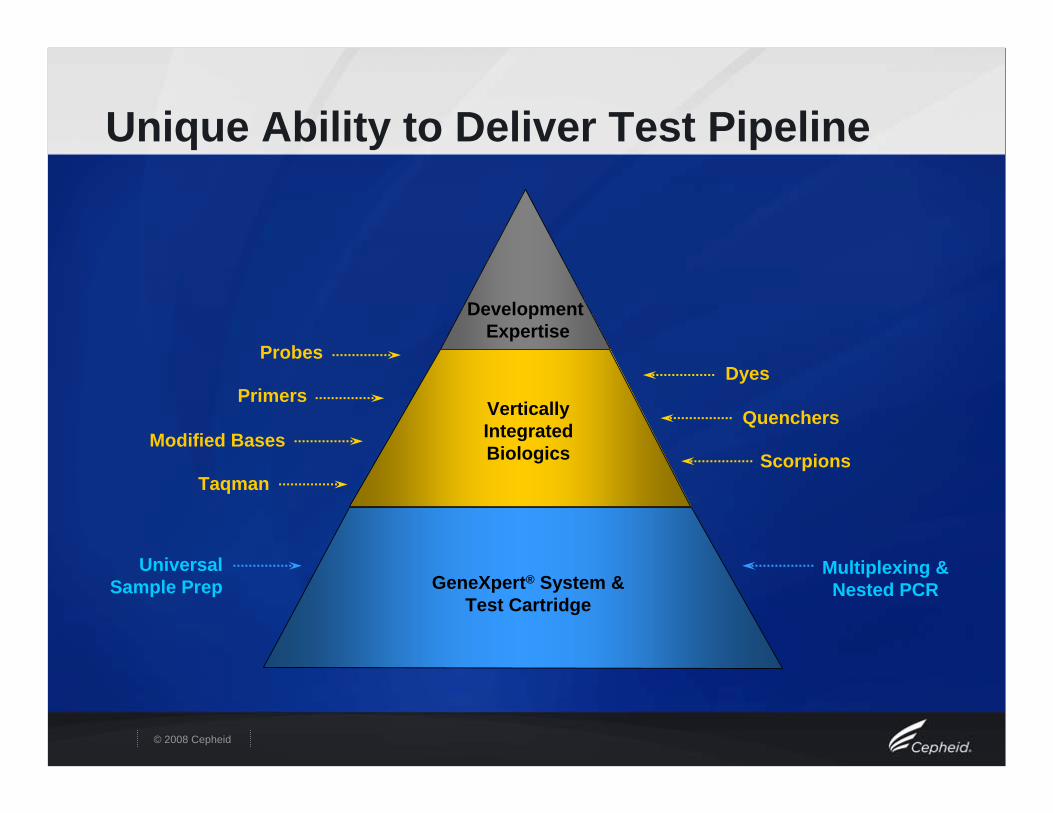
Universal Sample Prep
Multiplexing & Nested PCR
TaqmanScorpions
Primers
Probes
Quenchers
Dyes
Modified Bases
GeneXpert® System & Test Cartridge
Vertically IntegratedBiologics
DevelopmentExpertise
Unique Ability to Deliver Test Pipeline
© 2008 Cepheid
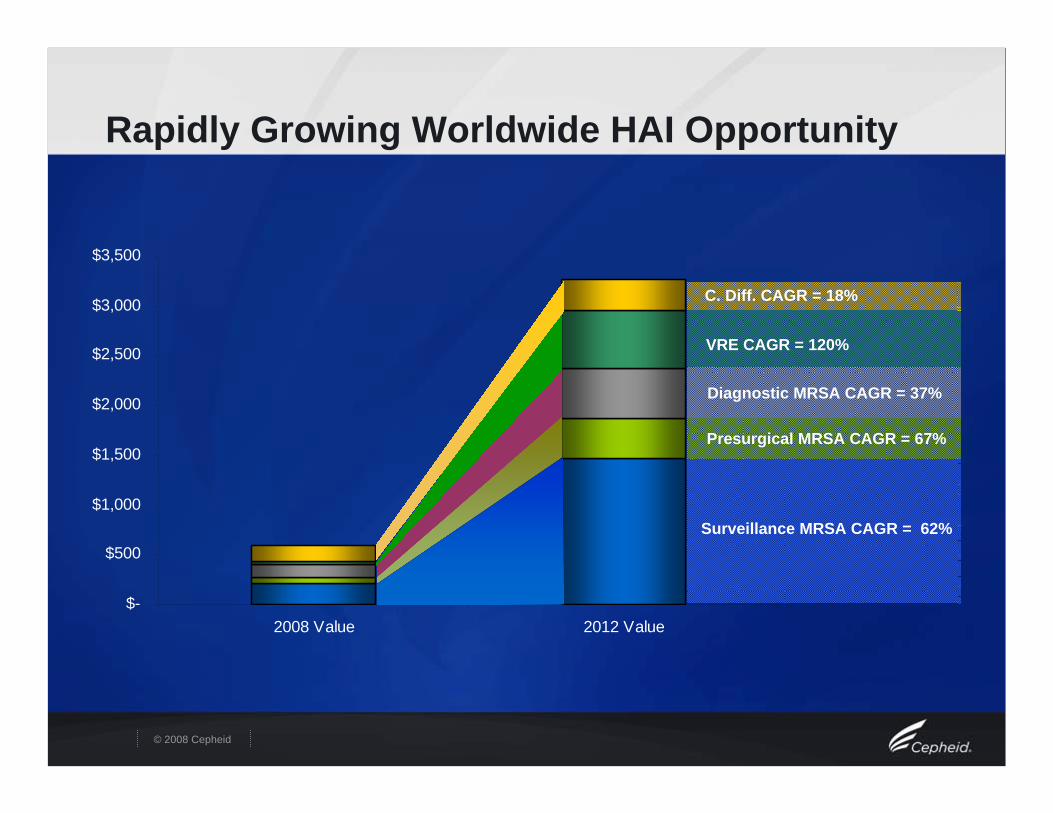
$-
$500
$1,000
$1,500
$2,000
$2,500
$3,000
$3,500
2008 Value 2012 Value
Rapidly Growing Worldwide HAI Opportunity
VRE CAGR = 120%
Diagnostic MRSA CAGR = 37%
Presurgical MRSA CAGR = 67%
Surveillance MRSA CAGR = 62%
C. Diff. CAGR = 18%
© 2008 Cepheid
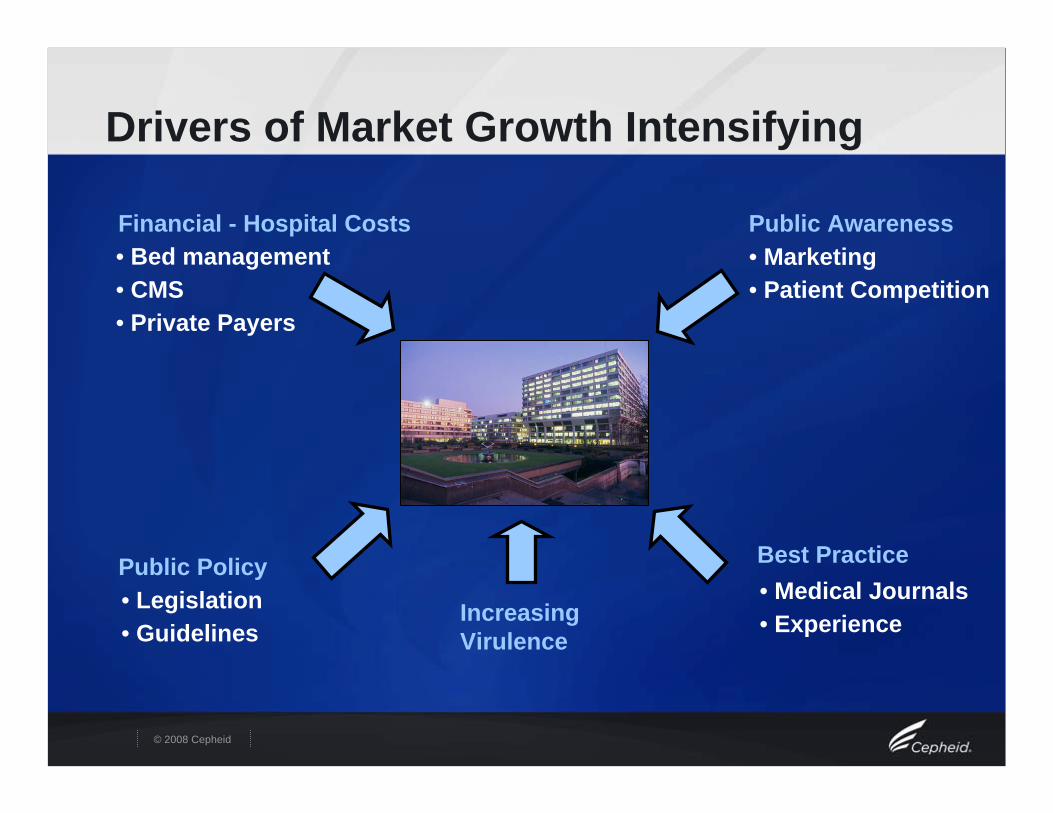
Drivers of Market Growth Intensifying
Financial - Hospital Costs Public Awareness
Best PracticePublic Policy
• Bed management• CMS• Private Payers
• Legislation• Guidelines
• Marketing• Patient Competition
Increasing Virulence
• Medical Journals• Experience
© 2008 Cepheid
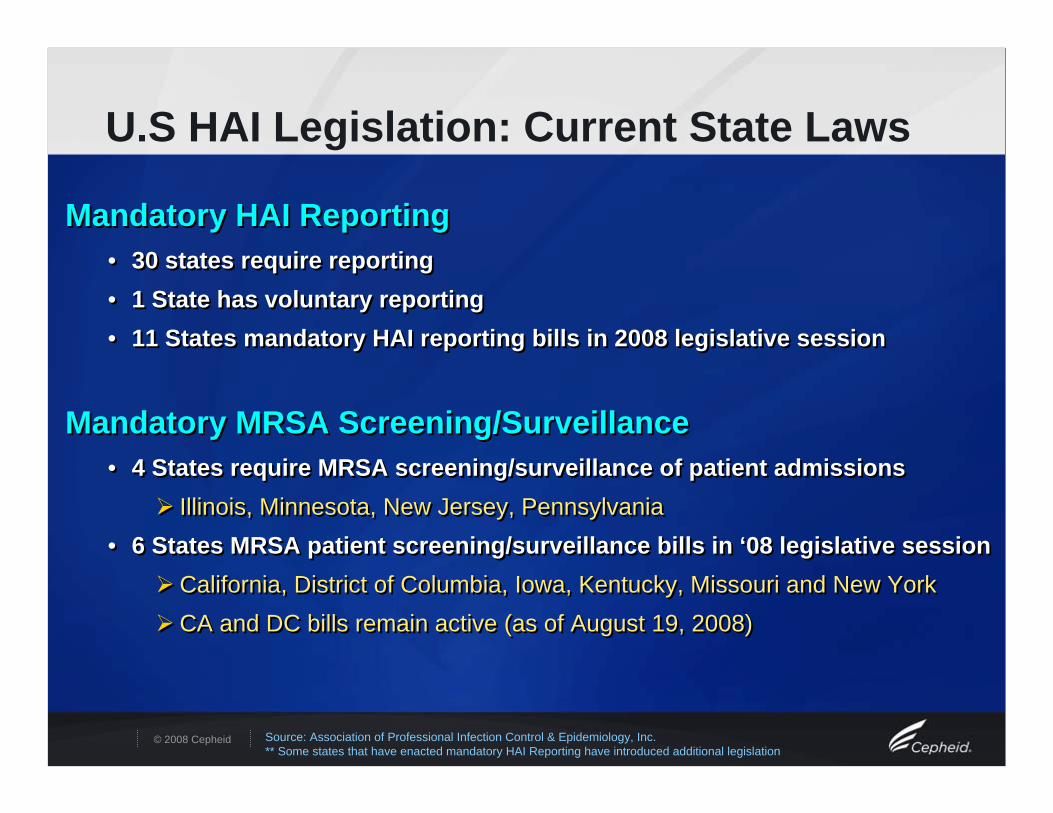
U.S HAI Legislation: Current State Laws
Mandatory HAI Reporting• 30 states require reporting • 1 State has voluntary reporting • 11 States mandatory HAI reporting bills in 2008 legislative session
Mandatory MRSA Screening/Surveillance• 4 States require MRSA screening/surveillance of patient admissions
Illinois, Minnesota, New Jersey, Pennsylvania • 6 States MRSA patient screening/surveillance bills in ‘08 legislative session
California, District of Columbia, Iowa, Kentucky, Missouri and New YorkCA and DC bills remain active (as of August 19, 2008)
Source: Association of Professional Infection Control & Epidemiology, Inc.** Some states that have enacted mandatory HAI Reporting have introduced additional legislation
© 2008 Cepheid
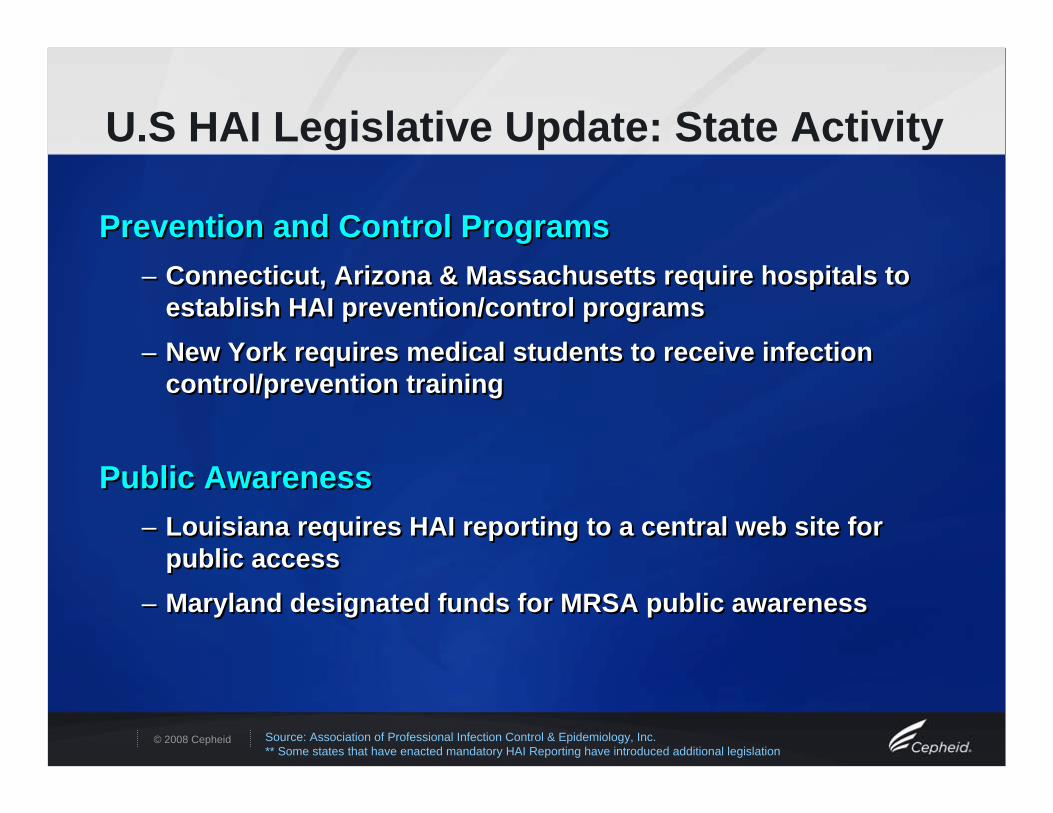
U.S HAI Legislative Update: State Activity
Prevention and Control Programs– Connecticut, Arizona & Massachusetts require hospitals to
establish HAI prevention/control programs– New York requires medical students to receive infection
control/prevention training
Public Awareness– Louisiana requires HAI reporting to a central web site for
public access– Maryland designated funds for MRSA public awareness
Source: Association of Professional Infection Control & Epidemiology, Inc.** Some states that have enacted mandatory HAI Reporting have introduced additional legislation
© 2008 Cepheid
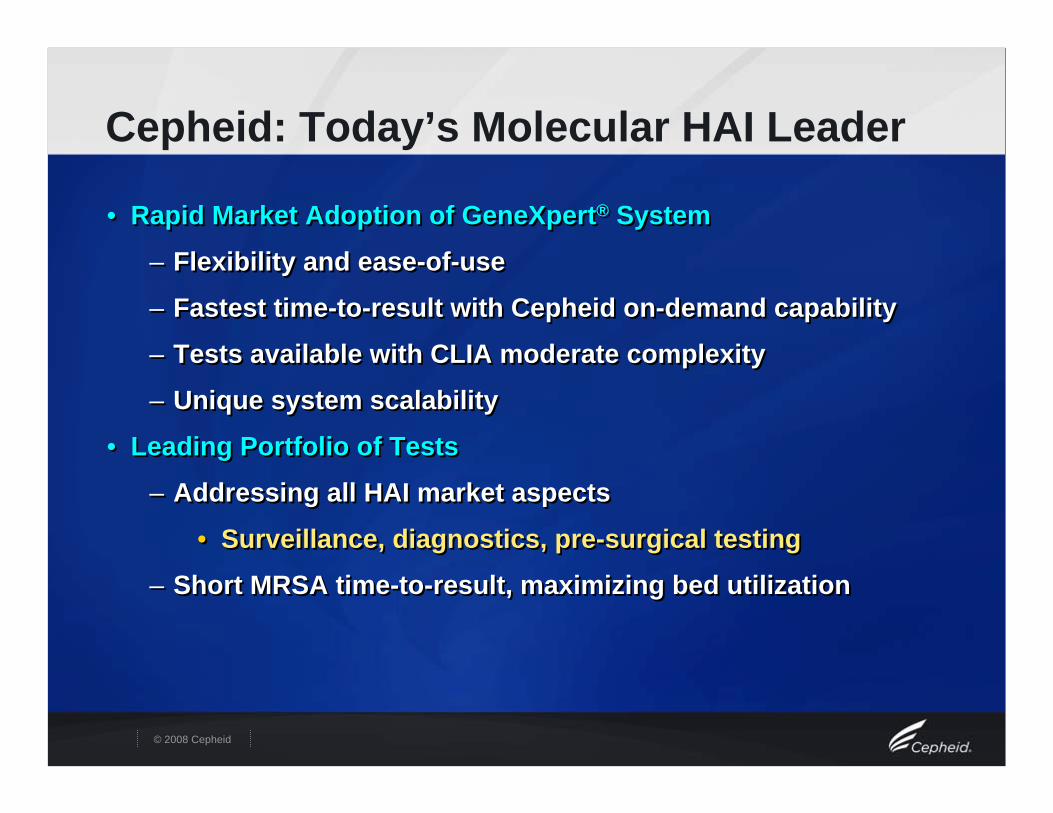
Cepheid: Today’s Molecular HAI Leader
• Rapid Market Adoption of GeneXpert® System
– Flexibility and ease-of-use
– Fastest time-to-result with Cepheid on-demand capability
– Tests available with CLIA moderate complexity
– Unique system scalability
• Leading Portfolio of Tests
– Addressing all HAI market aspects
• Surveillance, diagnostics, pre-surgical testing
– Short MRSA time-to-result, maximizing bed utilization
© 2008 Cepheid
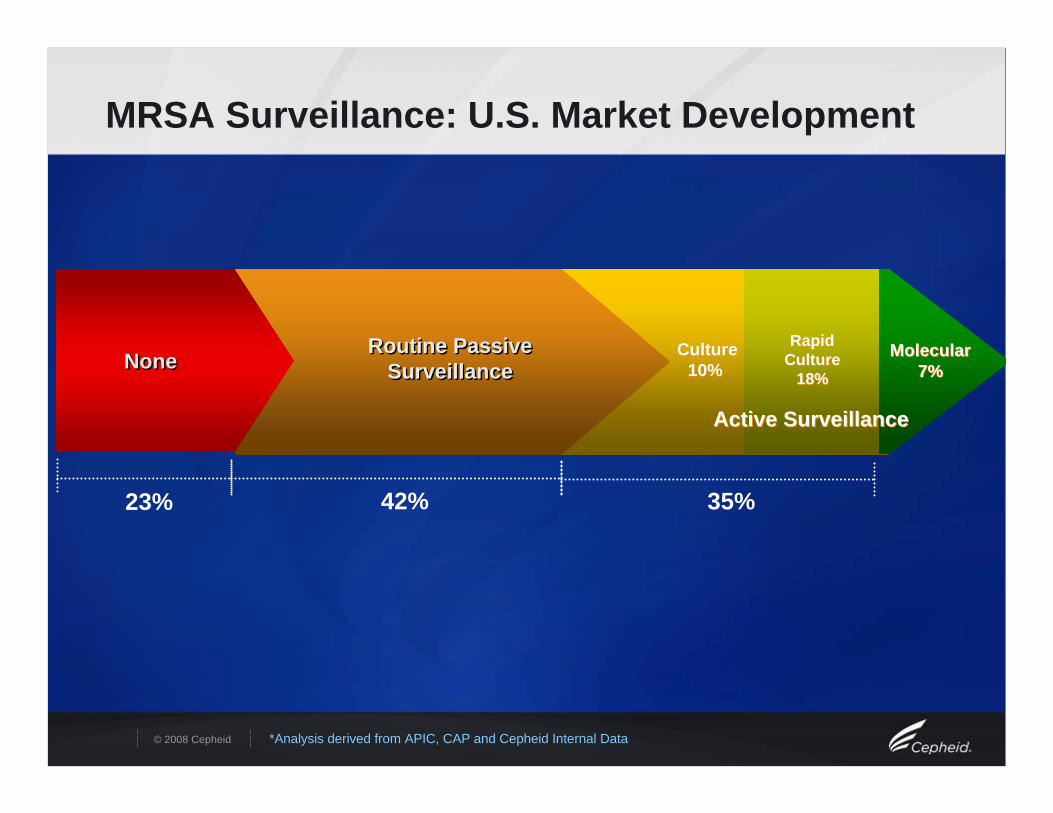
MRSA Surveillance: U.S. Market Development
*Analysis derived from APIC, CAP and Cepheid Internal Data
Active Surveillance
Active Surveillance
35%
Molecular Molecular 7%7%
Culture Culture 10%10%
Rapid Rapid Culture Culture
18%18%
Active SurveillanceActive Surveillance
Routine Passive Surveillance
Routine Passive Surveillance
42%
NoneNone
23%
© 2008 Cepheid
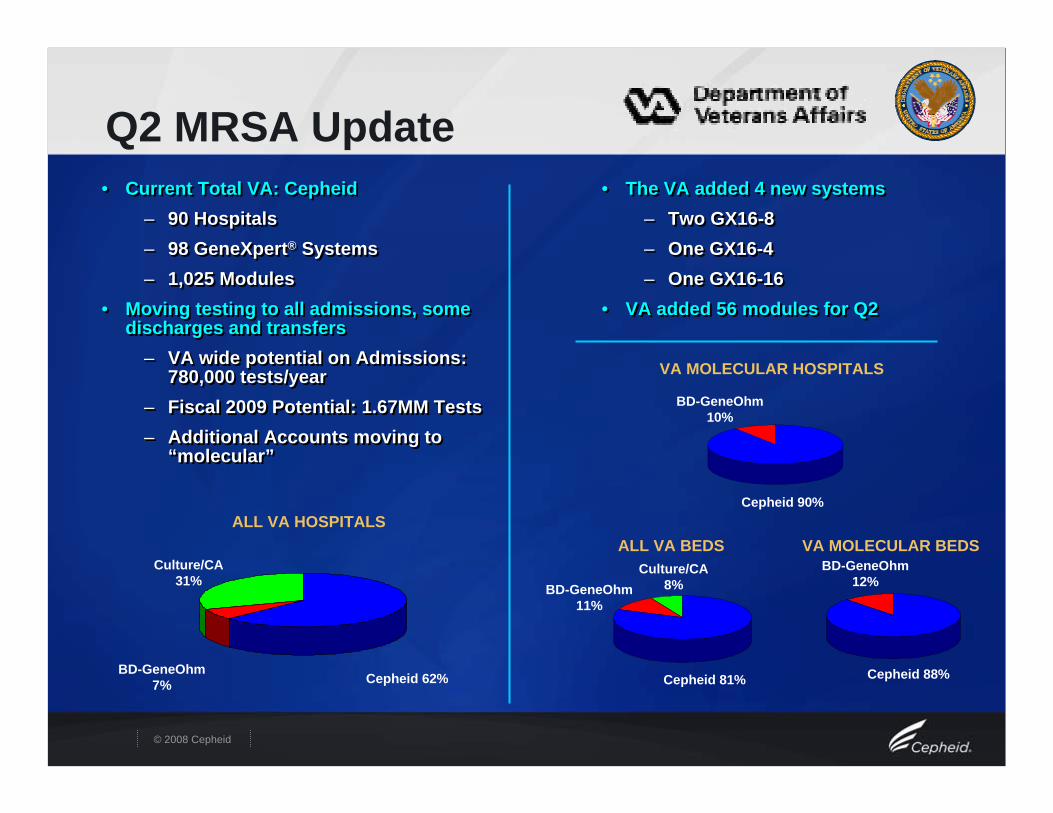
Q2 MRSA Update• Current Total VA: Cepheid
– 90 Hospitals– 98 GeneXpert® Systems– 1,025 Modules
• Moving testing to all admissions, some discharges and transfers
– VA wide potential on Admissions: 780,000 tests/year
– Fiscal 2009 Potential: 1.67MM Tests– Additional Accounts moving to
“molecular”
• Current Total VA: Cepheid– 90 Hospitals– 98 GeneXpert® Systems– 1,025 Modules
• Moving testing to all admissions, some discharges and transfers
– VA wide potential on Admissions: 780,000 tests/year
– Fiscal 2009 Potential: 1.67MM Tests– Additional Accounts moving to
“molecular”
• The VA added 4 new systems – Two GX16-8 – One GX16-4 – One GX16-16
• VA added 56 modules for Q2
• The VA added 4 new systems – Two GX16-8 – One GX16-4 – One GX16-16
• VA added 56 modules for Q2
ALL VA HOSPITALSALL VA BEDS VA MOLECULAR BEDS
Culture/CA 31%
BD-GeneOhm 7% Cepheid 62%
VA MOLECULAR HOSPITALS
BD-GeneOhm 10%
Cepheid 90%
BD-GeneOhm 11%
Culture/CA 8%
Cepheid 81%
BD-GeneOhm 12%
Cepheid 88%
© 2008 Cepheid
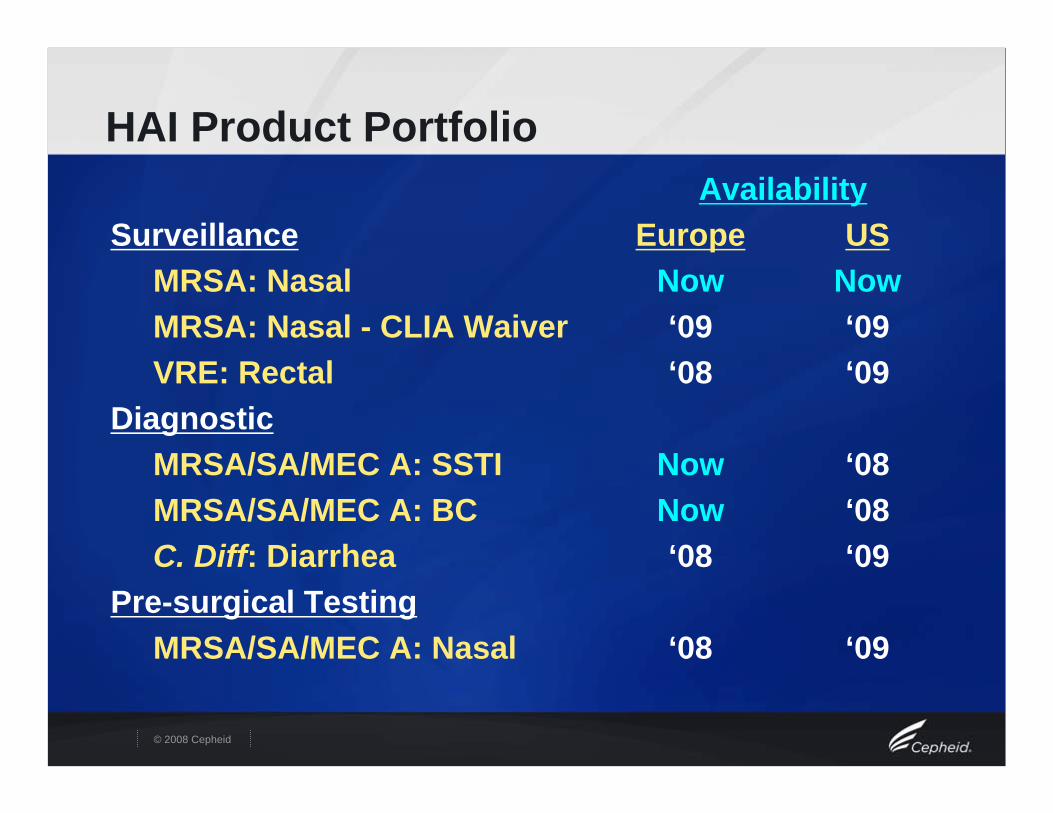
HAI Product PortfolioAvailability
Surveillance Europe USMRSA: Nasal Now NowMRSA: Nasal - CLIA Waiver ‘09 ‘09VRE: Rectal ‘08 ‘09
DiagnosticMRSA/SA/MEC A: SSTI Now ‘08MRSA/SA/MEC A: BC Now ‘08C. Diff: Diarrhea ‘08 ‘09
Pre-surgical TestingMRSA/SA/MEC A: Nasal ‘08 ‘09
© 2008 Cepheid
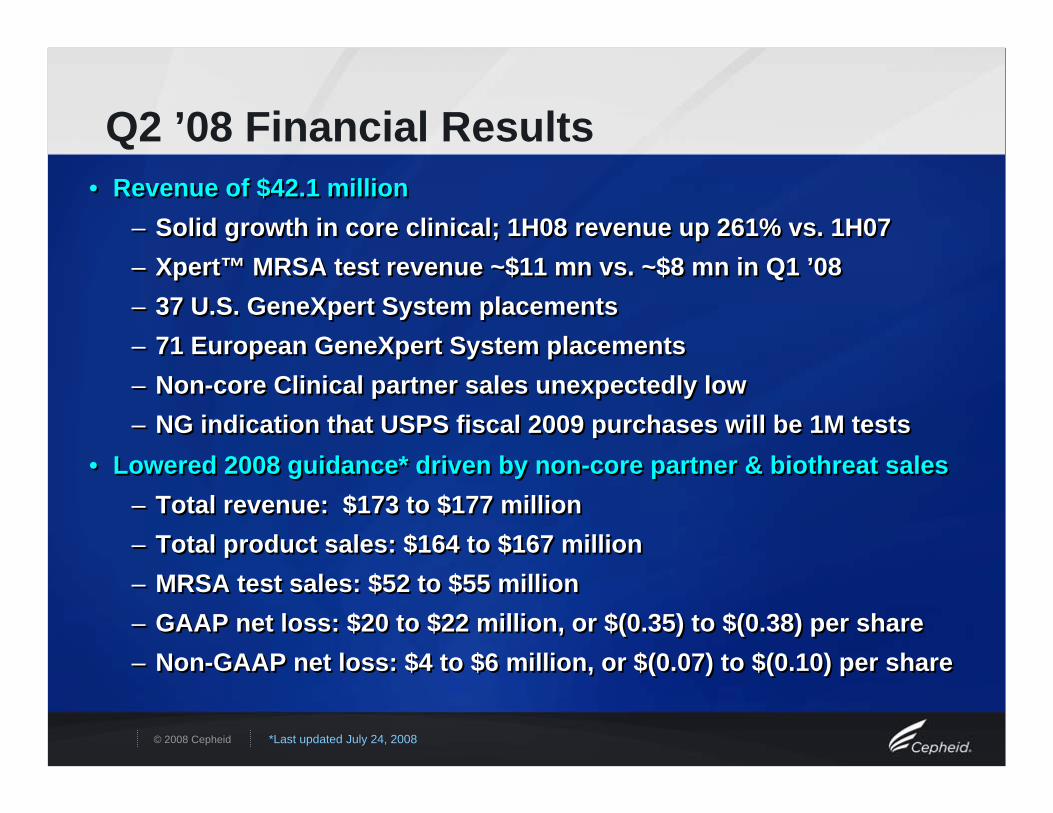
Q2 ’08 Financial Results• Revenue of $42.1 million
– Solid growth in core clinical; 1H08 revenue up 261% vs. 1H07 – Xpert™ MRSA test revenue ~$11 mn vs. ~$8 mn in Q1 ’08– 37 U.S. GeneXpert System placements– 71 European GeneXpert System placements– Non-core Clinical partner sales unexpectedly low– NG indication that USPS fiscal 2009 purchases will be 1M tests
• Lowered 2008 guidance* driven by non-core partner & biothreat sales– Total revenue: $173 to $177 million – Total product sales: $164 to $167 million– MRSA test sales: $52 to $55 million– GAAP net loss: $20 to $22 million, or $(0.35) to $(0.38) per share– Non-GAAP net loss: $4 to $6 million, or $(0.07) to $(0.10) per share
• Revenue of $42.1 million– Solid growth in core clinical; 1H08 revenue up 261% vs. 1H07 – Xpert™ MRSA test revenue ~$11 mn vs. ~$8 mn in Q1 ’08– 37 U.S. GeneXpert System placements– 71 European GeneXpert System placements– Non-core Clinical partner sales unexpectedly low– NG indication that USPS fiscal 2009 purchases will be 1M tests
• Lowered 2008 guidance* driven by non-core partner & biothreat sales– Total revenue: $173 to $177 million – Total product sales: $164 to $167 million– MRSA test sales: $52 to $55 million– GAAP net loss: $20 to $22 million, or $(0.35) to $(0.38) per share– Non-GAAP net loss: $4 to $6 million, or $(0.07) to $(0.10) per share
*Last updated July 24, 2008
© 2008 Cepheid28
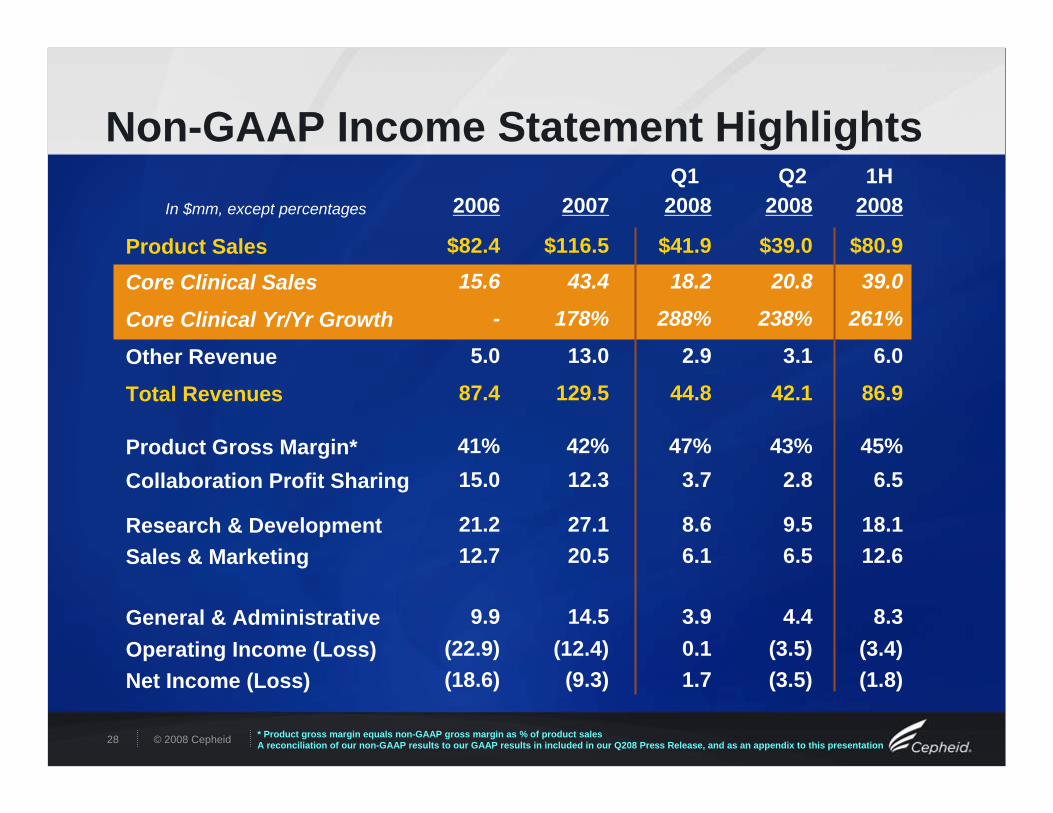
261%238%288%178%-Core Clinical Yr/Yr Growth
39.020.818.243.415.6Core Clinical Sales
2006 2007Q1
2008Q2
20081H
2008
Product Sales $82.4 $116.5 $41.9 $39.0 $80.9
Other Revenue 5.0 13.0 2.9 3.1 6.0
Total Revenues 87.4 129.5 44.8 42.1 86.9
Product Gross Margin* 41% 42% 47% 43% 45%Collaboration Profit Sharing 15.0 12.3 3.7 2.8 6.5
Research & Development 21.2 27.1 8.6 9.5 18.1Sales & Marketing 12.7 20.5 6.1 6.5 12.6
General & Administrative 9.9 14.5 3.9 4.4 8.3Operating Income (Loss) (22.9) (12.4) 0.1 (3.5) (3.4)Net Income (Loss) (18.6) (9.3) 1.7 (3.5) (1.8)
Non-GAAP Income Statement HighlightsIn $mm, except percentages
* Product gross margin equals non-GAAP gross margin as % of product salesA reconciliation of our non-GAAP results to our GAAP results in included in our Q208 Press Release, and as an appendix to this presentation
© 2008 Cepheid
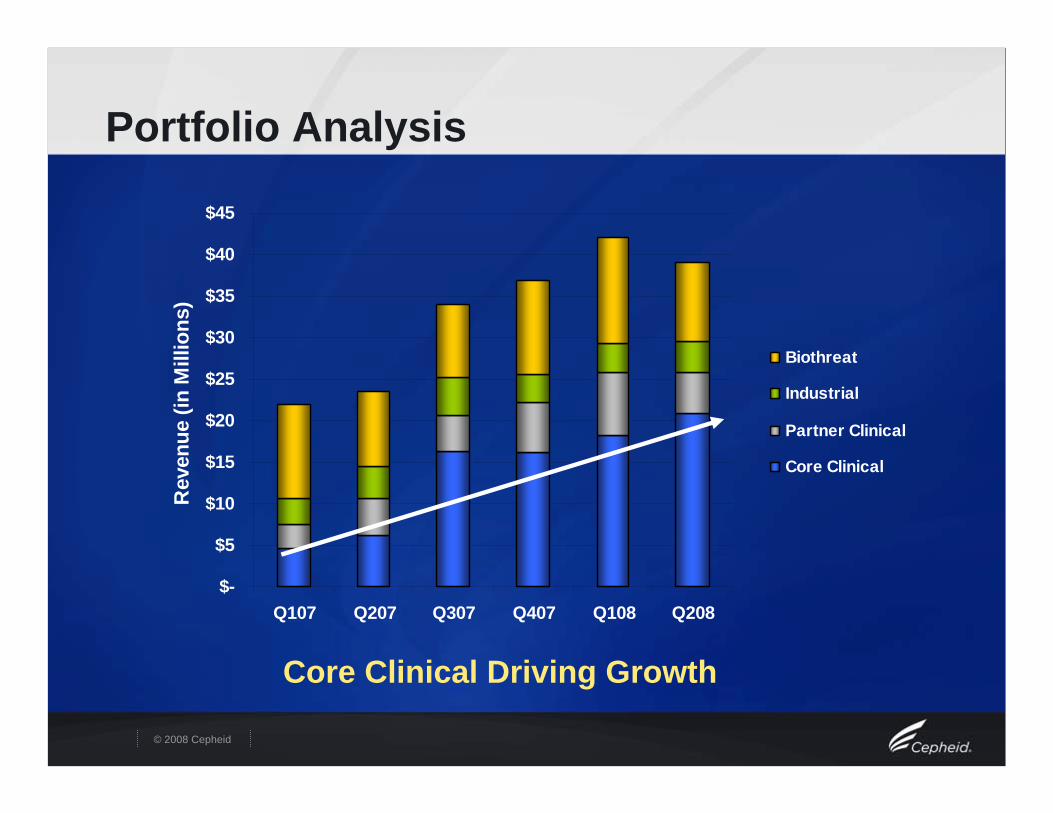
Portfolio Analysis
$-
$5
$10
$15
$20
$25
$30
$35
$40
$45
Q107 Q207 Q307 Q407 Q108 Q208
Rev
enue
(in
Mill
ions
)
Biothreat
Industrial
Partner Clinical
Core Clinical
Core Clinical Driving Growth
© 2008 Cepheid30
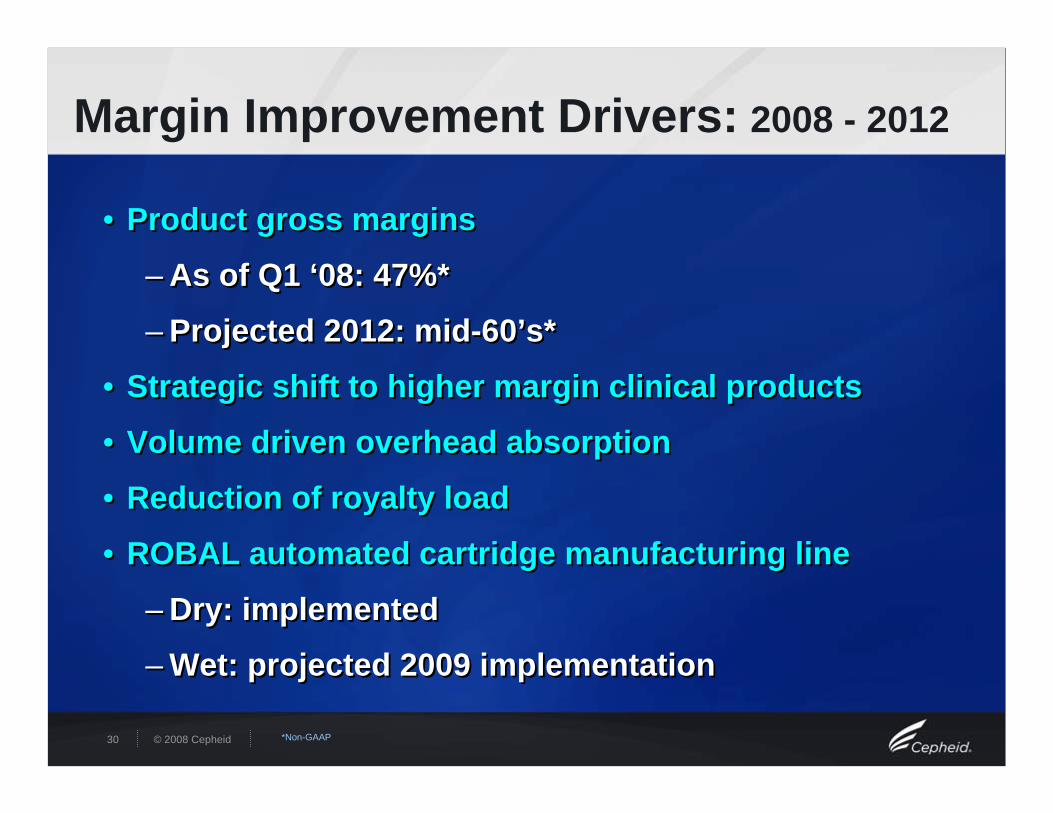
Margin Improvement Drivers: 2008 - 2012
• Product gross margins
– As of Q1 ‘08: 47%*
– Projected 2012: mid-60’s*
• Strategic shift to higher margin clinical products
• Volume driven overhead absorption
• Reduction of royalty load
• ROBAL automated cartridge manufacturing line
– Dry: implemented
– Wet: projected 2009 implementation
• Product gross margins
– As of Q1 ‘08: 47%*
– Projected 2012: mid-60’s*
• Strategic shift to higher margin clinical products
• Volume driven overhead absorption
• Reduction of royalty load
• ROBAL automated cartridge manufacturing line
– Dry: implemented
– Wet: projected 2009 implementation
*Non-GAAP
© 2008 Cepheid
0%
10%
20%
30%
40%
50%
60%
70%
80%
90%
100%
Current 2012
COGSRoyaltiesGross Margin
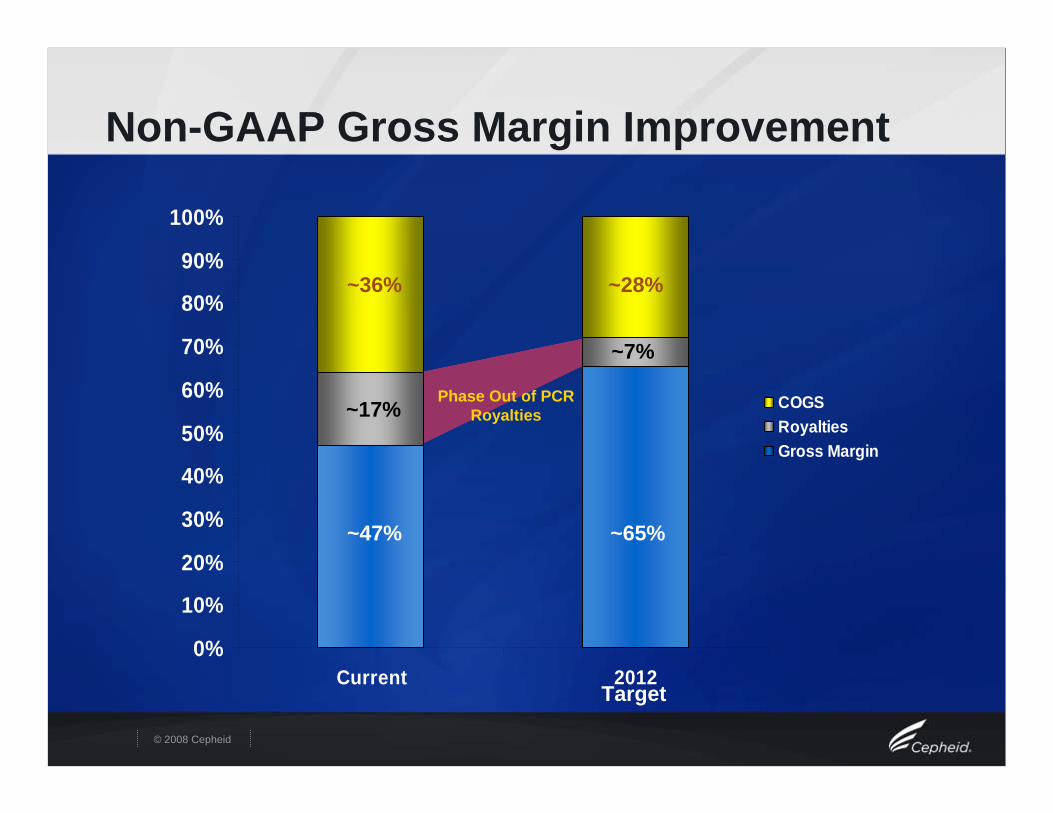
Non-GAAP Gross Margin Improvement
Phase Out of PCR Royalties
~36% ~28%
~47% ~65%
Target
~17%
~7%
© 2008 Cepheid
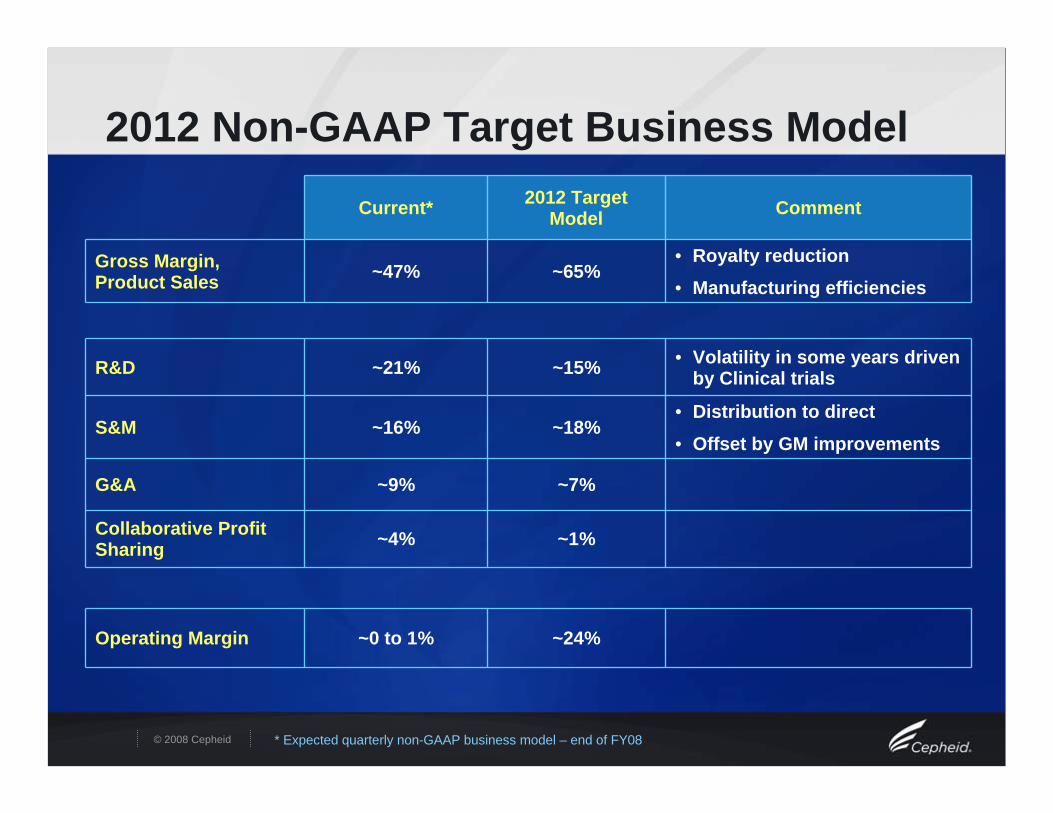
2012 Non-GAAP Target Business Model
* Expected quarterly non-GAAP business model – end of FY08
Current* 2012 Target Model Comment
Gross Margin, Product Sales ~47% ~65%
• Royalty reduction• Manufacturing efficiencies
Operating Margin ~0 to 1% ~24%
R&D ~21% ~15% • Volatility in some years driven by Clinical trials
S&M ~16% ~18%• Distribution to direct
• Offset by GM improvements
G&A ~9% ~7%
Collaborative Profit Sharing ~4% ~1%
© 2008 Cepheid
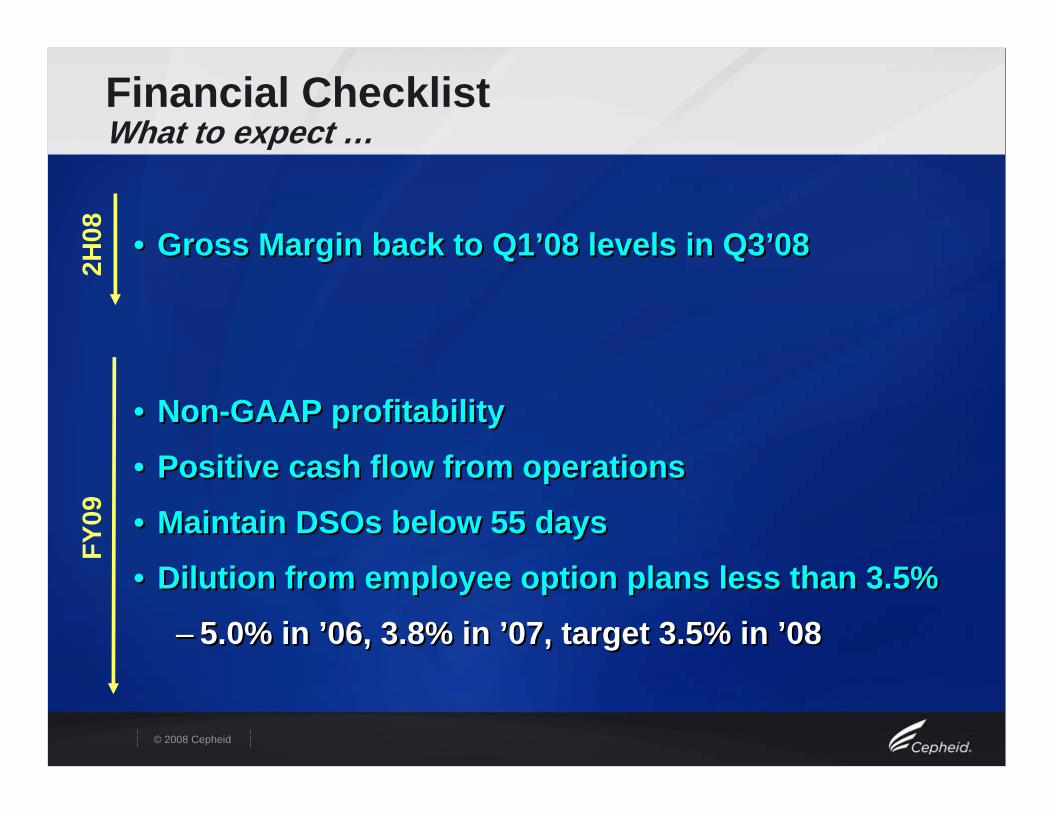
Financial ChecklistWhat to expect …
• Gross Margin back to Q1’08 levels in Q3’08
• Non-GAAP profitability
• Positive cash flow from operations
• Maintain DSOs below 55 days
• Dilution from employee option plans less than 3.5%
– 5.0% in ’06, 3.8% in ’07, target 3.5% in ’08
• Gross Margin back to Q1’08 levels in Q3’08
• Non-GAAP profitability
• Positive cash flow from operations
• Maintain DSOs below 55 days
• Dilution from employee option plans less than 3.5%
– 5.0% in ’06, 3.8% in ’07, target 3.5% in ’08
2H08
FY09
© 2008 Cepheid
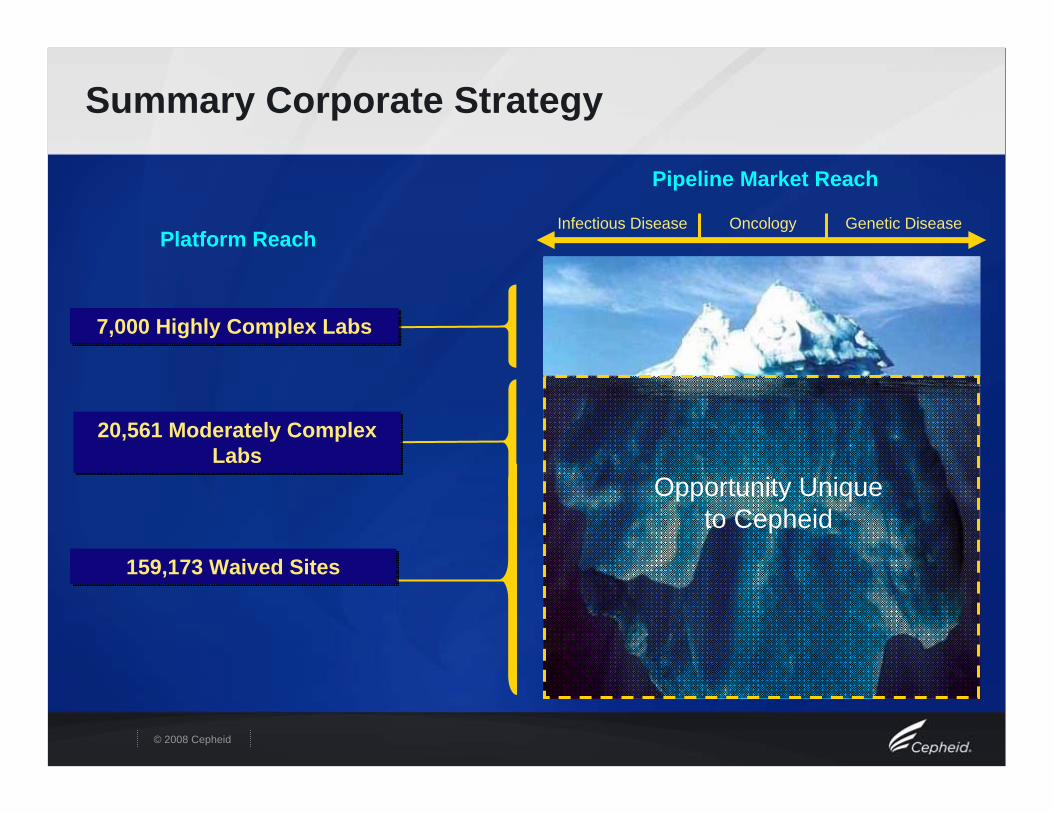
Summary Corporate Strategy
7,000 Highly Complex Labs7,000 Highly Complex Labs
159,173 Waived Sites159,173 Waived Sites
20,561 Moderately Complex Labs
20,561 Moderately Complex Labs
Infectious Disease Oncology Genetic Disease
Pipeline Market Reach
Platform Reach
Opportunity Unique to Cepheid

© 2008 Cepheid
2008 Expected Milestones• Market shipment of GX-I• Market shipment GX 6 color system• Market shipment of LIS software for GeneXpert® Systems• Implementation of direct sales organization in the U.K.• European release of Xpert™ HemosIL (FII/FV) test• Signed contract with Premier GPO• European release of Xpert™ MRSA/SA nasal• FDA Clearance of Xpert™ MRSA/SA test for SSTI• FDA Clearance of Xpert™ MRSA/SA test for Blood Culture• FDA Clearance of Xpert™ HemosIL (FII/FV) test • European release of Xpert™ VRE test• European release of Xpert™ C. difficile test• Market shipment of GeneXpert® Infinity-48 System
• Market shipment of GX-I• Market shipment GX 6 color system• Market shipment of LIS software for GeneXpert® Systems• Implementation of direct sales organization in the U.K.• European release of Xpert™ HemosIL (FII/FV) test• Signed contract with Premier GPO• European release of Xpert™ MRSA/SA nasal• FDA Clearance of Xpert™ MRSA/SA test for SSTI• FDA Clearance of Xpert™ MRSA/SA test for Blood Culture• FDA Clearance of Xpert™ HemosIL (FII/FV) test • European release of Xpert™ VRE test• European release of Xpert™ C. difficile test• Market shipment of GeneXpert® Infinity-48 System
CompletedExpected
NASDAQ: CPHDNASDAQ: CPHD
September 10, 2008September 10, 2008
© 2008 Cepheid
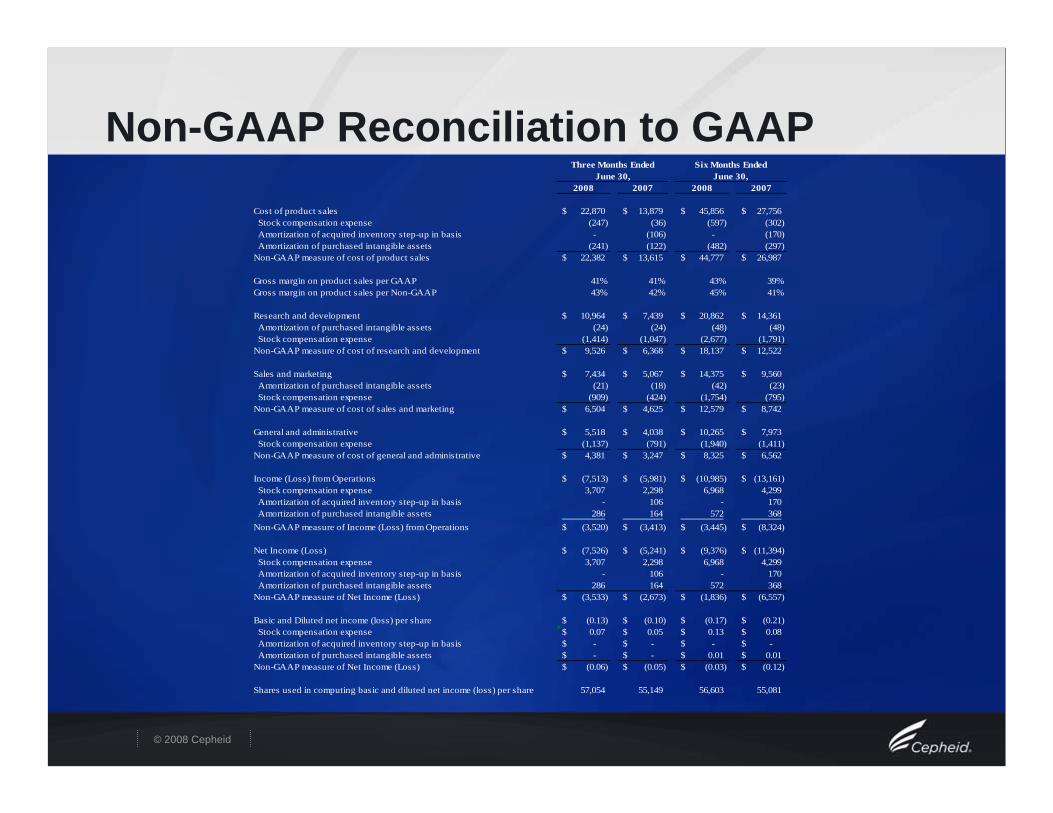
Non-GAAP Reconciliation to GAAP2008 2007 2008 2007
Cost of product sales 22,870$ 13,879$ 45,856$ 27,756$ Stock compensation expense (247) (36) (597) (302) Amortization of acquired inventory step-up in basis - (106) - (170) Amortization of purchased intangible assets (241) (122) (482) (297) Non-GAAP measure of cost of product sales 22,382$ 13,615$ 44,777$ 26,987$
Gross margin on product sales per GAAP 41% 41% 43% 39%Gross margin on product sales per Non-GAAP 43% 42% 45% 41%
Research and development 10,964$ 7,439$ 20,862$ 14,361$ Amortization of purchased intangible assets (24) (24) (48) (48) Stock compensation expense (1,414) (1,047) (2,677) (1,791) Non-GAAP measure of cost of research and development 9,526$ 6,368$ 18,137$ 12,522$
Sales and marketing 7,434$ 5,067$ 14,375$ 9,560$ Amortization of purchased intangible assets (21) (18) (42) (23) Stock compensation expense (909) (424) (1,754) (795) Non-GAAP measure of cost of sales and marketing 6,504$ 4,625$ 12,579$ 8,742$
General and administrative 5,518$ 4,038$ 10,265$ 7,973$ Stock compensation expense (1,137) (791) (1,940) (1,411) Non-GAAP measure of cost of general and administrative 4,381$ 3,247$ 8,325$ 6,562$
Income (Loss) from Operations (7,513)$ (5,981)$ (10,985)$ (13,161)$ Stock compensation expense 3,707 2,298 6,968 4,299 Amortization of acquired inventory step-up in basis - 106 - 170 Amortization of purchased intangible assets 286 164 572 368 Non-GAAP measure of Income (Loss) from Operations (3,520)$ (3,413)$ (3,445)$ (8,324)$
Net Income (Loss) (7,526)$ (5,241)$ (9,376)$ (11,394)$ Stock compensation expense 3,707 2,298 6,968 4,299 Amortization of acquired inventory step-up in basis - 106 - 170 Amortization of purchased intangible assets 286 164 572 368 Non-GAAP measure of Net Income (Loss) (3,533)$ (2,673)$ (1,836)$ (6,557)$
Basic and Diluted net income (loss) per share (0.13)$ (0.10)$ (0.17)$ (0.21)$ Stock compensation expense 0.07$ 0.05$ 0.13$ 0.08$ Amortization of acquired inventory step-up in basis -$ -$ -$ -$ Amortization of purchased intangible assets -$ -$ 0.01$ 0.01$ Non-GAAP measure of Net Income (Loss) (0.06)$ (0.05)$ (0.03)$ (0.12)$
Shares used in computing basic and diluted net income (loss) per share 57,054 55,149 56,603 55,081
Three Months EndedJune 30,
Six Months EndedJune 30,