Embed Size (px)
Citation preview
2ND QUARTER 2004
PERFORMANCE AND RISK
MONITORING REPORT For CPFIS-Included Unit Trusts & Investment-Linked Insurance Products
August 13, 2004 Standard & Poor's Fund Services Asia
TABLE OF CONTENTS Section Page Updates on CPFIS-Included Funds 1 Market Review by Standard & Poor’s 2 1. Equities 2
2. Bonds 4 3. Currency 5 4. Performance of World-wide Indices 6
Summary of Absolute Performance 7 1. Average Absolute Performance 7
2. Overview of Average, Best & Worst Performance by Asset Class 9 3. Positive & Negative Returns Distributions for Unit Trusts & ILPs 10 Summary of Risk-Adjusted Performance 11 1. Risk-Return over Past 3 Years 11 Performance Ranking: S&P Fund Stars 13 1. Background 13 2. S&P Fund Stars for CPFIS-Included Unit Trusts & ILPs 13 3. Full List of CPFIS-Included Unit Trusts & ILPs with S&P Fund Stars 14 Further Information 17 Appendix 1: Complete List of Funds in Each Quadrant of the Risk/Return Chart Appendix 2: S&P Fund Stars Methodology Appendix 3: Investment Terminology Definition
- 1 -
Standard & Poor’s Fund Services Asia has been appointed by the Funds Performance Tracking Committee (FPTC), a committee chaired by and comprising of representatives from IMAS, LIA and SIAS, to monitor the performance of all unit trusts and investment-linked insurance products included under the CPF Investment Scheme (CPFIS). This report documents the findings of Standard & Poor’s Fund Services for the period ending June 30, 2004 (Q2 2004). UPDATES ON CPFIS-INCLUDED FUNDS The number of funds included under the CPFIS has again increased over the past quarter. Below are some summary statistics:
Total Number of CPFIS-Included Funds: As at June 30, 2004 there are altogether 227 unit trusts and 170 investment-linked insurance products (ILPs) included under the CPF Investment Scheme.
New Products: 12 new Unit Trusts and 4 new ILPs have been added to the CPFIS in Q2.
De-listed Products: 12 Unit Trusts and 2 ILPs were de-listed from the CPFIS in Q2.
- 2 -
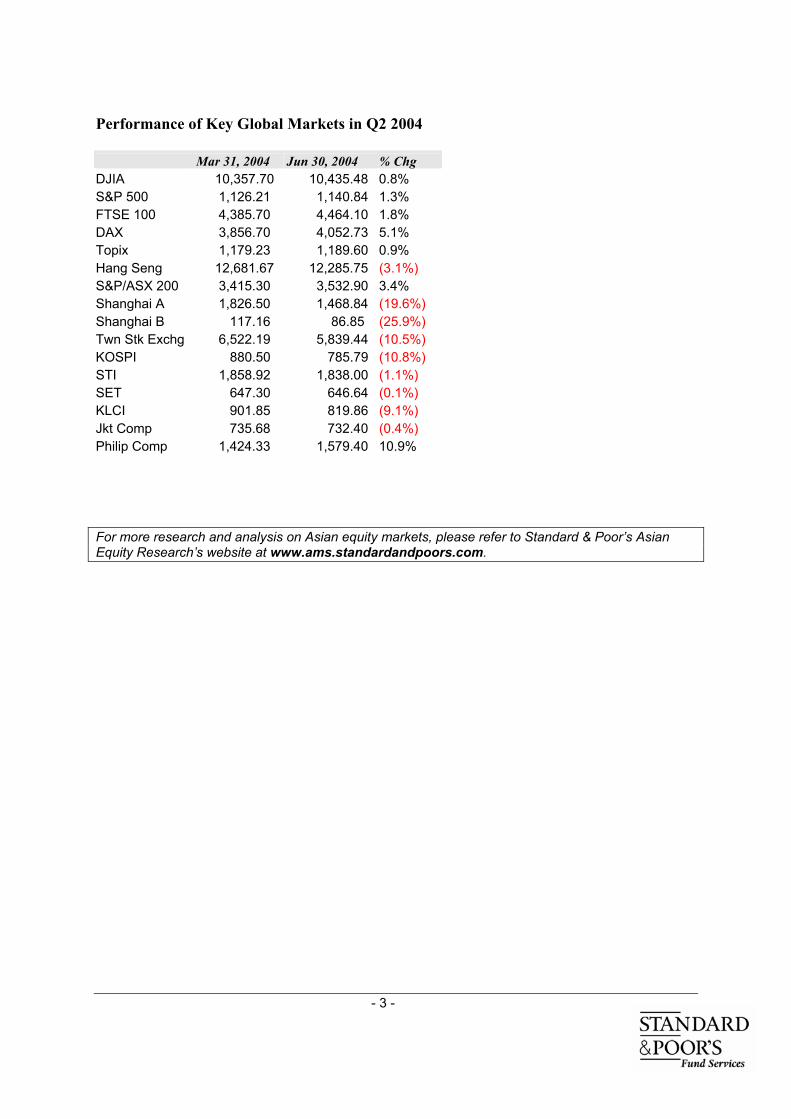
MARKET REVIEW BY STANDARD & POOR’S 1. Equities Around the World Global equity markets had another soft quarter and most major markets ended the three months with only small gains. The threat of interest rate hikes, soaring oil prices, events in Iraq and terrorism fears cast a shadow over equity markets. In the US, the Dow Jones Industrial rose 0.8% while the broader market S&P 500 rose 1.3%. Germany’s DAX was the top performer in the second quarter, erasing first quarter losses to end the quarter up 5.1%. Japan’s Topix hit a year high in mid-April but subsequently retraced the bulk of the gains to end the quarter up a mere 0.9%. Nonetheless, Japan was the top-performing market at midyear with the Topix advancing 14% in the first six months as foreign investors turned more positive amid the stronger than expected economic recovery and improving corporate earnings outlook. In Asia Echoing the concerns of equity markets around the world, most Asian markets were in the negative territory in the second quarter. In addition to fears of rising interest rates and high oil prices, credit tightening in China and concerns of a China slowdown weighed on market sentiment. North Asia suffered the sharpest declines. The Shanghai A and B indexes were the top losers, falling sharply by 19.6% and 25.9% respectively as the Chinese government took steps to cool the economy. Straits tensions added to Taiwan’s woes and the TSE fell 10.5%, while Korea’s KOSPI and Hong Kong’s Hang Seng fell 10.8% and 3.1% respectively. Malaysia’s KLCI retraced most of the gains made earlier in the year, falling by 9.1% in the second quarter with no fresh leads after the general elections in March. The Philippines market bucked the regional trend, aided by a favorable outcome for the incumbent in the presidential elections. Philippines’ Composite Index gained 10.9% and was the top-performing market in the second quarter. All other markets around the region, with the exception of Australia, ended the quarter with minor losses. Singapore’s STI fell 1.1%, Thailand’s SET was down 0.1% and Jakarta’s Composite declined 0.4%, while Australia’s S&P/ASX 200 rose 3.4%.
- 3 -
Performance of Key Global Markets in Q2 2004 Mar 31, 2004 Jun 30, 2004 % Chg DJIA 10,357.70 10,435.48 0.8% S&P 500 1,126.21 1,140.84 1.3% FTSE 100 4,385.70 4,464.10 1.8% DAX 3,856.70 4,052.73 5.1% Topix 1,179.23 1,189.60 0.9% Hang Seng 12,681.67 12,285.75 (3.1%) S&P/ASX 200 3,415.30 3,532.90 3.4% Shanghai A 1,826.50 1,468.84 (19.6%) Shanghai B 117.16 86.85 (25.9%) Twn Stk Exchg 6,522.19 5,839.44 (10.5%) KOSPI 880.50 785.79 (10.8%) STI 1,858.92 1,838.00 (1.1%) SET 647.30 646.64 (0.1%) KLCI 901.85 819.86 (9.1%) Jkt Comp 735.68 732.40 (0.4%) Philip Comp 1,424.33 1,579.40 10.9% For more research and analysis on Asian equity markets, please refer to Standard & Poor’s Asian Equity Research’s website at www.ams.standardandpoors.com.
- 4 -
2. Bonds o Federal Reserve chairman, Alan Greenspan, gave his semi-annual testimony on the US
economy on July 20. Overall, he broke little new ground, and his comments were very much in line with markets' expectations. Greenspan did shade his comments toward the more bullish side. Basically Greenspan said the economic expansion is self-sustaining and has become broader based. Labour market conditions have improved and that will have important follow-on effects for household spending. As for inflation, cost pressures should remain contained as the economy is still operating below full capacity. The outlook for the removal of monetary accommodation continues to be measured.
o Malaysia's broadest measure of money in circulation expanded more quickly in June,
amid sustained economic growth. M3 rose 10.8% in June from a year earlier, compared with an expansion of 10% in May. Growth of M1 expanded 16.3% in June, after growing 16.8% in May. M2, which adds fixed deposits to M1, rose 11.5% after 10.6% in May. Loans made by banks in Malaysia, including those sold to national mortgage company, Cagamas Bhd., rose 6.2% from a year ago to M$492.8 bln. Loans outstanding grew 6.3% in May. Non-performing loans, with interest or principal at least six months overdue, made up 6.2% of total loans, down from 6.5% in the previous month, Bank Negara Malaysia said.
o Selective nibbling was the theme in the corporate bond market in Malaysia. Medium
tenured bonds were targeted with yields seen backing in a little especially in the single-A papers. Trading in the AAA segment was limited to a sole Sime Darby Feb’10. Due to the overwhelming demand for yield pickup, investors’ preference has been along the lower end of the AA segment.
o In Japan, the Japanese Government Bonds (JGB) market will gradually turn its attention
to the compilation of the budget and JGB issuance. Nikkei Shimbun said on July 14 the MoF plans to keep general expenditure at about JPY48 tln in 2005 – the same level as this year. Public works outlay could be cut by 3% YoY. With premier Junichiro Koizumi staying on as PM, fiscal austerity will be maintained. Market players are expecting the private sector's absorption of JGBs to reach around JPY135 tln in FY05, including an extra JPY20 tln for redemptions. June's sharp rise in bond yields was triggered by expectations that the economic recovery may compel the BoJ to end quantitative easing in 1H05 and fears of a deterioration in the supply-demand balance during FY05. The JGB market is expected to remain stable in the present range.
o In Hong Kong, Exchange Fund Bills (EFB)/Exchange Fund Notes (EFN) yields
continued to edge up, tracking rise in US treasury yields and the narrowing of USD/HKD forward discounts, with the 1Y forward breaching the key –600 pips level. Total outflow on July 21 registered HK$5.9 bln. Reception for the 3Y EFN re-opening was relatively soft amidst weak sentiment. The issue was awarded a cut-off yield of 3%, which was above the secondary market level. Separately, financial secretary Henry Tang reportedly noted that the HK government is open to additional issues to fund infrastructure development following the recently well-received HK$20 bln multi-tranche bond sales.
- 5 -
3. Currency
o The SGD firmed against the USD in the last week of July on speculation that the Monetary Authority of Singapore will buy the currency to keep inflation in check. The MAS policy of seeking a "modest and gradual" appreciation of the SGD will help spur an economic expansion without triggering inflation, its MD said. The Singapore government in May raised its growth projection to as much as 7.5% from 5.5%.
o Bank Indonesia said benchmark SBI rates will remain stable at current levels and will be
conducive to stimulating the economy. Inflation does not pose a concern, said the bank, as recent rises had been due to seasonal factors. With the BI confident on containing inflation, IDR direction continues to rest on the political scene, with the presidential elections entering the second round in September between Megawati Sukarnoputri and Susilo Bambang Yudhoyono.
o The three key drivers of USD-JPY at present are long-end interest rate spreads, oil prices
and global equity market performance. With oil prices higher, a decline in equity prices and little change to interest rate spreads (Japan vs US), many players think the JPY could trade on the heavy side again. Despite encouraging news, which continues to emerge with respect to the Japanese economy, there are other factors, which could dwarf this impact. All things being equal, the JPY should draw support from an improved economy and Japan's growing current account surplus. Slackening non-resident interest in Japanese assets may lessen momentum, however, leading to range trading in illiquid markets.
o Since January 2004 Tokyo has won a major victory over forex investors seeking to drive
up the JPY. Record interventions in currency markets in 2003 and early 2004 were successful in keeping the JPY below the limit of JPY105 to the USD. Although this intervention has ceased, the steady flow of good trade news continues to support the JPY.
o The AUD lost ground on July 30 after comments from Prime Minister John Howard. The
AUD had lost around 40 points after Howard said there was no compelling case for a local interest rate rise at the moment. Howard told Melbourne radio 3AW that Australia was still enjoying low inflation and strong employment conditions, wage growth had not blown up unsustainably and the housing market had eased. "So when you take all of those together and when you bear in mind that we did not push our rates down as far as the Americans, there's not a compelling case for any significant upward lift," the premier said.
o The Bank of Korea expects growth in 2H04 to remain stable with each quarter registering
about 1% QoQ growth. The BoK is forecasting 5.2% YoY growth for the full year. On the inflation front, it expects consumer price inflation to touch 4% YoY in July and August (from 3.6% in June) on the back of a rise in public transportation fares and cigarette prices. This may continue to fuel market talk the BoK would prefer to contain any imported inflation at the same time via the KRW.
- 6 -
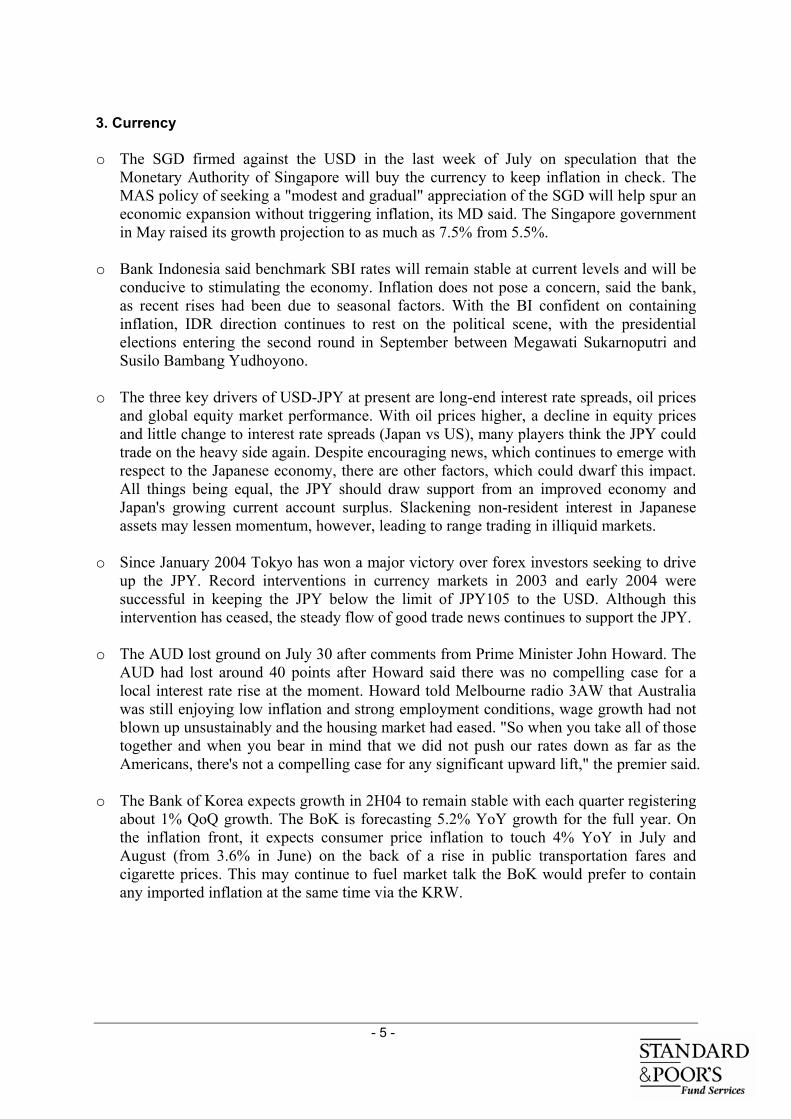
4. Performance of World-wide Indices Based on SGD The above indices represent the various major financial markets/sectors in the following manner: • Citi WGBI (Citigroup World Gov’t. Bond Index) Index: Global bonds • MSCI World Index: Global equities • MSCI AC Asia Fr x Japan Index: Asian ex-Japan equities • Singapore Strait Times Index: Singapore equities • UOB SGS Index: Singapore bonds The minimum annual interest rates paid by the CPF Board with regards the various accounts are as follows: • Ordinary: 2.5% • Special: 4.0% • Medisave: 4.0% • Retirement: 4.0% Please note that the above interest rates are based on the 12-month fixed deposit and month-end savings rates of the major local banks and are revised quarterly. The interest is computed monthly, and is credited and compounded annually.
Performance of Worldwide Indices in Quarter 2
-0.67 -1.13 -1.21
-7.78
3.08
-10.00
-7.00
-4.00
-1.00
2.00
5.00
MSCI World USD *
Citi WGBIUSD !
SingaporeStraits Times
*
UOB SGSIndex
MSCI AC Asiax Japan USD
*
Perc
enta
ge R
etur
n
- 7 -
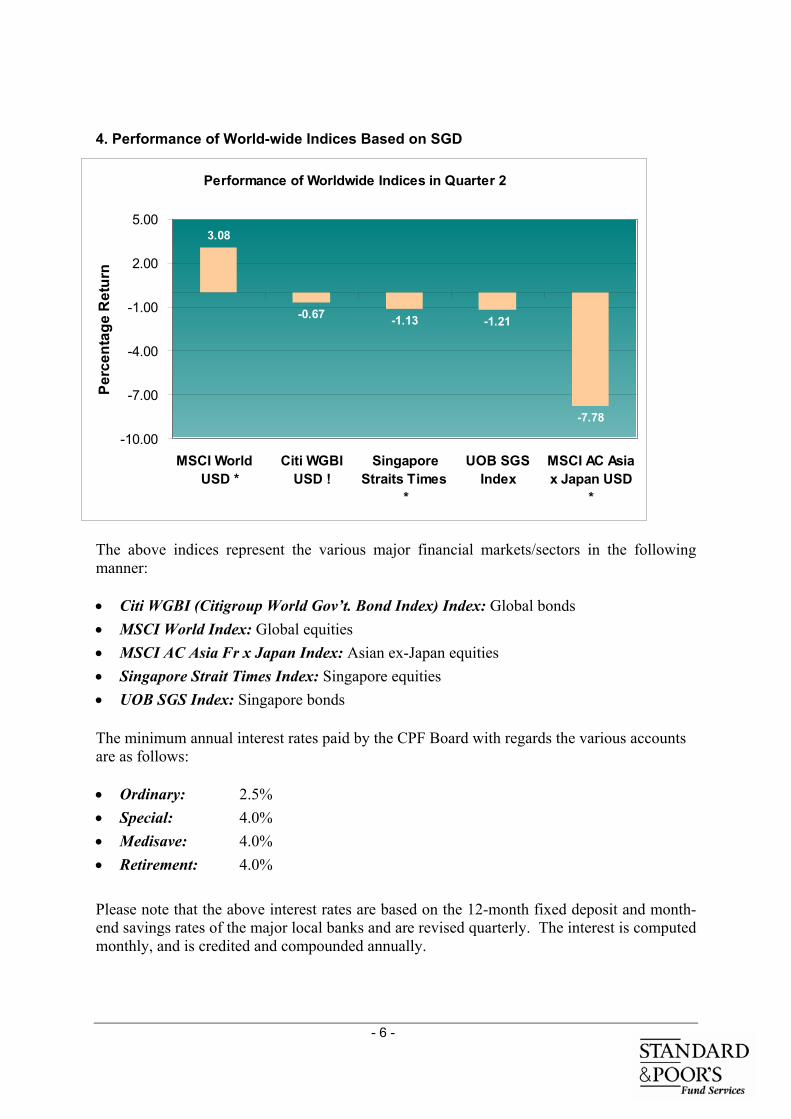
SUMMARY OF ABSOLUTE PERFORMANCE 1. Average Absolute Performance
The average absolute returns of the various asset classes1 of CPFIS-included unit trusts and ILPs are summarized in the graphs below.
-0.34-0.47-1.54
0.14
10.94
5.14
9.0611.21
21.69
-10
0
10
20
30
Past Quarter Past 1 Year Past 3 Years
Asset Class
Abso
lute
Ret
urn
(%)
Fixed IncomeAsset AllocationEquity
Average Performance of CPFIS-Included Unit Trusts Over the second quarter, the performance of CPFIS-included unit trusts was on average -1.22%. Fixed income funds came out as the best performer, although their average return is still a slight loss of 0.34 % over the period. In the longer 1-year period, equity funds with an average return of 21.69% far exceeded the performance of the two other asset classes. Asset allocation funds and fixed income funds posted returns of 9.06% and 0.14% respectively. Average return for CPFIS-included unit trusts over the last 12 months up to June 30, 2004 is 17.19%. With regards to the performance over the past 3 years, equity funds outperformed the two other asset classes with an average return of 11.21%. Average return generated by CPFIS-included unit trusts over this period is 10.36%
1 Definitions of the asset classes are as follows: - Money Market: Funds investing solely in money market or cash instruments with duration ranging from overnight to 12 months. Investments
will normally be held in bank deposits, short-term monetary investments (e.g. T. Bills and certificates of deposit). - Fixed Income: Funds investing in excess of 70% in fixed interest securities (corporate, government, index-linked etc.). - Asset Allocation: Funds with a portfolio principally invested in equity, fixed interest and money market securities but typically with no more
than 60% in any one asset class. - Equity: Funds investing in excess of 70% in equities or related instruments. Such funds may have an objective of capital and/or income growth;
and may be passively (i.e. index tracking) or actively managed.
- 8 -
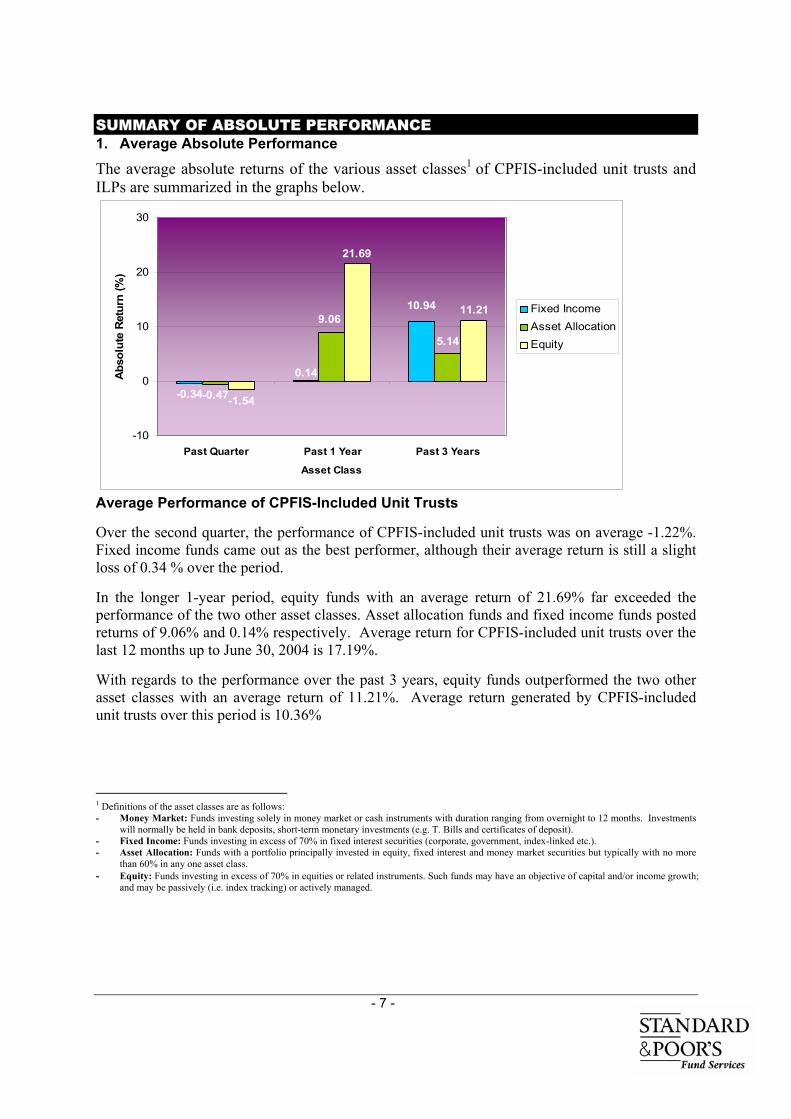
Average Performance of CPFIS-Included ILPs
0.10 1.660.37
-0.40
12.5514.39
-0.62-0.09
18.6518.04
-1.22
4.22
-6.00
1.00
8.00
15.00
22.00
Past Quarter Past 1 Year Past 3 Years
Asset Class
Abs
olut
e Re
turn
(%)
Money Market SGDAsset AllocationFixed IncomeEquity
As for the performance of CPFIS-included ILPs, the average return in Q2 is -0.87%. Amongst all the 4 asset classes, only money market funds produced positive return over the past quarter (0.10%). Over the last 12 months up to June 30, equity funds have outperformed the other categories, producing 18.04% in average return. Average returns for asset allocation, money market and fixed income funds in the same period are 12.55%, 0.37% and -0.09% respectively, with the overall return for CPFIS-included ILPs being, on average, a gain of 14.36%. In the 3-year period ended June 30, the average performance of all fund categories is satisfactory. Fixed income funds fared the best, with an average return of 18.65%. The performance of the asset allocation category is impressive as well over this timeframe with, on average, a return of 14.39%. Equity and money market funds’ average returns are 4.22 % and 1.66% respectively. The overall performance of CPFIS-included ILPs is 7.54% over the past 3 years.
- 9 -
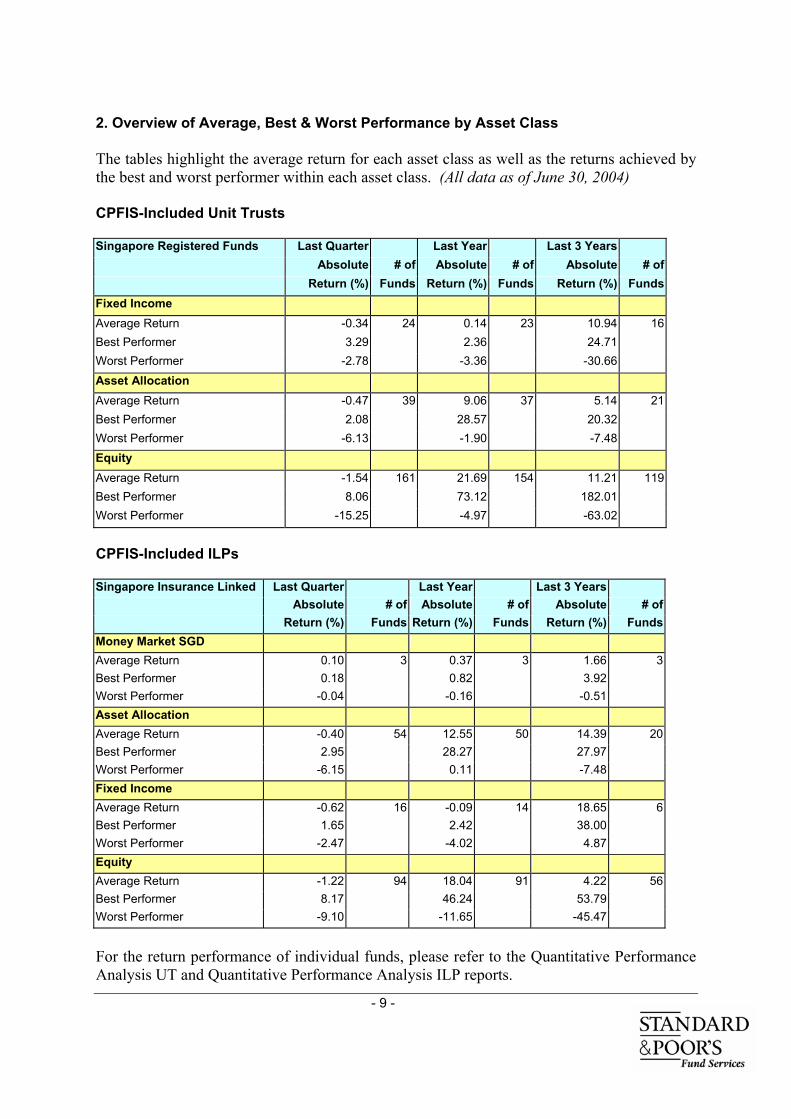
2. Overview of Average, Best & Worst Performance by Asset Class The tables highlight the average return for each asset class as well as the returns achieved by the best and worst performer within each asset class. (All data as of June 30, 2004) CPFIS-Included Unit Trusts Singapore Registered Funds Last Quarter Last Year Last 3 Years
Absolute # of Absolute # of Absolute # of Return (%) Funds Return (%) Funds Return (%) Funds
Fixed Income Average Return -0.34 24 0.14 23 10.94 16Best Performer 3.29 2.36 24.71 Worst Performer -2.78 -3.36 -30.66 Asset Allocation Average Return -0.47 39 9.06 37 5.14 21Best Performer 2.08 28.57 20.32 Worst Performer -6.13 -1.90 -7.48 Equity Average Return -1.54 161 21.69 154 11.21 119Best Performer 8.06 73.12 182.01 Worst Performer -15.25 -4.97 -63.02
CPFIS-Included ILPs Singapore Insurance Linked Last Quarter Last Year Last 3 Years
Absolute # of Absolute # of Absolute # of Return (%) Funds Return (%) Funds Return (%) Funds
Money Market SGD Average Return 0.10 3 0.37 3 1.66 3Best Performer 0.18 0.82 3.92 Worst Performer -0.04 -0.16 -0.51 Asset Allocation Average Return -0.40 54 12.55 50 14.39 20Best Performer 2.95 28.27 27.97 Worst Performer -6.15 0.11 -7.48 Fixed Income Average Return -0.62 16 -0.09 14 18.65 6Best Performer 1.65 2.42 38.00 Worst Performer -2.47 -4.02 4.87 Equity Average Return -1.22 94 18.04 91 4.22 56Best Performer 8.17 46.24 53.79 Worst Performer -9.10 -11.65 -45.47
For the return performance of individual funds, please refer to the Quantitative Performance Analysis UT and Quantitative Performance Analysis ILP reports.
- 10 -
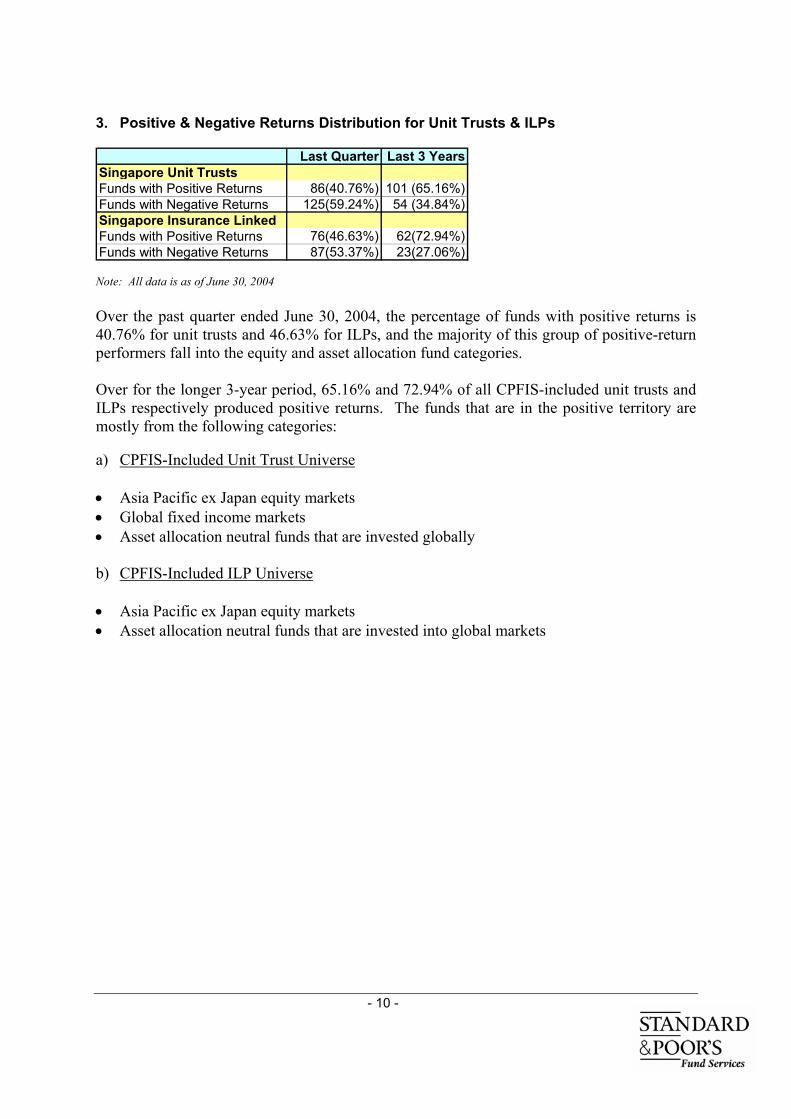
3. Positive & Negative Returns Distribution for Unit Trusts & ILPs
Last Quarter Last 3 YearsSingapore Unit TrustsFunds with Positive Returns 86(40.76%) 101 (65.16%)Funds with Negative Returns 125(59.24%) 54 (34.84%)Singapore Insurance LinkedFunds with Positive Returns 76(46.63%) 62(72.94%)Funds with Negative Returns 87(53.37%) 23(27.06%)
Note: All data is as of June 30, 2004 Over the past quarter ended June 30, 2004, the percentage of funds with positive returns is 40.76% for unit trusts and 46.63% for ILPs, and the majority of this group of positive-return performers fall into the equity and asset allocation fund categories. Over for the longer 3-year period, 65.16% and 72.94% of all CPFIS-included unit trusts and ILPs respectively produced positive returns. The funds that are in the positive territory are mostly from the following categories: a) CPFIS-Included Unit Trust Universe • Asia Pacific ex Japan equity markets • Global fixed income markets • Asset allocation neutral funds that are invested globally b) CPFIS-Included ILP Universe • Asia Pacific ex Japan equity markets • Asset allocation neutral funds that are invested into global markets
- 11 -
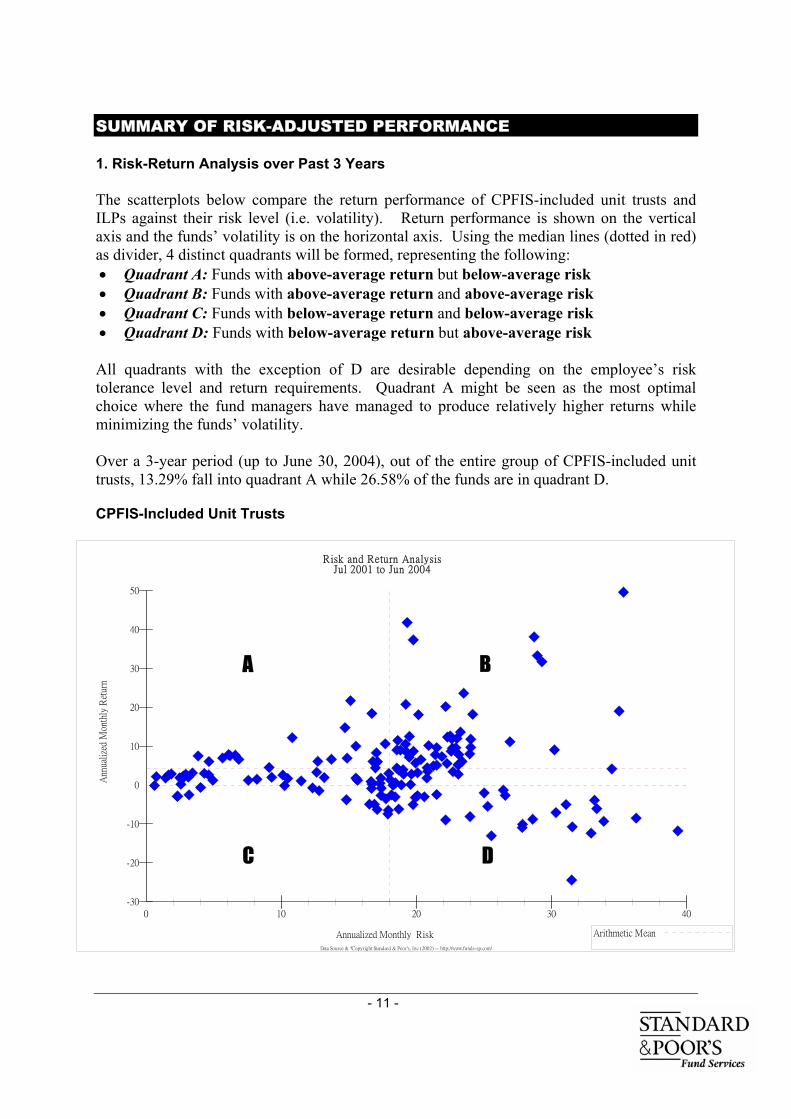
SUMMARY OF RISK-ADJUSTED PERFORMANCE 1. Risk-Return Analysis over Past 3 Years The scatterplots below compare the return performance of CPFIS-included unit trusts and ILPs against their risk level (i.e. volatility). Return performance is shown on the vertical axis and the funds’ volatility is on the horizontal axis. Using the median lines (dotted in red) as divider, 4 distinct quadrants will be formed, representing the following: • Quadrant A: Funds with above-average return but below-average risk • Quadrant B: Funds with above-average return and above-average risk • Quadrant C: Funds with below-average return and below-average risk • Quadrant D: Funds with below-average return but above-average risk
All quadrants with the exception of D are desirable depending on the employee’s risk tolerance level and return requirements. Quadrant A might be seen as the most optimal choice where the fund managers have managed to produce relatively higher returns while minimizing the funds’ volatility. Over a 3-year period (up to June 30, 2004), out of the entire group of CPFIS-included unit trusts, 13.29% fall into quadrant A while 26.58% of the funds are in quadrant D. CPFIS-Included Unit Trusts
Risk and Return AnalysisJul 2001 to Jun 2004
Ann
ualize
d M
onth
ly R
etur
n
Annualized Monthly Risk
-10
-20
-30
0
10
20
30
40
50
0 10 20 30 40
Arithmetic Mean
Data Source & ?Copyright Standard & Poor's, Inc (2002) -- http://www.funds-sp.com/
A B
C D
- 12 -
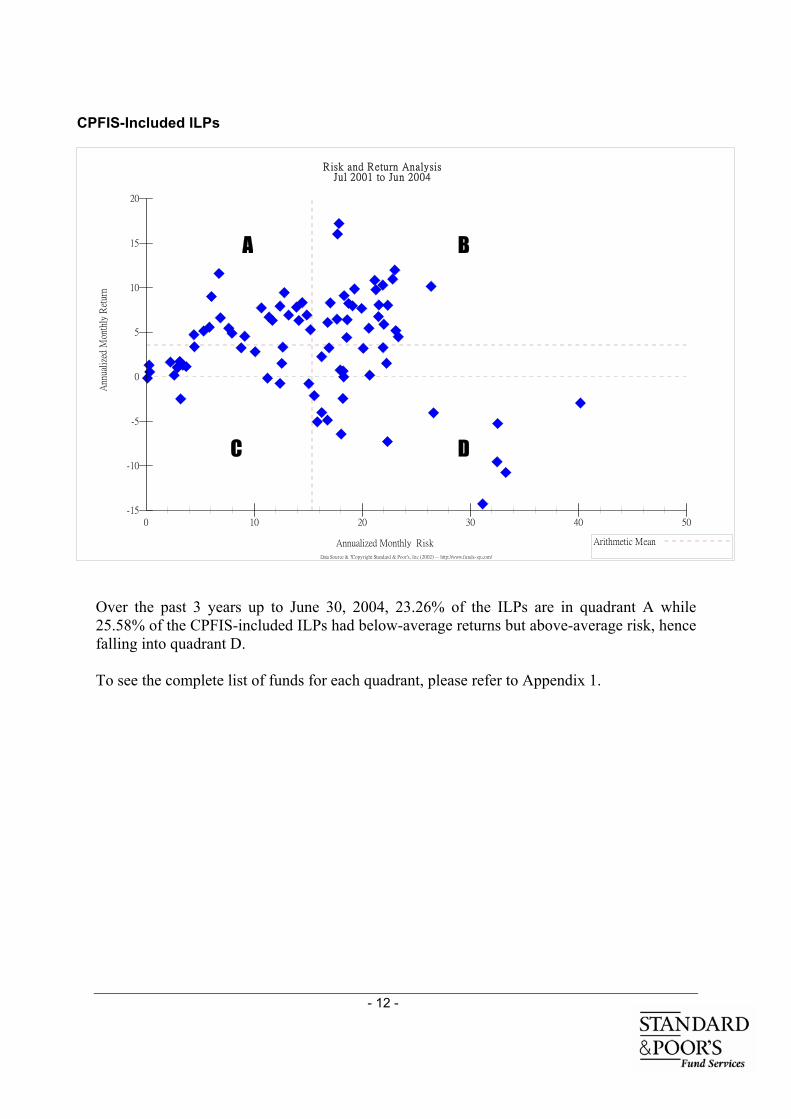
CPFIS-Included ILPs
Over the past 3 years up to June 30, 2004, 23.26% of the ILPs are in quadrant A while 25.58% of the CPFIS-included ILPs had below-average returns but above-average risk, hence falling into quadrant D. To see the complete list of funds for each quadrant, please refer to Appendix 1.
Risk and Return AnalysisJul 2001 to Jun 2004
Ann
uali
zed
Mon
thly
Ret
urn
Annualized Monthly Risk
-5
-10
-15
0
5
10
15
20
0 10 20 30 40 50
Arithmetic Mean
Data Source & ?Copyright Standard & Poor's, Inc (2002) -- http://www.funds-sp.com/
C D
B A
- 13 -
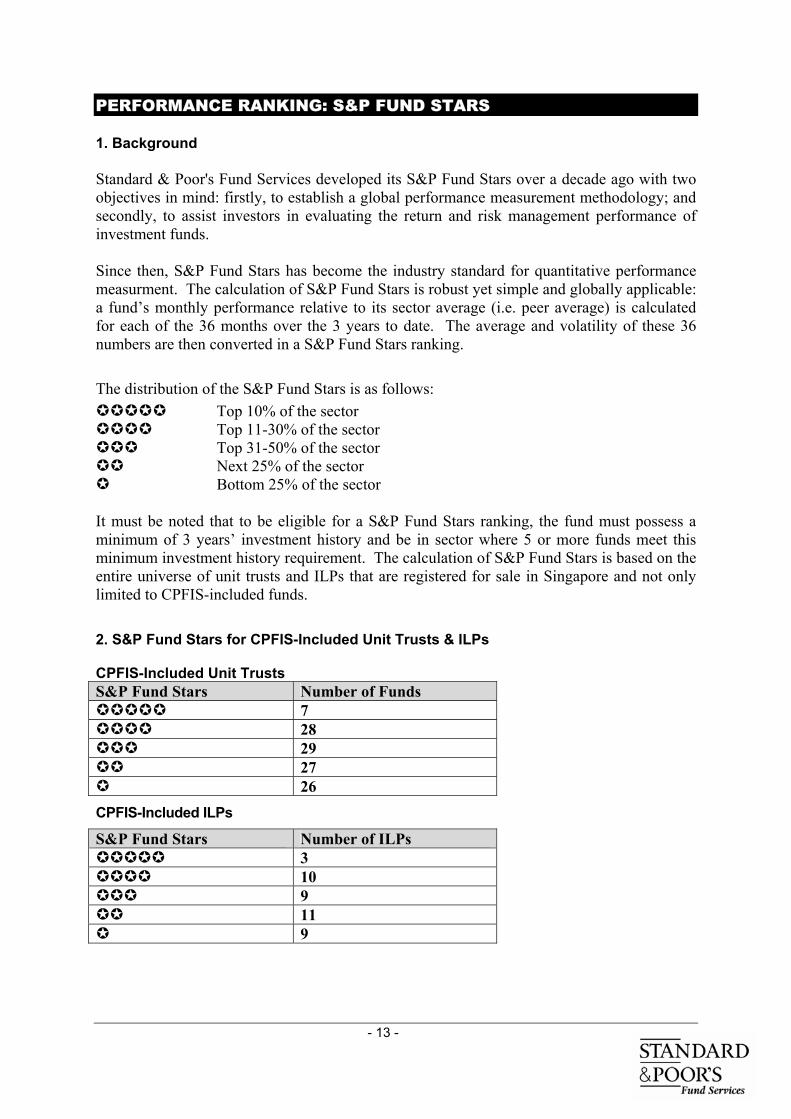
PERFORMANCE RANKING: S&P FUND STARS 1. Background Standard & Poor's Fund Services developed its S&P Fund Stars over a decade ago with two objectives in mind: firstly, to establish a global performance measurement methodology; and secondly, to assist investors in evaluating the return and risk management performance of investment funds. Since then, S&P Fund Stars has become the industry standard for quantitative performance measurment. The calculation of S&P Fund Stars is robust yet simple and globally applicable: a fund’s monthly performance relative to its sector average (i.e. peer average) is calculated for each of the 36 months over the 3 years to date. The average and volatility of these 36 numbers are then converted in a S&P Fund Stars ranking.
The distribution of the S&P Fund Stars is as follows: Top 10% of the sector
Top 11-30% of the sector Top 31-50% of the sector
Next 25% of the sector Bottom 25% of the sector
It must be noted that to be eligible for a S&P Fund Stars ranking, the fund must possess a minimum of 3 years’ investment history and be in sector where 5 or more funds meet this minimum investment history requirement. The calculation of S&P Fund Stars is based on the entire universe of unit trusts and ILPs that are registered for sale in Singapore and not only limited to CPFIS-included funds.
2. S&P Fund Stars for CPFIS-Included Unit Trusts & ILPs CPFIS-Included Unit Trusts S&P Fund Stars Number of Funds
7 28
29 27
26 CPFIS-Included ILPs
S&P Fund Stars Number of ILPs 3
10 9
11 9
- 14 -
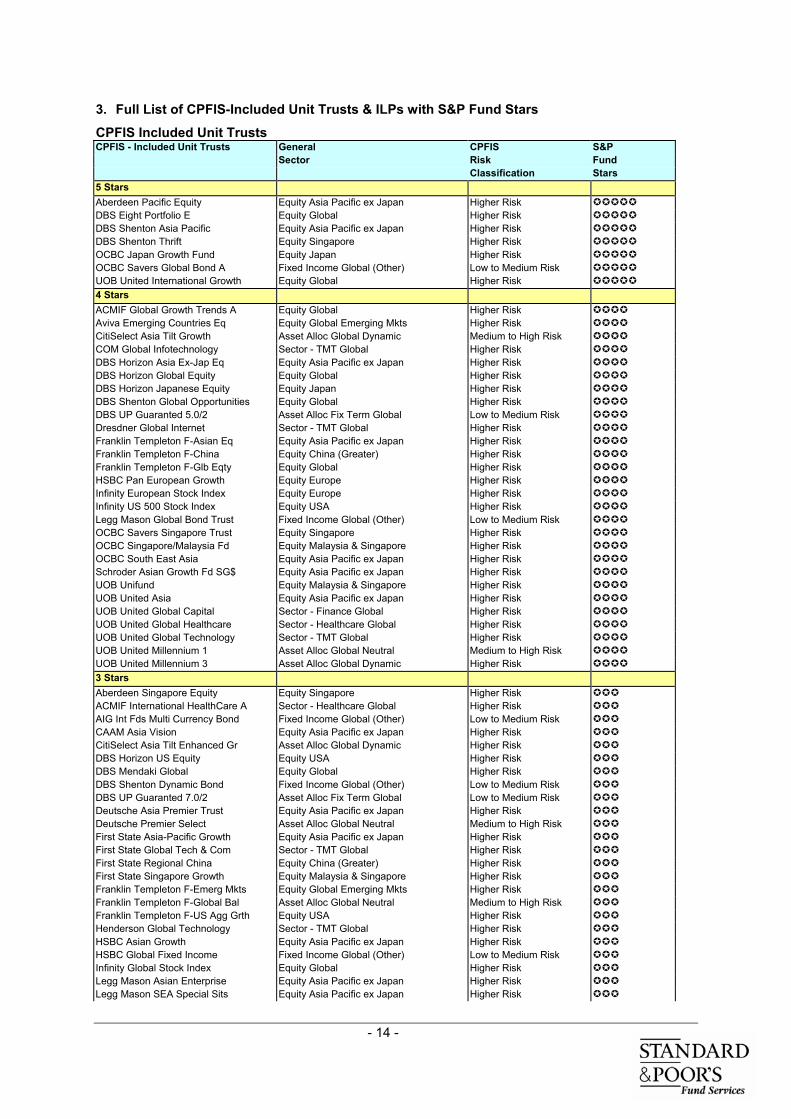
3. Full List of CPFIS-Included Unit Trusts & ILPs with S&P Fund Stars
CPFIS Included Unit Trusts CPFIS - Included Unit Trusts General CPFIS S&P Sector Risk Fund Classification Stars 5 Stars Aberdeen Pacific Equity Equity Asia Pacific ex Japan Higher Risk DBS Eight Portfolio E Equity Global Higher Risk DBS Shenton Asia Pacific Equity Asia Pacific ex Japan Higher Risk DBS Shenton Thrift Equity Singapore Higher Risk OCBC Japan Growth Fund Equity Japan Higher Risk OCBC Savers Global Bond A Fixed Income Global (Other) Low to Medium Risk UOB United International Growth Equity Global Higher Risk
4 Stars ACMIF Global Growth Trends A Equity Global Higher Risk Aviva Emerging Countries Eq Equity Global Emerging Mkts Higher Risk CitiSelect Asia Tilt Growth Asset Alloc Global Dynamic Medium to High Risk COM Global Infotechnology Sector - TMT Global Higher Risk DBS Horizon Asia Ex-Jap Eq Equity Asia Pacific ex Japan Higher Risk DBS Horizon Global Equity Equity Global Higher Risk DBS Horizon Japanese Equity Equity Japan Higher Risk DBS Shenton Global Opportunities Equity Global Higher Risk DBS UP Guaranted 5.0/2 Asset Alloc Fix Term Global Low to Medium Risk Dresdner Global Internet Sector - TMT Global Higher Risk Franklin Templeton F-Asian Eq Equity Asia Pacific ex Japan Higher Risk Franklin Templeton F-China Equity China (Greater) Higher Risk Franklin Templeton F-Glb Eqty Equity Global Higher Risk HSBC Pan European Growth Equity Europe Higher Risk Infinity European Stock Index Equity Europe Higher Risk Infinity US 500 Stock Index Equity USA Higher Risk Legg Mason Global Bond Trust Fixed Income Global (Other) Low to Medium Risk OCBC Savers Singapore Trust Equity Singapore Higher Risk OCBC Singapore/Malaysia Fd Equity Malaysia & Singapore Higher Risk OCBC South East Asia Equity Asia Pacific ex Japan Higher Risk Schroder Asian Growth Fd SG$ Equity Asia Pacific ex Japan Higher Risk UOB Unifund Equity Malaysia & Singapore Higher Risk UOB United Asia Equity Asia Pacific ex Japan Higher Risk UOB United Global Capital Sector - Finance Global Higher Risk UOB United Global Healthcare Sector - Healthcare Global Higher Risk UOB United Global Technology Sector - TMT Global Higher Risk UOB United Millennium 1 Asset Alloc Global Neutral Medium to High Risk UOB United Millennium 3 Asset Alloc Global Dynamic Higher Risk
3 Stars Aberdeen Singapore Equity Equity Singapore Higher Risk ACMIF International HealthCare A Sector - Healthcare Global Higher Risk AIG Int Fds Multi Currency Bond Fixed Income Global (Other) Low to Medium Risk CAAM Asia Vision Equity Asia Pacific ex Japan Higher Risk CitiSelect Asia Tilt Enhanced Gr Asset Alloc Global Dynamic Higher Risk DBS Horizon US Equity Equity USA Higher Risk DBS Mendaki Global Equity Global Higher Risk DBS Shenton Dynamic Bond Fixed Income Global (Other) Low to Medium Risk DBS UP Guaranted 7.0/2 Asset Alloc Fix Term Global Low to Medium Risk Deutsche Asia Premier Trust Equity Asia Pacific ex Japan Higher Risk Deutsche Premier Select Asset Alloc Global Neutral Medium to High Risk First State Asia-Pacific Growth Equity Asia Pacific ex Japan Higher Risk First State Global Tech & Com Sector - TMT Global Higher Risk First State Regional China Equity China (Greater) Higher Risk First State Singapore Growth Equity Malaysia & Singapore Higher Risk Franklin Templeton F-Emerg Mkts Equity Global Emerging Mkts Higher Risk Franklin Templeton F-Global Bal Asset Alloc Global Neutral Medium to High Risk Franklin Templeton F-US Agg Grth Equity USA Higher Risk Henderson Global Technology Sector - TMT Global Higher Risk HSBC Asian Growth Equity Asia Pacific ex Japan Higher Risk HSBC Global Fixed Income Fixed Income Global (Other) Low to Medium Risk Infinity Global Stock Index Equity Global Higher Risk Legg Mason Asian Enterprise Equity Asia Pacific ex Japan Higher Risk Legg Mason SEA Special Sits Equity Asia Pacific ex Japan Higher Risk
- 15 -
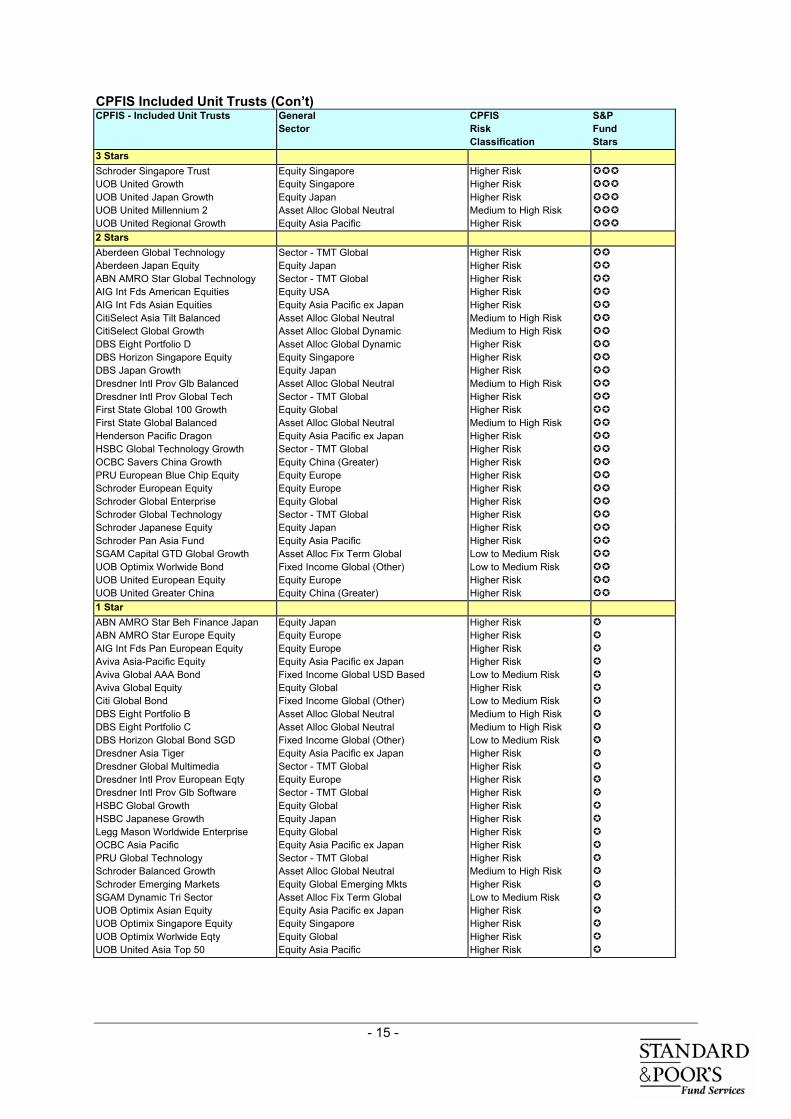
CPFIS Included Unit Trusts (Con’t) CPFIS - Included Unit Trusts General CPFIS S&P Sector Risk Fund Classification Stars 3 Stars Schroder Singapore Trust Equity Singapore Higher Risk UOB United Growth Equity Singapore Higher Risk UOB United Japan Growth Equity Japan Higher Risk UOB United Millennium 2 Asset Alloc Global Neutral Medium to High Risk UOB United Regional Growth Equity Asia Pacific Higher Risk
2 Stars Aberdeen Global Technology Sector - TMT Global Higher Risk Aberdeen Japan Equity Equity Japan Higher Risk ABN AMRO Star Global Technology Sector - TMT Global Higher Risk AIG Int Fds American Equities Equity USA Higher Risk AIG Int Fds Asian Equities Equity Asia Pacific ex Japan Higher Risk CitiSelect Asia Tilt Balanced Asset Alloc Global Neutral Medium to High Risk CitiSelect Global Growth Asset Alloc Global Dynamic Medium to High Risk DBS Eight Portfolio D Asset Alloc Global Dynamic Higher Risk DBS Horizon Singapore Equity Equity Singapore Higher Risk DBS Japan Growth Equity Japan Higher Risk Dresdner Intl Prov Glb Balanced Asset Alloc Global Neutral Medium to High Risk Dresdner Intl Prov Global Tech Sector - TMT Global Higher Risk First State Global 100 Growth Equity Global Higher Risk First State Global Balanced Asset Alloc Global Neutral Medium to High Risk Henderson Pacific Dragon Equity Asia Pacific ex Japan Higher Risk HSBC Global Technology Growth Sector - TMT Global Higher Risk OCBC Savers China Growth Equity China (Greater) Higher Risk PRU European Blue Chip Equity Equity Europe Higher Risk Schroder European Equity Equity Europe Higher Risk Schroder Global Enterprise Equity Global Higher Risk Schroder Global Technology Sector - TMT Global Higher Risk Schroder Japanese Equity Equity Japan Higher Risk Schroder Pan Asia Fund Equity Asia Pacific Higher Risk SGAM Capital GTD Global Growth Asset Alloc Fix Term Global Low to Medium Risk UOB Optimix Worlwide Bond Fixed Income Global (Other) Low to Medium Risk UOB United European Equity Equity Europe Higher Risk UOB United Greater China Equity China (Greater) Higher Risk
1 Star ABN AMRO Star Beh Finance Japan Equity Japan Higher Risk ABN AMRO Star Europe Equity Equity Europe Higher Risk AIG Int Fds Pan European Equity Equity Europe Higher Risk Aviva Asia-Pacific Equity Equity Asia Pacific ex Japan Higher Risk Aviva Global AAA Bond Fixed Income Global USD Based Low to Medium Risk Aviva Global Equity Equity Global Higher Risk Citi Global Bond Fixed Income Global (Other) Low to Medium Risk DBS Eight Portfolio B Asset Alloc Global Neutral Medium to High Risk DBS Eight Portfolio C Asset Alloc Global Neutral Medium to High Risk DBS Horizon Global Bond SGD Fixed Income Global (Other) Low to Medium Risk Dresdner Asia Tiger Equity Asia Pacific ex Japan Higher Risk Dresdner Global Multimedia Sector - TMT Global Higher Risk Dresdner Intl Prov European Eqty Equity Europe Higher Risk Dresdner Intl Prov Glb Software Sector - TMT Global Higher Risk HSBC Global Growth Equity Global Higher Risk HSBC Japanese Growth Equity Japan Higher Risk Legg Mason Worldwide Enterprise Equity Global Higher Risk OCBC Asia Pacific Equity Asia Pacific ex Japan Higher Risk PRU Global Technology Sector - TMT Global Higher Risk Schroder Balanced Growth Asset Alloc Global Neutral Medium to High Risk Schroder Emerging Markets Equity Global Emerging Mkts Higher Risk SGAM Dynamic Tri Sector Asset Alloc Fix Term Global Low to Medium Risk UOB Optimix Asian Equity Equity Asia Pacific ex Japan Higher Risk UOB Optimix Singapore Equity Equity Singapore Higher Risk UOB Optimix Worlwide Eqty Equity Global Higher Risk UOB United Asia Top 50 Equity Asia Pacific Higher Risk
- 16 -
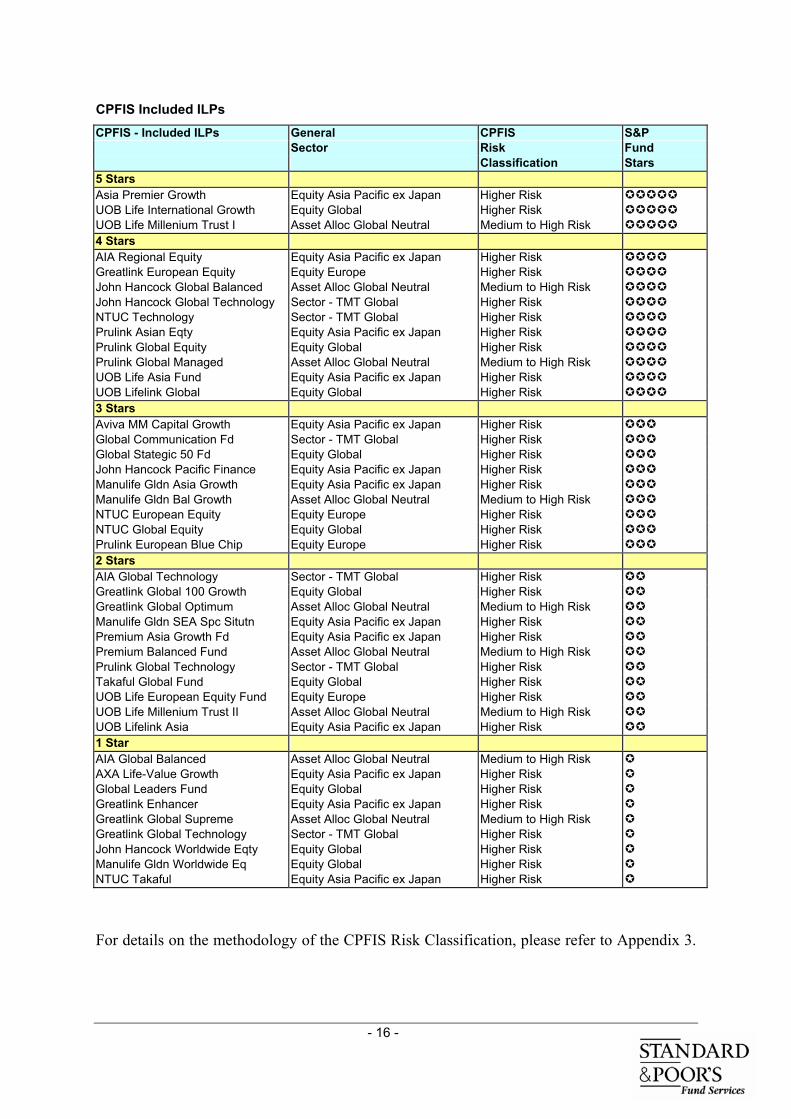
CPFIS Included ILPs
CPFIS - Included ILPs General CPFIS S&P Sector Risk Fund Classification Stars 5 Stars Asia Premier Growth Equity Asia Pacific ex Japan Higher Risk UOB Life International Growth Equity Global Higher Risk UOB Life Millenium Trust I Asset Alloc Global Neutral Medium to High Risk 4 Stars AIA Regional Equity Equity Asia Pacific ex Japan Higher Risk Greatlink European Equity Equity Europe Higher Risk John Hancock Global Balanced Asset Alloc Global Neutral Medium to High Risk John Hancock Global Technology Sector - TMT Global Higher Risk NTUC Technology Sector - TMT Global Higher Risk Prulink Asian Eqty Equity Asia Pacific ex Japan Higher Risk Prulink Global Equity Equity Global Higher Risk Prulink Global Managed Asset Alloc Global Neutral Medium to High Risk UOB Life Asia Fund Equity Asia Pacific ex Japan Higher Risk UOB Lifelink Global Equity Global Higher Risk 3 Stars Aviva MM Capital Growth Equity Asia Pacific ex Japan Higher Risk Global Communication Fd Sector - TMT Global Higher Risk Global Stategic 50 Fd Equity Global Higher Risk John Hancock Pacific Finance Equity Asia Pacific ex Japan Higher Risk Manulife Gldn Asia Growth Equity Asia Pacific ex Japan Higher Risk Manulife Gldn Bal Growth Asset Alloc Global Neutral Medium to High Risk NTUC European Equity Equity Europe Higher Risk NTUC Global Equity Equity Global Higher Risk Prulink European Blue Chip Equity Europe Higher Risk 2 Stars AIA Global Technology Sector - TMT Global Higher Risk Greatlink Global 100 Growth Equity Global Higher Risk Greatlink Global Optimum Asset Alloc Global Neutral Medium to High Risk Manulife Gldn SEA Spc Situtn Equity Asia Pacific ex Japan Higher Risk Premium Asia Growth Fd Equity Asia Pacific ex Japan Higher Risk Premium Balanced Fund Asset Alloc Global Neutral Medium to High Risk Prulink Global Technology Sector - TMT Global Higher Risk Takaful Global Fund Equity Global Higher Risk UOB Life European Equity Fund Equity Europe Higher Risk UOB Life Millenium Trust II Asset Alloc Global Neutral Medium to High Risk UOB Lifelink Asia Equity Asia Pacific ex Japan Higher Risk 1 Star AIA Global Balanced Asset Alloc Global Neutral Medium to High Risk AXA Life-Value Growth Equity Asia Pacific ex Japan Higher Risk Global Leaders Fund Equity Global Higher Risk Greatlink Enhancer Equity Asia Pacific ex Japan Higher Risk Greatlink Global Supreme Asset Alloc Global Neutral Medium to High Risk Greatlink Global Technology Sector - TMT Global Higher Risk John Hancock Worldwide Eqty Equity Global Higher Risk Manulife Gldn Worldwide Eq Equity Global Higher Risk NTUC Takaful Equity Asia Pacific ex Japan Higher Risk
For details on the methodology of the CPFIS Risk Classification, please refer to Appendix 3.
- 17 -
FURTHER INFORMATION Additional information can be found in the appendices: • Appendix 1: Complete List of Funds in Each Quandrant of the Risk/Return Chart • Appendix 2: S&P Fund Stars Methodology • Appendix 3: Investment Terminology Definition For a soft copy of this report as well as the most-to-date performance data on CPFIS-included unit trusts and ILPs, please visit www.fundsingapore.com. NOTE All returns are calculated on a bid-to-bid basis in SGD, with gross income re-invested. DISCLAIMERS The data provided in this report is for information only and not deemed to be financial advice or offer to sell, or a solicitation or an offer to buy or subscribe to or hold any fund. Past performance is not indicative of future performance. All investments involve risk – in other words, the price of units and income from them can go down as well as up. Before investing in any fund, you should carefully read the literature about the fund, including its Explanantory Memorandum. All data contained in this report has been provided to Standard & Poor’s Fund Services by the management groups or insurers who manage the unit trusts or ILPs that are included in the CPFIS. While Standard & Poor’s Fund Services has made reasonable endeavours to ensure the accuracy the information obtained, it does not accept any responsibility with regards to the accuracy or completeness of the information provided or any liability for the investment decisions of investors or any loss arising therefrom.
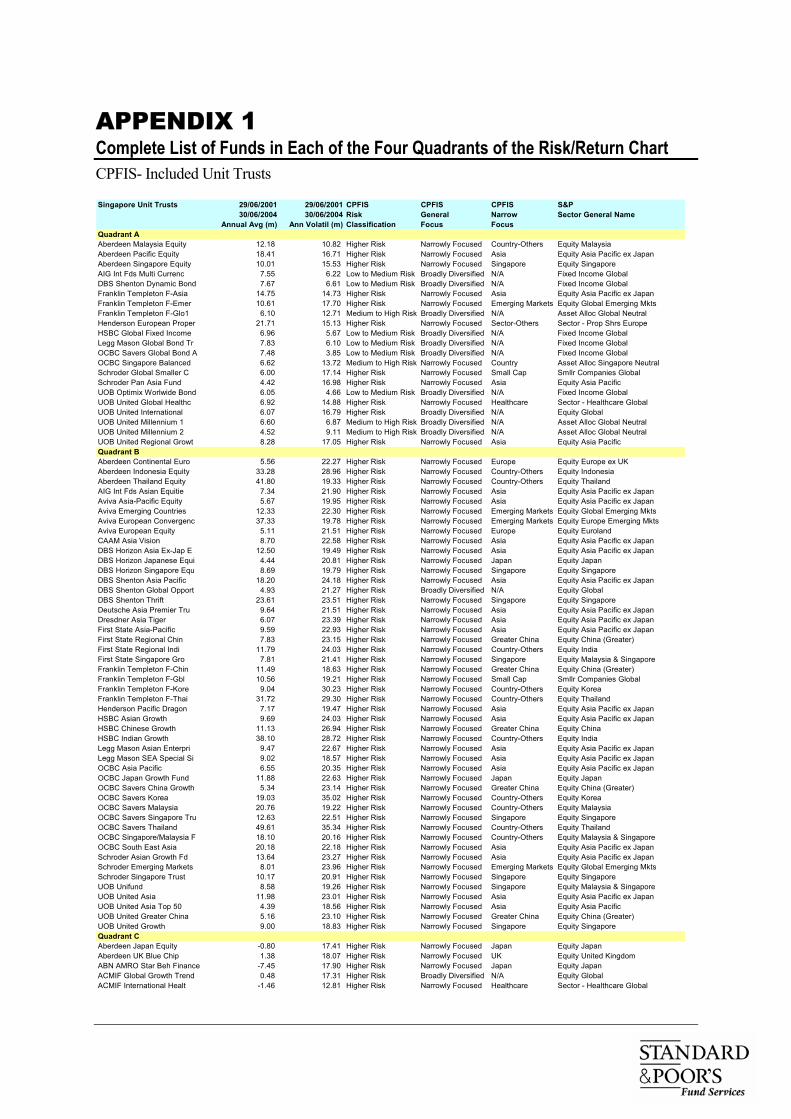
APPENDIX 1 Complete List of Funds in Each of the Four Quadrants of the Risk/Return Chart CPFIS- Included Unit Trusts Singapore Unit Trusts 29/06/2001 29/06/2001 CPFIS CPFIS CPFIS S&P
30/06/2004 30/06/2004 Risk General Narrow Sector General Name Annual Avg (m) Ann Volatil (m) Classification Focus Focus
Quadrant AAberdeen Malaysia Equity 12.18 10.82 Higher Risk Narrowly Focused Country-Others Equity MalaysiaAberdeen Pacific Equity 18.41 16.71 Higher Risk Narrowly Focused Asia Equity Asia Pacific ex JapanAberdeen Singapore Equity 10.01 15.53 Higher Risk Narrowly Focused Singapore Equity SingaporeAIG Int Fds Multi Currenc 7.55 6.22 Low to Medium Risk Broadly Diversified N/A Fixed Income GlobalDBS Shenton Dynamic Bond 7.67 6.61 Low to Medium Risk Broadly Diversified N/A Fixed Income GlobalFranklin Templeton F-Asia 14.75 14.73 Higher Risk Narrowly Focused Asia Equity Asia Pacific ex JapanFranklin Templeton F-Emer 10.61 17.70 Higher Risk Narrowly Focused Emerging Markets Equity Global Emerging MktsFranklin Templeton F-Glo1 6.10 12.71 Medium to High Risk Broadly Diversified N/A Asset Alloc Global NeutralHenderson European Proper 21.71 15.13 Higher Risk Narrowly Focused Sector-Others Sector - Prop Shrs EuropeHSBC Global Fixed Income 6.96 5.67 Low to Medium Risk Broadly Diversified N/A Fixed Income GlobalLegg Mason Global Bond Tr 7.83 6.10 Low to Medium Risk Broadly Diversified N/A Fixed Income GlobalOCBC Savers Global Bond A 7.48 3.85 Low to Medium Risk Broadly Diversified N/A Fixed Income GlobalOCBC Singapore Balanced 6.62 13.72 Medium to High Risk Narrowly Focused Country Asset Alloc Singapore NeutralSchroder Global Smaller C 6.00 17.14 Higher Risk Narrowly Focused Small Cap Smllr Companies GlobalSchroder Pan Asia Fund 4.42 16.98 Higher Risk Narrowly Focused Asia Equity Asia PacificUOB Optimix Worlwide Bond 6.05 4.66 Low to Medium Risk Broadly Diversified N/A Fixed Income GlobalUOB United Global Healthc 6.92 14.88 Higher Risk Narrowly Focused Healthcare Sector - Healthcare GlobalUOB United International 6.07 16.79 Higher Risk Broadly Diversified N/A Equity GlobalUOB United Millennium 1 6.60 6.87 Medium to High Risk Broadly Diversified N/A Asset Alloc Global NeutralUOB United Millennium 2 4.52 9.11 Medium to High Risk Broadly Diversified N/A Asset Alloc Global NeutralUOB United Regional Growt 8.28 17.05 Higher Risk Narrowly Focused Asia Equity Asia PacificQuadrant BAberdeen Continental Euro 5.56 22.27 Higher Risk Narrowly Focused Europe Equity Europe ex UKAberdeen Indonesia Equity 33.28 28.96 Higher Risk Narrowly Focused Country-Others Equity IndonesiaAberdeen Thailand Equity 41.80 19.33 Higher Risk Narrowly Focused Country-Others Equity ThailandAIG Int Fds Asian Equitie 7.34 21.90 Higher Risk Narrowly Focused Asia Equity Asia Pacific ex JapanAviva Asia-Pacific Equity 5.67 19.95 Higher Risk Narrowly Focused Asia Equity Asia Pacific ex JapanAviva Emerging Countries 12.33 22.30 Higher Risk Narrowly Focused Emerging Markets Equity Global Emerging MktsAviva European Convergenc 37.33 19.78 Higher Risk Narrowly Focused Emerging Markets Equity Europe Emerging MktsAviva European Equity 5.11 21.51 Higher Risk Narrowly Focused Europe Equity EurolandCAAM Asia Vision 8.70 22.58 Higher Risk Narrowly Focused Asia Equity Asia Pacific ex JapanDBS Horizon Asia Ex-Jap E 12.50 19.49 Higher Risk Narrowly Focused Asia Equity Asia Pacific ex JapanDBS Horizon Japanese Equi 4.44 20.81 Higher Risk Narrowly Focused Japan Equity JapanDBS Horizon Singapore Equ 8.69 19.79 Higher Risk Narrowly Focused Singapore Equity SingaporeDBS Shenton Asia Pacific 18.20 24.18 Higher Risk Narrowly Focused Asia Equity Asia Pacific ex JapanDBS Shenton Global Opport 4.93 21.27 Higher Risk Broadly Diversified N/A Equity GlobalDBS Shenton Thrift 23.61 23.51 Higher Risk Narrowly Focused Singapore Equity SingaporeDeutsche Asia Premier Tru 9.64 21.51 Higher Risk Narrowly Focused Asia Equity Asia Pacific ex JapanDresdner Asia Tiger 6.07 23.39 Higher Risk Narrowly Focused Asia Equity Asia Pacific ex JapanFirst State Asia-Pacific 9.59 22.93 Higher Risk Narrowly Focused Asia Equity Asia Pacific ex JapanFirst State Regional Chin 7.83 23.15 Higher Risk Narrowly Focused Greater China Equity China (Greater)First State Regional Indi 11.79 24.03 Higher Risk Narrowly Focused Country-Others Equity IndiaFirst State Singapore Gro 7.81 21.41 Higher Risk Narrowly Focused Singapore Equity Malaysia & SingaporeFranklin Templeton F-Chin 11.49 18.63 Higher Risk Narrowly Focused Greater China Equity China (Greater)Franklin Templeton F-Gbl 10.56 19.21 Higher Risk Narrowly Focused Small Cap Smllr Companies GlobalFranklin Templeton F-Kore 9.04 30.23 Higher Risk Narrowly Focused Country-Others Equity KoreaFranklin Templeton F-Thai 31.72 29.30 Higher Risk Narrowly Focused Country-Others Equity ThailandHenderson Pacific Dragon 7.17 19.47 Higher Risk Narrowly Focused Asia Equity Asia Pacific ex JapanHSBC Asian Growth 9.69 24.03 Higher Risk Narrowly Focused Asia Equity Asia Pacific ex JapanHSBC Chinese Growth 11.13 26.94 Higher Risk Narrowly Focused Greater China Equity ChinaHSBC Indian Growth 38.10 28.72 Higher Risk Narrowly Focused Country-Others Equity IndiaLegg Mason Asian Enterpri 9.47 22.67 Higher Risk Narrowly Focused Asia Equity Asia Pacific ex JapanLegg Mason SEA Special Si 9.02 18.57 Higher Risk Narrowly Focused Asia Equity Asia Pacific ex JapanOCBC Asia Pacific 6.55 20.35 Higher Risk Narrowly Focused Asia Equity Asia Pacific ex JapanOCBC Japan Growth Fund 11.88 22.63 Higher Risk Narrowly Focused Japan Equity JapanOCBC Savers China Growth 5.34 23.14 Higher Risk Narrowly Focused Greater China Equity China (Greater)OCBC Savers Korea 19.03 35.02 Higher Risk Narrowly Focused Country-Others Equity KoreaOCBC Savers Malaysia 20.76 19.22 Higher Risk Narrowly Focused Country-Others Equity MalaysiaOCBC Savers Singapore Tru 12.63 22.51 Higher Risk Narrowly Focused Singapore Equity SingaporeOCBC Savers Thailand 49.61 35.34 Higher Risk Narrowly Focused Country-Others Equity ThailandOCBC Singapore/Malaysia F 18.10 20.16 Higher Risk Narrowly Focused Country-Others Equity Malaysia & SingaporeOCBC South East Asia 20.18 22.18 Higher Risk Narrowly Focused Asia Equity Asia Pacific ex JapanSchroder Asian Growth Fd 13.64 23.27 Higher Risk Narrowly Focused Asia Equity Asia Pacific ex JapanSchroder Emerging Markets 8.01 23.96 Higher Risk Narrowly Focused Emerging Markets Equity Global Emerging MktsSchroder Singapore Trust 10.17 20.91 Higher Risk Narrowly Focused Singapore Equity SingaporeUOB Unifund 8.58 19.26 Higher Risk Narrowly Focused Singapore Equity Malaysia & SingaporeUOB United Asia 11.98 23.01 Higher Risk Narrowly Focused Asia Equity Asia Pacific ex JapanUOB United Asia Top 50 4.39 18.56 Higher Risk Narrowly Focused Asia Equity Asia PacificUOB United Greater China 5.16 23.10 Higher Risk Narrowly Focused Greater China Equity China (Greater)UOB United Growth 9.00 18.83 Higher Risk Narrowly Focused Singapore Equity SingaporeQuadrant CAberdeen Japan Equity -0.80 17.41 Higher Risk Narrowly Focused Japan Equity JapanAberdeen UK Blue Chip 1.38 18.07 Higher Risk Narrowly Focused UK Equity United KingdomABN AMRO Star Beh Finance -7.45 17.90 Higher Risk Narrowly Focused Japan Equity JapanACMIF Global Growth Trend 0.48 17.31 Higher Risk Broadly Diversified N/A Equity GlobalACMIF International Healt -1.46 12.81 Higher Risk Narrowly Focused Healthcare Sector - Healthcare Global
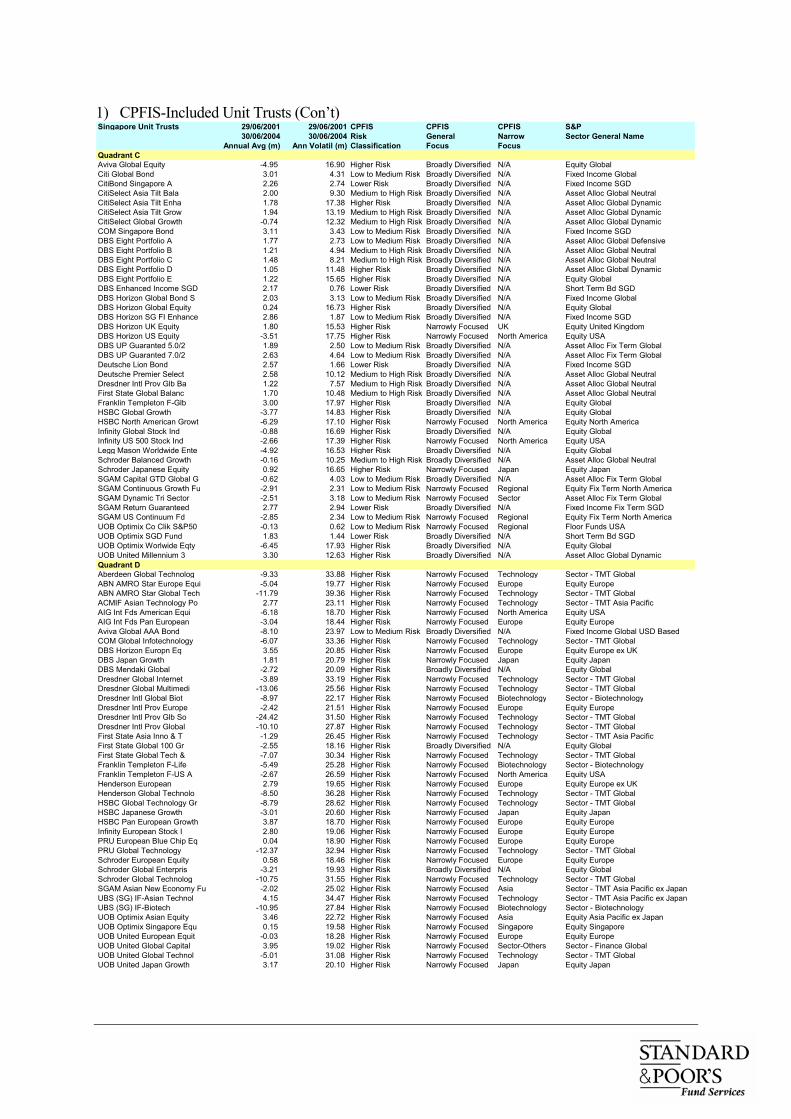
1) CPFIS-Included Unit Trusts (Con’t) Singapore Unit Trusts 29/06/2001 29/06/2001 CPFIS CPFIS CPFIS S&P
30/06/2004 30/06/2004 Risk General Narrow Sector General Name Annual Avg (m) Ann Volatil (m) Classification Focus Focus
Quadrant CAviva Global Equity -4.95 16.90 Higher Risk Broadly Diversified N/A Equity GlobalCiti Global Bond 3.01 4.31 Low to Medium Risk Broadly Diversified N/A Fixed Income GlobalCitiBond Singapore A 2.26 2.74 Lower Risk Broadly Diversified N/A Fixed Income SGDCitiSelect Asia Tilt Bala 2.00 9.30 Medium to High Risk Broadly Diversified N/A Asset Alloc Global NeutralCitiSelect Asia Tilt Enha 1.78 17.38 Higher Risk Broadly Diversified N/A Asset Alloc Global DynamicCitiSelect Asia Tilt Grow 1.94 13.19 Medium to High Risk Broadly Diversified N/A Asset Alloc Global DynamicCitiSelect Global Growth -0.74 12.32 Medium to High Risk Broadly Diversified N/A Asset Alloc Global DynamicCOM Singapore Bond 3.11 3.43 Low to Medium Risk Broadly Diversified N/A Fixed Income SGDDBS Eight Portfolio A 1.77 2.73 Low to Medium Risk Broadly Diversified N/A Asset Alloc Global DefensiveDBS Eight Portfolio B 1.21 4.94 Medium to High Risk Broadly Diversified N/A Asset Alloc Global NeutralDBS Eight Portfolio C 1.48 8.21 Medium to High Risk Broadly Diversified N/A Asset Alloc Global NeutralDBS Eight Portfolio D 1.05 11.48 Higher Risk Broadly Diversified N/A Asset Alloc Global DynamicDBS Eight Portfolio E 1.22 15.65 Higher Risk Broadly Diversified N/A Equity GlobalDBS Enhanced Income SGD 2.17 0.76 Lower Risk Broadly Diversified N/A Short Term Bd SGDDBS Horizon Global Bond S 2.03 3.13 Low to Medium Risk Broadly Diversified N/A Fixed Income GlobalDBS Horizon Global Equity 0.24 16.73 Higher Risk Broadly Diversified N/A Equity GlobalDBS Horizon SG FI Enhance 2.86 1.87 Low to Medium Risk Broadly Diversified N/A Fixed Income SGDDBS Horizon UK Equity 1.80 15.53 Higher Risk Narrowly Focused UK Equity United KingdomDBS Horizon US Equity -3.51 17.75 Higher Risk Narrowly Focused North America Equity USADBS UP Guaranted 5.0/2 1.89 2.50 Low to Medium Risk Broadly Diversified N/A Asset Alloc Fix Term GlobalDBS UP Guaranted 7.0/2 2.63 4.64 Low to Medium Risk Broadly Diversified N/A Asset Alloc Fix Term GlobalDeutsche Lion Bond 2.57 1.66 Lower Risk Broadly Diversified N/A Fixed Income SGDDeutsche Premier Select 2.58 10.12 Medium to High Risk Broadly Diversified N/A Asset Alloc Global NeutralDresdner Intl Prov Glb Ba 1.22 7.57 Medium to High Risk Broadly Diversified N/A Asset Alloc Global NeutralFirst State Global Balanc 1.70 10.48 Medium to High Risk Broadly Diversified N/A Asset Alloc Global NeutralFranklin Templeton F-Glb 3.00 17.97 Higher Risk Broadly Diversified N/A Equity GlobalHSBC Global Growth -3.77 14.83 Higher Risk Broadly Diversified N/A Equity GlobalHSBC North American Growt -6.29 17.10 Higher Risk Narrowly Focused North America Equity North AmericaInfinity Global Stock Ind -0.88 16.69 Higher Risk Broadly Diversified N/A Equity GlobalInfinity US 500 Stock Ind -2.66 17.39 Higher Risk Narrowly Focused North America Equity USALegg Mason Worldwide Ente -4.92 16.53 Higher Risk Broadly Diversified N/A Equity GlobalSchroder Balanced Growth -0.16 10.25 Medium to High Risk Broadly Diversified N/A Asset Alloc Global NeutralSchroder Japanese Equity 0.92 16.65 Higher Risk Narrowly Focused Japan Equity JapanSGAM Capital GTD Global G -0.62 4.03 Low to Medium Risk Broadly Diversified N/A Asset Alloc Fix Term GlobalSGAM Continuous Growth Fu -2.91 2.31 Low to Medium Risk Narrowly Focused Regional Equity Fix Term North AmericaSGAM Dynamic Tri Sector -2.51 3.18 Low to Medium Risk Narrowly Focused Sector Asset Alloc Fix Term GlobalSGAM Return Guaranteed 2.77 2.94 Lower Risk Broadly Diversified N/A Fixed Income Fix Term SGDSGAM US Continuum Fd -2.85 2.34 Low to Medium Risk Narrowly Focused Regional Equity Fix Term North AmericaUOB Optimix Co Clik S&P50 -0.13 0.62 Low to Medium Risk Narrowly Focused Regional Floor Funds USAUOB Optimix SGD Fund 1.83 1.44 Lower Risk Broadly Diversified N/A Short Term Bd SGDUOB Optimix Worlwide Eqty -6.45 17.93 Higher Risk Broadly Diversified N/A Equity GlobalUOB United Millennium 3 3.30 12.63 Higher Risk Broadly Diversified N/A Asset Alloc Global DynamicQuadrant DAberdeen Global Technolog -9.33 33.88 Higher Risk Narrowly Focused Technology Sector - TMT GlobalABN AMRO Star Europe Equi -5.04 19.77 Higher Risk Narrowly Focused Europe Equity EuropeABN AMRO Star Global Tech -11.79 39.36 Higher Risk Narrowly Focused Technology Sector - TMT GlobalACMIF Asian Technology Po 2.77 23.11 Higher Risk Narrowly Focused Technology Sector - TMT Asia PacificAIG Int Fds American Equi -6.18 18.70 Higher Risk Narrowly Focused North America Equity USAAIG Int Fds Pan European -3.04 18.44 Higher Risk Narrowly Focused Europe Equity EuropeAviva Global AAA Bond -8.10 23.97 Low to Medium Risk Broadly Diversified N/A Fixed Income Global USD BasedCOM Global Infotechnology -6.07 33.36 Higher Risk Narrowly Focused Technology Sector - TMT GlobalDBS Horizon Europn Eq 3.55 20.85 Higher Risk Narrowly Focused Europe Equity Europe ex UKDBS Japan Growth 1.81 20.79 Higher Risk Narrowly Focused Japan Equity JapanDBS Mendaki Global -2.72 20.09 Higher Risk Broadly Diversified N/A Equity GlobalDresdner Global Internet -3.89 33.19 Higher Risk Narrowly Focused Technology Sector - TMT GlobalDresdner Global Multimedi -13.06 25.56 Higher Risk Narrowly Focused Technology Sector - TMT GlobalDresdner Intl Global Biot -8.97 22.17 Higher Risk Narrowly Focused Biotechnology Sector - BiotechnologyDresdner Intl Prov Europe -2.42 21.51 Higher Risk Narrowly Focused Europe Equity EuropeDresdner Intl Prov Glb So -24.42 31.50 Higher Risk Narrowly Focused Technology Sector - TMT GlobalDresdner Intl Prov Global -10.10 27.87 Higher Risk Narrowly Focused Technology Sector - TMT GlobalFirst State Asia Inno & T -1.29 26.45 Higher Risk Narrowly Focused Technology Sector - TMT Asia PacificFirst State Global 100 Gr -2.55 18.16 Higher Risk Broadly Diversified N/A Equity GlobalFirst State Global Tech & -7.07 30.34 Higher Risk Narrowly Focused Technology Sector - TMT GlobalFranklin Templeton F-Life -5.49 25.28 Higher Risk Narrowly Focused Biotechnology Sector - BiotechnologyFranklin Templeton F-US A -2.67 26.59 Higher Risk Narrowly Focused North America Equity USAHenderson European 2.79 19.65 Higher Risk Narrowly Focused Europe Equity Europe ex UKHenderson Global Technolo -8.50 36.28 Higher Risk Narrowly Focused Technology Sector - TMT GlobalHSBC Global Technology Gr -8.79 28.62 Higher Risk Narrowly Focused Technology Sector - TMT GlobalHSBC Japanese Growth -3.01 20.60 Higher Risk Narrowly Focused Japan Equity JapanHSBC Pan European Growth 3.87 18.70 Higher Risk Narrowly Focused Europe Equity EuropeInfinity European Stock I 2.80 19.06 Higher Risk Narrowly Focused Europe Equity EuropePRU European Blue Chip Eq 0.04 18.90 Higher Risk Narrowly Focused Europe Equity EuropePRU Global Technology -12.37 32.94 Higher Risk Narrowly Focused Technology Sector - TMT GlobalSchroder European Equity 0.58 18.46 Higher Risk Narrowly Focused Europe Equity EuropeSchroder Global Enterpris -3.21 19.93 Higher Risk Broadly Diversified N/A Equity GlobalSchroder Global Technolog -10.75 31.55 Higher Risk Narrowly Focused Technology Sector - TMT GlobalSGAM Asian New Economy Fu -2.02 25.02 Higher Risk Narrowly Focused Asia Sector - TMT Asia Pacific ex JapanUBS (SG) IF-Asian Technol 4.15 34.47 Higher Risk Narrowly Focused Technology Sector - TMT Asia Pacific ex JapanUBS (SG) IF-Biotech -10.95 27.84 Higher Risk Narrowly Focused Biotechnology Sector - BiotechnologyUOB Optimix Asian Equity 3.46 22.72 Higher Risk Narrowly Focused Asia Equity Asia Pacific ex JapanUOB Optimix Singapore Equ 0.15 19.58 Higher Risk Narrowly Focused Singapore Equity SingaporeUOB United European Equit -0.03 18.28 Higher Risk Narrowly Focused Europe Equity EuropeUOB United Global Capital 3.95 19.02 Higher Risk Narrowly Focused Sector-Others Sector - Finance GlobalUOB United Global Technol -5.01 31.08 Higher Risk Narrowly Focused Technology Sector - TMT GlobalUOB United Japan Growth 3.17 20.10 Higher Risk Narrowly Focused Japan Equity Japan
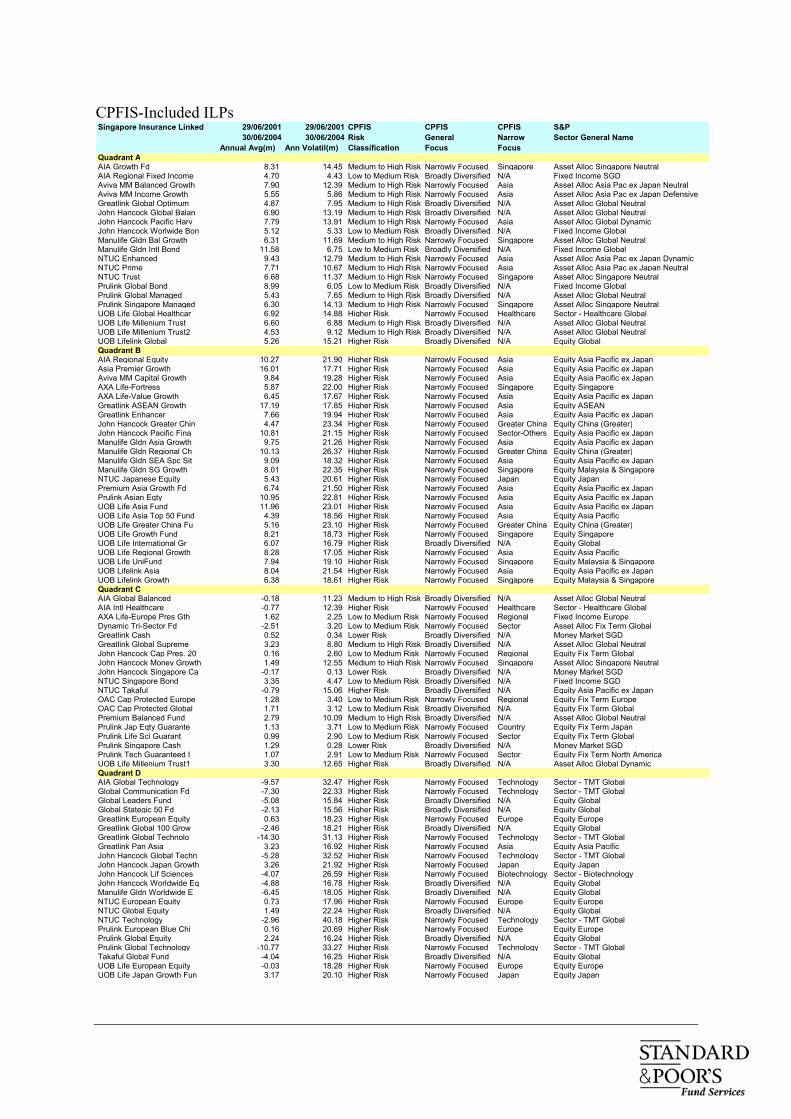
CPFIS-Included ILPs Singapore Insurance Linked 29/06/2001 29/06/2001 CPFIS CPFIS CPFIS S&P
30/06/2004 30/06/2004 Risk General Narrow Sector General NameAnnual Avg(m) Ann Volatil(m) Classification Focus Focus
Quadrant AAIA Growth Fd 8.31 14.45 Medium to High Risk Narrowly Focused Singapore Asset Alloc Singapore NeutralAIA Regional Fixed Income 4.70 4.43 Low to Medium Risk Broadly Diversified N/A Fixed Income SGDAviva MM Balanced Growth 7.90 12.39 Medium to High Risk Narrowly Focused Asia Asset Alloc Asia Pac ex Japan NeutralAviva MM Income Growth 5.55 5.86 Medium to High Risk Narrowly Focused Asia Asset Alloc Asia Pac ex Japan DefensiveGreatlink Global Optimum 4.87 7.95 Medium to High Risk Broadly Diversified N/A Asset Alloc Global NeutralJohn Hancock Global Balan 6.90 13.19 Medium to High Risk Broadly Diversified N/A Asset Alloc Global NeutralJohn Hancock Pacific Harv 7.79 13.91 Medium to High Risk Narrowly Focused Asia Asset Alloc Global DynamicJohn Hancock Worlwide Bon 5.12 5.33 Low to Medium Risk Broadly Diversified N/A Fixed Income GlobalManulife Gldn Bal Growth 6.31 11.69 Medium to High Risk Narrowly Focused Singapore Asset Alloc Global NeutralManulife Gldn Intl Bond 11.58 6.75 Low to Medium Risk Broadly Diversified N/A Fixed Income GlobalNTUC Enhanced 9.43 12.79 Medium to High Risk Narrowly Focused Asia Asset Alloc Asia Pac ex Japan DynamicNTUC Prime 7.71 10.67 Medium to High Risk Narrowly Focused Asia Asset Alloc Asia Pac ex Japan NeutralNTUC Trust 6.68 11.37 Medium to High Risk Narrowly Focused Singapore Asset Alloc Singapore NeutralPrulink Global Bond 8.99 6.05 Low to Medium Risk Broadly Diversified N/A Fixed Income GlobalPrulink Global Managed 5.43 7.65 Medium to High Risk Broadly Diversified N/A Asset Alloc Global NeutralPrulink Singapore Managed 6.30 14.13 Medium to High Risk Narrowly Focused Singapore Asset Alloc Singapore NeutralUOB Life Global Healthcar 6.92 14.88 Higher Risk Narrowly Focused Healthcare Sector - Healthcare GlobalUOB Life Millenium Trust 6.60 6.88 Medium to High Risk Broadly Diversified N/A Asset Alloc Global NeutralUOB Life Millenium Trust2 4.53 9.12 Medium to High Risk Broadly Diversified N/A Asset Alloc Global NeutralUOB Lifelink Global 5.26 15.21 Higher Risk Broadly Diversified N/A Equity GlobalQuadrant BAIA Regional Equity 10.27 21.90 Higher Risk Narrowly Focused Asia Equity Asia Pacific ex JapanAsia Premier Growth 16.01 17.71 Higher Risk Narrowly Focused Asia Equity Asia Pacific ex JapanAviva MM Capital Growth 9.84 19.28 Higher Risk Narrowly Focused Asia Equity Asia Pacific ex JapanAXA Life-Fortress 5.87 22.00 Higher Risk Narrowly Focused Singapore Equity SingaporeAXA Life-Value Growth 6.45 17.67 Higher Risk Narrowly Focused Asia Equity Asia Pacific ex JapanGreatlink ASEAN Growth 17.19 17.85 Higher Risk Narrowly Focused Asia Equity ASEANGreatlink Enhancer 7.66 19.94 Higher Risk Narrowly Focused Asia Equity Asia Pacific ex JapanJohn Hancock Greater Chin 4.47 23.34 Higher Risk Narrowly Focused Greater China Equity China (Greater)John Hancock Pacific Fina 10.81 21.15 Higher Risk Narrowly Focused Sector-Others Equity Asia Pacific ex JapanManulife Gldn Asia Growth 9.75 21.26 Higher Risk Narrowly Focused Asia Equity Asia Pacific ex JapanManulife Gldn Regional Ch 10.13 26.37 Higher Risk Narrowly Focused Greater China Equity China (Greater)Manulife Gldn SEA Spc Sit 9.09 18.32 Higher Risk Narrowly Focused Asia Equity Asia Pacific ex JapanManulife Gldn SG Growth 8.01 22.35 Higher Risk Narrowly Focused Singapore Equity Malaysia & SingaporeNTUC Japanese Equity 5.43 20.61 Higher Risk Narrowly Focused Japan Equity JapanPremium Asia Growth Fd 6.74 21.50 Higher Risk Narrowly Focused Asia Equity Asia Pacific ex JapanPrulink Asian Eqty 10.95 22.81 Higher Risk Narrowly Focused Asia Equity Asia Pacific ex JapanUOB Life Asia Fund 11.96 23.01 Higher Risk Narrowly Focused Asia Equity Asia Pacific ex JapanUOB Life Asia Top 50 Fund 4.39 18.56 Higher Risk Narrowly Focused Asia Equity Asia PacificUOB Life Greater China Fu 5.16 23.10 Higher Risk Narrowly Focused Greater China Equity China (Greater)UOB Life Growth Fund 8.21 18.73 Higher Risk Narrowly Focused Singapore Equity SingaporeUOB Life International Gr 6.07 16.79 Higher Risk Broadly Diversified N/A Equity GlobalUOB Life Regional Growth 8.28 17.05 Higher Risk Narrowly Focused Asia Equity Asia PacificUOB Life UniFund 7.94 19.10 Higher Risk Narrowly Focused Singapore Equity Malaysia & SingaporeUOB Lifelink Asia 8.04 21.54 Higher Risk Narrowly Focused Asia Equity Asia Pacific ex JapanUOB Lifelink Growth 6.38 18.61 Higher Risk Narrowly Focused Singapore Equity Malaysia & SingaporeQuadrant CAIA Global Balanced -0.18 11.23 Medium to High Risk Broadly Diversified N/A Asset Alloc Global NeutralAIA Intl Healthcare -0.77 12.39 Higher Risk Narrowly Focused Healthcare Sector - Healthcare GlobalAXA Life-Europe Pres Gth 1.62 2.25 Low to Medium Risk Narrowly Focused Regional Fixed Income EuropeDynamic Tri-Sector Fd -2.51 3.20 Low to Medium Risk Narrowly Focused Sector Asset Alloc Fix Term GlobalGreatlink Cash 0.52 0.34 Lower Risk Broadly Diversified N/A Money Market SGDGreatlink Global Supreme 3.23 8.80 Medium to High Risk Broadly Diversified N/A Asset Alloc Global NeutralJohn Hancock Cap Pres. 20 0.16 2.60 Low to Medium Risk Narrowly Focused Regional Equity Fix Term GlobalJohn Hancock Money Growth 1.49 12.55 Medium to High Risk Narrowly Focused Singapore Asset Alloc Singapore NeutralJohn Hancock Singapore Ca -0.17 0.13 Lower Risk Broadly Diversified N/A Money Market SGDNTUC Singapore Bond 3.35 4.47 Low to Medium Risk Broadly Diversified N/A Fixed Income SGDNTUC Takaful -0.79 15.06 Higher Risk Broadly Diversified N/A Equity Asia Pacific ex JapanOAC Cap Protected Europe 1.28 3.40 Low to Medium Risk Narrowly Focused Regional Equity Fix Term EuropeOAC Cap Protected Global 1.71 3.12 Low to Medium Risk Broadly Diversified N/A Equity Fix Term GlobalPremium Balanced Fund 2.79 10.09 Medium to High Risk Broadly Diversified N/A Asset Alloc Global NeutralPrulink Jap Eqty Guarante 1.13 3.71 Low to Medium Risk Narrowly Focused Country Equity Fix Term JapanPrulink Life Sci Guarant 0.99 2.90 Low to Medium Risk Narrowly Focused Sector Equity Fix Term GlobalPrulink Singapore Cash 1.29 0.28 Lower Risk Broadly Diversified N/A Money Market SGDPrulink Tech Guaranteed I 1.07 2.91 Low to Medium Risk Narrowly Focused Sector Equity Fix Term North AmericaUOB Life Millenium Trust1 3.30 12.65 Higher Risk Broadly Diversified N/A Asset Alloc Global DynamicQuadrant DAIA Global Technology -9.57 32.47 Higher Risk Narrowly Focused Technology Sector - TMT GlobalGlobal Communication Fd -7.30 22.33 Higher Risk Narrowly Focused Technology Sector - TMT GlobalGlobal Leaders Fund -5.08 15.84 Higher Risk Broadly Diversified N/A Equity GlobalGlobal Stategic 50 Fd -2.13 15.56 Higher Risk Broadly Diversified N/A Equity GlobalGreatlink European Equity 0.63 18.23 Higher Risk Narrowly Focused Europe Equity EuropeGreatlink Global 100 Grow -2.46 18.21 Higher Risk Broadly Diversified N/A Equity GlobalGreatlink Global Technolo -14.30 31.13 Higher Risk Narrowly Focused Technology Sector - TMT GlobalGreatlink Pan Asia 3.23 16.92 Higher Risk Narrowly Focused Asia Equity Asia PacificJohn Hancock Global Techn -5.28 32.52 Higher Risk Narrowly Focused Technology Sector - TMT GlobalJohn Hancock Japan Growth 3.26 21.92 Higher Risk Narrowly Focused Japan Equity JapanJohn Hancock Lif Sciences -4.07 26.59 Higher Risk Narrowly Focused Biotechnology Sector - BiotechnologyJohn Hancock Worldwide Eq -4.88 16.78 Higher Risk Broadly Diversified N/A Equity GlobalManulife Gldn Worldwide E -6.45 18.05 Higher Risk Broadly Diversified N/A Equity GlobalNTUC European Equity 0.73 17.96 Higher Risk Narrowly Focused Europe Equity EuropeNTUC Global Equity 1.49 22.24 Higher Risk Broadly Diversified N/A Equity GlobalNTUC Technology -2.96 40.18 Higher Risk Narrowly Focused Technology Sector - TMT GlobalPrulink European Blue Chi 0.16 20.69 Higher Risk Narrowly Focused Europe Equity EuropePrulink Global Equity 2.24 16.24 Higher Risk Broadly Diversified N/A Equity GlobalPrulink Global Technology -10.77 33.27 Higher Risk Narrowly Focused Technology Sector - TMT GlobalTakaful Global Fund -4.04 16.25 Higher Risk Broadly Diversified N/A Equity GlobalUOB Life European Equity -0.03 18.28 Higher Risk Narrowly Focused Europe Equity EuropeUOB Life Japan Growth Fun 3.17 20.10 Higher Risk Narrowly Focused Japan Equity Japan
APPENDIX 2 S&P Fund Stars Methodology To assist investors in evaluating the performance of a fund and the consistency of that performance relative to other funds in the sector, Standard and Poor’s Fund Services has developed the S&P Fund Stars based on a fund’s relative performance. The S&P Fund Stars is calculated using a fund’s monthly performance relative to its sector average for each of the 36 months over the past 3 years to date. The average and volatility of these 36 numbers is used to calculate the Fund Stars ranking. To be eligible for the S&P Fund Stars, a fund must possess 3 years of investment history and belong to a sector that contain 5 or more funds all with a minimum investment history of 3 years as well. S&P Fund Stars Calculation 1. RELATIVE PERFORMANCE Definition: This is the performance of the fund less the performance of its sector average (average performance of its peers). Example: If a fund rises 6% in a month and its sector average by 4% in the same month then the fund’s relative performance is +2%. This number is calculated for each of the past 36 months. 2. AVERAGE RELATIVE PERFORMANCE Definition: By calculating the average of the fund’s latest 36 monthly relative performance, we are measuring its tendency on average to out- or under-perform the other funds in its sector. The higher the average the more the fund has outperformed its peers over the past 36 months.
3. VOLATILITY OF RELATIVE PERFORMANCE Definition: Volatility (standard deviation) is a statistical method for measuring how much a series of values deviates (how much it moves up and down) from its average. By calculating the volatility of the fund’s 36 monthly relative performance, we are measuring how consistently the fund has performed vis-à-vis its peers. The higher the volatility, the less consistent the fund’s performance relative to its peers. 4. RELATIVE RETURN / VOLATILITY RATIO Definition: By dividing the fund’s average relative performance by the volatility of its relative performance, we are measuring its ability to not only outperform its peers but to also do so consistently. The higher the ratio the greater the fund’s ability to outperform its peers on a consistent basis. Average monthly relative performance over 3 years
= Relative return / volatility ratio Volatility of monthly relative performance over 3 years
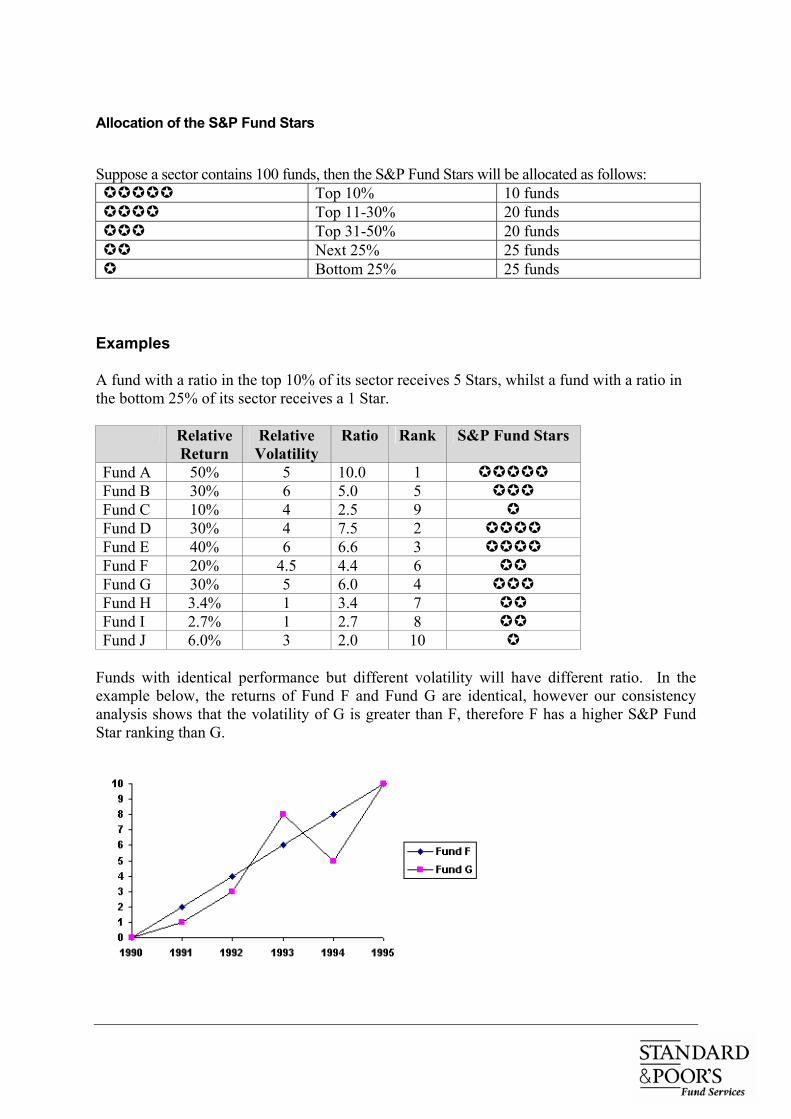
Allocation of the S&P Fund Stars Suppose a sector contains 100 funds, then the S&P Fund Stars will be allocated as follows:
Top 10% 10 funds Top 11-30% 20 funds
Top 31-50% 20 funds Next 25% 25 funds
Bottom 25% 25 funds
Examples A fund with a ratio in the top 10% of its sector receives 5 Stars, whilst a fund with a ratio in the bottom 25% of its sector receives a 1 Star. Relative
Return Relative Volatility
Ratio Rank S&P Fund Stars
Fund A 50% 5 10.0 1 Fund B 30% 6 5.0 5 Fund C 10% 4 2.5 9 Fund D 30% 4 7.5 2 Fund E 40% 6 6.6 3 Fund F 20% 4.5 4.4 6 Fund G 30% 5 6.0 4 Fund H 3.4% 1 3.4 7 Fund I 2.7% 1 2.7 8 Fund J 6.0% 3 2.0 10
Funds with identical performance but different volatility will have different ratio. In the example below, the returns of Fund F and Fund G are identical, however our consistency analysis shows that the volatility of G is greater than F, therefore F has a higher S&P Fund Star ranking than G.
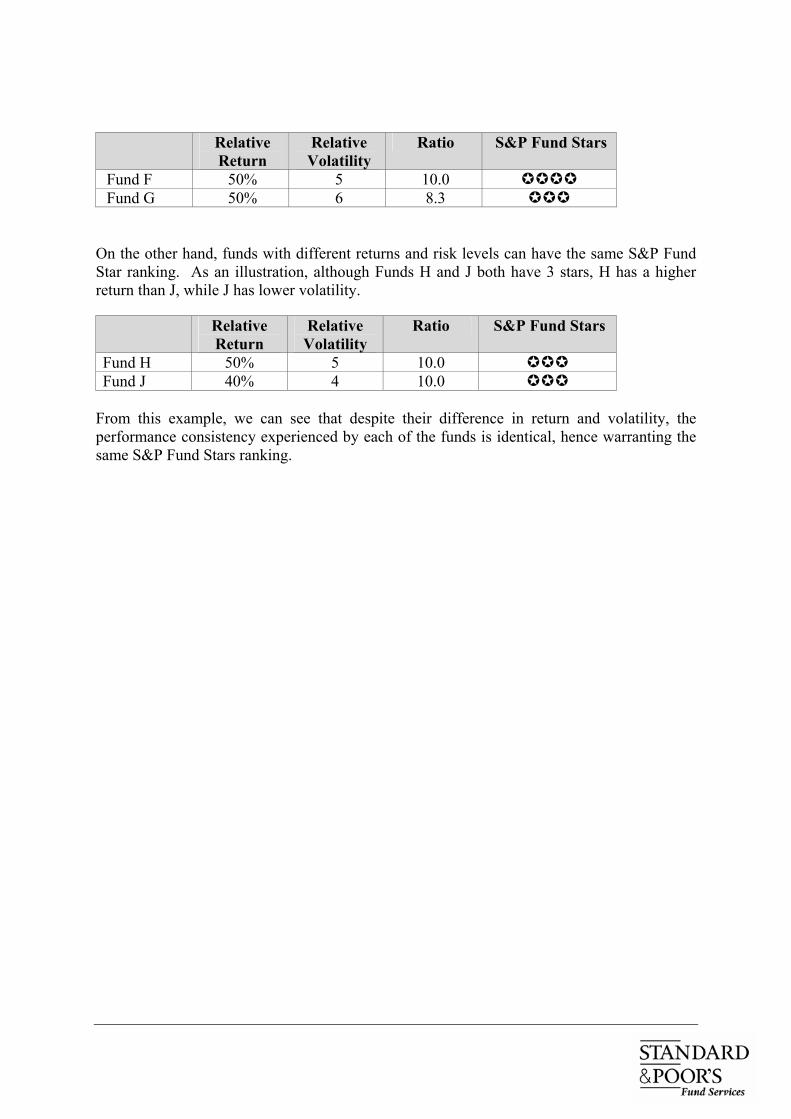
Relative
Return Relative Volatility
Ratio S&P Fund Stars
Fund F 50% 5 10.0 Fund G 50% 6 8.3
On the other hand, funds with different returns and risk levels can have the same S&P Fund Star ranking. As an illustration, although Funds H and J both have 3 stars, H has a higher return than J, while J has lower volatility. Relative
Return Relative Volatility
Ratio S&P Fund Stars
Fund H 50% 5 10.0 Fund J 40% 4 10.0
From this example, we can see that despite their difference in return and volatility, the performance consistency experienced by each of the funds is identical, hence warranting the same S&P Fund Stars ranking.
APPENDIX 3 Investment Terminology Definition Risk Classification CPF Board’s consultant, Mercer Investment Consulting, has developed a risk classification system for the CPFIS that assigns various risk levels to permitted investments. The unit trusts or ILPs with a greater proportion of their assets invested in the more volatile stock market will have a higher Equity Risk. Conversely, the greater the proportion of the fund’s assets that are in bonds and cash, the lower its Equity Risk. Based on their level of Equity Risk, CPFIS-included unit trusts and ILPs will be assigned one of the following risk categories: • Lower Risk • Low to Medium Risk • Medium to High Risk • Higher Risk As of June 30, 2004, the distribution of CPFIS-included investments in the 4 different risk categories is as below: Risk Classification Unit Trusts ILPs Higher Risk 143 83 Medium to High Risk 25 49 Low to Medium Risk 54 31 Lower Risk 5 7 Further information on the CPFIS Risk Classification System can be found in the handbook entitled “CPF Investment Scheme Risk Classification System – Investing to Match your Risk Profile” which can be obtained from any CPF office, agent bank or management group that is included in CPFIS. Alternatively, the handbook can also be downloaded from this link: http://www.cpf.gov.sg/cpf_info/Publication/riskclas.asp. Quantitative Analysis • Expense Ratio: The operating costs, including management fees, of a CPFIS-include unit
trust or ILP expressed as a percentage of the fund's average net assets for a given time period. The expense ratio is furnished to Standard & Poor's Fund Services by the management groups and insurers, and is calculated according to the guidelines set out by the Investment Management Association of Singapore (IMAS).
In accordance to IMAS’ guidelines, the expense ratio is calculated as the average of the annualized expense ratios of the two last 6-month periods, stated on an annualized basis. The formula for this calculation is given as follows:
Expenses x 100%
Net Asset Value Items taken as expenses in the above calculation include, but are not limited to:
Management fee Trustee fee Administration fee Custodian, sub-custodian and depository fees Registrar fees Printing & distribution costs Audit fees Amortized expenses GST on expenses
On the issue of feeder funds, to ensure their comparability with direct investment funds, the expense ratio should look through the feeder structure and include all expenses incurred at both the Singapore and parent-fund level. The calculation guidelines for feeder funds’ expense ratio are as follows:
Annualized expense ratio for the Singapore feeder fund plus that of the parent-fund
Both components of the expense ratio should be calculated in accordance to requirements specified above.
For further information, please refer to http://www.imas.org.sg • Gain/Loss Ratio: This is the sum of positive percentage fund returns divided by the sum
of negative percentage fund returns over the past 3 years to date. The higher the resultant ratio, the greater the proportion of positive returns versus negative returns, hence the better the fund’s performance.
• Information Ratio: Information Ratio is calculated by taking the monthly difference
between a fund's gross return and its benchmark return (in this case the sector average of the S&P sector into which the fund falls), and then dividing that figure by the standard deviation of the monthly differences. This ratio helps investors understand how well the fund has been managed on a risk-adjusted basis relative to its peers.
• Maximum Loss: The worst 3-month return produced by a fund over the past 3 years to
date. • Sharpe Ratio: Devloped by William Sharpe, it is a measurement of a fund’s annualized
return that is in excess of the risk-free rate (a theoretical interest rate that would be returned on an investment which is completely free of risk) and adjusted for the fund’s volatility. The calculation is as follows: (Fund Return – Risk-free Return)/Fund Standard Deviation. From this formula, it can be derived that the higher a fund’s Sharpe ratio, the better its returns relative to the amount of investment risk it has taken.
The reason why this relationship between risk and return holds is very simple: the higher a fund’s standard deviation, the larger the denomintor of the Sharpe ratio, hence a larger numerator (fund’s excess return) will be required to have a high Sharpe ratio. Conversely, a fund with moderate returns will have a relatively small numerator, however, should its volatility also be low, the fund’s Sharpe ratio can still be quite high.
• Standard Deviation: A proxy for the risk level of a fund, standard deviation measures the annualized variability of a fund’s returns. A high standard deviation indicates that a fund’s returns have been volatile while a low figure would be the reverse.
END OF REPORT